Article

Phosphorescence of Hydrogen-Capped Linear Polyyne Molecules C8H2, C10H2 and C12H2 in Solid Hexane Matrices at 20 K

1
Department of Chemistry, School of Science and Engineering, Kindai University, Kowakae 3-4-1, Higashi-Osaka 577-8502, Japan
2
obvioTec AG, Garstligweg 8, 8634 Hombrechtikon, Switzerland
3
Univ Rennes, Ecole Nationale Supérieure de Chimie de Rennes, CNRS, ISCR—UMR6226, F-35000 Rennes, France
4
Department of Chemistry, Graduate School of Science, Tokyo Metropolitan University, Minami-Osawa 1-1, Hachioji 192-0364, Japan
5
Center for Basic Education and Integrated Learning, Kanagawa Institute of Technology, Shimo-Ogino 1030, Atsugi 243-0292, Japan
6
Department of Chemistry, Faculty of Science and Technology, Keio University, Hiyoshi 3-14-1, Yokohama 223-8522, Japan
*
Author to whom correspondence should be addressed.
Photochem 2022, 2(1), 181-201; https://doi.org/10.3390/photochem2010014
Submission received: 2 February 2022 / Revised: 21 February 2022 / Accepted: 23 February 2022 / Published: 28 February 2022

Abstract

:
Laser-ablated polyyne molecules, H(C≡C)nH, were separated by size in solutions and co-condensed with excess hexane molecules at a cryogenic temperature of 20 K in a vacuum system. The solid matrix samples containing C8H2, C10H2, and C12H2 molecules were irradiated with UV laser pulses and the phosphorescence 0–0 band was observed at 532, 605, and 659 nm, respectively. Vibrational progression was observed for the symmetric stretching mode of the carbon chain in the ground state with increments of ~2190 cm−1 for C8H2, ~2120 cm−1 for C10H2, and ~2090 cm−1 for C12H2. Temporal decay analysis of the phosphorescence intensity revealed the lifetimes of the triplet state as ~30 ms for C8H2, ~8 ms for C10H2, and ~4 ms for C12H2. The phosphorescence excitation spectrum reproduces UV absorption spectra in the hexane solution and in the gas phase at ambient temperature, although the excitation energy was redshifted. The symmetry-forbidden vibronic transitions were observed for C10H2 by lower excitation energies of 25,500–31,000 cm−1 (320–390 nm). Detailed phosphorescence excitation patterns are discussed along the interaction of the polyyne molecule and solvent molecules of hexane.

Graphical Abstract

1. Introduction

Hydrogen-end-capped linear polyyne molecules, H(C≡C)nH or C2nH2 (n ≥ 2), constitute a series of model compounds for sp-hybridized carbon species [1,2]. Since the discovery of cyanopolyynes, H(C≡C)nC≡N or HC2n+1N (n ≥ 2), in the molecular clouds and circumstellar shells of a red giant (a carbon star in AGB) by radio astronomical observations [3,4,5,6,7], they have been thought of as candidates for interstellar molecules [8]. Laboratory experiments revealed UV absorption spectra of C2nH2 up to n = 12, thanks to the organic synthesis in the early 1970s [9,10]. Infrared absorption spectra, as well as the UV spectra, were measured for C6H2 and C8H2 in the gas phase [11,12]. Recently, cyanopolyynes of molecular formulae, HC2n+1N, have been synthesized in the laboratory up to n = 2 and reacted in cryogenic matrices into larger derivatives to identify their phosphorescence spectra [13,14,15,16,17,18,19,20,21]. Very recently, photosyntheses were conducted using polyynic precursors of HC5N and C4H2 co-condensed in solid rare gas matrices, and the detection of phosphorescence of HC9N was successful [18]. Using laser-ablated cyanopolyynes, the phosphorescence measurement was extended to HC9N and HC11N in solid organic molecules at 20 K as matrix hosts [22].
Polyyne molecules were formed by the laser ablation of carbon particles [23,24] as well as by the arc discharge of graphite in organic solvents [1]. The formation of hydrogen-capped polyyne molecules was confirmed up to C26H2 by the laser ablation in decalin [25]. Spectroscopic characterization has so far been performed by UV absorption [9,10], IR absorption [11,12,19,22,26], Raman [17,24], and resonance Raman spectroscopy [27,28]. In relation to the formation mechanism, 1H-NMR and 13C-NMR were applied to polyynes, C10H2 and C12H2 [28], and cyanopolyynes, HC7N and HC9N [29]. Using the size-separated polyyne molecules of C2nH2 (n = 5–8), optical emission spectra were observed in solutions of hexane at ambient temperature [30]. Since the spectral range of the emission spanning from near-UV to visible [30] differs to that for the phosphorescence of cyanopolyynes of a relevant size [16,18], the emission was attributed to the fluorescence of polyyne molecules. To obtain evidence for the assignment, we planned to observe the phosphorescence of C2nH2 (n = 4–6) in this work.
For the measurement of phosphorescence, it is crucial to keep the molecular samples at cryogenic temperature in a condensed phase. However, the unsaturated polyyne molecules are highly reactive, leaving polymerized materials at high concentration. In solutions, the molecules are stable only under the dilute condition of less than ~1 mg/mL. We decided to allow the solution to be condensed directly on a cold surface under vacuum, where laser-induced phosphorescence measurements were performed. Dispersed phosphorescence spectra were recorded for C8H2, C10H2, and C12H2 within a range of 500–1000 nm by scanning the excitation wavelength in the ranges of UV, 213–302 nm, and near-UV, 302–409 nm, and converted to phosphorescence excitation spectra. Phosphorescence lifetimes were also measured and compared along the difference in size, n.

2. Materials and Methods

Polyyne molecules were produced by the laser ablation of graphite particles in liquid hexane by irradiation with the 1064 nm output at ~0.5 J/pulse from a Nd:YAG laser system operated at 10 Hz (Continuum, Santa Clara, CA, USA, Powerlite 8010). The solution after laser irradiation was filtrated to remove solid particles to obtain a yellow solution, which is subjected to high-performance liquid chromatography (HPLC, Shimadzu, Kyoto, Japan, LC-10) using a polymeric ODS column (Wako Chemicals, Tokyo, Japan, Wakosil 5C-18AR, i.d. 10 mm × 250 mm) eluted with hexane to separate the molecules of C8H2, C10H2, and C12H2 [24,28,29,30]. The concentration and purity of polyyne, C2nH2, in the solution were estimated by the measurement of UV absorption spectra.
The C8H2 molecules isolated in a solution of hexane were condensed by using a rotary evaporator to a volume of ~1 mL at a concentration of ~1 mg/mL. Having similar molecular weights, 98 for C8H2 and 84 for hexane, the order of molecular number ratio of C8H2 to hexane is 1:1000, corresponding to the condition in which ten solvent molecules lie between two neighboring C8H2 molecules on average, though a fraction of C8H2 vaporizes together with hexane to reduce the efficiency of concentration. The concentrated solution was conducted into the vacuum system through a tubing of 0.10 mm in inner diameter. Reaching the exit of the tubing, the solution was sprayed onto a nearby cupper slab cooled at 20 K using a closed-cycle helium refrigerator (Daikin, Osaka, Japan, V202CL), where the C8H2 molecules and the excess hexane molecules were co-condensed as an opaque, milky white, solid matrix sample. By the rapid introduction of the solution within several seconds, even droplets were directly condensed on the cold surface. The dimerization of C8H2 molecules was minimized and the C8H2/hexane ratio in the solid matrix sample was more or less the same as the precursory condensed solution. The introduction of the room temperature solution results in the instantaneous warming of the cold surface to ~60 K. The measurement was performed after waiting for the cold surface to be cooled down to 20 K.
The solid matrix sample at 20 K was irradiated with UV laser pulses of the second harmonic of an OPO output excited with nanosecond 355 nm laser pulses (Spectra Physics, Santa Clara, CA, USA, VersaScan-MB/INDI40). Emitted photons from the surface of the UV-irradiated matrix sample were collected through an optical-fiber bundle and dispersed by a polychromator (Acton Research Corporation, Acton, MA, USA, Model 320i) and recorded on a liquid-nitrogen-cooled CCD array detector (Princeton Instruments, Trenton, NJ, USA, PyLoN:256-OE) in a spectral range of 500–1000 nm. A long-pass glass filter having an appropriate cut-off wavelength was used to reduce stray light. The excitation wavelength was slowly scanned in a range of 213–302 nm and a series of dispersed emission spectra were recorded redundantly. Spectral resolution was ~0.1 nm for dispersed phosphorescence and 0.2–0.5 nm for the excitation spectrum.
Lifetime measurement was performed for selected bands of phosphorescence by using a photomultiplier detector (Hamamatsu Photonics, Hamamatsu, Japan, R928) and a digitizing oscilloscope (LeCroy, Chestnut Ridge, NY, USA, WavePro 954). The waveform of amplified phosphorescence signals was summed over 1000 laser pulses and transferred to a PC. The same experimental procedures of the spectral measurement and the lifetime measurement for C8H2 were applied also to C10H2 and C12H2. For the longer wavelength excitation in 302–409 nm for C10H2, the sum-frequency mixing (SFM) of the OPO system was exploited.

3. Results

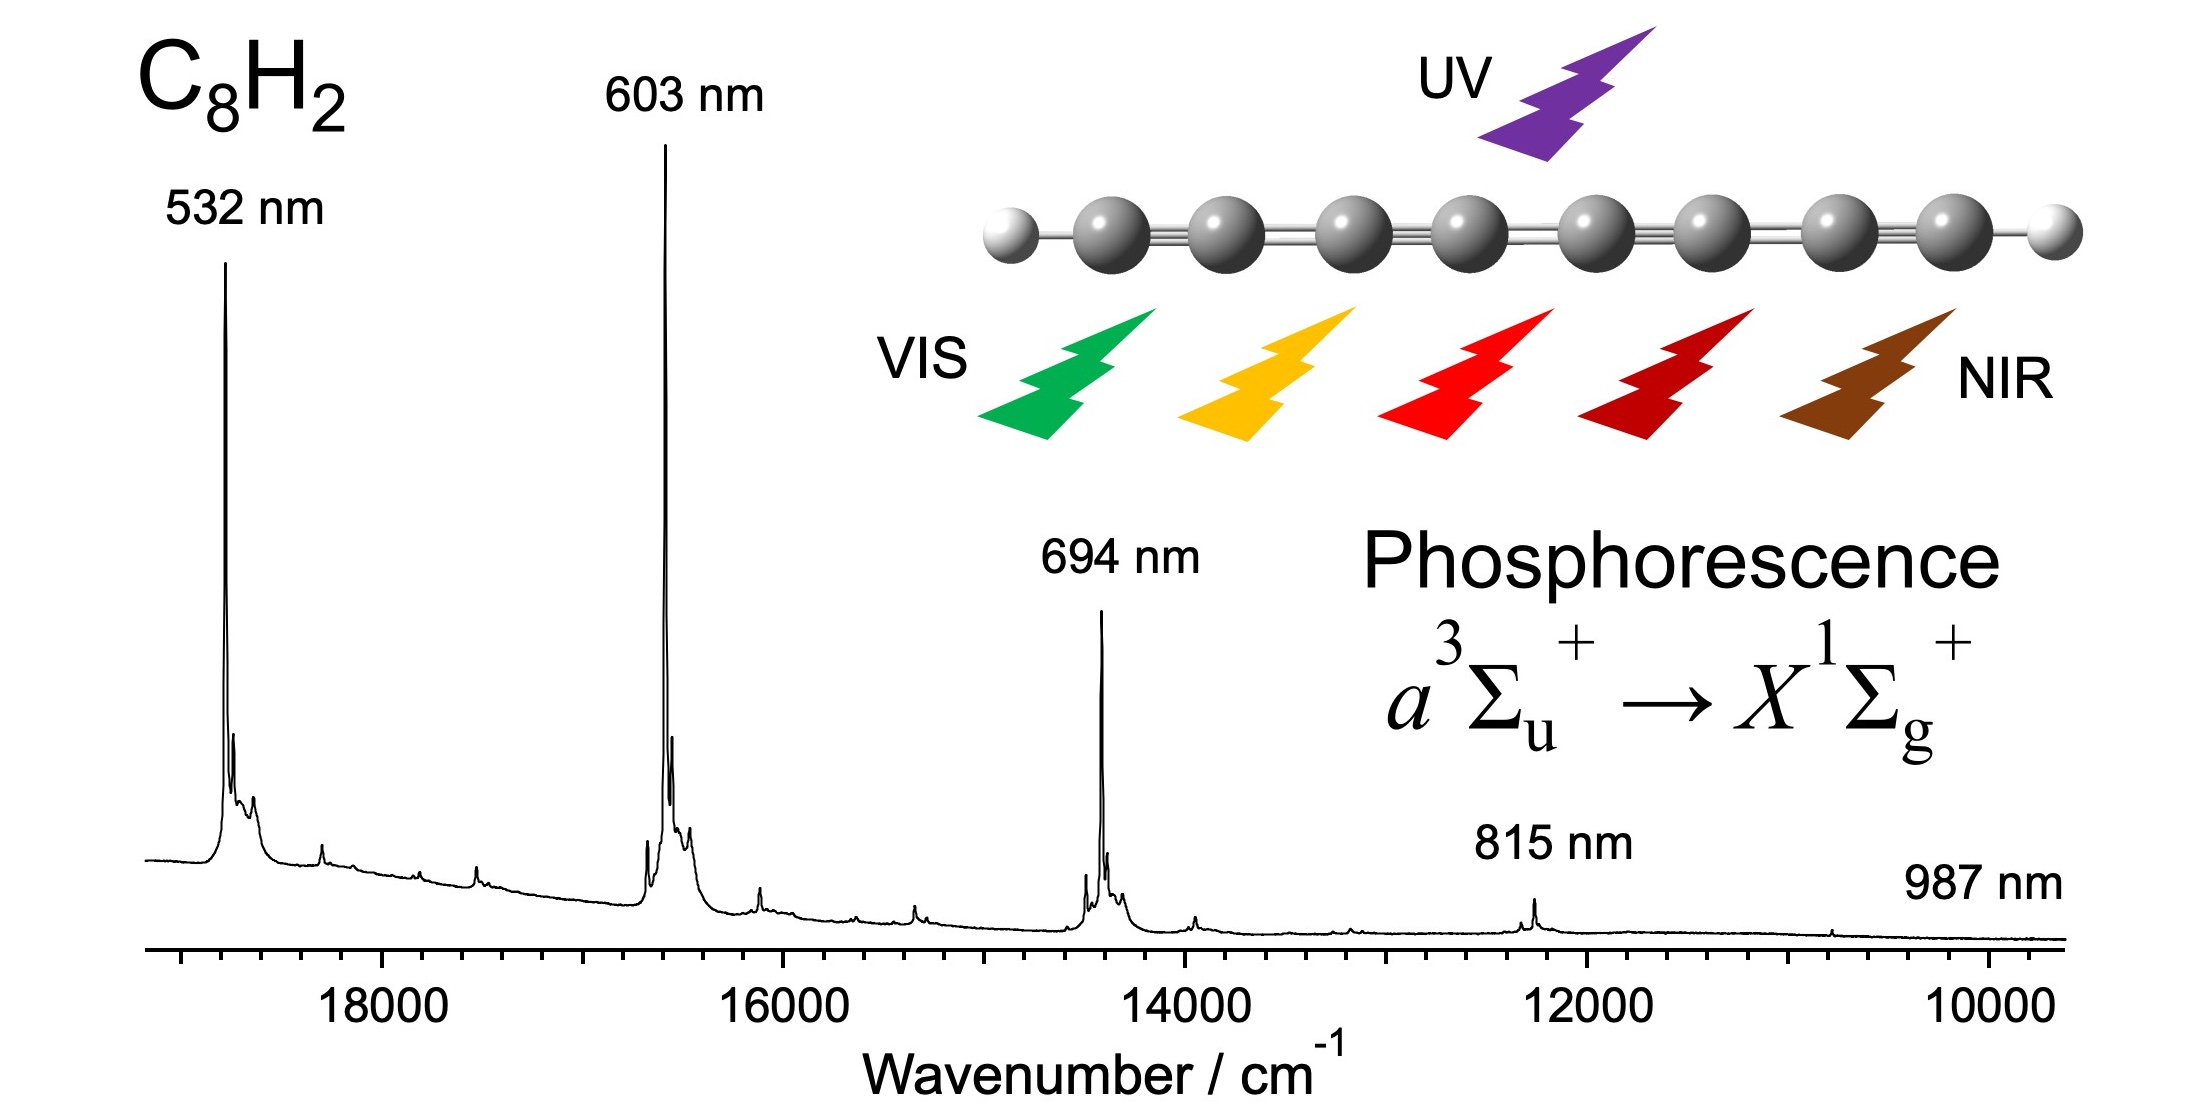
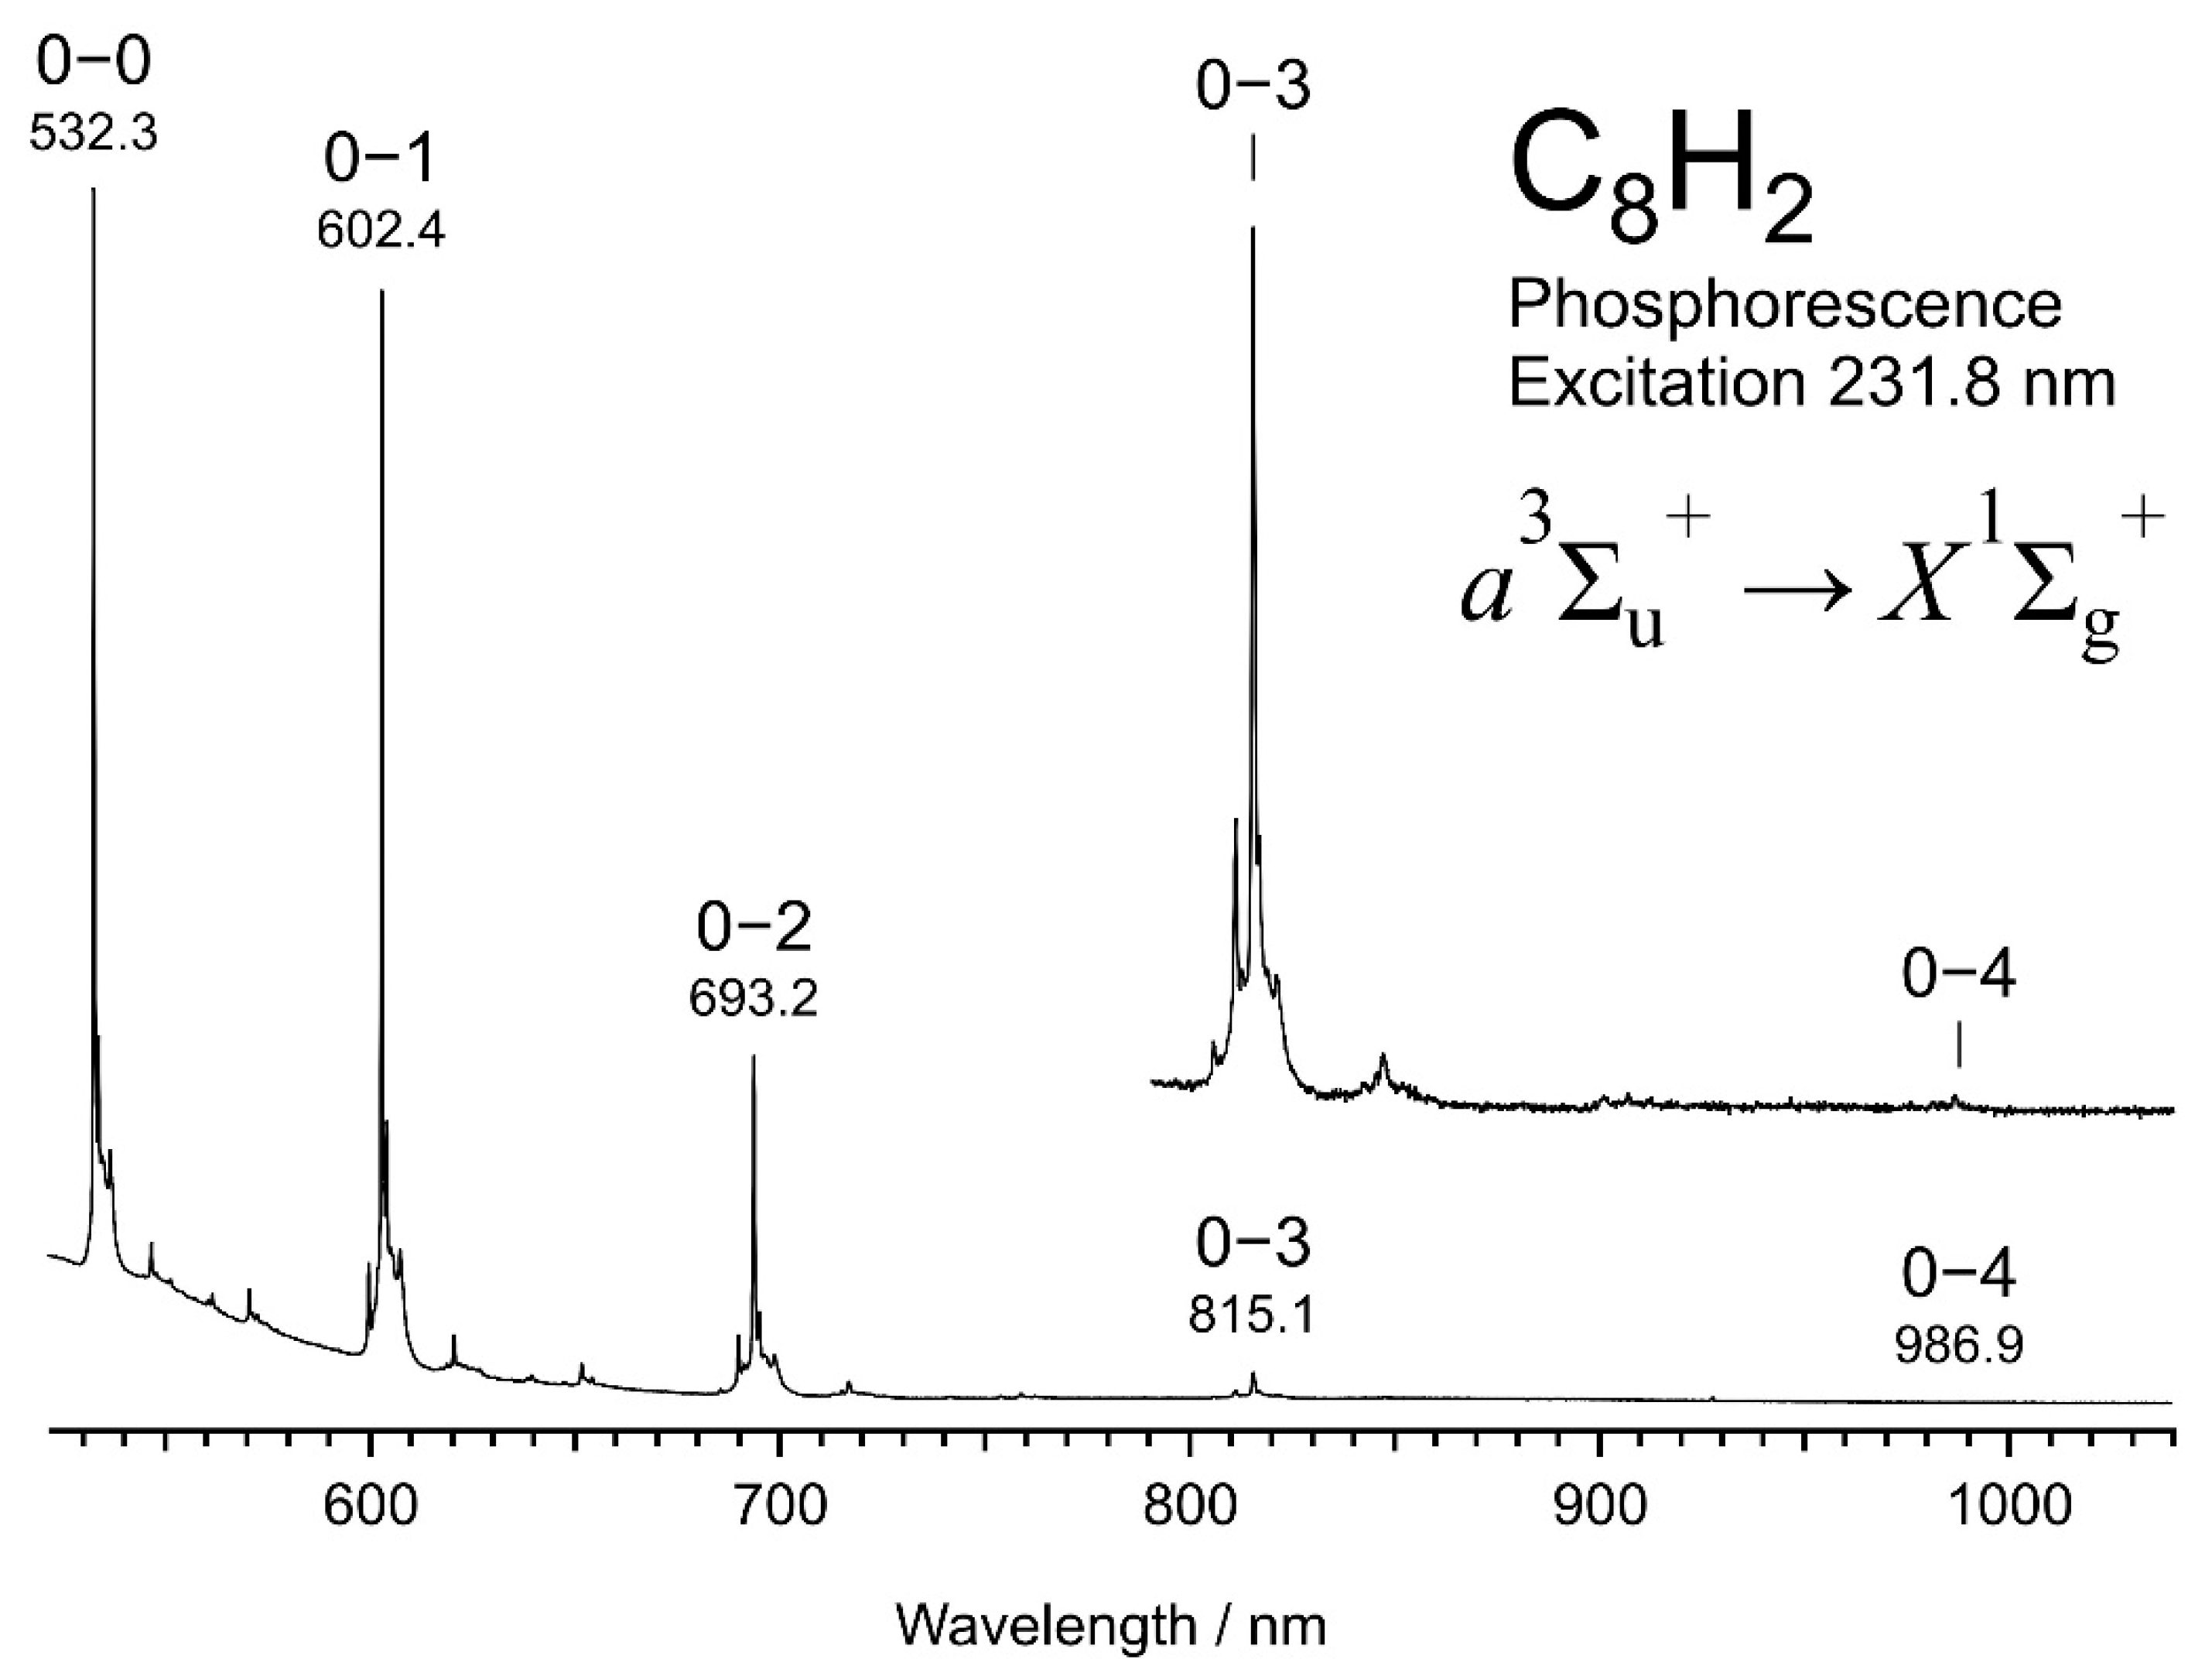
3.1. Phosphorescence Spectra and Excitation Spectra

Figure 1 shows a dispersed phosphorescence spectrum of C8H2 embedded in a solid hexane matrix at 20 K, observed at the excitation of 231.8 nm. Peaks are conspicuous at 532.3, 602.4, 693.2, 815.1, and 986.9 nm for the 0–0, 0–1, 0–2, 0–3, and 0–4 bands, respectively. Adjacent peaks in the series of transitions from the v = 0 level in the upper electronic state to v = 0, 1, 2, 3, and 4 levels in the lower electronic state are separated by successive increments of 2190, 2172, 2157, and 2136 cm−1, which are attributable to the member of a vibrational progression of the symmetric stretching σg mode of the sp-carbon chain in the electronic ground state, X1g+. The upper state of the phosphorescence is the lowest triplet state, a3u+. Smaller peaks are discernible between the high-intensity peaks. Appearing in a similar pattern repeatedly in the gaps, these tiny peaks are attributable to combination bands of some symmetric vibrational species with the symmetric stretching σg mode.
Figure 2 illustrates the phosphorescence excitation mapping for the 0–1 band of C8H2 at 602.5 nm. Relatively strong emission was observed when the excitation wavelength was set at 232 nm and 221 nm. The trace in white at the bottom of the panel represents the intensity of the horizontal cross section at the excitation of 232 nm. The peak at 602.5 nm is again the 0–1 band of the phosphorescence. Small peaks near 620 and 640 nm are the combinations. A few satellite peaks accompany the foot of the main peak at 602.5 nm, which are signals belonging to the same σg mode, but their photons of phosphorescence are emitted from molecules in different environments in the matrix sample. A less intense but almost identical phosphorescence spectrum is obtained at the excitation of 221 nm. The series of spots corresponding to the phosphorescence peaks are discernible along the horizontal line at 221 nm in the mapping. As a result, the strong phosphorescence peak at 602.5 nm appears twice, at excitation wavelengths of 232 and 221 nm. When the intensity of phosphorescence at 602.5 nm is plotted as a function of the excitation wavelength, we obtain another spectrum in yellow in the left of the panel. This action spectrum primarily represents the strength of absorption at relevant UV wavelength and is called an excitation spectrum. The upper electronic state is designated as 1u+, to which the UV photon lifts the molecule to be excited from the ground state, X1g+.
Figure 3 shows the excitation spectrum for the 0–1 band in the phosphorescence at 603 nm of C8H2, plotted as a function of energy. The intensity is scaled according to the conversion from wavelength to energy. Two major bands, namely the 0–0 band at 43,113 cm−1 and the 1–0 band at 45,243 cm−1, constitute the vibrational progression of the symmetric stretching σg mode in the excited state, 1u+. The increment of 2130 cm−1 is smaller than the phosphorescence counterpart of 2190 cm−1, indicating a slightly shallow potential with a lower harmonic frequency in the excited state, 1u+. The overall shape of the excitation spectrum and the vibrational frequency in the upper state are explainable by the absorption of a UV photon via the fully allowed electric dipole transition, 1u+X1g+. When the transition energy of the 0–0 band is compared with that observed at 43,960 cm−1 by UV absorption in the solution of hexane, the peak in the solid matrix is redshifted by 847 cm−1. Weaker bands or shoulders at the higher energy side of the major bands in Figure 3 are rather close to the bands in the UV absorption spectrum in the solution of hexane, i.e., at 227 nm (44,050 cm−1) for the 0–0 band and 216 nm (46,300 cm−1) for the 1–0 band. The band with a shoulder in the phosphorescence excitation curve is fitted with three Gaussian functions to provide two narrow bands and a broad component for the base line. Among the two sets of the narrow-band features, one is the major component of high intensity, and the other is the minor component at the shoulder located close to the position of peaks in the solution at ambient temperature.
Figure 4 compares the dispersed phosphorescence spectra of C8H2, C10H2 and C12H2 with the excitation at 231.8, 259.0, and 282.0 nm, respectively, where the phosphorescence intensity is maximum for each size. As is expected for a particle-in-a-box model, the phosphorescence wavelength, as well as the excitation wavelength, shifts to a longer wavelength as the size of the carbon chain increases. The 0–0 band of phosphorescence appears at 532.3 nm for C8H2, 605.1 nm for C10H2, and 658.8 nm for C12H2. The vibrational progression is conspicuous for the symmetric stretching σg mode for each polyyne, exhibiting an increment of ~2190, ~2120, and ~2090 cm−1 for C2nH2 of n = 4, 5, and 6, respectively. The bands of C10H2 and C12H2 are relatively broad compared with those of C8H2, probably because of the lack of uniformity in the packing patterns of molecules surrounding the C2nH2 molecule. As is seen in the dashed line for C10H2 in Figure 4, a slightly different excitation wavelength at 261.7 nm provides a different band shape with a sharp phosphorescence peak at 599.4 nm, and with a broad distribution of satellites up to 605 nm. The detailed matrix effect is discussed in the latter Section 4.4. Despite the broadness of bands, peaks are discernible for major features: (1) the σg vibrational progression with three bands and (2) the combination bands between the major bands of σg.
Figure 5a shows the phosphorescence excitation spectrum obtained from the intensity of the 0–0 band of C10H2 in solid hexane at 20 K. The absorption spectra of C10H2 at ambient temperature are shown for comparison (b) in the solution of hexane and (c) in the gas phase. The measurement of the spectrum in the gas phase (c) is conducted as follows; a small amount of the concentrated solution of C10H2 in hexane was introduced into an evacuated quartz cell of 10 cm path length and the cell was set in the sample chamber of the double-beam UV spectrophotometer (Jasco, Hachioji, Japan, V-670). The 0–0 band peaked at 43,690 cm−1 (228.9 nm) in (c) and at 39,640 cm−1 (252.3 nm) in (b), indicating a solvent shift of −4050 cm−1 for hexane. In the excitation spectrum (a) for the hexane matrix at 20 K, the most intense band peaked at 38,728 cm−1 (258.2 nm), revealing a further redshift of −912 cm−1 from the peak in the hexane solution. In general, the tight packing of the solvent molecules in cryogenic solid matrices results in a stronger interaction between the host and guest molecules, and the electronically excited state of the guest polyyne molecule is stabilized further to redshift its absorption/excitation spectrum.
Figure 6 shows the phosphorescence excitation mapping of the 0–1 band of C12H2 (left) and an excitation spectrum (right) plotted using the phosphorescence intensity at 761.7 nm (solid line). The absorption spectrum in the solution at ambient temperature is overlapped (dashed line), showing the redshift of −840 cm−1 for the solid matrix relative to the liquid solution of C12H2/hexane. Table 1 summarizes the observed peaks in the phosphorescence excitation spectra of C8H2, C10H2, and C12H2, together with their absorption peaks in solutions and in the gas phase. Molecular constants in the electronically excited state, 1u+, are listed in Table 2. Figure 7 plots the transition energies of the electronic 1u+X1g+ system of C2nH2 (n = 4–6), showing the solvent shift (gas–solution) and the matrix shift (solution–solid matrix).

3.2. Lifetimes

Figure 8 illustrates the typical decay profiles of phosphorescence intensity at 20 K for the 0–0 and 0–1 bands of C8H2 (red), C10H2 (black), and C12H2 (blue). From the slope of the logarithmic plot, phosphorescence lifetime was deduced for each trace by fitting to a single exponential component. The lifetime was ~31 ms for C8H2, ~8.4 ms for C10H2, and ~3.9 ms for C12H2, showing a decreasing property as the number of carbon atoms in a molecule increases. A longer polyyne such as C14H2 should exhibit a weak phosphorescence signal at a longer wavelength.
For C10H2, depending on the phosphorescence peak wavelengths within the 0–0 band (599–605 nm), the observed decay rates deviated from 6 ms to 16 ms due to the different rates of intersystem crossing and/or internal conversion in the different trapping sites in the solid matrix host.

3.3. Vibrational Bands

Vibrational overtones and combinations in the dispersed phosphorescence in Figure 1 and Figure 4 are summarized in Table 3. Figure 9 plots the observed vibrational levels for (a) C8H2, (b) C10H2, and (c) C12H2. The electronic transition from the lowest triplet state to the ground state, a3u+X1g+, is spin forbidden but the other conditions are common with the fully allowed transition, 1u+X1g+, because excited states in both transitions commonly stem from the single-electron HOMO–LUMO excitation. In this case, totally symmetric vibrational species tend to appear as overtones and combinations. The main progression with the increment of 2100–2200 cm−1 is associated with the alternating C≡C and C–C stretching σg mode of the sp-carbon chain, i.e., ν2σg of C8H2, ν3σg of C10H2, and ν3σg of C12H2, in which all the triple bonds expand and all the single bonds shrink simultaneously, and vice versa. In Table 4, molecular constants deduced from the σg progression in the dispersed phosphorescence spectra are summarized for the electronic ground state, X1g+.
For candidates of the combination bands appearing between the peaks of the σg progression, totally symmetric species are possible by the other symmetric stretching σg modes and by even-numbered overtones of antisymmetric stretching modes or bending modes, i.e., σuσu, πgπg, or πuπu. Molecular orbital (MO) calculations predict harmonic frequencies for all modes, σg, σu, πg, and πu (see Figure S1 in Supporting Materials) [31]. Among them, frequencies for stretching σg and σu modes of lower frequencies, <1600 cm−1, are size dependent, i.e., lower frequencies for longer polyynes. Observed bands of frequencies at ~480 cm−1 for C8H2, ~380 cm−1 for C10H2, and ~310 cm−1 for C12H2 follow this tendency and are attributable to the longitudinal breathing mode of the carbon chain, namely σg’, having the lowest frequency among the σg modes, i.e., ν5σg for C8H2, ν6σg for C10H2, and ν7σg for C12H2. This mode is reasonably excited when the length of the molecule changes upon the a3u+X1g+ transition (one of the HOMO–LUMO transitions), where the triple bonds are tightened and the single bonds are loosened.
The three polyynes share a common frequency of 1230–1290 cm−1 for the observed highest-frequency combination band. According to the MO calculations, one of the highest-frequency bending modes of πg stays at 650–700 cm−1 independently of the molecular size for all the polyynes (see Figure S1 in Supporting Materials). This πg mode promotes a deformation of the carbon chain into a trans-zigzag configuration, i.e., alternating displacements of adjacent carbon nuclei in opposite directions to each other perpendicularly to the molecular axis (see Figure S2 in Supporting Materials). The activation of the trans-zigzag bending motion of the carbon chain accompanies the electronic transition of a3u+X1g+, when even numbers of vibrational quanta are excited, providing a totally symmetric species as πg ⊗ πg = σg+  δg. Thus, the observed band separated by 1230–1290 cm−1 from the band in the major progression of σg is attributable to the overtone of πg2 and its combinations with the alternating CC stretching mode, i.e., 2σg for C8H2, 3σg for C10H2, and 3σg for C12H2 of n = 1–4.
Another series of combination bands with common frequencies at ~480 and ~960 cm−1 are noted for the excitation, once and twice, of an overtone of bending modes, πg2 or πu2. The vibrational motion having a common harmonic frequency of ~240 cm−1 for different molecular size represents the cis-zigzag bending mode, namely πg’ for C10H2 and πu’ for C8H2 and C12H2 (see Figures S1 and S2 in Supporting Materials). Candidates for the possible excitations are 2ν16 and 4ν16 of πu’ for C8H2, 2ν15 and 4ν15 of πg’ for C10H2, and 2ν23 and 4ν23 of πu’ for C12H2.

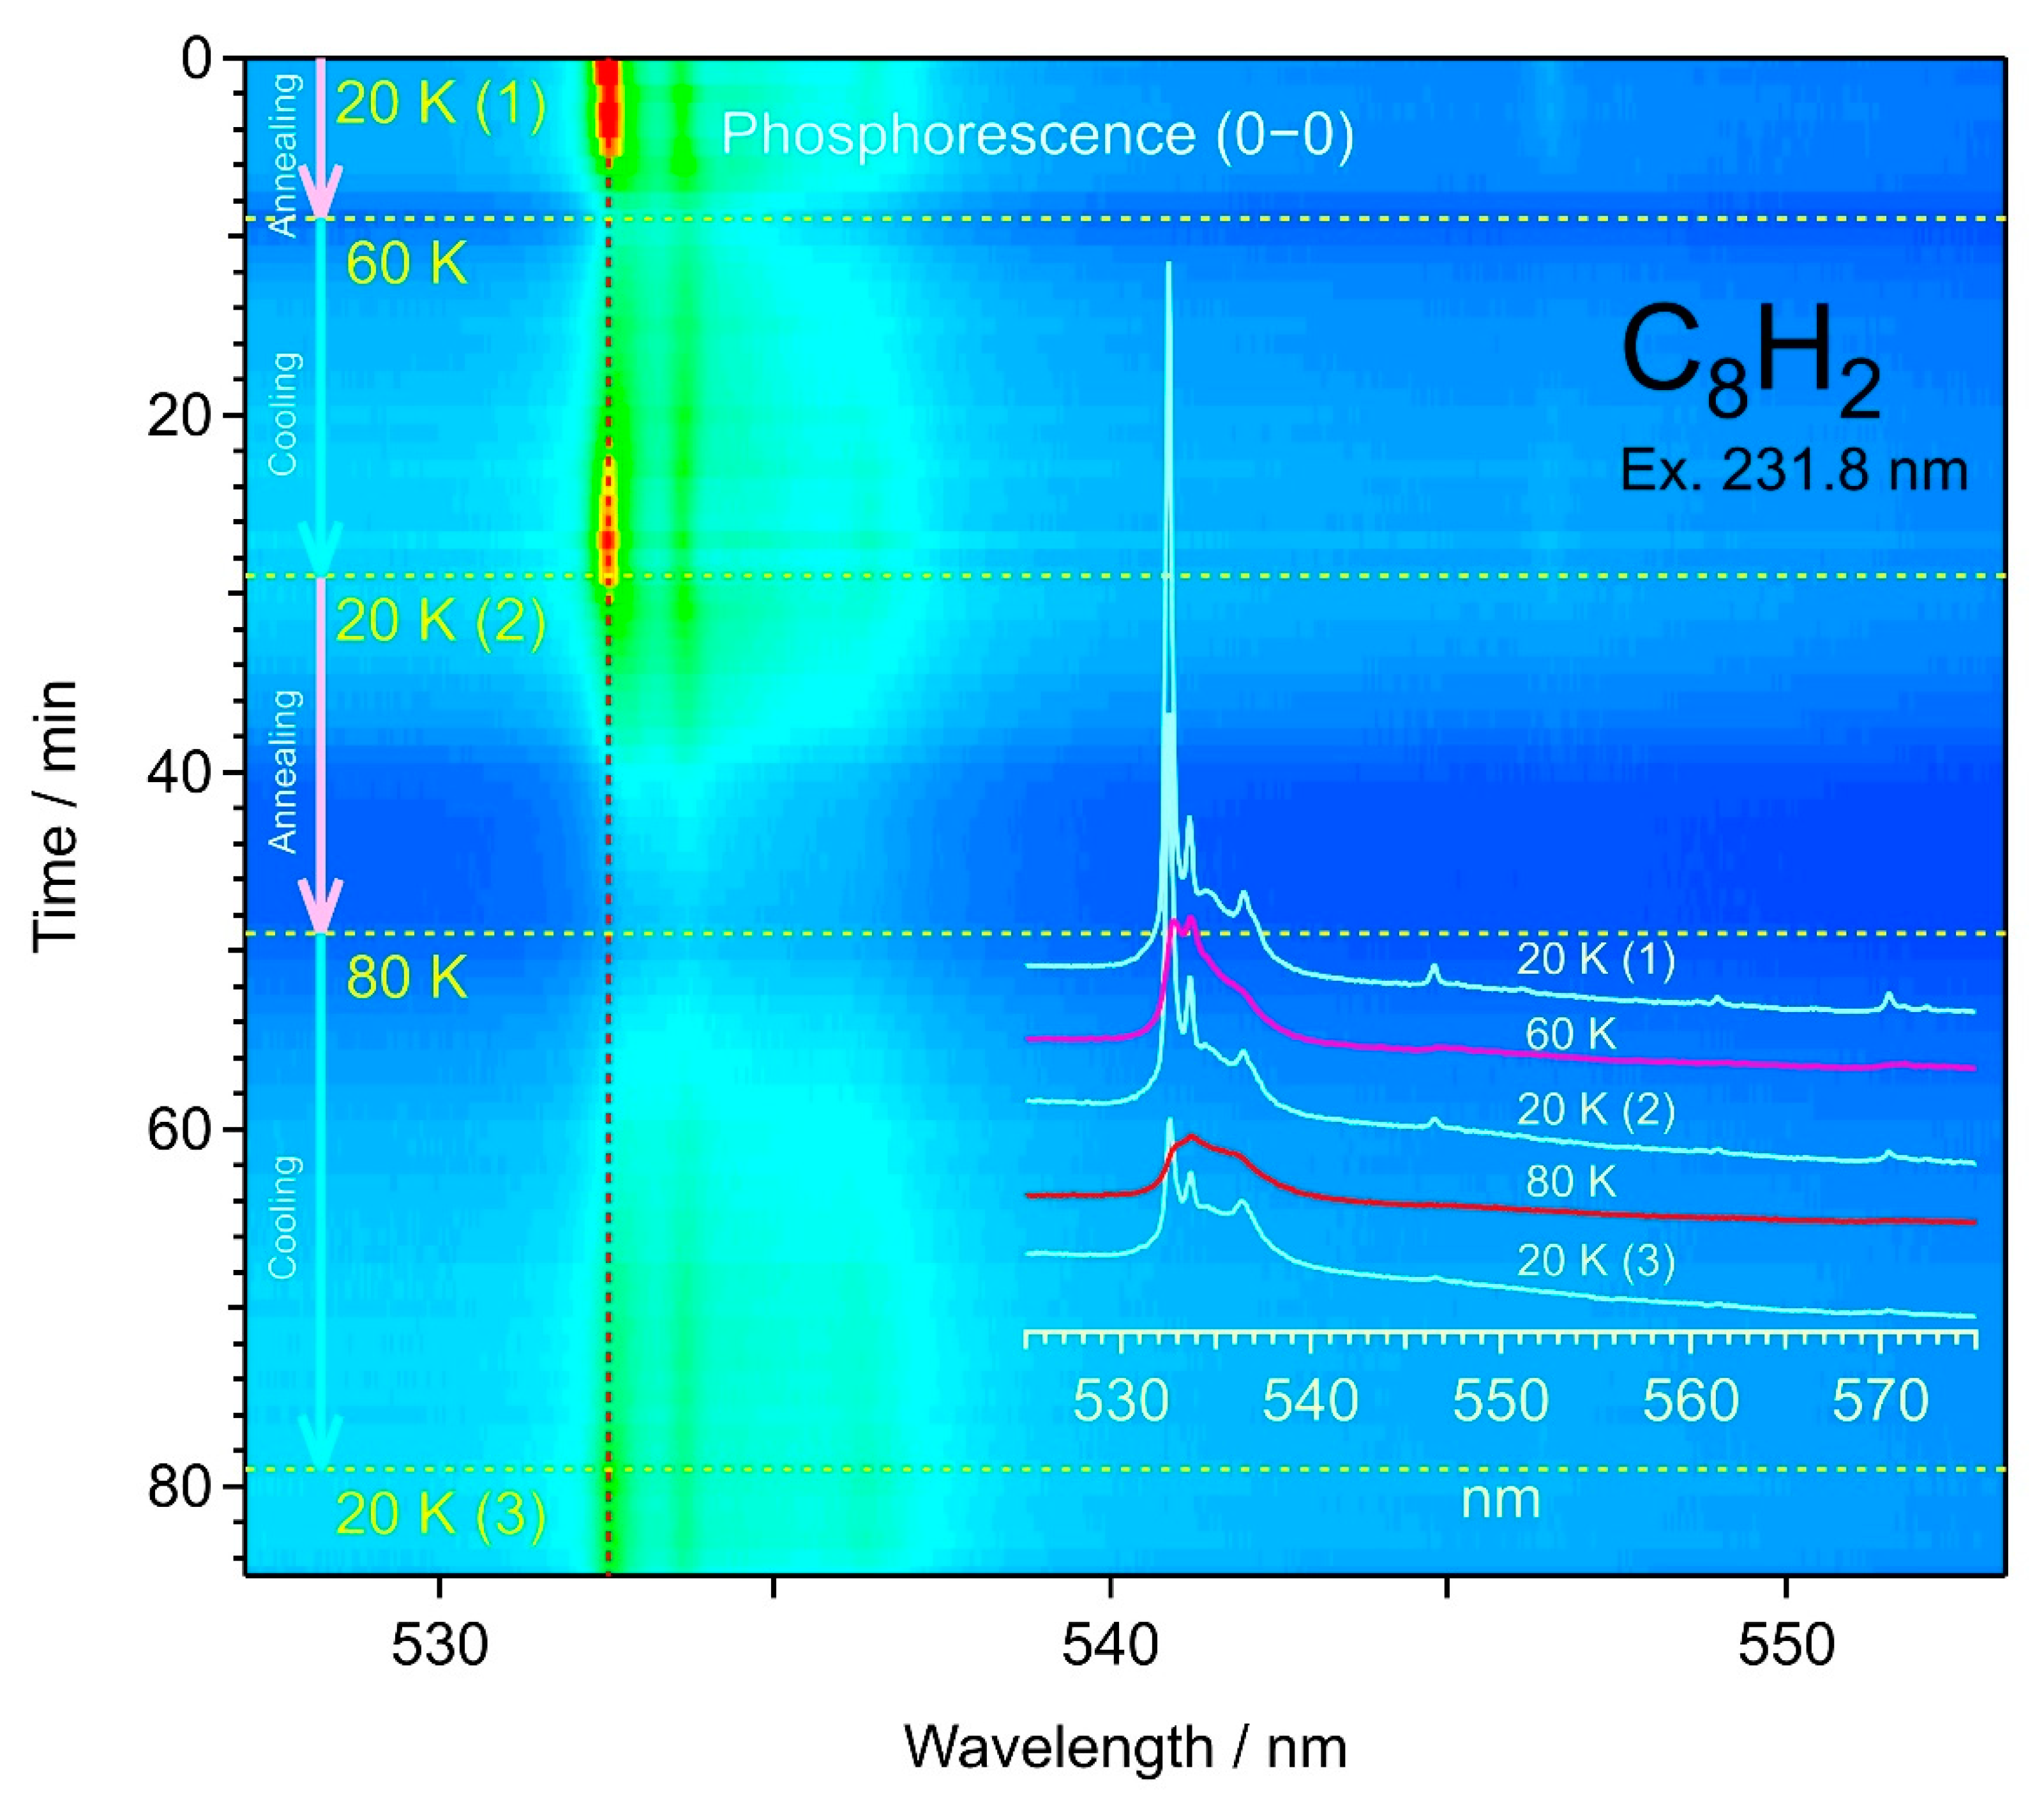
3.4. Annealing of Matrix Samples

To study the origin of satellite bands accompanying the main peak in the bands of the σg progression, the matrix sample in solid hexane was subjected to warming and cooling cycles between 20 K and 80 K, then warming up to 120 K, during which the spectra were recorded redundantly from one to the next. Figure 10 shows a series of spectra for the 0–0 band at 532 nm of C8H2 observed in the warming–cooling cycle, namely 20–60–20–80–20 K. The intensity of the main peak was reduced for vanishing by the warming up to 60 K, then recovered by cooling back to 20 K. In this cycle, a fraction of the intensity of the main peak was lost, while the intensity of the satellite bands was retained. The next cycle to 80 K affected the main peak by reducing its intensity to an order of magnitude less than the original intensity, even after cooling back to 20 K. Similar changes were observed for the other band of 0–1 in the σg progression. The recovery of the C8H2 molecule in a trapping site associated with the main peak is reproducible upon annealing partly but not completely.
In Figure 11, the simple warming up of the matrix sample from 20 K to 120 K for the 0–1 band at 603 nm of C8H2 exhibited again the reduction in the intensity for the main peak up to 80 K, followed by the intensification of a broad band at 607 nm and the reduction of all the band features around 120 K, up to where the solid hexane matrix and the trapped molecules were lost by sublimation. The weaker features or satellite bands were associated with the 0–0 and 0–1 transitions in the phosphorescence of C8H2 molecules trapped in different circumstantial environments. The relatively sharp main peak corresponds to C8H2 molecules in a stable trapping condition.

4. Discussion

4.1. Electronic Transition and Vibrational Excitation

Single-electron excitation from the highest occupied molecular orbital (HOMO) to the lowest unoccupied molecular orbital (LUMO) in a linear polyyne molecule in D∞h point group symmetry, H(C≡C)nH, provides three electronically excited states as spin-singlet states, i.e., 1u+, 1u, and 1Δu. Among them, the 1u+ is the only state to which the optical transition is allowed from the ground state, X1g+ [32,33,34]. By the character of the electronic excitation from one degenerated molecular orbital to another, the excited state to which the optical transition is allowed, 1u+, enjoys the highest transition energy among the three states stemming from the HOMO–LUMO excitation, while the others, 1u and 1Δu, come close at the lowest transition energies within the spin-singlet manifold [34]. The spin-flipped, lowest-energy triplet state, a3u+, also stemming from the HOMO–LUMO excitation, lies closer to or even lower in the transition energy relative to those for the latter two.
HOMO has electron densities on the triple bonds, C≡C, and nodes on the single bonds, C–C, of the polyynic carbon chain, while LUMO has electron densities on the single bonds, C–C, and nodes on the triple bonds, C≡C. Thus, upon the transition of an electron between HOMO and LUMO, a vibrational mode in which all the triple bonds expand and all the single bonds shrink and vice versa is activated. Accordingly, a conspicuous progression for the alternating CC stretching σg mode constitutes a major feature in the spectra of absorption, 1u+X1g+ [9,10] and 1ΔuX1g+ [10,12,32], fluorescence, 1ΔuX1g+ [30], and phosphorescence, a3u+X1g+, as shown in Figure 1 and Figure 4. The relevant modes are ν2σg for C8H2, ν3σg for C10H2, and ν3σg for C12H2. Since the phosphorescence excitation spectra of C10H2 in Figure 5a corresponds to the absorption spectra in Figure 5b,c, the progression of the alternating CC stretching σg mode predominates the spectral feature. The same discussion applies to the excitation spectra of C8H2 and C12H2 in Figure 3 and Figure 6, respectively.
When the potential minimum changes or the length of the sp-carbon chain varies upon the electronic transition, this is accompanied by the excitation of the longitudinal breathing mode, namely σg’, where all the CC bonds expand then shrink repeatedly. The relevant modes are the lowest-frequency symmetric stretching mode of ν5σg for C8H2, ν6σg for C10H2, and ν7σg for C12H2. As the size of the carbon chain, n, increases, the vibrational frequency of the breathing mode decreases as ~n−1.
A sudden change in the molecular length upon the electronic excitation is to be relaxed and mitigated when some bending modes are excited simultaneously. A plausible mode which accompanies the alternating CC stretching motion is the trans-zigzag bending mode of πg symmetry, in which the adjacent carbon atoms move in opposite directions transversely to the molecular axis. According to the MO calculations, another πg mode of vibration, i.e., CH bending, has a similar harmonic frequency to that of the trans-zigzag bending πg mode of the carbon chain. The calculated mode frequencies are so close that the order can be reversed depending on the theoretical model and the basis set used. Experimentally, the IR absorption spectra revealed the frequency for the CH-bending πu mode at 625 cm−1 and its combination of πg + πu at 1236 cm−1 for C2nH2 (n = 3–6), independently of the size, n [11,12,26]. Disregarding the anharmonicity and other effects of perturbation, the simple subtraction provides ~611 cm−1 for the CH-bending πg mode. On the other hand, the overtone frequency of ~1232 cm−1 for πg2 observed in the dispersed phosphorescence spectrum is simply divided into two, providing the frequency of ~616 cm−1 for the trans-zigzag bending πg mode. The highest-frequency πg mode is, by definition, ν10 for C8H2, ν12 for C10H2, and ν14 for C12H2. This numbering of the mode, n of νn, has been applied to the CH-bending πg mode in the IR absorption spectra [26] and also to the trans-bending πg mode of the carbon chain in the laser-induced fluorescence spectra [30]. One might better refrain from the use of the numbering, n for νn, because of the close proximity of the vibrational frequencies for the CH-bending πg mode and the trans-zigzag bending πg mode. However, for convenience throughout this article, we dare to reserve for the CH-bending the numbering of the highest-frequency πg mode, i.e., ν10 for C8H2, ν12 for C10H2, and ν14 for C12H2, while for the trans-zigzag bending of the carbon chain the numbering of the second highest-frequency πg mode, i.e., ν11 for C8H2, ν13 for C10H2, and ν15 for C12H2. Having the same frequency and belonging to the same vibrational symmetry, both πg modes can strongly couple to gain extra activity, appearing as conspicuous spectral features.
Another relaxation is obtained upon distortion induced by the electronic transition, provided the cis-zigzag bending mode is excited simultaneously. In this mode, displacements of the adjacent C≡C units are in opposite directions transversely to the molecular axis. The symmetry of this mode is πu for C8H2 and C12H2 or πg for C10H2, namely πu’ for the 4n series and πg’ for the 4n + 2 series. Having smaller number of nodes along the carbon chain, the vibrational frequency of ~240 cm−1 for this cis-zigzag bending mode, πu’ or πg’, is lower than that of ~620 cm−1 for the trans-zigzag bending mode, πg. They are ν16πu for C8H2, ν15πg for C10H2, and ν23πu for C12H2. With the excitation of even-numbered vibrational quanta, the πg and πu modes provide a totally symmetric vibrational species as πg ⊗ πg = πu ⊗ πu = σg+  δg, and thus are excited simultaneously upon the electronic excitation with a transition moment parallel to the molecular axis, namely the ∑-∑ transition. An example for the progression of the even-numbered vibrational quanta of a bending mode is reported for the ∏-∑ transition of a simple linear molecule of C3 [35].

4.2. Phosphorescence Lifetimes

The observed lifetimes of 31 ms for C8H2, 8.4 ms for C10H2, and 3.9 ms for C12H2 are comparable to the reported lifetimes of cyanopolyynes in solid rare gas matrices, i.e., 40 ms for HC5N [13,16], 8.2 ms for HC7N [15], and 3.9 ms for HC9N [18]. In solid organic matrices at 20 K, phosphorescence lifetimes of HC9N were ~9.7 ms in solid hexane and ~11.2 ms in solid acetonitrile, and the lifetime of HC11N was ~7.6 ms in solid acetonitrile [22]. These observations clearly show shorter lifetimes for larger species. The tendency of decreasing lifetimes for larger species is confirmed for both series of polyynes and cyanopolyynes. With an increasing number of vibrational degrees of freedom, particularly in low-frequency bending modes for longer polyynes, non-radiative decay is promoted from the upper singlet states, as well as from the lowest triplet state, a3u+, to vibrationally excited states of the singlet ground state, X1g+. The population in the electronically excited states decreases faster for larger molecules with a high density of vibrational states.

4.3. Phosphorescence versus Fluorescence

Laser-induced fluorescence spectra have been reported in the near-UV and visible regions for hydrogen-capped centrosymmetric polyyne molecules of C2nH2 (n = 5–8) in hexane solutions at ambient temperature, c.a. 25 °C, upon the excitation of the fully allowed transition, 1u+X1g+, in the UV [30]. The optical emission was attributed to the vibronic transition in the symmetry-forbidden electronic system of 1ΔuX1g+. The optical transition for the 0–0 band of 1ΔuX1g+ is strictly forbidden but becomes weakly allowed through vibronic coupling, when a particular vibrational mode, namely an inducing mode of πg symmetry, is activated or deactivated simultaneously upon the electronic transition [32,33]. Under the room temperature condition of the solution, fluorescence was detectable but phosphorescence was not noticed [30], reasonably because of the fast relaxation via internal conversion at the elevated temperature. Only the fluorescence having a typical lifetime of at most a few nanoseconds could be detected. In the present work for the same series of molecules, C2nH2 (n = 4–6), with the same excitation energy but in the cold matrix of solid hexane at 20 K, the phosphorescence spectrum predominated while the fluorescence spectrum was not discernible.

4.4. Vibronic Bands in the Forbidden Transition

Figure 12 shows the detail of the phosphorescence mapping of C10H2, with an extension of the excitation wavelength in the near-UV range from 302 nm to 409 nm, in addition to the excitation in the UV range from 213 nm to 302 nm. In the UV excitation below 300 nm, bright spots are discernible in the map, which are attributable to the 0–1 band emission of the phosphorescence, a3u+X1g+, upon the excitation of the allowed transition, 1u+X1g+. The bottom trace in light blue is the excitation spectrum for the emission at 693.5 nm, showing again the curve of UV absorption identical to the excitation spectrum by the 0–0 band at 605 nm in Figure 5a. In the middle trace, using the emission at 687.0 nm, another peak of the excitation at 262 nm appears as the small spot in the map, which corresponds to the emission peak of the dashed line in Figure 4. This excitation spectrum exhibits complex patterns, with two sharp peaks and some overlapping bands in the slightly longer wavelength region of 266–271 nm. The upper trace using the emission at 686.0 nm shows the excitation peak at 242 nm within a complex pattern of the excitation spectrum. All these patterns appear in the phosphorescence excitation mapping of C10H2 in solid hexane and they are reproducible for different matrix samples and for the mapping using the 0–0 band emission. Couples of electronic states are predicted below the excitation energy of the allowed transition, to which the electric dipole transition is symmetry forbidden but vibronically allowed by the mechanism of intensity borrowing [36,37,38].
In the near-UV excitation of 310–395 nm in Figure 12, four bands with an increment of ~2050 cm−1 are found in the mapping using phosphorescence 0–1 band of C10H2. By the proximity to those observed as absorption bands in the symmetry-forbidden transition in solutions [10,30], these bands belong to the excitation of the 1ΔuX1g+ system of the HOMO–LUMO transition. Table 5 compares the observed bands in the forbidden transition by phosphorescence excitation in solid hexane at 20 K in the present work and those by absorption in hexane solutions at ambient temperature [30]. In the excitation spectrum using the phosphorescence 0–0 band in Figure 5a, identical features are discernible in 32,300–25,300 cm−1. The intensity of these features in the excitation spectrum in Figure 5a is relatively stronger than the intensity in absorption in the solutions shown in Figure 5b. The difference is rationalized as follows: in different wavelengths of UV, where the molecule strongly absorbs the incident light, and near-UV, where the molecular absorption is orders of magnitude weaker, the thickness of the sample is common for the transmission measurement of the absorption in solutions, while in the phosphorescence measurement, the penetration depth of the incident light for the excitation is different, i.e., thin for the UV and thick for the near-UV, to gain intensity for the near-UV relative to the UV.
As the probing wavelength is shortened from 694 nm to 686 nm, the band shape of the forbidden transition changes, but rather simply compared with those in the allowed transition in shorter wavelengths. Since the appearance of the phosphorescence signal of the 0–1 band in 685–695 nm coincides well with the excitations of the allowed transition, 1u+X1g+, and the forbidden transition, 1ΔuX1g+, all the spectral features in Figure 12 belong to C10H2, despite the complex shifts in wavelengths and the alternating intensities.

4.5. Relevance to Interstellar Molecules

Finally, we briefly mention the relevance to interstellar molecules. Cyanopolyynes, H(C≡C)nC≡N, have been a series of leading interstellar molecules since their discovery by radio astronomical observations in the late 1970s [3,4,5,6,7]. It is natural to consider that the simplest analog of hydrogen-end-capped polyynes, H(C≡C)nH, shares the same place [8]. However, their detection in space has been limited by the selection rule for the pure rotational transition to take place, i.e., the detectable molecule must have a permanent electric dipole. Since the radio-frequency pure rotational transition for the centrosymmetric polyyne molecule, H(C≡C)nH, is forbidden, vibrational transitions or electronic transitions are the possibilities for detection.
Infrared absorption has been reported in relevance to the abundance of hexatriyne, C6H2, and octatetrayne, C8H2, in the atmosphere of Titan [11,12]. In this case, vibrational modes associated with heteronuclear, dipolar CH bonding are detectable, i.e., the asymmetric CH stretching σu mode at ~3330 cm−1 and the synchronized CH bending πu mode at 622 cm−1, and its combination of πu + πg at ~1230 cm−1. For the characteristic localized vibration on the two terminal CH bonds, the vibrational frequencies of these modes are independent of the size of the carbon chain. On the other hand, transition energies of the electronic spectra are size dependent because of the property of the HOMO–LUMO excitation of the electron in the doubly degenerate π-orbitals on the carbon chain, as plotted in Figure 13. Absorption bands of vibronic transitions in the forbidden transition, 1uX1g+ and 1ΔuX1g+ [33], have been the subject of astronomical observation. Concerning the phosphorescence, a3u+X1g+, the size-dependent property is clearly shown for the wavelength of their 0–0 bands, as demonstrated in Figure 4 and Figure 13. Although the observable condition is limited to the place where the UV excitation occurs for cold molecules, phosphorescence in the visible and near-infrared regions can be a promising probe for the detection of centrosymmetric linear polyyne molecules of C2nH2 in space.

Supplementary Materials

The following supporting information can be accessible at: https://www.mdpi.com/article/10.3390/photochem2010014/s1. For the assignment of vibrational modes in Figure 9 and Table 3, supplementary Figures S1 and S2 are available online. Figure S1 summarizes calculated harmonic frequencies and observed fundamentals and overtones. Figure S2 illustrates the displacement of atoms in the breathing mode (σg’) and the trans-zigzag (πg) and cis-zigzag (πu’ or πg’) bending modes for (a) C8H2, (b) C10H2, and (c) C12H2.

Author Contributions

Conceptualization, T.W. and U.S.; validation, H.S. (Haruo Shiromaru), T.K. and M.H.; investigation, T.Y. and H.S. (Hal Suzuki); chemical resources, K.T., S.S., and K.O.; data curation, K.F. and R.O.; writing—original draft preparation, T.W.; writing—review and editing, U.S. and J.-C.G.; funding acquisition, T.W. All authors have read and agreed to the published version of the manuscript.

Funding

This research was funded by The Ministry of Education, Sports, Science and Technology (MEXT) of Japan grant number 20K05438 of Grant-in-Aid for Scientific Research C.

Institutional Review Board Statement

Not applicable.

Informed Consent Statement

Not applicable.

Data Availability Statement

To share the experimental data sets for further investigations, please contact to the corresponding author, T.W., [email protected].

Conflicts of Interest

The authors declare no conflict of interest.

Sample Availability

Samples of polyynes in various organic solvents containing ~1 mg of C8H2, C10H2, or C12H2 are available for basic researches. For collaborations, please contact to the corresponding author, T.W., [email protected].

References

  1. Cataldo, F. (Ed.) Polyynes: Synthesis, Properties, and Applications; CRC Press: Boca Raton, FL, USA, 2006. [Google Scholar] [CrossRef]
  2. Diederich, F.; Stang, P.J.; Tykwinski, R.R. (Eds.) Acetylene Chemistry: Chemistry, Biology, and Material Science; Wiley-VCH: Weinheim, Switzerland, 2004. [Google Scholar] [CrossRef]
  3. Broten, N.W.; Oka, T.; Avery, L.W.; MacLeod, J.M.; Kroto, H.W. The detection of HC9N in interstellar space. Astrophys. J. 1978, 223, L105. [Google Scholar] [CrossRef]
  4. Snell, R.L.; Schloerb, F.P.; Young, J.S.; Hjalmarson, A.; Friberg, P. Observations of HC3N, HC5N, and HC7N in molecular clouds. Astrophys. J. 1981, 244, 45–53. [Google Scholar] [CrossRef]
  5. Bell, M.B.; Avery, L.W.; MacLeod, J.M.; Matthews, H.E. The excitation temperature of HC9N in the circumstellar envelope of IRC+10216. Astrophys. J. 1992, 400, 551–555. [Google Scholar] [CrossRef]
  6. Truong-Bach, D.G. HC9N from the envelopes of IRC+10216 and CRL:2688. Astron. Astrophys. 1993, 277, 133–138. [Google Scholar]
  7. Loomis, R.A.; Shingledecker, C.N.; Langston, G.; McGuire, B.A.; Dollhopf, N.M.; Burkhardt, A.M.; Corby, J.; Booth, S.T.; Carroll, P.B.; Turner, B.; et al. Non-detection of HC11N towards TMC-1: Constraining the chemistry of large carbon-chain molecules. Mon. Not. R. Astron. Soc. 2016, 463, 4175–4183. [Google Scholar] [CrossRef] [Green Version]
  8. Heath, J.R.; Zhang, Q.; O’Brien, S.C.; Curl, R.F.; Kroto, H.W.; Smalley, R.E. The formation of long carbon chain molecules during laser vaporization of graphite. J. Am. Chem. Soc. 1987, 109, 359–363. [Google Scholar] [CrossRef]
  9. Eastmond, R.; Johnson, T.R.; Walton, D.R.M. Silylation as a protective method for terminal alkynes in oxidative couplings—A general synthesis of the parent polyynes H(C≡C)nH (n = 4–10, 12). Tetrahedron 1972, 28, 4601–4616. [Google Scholar] [CrossRef]
  10. Kloster-Jensen, E.; Haink, H.-J.; Christen, H. The electronic spectra of unsubstituted mono- to penta- acetylene in the gas phase and in solution in the range 1100 to 4000 Å. Helv. Chim. Acta 1974, 57, 1731–1744. [Google Scholar] [CrossRef]
  11. Shindo, F.; Bénilan, Y.; Chaquin, P.; Guillemin, J.-C.; Jolly, A.; Raulin, F. IR spectrum of C8H2: Integrated band intensities and some observational implications. J. Mol. Spectrosc. 2001, 210, 191–195. [Google Scholar] [CrossRef]
  12. Shindo, F.; Benilan, Y.; Guillemin, J.-C.; Chaquin, P.; Jolly, A.; Raulin, F. Ultraviolet and infrared spectrum of C6H2 revisited and vapor pressure curve in Titan’s atmosphere. Planet. Space Sci. 2003, 51, 9–17. [Google Scholar] [CrossRef]
  13. Coupeaud, A.; Kołos, R.; Couturier-Tamburelli, I.; Aycard, J.P.; Piétri, N. Photochemical synthesis of the cyanodiacetylene HC5N: A cryogenic matrix experiment. J. Phys. Chem. A 2006, 110, 2371–2377. [Google Scholar] [CrossRef] [PubMed]
  14. Crépin, C.; Turowski, M.; Ceponkus, J.; Douin, S.; Boyé-Péronne, S.; Gronowski, M.; Kołos, R. UV-induced growth of cyanopolyyne chains in cryogenic solids. Phys. Chem. Chem. Phys. 2011, 13, 16780–16785. [Google Scholar] [CrossRef] [PubMed]
  15. Couturier-Tamburelli, I.; Piétri, N.; Crépin, C.; Turowski, M.; Guillemin, J.-C.; Kołos, R. Synthesis and spectroscopy of cyano-triacetylene (HC7N) in solid argon. J. Chem. Phys. 2014, 140, 044329. [Google Scholar] [CrossRef]
  16. Turowski, M.; Crépin, C.; Gronowski, M.; Guillemin, J.-C.; Coupeaud, A.; Couturier-Tamburelli, I.; Piétri, N.; Kołos, R. Electronic absorption and phosphorescence of cyanodiacetylene. J. Chem. Phys. 2010, 133, 074310. [Google Scholar] [CrossRef] [PubMed]
  17. Turowski, M.; Crépin, C.; Douin, S.; Gronowski, M.; Couturier-Tamburelli, I.; Piétri, N.; Wasiak, A.; Kołos, R. Low temperature Raman spectra of cyanobutadiyne (HC5N). Vib. Spectrosc. 2012, 62, 268–272. [Google Scholar] [CrossRef]
  18. Szczepaniak, U.; Crépin, C.; Gronowski, M.; Chevalier, M.; Guillemin, J.-C.; Turowski, M.; Custer, T.; Kołos, R. Cryogenic photochemical synthesis and electronic spectroscopy of cyanotetraacetylene. J. Phys. Chem. A 2017, 121, 7374–7384. [Google Scholar] [CrossRef]
  19. Szczepaniak, U.; Turowski, M.; Custer, T.; Gronowski, M.; Kerisit, N.; Trolez, Y.; Kołos, R. Infrared and Raman spectroscopy of methylcyanodiacetylene (CH3C5N). ChemPhysChem 2016, 17, 3047–3054. [Google Scholar] [CrossRef]
  20. Szczepaniak, U.; Kołos, R.; Gronowski, M.; Guillemin, J.-C.; Crépin, C. Low temperature synthesis and phosphorescence of methyltriacetylene. J. Phys. Chem. A 2018, 122, 89–99. [Google Scholar] [CrossRef]
  21. Turowski, M.; Szczepaniak, U.; Custer, T.; Gronowski, M.; Kołos, R. Electronic spectroscopy of methylcyanodiacetylene (CH3C5N). ChemPhysChem 2016, 17, 4068–4078. [Google Scholar] [CrossRef]
  22. Szczepaniak, U.; Ozaki, K.; Tanaka, K.; Ohnishi, Y.; Wada, Y.; Guillemin, J.-C.; Crépin, C.; Kołos, R.; Morisawa, Y.; Suzuki, H.; et al. Phosphorescence excitation mapping and vibrational spectroscopy of HC9N and HC11N cyanopolyynes in organic solvents. J. Mol. Struct. 2020, 1214, 128201. [Google Scholar] [CrossRef]
  23. Tsuji, M.; Tsuji, T.; Kuboyama, S.; Yoon, S.-H.; Korai, Y.; Tsujimoto, T.; Kubo, T.T.; Mori, A.; Mochida, I. Formation of hydrogen-capped polyynes by laser ablation of graphite particles suspended in solution. Chem. Phys. Lett. 2002, 355, 101–108. [Google Scholar] [CrossRef]
  24. Tabata, H.; Fujii, M.; Hayashi, M.; Doi, T.; Wakabayashi, T. Raman and surface-enhanced Raman scattering of a series of polyynes. Carbon 2006, 44, 3168–3176. [Google Scholar] [CrossRef]
  25. Inoue, K.; Matsutani, R.; Sanada, T.; Kojima, K. Preparation of long-chain polyynes of C24H2 and C26H2 by liquid-phase laser ablation in decalin. Carbon 2010, 48, 4209–4211. [Google Scholar] [CrossRef]
  26. Wada, Y.; Morisawa, Y.; Wakabayashi, T. Spectroscopic characterization of a series of polyyne-iodine molecular complexes H(C≡C)nH(I6) of n = 5–9. Chem. Phys. Lett. 2012, 541, 54–59. [Google Scholar] [CrossRef]
  27. Sato, Y.; Kodama, T.; Shiromaru, H.; Sanderson, J.H.; Fujino, T.; Wada, Y.; Wakabayashi, T.; Achiba, Y. Synthesis of polyyne molecules from hexane by irradiation of intense femtosecond laser pulses. Carbon 2010, 48, 1673–1676. [Google Scholar] [CrossRef]
  28. Wakabayashi, T.; Tabata, H.; Doi, T.; Nagayama, H.; Okuda, K.; Umeda, R.; Hisaki, I.; Sonoda, M.; Tobe, Y.; Minematsu, T.; et al. Resonance Raman spectra of polyyne molecules C10H2 and C12H2 in solution. Chem. Phys. Lett. 2007, 433, 296–300. [Google Scholar] [CrossRef]
  29. Wakabayashi, T.; Saikawa, M.; Wada, Y.; Minematsu, T. Isotope scrambling in the formation of cyanopolyynes by laser ablation of carbon particles in liquid acetonitrile. Carbon 2012, 50, 47–56. [Google Scholar] [CrossRef]
  30. Wakabayashi, T.; Nagayama, H.; Daigoku, K.; Kiyooka, Y.; Hashimoto, K. Laser induced emission spectra of polyyne molecules C2nH2 (n = 5–8). Chem. Phys. Lett. 2007, 446, 65–70. [Google Scholar] [CrossRef]
  31. Gaussian 16, Revision C.01; Gaussian, Inc.: Wallingford, CT, USA, 2019. Available online: https://gaussian.com/gaussian16/ (accessed on 21 February 2021).
  32. Ding, H.; Schmidt, T.W.; Pino, T.; Güthe, F.; Maier, J.P. Towards bulk behaviour of long hydrogenated carbon chains? Phys. Chem. Chem. Phys. 2003, 5, 4772–4775. [Google Scholar] [CrossRef]
  33. Wakabayashi, T.; Wada, Y.; Iwahara, N.; Sato, T. Vibronic bands in the HOMO-LUMO excitation of linear polyyne molecules. J. Phys. Conf. Ser. 2013, 428, 012004. [Google Scholar] [CrossRef]
  34. Nakai, H. Discovery of chemical principles: Symmetry rules of degenerate excitations. J. Comp. Chem. Jpn. 2012, 11, 1–16. (In Japanese) [Google Scholar] [CrossRef] [Green Version]
  35. Čermák, I.; Förderer, M.; Čermáková, I.; Kalhofer, S.; Stopka-Ebeler, H.; Monninger, G.; Krätschmer, W. Laser-induced emission spectroscopy of matrix-isolated carbon molecules: Experimental setup and new results on C3. J. Chem. Phys. 1998, 108, 10129–10142. [Google Scholar] [CrossRef]
  36. Orlandi, G.; Siebrand, W. Theory of vibronic intensity borrowing. Comparison of Herzberg-Teller and Born-Oppenheimer coupling. J. Chem. Phys. 1973, 58, 4513–4523. [Google Scholar] [CrossRef]
  37. Lin, S.H.; Eyring, H. Study of vibronic and Born-Oppenheimer couplings. Proc. Nat. Acad. Sci. USA 1974, 71, 3415–3417. [Google Scholar] [CrossRef] [PubMed] [Green Version]
  38. Lin, S.H.; Eyring, H. Study of the Franck-Condon and Herzberg-Teller Approximations. Proc. Nat. Acad. Sci. USA 1974, 71, 3802–3804. [Google Scholar] [CrossRef] [PubMed] [Green Version]
Figure 1. Dispersed phosphorescence spectrum of C8H2, a3u+X1g+, in solid hexane at 20 K induced by the excitation with UV photons at 231.8 nm.
Photochem 02 00014 g001
Figure 2. Phosphorescence excitation mapping of C8H2 in solid hexane at 20 K probed by the emission intensity of the 0–1 band peaking at 602.5 nm.
Photochem 02 00014 g002
Figure 3. Phosphorescence excitation spectrum of C8H2 in solid hexane at 20 K plotted by the emission intensity at 602.7 nm for the 0–1 band of the a3u+X1g+ transition (open circles). The spectral features correspond to the absorption spectrum for the fully allowed electronic transition in the UV, 1u+X1g+.
Photochem 02 00014 g003
Figure 4. Dispersed phosphorescence spectra of C8H2, C10H2, and C12H2 in solid hexane at 20 K.
Photochem 02 00014 g004
Figure 5. (a) Phosphorescence excitation spectrum of C10H2 in solid hexane at 20 K plotted by the emission intensity at 605 nm for the 0–0 band in the a3u+X1g+ transition. Absorption spectra of C10H2, 1u+X1g+, (b) in the solution of hexane and (c) in the gas phase, are plotted for comparison. Numbers atop the peak maxima are the wavelengths in nm.
Photochem 02 00014 g005
Figure 6. Phosphorescence excitation mapping (left) and the excitation spectrum probed by the emission intensity at 761.7 nm (right) of C12H2 in solid hexane at 20 K. Absorption spectrum of C12H2 in hexane solution at room temperature (dashed line in blue) is shown for comparison.
Photochem 02 00014 g006
Figure 7. Transition energies of the electronic 1u+X1g+ system of C2nH2 (n = 4–6) under the three different conditions in the gas phase, hexane solutions, and solid hexane matrices.
Photochem 02 00014 g007
Figure 8. Temporal decay profiles of selected phosphorescence peaks in the 0–0 and 0–1 bands of C8H2, C10H2, and C12H2 in solid hexane at 20 K. For C8H2, plots are the emission peak intensities at 533 nm (0–0) and 603 nm (0–1) by the excitation at 231.0 nm. Similarly, the emission at 603 nm (0–0) and 692 nm (0–1) by the excitation at 257.0 nm for C10H2, and the emission at 660 nm (0–0) and 765 nm (0–1) by the excitation at 282.0 nm for C12H2.
Photochem 02 00014 g008
Figure 9. Vibrational features in the dispersed phosphorescence spectra for (a) C8H2, (b) C10H2, and (c) C12H2 in solid hexane at 20 K.
Photochem 02 00014 g009
Figure 10. Spectral changes in phosphorescence 0–0 bands of C8H2 upon the warming–cooling cycle of the solid hexane matrix.
Photochem 02 00014 g010
Figure 11. Spectral changes in the phosphorescence 0–1 band of C8H2 upon annealing of the solid hexane matrix from 20 K to 120 K, where the hexane matrix sublimes.
Photochem 02 00014 g011
Figure 12. Phosphorescence excitation mapping of C10H2 polyyne molecules in solid hexane matrix at 20 K. Three traces in light blue are the excitation spectra corresponding to the emission at 686.0 nm, 687.0 nm, and 693.5 nm, all belonging to the 0–1 band with the ν3σg stretching-mode excitation in the phosphorescence, a3u+X1g+. The main features in shorter wavelengths than 271 nm are bands in the allowed transition, 1u+X1g+, while the weak features in the excitation wavelengths of 310–395 nm are bands in the forbidden transition, 1ΔuX1g+.
Photochem 02 00014 g012
Figure 13. Wavelengths of the 0–0 band of phosphorescence (circles) and absorption (squares) of polyyne molecules, C2nH2, plotted as a function of molecular size, 2n. The excitation wavelength of the forbidden transition of C10H2 in the solid hexane matrix in the present work (diamond) is plotted with emission and absorption wavelengths in solutions (triangles) [30]. Transition wavelengths of cyanopolyyne molecules, HC2n+1N, are plotted for comparison (closed markers) [22].
Photochem 02 00014 g013
Table 1. Peaks in cm−1 (nm) for the phosphorescence excitation spectra of polyyne molecules, C2nH2 (n = 4–6), in solid hexane matrices at 20 K. Peaks in the absorption spectra in the hexane solution and in the gas phase are listed for comparison.
MoleculeAssignment 1Solid Matrix
Hexane (20 K)
Solution 2
Hexane
Gas Phase 2
C8H20–043,113 (231.9)43,960 (227.5)48,190 (207.5)
1–045,243 (221.0)46,080 (217.0)50,280 (198.9)
2–0 48,190 (207.5)52,380 (190.9)
C10H20–038,728 (258.2)39,640 (252.3)43,690 (228.9)
1–040,815 (245.0)41,670 (240.0)45,790 (218.4)
2–042,909 (233.1)43,630 (229.2)47,820 (209.1)
3–044,940 (222.5)45,600 (219.3)
C12H20–035,420 (282.3)36,260 (275.8)40,370 (247.7)
1–037,511 (266.6)38,300 (261.1)42,340 (236.2)
2–039,469 (253.4)40,230 (248.6)44,250 (226.0)
3–041,457 (241.2)42,160 (237.2)
4–043,292 (231.0)44,010 (227.2)
1 Change in the symmetric stretching σg vibrational level in the 1u+X1g+ transition. 2 Measurement at room temperature.
Table 2. Molecular constants in cm−1 of the electronically excited state, 1u+, of polyyne molecules, C2nH2 (n = 4–6) in solid/liquid hexane and in the gas phase. Vibrational constants, ωe and ωexe, are for the alternating CC stretching σg mode.
MoleculeConstantSolid
cm−1
Solution
cm−1
Gas
cm−1
C8H2T * 142,04842,89647,145
ωe2130 221302090 2
ωexe5
C10H2T * 137,66338,62642,614
ωe212920442170
ωexe141535
C12H2T * 134,36135,23739,362
ωe214120722030
ωexe342730
1 T * = T0ωe/2 + ωexe/4. Zero-point energy in the electronic ground state is included. 2 Difference in the transition energies for the 1–0 and 0–0 bands.
Table 3. Overtone and combination bands observed in the dispersed phosphorescence spectra of C2nH2 (n = 4–6) in solid hexane matrices at 20 K. Vibrational mode characteristics are noted for (a) the alternating C≡C and C–C stretching mode, σg (2100–2200 cm−1), (b) the longitudinal breathing mode, σg’, (c) the even-numbered overtone of the trans-zigzag bending mode, πg (~620 cm−1), and (d) the even-numbered overtone of the cis-zigzag bending mode, πg’ for C10H2 and πu’ for C8H2 and C12H2 (~240 cm−1).
MoleculeObserved Band
cm−1 (nm)
Difference Frequency
cm−1
Vibrational Mode
Assignment
C8H218,788 (532.3)  0 0 0 0 0–0 band
18,305483 5 1 0 σgbreathing b
and/or 16 2 0 πu2cis-zigzag d
17,819969 16 4 0 πu4cis-zigzag d
17,5401248 11 2 0 πg2trans-zigzag c
16,597 (602.4)  2190 2 1 0 σgalternating CC str. a
16,126471 2 1 0 5 1 0 σg + σgbreathing b
and/or 2 1 0 16 2 0 σg + πu2cis-zigzag a,d
15,646951 2 1 0 16 4 0 σg + πu4cis-zigzag a,d
15,3521245 2 1 0 11 2 0 σg + πg2trans-zigzag a,c
14,426 (693.2)  2172 2 2 0 σg2alternating CC str. a
13,959467 2 2 0 5 1 0 σg2 + σgbreathing b
and/or 2 2 0 16 2 0 σg2 + πu2cis-zigzag a,d
13,1831243 2 2 0 11 2 0 σg2 + πg2trans-zigzag a,c
12,268 (815.1)  2157 2 3 0 σg3alternating CC str. a
10,133 (986.9)  2136 2 4 0 σg4alternating CC str. a
C10H216,525 (605.1)  0 0 0 0 0–0 band
16,145380 6 1 0 σgbreathing b
16,042483 15 2 0 πg2cis-zigzag d
15,560965 15 4 0 πg4cis-zigzag d
15,2931232 13 2 0 πg2trans-zigzag c
14,405 (694.2)  2120 3 1 0 σgalternating CC str. a
14,031374 3 1 0 6 1 0 σg + σgbreathing a,b
13,930475 3 1 0 15 2 0 σg + πg2cis-zigzag a,d
13,456949 3 1 0 15 4 0 σg + πg4cis-zigzag a,d
13,1721233 3 1 0 13 2 0 σg + πg2trans-zigzag a,c
12,300 (813.0)  2105 3 2 0 σg2alternating CC str. a
11,902398 3 2 0 6 1 0 σg2 + σgbreathing a,b
11,847453 3 2 0 15 2 0 σg2 + πg2cis-zigzag a,d
10,210 (979.4)  2090 3 3 0 σg3alternating CC str. a
C12H215,178 (658.8)  0 0 0 0 0–0 band
14,869309 7 1 0 σgbreathing b
14,699479 23 2 0 πu2cis-zigzag d
14,205973 23 4 0 πu4cis-zigzag d
13,8831295 15 2 0 πg2trans-zigzag c
13,088 (764.1)  2090 3 1 0 σgalternating CC str. c
12,765323 3 1 0 7 1 0 σg + σgbreathing a,b
12,602486 3 1 0 23 2 0 σg + πu2cis-zigzag a,d
11,008 (908.4)  2080 3 2 0 σg2alternating CC str. a
10,699309 3 2 0 7 1 0 σg2 + σgbreathing a,b
Table 4. Molecular constants in cm−1 obtained from the analysis of the a3u+X1g+ phosphorescence spectra for polyyne molecules, C2nH2 (n = 4–6), in solid hexane matrices at 20 K. Vibrational constants are deduced for the alternating CC stretching σg mode in the electronic ground state, X1g+.
MoleculeT * 1
cm−1
ωe
cm−1
ωexe
cm−1
ModeRaman 2
cm−1
C8H219,88822058.1 ν2σg2172
C10H217,59021357.5 ν3σg2123
C12H216,22721005.0 ν3σg2096
1 T * = T0 + ωe/2 − ωexe/4. Zero-point energy in the lowest spin-triplet state, a3u+, is included. 2 The Stokes Raman fundamental energy of the 1–0 transition in hexane solutions [24,25,28].
Table 5. Observed peaks in nm for the excitation spectrum of C10H2 in solid hexane matrix at 20 K. For the vibronic transition in near UV, 1ΔuX1g+, absorption bands observed in hexane solution at ambient temperature are listed for comparison [30].
TransitionExcitation
686.0 nm
Excitation
687.0 nm
Excitation
693.5 nm
Separation
cm−1
Solution 1
nm
ModeSymmetry
1ΔuX1g+395.3392.8397.8
390.30
387.8387.8387.8165384 13 0 2 πg2
381.8571
379.3173
365.3363.8367.3
361.32057
359.3359.3359.3154357 3 0 1 13 0 2 σg + πg2
353.8587
351.8161
339.8339.8340.8
336.32058
334.8334.8334.8133333 3 0 2 13 0 2 σg2 + πg2
330.3540
312.8313.8314.82031312 3 0 3 13 0 2 σg3 + πg2
1ΔuX1g+270.2271.2
268.2268.2
266.2266.2
1u+X1g+261.7261.7258.80 0–0
255.3257.3245.32116 3 0 1 σg
250.8251.3233.42084 3 0 2 σg2
242.3242.8222.92008 3 0 3 σg3
233.9239.9
230.9231.4
222.9
220.5
1 Reference [30].
Publisher’s Note: MDPI stays neutral with regard to jurisdictional claims in published maps and institutional affiliations.

