Article

Comparison of the Photodynamic Effect of Two Chlorins, Photodithazine and Fotoenticine, in Gliosarcoma Cells

by
Letícia Corrêa Fontana
1,
Juliana Guerra Pinto
1,
Jéssica Aparecida Magalhães
2,
Dayane Batista Tada
2,
Rainara Moreno Sanches de Almeida
1,
Cristina Pacheco-Soares
3 and
Juliana Ferreira-Strixino
1,*
1
Photobios—Laboratory of Photobiology Applied to Health, Research and Development Institute, University of Vale do Paraiba, Shishima Hifumi, 2911, Urbanova, São José dos Campos 12244-000, SP, Brazil
2
Laboratory of Nanomaterials and Nanotoxicology, Federal University of São Paulo, São José dos Campos 12231280, SP, Brazil
3
Laboratory of Cellular Dynamics, University of Vale do Paraiba, Shishima Hifumi, 2911, Urbanova, São José dos Campos 12244-000, SP, Brazil
*
Author to whom correspondence should be addressed.
Photochem 2022, 2(1), 165-180; https://doi.org/10.3390/photochem2010013
Submission received: 14 December 2021 / Revised: 20 February 2022 / Accepted: 23 February 2022 / Published: 25 February 2022

Abstract

:
The treatment and prognosis of cancers of the nervous system remain unfavorable to the patient, which makes it necessary to study alternative therapies as primary or adjuvant treatments to existing methods. Photodynamic Therapy (PDT) is a method that consists of combining a photosensitizer (PS), a light source at the appropriate wavelength, and molecular oxygen, forming reactive oxygen species (ROS), leading to death in the target cell. The objective of this work was to compare the effects of PDT with two chlorins, Photodithazine (PDZ) and Fotoenticine (FTC), in 9L/lacZ gliosarcoma cell lines. Both chlorins, together with an LED device at 660 nm with a fluence of 10 J/cm², were included in the study. It was observed that the response to therapy depends on the concentration and type of PS used. In addition, PDZ showed a higher quantum yield of singlet oxygen generation than FTC.

1. Introduction

Glioma (GS) is one of the most aggressive tumors of the Central Nervous System (CNS), with a high degree of malignancy. It is considered a rare and aggressive variant of glioblastoma, and its treatments include surgical resection, a combination of chemotherapy and radiotherapy, and immunotherapy. Among the main factors that influence the survival prognosis, the ethnicity and age of patients stand out, which directly affects the type of treatment indicated [1]. According to Hashami, gliosarcoma is characterized by “a well-circumscribed lesion with clearly identifiable biphasic glial and metaplastic mesenchymal components.” However, the characteristics of gliosarcoma lesions do not allow easy differentiation from glioblastoma lesions, preventing a more effective treatment. Despite the studies and technological advances already achieved, the prognosis is still poor, with 7 to 13 months [2].
Photodynamic therapy (PDT) is a promising treatment for various cancer diseases. PDT is a method that consists of a combination of three factors: a photosensitive drug (PS), the light at an appropriate wavelength, and molecular oxygen [3]. When used together, they induce the production of reactive oxygen species, which initiate a sequence of biological events, including phototoxicity, vascular damage, and immune responses, which culminate in cell death. Therefore, understanding the interaction of the three factors and their effects on cancer cells is essential to determine the possibility of clinical application, which would allow for selectivity in the treatment of the disease. The success of PDT depends on the choice of PS, the ideal concentrations for the treatment, the chosen light source, and the irradiation parameters. The tissue to be treated is also another determining factor in the effectiveness of therapy. It is known that protocols with standardization of PS and irradiation conditions do not have similar effects on similar tissues. Therefore, it is necessary to develop individual protocols for each type of tumor [4,5,6]. Kostron points to Foscan® chlorin as a promising photosensitizer for PDT in gliomas and photodynamic diagnosis. A study by Rynda et al. presented the study of two patients with glioblastoma, wherein PDZ was applied intravenously, and, after 1.5 h, the tumor area was irradiated. Signs of apoptosis, necrosis, and autophagy were observed, and the authors concluded that PDT is promising for treating glioblastomas [7,8].
Most of these studies were performed to assess the effects of PDT on glioblastoma strains. Although the types of tumors have significant histological similarities, it is still necessary to analyze the particularities of both types of tumors. Therefore, this study aims to compare the effect of PDT with chlorins, PDZ, and FTC in 9L/lacZ gliosarcoma cell lines.

2. Materials and Methods

2.1. Cell Culture

Cancer cells of the 9L/lacZ lineage (ATCC®—CRL-2200TM) were used, maintained in DMEM medium with 4.5 g/L of glucose and 1 mM of 90% sodium pyruvate, supplemented with 10% of Fetal Bovine Serum (FBS), 1% Penicillin / Streptomycin solution, and stored in a culture oven at 37 °C with 5% CO2.

2.2. Photosensitizers (PS)

Two e6 chlorins were used, Fotoenticine® (FTC) (La company Nuevas Tecnologías Científicas—NTC—Llanera (Asturias)) of Spanish origin and Photodithazine® (PDZ) from the company Veta-Grand® of Russian origin; both chlorins are solubilized and stabilized with 0.5% N-methyl-D-glucosamine. The drugs were supplied by the Biophotonics Laboratory of the São Carlos Institute of Physics—USP São Carlos. FTC is presented in an aqueous solution at 7.1 mg/mL (stock solution). PDZ is presented in an aqueous solution at 5 mg/mL (stock solution). Concentrations from 200 μg/mL to 6.3 μg/mL, in serial dilution 1:1, were used for both chlorins. Trypan blue exclusion tests, MTT morphology, and PDZ were previously published [9].

2.3. Study of PDZ and FTC Fluorescence in Aqueous Solution

The association of PDZ or FTC molecules in the ground or excited state in an aqueous solution was evaluated by UV-vis light absorption and fluorescence spectrometry (FS5, Edinburgh Instruments, Livingston, United Kingdom). PDZ and FTC solutions were prepared in deionized water (type 1) at concentrations from 6.3 to 200 µg/mL. UV-vis absorption spectra were acquired in the range of 260–800 nm by placing the solutions in a quartz cuvette. Fluorescence spectra were obtained using the exact solutions and an excitation filter at 488 nm and measuring the emission intensity in the range of 600 to 800 nm.

2.4. Chlorin Quantum Yield of Singlet Oxygen Generation

The generation of singlet oxygen (1O2) and its lifetime after irradiation was investigated by obtaining emission transients in the near-infrared (NIR) region. Data were acquired in the SHB Analytics GmbH (Berlin, Germany) system, consisting of a Brilliant Nd:YAG laser (Quantel) with a Rainbow OPO with a 10 Hz pulse frequency and an NIR PMT from Hamamatsu. The characteristic phosphorescence intensity evidenced the 1O2 generated by the samples at 1270 nm.
The quantum yield of 1O2 generation (φsample) was calculated by comparing emission transients generated by FTC, PDZ, and Tetra(4-sulfonatophenyl)porphyrin (H2TPPS4−) and was used as the standard PS. The stock solution of chlorins was diluted in water, and an aqueous solution of H2TPPS4− was freshly prepared before the assay. The absorbance of all samples was normalized at 647 nm before the measurements. The transients were monitored after excitation at 647 nm by detecting emission at 1270 nm. After 2 µs of the laser pulse (I), the area under the decay curve was calculated, proportional to the amount of generated 1O2. In order to calculate the quantum yield of 1O2 generation, the values were used according to the following equation:
φ sample = φ standard × A sample A standard
Asample = area under the decay curve of the transient detected at 1270 nm after 2 µs of the laser pulse used to excite sample solution of PDZ or FTC.
Astandard = area under the decay curve of the transient detected at 1270 nm after 2 µs of the laser pulse used to excite standard solution.
φstandard = H2TPPS4− quantum yield of 1O2 generation, reported as 0.62 by Wilkinson [10].

2.5. Chlorin Internalization

Confocal microscopy was used to analyze the uptake of FTC and PDZ. For this, 1 × 10⁶ cells per well were seeded in 24-well plates with round coverslips on the bottom and incubated overnight for adhesion. Chlorin was added to the respective wells at a 200 μg/mL concentration and incubated for 1 h. After this period, the PS was removed, the samples were washed with PBS, and 100 μL of 4% paraformaldehyde diluted in PBS was added to fix the cells for 15 min. Cells were washed with PBS and mounted with ProLong™ Diamond Antifade Mountant with DAPI (Invitrogen™) and observed under LSM 700 Zeiss (Berlin, Germany) confocal microscope. For the DAPI marker, excitation at 358 nm and emission captured at 461 nm were used, while, for chlorins, a laser at 488 nm and emission captured above 500 nm was used for excitation.

2.6. Experimental Design

Chlorin was tested at serially diluted concentrations, from 200 μg/mL to 6.3 μg/mL, with an incubation time of 1 h. Cells were plated in 96- or 24-well plates, according to the assays, at a concentration of 1 × 10⁶ cells/well, incubated for 24 h for adhesion. Three independent assays were performed, in triplicate (n = 9), in all experimental groups, Control (cells without PS kept in the dark), PS (PS at different concentrations tested, nonirradiated), Irradiated Control (cells without PS, irradiated with 10 J/cm²), and PDT (cells incubated with PS and irradiated). After cell adhesion, the PS and PDT groups were set at the concentrations mentioned above for one hour in an oven at 37 °C without light. Next, the Control and Irradiated Control groups were incubated with PBS. After the incubation period, the PS was removed, the cells were washed 1× with sterile PBS, with 200 μL of PBS added to each well, and the PDT and irradiated groups received treatment with 10 J/cm².
An LED-based device (Biopdi / Irrad-Led 660, São Carlos, São Paulo/Brazil) with light emission of 660 nm (±5 nm) was used as a light source for irradiation. The device is composed of 54 LEDs, and a fluence of 10 J/cm² was applied, with a power density of 25 mW/cm², totaling 6 min and 40 s of irradiation.

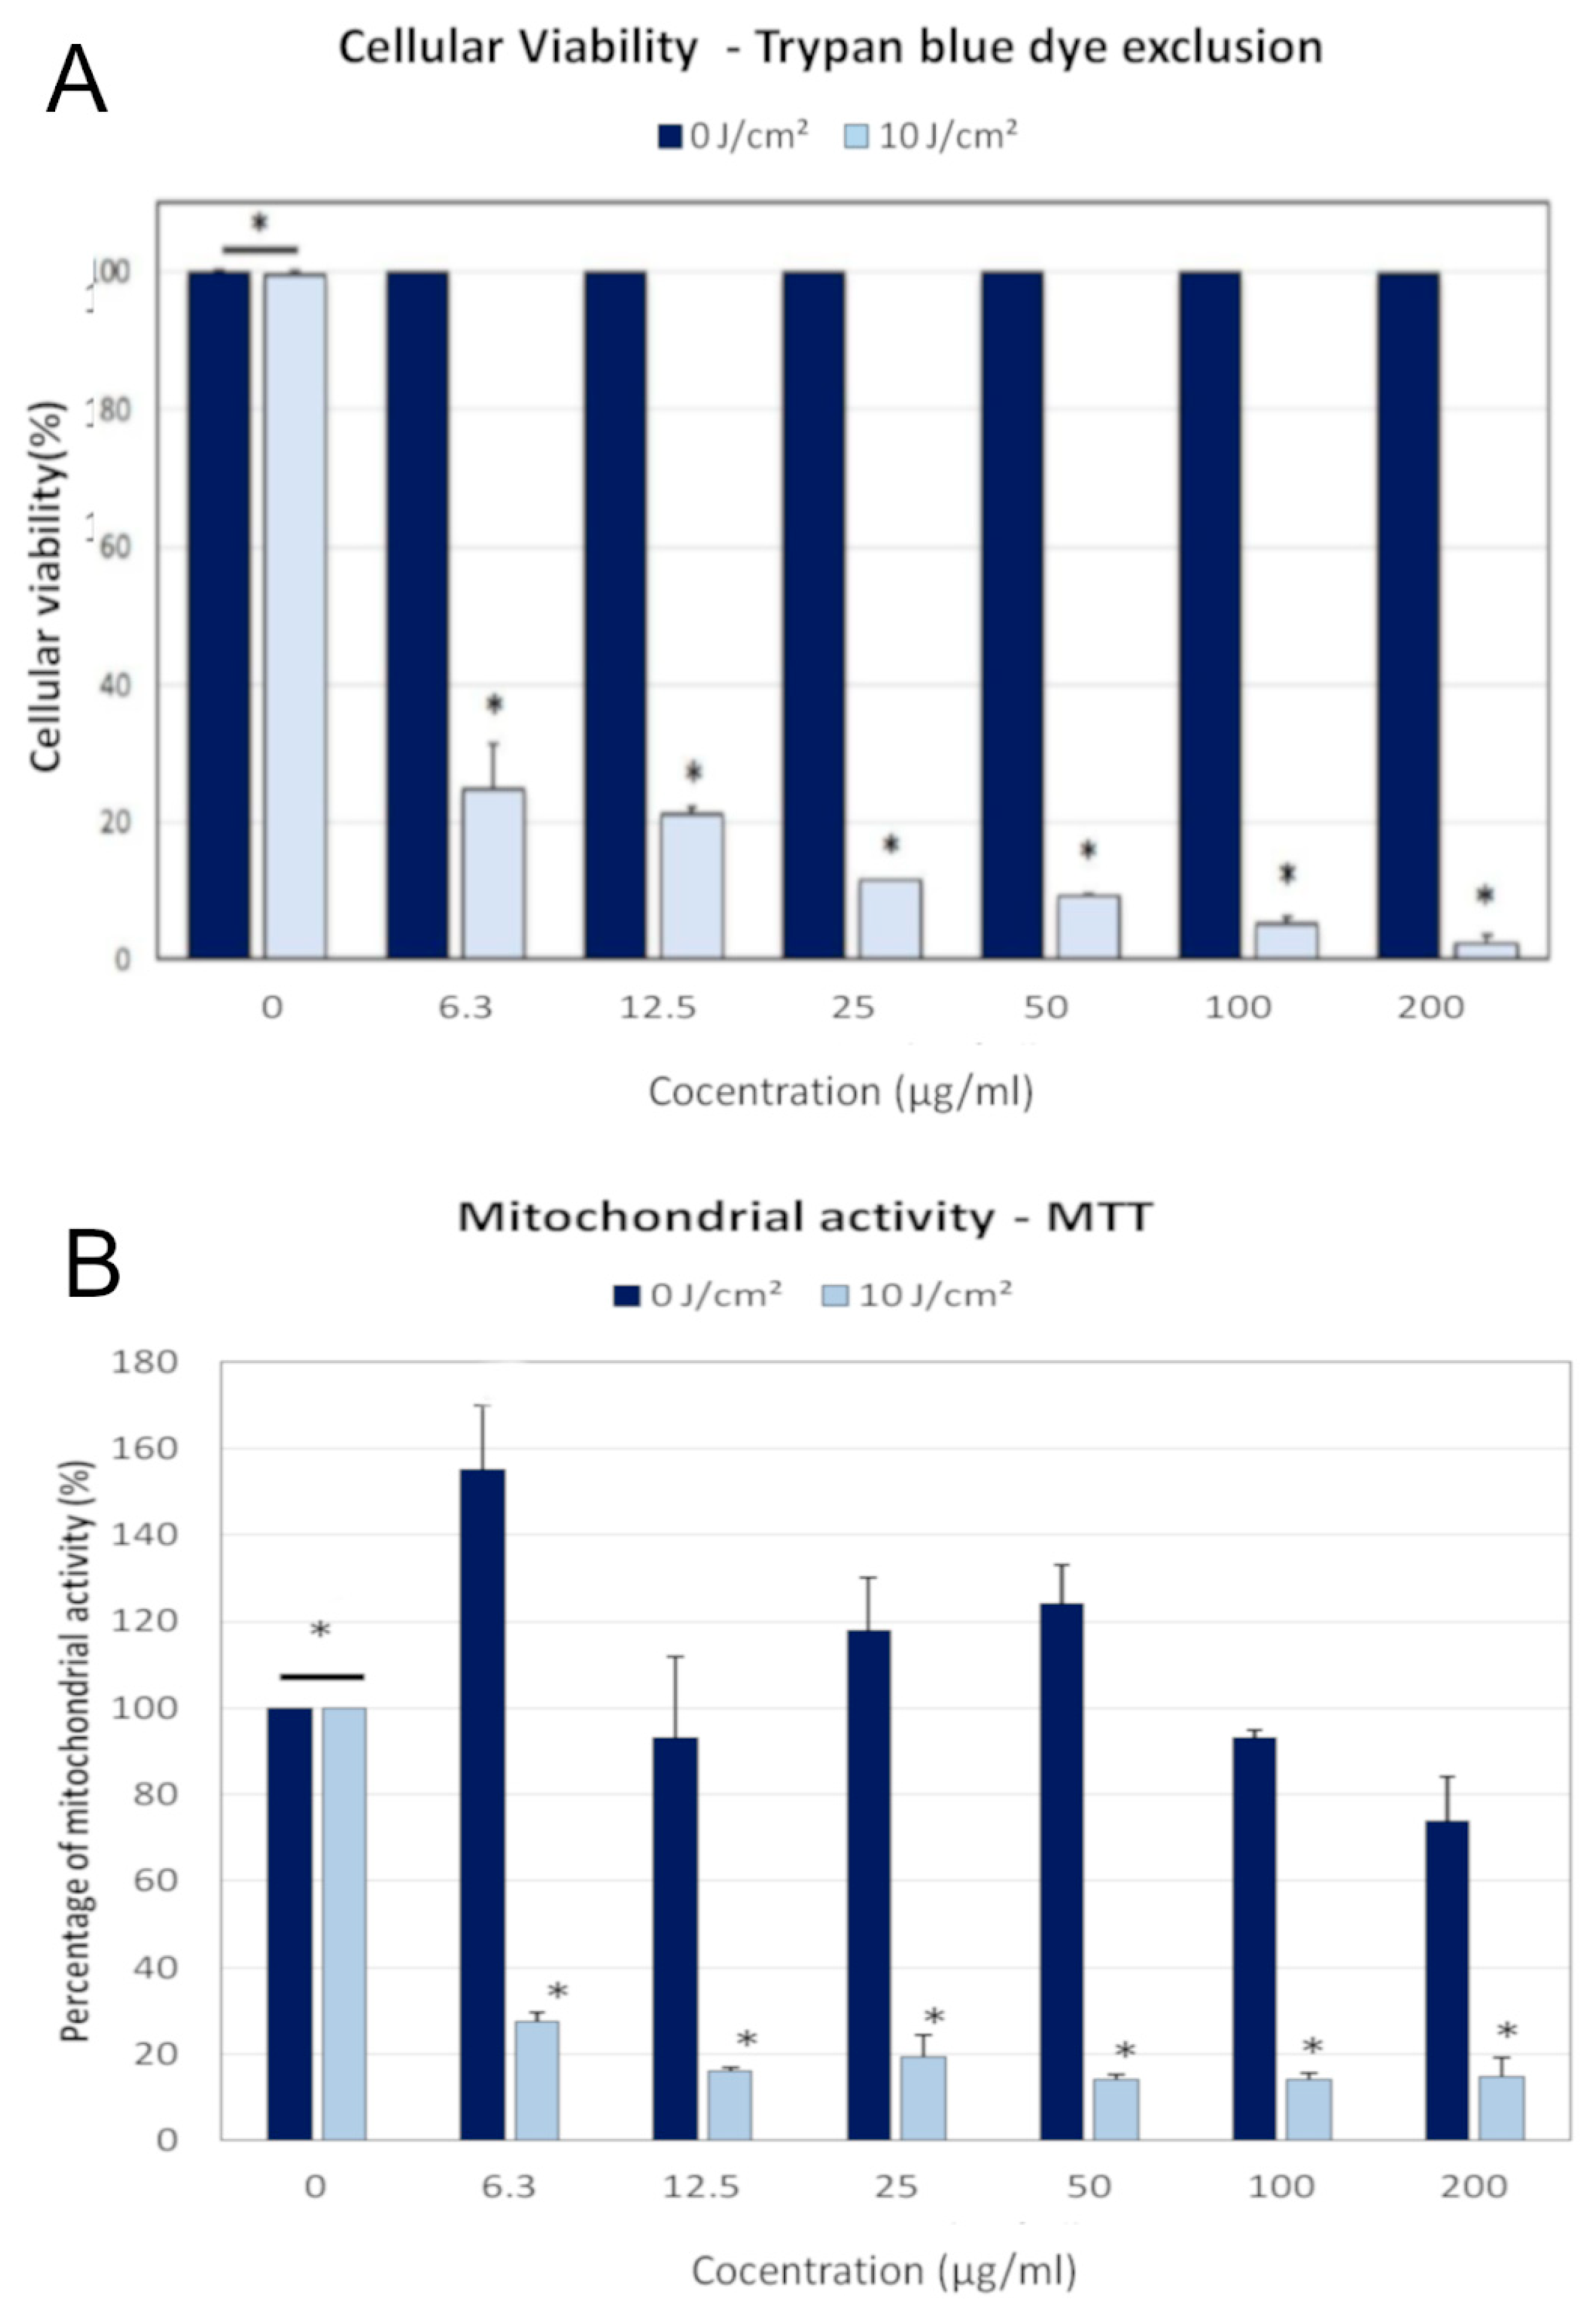
2.7. Cell Viability Analysis by the Trypan Blue Exclusion Method

The trypan blue exclusion method allows differentiating living cells from dead cells by observing the cell staining. Due to membrane integrity, there is no dye accumulation in the cytoplasm of viable cells, whereas membrane-compromised cells stain blue.
The test was performed 18 h after treatments, a time determined by previous group studies. For this, 50 μL of Trypan blue solution (Sigma® Sigma/Merck Brazil, Barueri, São Paulo/Brazil at 0.2% was added for 5 min and 150 μL of PBS. After homogenization, the cells were photographed using a camera coupled to an inverted optical microscope (Zeiss®—Axio Vert A1) at 40× magnification, with five random fields selected from each well. Dead (when blue-stained) and live (unstained cells) cells were counted from each group using the Cell Counter tool of the ImageJ® software (U. S. National Institutes of Health, Bethesda, MD, USA).

2.8. Mitochondrial Activity Analysis

The mitochondrial activity after the tests was evaluated using the MTT test, which consists of the degradation of the MTT salt ([3-(4,5-dimethylthiazol-2-yl) 2,5 diphenyltetrazolium]) in Formazan crystals by viable cells. After 18 h of treatments, 50 μL of MTT solution (5 mg/mL) was added to each well, gently shaken, and incubated for 4 h at 37 °C in a humidified atmosphere without light. After this period, MTT solution was removed, and 100 µL of DMSO was added to each well for the solubilization of the formazan crystals. Optical density was measured using an ELISA-type optical plate reader (Biotek Synergy HT Spectrophotometer Santa Clara, CA, USA) with a 570 nm filter. The absorbance values obtained were transformed into the percentage of mitochondrial activity concerning the control by Equation (2).
%   v i a b i l i t y = A b s   t r e a t e d   c e l l s A b s   b l a n k A b s   c o n t r o l A b s   b l a n k × 100

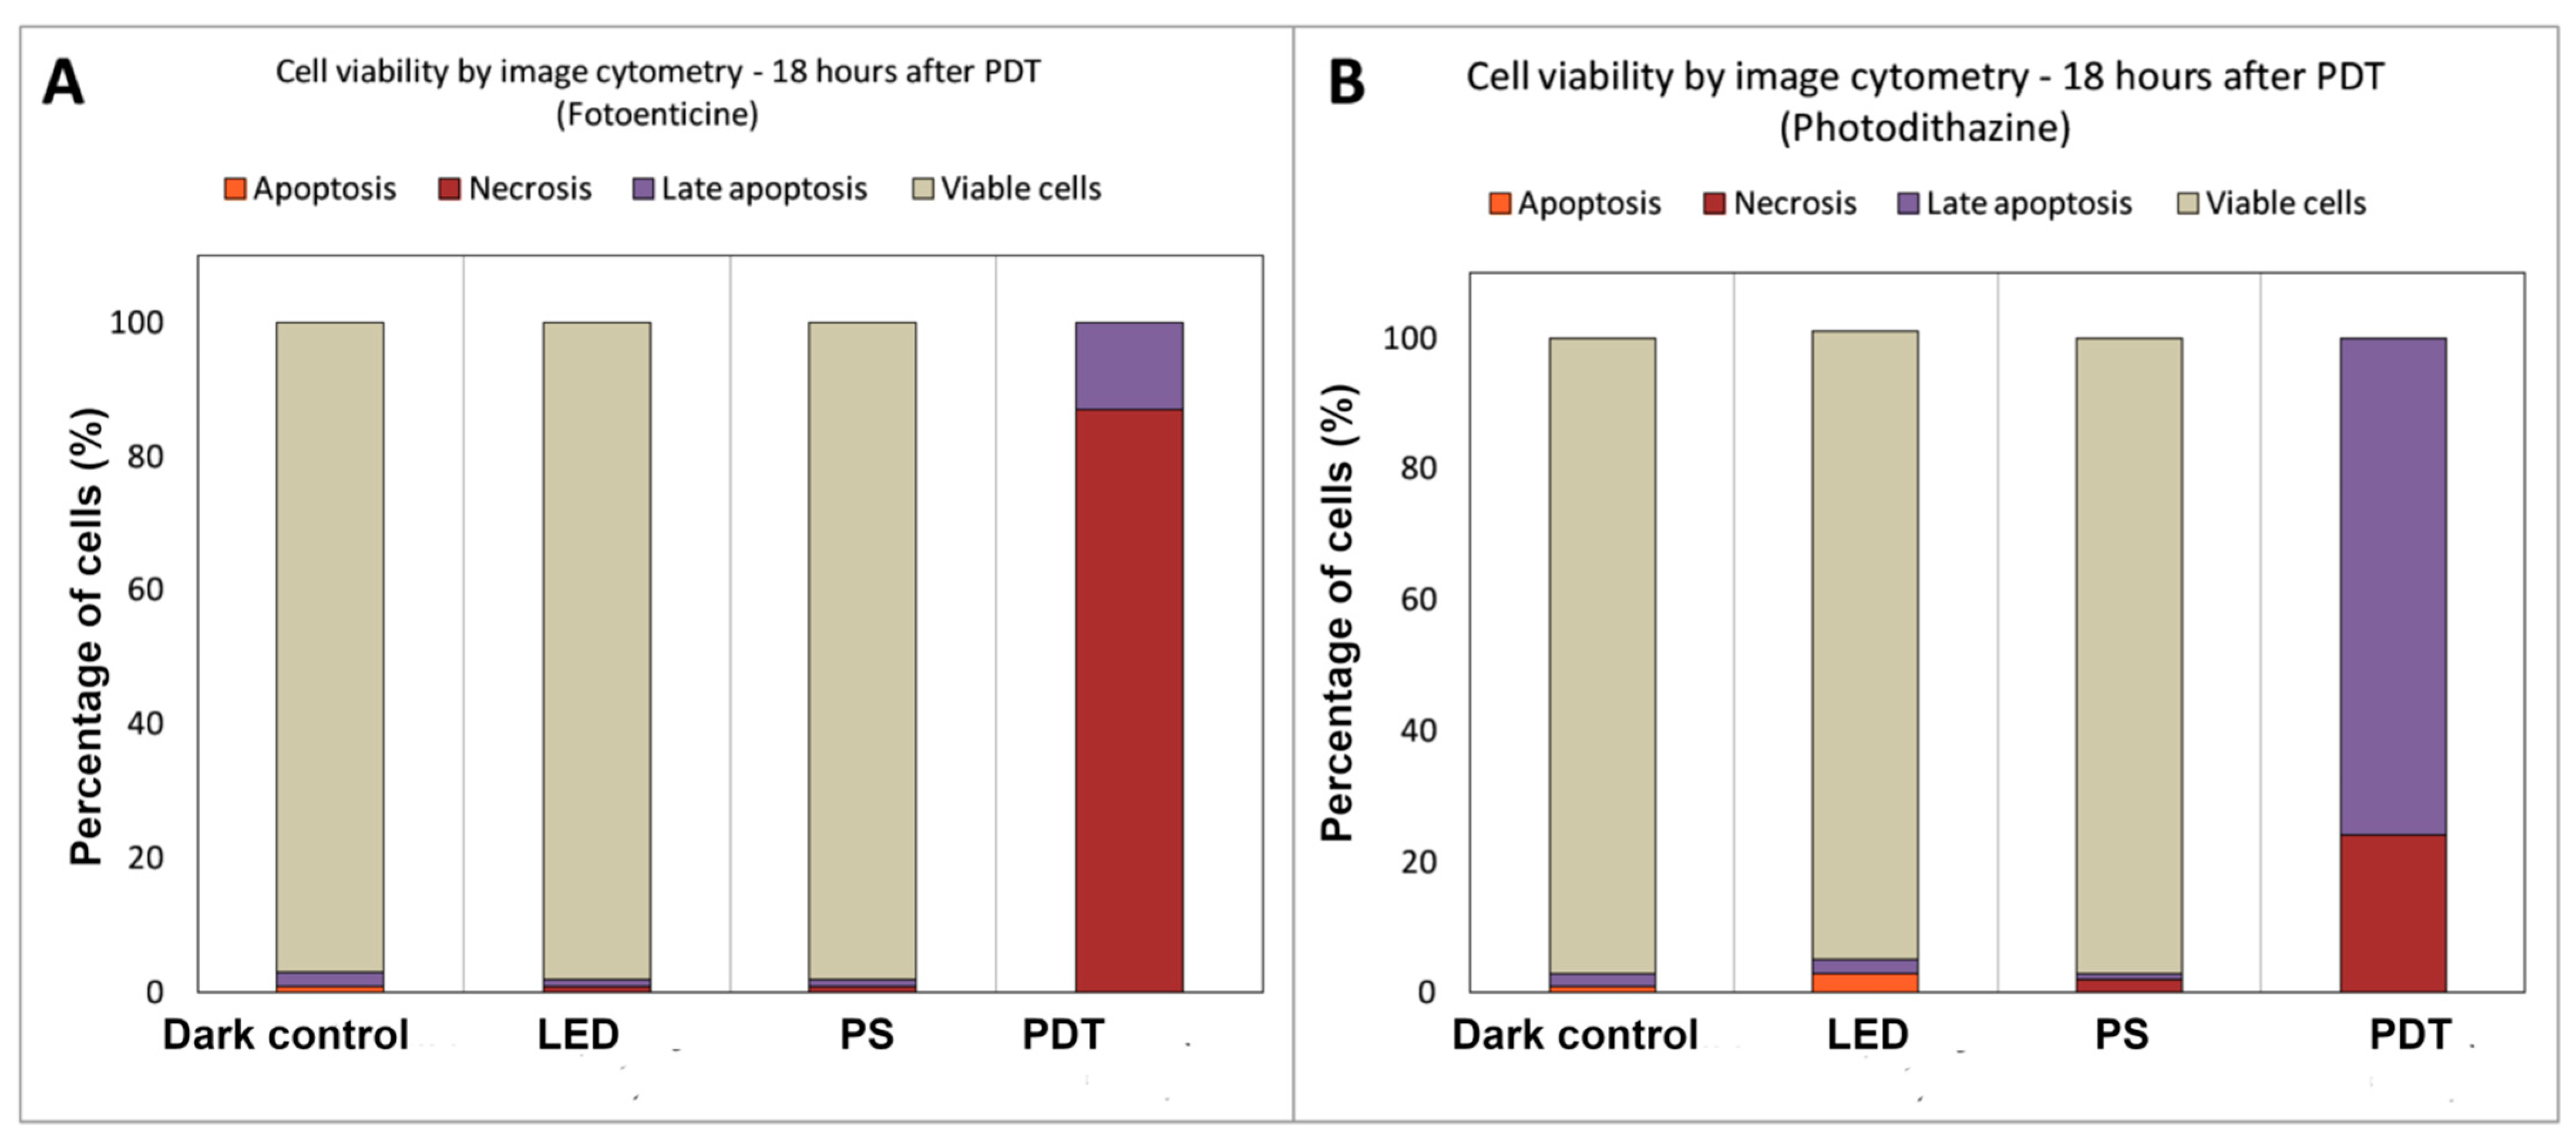
2.9. Analysis of the Type of Cell Death by Imaging Cytometry

Qualitative and quantitative analysis of cell death was performed by imaging cytometry, using the Apoptosis Assay Kit—Annexin V Alexa Fluor® 488 and propidium iodide for labeling cells in apoptosis and necrosis. The preparation was carried out according to the manufacturer’s information (Life Technologies® São Paulo, SP, Brazil. For analysis, an imaging cytometer (TALI®, Life Technologies® São Paulo, SP, Brazil) was used. The type of cell death was analyzed in two distinct groups after PDT. To compare cellular behavior in these two moments, one group was analyzed immediately after therapy and another 18 h after treatment.

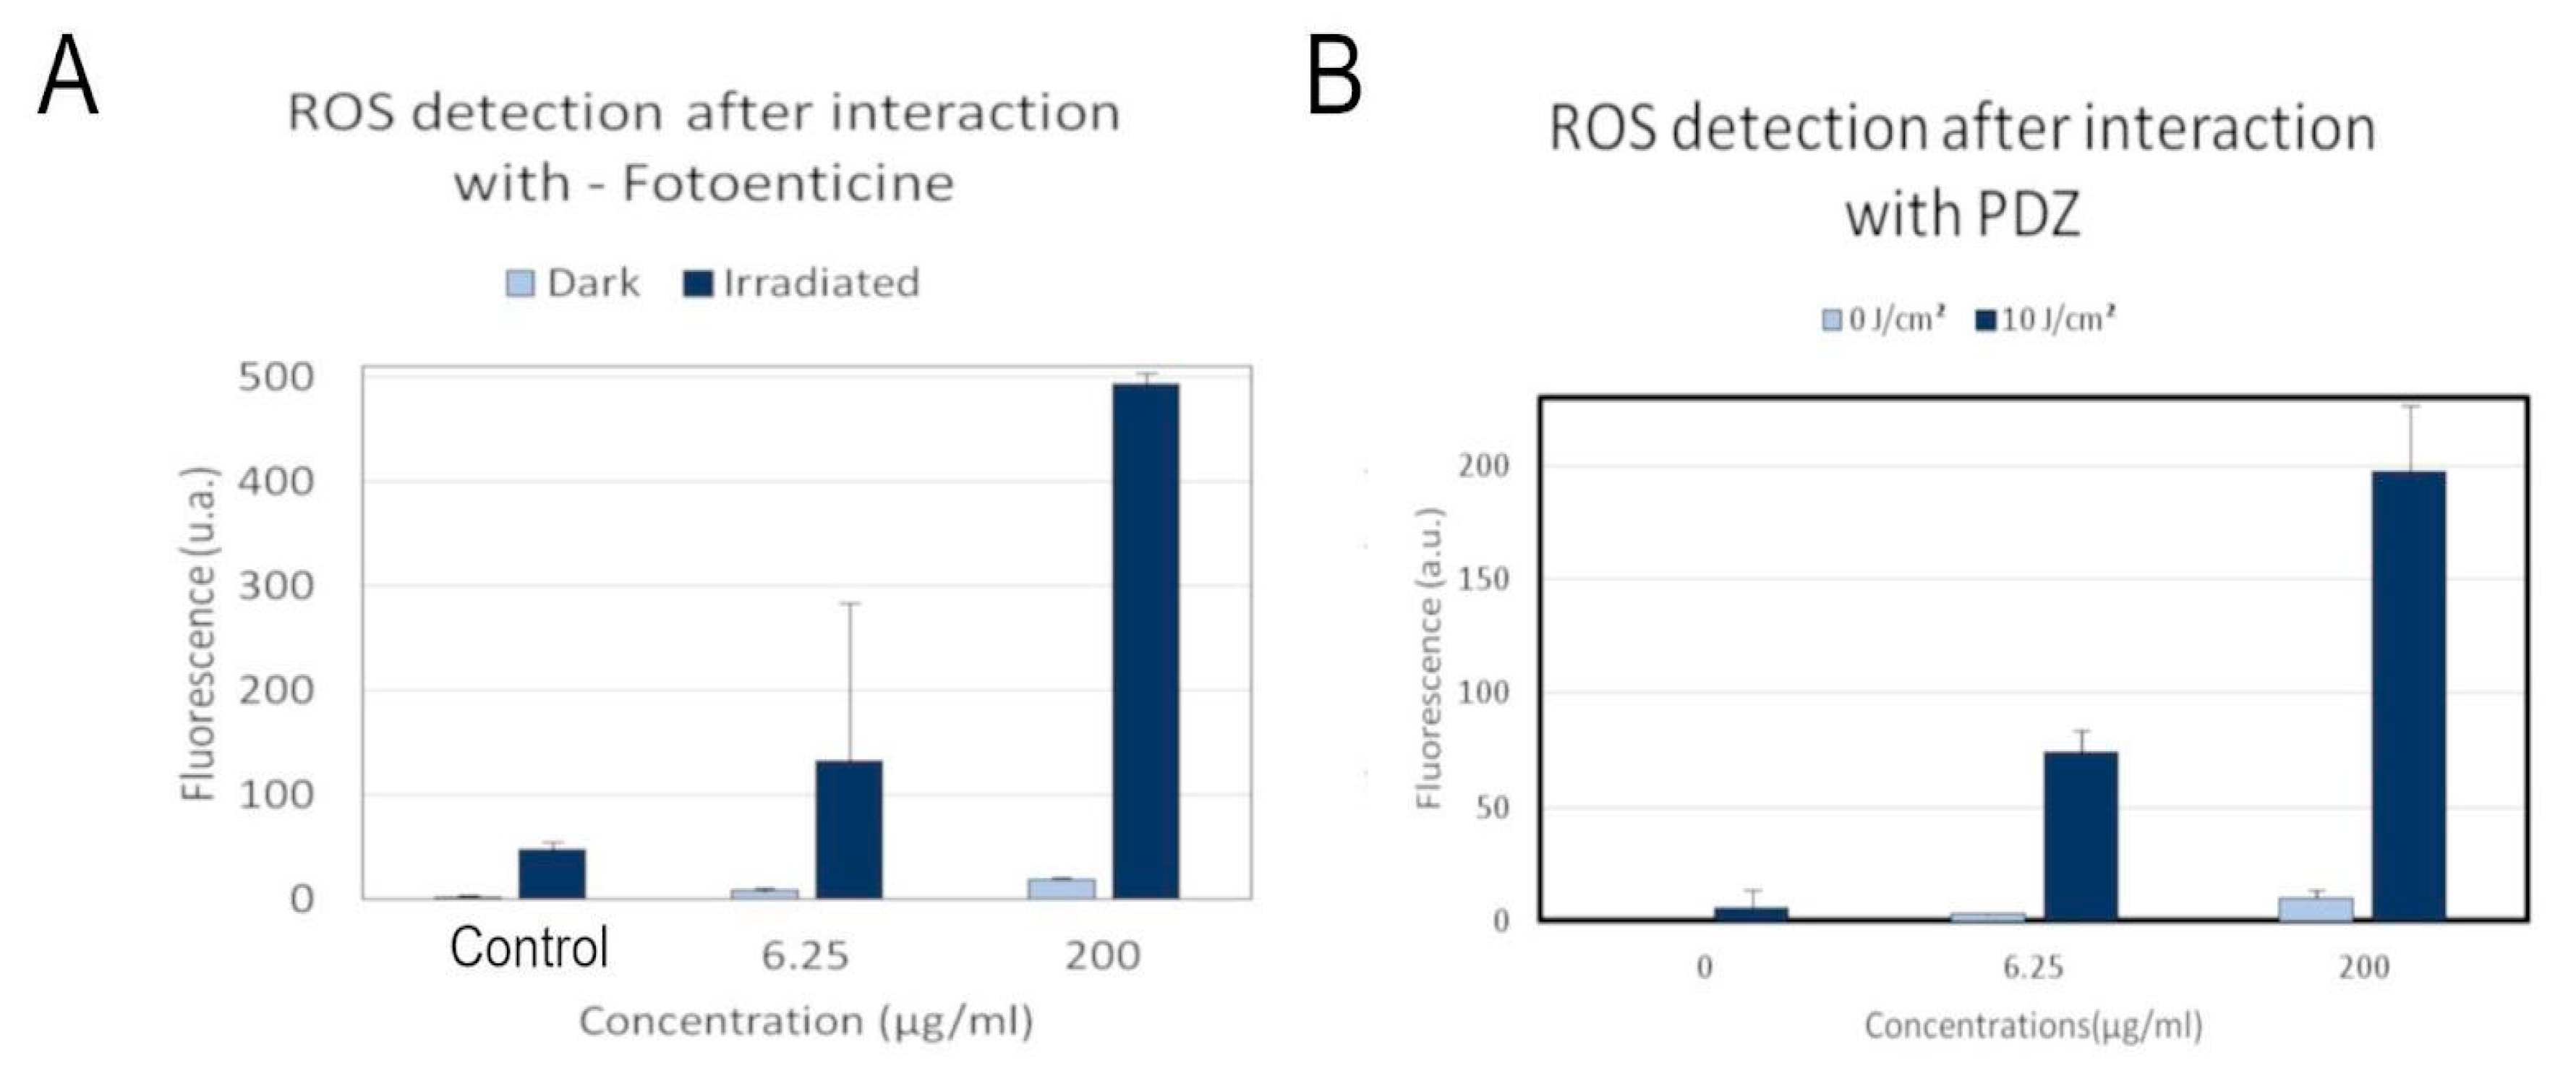
2.10. Analysis of Intracellular Formation of Reactive Oxygen Species

As an indicator of reactive oxygen species (ROS), the reagent 2′, 7′-dichlorodihydrofluorescein diacetate (H2DCF-DA—Thermo Fisher® Life Technologies® São Paulo, SP, Brazil) was used, a nonfluorescent reagent that is converted inside the cell by the action of ROS and other peroxides in its fluorescent form 2′, 7′-dichlorofluorescein (DCF) which fluorescent methods can detect.
After the viability tests, the cells were plated for the control group and the chosen concentration. After 1 h of incubation, the plate was incubated with 100 μL of H2DCF-DA reagent in a 10 μM solution for 30 min. After this interval, cells were washed 1× with PBS, 100 µL of PBS was added, and a plate was irradiated. A group with the marker and another without the marker was performed. The reading was conducted in the Synergy HT Multi-Detection Microplate Reader (Biotek, Winooski, VT, USA) with excitation at 480 nm and emission at 530 nm.

3. Results

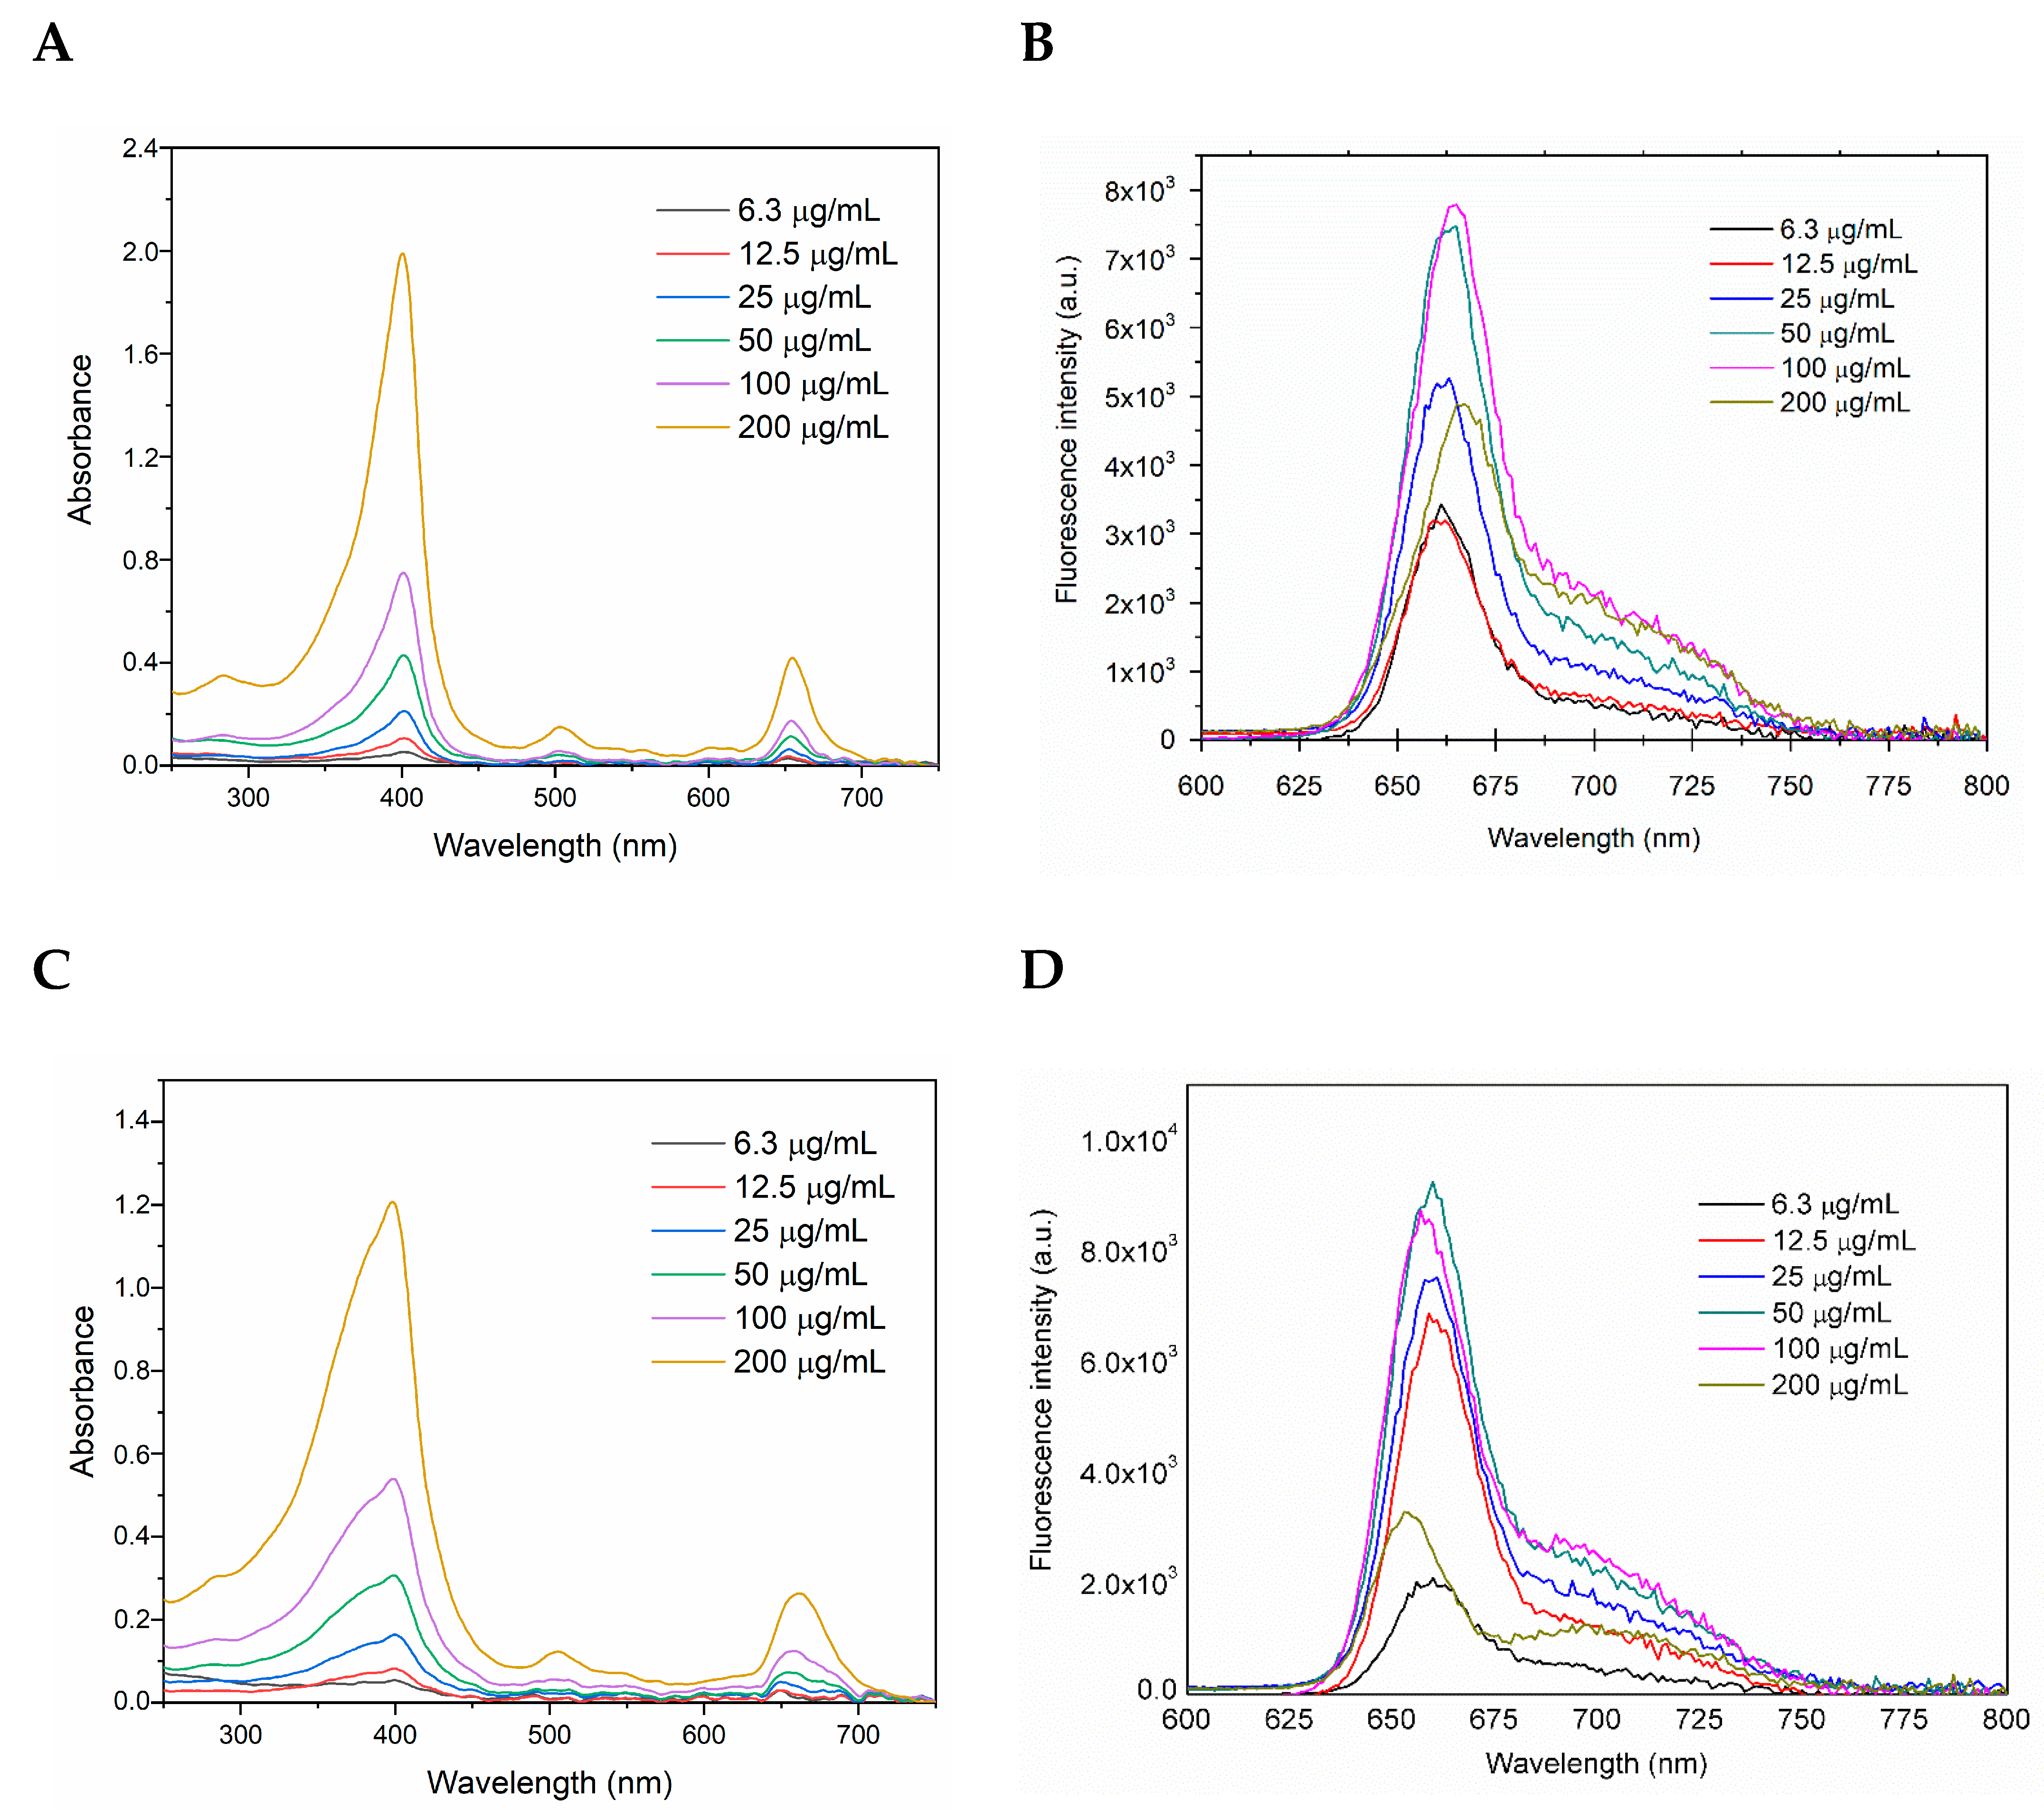
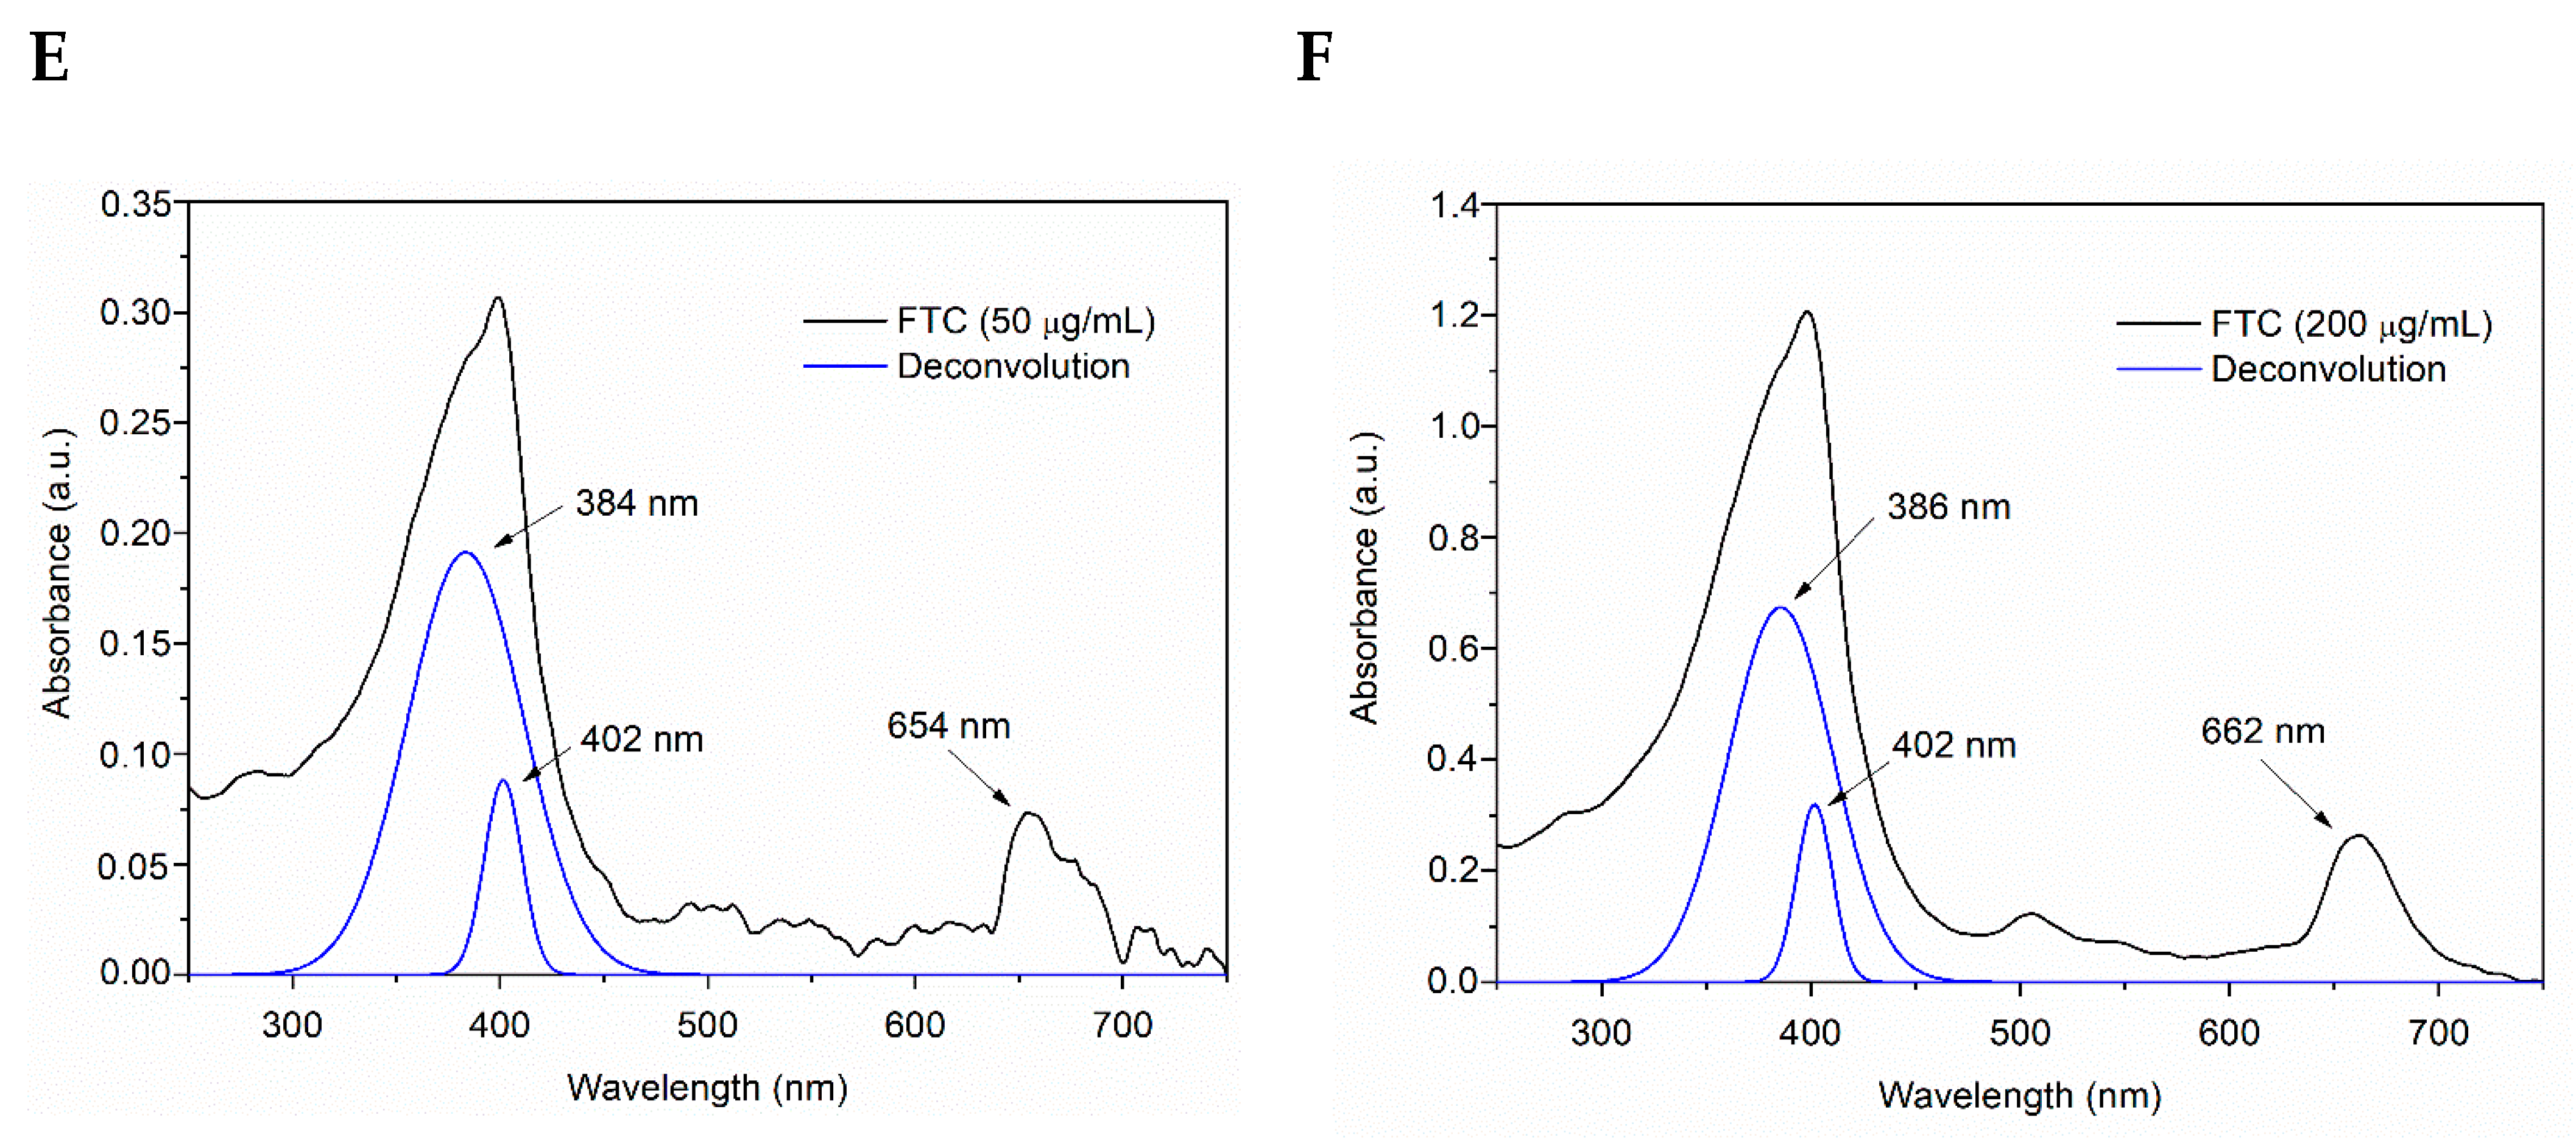
3.1. Fluorescence Study of PDZ and FTC Chlorins in Aqueous Solution

Firstly, the absorption spectra of PDZ and FTC at increasing concentrations were analyzed. As seen in Figure 1A, PDZ had two absorption bands. Despite the increased concentration of molecules in the solution, no changes were observed in the most intense band (Soret’s), which remained centered at 401 nm. However, a slight shift of the less intense (Q) band to longer wavelengths was observed. Changes in the absorption spectra were evaluated together with the changes observed in the fluorescence emission spectra to understand whether the molecules would associate in the ground state, in the excited state, or both. As shown in Figure 1B, there is a shift in the PDZ fluorescence band to longer wavelengths.
The shift of absorption and fluorescence bands was also investigated in the FTC spectra in an aqueous solution. As shown in Figure 1C, two evident absorption bands were identified, the Soret band being the most intense and the Q band the less intense. After the deconvolution of the Soret band (R2(50) = 0.999 and R2(200) = 0.999), the contribution of two absorption bands in the FTC absorption spectra at 50 and 200 µg/mL was identified. One of these bands was subtly shifted to the left with increasing concentration, while the other remained unchanged at 402 nm (Figure 1E,F). In addition, different behavior of the Q band was observed, which shifted to longer wavelengths at higher concentrations. The effect of concentration on the FTC fluorescence emission spectrum was also evaluated. Surprisingly, there was a shift in the fluorescence band to lower wavelengths, indicating increased energy in the emission process (Figure 1D) with increasing concentration. Furthermore, a more pronounced trend in decreasing Stokes shift was observed when considering the changes at the Q absorption band.

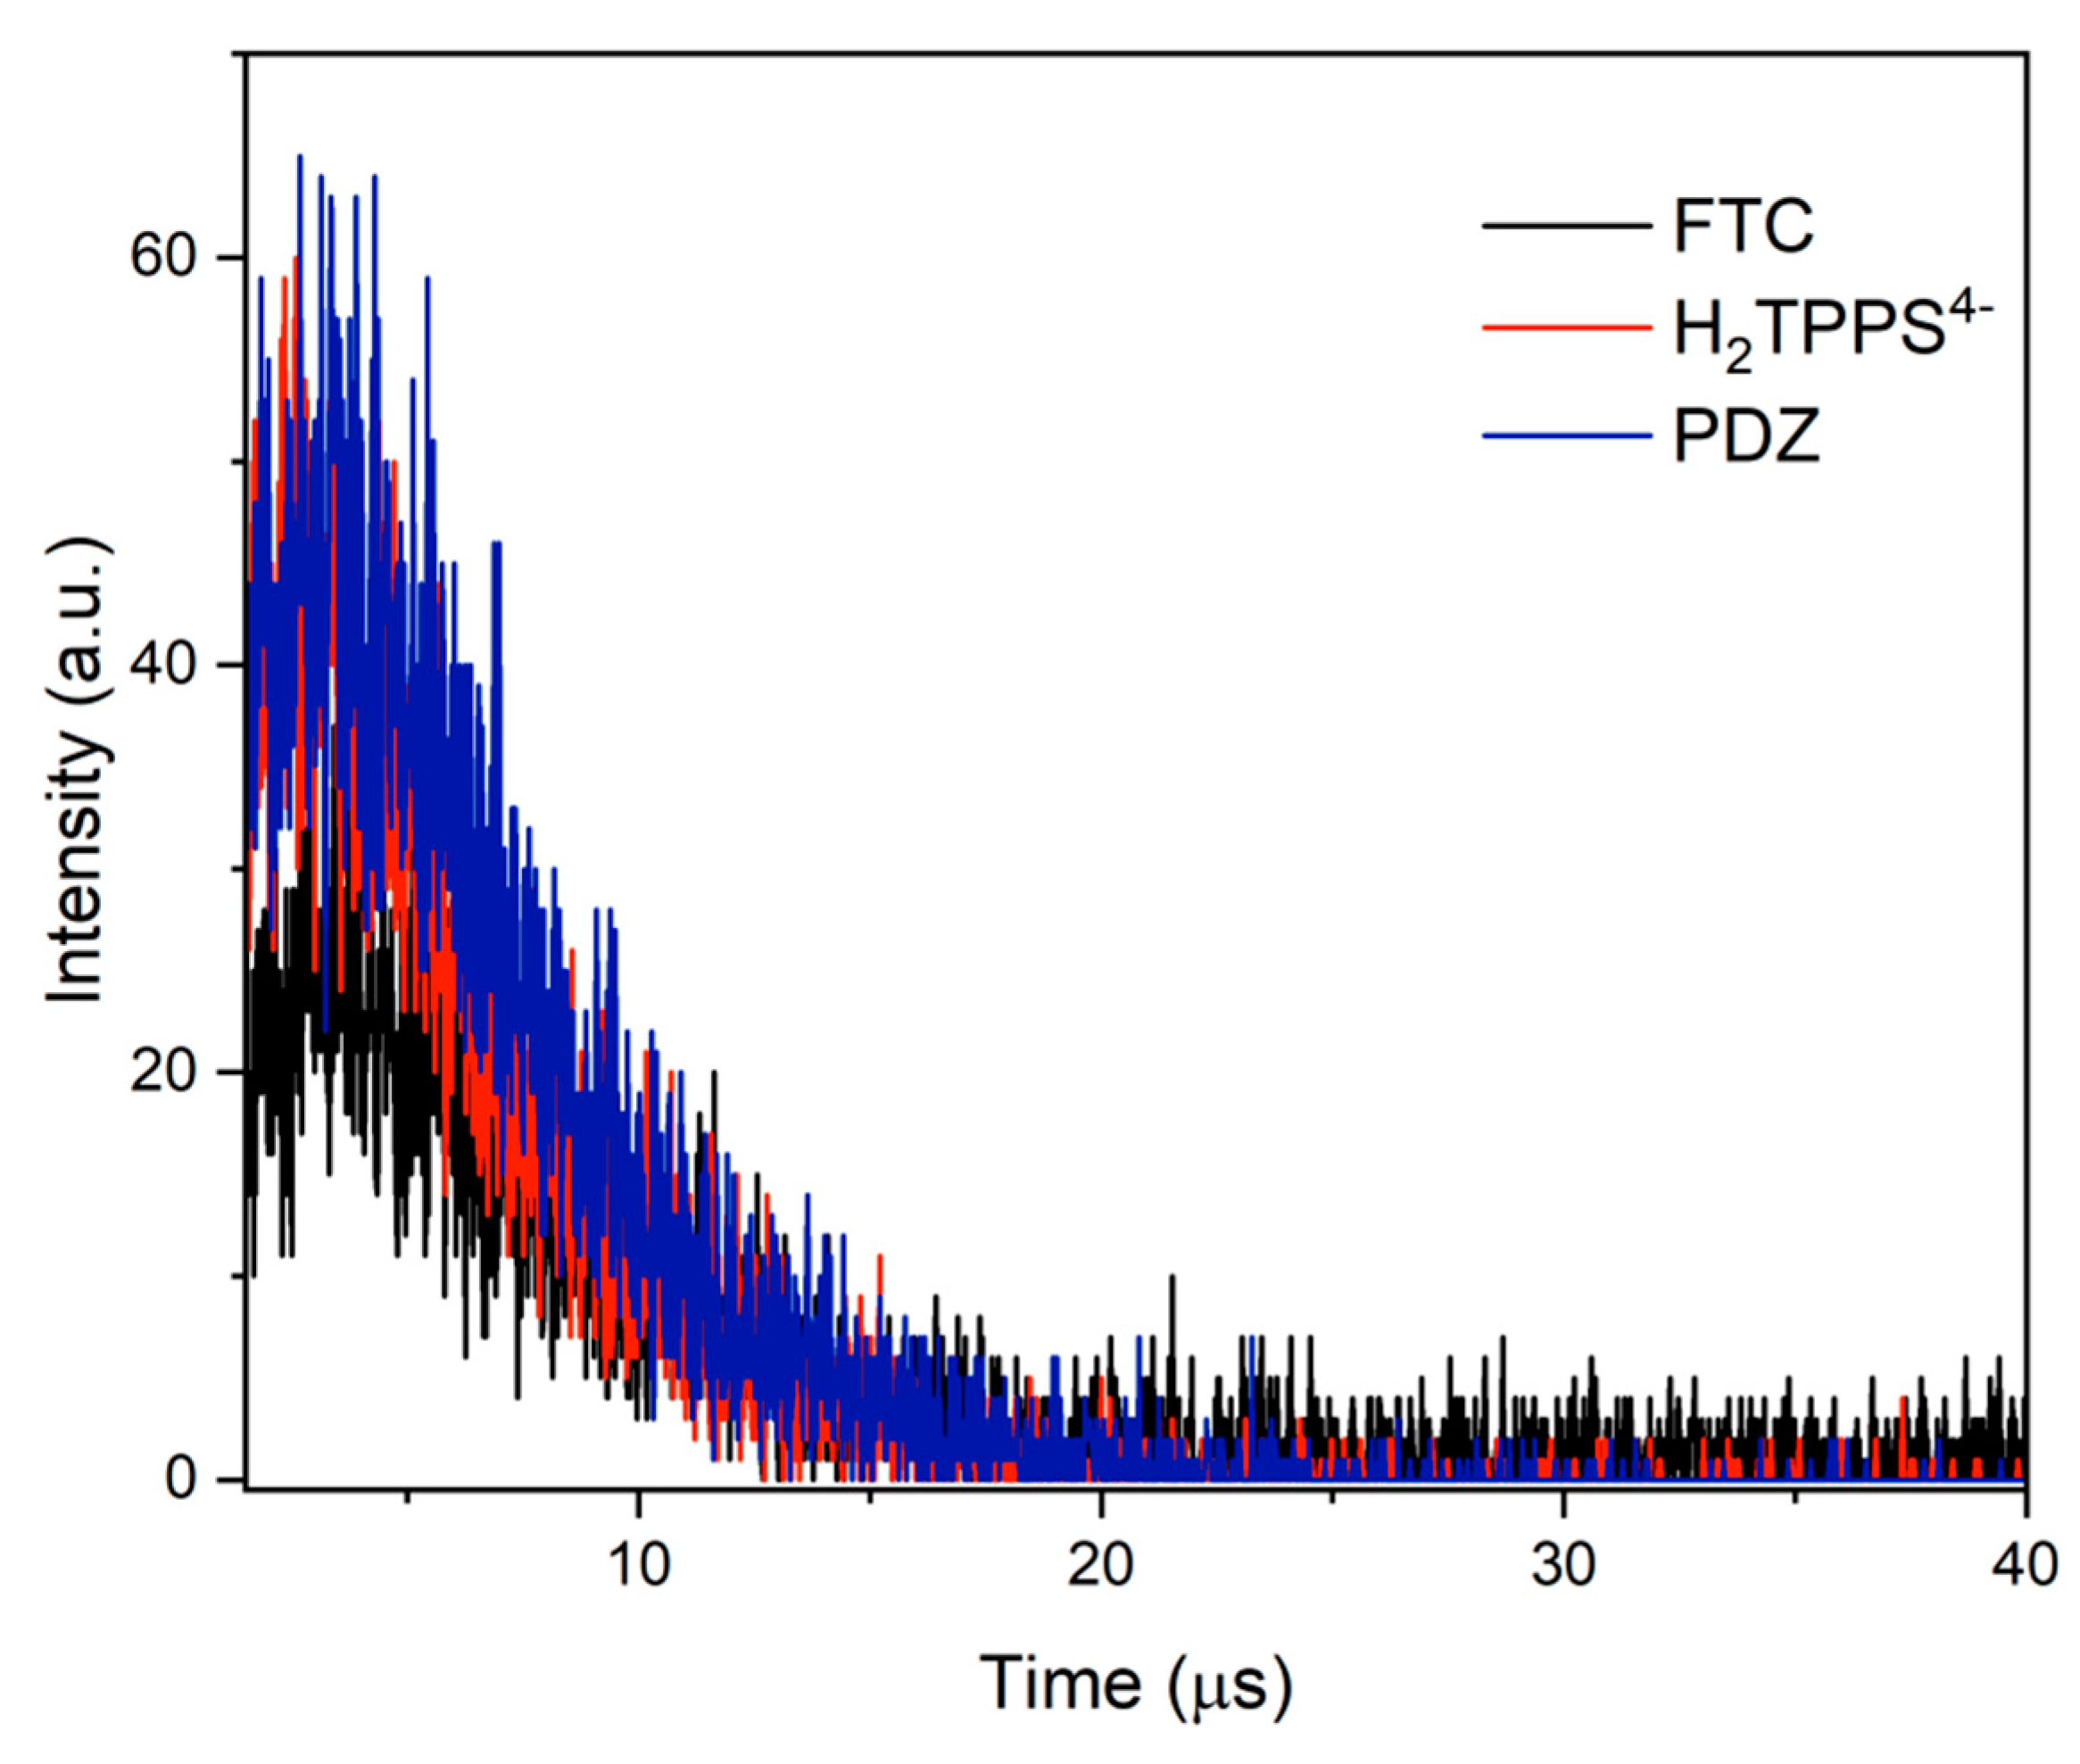
3.2. Quantm Yield of Singlet Oxygen Generation by Chlorin

The analysis of the generation 1O2 by chlorins under irradiation was performed by comparing the generation of 1O2 by H2TPPS4-, which was used as standard. The 1O2 lifetime calculated by fitting the transient decay to first-order decay was close to the already reported value for 1O2 lifetime in water (Table 1). Since standard and chlorins afforded transients with equivalent values of lifetimes, it could be concluded that the generated 1O2 was able to diffuse to the solvent despite the different stabilizers used by the supplier of the chlorins. The maximum emission also confirmed the presence of 1O2 at 1270 nm, which is the characteristic emission band of 1O2 (Figure 2).
The PDZ and FTC quantum yields of 1O2 generation were calculated by comparing the area under the decay curve of the transient detected at 1270 nm corresponding to the 1O2 generated by chlorins and H2TPPS4−. The obtained values are depicted in Table 1. The quantum yield value of the 1O2 generation of PDZ was higher than the quantum yield calculated for FTC. However, the value found for FTC is close to the values previously reported for similar molecules of PS. Kustov reported quantum yield of 1O2 generation of PDZ and Fotoran e6, measured by an indirect method, as 0.57 and 0.56, respectively [11]. Uchoa et al. found a value of 0.52 for a sterically designed chlorin derivative [12].
It is considered that chlorins that do not contain metal ions in the coordination sphere are expected to have a quantum yield of 1O2 generation about 0.5 ± 0.1 [13]. Notably, the value found for PDZ (0.7 ± 0.1) was higher compared with similar chlorins, and therefore pointed out the potential application of this chlorin in PDT. Since the transient was detected in water, wherein the lifetime of 1O2 is very short, the signal/noise ratio was low, and it afforded about 20% of uncertainty to the final value of the area under the transient curve. It is noteworthy that a better resolution could be reached (data not shown) by exciting the samples with a 400 nm LED; however, in this case, the final values were very close to values found by exciting the samples with a 647 nm laser.
Table 1. Values of 1O2 lifetime and quantum yield of 1O2 generation (φ) calculated after irradiation of each sample.
Samples1O2 Lifetime (µs)φ1O2
H2TPPS4−5.01 ± 0.060.62 [12]
PDZ5.70 ± 0.100.70 ± 0.10
FTC5.50 ± 0.100.60 ± 0.10

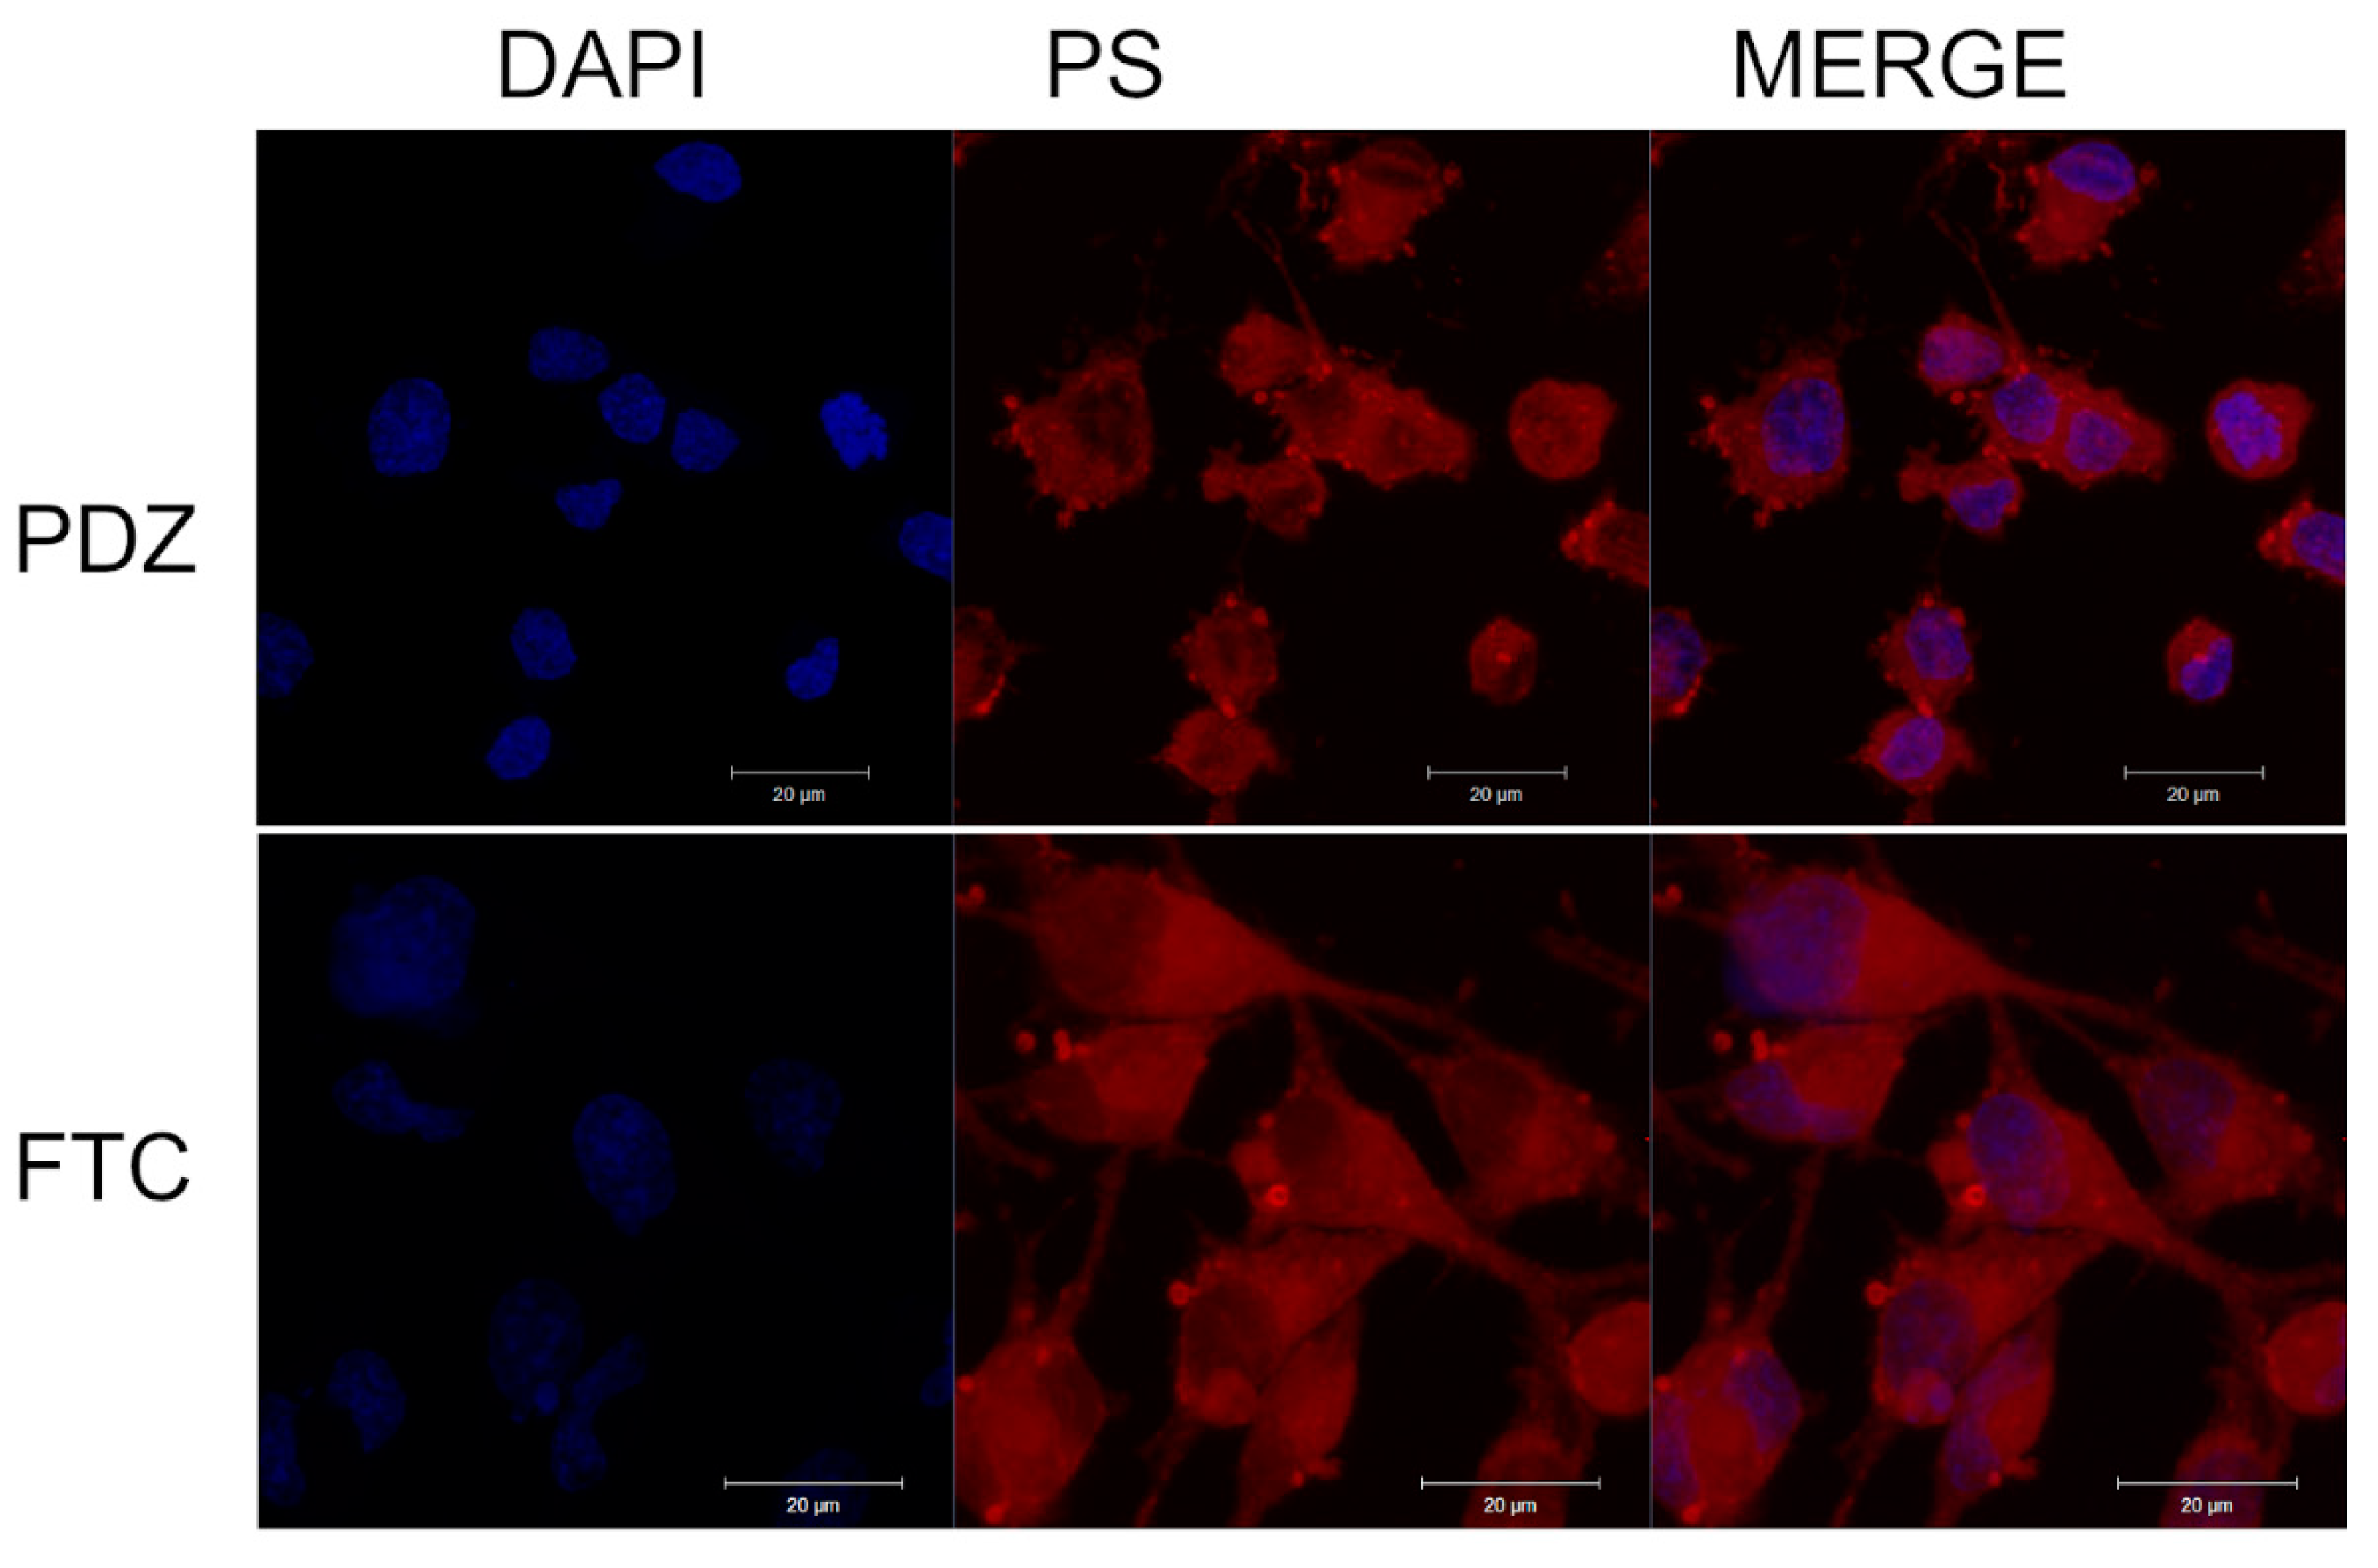
3.3. Chlorin Internalization

Analysis by confocal laser scanning microscopy (CLSM) made it possible to observe the cellular location of FTC to compare it with the results obtained with PDZ, previously by fluorescence microscopy [9]. Confocal microscopy allows for higher resolution and a better understanding of the interaction of PS with cells. A 200 μg/mL concentration was used, noting that, after 1 h of incubation, PS is internalized by cells and located in the cytoplasm but not in the cell nucleus (Figure 3). It was possible to observe that PDZ accumulates throughout the cytoplasmic and perinuclear region. As with PDZ, FTC has also been distributed throughout the cytoplasm. However, it is better distributed throughout the cytoplasmic extension and cell extensions.

3.4. Cell Viability Analysis by the Trypan Blue Exclusion Method

The viability test with trypan blue with FTC showed a concentration-dependent reduction in viability, with the concentration of 200 µg/mL showing a decrease more significant than 97.5%. In contrast, the other concentrations tested did not show toxicity in the dark groups (Figure 4A). There is no statistical difference when comparing irradiated and nonirradiated control groups and groups with PS at different concentrations in the absence of light. However, a statistical difference was observed between groups treated with PDT and dark controls (p < 0.05).
An increase in mitochondrial activity was observed in the group treated with 6.3 μg/mL and was kept in the dark, compared to controls (Figure 4B). However, in all groups treated with PDT, there was a significant reduction in mitochondrial activity (p < 0.01) compared to the control groups. Together with the low viability observed in the trypan test for the same groups, these findings confirm that PDT altered cell viability. However, it was also possible that the irradiation parameters used did not modify the cellular response, since the groups, control and only irradiated, did not present significant differences.
There was a significant increase in mitochondrial activity at the lowest concentration in the absence of light, but this does not indicate an increase in viability but rather more significant cellular activity. FTC presents itself as a promising PS for PDT with a percentage of 15% of mitochondrial activity at the highest concentration after irradiation and 28% at the lowest concentration.

3.5. Analysis of the Type of Cell Death by Imaging Cytometry

The Imaging Cytometry technique with the TALI® equipment analyzes cell markings with annexin V and propidium iodide, quantifying the percentage of apoptosis marking, signs of late apoptosis (or secondary apoptosis), or necrosis and viable cells. Assays were performed 18 h after PDT at a 200 μg/mL concentration, with FTC and PDZ (Figure 5A,B). This concentration was chosen because it presented the best results for both compounds. In addition, dark and irradiated control groups were also tested. The dark control (0 μg/mL; 0 J/cm²) and irradiated control (0 μg/mL; 10 J/cm2) groups confirmed the findings of the trypan viability test, with few dead cells in both control groups and the group treated only with PS.
However, when comparing the profile of the type of death after PDT, there is a big difference between the PS. The group that received PDT with FTC showed a predominance of necrosis marking, 87%, and 13% of cells with marking indicative of late apoptosis, while the group treated with PDT and PDZ presented 76% of cells, with marking indicative of late apoptosis and 24% of cells marked necrosis.

3.6. Quantification of Reactive Oxygen Species (ROS)

The quantification of reactive oxygen species after PDT was performed using the H2DCF-DA marker. This nonfluorescent probe is converted to the fluorescent DCF compound through exposure to reactive oxygen species formed in the environment. In all tests, the irradiated control group showed increased ROS production. However, as observed in previous tests, this increase does not affect cell viability. For both chlorins, concentrations of 200 μg/mL and 6.3 μg/mL were tested (Figure 6). ROS production is dose-dependent for both FTC and PDZ; with increasing concentration, there is also an increase in ROS production. However, PDT with FTC produced twice as much fluorescence as PDZ.

4. Discussion

According to the literature, the increase in concentration or the PS adsorption on membranes can induce PS aggregation or association. Aggregation is most observed at high concentrations and results in significant structures that can even be detected by dynamic light scattering. In turn, an association can occur at low concentration in the range of 1–10 × 10−6 mol/L and involves the interaction between a few PS molecules forming dimers. Both aggregation and association of PS can lead to a decrease in the quantum yield of ROS generation and, consequently, to a reduction in the therapeutic efficiency of PDT [14]. Thus, it is imperative to investigate these processes when searching for new photosensitizing systems. Herein, our results indicate the association of the PDZ molecules.
Two evident PDZ absorption bands were observed in the absorption spectra. Despite the increased concentration of molecules in the solution, no changes were observed in the most intense band (Soret’s), which remained centered at 401 nm. However, a slight shift in the less intense band (Q-band) to longer wavelengths was observed and a change in the fluorescence band to longer wavelengths. This behavior can be attributed to several factors, such as the association of PS molecules in J-type structures, increased charge transfer by changing the geometry of the association, or even by the electronic change from the HOMO molecular orbital to the LUMO molecular orbital [15,16]. Another possible explanation may be based on Kasha’s exciton theory [11], which considers that only transitions to low-energy exciton states are allowed in J-type associations, resulting in a red-shift of the fluorescence band when compared to monomer fluorescence [17].
A subtle shift of the Soret band was observed in FTC spectra at increasing concentrations, while the Q band shifted to the right at higher concentrations. In addition, the FTC fluorescence band turned to the left, with a more pronounced trend towards a decrease in Stokes shift when considering the Q absorption band in the analysis. These shifts in the absorption and fluorescence spectra may suggest the phenomenon of fluorescence reabsorption and emission, which is a radiative energy transfer, typical of fluorophores that present a slight Stokes shift [18]. However, it is also essential to consider the role of non-radiative energy transfer mechanisms, which are firmly dependent on the distance and interaction between molecules in solution [19,20].
Both PDZ and FTC had low cell toxicity and good results with PDT. To better understand the interaction of PS with the cell and the mechanisms of therapy, the patterns of mitochondrial activity, the production of reactive oxygen species, and the type of cell death were analyzed.
Internalization by confocal fluorescence microscopy allowed us to observe that both chlorins do not accumulate in the nucleus, however the PDZ was closer to the perinuclear membrane. Bae and collaborators analyzed the internalization process of Roda Chlorin® in the mouse lung cancer cell line TC-1 after 12 h of incubation. They concluded that there was an accumulation in the cell cytosol and suggested an association of the compound with the plasma membrane [21]. It is important to emphasize that with just 1 h of incubation, the cells internalized FTC and PDZ, concentrating in the cytosol of the cell lineage tested in the present study. In addition, PDT with FTC triggered death in over 95% of cells at the highest concentration tested. PDZ showed greater efficacy, eliminating almost 100% of cells treated with PDT in vitro in a previous study [9]. PDZ at low concentrations is less concentrated in the cytoplasm of 9L/lacZ cells, but more than 99% of cell death occurs [22]. These data demonstrate the advantage of PDZ, as its high efficacy at lower concentrations may reduce costs in future clinical trials.
MTT tests showed reduced mitochondrial activity in all groups treated with PDT, including the lowest concentration (6.3 µg/mL). On the other hand, the groups with nonirradiated PS showed changes in mitochondrial activity, with increased activity at lower concentrations. Treatment with PDZ led to reduced mitochondrial activity in groups treated with PDT and a slight increase in groups treated with PDZ alone [9]. However, for both chlorins, changes in mitochondrial activity in groups kept in the dark do not reflect changes in viability. Although the MTT has been widely used as a feasibility indicator, several studies have shown that this result does not reflect this information correctly. Mosmann reported that the MTT assay cannot detect cell death, depending on the degree of cell activation. Furthermore, once the MTT salt is converted into mitochondria, the interaction with PS may interfere with mitochondrial metabolism without this being a death reflex [23]. Stepanenko highlighted that, depending on the cell type studied and the experimental parameters, there may be discrepancies in the MTT assay, concluding that the correct approach is to associate the MTT assay with another nonmetabolic assay [24].
Therefore, it was associated with the viability analysis with trypan blue, a vital dye, which concentrates inside cells whose membrane is damaged. FTC interfered with cell viability with dose-dependent results. The higher the concentration, the higher the mortality rate observed. Thus, PDZ was more effective at all concentrations tested, as, even at lower concentrations, it had a high mortality rate [9].
In addition to the PS concentration, another factor that can provide a more significant interaction of PDZ and FTC with tumor cells, potentially reducing the activity in healthy cells, is the drug clearance time, which can show faster elimination kinetics in healthy cells, being retained in the tumor cells [25].
One of the biggest challenges in tumor resection surgeries is preserving healthy neuronal tissue, since sequelae can be caused to the patient, such as the inability to speak, difficulty in walking, reduced movement of hands and arms, among other problems that end up limiting the patient’s life. For this reason, a drug that has a greater selective capacity for tumor cells and allows for a more remarkable preservation of healthy tissue becomes a drug of greater interest in the treatment of brain tumors [26]. Therefore, the fast interaction of PDZ and FTC makes them attractive alternatives for future in vivo assays. An essential factor to be highlighted is that, although FTC presents higher ROS production values, PDZ was more effective in PDT, eliminating almost 100% of treated cells. Although micrographs obtained by confocal fluorescence microscopy suggest the greater intensity of FTC, PDZ has a greater capacity to cause damage. This may be related to the process of concentration in the cytosol and a possible accumulation in the organelles, triggering more significant damage, since PDZ also presented a better quantum yield.
The type of cell death depends on the type of PS used, the irradiation parameters, and the location of the PS inside the cell. Imaging cytometry was used to determine the types of cell death, which provides quantitative multiparametric data in a sample. Image cytometry analyzes through random fields, estimating the number of cells labeled with the fluorophores Annexin V (Ann) and Propidium Iodide (PI). Annexin V binds to the lipoprotein Phosphatidylserine, commonly present in the inner membrane of viable cells. This lipoprotein is externalized at the beginning of the apoptotic process, while Propidium Iodide is not internalized by viable cells. However, in cases of loss of selectivity by membrane destruction, IP can internalize itself in the cell and bind to genetic material; this process is linked to death by necrosis. There may also be double-labeling in some cases, indicating late apoptosis [27,28].
Both chlorins could reduce viability after PDT, but the type of death observed was different. While the PDT with FTC group showed mainly necrosis staining, 87% and 13% of the cells showed staining suggesting a late apoptosis stage. The PDT with PDZ group showed 76% of the cells in a late apoptosis stage and 24% of the cells with necrosis marking. Turubanova and collaborators studied the interaction of PDZ with glioma and fibrosarcoma cells at a concentration of 1.2 μM and 4 h of incubation, observing the accumulation of the compound in the endoplasmic reticulum and Golgi complex. PDZ, under the conditions studied, died only due to apoptosis. The authors emphasize that, depending on the concentration of PS, and even its structure, the type of death can vary, and higher concentrations or high luminous fluences can cause immediate damage, leading to death by necrosis [29,30]. Wen and collaborators studied the effects of PDT with PDZ on A20 cells of lymphoma B/murine leukemia after 12 h of incubation. A predominance of death by apoptosis was observed, indicating some factor inherent to PDZ, responsible for triggering this type of death; after that, even in an in vivo assay, upregulation was observed in pro-apoptotic genes such as CASP4, CASP12, CIDEA, GADD45A, and FAZ, in a study using PDT with PDZ in breast cancer [30]. A series of stimuli can induce cell death, and, depending on the intensity of these stimuli, death by apoptosis or necrosis occurs [31,32]. Among the triggers is oxidative stress through ROS generation, involving the production of hydrogen peroxide, superoxide, and singlet oxygen [33,34]. In addition, the increase in ROS levels can damage DNA, RNA, proteins, and lipids, inducing cell death [35].
Cellular damage after PDT depends, among other factors, on the ability to form ROS from the PS–Irradiation combination [36,37]. The control groups of both chlorins showed a low ROS index, visualized by the organism’s natural production, a noncytotoxic rate, as visualized through the viability tests. Cells present defenses against the crude production of ROS and cytotoxic oxidative stress when there is an abrupt increase in these species above the cellular buffering capacity and in a greater quantity than that supported by the enzymes responsible for controlling these molecules. The lifespan and type of ROS formed cause damage to different organelles and changes in the cell death mechanism that will act in cells [38,39]. The PS test demonstrated that, after irradiation, the amount of ROS produced is sufficient to reduce cell viability.
Cells under oxidative stress have important defense mechanisms, including the reducing Tiol buffer, composed of peptides with redox-active sulfhydryl molecules (glutathione and thioredoxin) [40,41,42,43,44]. Glutathione (GSH) has antioxidant properties, participating in cell death by apoptosis. Therefore, intracellular redox changes induced by cytotoxic compounds can be modulated by ROS generation and the extrusion of GSH from the cells, which can cause the cell to die by apoptosis. Furthermore, when there is a decrease in mitochondrial GSH, energy production (ATP) is observed to be affected, which can cause cell death by secondary necrosis, also called late apoptosis [45]. Furthermore, in a cell subjected to an oxidative stress situation, death by apoptosis can undergo a transition to necrotic through two mechanisms: inactivation of caspases and reduction in ATP levels, due to the decrease in mitochondrial activity attributed to the presence of oxidizing substances, releasing cytochrome C and altering membrane permeability [46,47].
Bernal and colleagues studied different PS, including Photogem (PG) and PDZ, in HEp-2 cells, demonstrating that chlorin is a more water-soluble compound. However, this feature did not prevent the accumulation of PDZ and FTC in the present study, an essential element for PS penetration through the cell’s phospholipid membrane [48].
One of the critical characteristics of a PS is the ability to generate 1O2. Therefore, the comparison between the two chlorins under study regarding their quantum yield of 1O2 generation is essential for a better understanding of the cell death mechanisms triggered by them. For this, the quantum yield of 1O2 generation was calculated based on H2TPPS4− under laser irradiation at 647 nm. The values of 0.7 ± 0.1 for PDZ and 0.6 ± 0.1 for FTC pointed out the higher efficiency of the 1O2 generation of PDZ. Despite the lower quantum yield of 1O2 generation, FTC showed higher ROS generation in the in vitro assay, which indicated that this chlorin might also act by generating radical species. It can be attributed to the more significant generation of reactive oxygen species, such as superoxide, nitric oxide, or oxygenated free radicals, lasting longer lives [37]. This result corroborates the higher incidence of necrosis compared with the cell death by apoptosis observed in vitro with FTC-PDT. Accordingly, the higher generation of 1O2 and lower generation of intracellular ROS by PDZ was in line with the increased incidence of cell death by late apoptosis. Nevertheless, as it is a highly energetic and unstable molecule, the concentration of 1O2 is expected to decrease with time, leading to damage only in regions close to its formation site [49].
The interaction effects with reactive species formed after PDT were also demonstrated through Annexin and Propidium Iodide analysis. While PDT with FTC predominantly triggered death by necrosis, indicating immediate cell damage, PDT with PDZ mainly showed labeling indicative of late apoptosis.
Despite the lower quantum yield of 1O2 by FTC, the measurement of intracellular ROS suggested higher ROS concentration. This can be attributed to the more significant generation of reactive oxygen species, such as superoxide, nitric oxide, or oxygenated free radicals, which have a longer shelf life [37]. However, the more excellent production of ROS did not reflect a more significant number of dead cells, with PDZ showing superior results [9].
The ability of PDZ and FTC to interact with the 9L/lacZ cell lineage and trigger cell death and changes in cell metabolism is essential for positive in vitro results and for establishing protocols for future tests. In addition to the facts highlighted in this study, the ability of both chlorins to interact with mitochondria, demonstrated by co-labeling with trimethylated Rhodamine, may explain changes in metabolism, even in dark groups [22,50]. Furthermore, in previous studies, morphological changes in this cell line were demonstrated after PDT, with the cells losing their characteristic spindle shape, with no apparent rupture of the membrane. However, co-labeling with tubulin showed no interaction of PDZ and FTC with the cytoskeleton, indicating that these morphological changes occur through another mechanism and the interaction with the cytoskeleton [22,50].

5. Conclusions

Both FTC and PDZ demonstrated stability in an aqueous solution and efficient PDT activity in vitro. PDZ showed a higher quantum yield of 1O2 generation, but FTC showed an increased generation of intracellular ROS. Both chlorins were internalized by the cell after 1 h, and FTC was shown to trigger dose-dependent cell death and alterations in mitochondrial activity. In most cells, PDT with FTC triggered cell death mainly by necrosis, whereas PDZ triggered cell death mainly by apoptosis.

Author Contributions

Conceptualization: J.F.-S., J.G.P. and L.C.F.; methodology: J.F.-S., J.G.P., D.B.T. and L.C.F.; formal analysis: L.C.F. and J.A.M.; resources: J.F.-S.; data curation: J.F.-S., J.G.P., D.B.T., C.P.-S. and L.C.F.; writing—original draft preparation: L.C.F. and J.G.P.; writing—review and editing: J.F.-S., J.G.P., D.B.T., C.P.-S., J.A.M. and R.M.S.d.A.; supervision: J.F.-S.; project administration: J.F.-S., J.G.P. and L.C.F.; funding acquisition, J.F.-S. All authors have read and agreed to the published version of the manuscript.

Funding

This research was funded by São Paulo State Research Support Foundation (FAPESP), grant number: 2016/20022–7 and 2016/12211–4.

Institutional Review Board Statement

Not applicable.

Informed Consent Statement

Not applicable.

Data Availability Statement

Not applicable.

Acknowledgments

The authors thank FAPESP/CEPOF-2013/07276–1 and FINEP agreement 01.13.0275.00 and Coordination for the Improvement of Higher Education Personnel—Brazil (CAPES) Financing Code 001. The authors would like to thank FAPESP (2018/22890-1) for the PhD fellowship of J.A.M. The authors also thank the NAP-Phototech, University of São Paulo, São Paulo, Brazil and the Helena Couto Junqueira for the singlet oxygen measurements.

Conflicts of Interest

The authors declare no conflict of interest.

References

  1. Gerges, C.; Elder, T.; Penuela, M.; Rossetti, N.; Maynard, M.; Jeong, S.; Wright, C.H.; Wright, J.; Zhou, X.; Burant, C.; et al. Comparative epidemiology of gliosarcoma and glioblastoma and the impact of Race on overall survival: A systematic literature review. Clin. Neurol. Neurosurg. 2020, 195, 106054. [Google Scholar] [CrossRef] [PubMed]
  2. Alam Hashmi, F.; Salim, A.; Shamim, M.S.; Bari, M.E. Biological characteristics and outcomes of Gliosarcoma. J. Pak. Med. Assoc. 2018, 68, 1273–1275. [Google Scholar]
  3. Kwiatkowski, S.; Knap, B.; Przystupski, D.; Saczko, J.; Kędzierska, E.; Knap-Czop, K.; Kotlińska, J.; Michel, O.; Kotowski, K.; Kulbacka, J. Photodynamic therapy—mechanisms, photosensitizers and combinations. Biomed. Pharmacother. 2018, 106, 1098–1107. [Google Scholar] [CrossRef] [PubMed]
  4. Tirapelli, L.F.; Morgueti, M.; da Cunha Tirapelli, D.P.; Bagnato, V.S.; Ferreira, J.; Neto, F.S.L.; Peria, F.M.; Oliveira, H.F.; Junior, C.G.C. Apoptosis in Glioma Cells Treated with PDT. Photomed. Laser Surg. 2011, 29, 305–309. [Google Scholar] [CrossRef]
  5. Vanderesse, D.B.; Muriel, B. Innovations of Photodynamic Therapy for Brain Tumors: Potential of Multifunctional Nanoparticles. J. Carcinog. Mutagen. 2014, s8, 001. [Google Scholar] [CrossRef] [Green Version]
  6. Akimoto, J. Photodynamic Therapy for Malignant Brain Tumors. Neurol. medico-chirurgica 2016, 56, 151–157. [Google Scholar] [CrossRef] [Green Version]
  7. Kostron, H. Photodynamic Diagnosis and Therapy and the Brain. Photodyn. Ther. 2010, 635, 261–280. [Google Scholar] [CrossRef]
  8. Rynda, A.Y.; Rostovtsev, D.M.; Olyushin, V.E.; Zabrodskaya, Y.M. Therapeutic pathomorphosis in malignant glioma tissues after photodynamic therapy with chlorin e6 (reports of two clinical cases). Biomed. Photonics 2018, 7, 4–20. [Google Scholar] [CrossRef]
  9. Fontana, L.C.; Pinto, J.G.; Pereira, A.H.C.; Soares, C.P.; Raniero, L.J.; Ferreira-Strixino, J. Photodithazine photodynamic effect on viability of 9L/lacZ gliosarcoma cell line. Lasers Med. Sci. 2017, 32, 1245–1252. [Google Scholar] [CrossRef]
  10. Wilkinson, F.; Helman, W.P.; Ross, A.B. Quantum Yields for the Photosensitized Formation of the Lowest Electronically Excited Singlet State of Molecular Oxygen in Solution. J. Phys. Chem. Ref. Data 1993, 22, 113–262. [Google Scholar] [CrossRef] [Green Version]
  11. Kustov, A.V.; Smirnova, N.L.; Privalov, O.A.; Moryganova, T.M.; Strelnikov, A.I.; Morshnev, P.K.; Koifman, O.I.; Lyubimtsev, A.V.; Kustova, T.V.; Berezin, D.B. Transurethral Resection of Non-Muscle Invasive Bladder Tumors Combined with Fluorescence Diagnosis and Photodynamic Therapy with Chlorin e6-Type Photosensitizers. J. Clin. Med. 2021, 11, 233. [Google Scholar] [CrossRef] [PubMed]
  12. Uchoa, A.F.; de Oliveira, K.T.; Baptista, M.S.; Bortoluzzi, A.J.; Iamamoto, Y.; Serra, O.A. Chlorin Photosensitizers Sterically Designed To Prevent Self-Aggregation. J. Org. Chem. 2011, 76, 8824–8832. [Google Scholar] [CrossRef] [PubMed]
  13. Kustov, A.V.; Belykh, D.; Smirnova, N.L.; Venediktov, E.A.; Kudayarova, T.K.; Kruchin, S.; Khudyaeva, I.S.; Berezin, D. Synthesis and investigation of water-soluble chlorophyll pigments for antimicrobial photodynamic therapy. Dye. Pigment. 2018, 149, 553–559. [Google Scholar] [CrossRef]
  14. Tada, D.B.; Baptista, M.S. Photosensitizing nanoparticles and the modulation of ROS generation. Front. Chem. 2015, 3, 33. [Google Scholar] [CrossRef] [PubMed] [Green Version]
  15. Gierschner, J.; Lüer, L.; Milián-Medina, B.; Oelkrug, D.; Egelhaaf, H.-J. Highly Emissive H-Aggregates or Aggregation-Induced Emission Quenching? The Photophysics of All-Trans para-Distyrylbenzene. J. Phys. Chem. Lett. 2013, 4, 2686–2697. [Google Scholar] [CrossRef]
  16. Gierschner, J.; Park, S.Y. Luminescent distyrylbenzenes: Tailoring molecular structure and crystalline morphology. J. Mater. Chem. C 2013, 1, 5818–5832. [Google Scholar] [CrossRef]
  17. Kasha, M. Energy Transfer Mechanisms and the Molecular Exciton Model for Molecular Aggregates. Radiat. Res. 2012, 178, AV27–AV34. [Google Scholar] [CrossRef]
  18. Sauer, M.; Hofkens, J.; Enderlein, J. Basic Principles of Fluorescence Spectroscopy. In Handbook of Fluorescence Spectroscopy and Imaging: From Single Molecules to Ensembles; John Wiley & Sons: Weinheim, Germany, 2011; pp. 1–30. [Google Scholar] [CrossRef]
  19. Rodríguez, H.B.; Román, E.S. Effect of Concentration on the Photophysics of Dyes in Light-Scattering Materials. Photochem. Photobiol. 2013, 89, 1273–1282. [Google Scholar] [CrossRef]
  20. Sisamakis, E.; Valeri, A.; Kalinin, S.; Rothwell, P.J.; Seidel, C.A.M. Accurate Single-Molecule FRET Studies Using Multiparameter Fluorescence Detection. Methods Enzymol. 2010, 475, 455–514. [Google Scholar]
  21. Kwak, S.-Y.; Lim, D.-S.; Bae, S.-M.; Kim, Y.-W.; Lee, J.-M.; Namkoong, S.-E.; Han, S.-J.; Kim, J.-K.; Lee, C.-H.; Chun, H.J.; et al. Photodynamic effects of Radachlorin® on cervical cancer model. J. Porphyrins Phthalocyanines 2005, 9, 835–840. [Google Scholar] [CrossRef]
  22. Santos Vitorio, G.D.; de Almeida, R.M.S.; Pinto, J.G.; Fontana, L.C.; Ferreira-Strixino, J. Analysis of the effects of Photodynamic therapy with Photodithazine on the treatment of 9l/lacZ cells, in vitro study. Photodiagnosis Photodyn. Ther. 2021, 34, 102233. [Google Scholar] [CrossRef]
  23. Mitra, I.; Mukherjee, S.; Reddy, B.V.P.; Dasgupta, S.; Bose, K.J.C.; Mukherjee, S.; Linert, W.; Moi, S.C. Benzimidazole based Pt(ii) complexes with better normal cell viability than cisplatin: Synthesis, substitution behavior, cytotoxicity, DNA binding and DFT study. RSC Adv. 2016, 6, 76600–76613. [Google Scholar] [CrossRef] [Green Version]
  24. Stepanenko, A.; Dmitrenko, V. Pitfalls of the MTT assay: Direct and off-target effects of inhibitors can result in over/underestimation of cell viability. Gene 2015, 574, 193–203. [Google Scholar] [CrossRef] [PubMed]
  25. Agostinis, P.; Berg, K.; Cengel, K.A.; Foster, T.H.; Girotti, A.W.; Gollnick, S.O.; Hahn, S.M.; Hamblin, M.R.; Juzeniene, A.; Kessel, D.; et al. Photodynamic therapy of cancer: An update. CA Cancer J. Clin. 2011, 61, 250–281. [Google Scholar] [CrossRef] [PubMed]
  26. Barone, D.G.; Lawrie, T.; Hart, M.G. Image guided surgery for the resection of brain tumours. Cochrane Database Syst. Rev. 2014, 2014, CD009685. [Google Scholar] [CrossRef]
  27. Brauchle, E.; Thude, S.; Brucker, S.Y.; Schenke-Layland, K. Cell death stages in single apoptotic and necrotic cells monitored by Raman microspectroscopy. Sci. Rep. 2014, 4, 4698. [Google Scholar] [CrossRef] [Green Version]
  28. Remple, K.; Stone, L. Assessment of GFP Expression and Viability Using the Tali Image-Based Cytometer. J. Vis. Exp. 2011, 57, e3659. [Google Scholar] [CrossRef]
  29. Turubanova, V.D.; Balalaeva, I.V.; Mishchenko, T.A.; Catanzaro, E.; Alzeibak, R.; Peskova, N.N.; Efimova, I.; Bachert, C.; Mitroshina, E.V.; Krysko, O.; et al. Immunogenic cell death induced by a new photodynamic therapy based on photosens and photodithazine. J. Immunother. Cancer 2019, 7, 350. [Google Scholar] [CrossRef]
  30. Wen, L.Y.; Bae, S.-M.; Chun, H.J.; Park, K.-S.; Ahn, W.S. Therapeutic effects of systemic photodynamic therapy in a leukemia animal model using A20 cells. Lasers Med. Sci. 2011, 27, 445–452. [Google Scholar] [CrossRef]
  31. Hensley, K.; Robinson, K.A.; Gabbita, S.P.; Salsman, S.; Floyd, R.A. REACTIVE OXYGEN SPECIES, CELL SIGNALING, AND CELL INJURY. Free Radic. Biol. Med. 2000, 28, 1456–1462. [Google Scholar] [CrossRef]
  32. Matés, J.M.; Jiménez, F.M.S. Role of reactive oxygen species in apoptosis: Implications for cancer therapy. Int. J. Biochem. Cell Biol. 1999, 32, 157–170. [Google Scholar] [CrossRef]
  33. Ikeda, K.; Kajiwara, K.; Tanabe, E.; Tokumaru, S.; Kishida, E.; Masuzawa, Y.; Kojo, S. Involvement of hydrogen peroxide and hydroxyl radical in chemically induced apoptosis of HL-60 cells. Biochem. Pharmacol. 1999, 57, 1361–1365. [Google Scholar] [CrossRef]
  34. Matsura, T.; Kai, M.; Fujii, Y.; Ito, H.; Yamada, K. Hydrogen peroxide-induced apoptosis in HL-60 cells requires caspase-3 activation. Free Radic. Res. 1999, 30, 73–83. [Google Scholar] [CrossRef] [PubMed]
  35. Fernandes, R.S.; Cotter, T. Apoptosis or necrosis: Intracellular levels of glutathione influence mode of cell death. Biochem. Pharmacol. 1994, 48, 675–681. [Google Scholar] [CrossRef]
  36. Benito-Miguel, M.; Blanco, M.D.; Gómez, C. Assessment of sequential combination of 5-fluorouracil-loaded-chitosan-nanoparticles and ALA-photodynamic therapy on HeLa cell line. Photodiagnosis Photodyn. Ther. 2015, 12, 466–475. [Google Scholar] [CrossRef]
  37. Benov, L. Photodynamic Therapy: Current Status and Future Directions. Med. Princ. Pr. 2015, 24, 14–28. [Google Scholar] [CrossRef]
  38. Abrahamse, H.; Hamblin, M.R. New photosensitizers for photodynamic therapy. Biochem. J. 2016, 473, 347–364. [Google Scholar] [CrossRef] [Green Version]
  39. Grecco, C.; Pratavieira, S.; Bagnato, V.; Kurachi, C. Comparison of two photosensitizers in photodynamic therapy using light pulses in femtosecond regime: An animal study. Int. Soc. Opt. Photonics 2016, 9694, 969417. [Google Scholar] [CrossRef]
  40. Curtin, J.; Donovan, M.; Cotter, T.G. Regulation and measurement of oxidative stress in apoptosis. J. Immunol. Methods 2002, 265, 49–72. [Google Scholar] [CrossRef] [Green Version]
  41. Davis, W.; Ronai, Z.; Tew, K.D. Cellular thiols and reactive oxygen species in drug-induced apoptosis. J. Pharmacol. Exp. Ther. 2001, 296, 1–6. [Google Scholar]
  42. Gabbita, S.; Robinson, K.A.; Stewart, C.A.; Floyd, R.A.; Hensley, K. Redox Regulatory Mechanisms of Cellular Signal Transduction. Arch. Biochem. Biophys. 2000, 376, 1–13. [Google Scholar] [CrossRef] [PubMed]
  43. Matés, J.M. Effects of antioxidant enzymes in the molecular control of reactive oxygen species toxicology. Toxicology 2000, 153, 83–104. [Google Scholar] [CrossRef]
  44. Yu, B.P. Cellular Defenses against Damage from Reactive Oxygen Species. Physiol. Rev. 1994, 74, 139–162. [Google Scholar] [CrossRef] [PubMed]
  45. Slater, A.F.G.; Stefan, C.; Nobel, I.; Dobbelsteen, D.J.V.D.; Orrenius, S. Signalling mechanisms and oxidative stress in apoptosis. Toxicol. Lett. 1995, 82–83, 149–153. [Google Scholar] [CrossRef]
  46. Chandra, J.; Samali, A.; Orrenius, S. Triggering and modulation of apoptosis by oxidative stress. Free Radic. Biol. Med. 2000, 29, 323–333. [Google Scholar] [CrossRef]
  47. McConkey, D.J. Biochemical determinants of apoptosis and necrosis. Toxicol. Lett. 1998, 99, 157–168. [Google Scholar] [CrossRef]
  48. Bernal, C.; Ribeiro, A.O.; Andrade, G.P.; Perussi, J.R. Photodynamic efficiency of hypericin compared with chlorin and hematoporphyrin derivatives in HEp-2 and Vero epithelial cell lines. Photodiagnosis Photodyn. Ther. 2015, 12, 176–185. [Google Scholar] [CrossRef]
  49. Moan, J.; Berg, K. The photodegradation of porphyrins in cells can be used to estimate the lifetime of singlet oxygen. Photochem. Photobiol. 1991, 53, 549–553. [Google Scholar] [CrossRef]
  50. de Almeida, R.M.S.; Fontana, L.C.; Vitorio, G.D.S.; Correia Pereira, A.H.; Soares, C.P.; Pinto, J.G.; Ferreira-Strixino, J. Analysis of the effect of photodynamic therapy with Fotoenticine on gliosarcoma cells. Photodiagnosis Photodyn. Ther. 2020, 30, 101685. [Google Scholar] [CrossRef]
Figure 1. Absorption (A) and fluorescence emission (B) spectra of PDZ in aqueous solution as a function of concentration. Absorption (C) and fluorescence emission (D) spectra of FTC in aqueous solution at various concentrations. Deconvolution of the Soret band of the FTC spectra at 50 µg/mL (E) and 200 µg/mL (F).
Photochem 02 00013 g001aPhotochem 02 00013 g001b
Figure 2. Time-resolved 1O2 signal (1270 nm) generated by PDZ, FTC, and H2TPPS4- under irradiation (647 nm). All the samples were prepared in deionized water (type 1).
Photochem 02 00013 g002
Figure 3. Micrograph by confocal fluorescence microscopy showing the internalization of PDZ and FTC at a concentration of 200 μg/mL.
Photochem 02 00013 g003
Figure 4. Trypan test (A) performed 18 h after applying the FTC-PDT, with 1 h of incubation with the PS, demonstrating the cell viability of the light and dark groups. Mitochondrial activity (B) was evaluated in dark and irradiated control groups and treated with FTC-PDT. Results presented as mean ± standard deviation (SD) (* p < 0.01).
Photochem 02 00013 g004
Figure 5. Death Indicators by labeling with Annexin and Iodide in the groups treated with FTC (A) and PDZ (B).
Photochem 02 00013 g005
Figure 6. Production of reactive oxygen species after PDT with FTC (A) and PDZ (B) at concentrations of 6.3 μg/mL and 200 μg/mL. Results presented in Mean ± SD demonstrate an increase in the amount of ROS produced with increasing concentration.
Photochem 02 00013 g006
Publisher’s Note: MDPI stays neutral with regard to jurisdictional claims in published maps and institutional affiliations.

