Abstract
Each olefin (ethylene, trans-1,3-butadiene, isoprene, dimethyl butadiene (DMB)) and ozone molecules were codeposited on a CsI window at cryogenic temperature, and the products of photolysis with ultraviolet–visible light were observed using Fourier-transform infrared spectroscopy. The products of the C2H4–O3 system could be assigned to glyoxal (CHO–CHO), ethylene oxide (c–C2H4O), CO, and CO2. The formation of CHO–CHO and c–C2H4 and the absence of H2CO and HCOOH indicated that the main reaction channels did not involve C–C bond breaking. Based on this simple scheme, the photoproducts of different olefin–O3 systems were assigned, and the vibrational features predicted by density functional theory calculations were compared with the observed spectra. Regarding butadiene, spectral matches between the observations and calculations seemed reasonable, while assignments for isoprene ambiguities of and DMB remain, mainly because of the limited availability of authentic sample spectra.
1. Introduction
The products of oxidation of volatile organic compounds (VOCs) contribute to secondary organic aerosols (SOAs) in the atmosphere and influence climate and local air quality [1]. In this respect, unsaturated VOCs such as ethylene (C2H4) [2] and isoprene (C5H8) [3], have been intensively investigated. The key reactants for the oxidation processes are ozone (O3), hydroxyl (OH), and nitrate (NO3) radicals. Ozone forms charge–transfer (CT) complexes with various organic molecules, and exhibits strong CT bands in the ultraviolet–visible (UV–VIS) region [4,5,6,7]. The oxidation processes involve reactions in both light and dark conditions; therefore, it is important to understand how light-induced oxidation proceeds in the olefin–ozone system.
The purpose of this study is to investigate the light-induced reactions of olefin–O3 systems spectroscopically in a cryogenic noble gas matrix to minimize the effect of thermal excitation of reactants. Numerous investigations have been conducted on reactions of olefin-O3 systems experimentally [8,9,10,11,12,13,14,15,16,17,18,19,20,21,22,23] and theoretically [24,25,26]. Many of the gas phase studies have been focused on ozonolysis in dark conditions, and have been done at moderate temperatures [8,9,10,11,12,13]. Quite recently, these reactions have been under further scrutiny at lower temperature by using new experimental techniques [14,15]. In matrices, on the other hand, studies on low temperature reactions have been done for decades [16,17,18,19,20,21,22,23]. In situ observations of light-induced reactions of olefin-O3 systems at cryogenic temperature are, to the best of our knowledge, not so abundant [23]. Ault and coworkers have performed systematic studies on these systems [24,25,26,27], and we will refer to them in comparison with this study.
In the present study, two samples, i.e., olefin/Ar (olefin = ethylene (C2H4), 1,3-butadiene (C4H6), isoprene (C5H8), dimethyl butadiene (C6H10)) and O3/Ar premixed samples, were co-deposited on a cold CsI window via separate pulse valves and irradiated by several light sources at various wavelengths. The observed vibrational features of the photoproducts were compared with existing spectral data and the simulated features obtained using quantum chemical calculations, as performed previously [28,29].
2. Materials and Methods
2.1. Experiment
Gaseous ethylene and butadiene were purchased from GL Sciences and TCI, respectively, and used without further purification. Isoprene and dimethyl butadiene (WAKO) were degassed in freeze–pump–thaw cycles before sample preparation. Ozone was generated using a homemade ozonizer made of O2 gas, trapped in a liquid N2-cooled silica gel, and subjected to vacuum distillation to remove residual O2. Each gaseous sample was diluted with Ar at various ratios and stored in a shielded glass vessel. Olefin/Ar and O3/Ar samples were codeposited onto a cold CsI window through separate pulse valves at 9–30 K, with a repetition rate of 10 Hz and pulse width of 450 µs. Matrix-isolated species were irradiated by several light sources, including continuous wave (CW) diode lasers at 405, 670, and 800 nm, pulsed nanosecond lasers at 532 and 780 nm (LOTIS LS-2137/2 and LT-2211A), and a CW Xe discharge lamp (ENERGETIQ EQ-99FC) with sets of optical filters. The typical exposure time was 10–30 min. Infrared (IR) spectra before and after photolysis were recorded with a JASCO FT/IR-6100 spectrometer, and the results were used to obtain the difference spectra for each system. Spectra were recorded in the region of 650–4000 cm−1 with a resolution of 0.5 cm−1. A schematic of the experimental setup is presented in Figure 1. Details of the instrumentation can be found in our previous articles [28,29]. The obtained difference spectra for C2H4, C4H6, C5H8, and C6H10 are displayed in Figure 2, Figure 3, Figure 4 and Figure 5, respectively. Spectral changes upon isotopic substitution (16O→18O) are listed for the three systems in Figure 6. Ozone (18O3) was prepared using the same procedure as used for the preparation of normal species from 18O2 (Matheson).
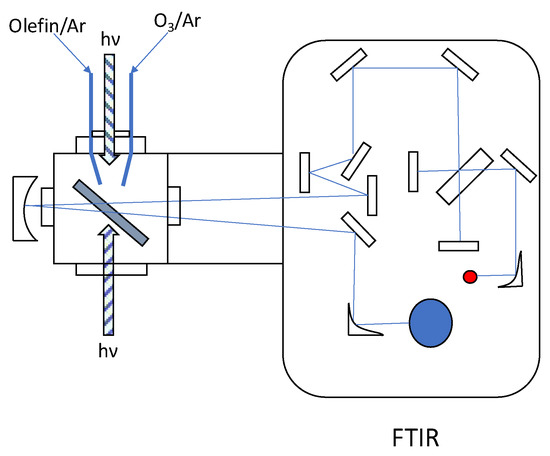
Figure 1.
A schematic of the experimental setup for the olefin–ozone photolysis. Two pulse valves were used to deposit olefin/Ar and O3/Ar samples separately. The photolysis beam was introduced from two optical ports, via optical fiber (for CW light source) or transfer optics (pulsed laser).
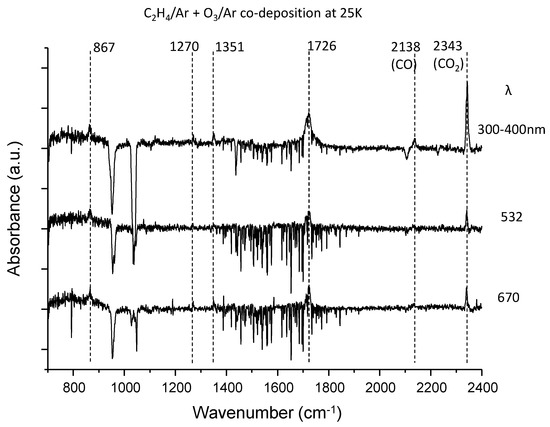
Figure 2.
The difference spectra for the ethylene–ozone system upon irradiation at three wavelengths in the fingerprint region. The near-UV light was obtained from a CW Xe discharge lamp through an optical filter. The 532 nm light was taken from the second-harmonic wave of nano-second pulse Nd: YAG laser, while the 670 nm light was obtained from the CW diode laser.
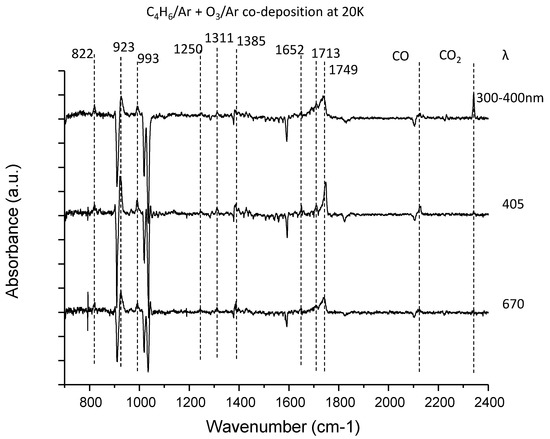
Figure 3.
The difference spectra for the 1,3-butadiene–ozone system upon irradiation at three wavelengths in the fingerprint region. The near-UV light was obtained from the CW Xe discharge lamp through the optical filter, while others are supplied by CW diode laser.
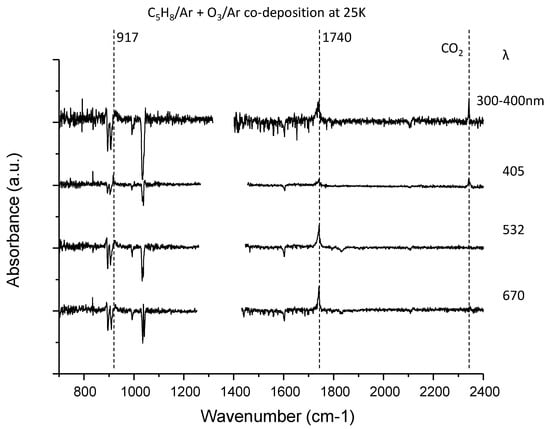
Figure 4.
The difference spectra for the isoprene–ozone system upon irradiation at four wavelengths in the fingerprint region. The near-UV light was obtained from the CW Xe discharge lamp through the optical filter. The 532 nm light was taken from the second-harmonic wave of nano-second pulse Nd: YAG laser, while others were supplied from the CW diode laser. The region with light intensity degradation due to optical fringes and atmospheric water was trimmed in each trace.
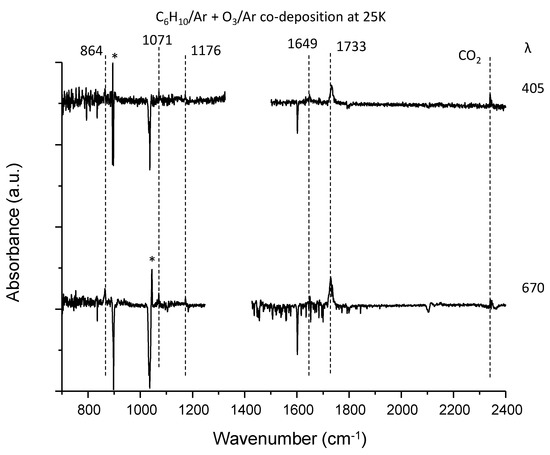
Figure 5.
The difference spectra for the dimethylbutadiene–ozone system upon irradiation in the fingerprint region. Two CW diode laser sources were used to photolyze this system at 405 and 670 nm. Peaks with asterisks (*) were not reproducible. The region with light intensity degradation due to optical fringes and atmospheric water was trimmed in each trace.
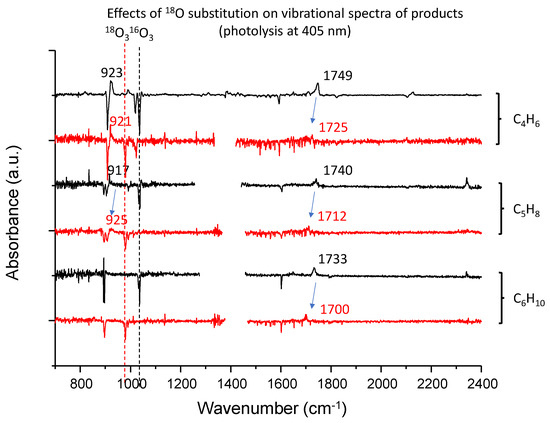
Figure 6.
The difference spectra for the three systems with 16O3 (black trace) and 18O3 (red trace) being compared with each other. The region with light intensity degradation due to optical fringes and atmospheric water was trimmed in each trace.
2.2. Calculation
For the assignment of photoproducts, density functional theory (DFT) calculations were carried out for candidate molecules. Structure optimization and vibrational calculation for each stable species were performed at the dcp-b3lyp/6-31 + G (2d,2p) level [30]. Anharmonic vibrational frequencies for all fundamental bands of each species were obtained with vibrational second-order perturbation treatment [31,32] for direct comparison with the observed vibrational peak position without frequency scaling. All calculations were completed with Gaussian09 (Rev. 02) [33].
3. Results
3.1. C2H4–O3 System
Figure 2 shows the difference spectra for the ethylene–ozone system upon irradiation; the photoproducts produce positive peaks, whereas reactants show depletion. Below 15 K, the difference spectra showed no decrease in reactants nor the emergence of photoproducts. This indicated that thermal diffusion after deposition was crucial to achieving close contact between C2H4 and O3 in the matrix. Four peaks could be ascribed to the photoproducts, and two of them (at 2138 and 2343 cm−1) were readily assigned to CO and CO2, respectively. While the peaks at 867 cm−1 and 1270 cm−1 were assigned to the ν5 and ν3 bands of ethylene oxide (c–C2H4) [34], respectively, the assignment of the most intense band at 1726 cm−1 was not straightforward, because it was not due to the aldehydes (H2CO [35] and CH3CHO [36]) or the carboxylic acids (HCOOH [37] and CH3COOH [38]) as expected. Finally, we assigned this peak to trans-glyoxal (CHO–CHO), in conformation with previous matrix data [39]. The remaining peak at 1351 cm−1 could not be assigned to a known species. Although it was in good agreement with ν7 of CH3CHO, a ν8 band with comparable intensity could not be located. Therefore, it was left unassigned. From existing data on the IR band intensities of these molecules [40,41,42], it was found that the depletion of C2H4 and O3 obeyed ~ 1:1 stoichiometry. The mass balance of C atoms in these photoreactions could be estimated to be more than 43% in total, and more than 70% for UV-photolysis. Therefore, it is reasonable to conclude that the photoreactions of the C2H4–O3 system mainly proceed without C–C bond breaking.
It is known that the reaction of C2H4 and an oxygen atom (3P) in the gas phase at room temperature produces mainly CH3CHO and fragmented products due to the high excess energy of the C2H4O adduct [43]. Conversely, in liquid N2, the addition reaction leads to the simultaneous formation of c–C2H4O and CH3CHO with a comparable branching ratio, owing to the rapid energy release of the adduct into the cold media [44]. The absence of CH3CHO in the photoproducts in the Ar matrix suggests that the photoreaction of the C2H4 + O3 system is not stepwise as follows:
where [C2H4O]‡ stands for a transition state.
It seems more reasonable to assume the following concerted reaction instead:
where [C2H4···O3] represents a CT complex. Contrarily, the decrease in CO and CO2 during photolysis at longer wavelengths may indicate that they originate from the UV dissociation of photoproducts (mainly CHO–CHO).
Production of CHO–CHO from this system is reasonable in view of the following energetics:
C2H4 + O3 → CHO–CHO + H2O △H298 = −648.9 kJ mol−1
C2H4 + O3 → CH3CHO + O2 △H298 = −365.8 kJ mol−1
C2H4 + O3 → c–C2H4O + O2 △H298 = −247.7 kJ mol−1
Understanding the reasons behind why CH3CHO was not observed in the photoproducts of this system is difficult. Theoretically, the isomerization of c–C2H4O to CH3CHO and vice versa is hampered by the high activation energy barriers [45]; therefore, we can safely state that CH3CHO is not a primary product in the photolysis of the C2H4--O3 complex at cryogenic temperatures. In the dehydration reaction, glyoxal and H2O molecules are produced simultaneously. The apparent absence of H2O in the observed spectra is due to a compound effect of optical fringes and the ineffective removal of atmospheric water vapor, even with a purge system by dry N2 flow. Since it was practically impossible to assign photoproducts in this region for larger olefins, the corresponding part was trimmed in Figure 4, Figure 5, Figure 6 and Figure 7; see each figure caption.
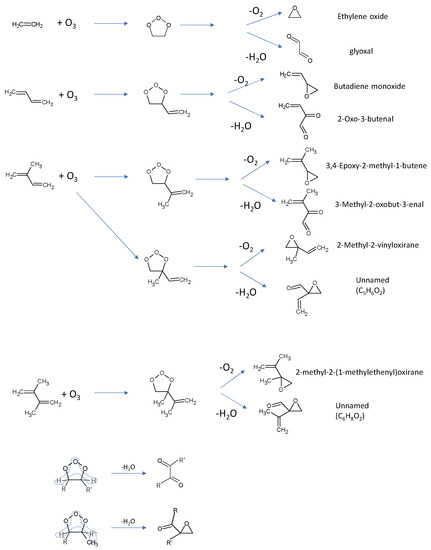
Figure 7.
Plausible photoproducts for the olefin–O3 systems predicted from two types of reaction paths for the C2H4–O3 system.
The ozonolysis of C2H4 (dark reaction) initiated at an elevated temperature, with an energy threshold of 5.2 kCal mol−1 [46]. Thus, this study shows the initial stage of photoreactions followed by complicated chains of the oxidation processes, leading to secondary organic aerosol (SOA) formation at ambient temperature.
Therefore, it is assumed that the primary photolysis of olefin–O3 systems occurs in the following ways:
and
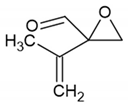
as observed for the C2H4–O3 system. The primary products predicted from these two schemes for each olefin are shown in Figure 7. Regarding the dehydration products from C5H8–O3 and C6H10–O3 systems, it was difficult to derive glyoxal-like molecules by removing one O2 and two H2 atoms symmetrically from the Criegee intermediates (see the bottom trace of Figure 7). Thereafter, other types of molecules, including an oxirane skeleton and a formyl group, were assumed. The name of each molecule was obtained from PubChem via the Add-ons of the ACD/ChemSketch software. Simulated spectra for the predicted products were obtained from anharmonic vibrational calculations, as described in Section 2.2, and compared with the experimental spectra in Figure 8, Figure 9 and Figure 10.
Olefin + O3 → oxirane-like product + O2
Olefin + O3 → glyoxal-like product + H2O
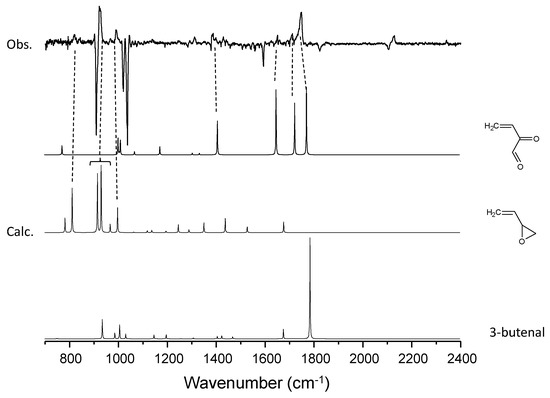
Figure 8.
A comparison of the experimental spectra with simulated spectra for the candidate molecules for the C4H6–O3 system.
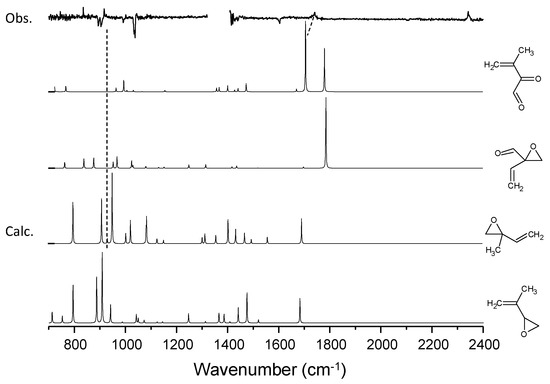
Figure 9.
A comparison of the experimental spectra with simulated spectra for the candidate molecules for the C5H8–O3 system.
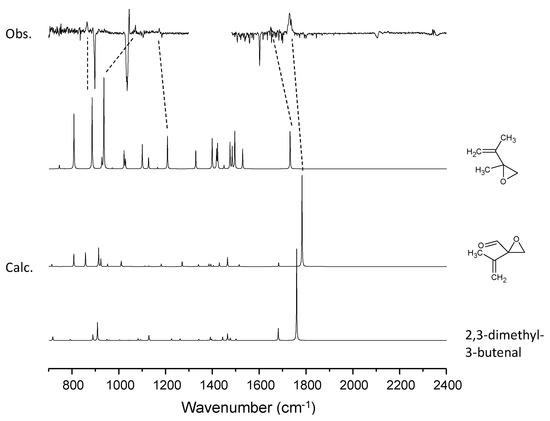
Figure 10.
A comparison of the experimental spectra with simulated spectra for the candidate molecules for the C6H10–O3 system.
3.2. C4H6–O3 System
Figure 3 shows the difference spectra of the 1,3-butadiene–ozone system upon irradiation similar to that of the C2H4–O3 system. In addition to the peaks for CO and CO2, four vibrational peaks were observed as the photoproducts. Notably, the peak at 1749 cm−1 was broad and degraded at longer wavelengths. As mentioned above, the production of CO and CO2 is suppressed during photolysis at longer wavelengths. The observed peaks reproduced the result of Ault [27]. Based on the reaction schemes in Figure 7, the following were assigned to the vibrational peaks of the photoproducts:
822, 923, 993 cm−1: butadiene monoxide
1385, 1652, 1713, 1749 cm−1: 2-oxo-3-butenal
The gas-phase spectrum for butadiene monoxide in the National Institute of Standards and Technology (NIST) database conformed to the present matrix-isolation peaks. The peaks assigned to butadiene monoxide also conformed to those observed in the Ar matrix produced from visible laser photolysis of the C4H6–NO2 system [47]. Conversely, for the 2-oxo-3-butenal, no experimental spectrum is available, so direct comparison was not possible. Instead, the anharmonic vibrational calculation showed a good match with the observed peak positions (Figure 8). Ault assigned the peaks at 1385, 1652, 1749 cm−1 to 3-butenal and the peak at 1713 cm−1 to 2-butenal. Tanaka et al. reported a vibrational peak of 3-butenal at 1735 cm−1 [47], and this position is not consistent with the assignment of ref. [27]. The spectral matches between observation and calculation in Figure 8 showed better agreement for 2-oxo-3-butenal, and it would be more conclusive to assign these peaks to the glyoxal-like 2-oxo-3-butenal. The isotopic shift (16O → 18O) of this band is 24 cm−1, which is comparable to the calculated anharmonic wavenumber shift for 2-oxo-3-butenal (36 cm−1). The two peaks at 1250 and 1311 cm−1 could not be assigned to these two molecules and remain unidentified. Besides, we cannot rule out the possibility that peaks of other photoproducts overlap with the 1749 cm−1 peak, in view of the broad and strong spectral feature.
3.3. C5H8–O3 System
Figure 4 shows the difference spectra for the isoprene–ozone system upon irradiation. Due to its limited sensitivity, only two peaks at 917 and 1740 cm−1 were observed in addition to the peak for CO2. In contrast, the inequivalence of the two double bonds in isoprene provides two possible isoprene–ozone complexes, and thus, four photoproducts are predicted (see Figure 7). We carried out DFT calculations at the B3LYP/aug-cc-pVTZ level for the CT complexes, and found that both CT complexes are comparably stable (energy difference < 50 cm−1). It is thus reasonable to assume that they coexist. Among these four candidate molecules, the spectral database contained the spectra for only 2-methyl-2-vinyloxirane in the form of transmission and ATR spectra for liquid films [48]. The experimental spectra showed a strong peak at 890 cm−1 that does not conform to the peak at 917 cm−1. Tanaka et al. observed visible laser photoproducts in the isoprene–NO2 system and assigned the 930 cm−1 peak to this molecule. Since these two peaks cannot be misidentified, the 917 cm−1 peak was assigned to 3,4-epoxy-2-methyl-1-butene. Although the 917 cm−1 peak was close to the O-O stretching band of the simplest Criegee intermediate CH2OO [49], such possibility was ruled out from the very small isotope shift upon 16O → 18O substitution; see Figure 6.
Regarding the 1740 cm−1 band, the two candidate molecules exhibited similar simulated patterns, and it is not clear which is more plausible. Because of the considerable energy difference between them, the peak was temporarily assigned to 3-methyl-2-oxobut-3-enal. As shown in Figure 9, the spectral match remains qualitative owing to the limited spectroscopic data available. The isotopic shift (16O → 18O) of this band is 28 cm−1, which is comparable to the calculated anharmonic wavenumber shift for this molecule (34 cm−1).
3.4. C6H10–O3 System
Figure 5 shows the difference spectra for the dimethyl butadiene–ozone system upon irradiation. Five peaks were observed at 864, 1071, 1176, 1649 and 1733 cm−1, in addition to the CO2 peak. Notably, the production of CO2 is negligible even at 405 nm, implying the absence of a glyoxal-like product. Tanaka et al. observed peaks at 865, 1070, 1175 in the visible laser photolysis of a DMB–NO2 system in Ar and assigned them to 2-methyl-2-(1-methylethenyl) oxirane [47]. They did not report the peak at 1649 cm−1, and it may be obscured by the strong peak of nitrite radical at 1657 cm−1. They observed a peak at 1731 cm−1 and assigned it to 2,3-dimethyl-3-butenal. Our assignments of the three low lying peaks were consistent with theirs, although it is not clear which molecule the 1733 cm−1 band is assignable to; no experimental IR data are available for the authentic samples of the two candidate molecules. Anharmonic vibrational calculations for these two species provided essentially the same spectral patterns, and the qualitative match between the experiment and calculation is similar to that of the C5H8–O3 system, as shown in Figure 10. The isotopic shift (16O → 18O) of this band is 33 cm−1, comparable to the calculated anharmonic wavenumber shift for the molecule (38 cm−1).
4. Discussions
The peak positions of the photoproducts in this study are listed in Table 1, together with their assignments. As described above, the vibrational peaks for the photoproducts for each of the three olefin–ozone systems can be interpreted consistently by assuming there was no C–C bond cleavage upon irradiation. It would be reasonable to conclude that the CT bands of these ozone complexes do not have significant absorption cross-sections in the longer wavelength limit of the visible region, because we could not detect products of photolysis at 780 and 800 nm. Regarding the C2H4–O3 system, we could not observe photoproducts spectroscopically upon irradiation at 405 nm, and there might be a “gap” in the CT band around this wavelength, whereas no such depletion of photolysis was found for other olefins. The observation of CT bands has been reported for some organic molecule–ozone complexes [4,5,6,7]. Jonnalagadda et al. measured the CT band for the C2H4–O3 complex in the Xe matrix [6]. The spectrum shows a maximum at ca. 300 nm and a decrease in the longer wavelength region. This is consistent with the photolytic efficiency observed in this study, except for the possible gap at approximately 405 nm. One possible source of this small discrepancy might be the difference in host atoms; Xe is more polarizable than Ar and, therefore, may influence the CT band profile via host–guest interactions. The enhancement of the CT band for the allene–O3 complex in Xe was found to be the host effect [4]. We also attempted to observe the CT band of the C2H4–O3 complex in the Ar matrix using a UV–VIS spectrometer (StellarNet Qmini2 WIDE-V), but the strong scattering of the host matrix did not allow for reproducible detection. Instead, we carried out two types of theoretical calculations for the CT band using time-dependent DFT (TD-DFT) and a configuration interaction including only single excitation (CIS). An optimized structure for the C2H4–O3 complex in the electronic ground state was obtained at the cam-B3LYP /aug-cc-pVTZ level, and it was used as the reference geometry for the excited state calculations. The range-separated function was employed because it provides a better description for excited states of CT complexes [50,51,52]. The results shown in Figure 11 indicate that CIS predicts a bimodal absorption profile, whereas TD-DFT derives a strong absorption band in between. It seems that the CIS calculation qualitatively reproduced the observed photolytic efficiency.

Table 1.
Observed vibrational peaks of photoproducts and their assignments. The name of each molecule was obtained from PubChem. The molecule in the last row cannot be found in the database, so its structure is presented instead.
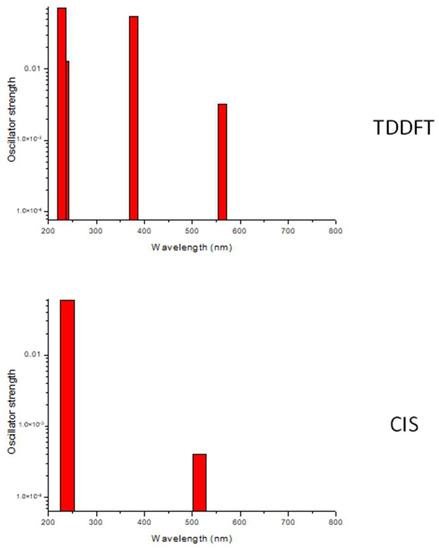
Figure 11.
The simulated spectra for the CT bands for the ethylene–ozone complex by TD-DFT and CIS methods.
In this study, the types of photoproducts derived were not dependent on the wavelength of the light source. Kamata et al. [53] and Kon et al. [54] reported the switching of photoreaction channels at visible wavelengths. It is still not clear how and why such differences arise, which presents another issue to be solved.
5. Conclusions
In this study, we experimentally observed the photolysis of four types of olefin–ozone complexes and presented the possible assignment of photoproducts. Regarding the C2H4–O3 and C4H6–O3 systems, the spectral match between observation and prediction seemed satisfactory, but those for the other systems remain ambiguous, mainly because of the unavailability of authentic sample spectra. We must stress that the work of Tanaka et al. on diene–NO2 systems [47] was very helpful in narrowing down candidate molecules, even though we had to rely on the simulated spectra for the temporary assignment of many of these products. Further research is required to verify the assignments. Finally, the importance of the low carbon balance for the C2H4–O3 system reaction that amounts to 70% at most, as described above, indicates that there are some other reaction channels followed by the photoexcitation of the CT band, whose products were not identified by infrared spectroscopy. The application of other experimental techniques is required in future.
Funding
This research received no external funding.
Institutional Review Board Statement
Not applicable.
Informed Consent Statement
Not applicable.
Data Availability Statement
Raw output files of DFT calculations in this study are available from the author upon request.
Acknowledgments
We would like to thank Akai and Kamata (TUAT) for valuable information on the effective separation and purification technique of ozone. We would also like to thank anonymous referees who provided useful and detailed comments on earlier versions of the manuscript.
Conflicts of Interest
We declare no conflict of interest regarding the financial and personal issues that could influence the work reported in this paper.
References
- Seinfeld, J.H.; Pandis, S.N. Atmospheric Chemistry and Physics: From Air Pollution to Climate Change; Wiley: New York, NY, USA, 1998. [Google Scholar]
- Johnson, D.; Marston, G. The gas-phase ozonolysis of unsaturated volatile organic compounds in the troposphere. Chem. Soc. Rev. 2008, 37, 699–716. [Google Scholar] [CrossRef] [PubMed]
- Wennberg, P.O.; Bates, K.H.; Crounse, J.D.; Dodson, L.G.; McVay, R.C.; Mertens, L.A.; Nguyen, T.B.; Praske, E.; Schwantes, R.H.; Smarte, M.D.; et al. Gas-Phase Reactions of Isoprene and Its Major Oxidation Products. Chem. Rev. 2018, 118, 3337–3390. [Google Scholar] [CrossRef] [Green Version]
- Singmaster, K.A.; Pimentel, G.C. Photolysis of Allene-Ozone Mixtures at 647 nm in Crygenic Matrices Part 1. Formation of allene oxide. J. Mol. Struct. 1989, 194, 215–238. [Google Scholar] [CrossRef]
- Singmaster, K.A.; Pimentel, G.C. Spectroscopic Detection of Ozone-Olefin Charge-Transfer Complexes in Cryogenic Matrices. J. Phys. Chem. 1990, 94, 5226–5229. [Google Scholar] [CrossRef]
- Jonnalagadda, S.; Chan, S.; Garrido, J.; Bond, J.; Singmaster, K.A. Detection of Ethylene-Ozone and Cyclohexene-Ozone Charge-Transfer Complexes in Cryogenic Matrices. J. Am. Chem. Soc. 1995, 117, 562–563. [Google Scholar] [CrossRef]
- Pinelo, L.F.; Kugel, R.W.; Ault, B.S. Charge-Transfer Complexes and Photochemistry of Ozone with Ferrocene and n-Butylferrocene: A UV−vis Matrix-Isolation Study. J. Phys. Chem. A 2015, 119, 10272–10278. [Google Scholar] [CrossRef]
- Herron, J.T.; Huie, R.E. Stopped-Flow Studies of the Mechanisms of Ozone-Alkene Reactions in the Gas Phase. Ethylene. J. Am. Chem. Soc. 1977, 99, 5430–5435. [Google Scholar] [CrossRef]
- Niki, H.; Maker, P.D.; Savage, C.M.; Breltenbach, L.P. A FT IR Study of a Transitory Product in the Gas-Phase Ozone-Ethylene Reaction. J. Phys. Chem. 1981, 85, 1024–1027. [Google Scholar] [CrossRef]
- Su, F.; Calverl, J.G.; Shaw, J.H. A FT 1R Spectroscopic Study of the Ozone-Ethene Reaction Mechanism in O2-Rich Mixtures. J. Phys. Chem. 1980, 84, 239–246. [Google Scholar] [CrossRef]
- Horie, O.; Moortgat, G.K. Decomposition pathways of the excited Criegee intermediates in the ozonolysis of simple alkenes. Atmos. Environ. A 1991, 25, 1881–1896. [Google Scholar] [CrossRef]
- Neeb, P.; Horie, O.; Moortgat, G.K. The nature of the transitory product in the gas-phase ozonolysis of ethene. Chem. Phys. Lett. 1995, 246, 150–156. [Google Scholar] [CrossRef]
- Neeb, P.; Horie, O.; Moortgat, G.K. The Ethene—Ozone Reaction in the Gas Phase. J. Phys. Chem. A 1998, 102, 6778–6785. [Google Scholar] [CrossRef]
- Porterfield, J.P.; Eibenberger, S.; Patterson, D.; McCarthy, M.C. The ozonolysis of isoprene in a cryogenic buffer gas cell by high resolution microwave spectroscopy. Phys. Chem. Chem. Phys. 2018, 20, 16828–16834. [Google Scholar] [CrossRef] [PubMed] [Green Version]
- Rousso, A.C.; Hansen, N.; Jasper, A.W.; Ju, Y. Low-Temperature Oxidation of Ethylene by Ozone in a Jet-Stirred Reactor. J. Phys. Chem. A 2018, 122, 8674–8685. [Google Scholar] [CrossRef]
- Kühne, H.; Vaccani, S.; Ha, T.-K.; Bauder, A.; Günthard, H.H. Infrared-matrix and microwave spectroscopy of the ethylene-ozone gas-phase reaction. Chem. Phys. Lett. 1976, 38, 449–455. [Google Scholar] [CrossRef]
- Kühne, H.; Günthard, H.H. Spectroscopic Study of the Ozone-Ethylene Reaction. Matrix-Infrared Spectra of Three Isotopic Ethylene Ozonides. J. Phys. Chem. 1976, 80, 1238–1247. [Google Scholar] [CrossRef]
- Nelander, B.; Nord, L. The reaction between ethylene and ozone. A matrix study. Tetrahedron Lett. 1977, 32, 2821–2822. [Google Scholar] [CrossRef]
- Hawkins, M.; Kohlmlller, C.K.; Andrews, L. Matrix Infrared Spectra and Photolysis and Pyrolysis of Isotopic Secondary Ozonides of Ethylene. J. Phys. Chem. 1982, 86, 3154–3166. [Google Scholar] [CrossRef]
- Kohlmiller, C.K.; Andrews, L. Infrared Spectrum of the Primary Ozonide of Ethylene in Solid Xenon. J. Am. Chem. Soc. 1981, 103, 2578–2583. [Google Scholar] [CrossRef]
- Andrews, L.; Kohlmiller, C.K. Infrared Spectra and Photochemistry of the Primary and Secondary Ozonides of Propene, trans-2-Butene, and Methylpropene in Solid Argon. J. Phys. Chem. 1982, 86, 4548–4557. [Google Scholar] [CrossRef]
- Samuni, U.; Haas, Y.; Fajgar, R.; Pola, J. Matrix effects in the low-temperature oxonation of ethylene, tetramethylethylene and 1-hexene. J. Mol. Struct. 1998, 449, 177–201. [Google Scholar] [CrossRef]
- Clark, R.J.H.; Foley, L.J. Photochemically Induced Reactions of Ozone with 1,2-Dibromoethene and 1,2-Dichloroethene: An FT-IR Matrix Isolation Study. J. Phys. Chem. A 2002, 106, 3356–3364. [Google Scholar] [CrossRef]
- Clay, M.; Ault, B.S. Infrared matrix isolation and theoretical study of the initial intermediates in the reaction of ozone with cis-2-butene. J. Phys. Chem. A 2010, 114, 2799–2805. [Google Scholar] [CrossRef] [PubMed]
- Hoops, M.D.; Ault, B.S. Matrix isolation study of the early intermediates in the ozonolysis of cyclopentene and cyclopentadiene: Observation of two criegee intermediates. J. Am. Chem. Soc. 2009, 131, 2853–2863. [Google Scholar] [CrossRef]
- Kugel, R.W.; Ault, B.S. Infrared matrix isolation and theoretical studies of reactions of ozone with bicyclic alkenes: α-pinene, norbornene, and norbornadiene. J. Phys. Chem. A 2015, 119, 312–322. [Google Scholar] [CrossRef]
- Ault, B.S. Matrix isolation study of the reaction of O (3P) with 1,3 butadiene: Unexpected formation of ethylketone. J. Mol. Struct. 2019, 1176, 47–53. [Google Scholar] [CrossRef]
- Ito, F. Infrared and quantum chemical studies of isoprene-methanol complexes in noble gas matrices. J. Mol. Spectrosc. 2019, 362, 90–95. [Google Scholar] [CrossRef]
- Ito, F. Infrared and density functional theory studies of isoprene-water complexes in noble gas matrices. J. Mol. Spectrosc. 2017, 341, 27–34. [Google Scholar] [CrossRef]
- Torres, E.; DiLabio, G.A. A (Nearly) Universally Applicable Method for Modeling Noncovalent Interactions Using B3LYP. J. Phys. Chem. Lett. 2012, 3, 1738–1744. [Google Scholar] [CrossRef]
- Barone, V. Vibrational zero-point energies and thermodynamic functions beyond the harmonic approximation. J. Chem. Phys. 2004, 120, 3059–3065. [Google Scholar] [CrossRef]
- Barone, V. Anharmonic vibrational properties by a fully automated second-order perturbative approach. J. Chem. Phys. 2005, 122, 014108. [Google Scholar] [CrossRef] [PubMed]
- Frisch, M.J.; Trucks, G.W.; Schlegel, H.B.; Scuseria, G.E.; Robb, M.A.; Cheeseman, J.R.; Scalmani, G.; Barone, V.; Petersson, G.A.; Nakatsuji, H.; et al. Gaussian 09, Revision A.02; Gaussian, Inc.: Wallingford, CT, USA, 2009. [Google Scholar]
- Ault, B.S. Matrix Isolation Study of the Complexes of Small-ring Heterocycles. J. Mol. Struct. 1985, 127, 343–356. [Google Scholar] [CrossRef]
- Khoshkhoo, H.; Nixon, E.R. Infrared and Raman spectra of formaldehyde in argon and nitrogen matrices. Spectrochim. Acta A 1973, 29, 603–612. [Google Scholar] [CrossRef]
- Wiberg, K.B.; Thiel, Y.; Goodman, L.; Leszczynski, J. Acetaldehyde: Harmonic Frequencies, Force Field, and Infrared Intensities. J. Phys. Chem. 1995, 99, 13850–13864. [Google Scholar] [CrossRef]
- Maçôas, E.M.S.; Lundell, J.; Pettersson, M.; Khriachtchev, L.; Fausto, R.; Räsänen, M. Vibrational spectroscopy of cis- and trans-formic acid in solid argon. J. Mol. Spectrosc. 2003, 219, 70–80. [Google Scholar] [CrossRef] [Green Version]
- Macoas, E.M.S.; Khriachtchev, L.; Pettersson, M.; Fausto, R.; Rasanen, M. Rotational isomerism of acetic acid isolated in rare-gas matrices: Effect of medium and isotopic substitution on IR-induced isomerization quantum yield and cis→trans tunneling rate. J. Chem. Phys. 2004, 121, 1331–1338. [Google Scholar] [CrossRef] [Green Version]
- Diem, M.; MacDonald, B.G.; Lee, E.K.C. Photolysis and Laser-Excited Fluorescence and Phosphorescence Emission of trans-Glyoxal in an Argon Matrix at 13 K. J. Phys. Chem. 1981, 85, 2227–2232. [Google Scholar] [CrossRef]
- Pugh, L.A.; Rao, K.N. Intensities from infrared spectra. In Molecular Spectroscopy: Modern Research; Rao, K.N., Ed.; Academic Press: Cambridge, MA, USA, 1976; Volume 2, pp. 165–226. [Google Scholar]
- Profeta, L.T.M.; Sams, R.L.; Johnson, T.J. Quantitative Infrared Intensity Studies of Vapor-Phase Glyoxal, Methylglyoxal, and 2,3-Butanedione (Diacetyl) with Vibrational Assignments. J. Phys. Chem. A 2011, 115, 9886–9900. [Google Scholar] [CrossRef]
- Adler-Golden, S.M.; Langhoff, S.R.; Bauschlicher, C.W., Jr.; Carney, G.D. Theoretical calculation of ozone vibrational infrared intensities. J. Chem. Phys. 1985, 83, 255–264. [Google Scholar] [CrossRef]
- Cvetanovic, R.J. Reaction of Oxygen Atoms with Ethylene. J. Chem. Phys. 1955, 23, 1375–1380. [Google Scholar] [CrossRef]
- Hirokami, S.; Cvetanovic, R.J. Reaction of Oxygen Atoms, O(3P), with Olefins in Liquid Nitrogen Solution at 77 K. J. Am. Chem. Soc. 1974, 96, 3738–3746. [Google Scholar] [CrossRef]
- Yang, X.; Maeda, S.; Ohno, K. Insight into Global Reaction Mechanism of [C2, H4, O] System from ab initio Calculations by the Scaled Hypersphere Search Method. J. Phys. Chem. A 2007, 111, 5099–5110. [Google Scholar] [CrossRef] [PubMed]
- Atkinson, R.; Carter, W.P.L. Kinetics and Mechanisms of the Gas-Phase Reactions of Ozone with Organic Compounds under Atmospheric Conditions. Chem. Rev. 1984, 84, 437–470. [Google Scholar] [CrossRef]
- Tanaka, N.; Kajii, Y.; Shibuya, K.; Nakata, M. Visible Light Induced Reactions of NO2 with Conjugated Dienes in a Low-Temperature Ar Matrix. J. Phys. Chem. 1993, 97, 7048–7053. [Google Scholar] [CrossRef]
- 2-Methyl-2-vinyloxirane | C5H8O - PubChem. Available online: https://pubchem.ncbi.nlm.nih.gov/compound/92166 (accessed on 23 February 2022).
- Su, Y.-T.; Huang, Y.-H.; Witek, H.A.; Lee, Y.-P. Infrared Absorption Spectrum of the Simplest Criegee Intermediate CH2OO. Science 2013, 340, 174–176. [Google Scholar] [CrossRef] [Green Version]
- Dreuw, A.; Weisman, J.L.; Head-Gordon, M. Long-range charge-transfer excited states in time-dependent density functional theory require non-local exchange. J. Chem. Phys. 2003, 119, 2943–2946. [Google Scholar] [CrossRef]
- Adamo, C.; Jacquemin, D. The calculations of excited-state properties with Time-Dependent Density Functional Theory. Chem. Soc. Rev. 2013, 42, 845–856. [Google Scholar] [CrossRef]
- Campetella, M.; Maschietto, F.; Frisch, M.J.; Scalmani, G.; Ciofini, I.; Adamo, C. Charge Transfer Excitations in TDDFT: A Ghost-Hunter Index. J. Comput. Chem. 2017, 38, 2151–2156. [Google Scholar] [CrossRef]
- Kamata, K.; Yoshioka, R.; Akai, N.; Nakata, M. Visible-light-Induced Reaction of an Ozone–Trimethylamine Complex Studied by Matrix-Isolation IR and Visible Absorption Spectroscopies. J. Phys. Chem. A 2020, 124, 9973–9979. [Google Scholar] [CrossRef]
- Kon, A.; Inano, N.; Terada, N.; Kamata, K.; Akai, N.; Nakata, M. Photoreactions of Ozone–Tetrahydrothiophene, Ozone–Pyrrolidine, and Ozone–Thiazolidine Complexes Studied Using Matrix-Isolation IR and Visible Absorption Spectroscopies. J. Phys. Chem. A 2021, 125, 2114–2120. [Google Scholar] [CrossRef]
Publisher’s Note: MDPI stays neutral with regard to jurisdictional claims in published maps and institutional affiliations. |
© 2022 by the author. Licensee MDPI, Basel, Switzerland. This article is an open access article distributed under the terms and conditions of the Creative Commons Attribution (CC BY) license (https://creativecommons.org/licenses/by/4.0/).
