All articles published by MDPI are made immediately available worldwide under an open access license. No special
permission is required to reuse all or part of the article published by MDPI, including figures and tables. For
articles published under an open access Creative Common CC BY license, any part of the article may be reused without
permission provided that the original article is clearly cited. For more information, please refer to
https://www.mdpi.com/openaccess.
Feature papers represent the most advanced research with significant potential for high impact in the field. A Feature
Paper should be a substantial original Article that involves several techniques or approaches, provides an outlook for
future research directions and describes possible research applications.
Feature papers are submitted upon individual invitation or recommendation by the scientific editors and must receive
positive feedback from the reviewers.
Editor’s Choice articles are based on recommendations by the scientific editors of MDPI journals from around the world.
Editors select a small number of articles recently published in the journal that they believe will be particularly
interesting to readers, or important in the respective research area. The aim is to provide a snapshot of some of the
most exciting work published in the various research areas of the journal.
Department of Hydroaerodynamics and Hydraulic Machines, Technical University of Sofia, 1000 Sofia, Bulgaria
2
Miracle Centre of Competence Lab “Intelligent Mechatronic Solutions in Textiles and Clothing” (MeTex), Technical University of Sofia, 1000 Sofia, Bulgaria
3
Centre for Research and Design in Human Comfort, Energy and Environment (CERDECEN), Technical University of Sofia, 1000 Sofia, Bulgaria
4
Department of Energy and Mechanical Engineering, Technical University of Sofia, 1000 Sofia, Bulgaria
*
Author to whom correspondence should be addressed.
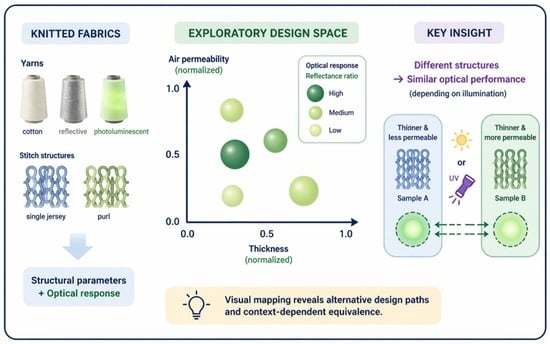
The study presents an exploratory design-space mapping approach for analysing knitted fabrics through the combined consideration of structural, comfort-related, and optical parameters. The methodology addresses the multi-parameter nature of knitted macrostructures, where functional behaviour emerges from the interaction of yarn composition, stitch architecture, and structural configuration rather than from isolated descriptors. Twelve knitted samples differing in stitch type and yarn linear density, and incorporating photoluminescent and reflective yarns, were analysed. Fabric thickness and air permeability were selected as representative structural and comfort-related parameters, while optical response was characterised using a dimensionless reflectance ratio under multiple illumination conditions. All parameters were normalised to enable comparative representation within a unified design space. The resulting maps reveal visual clusters, structurally isolated cases, and illumination-dependent optical equivalence between structurally different configurations. The findings demonstrate that similar optical performance can be achieved through alternative structural solutions, depending on the illumination context. The proposed approach provides a qualitative, design-oriented framework that supports engineering decision-making without implying optimisation or ranking, while revealing alternative design pathways and context-dependent equivalence.
Textile fabrics are macrostructures in which yarn composition, structural formation, and functional characteristics are closely connected. The functional behaviour of textile fabrics does not result from isolated parameters, but from their combined interaction within a common structural configuration [1,2]. In knitted macrostructures, this interdependence is clearly expressed, as structural formation plays an active role in the interaction between threads, fabric geometry, and functional response [3].
The loop-based architecture of knitted fabrics allows significant variability in thickness, porosity, and behaviour during use. This makes knitted macrostructures suitable for apparel as well as for technical and functional applications [4,5]. At the same time, this structural flexibility introduces complexity, since several parameters influence fabric performance simultaneously and often show non-linear relationships [6,7]. It is also characteristic that similar structural configurations can lead to different functional behaviour, while similar functional properties can be achieved through different structural solutions.
In textile research, structural and performance characteristics of fabrics are often analysed separately, or a single performance parameter, such as air permeability, thermal insulation, or mechanical strength, is optimised. However, these approaches do not fully reflect the multi-parameter nature of textile systems at the fabric (macrostructural) level. In this context, air permeability can be considered a typical example of a parameter that links fabric structure to comfort-related behaviour [8]. It is related to thermophysiological comfort, as it reflects the balance between breathability and thermal insulation and contributes to heat and mass transfer between the body and the environment [9,10].
When complex yarns with passive smart response are incorporated into knitted fabrics, an additional functional dimension is introduced, for example, optical response. Then, the functional reaction of the fabric would depend on yarn material composition, structural configuration, and illumination conditions. These functionalities are closely related to the knitted macrostructure and impose additional constraints [2,11]. Functional yarns must be structurally integrated in a way that does not compromise air permeability and thermal comfort [12,13]. The interaction between functional yarns and the knitted macrostructure may lead to structural trade-offs [14]. As a result, the fabric macrostructure becomes an active element rather than a neutral carrier of functionality.
This multidimensional dependency further complicates the analysis when conventional parametric approaches limited to one or two isolated descriptors are applied [15].
Thickness is a universal structural descriptor applicable to textile fabrics, as it reflects mass per unit area, bulk, compactness, and the overall macrostructural configuration of the fabric [16,17,18]. It represents the structural outcome of multiple design decisions, including yarn selection, stitch type, and the integration of functional elements. In this sense, thickness acts as an indicator and a mediator, rather than as an objective itself. Air permeability, in turn, is a key comfort-related parameter governing air and heat exchange at the fabric level. It depends not only on thickness, but also on the distribution of pores and loops within the knitted structure [8,19]. Considered together, thickness and air permeability provide a structural basis for describing and comparing knitted fabrics beyond single-parameter assessment.
While established methods exist for measuring individual structural, comfort-related, and functional characteristics of textile fabrics [20,21], their integration within a common analytical space remains challenging. The limitation lies mainly in the lack of approaches for the combined mapping of multiple, interrelated structural, comfort-related, and functional parameters in textile macrostructures.
Recent studies have explored design-space mapping and visual parameter-space analysis in engineering contexts, enabling the identification of relationships between structural configurations and performance characteristics [22,23,24,25]. However, such approaches remain limited in textile applications, where parameters are typically analysed in isolation.
The present study applies an exploratory mapping approach to position knitted fabrics within a shared analytical space defined by selected structural, comfort-related, and functional parameters. It builds directly upon the experimentally validated structural and functional dataset previously reported in [26], extending the analysis from parameter-specific evaluation toward an integrated design-space interpretation. Thickness, air permeability, and optical response are used as representative descriptors to explore their interrelationships. The expected outcome is the identification of characteristic regions and trends that can inform structure-driven design decisions for functional knitted fabrics.
2. Materials and Methods
2.1. Materials
The present study is based on a set of twelve knitted samples differing in stitch architecture and yarn composition. An overview of the investigated samples, including pattern type, base yarn linear density, and the presence of photoluminescent and reflective yarn components, is provided in Table 1. The experimental measurements associated with these samples have been reported previously [26,27] and are used here exclusively as input data for exploratory design-space mapping.
The images in Table 1 represent the actual appearance of the knitted samples under standard laboratory lighting conditions, without magnification.
The cotton yarn used in this study is a commercially available 100% white cotton yarn (Bulgaria-Tex, Kazanlak, Bulgaria) intended for knitting.
Functional properties are introduced through the integration of two additional yarn types. The photoluminescent yarn is a continuous filament composed of polybutylene terephthalate (PBT) and polypropylene (PP), with a linear density of 150 × 2 dtex. The reflective yarn consists of a polyamide core coated with glass beads, with a linear density of 175 × 2 tex.
No additional pre-treatment of the yarns was performed prior to sample production.
2.2. Selection of Structural and Optical Parameters
The construction of a combined design space requires the selection of a limited set of parameters that are both physically meaningful and relevant for textile design decisions [24]. In the present exploratory methodology, parameters were chosen to represent three complementary domains: structural characteristics, related to fabric geometry and macrostructural development; comfort-related characteristics, associated with heat and mass transfer through the fabric; and optical characteristics, related to visibility and functional response under illumination.
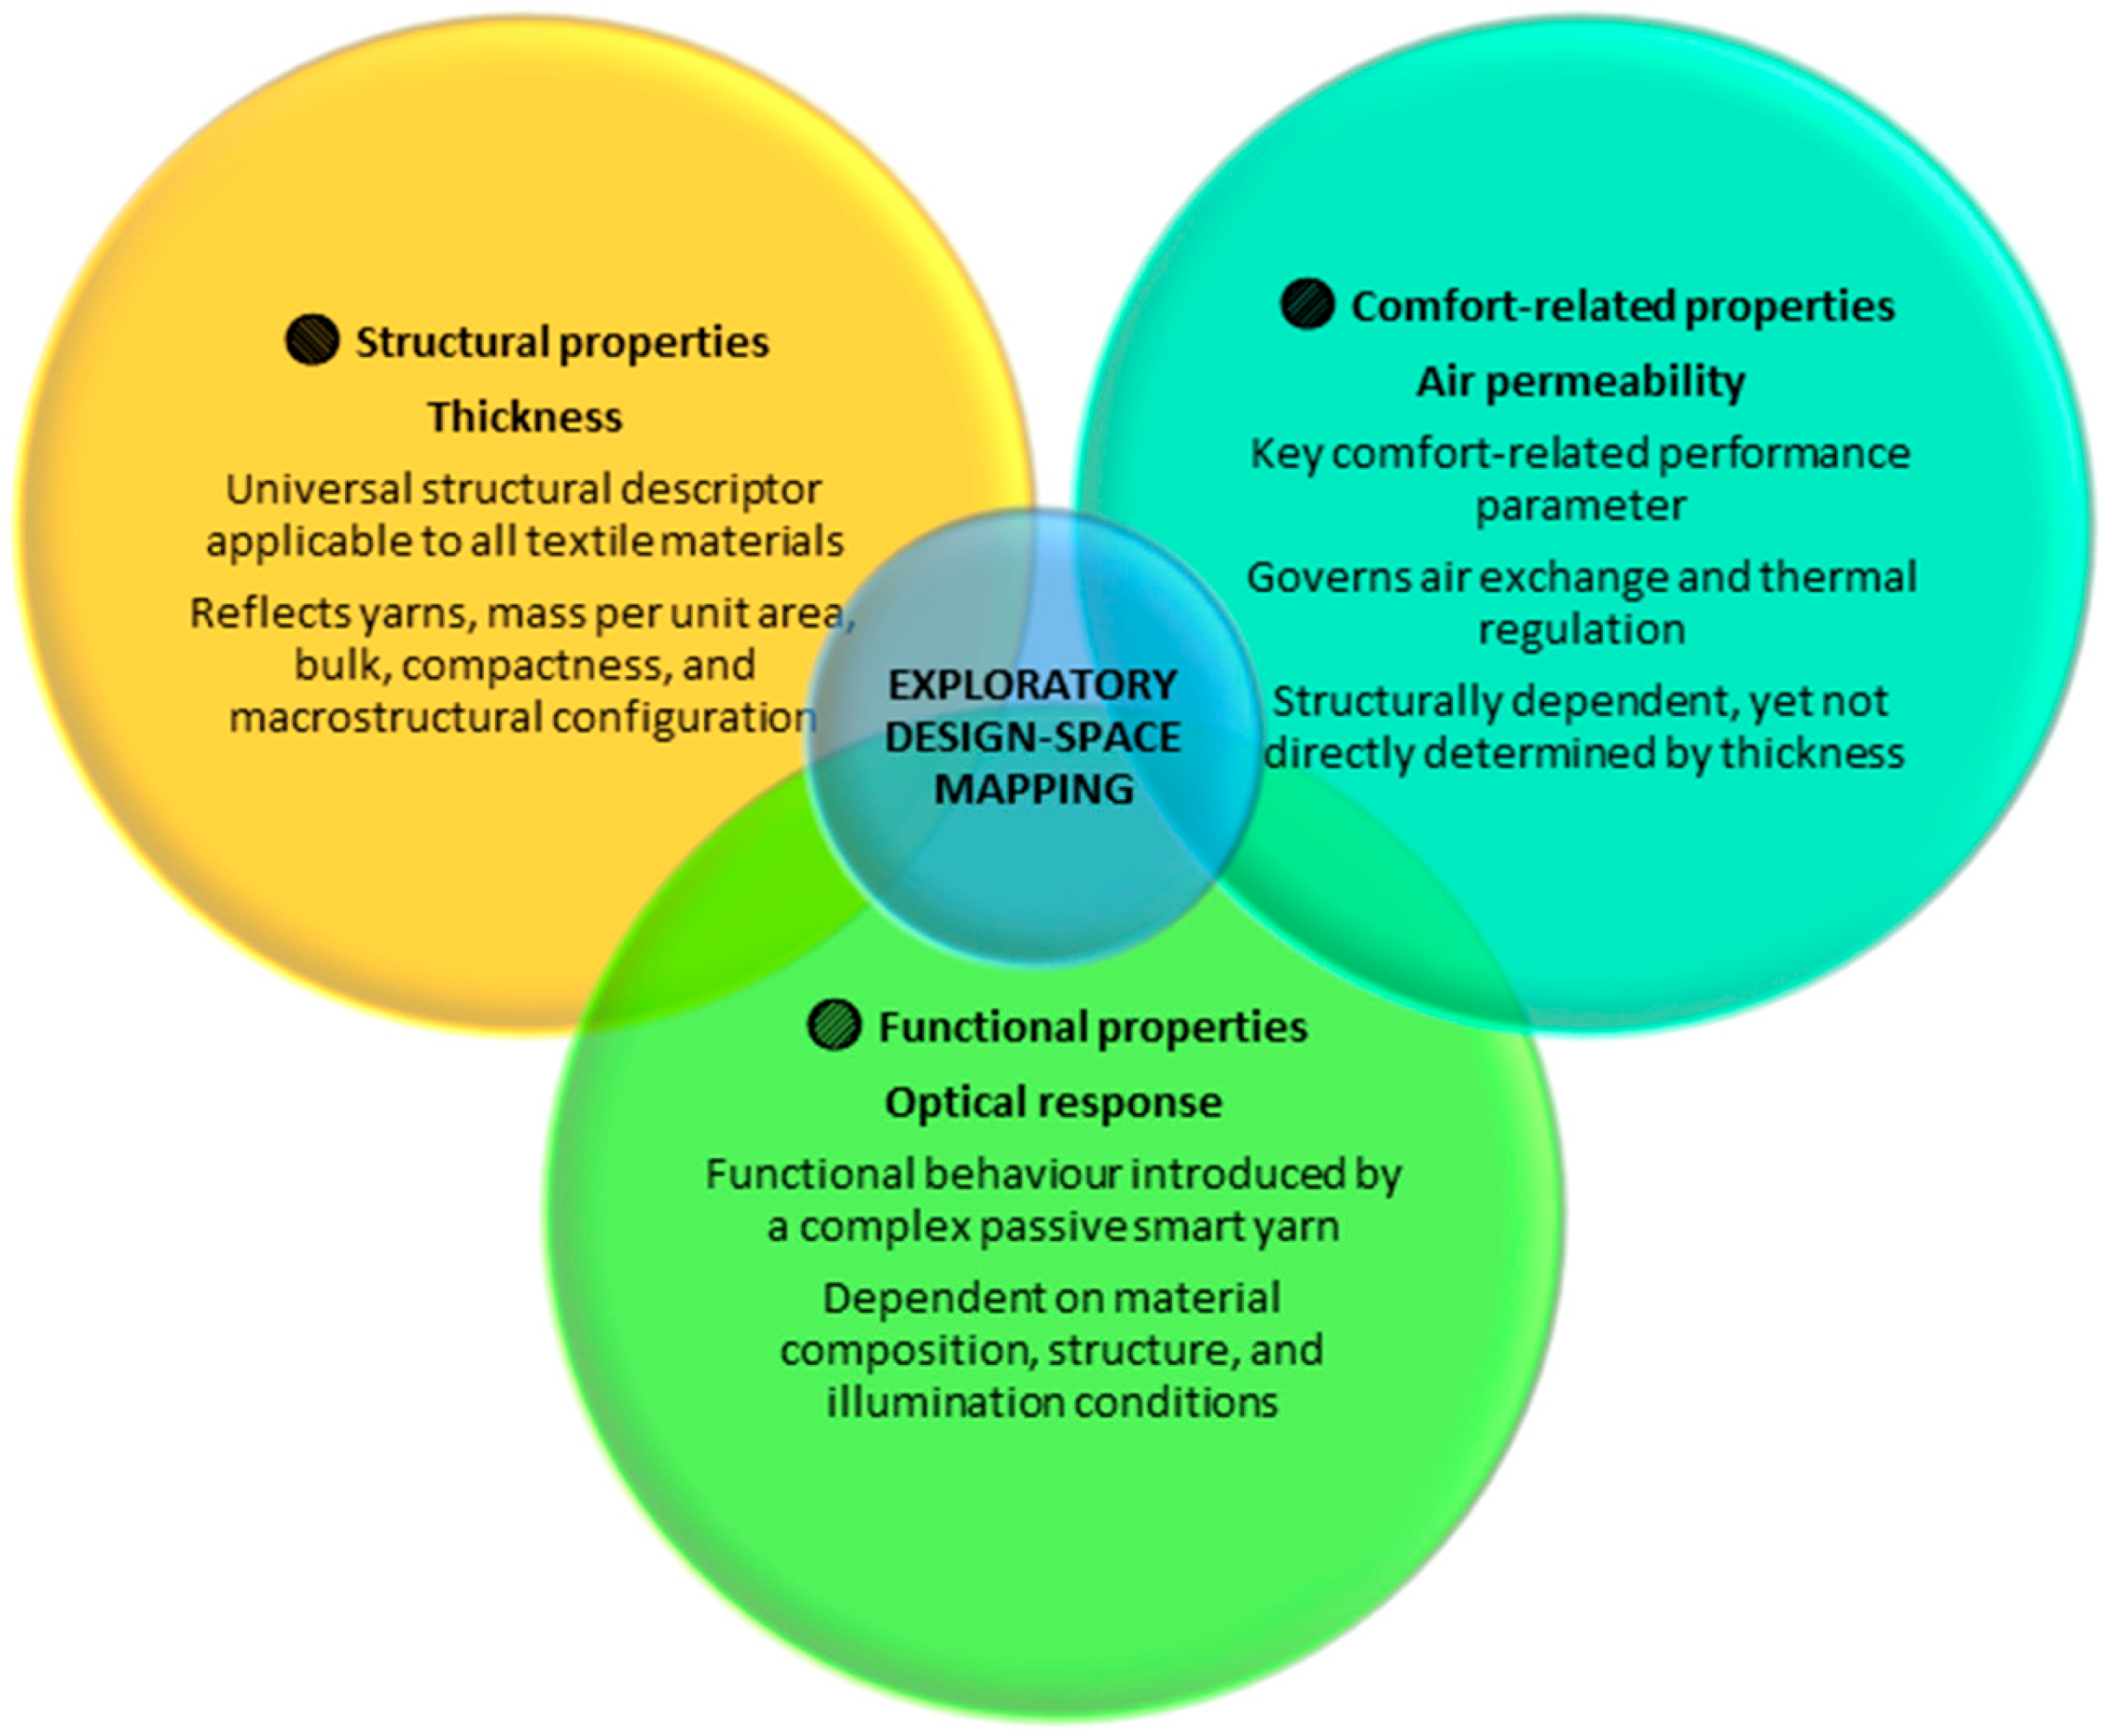
These three domains correspond to the conceptual structure illustrated in Figure 1, where structural, comfort-related, and functional properties intersect within a shared exploratory design space.
It should be clarified that in this study, optical parameters are treated as a specific subset of functional parameters, associated with visual performance under illumination.
The proposed approach focuses on a reduced set of parameters that enables intuitive interpretation and visual mapping, while maintaining direct links to measurable fabric behaviour. The selected parameters are treated as design variables and serve as the axes and visual encodings of the design space. The validity of the proposed approach lies in its interpretative consistency and in its ability to reveal non-obvious relationships within experimentally validated datasets, rather than in predictive or statistical performance.
2.2.1. Structural Parameters
Two structural parameters were selected to characterise the geometric development and transport-related behaviour of the knitted fabrics within the proposed design space:
Fabric thickness
Air permeability
Fabric thickness describes the overall spatial development of the knitted macrostructure and serves as a compact geometric descriptor of fabric bulk and compactness. Within the design-space framework, thickness is used to represent the degree of macrostructural development resulting from stitch type, yarn arrangement, and structural layering.
Air permeability represents the transport-related response of the knitted macrostructure and is used to characterise structural openness. In the context of the proposed methodology, air permeability functions as a complementary dimension to thickness, reflecting airflow-related behaviour associated with pore distribution and loop interconnection.
The combined use of thickness and air permeability defines a structural–comfort plane. Knitted fabrics are positioned in this plane according to their balance between macrostructural development and openness, enabling comparative analysis within the exploratory mapping framework.
2.2.2. Optical Parameter
To represent optical functionality, a single dimensionless parameter was selected: reflectance ratio. The reflectance ratio R is defined as [26]
where Em corresponds to the illuminance measured from the textile surface under defined illumination conditions (lx), and E0 represents the illuminance measured under identical conditions in the absence of the textile sample (lx).
Within the proposed methodology, the reflectance ratio is used to characterise the optical response of knitted fabrics associated with the incorporation of reflective and photoluminescent yarns into the macrostructure. As a relative and dimensionless parameter, it allows direct comparison between fabrics with different structural configurations and material compositions.
The reflectance ratio captures the combined influence of yarn composition, surface exposure, and macrostructural arrangement, while remaining suitable for visual representation within the exploratory design space. In this study, it is treated as a generic optical performance indicator and is not analysed as a function of illumination type or spectral distribution.
2.2.3. Rationale for Parameter Selection
The selected parameters satisfy three methodological criteria essential for exploratory design-space mapping. Similar approaches have been reported in engineering design and conceptual modelling research, where parameterised design spaces support systematic exploration, sensitivity analysis, and interpretable relationships between design features and performance outcomes [22,23,28]:
Design relevance. Each parameter corresponds to a property that can be intentionally influenced through yarn selection, structural configuration, or stitch pattern design.
Partial independence (orthogonality). Structural, comfort-related, and optical parameters capture different aspects of fabric behaviour and are not trivially reducible to one another, allowing complementary information to be represented within a shared analytical space.
Visual interpretability. The parameters can be meaningfully represented within two-dimensional maps and enhanced through additional visual encodings, facilitating comparative analysis and intuitive interpretation of design trends.
By restricting the parameter set to thickness, air permeability, and reflectance ratio, the proposed methodology avoids over-parameterisation and prioritises interpretability over exhaustive description [24]. This choice supports the exploratory nature of the study, where the objective is not optimisation but orientation within a multidimensional design landscape.
2.3. Normalisation and Dimensionless Representation
To enable meaningful comparison between structural and optical parameters with different physical units and numerical ranges, all selected variables were transformed into a normalised, dimensionless form prior to design-space construction. Such transformation is commonly employed in exploratory design-space mapping to ensure that parameters with different scales can be examined within a shared analytical framework. This step is essential, as it prevents any single parameter from dominating the visual interpretation due to scale effects rather than functional relevance [22,25].
In the proposed methodology, normalisation is applied to support comparability and visual interpretability within the design space. The analysis focuses on the relative positioning of knitted samples, which is consistent with the exploratory character of the study.
2.3.1. Normalisation Approach
Fabric thickness and air permeability, originally expressed in millimetres and metres per second respectively, were normalised using min–max scaling [29]:
where X represents the original measured value of the parameter, and Xmin and Xmax denote the minimum and maximum values observed within the dataset.
This transformation maps all structural parameters onto a common dimensionless range [0, 1], preserving the relative distances between samples while eliminating unit-dependent bias. As a result, differences between knitted macrostructures reflect relative structural behaviour rather than absolute magnitude [30].
The reflectance ratio, being inherently dimensionless, does not require unit conversion. However, for consistency in visual encoding across parameters, reflectance values are treated as relative indicators and scaled within the same normalised range when used for marker size in the design maps.
2.3.2. Rationale for Dimensionless Representation
The use of normalised, dimensionless parameters serves three key methodological purposes:
Cross-parameter comparability. Structural and optical parameters with fundamentally different physical meanings can be examined simultaneously without implicit weighting [31].
Dataset-independence. The mapping approach remains applicable to other datasets with different absolute ranges, supporting transferability of the methodology [32].
Visual neutrality. Normalisation ensures that the visual prominence of a parameter arises from its functional role, not from its numerical scale [33].
Importantly, the applied normalisation does not imply statistical equivalence or correlation between parameters. The mapped design space is intended as a qualitative–comparative tool, enabling the identification of clusters, extremes, and trade-off regions rather than quantitative optimisation [34,35].
2.3.3. Implications for Exploratory Analysis
Through operating in a normalised parameter space, the proposed methodology emphasises patterns of distribution and relative positioning of knitted fabrics. This representation facilitates exploratory interpretation of structural–optical relationships without imposing predefined performance hierarchies.
The dimensionless representation thus forms the foundation for the subsequent construction of combined design maps, allowing structural performance axes and optical encoding to be integrated within a coherent and interpretable visual framework.
2.4. Construction of the Combined Design Space
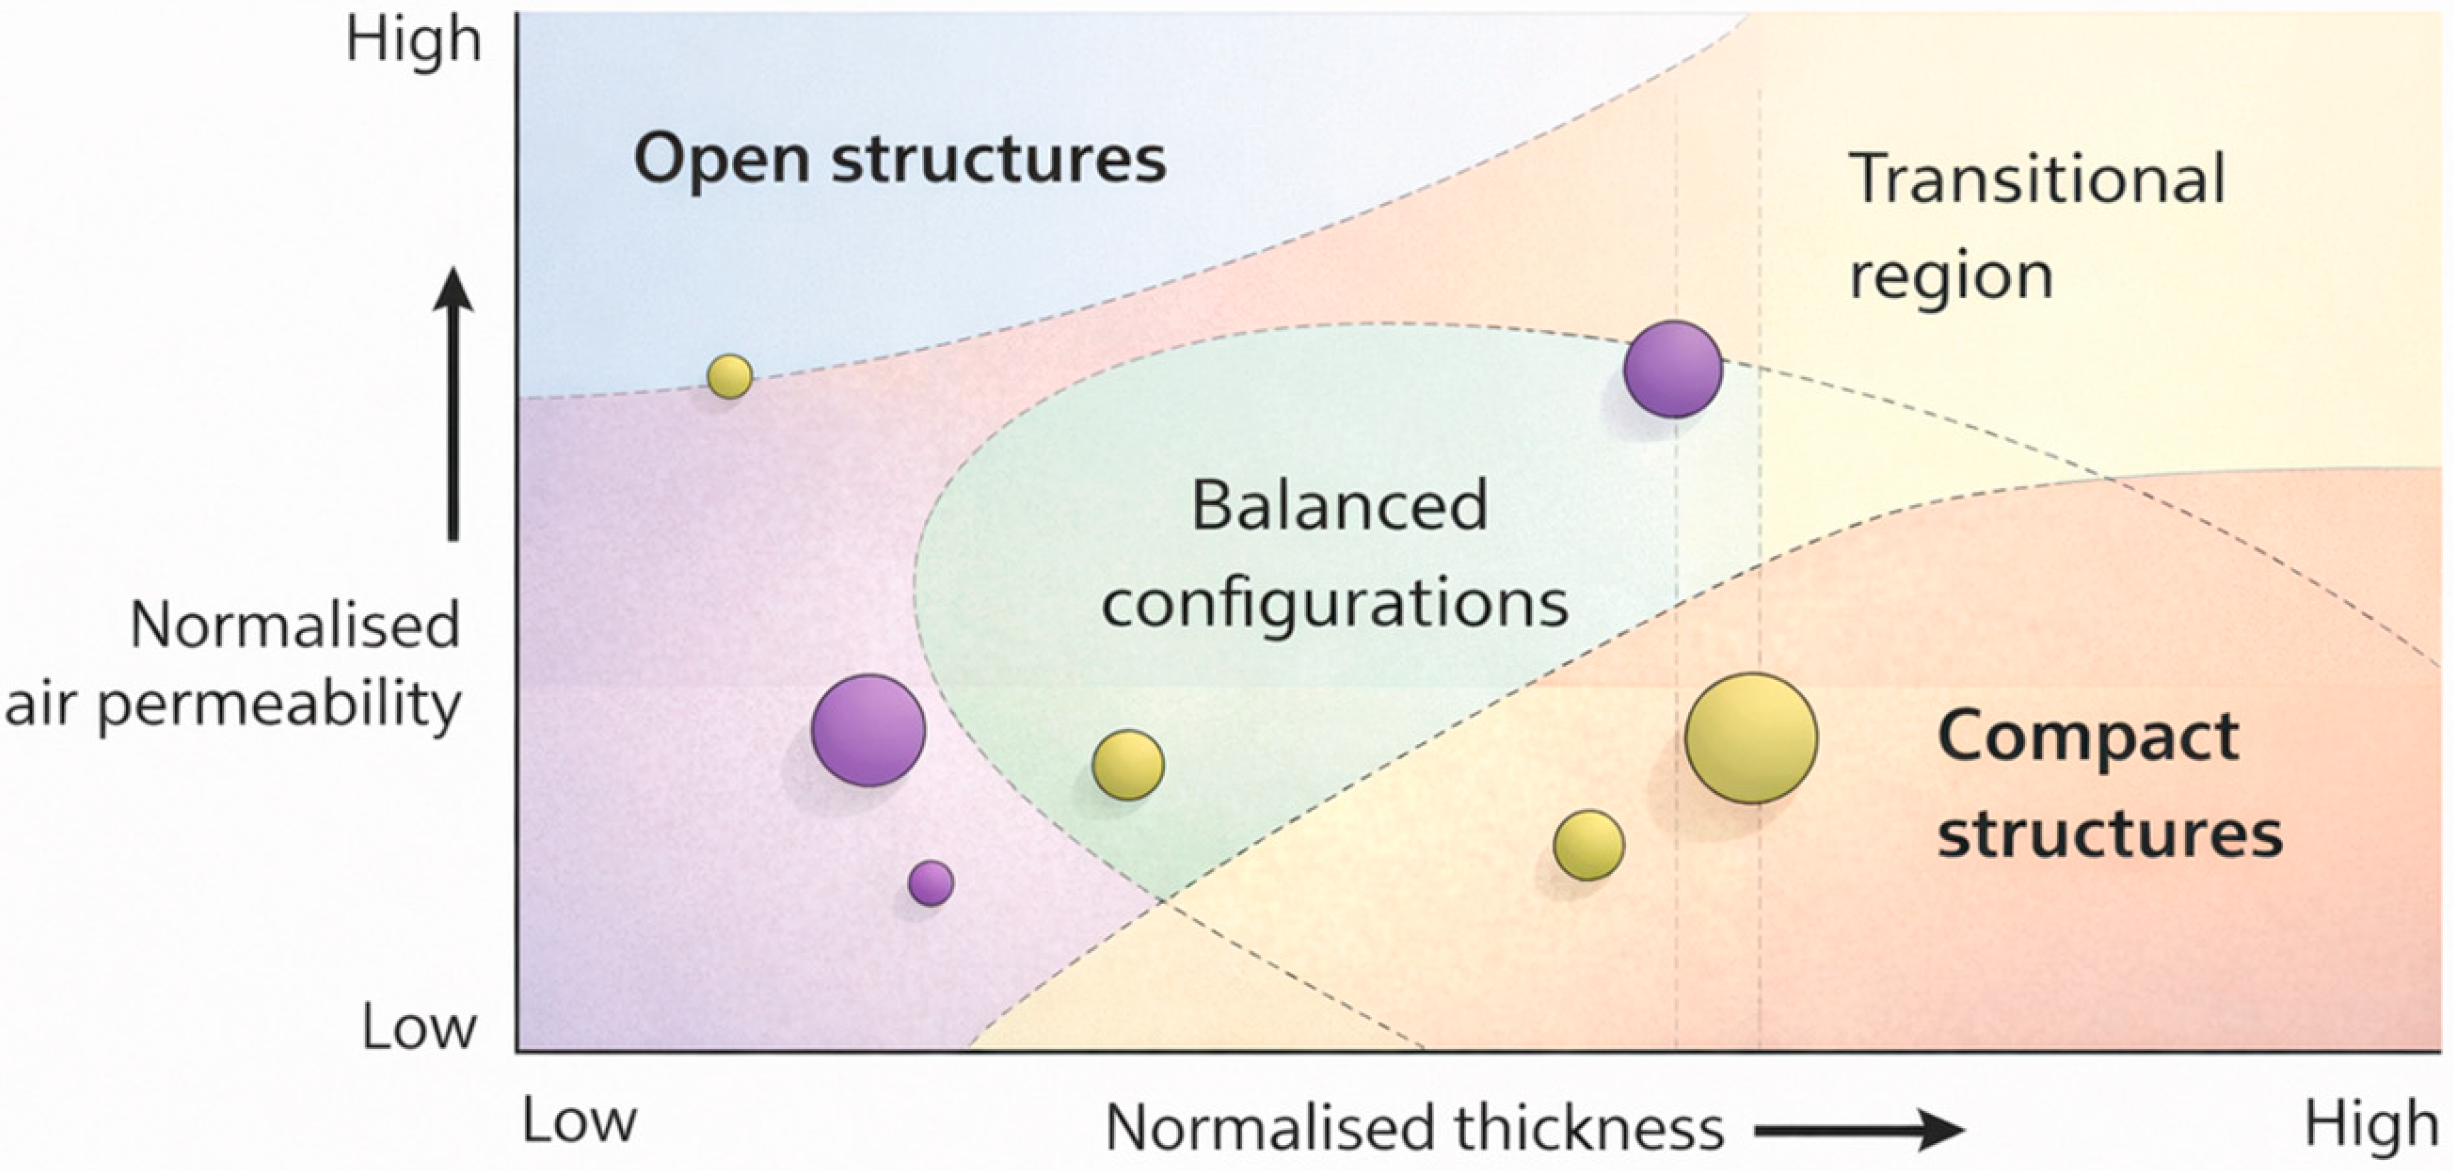
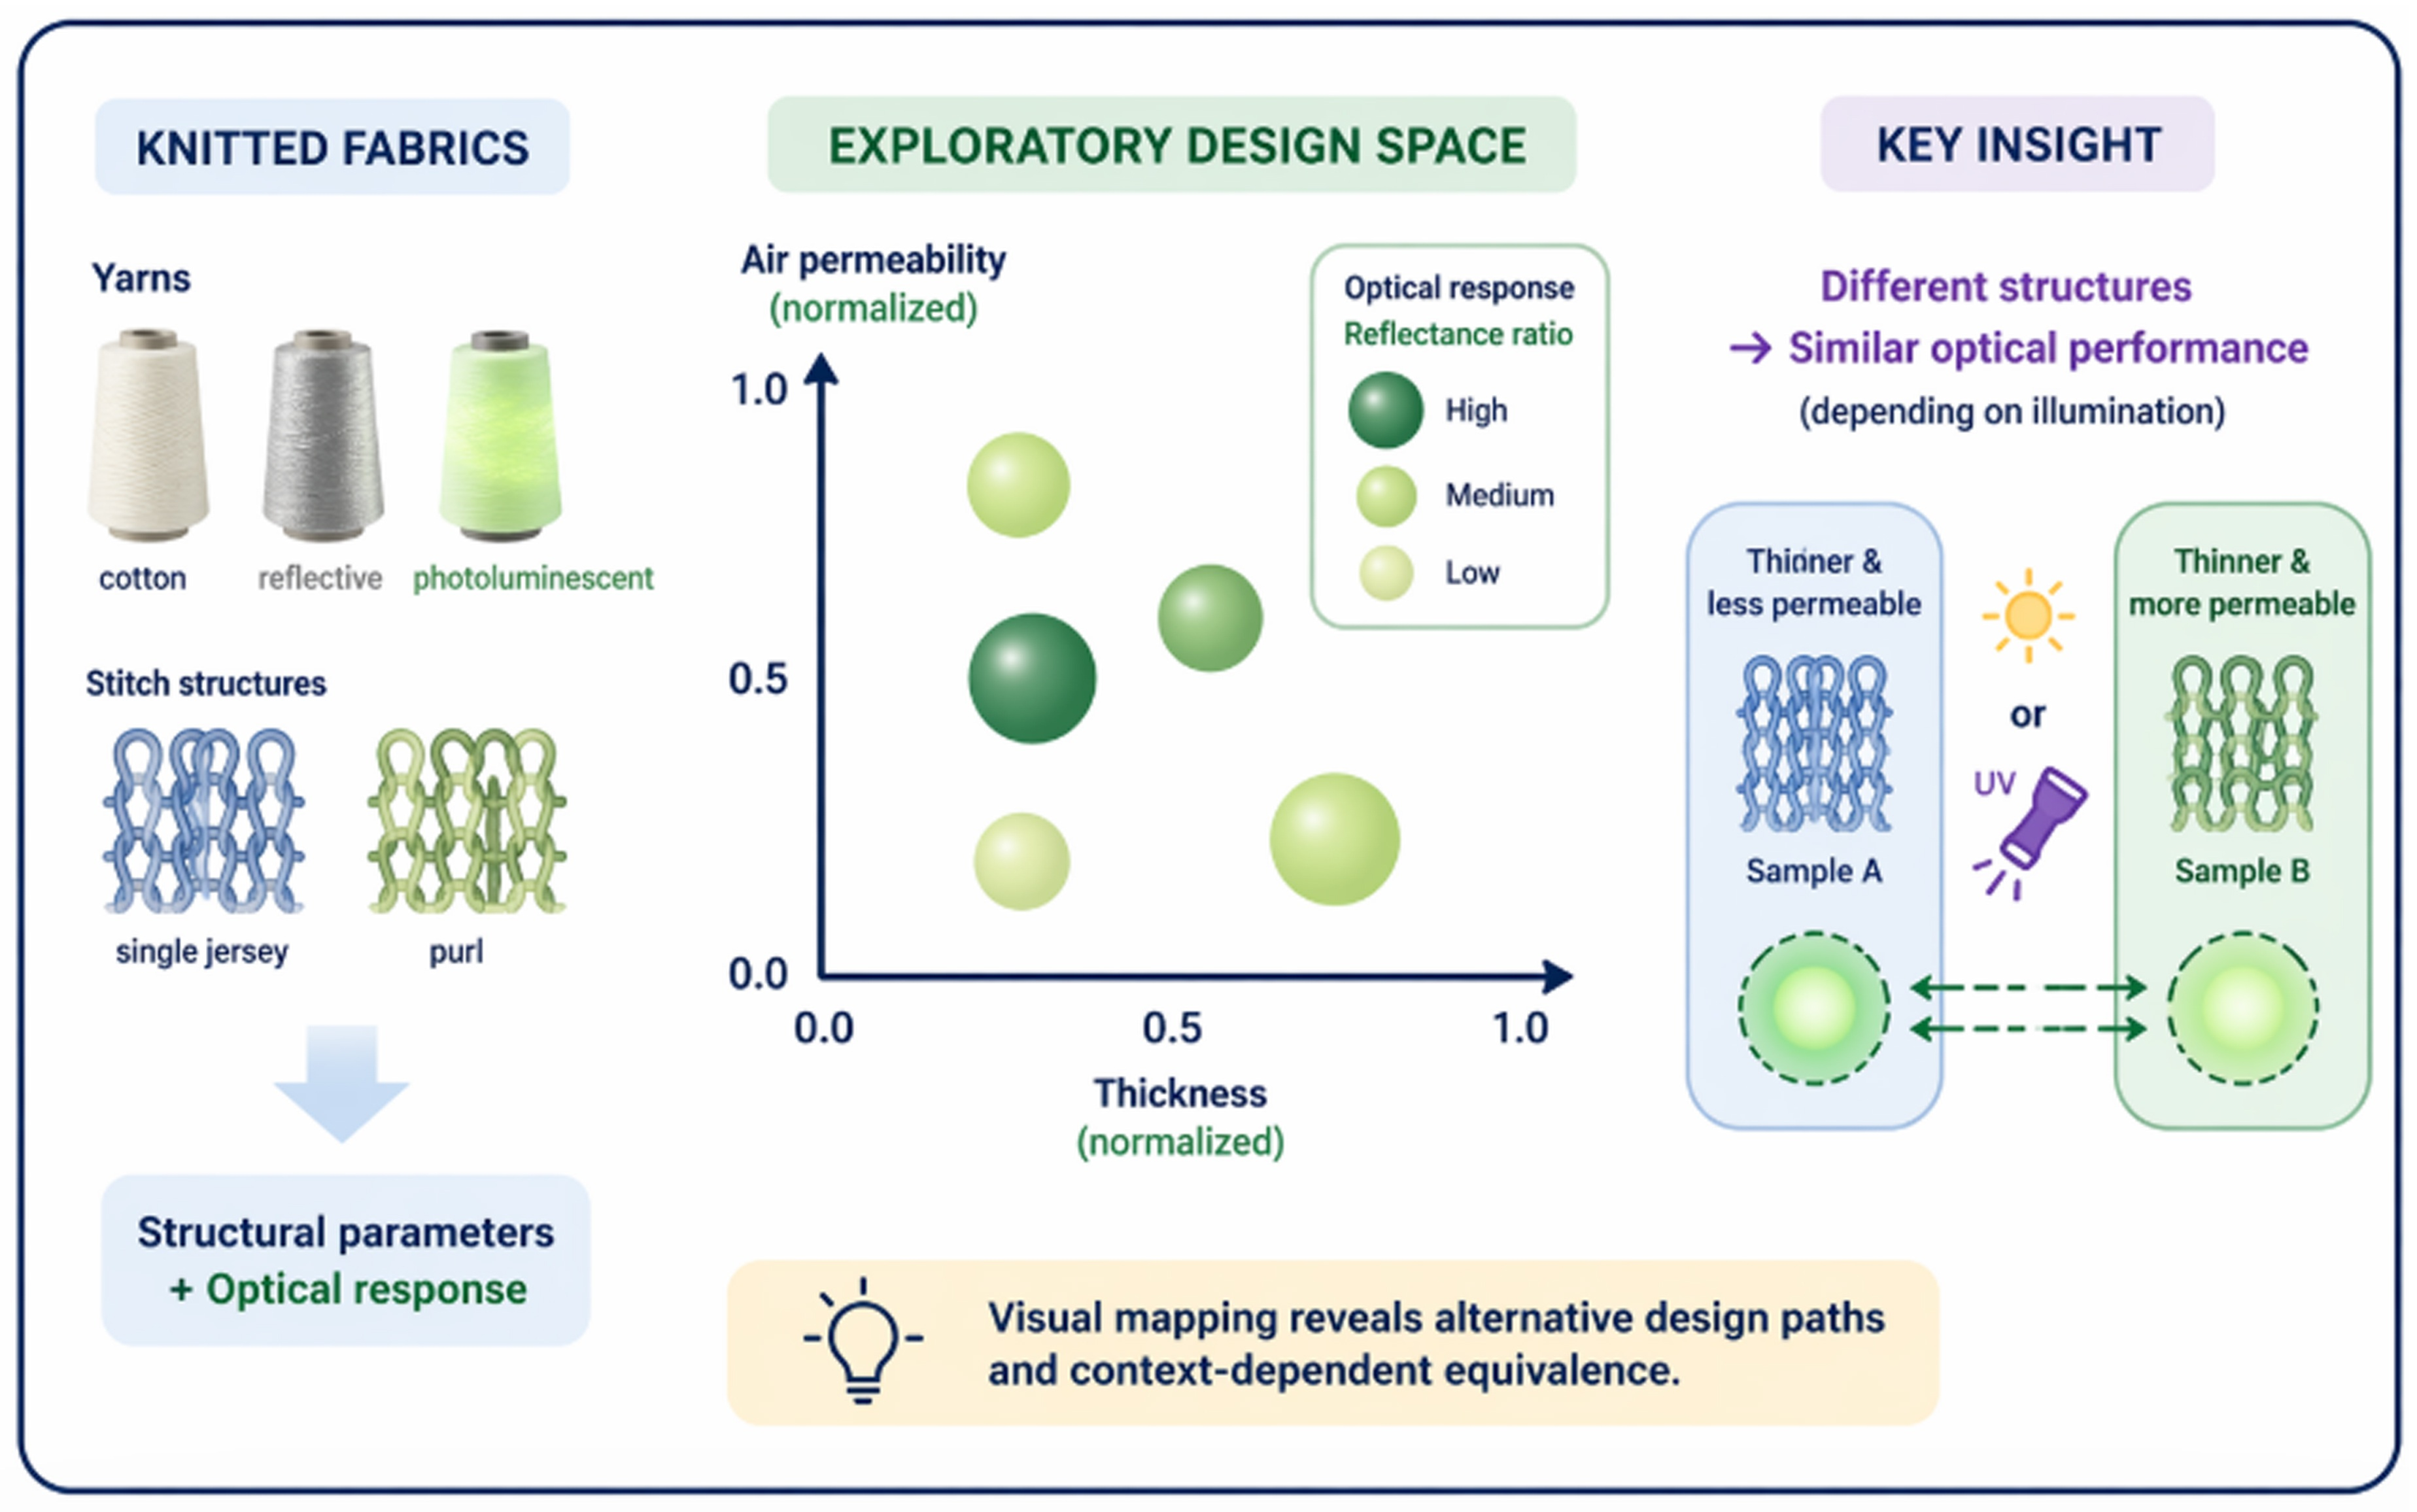
Following parameter selection and normalisation, a combined design space was constructed to enable the simultaneous representation of structural and optical characteristics of knitted fabrics. The overall logic of the design-space construction and visual encoding is summarised schematically in Figure 2, which illustrates the integration of normalised structural axes and optical performance encoding within a unified exploratory framework [25].
The design space is conceived as a conceptual and visual framework, supporting exploratory analysis and design-oriented interpretation, rather than as a statistical or predictive model.
2.4.1. Definition of Design-Space Axes
The combined design space is defined by two orthogonal structural axes:
X-axis: normalised fabric thickness
Y-axis: normalised air permeability
These axes establish a two-dimensional structural plane in which each knitted sample is positioned according to its relative balance between bulk and breathability. This structural plane forms the geometric basis of the design space shown in Figure 2.
The use of thickness and air permeability as orthogonal dimensions enables macrostructures with similar mass per unit area or yarn composition to be distinguished based on differences in structural openness and airflow behaviour [22].
The resulting plane does not imply causal relationships or optimisation directions. Instead, it represents a structural landscape, in which relative positions reflect differences in macrostructural configuration and airflow-related characteristics.
2.4.2. Optical Performance Encoding
Optical performance is integrated into the design space through visual encoding, rather than as an additional geometric axis. The reflectance ratio could be mapped onto marker attributes such as size, colour or intensity. In this particular case, the marker size is used to represent the magnitude of textiles’ optical response.
This approach preserves the two-dimensional readability of the design space while enabling optical functionality to be examined in conjunction with structural behaviour [35]. By avoiding the introduction of a third geometric axis, visual complexity is reduced and interpretability is maintained [25].
Importantly, the reflectance encoding is intended to communicate relative optical behaviour, not absolute performance ranking. The design space therefore supports comparison across samples without introducing implicit optimisation criteria.
2.4.3. Representation of Knitted Samples
Each knitted sample is represented as a single point within the design space, defined by its normalised thickness and air permeability values. This point-based representation enables direct comparison of samples within the shared analytical space defined in Figure 2. Samples sharing similar structural behaviour appear in proximity, while structurally distinct macrostructures occupy separate regions of the map.
When combined with optical encoding, clusters, gradients, and outliers become visually apparent, allowing regions of the design space to be interpreted in terms of characteristic structural and functional trade-offs, such as (Figure 2):
compact structures (high thickness) with limited breathability,
balanced structural performance, or
open structures with enhanced airflow.
No predefined region boundaries are imposed; instead, such regions emerge naturally from the distribution of samples within the mapped space [25].
2.4.4. Interpretative Logic of the Design Space
The constructed design space is intended as an exploratory and interpretative tool, rather than a predictive or evaluative model. Its primary purpose is to support qualitative reasoning, enabling designers and engineers to:
identify structurally efficient or inefficient regions,
recognise trade-offs between structural compactness and optical response, and
compare alternative macrostructural solutions within a unified framework.
The interpretative value of the design space lies in its ability to integrate multiple performance dimensions into a single visual representation, facilitating design-oriented insight rather than quantitative optimisation [28,35].
2.4.5. Methodological Scope and Limitations
The constructed design space is inherently dataset-dependent, reflecting the specific range of yarn compositions and knitted macrostructures included in the present study. Nevertheless, the underlying mapping logic illustrated in Figure 2 is transferable and can be applied to other textile systems by selecting appropriate structural axes and performance encodings [22].
No statistical inference or extrapolation beyond the mapped samples is implied. The design space serves as a conceptual and comparative representation, supporting exploratory understanding of complex structure–function relationships in the investigated functional knitted macrostructures.
2.5. Interpretation Rules
This encoding strategy, described in Section 3.3, enables simultaneous perception of structural balance and optical behaviour while preserving a clear two-dimensional layout. The chosen representation prioritises readability and comparative insight over graphical complexity.
2.5.1. Interpretation Principles
The design maps are intended to support qualitative exploratory interpretation. The following principles govern their use:
Relative, not absolute interpretation. Marker positions and sizes reflect relative differences between samples within the dataset. The maps do not convey absolute performance rankings or threshold-based classifications.
Emergent regions rather than predefined zones. Regions of the design space are not defined a priori. Instead, clusters, sparse areas, and gradients emerge from the distribution of samples and may be interpreted post hoc in relation to structural efficiency or trade-offs.
Trade-off identification. The maps enable visual identification of trade-offs between structural compactness (thickness), breathability (air permeability), and optical response. Samples exhibiting similar structural positioning but differing optical encoding highlight the influence of yarn composition, while structurally separated samples with comparable optical encoding indicate macrostructural effects.
No implied causality. Spatial proximity or separation within the design space does not denote causal relationships between parameters. The maps are descriptive and comparative, not predictive.
2.5.2. Scope and Limitations of Interpretation
The design-space maps do not support statistical inference, optimisation, or extrapolation beyond the investigated samples. They are not intended to define optimal solutions or universal design rules. Instead, their function is to provide orientation within a multidimensional design landscape, enabling informed reasoning and hypothesis generation.
Interpretation depends on the specific dataset and reflects the selected parameter ranges, yarn compositions, and knitted macrostructures. However, the visual logic and interpretation framework are transferable and may be applied to other textile systems by adapting the selected axes and encoding parameters.
2.5.3. Design-Oriented Relevance
By explicitly defining visual encoding and interpretation rules, the proposed methodology bridges experimental characterisation and design reasoning. The resulting maps can be used as decision-support tools, assisting designers and engineers in comparing alternative macrostructural solutions, identifying promising regions for further exploration, and balancing functional requirements in multifunctional knitted fabrics.
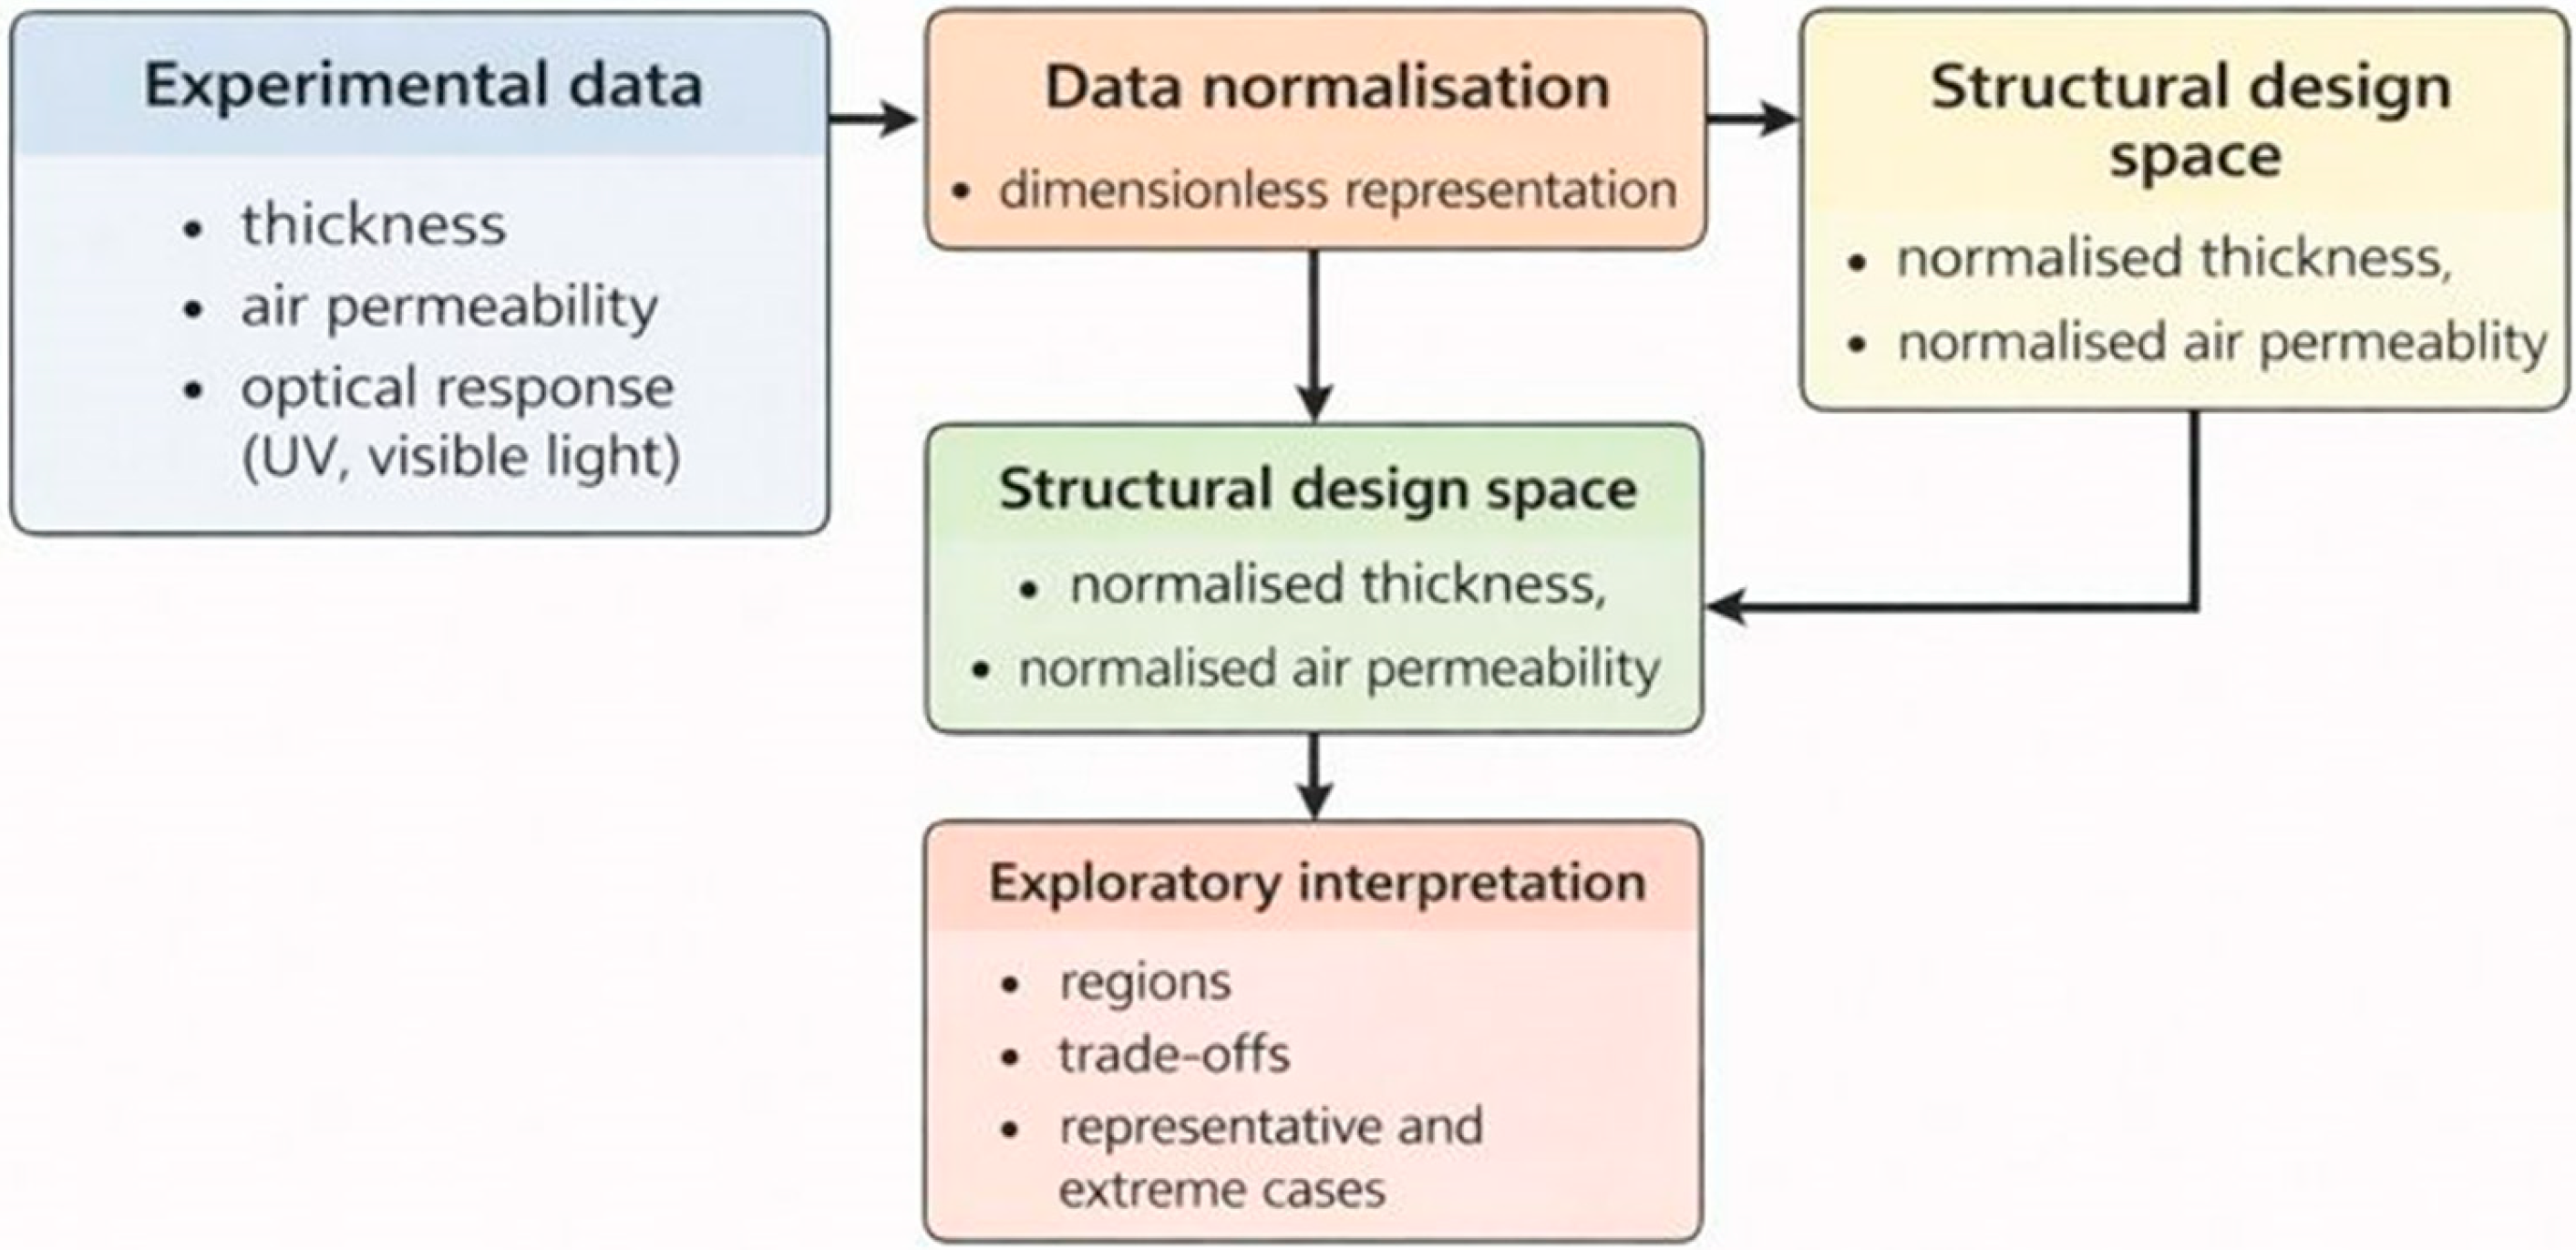
The overall workflow of the proposed exploratory design-space mapping methodology is summarised in Figure 3. The transformation of experimental structural and optical data through normalisation into a combined structural design space is illustrated, followed by exploratory interpretation based on spatial distribution, regions, and representative cases. This schematic overview clarifies the relationship between data processing steps and the subsequent visual analysis presented in Section 4.
3. Results—Exploratory Design Map
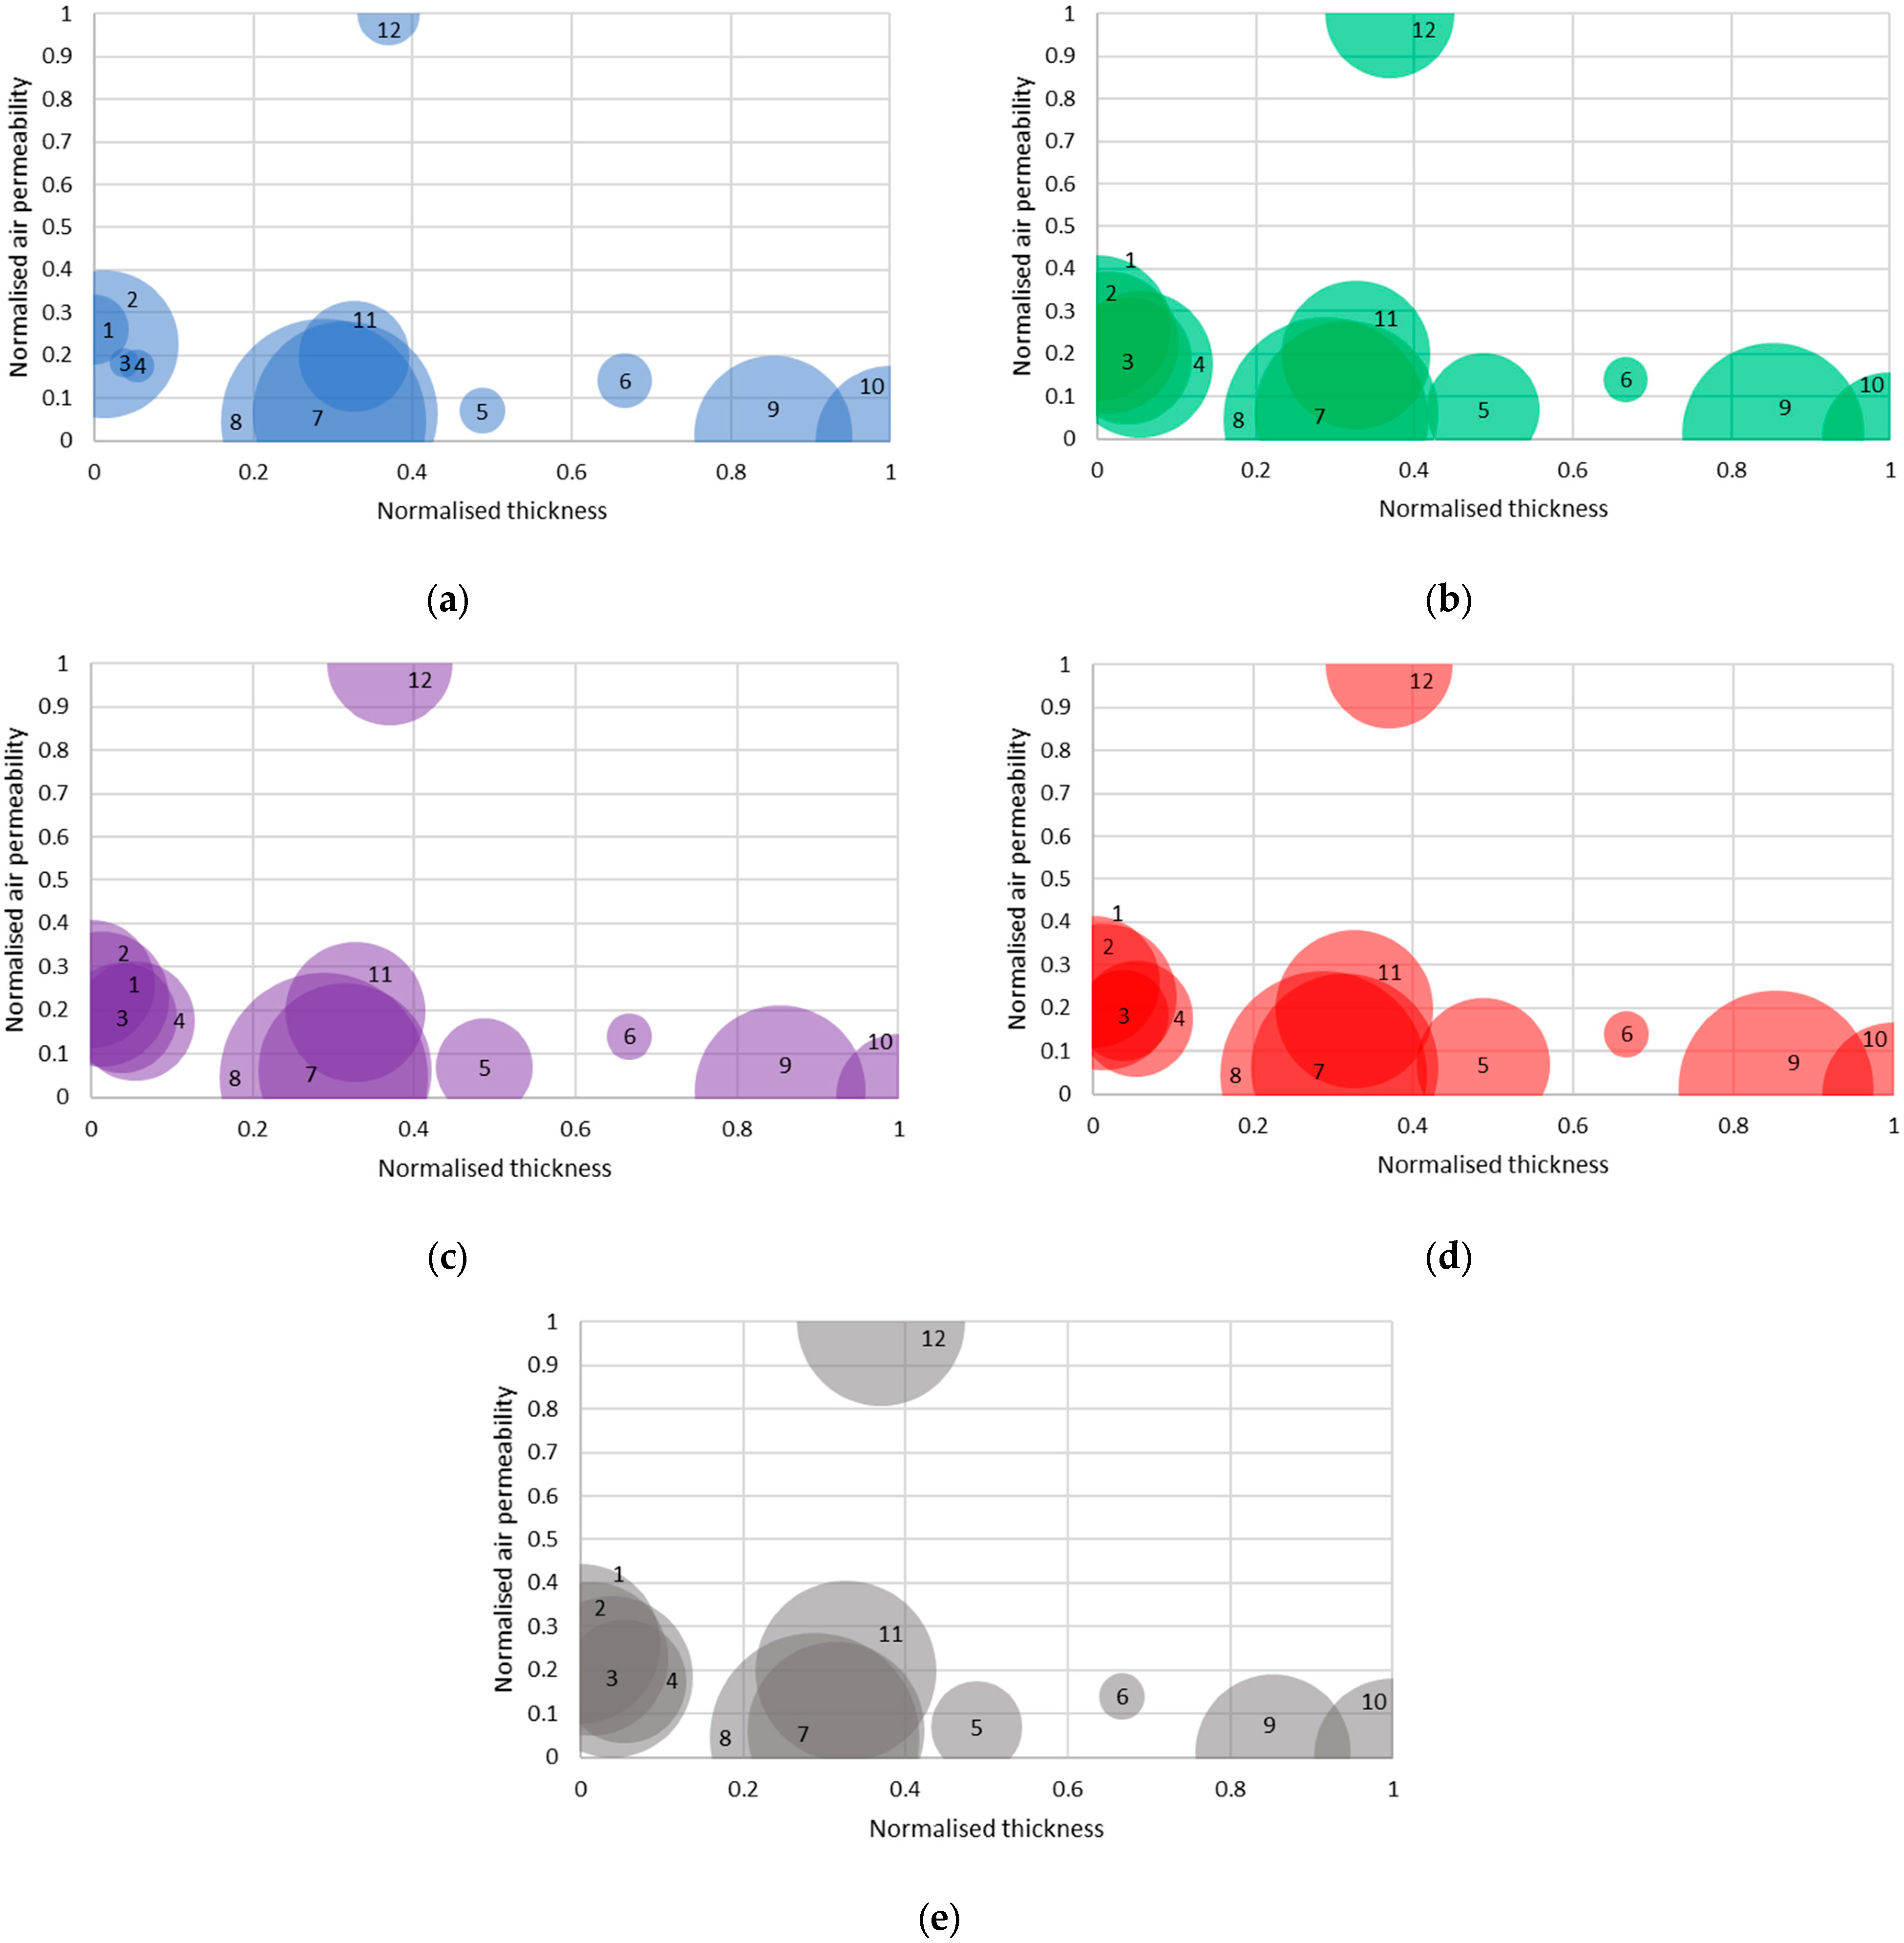
The constructed design-space maps provide a visual overview of how the investigated knitted fabrics are distributed with respect to their combined structural and optical characteristics. The analysis focuses on spatial patterns, relative positioning, and emergent regions within the mapped design space, as illustrated in the exploratory design maps in Figure 4a–e.
3.1. Distribution of Knitted Fabrics Within the Structural Design Space
When projected onto the normalised thickness–air permeability plane, the knitted samples exhibit a distinctly non-uniform spatial distribution, reflecting the diversity of macrostructural configurations included in the dataset (Figure 4a–e). The overall geometric arrangement of samples remains identical across all subfigures, confirming that the structural design space is defined independently of the optical encoding.
Samples characterised by compact or multilayered stitch configurations are predominantly located in regions associated with higher normalised thickness and reduced air permeability, occupying the right-hand and lower portions of the design space (e.g., Samples 9 and 10 in Figure 4a–e). In contrast, samples with more open macrostructures and reduced material compactness are positioned towards lower thickness values and higher air permeability, forming a distinct cluster on the left-hand side of the maps (Samples 1–4).
Notably, samples with comparable thickness values do not necessarily align at similar vertical positions within the design space. For instance, Samples 7, 8, and 11 exhibit closely grouped thickness values while occupying different positions along the air permeability axis (Figure 4a–e). This vertical separation indicates that air permeability is not governed by thickness alone, but is strongly influenced by the specific loop geometry and pore arrangement within the knitted macrostructure.
The observed spatial dispersion demonstrates that the proposed design space effectively differentiates between fabrics that would otherwise appear similar when evaluated using a single structural descriptor. As a result, the thickness–air permeability plane provides a meaningful structural framework for subsequent overlay of optical performance indicators.
3.2. Optical Performance Patterns Within the Design Space
When optical response is overlaid onto the structural design space using marker size encoding, differences between knitted samples become visible (Figure 4a–e). Samples located at similar positions in the normalised thickness–air permeability plane often display different marker sizes, indicating that optical response is not directly determined by structural position alone.
Samples 1 and 2, which do not contain a reflective yarn component, consistently exhibit the smallest marker sizes across all illumination conditions (Figure 4a–e). These samples occupy structural positions close to Samples 3 and 4, but their optical response remains clearly lower in all design maps.
In contrast, Samples 3–12, all of which include a reflective yarn component, show larger marker sizes across the design space. These samples are distributed over both compact and more open structural regions, demonstrating that enhanced optical response is observed across a wide range of macrostructural configurations (Figure 4a–e).
A comparison between the five design maps obtained under different illumination conditions reveals that marker sizes vary for individual samples between figures, while their structural positions remain unchanged. This effect is particularly evident for Samples 5 and 12, which show noticeably larger marker sizes in the UV illumination map (Figure 4a) compared to the remaining illumination conditions (Figure 4b–e).
Similar marker sizes are also observed for samples located at different structural positions. For example, Samples 6 and 9 exhibit comparable marker sizes despite differences in both normalised thickness and air permeability (Figure 4b–e). This observation indicates that similar levels of optical response can be achieved through different macrostructural solutions.
Samples with similar stitch structures tend to form local clusters within the thickness–air permeability plane. Within these structural clusters, variations in marker size are observed between samples, reflecting differences in yarn composition rather than changes in macrostructure.
Taken together, these observations show that optical response represents an additional, independent dimension within the mapped design space. The design maps enable comparison of optical behaviour between structurally similar samples and across different illumination conditions without introducing performance ranking or optimisation assumptions.
3.3. Emergent Regions and Trade-Off Tendencies
The exploratory design-space maps make visible several spatial regions associated with distinct combinations of structural parameters and optical response (Figure 4a–e). These regions are identified through the distribution of samples within the mapped space, without reference to individual sample behaviour.
Within the central area of the design space, samples are distributed around intermediate values of both normalised thickness and air permeability, forming a concentration zone without pronounced extremes along either axis.
A clearly defined region in the upper-left portion of the maps corresponds to samples combining lower thickness with higher air permeability, while the lower-right region of the design space is occupied by samples characterised by higher thickness and reduced air permeability (Figure 4a–e).
When optical encoding is considered across these regions, no consistent monotonic relationship is observed between structural position and marker size. Similar marker sizes appear in different structural regions, and within the same region, samples may display different marker sizes.
The spatial overlap of marker sizes across regions indicates the presence of multiple structure–optical combinations within the mapped space. These patterns are observed consistently across the design maps shown in Figure 4a–e.
3.4. Identification of Representative and Extreme Cases
Within the mapped design space, several samples occupy peripheral positions that correspond to extreme combinations of structural parameters and optical response (Figure 4a–e). Samples located near the boundaries of the thickness–air permeability plane define the practical limits of the investigated configurations and serve as reference points for interpreting intermediate cases.
Samples positioned at high normalised air permeability values represent highly open macrostructures with pronounced airflow characteristics. Sample 12 occupies the uppermost position in the design space (highest normalised air permeability) across all subfigures (Figure 4a–e). Its spatial isolation emphasises the distinction between its highly permeable macrostructure and the rest of the dataset.
Conversely, samples characterised by high normalised thickness and low air permeability define the opposite extremes of the design space, corresponding to dense or multilayered macrostructural arrangements. Samples 9 and 10 occupy the far-right region (highest normalised thickness) with low normalised air permeability (Figure 4a–e). These samples consistently appear in the lower-right region of the maps and provide a contrasting reference for evaluating configurations positioned closer to the central regions.
In addition to structural extremes, certain samples exhibit pronounced optical encoding relative to their surrounding neighbours within the design space. The largest marker sizes are observed for Sample 12 in Figure 4a, while Samples 9 and 10 show consistently large marker sizes in the high-thickness region (Figure 4a–e).
The identification of representative and extreme Samples contributes to a clearer reading of the design maps by anchoring the spatial distribution and facilitating comparison between central and boundary regions within the combined structural–optical design space. As a representative intermediate case, Sample 11 is in the central region of the plane (intermediate thickness and intermediate air permeability) and can be used as a reference for comparing shifts toward the open (Sample 12) and compact (Samples 9–10) extremes (Figure 4a–e).
4. Discussion
Conventional approaches in textile research are typically based on the analysis or optimisation of individual parameters, such as air permeability, thermal resistance, or mechanical properties. In contrast, the present approach integrates heterogeneous parameters within a unified design-space representation, enabling exploratory interpretation of relationships between structurally and functionally different configurations.
This shifts the focus from optimisation to interpretability and design-oriented reasoning.
4.1. Clusters Defined by Spatial Distribution in the Design-Space Maps
Analysis of the design-space map (normalised thickness versus normalised air permeability) make visible clearly defined visual clusters that do not fully coincide with the theoretical grouping based on yarn composition. This indicates that parameters other than material composition play a leading role in spatial positioning, even when the yarn system is identical.
Based on the actual spatial distribution in the map, three main visual clusters and three structurally isolated samples can be identified.
Visual cluster 1: Samples 1–2–3–4.
Samples 1, 2, 3, and 4 are grouped in a region characterised by low normalised thickness and low to moderate air permeability. Although Samples 1–2 and 3–4 differ in the presence of a reflective yarn, they share a similar macrostructural configuration, which results in close spatial positioning. This cluster shows that, for a thin cotton base yarn (264 tex), structural parameters dominate over the effect of functional yarns in determining the position in the design-space map. Differences in optical response between Samples 1–2 and 3–4 are mainly expressed through marker size, while their positions in the thickness–air permeability plane remain closely aligned.
Visual cluster 2: Samples 7–8–11
Samples 7, 8, and 11 form a second distinct cluster, located at intermediate normalised thickness and low air permeability. These samples use a thicker cotton base yarn (400 tex) and contain both photoluminescent and reflective yarns, while differing in stitch architecture. The fact that Sample 11 (single jersey with float) is grouped together with Samples 7 and 8 (single jersey) indicates that float elements modify the optical response, but in this case are not sufficient to shift the structure outside this spatial region. Here, the cluster results from a combination of thick yarn and a relatively compact macrostructure.
Visual cluster 3: Samples 9–10
Samples 9 and 10 form a compact cluster in the region of high normalised thickness and very low air permeability, which is characteristic of dense and massive macrostructures (purl and double jersey produced with thick cotton yarn, 400 tex). This cluster clearly defines the dense structural region of the design-space map and serves as a reference for comparison with more open configurations.
Structurally isolated samples: 5, 6, and 12
In addition to the visual clusters, the map shows three individual samples that are spatially separated from their “theoretical counterparts” based on yarn composition. Sample 5 (purl, cotton yarn 264 tex) is shifted towards higher thickness compared to other structures made with thin cotton yarn. This shows that stitch architecture alone can move a structure outside the expected cluster. Sample 6 (double jersey, cotton yarn 264 tex) occupies an intermediate position, distinct from both the thin-yarn cluster and the dense thick-yarn cluster. This highlights the strong effect of the double jersey structure, even when a thin base yarn is used. Sample 12 represents a clear structural extreme, positioned at very high air permeability, although it functionally belongs to the group with thick cotton yarn and functional yarns. This shows that a highly open macrostructure, resulting from lace-like effects of the modified purl stitch, can dominate over the material system and shift the sample outside the main cluster.
4.2. Visual Clusters Versus Design Logic in Experimental Planning
After identifying the visual clusters in the design-space map, it becomes clear that the grouping of samples does not fully correspond to the initial design logic based on identical stitch structures or identical yarn systems. For example, samples with the same stitch type (single jersey or purl) or identical yarn composition are distributed across different regions of the map, while samples with different stitch architectures or yarn systems may appear spatially close.
This mismatch indicates that structural positioning is governed by the combined effect of thickness, porosity (air permeability), and macrostructural compactness, rather than by stitch type as an isolated parameter. From a design perspective, stitch architecture functions as a local modifier of behaviour, but not as a primary criterion for global distribution within the structural space.
In this sense, the design-space maps do not reproduce predefined categories, but instead reveal new, empirically emerging groupings that may differ from the original design expectations. This confirms the exploratory nature of the approach and its value as a tool for early-stage design, where the objective is not classification, but the identification of unexpected structural relationships.
4.3. Illumination-Specific Convergence of Optical Response Outside the Visual Clusters
In addition to the visual clusters, the design-space maps allow the identification of individual samples that exhibit a similar optical response under a specific type of illumination, despite substantial differences in stitch architecture, thickness, and air permeability. These cases appear as identical or nearly identical marker sizes within a single figure. Representative examples include the following.
UV illumination.
Under UV illumination (Figure 4a), a pronounced convergence is observed between Samples 1 and 12, which show very close normalised values (0.115 and 0.094). Despite this similar optical response, the two samples are structurally opposite. Sample 1 is a thin single jersey structure with low thickness and no reflective yarn, whereas Sample 12 represents a highly open, thick structure with a modified purl stitch and high air permeability. This result indicates that, under UV excitation, different structural and material mechanisms can lead to a similar optical response, without implying a common mechanism or equivalence of functional yarn systems.
Daylight (D65).
Under daylight conditions (Figure 4b), the case of Samples 1 and 4 is particularly illustrative. These samples exhibit almost identical optical responses (0.519 and 0.515), although Sample 4 contains a reflective yarn and Sample 1 does not. They also differ in structural compactness, yet appear optically similar under this illumination. This result suggests that, under broad-spectrum daylight, the contribution of the reflective yarn can be partially compensated by structural factors, leading to visually similar emission for different material solutions.
OPT/Store light.
Under OPT illumination (Figure 4c), convergence is observed between Samples 10 and 12 (0.362 and 0.358). The two samples occupy different regions of the design-space map. Sample 10 is a dense double jersey structure with low air permeability, whereas Sample 12 is an extremely open structure. This example shows that, under specific spectral conditions, structural compactness is not the dominant factor for optical response, and that different macrostructural pathways can lead to a similar visual outcome.
Store light.
Under store light illumination (Figure 4d), a clear similarity is observed between Samples 5 and 12 (0.417 and 0.378). Sample 5 is a purl structure produced with a thin cotton yarn, whereas Sample 12 is produced with a thick cotton yarn but features a highly open modified purl structure. Despite these differences, the two samples exhibit a similar optical intensity. This result is particularly important, as it shows that yarn linear density, stitch architecture, and fabric thickness can vary substantially without altering the perceived optical output under a specific type of artificial lighting.
Home light (Incandescent A).
Under home lighting conditions (Figure 4e), a clear convergence is observed between Samples 11 and 12 (0.746 and 0.647). The two samples differ in stitch architecture (single jersey with float versus modified purl) and occupy different structural positions, yet display similarly high optical emission. This suggests that warm-spectrum illumination enhances the photoluminescent contribution, reducing the influence of macrostructural differences and allowing distinct textile solutions to appear optically equivalent.
These illumination-specific convergences demonstrate that optical equivalence is not a universal property of a given sample, but a context-dependent phenomenon governed by the spectral characteristics of the illumination under which the textiles are observed or used. The design-space maps enable the identification of such cases, which cannot be predicted from yarn composition, stitch architecture, or structural position when considered independently.
This represents a key outcome of the study and directly supports the exploratory nature of the proposed method.
4.4. Design Relevance of Illumination-Specific Equivalence
In addition to cases of optical convergence between different samples under specific illumination, the maps make visible a second important effect: different sensitivity of individual samples to illumination type, expressed as changes in marker size across Figure 4a–e. Some samples exhibit strong variability in optical response, while others maintain almost unchanged behaviour.
Samples 5 and 12 are among the most illumination-sensitive. Both show minimal optical response under UV illumination and a markedly higher response under home light (Illuminant A). For Sample 12, this contrast is particularly informative, as it represents a structural extreme with high air permeability, yet does not exhibit a universally high optical effect. Instead, its optical expression is strongly context-dependent. This indicates that, for certain structures, the spectral composition of the illumination can dominate over macrostructural parameters, either enhancing or suppressing the manifestation of functional yarns.
In contrast, Sample 6 shows an almost invariant response to illumination. Its value remains minimal under all lighting conditions. This can be interpreted as an indication that, for this specific combination of yarn system and structure, the functional contribution to the optical effect is limited, and changes in illumination do not lead to a measurable difference in response.
Alongside these two extreme cases, Sample 8 represents a third, fundamentally different type of behaviour. It exhibits a consistently high optical response across all investigated illumination conditions. This appears as a maximum or near-maximum marker size in each of Figure 4a–e. Unlike Samples 5 and 12, where optical performance varies strongly with the lighting environment, Sample 8 shows no substantial change in response when illumination conditions are altered. This behaviour indicates robustness of the functional response with respect to spectral variation.
It is important to emphasise that these observations do not indicate a “better” or “worse” sample. Instead, they reveal distinct behaviour types: structures with high illumination sensitivity, structures with inert or weak optical response, and structures with a stable, practically invariant optical effect, as exemplified by Sample 8. This differentiation is critical for design-oriented applications, as it enables informed selection between solutions with predictable behaviour across lighting environments and solutions that are optimal only under specific illumination conditions.
4.5. Design and Engineering Relevance of the Results: When Change Does Not Lead to Effect
The results of this exploratory study are important because, in practical engineering and design work, a common assumption is often applied: changing the yarn will produce a different outcome; changing the stitch will produce a different outcome; changing thickness or porosity (air permeability) will again produce a different outcome. The present analysis shows that, in multifactor textile systems, this intuition is not reliable.
The design-space maps show that, in some cases, changing a single parameter does not lead to a substantial change in optical response, which in this study represents the target effect, under a given illumination condition. More importantly, cases are observed in which the material system (yarns), stitch architecture, and structural position (thickness and air permeability) all differ simultaneously, while the optical outcome remains similar within the same illumination context. This indicates that different parameter combinations can be functionally equivalent under specific conditions.
Consequently, the design of functional textiles cannot rely on linear expectations such as “more”, “thicker”, or “denser” leading to a stronger effect. Instead, it is necessary to identify context-dependent equivalences and zones of insensitivity, where the system remains effectively inert to certain changes. This insight represents the practical value of the exploratory design-space approach: it makes visible not only where differences occur, but also where change is unnecessary because it does not result in functional improvement under the defined external factor, in this case the illumination type, which may be replaced by another target parameter in future applications.
4.6. Numerical Versus Design-Relevant Optical Equivalence
To clarify the interpretation of illumination-specific equivalence, two complementary analytical perspectives are considered in the Discussion. Table 2 presents cases of strict numerical proximity, in which samples exhibit almost identical normalised optical values under a given illumination condition. This analysis focuses exclusively on quantitative similarity and identifies situations where optical response clusters within a narrow numerical range, independent of structural or material differences.
In parallel, Table 3 presents cases of design-relevant equivalence, where samples with clearly different characteristics (stitch architecture, yarn composition, thickness, and air permeability) produce a similar optical response under specific illumination conditions. In this case, the emphasis is placed on the coincidence of functional outcome under maximum structural contrast, which is directly relevant for design and engineering decision-making.
For ease of interpretation, Table 2 should be read as a purely numerical comparison, highlighting minimal differences in normalised optical values, whereas Table 3 should be read as a design-oriented comparison, emphasising structural contrast and functional interchangeability under specific illumination conditions.
It is important to note that the two tables do not fully coincide, which does not represent a limitation of the analysis but a significant result. For example, under OPT illumination, Table 2 identifies Samples 10 and 12 as the numerically closest pair, whereas Table 3 selects Samples 4 and 12, as this pair exhibits substantially greater structural contrast and more clearly illustrates design-relevant equivalence between a thin, compact structure and an extremely open macrostructure. A similar discrepancy is observed under home lighting conditions, where numerically close values are recorded for Samples 1 and 3 (Table 2), while from a design perspective the pair Samples 3 and 10 (Table 3) is more informative, combining a similar optical response with clearly different stitch types, thickness, and structural compactness.
These examples demonstrate that numerical equivalence and design relevance are not the same, and that the selection of “equivalent” samples depends on the objective of the analysis—whether the aim is to minimise quantitative difference or to maximise insight into alternative design solutions.
By explicitly distinguishing between these two types of equivalence, the exploratory design-space approach enables a clear separation between quantitative similarity and functional interchangeability. This distinction is critical for engineering and design practice, where the objective is often not to minimise numerical differences, but to identify structurally different solutions that deliver comparable functional performance under defined contextual conditions, which in the present study is the illumination type.
5. Conclusions
This study presents an exploratory design-space approach for analysing knitted textiles by integrating structural parameters with illumination-dependent optical response. The results show that optical behaviour is context-dependent and cannot be inferred directly from yarn composition, stitch architecture, or macrostructural properties considered in isolation.
By distinguishing between numerical equivalence and design-relevant equivalence, the approach reveals cases in which structurally and materially different textile configurations deliver comparable optical performance under specific illumination conditions. At the same time, the design-space maps identify regions where changes in structure or material do not lead to measurable functional improvement.
From a design perspective, these findings challenge linear assumptions that increasing material complexity or structural density necessarily leads to enhanced functional performance. Instead, the proposed methodology supports informed design decisions by identifying alternative, and sometimes simpler, solutions that achieve equivalent functional outcomes within a given context.
Author Contributions
Conceptualisation, R.A.A.; methodology, R.A.A., E.B. and D.S.; validation, E.B. and D.S.; formal analysis, R.A.A.; investigation, R.A.A., E.B. and D.S.; resources, R.A.A.; data curation, R.A.A. and E.B.; writing—original draft preparation, R.A.A.; writing—review and editing, E.B. and D.S.; visualisation, R.A.A.; supervision, R.A.A.; project administration, R.A.A.; funding acquisition, R.A.A. All authors have read and agreed to the published version of the manuscript.
Funding
This study and its publication is financed by the European Union—NextGenerationEU, through the National Recovery and Resilience Plan of the Republic of Bulgaria, project No. BG-RRP-2.004-0005.
Institutional Review Board Statement
Not applicable.
Data Availability Statement
The original contributions presented in this study are included in the article. Further inquiries can be directed to the corresponding author.
Conflicts of Interest
The authors declare no conflicts of interest.
References
Bridgens, B.; Birchall, M. Form and function: The significance of material properties in the design of tensile fabric structures. Eng. Struct.2012, 44, 1–12. [Google Scholar] [CrossRef] [Scilit]
Gereke, T.; Döbrich, O.; Hübner, M.; Cherif, C. Experimental and computational composite textile reinforcement forming: A review. Compos. Part A Appl. Sci. Manuf.2013, 46, 1–10. [Google Scholar] [CrossRef] [Scilit]
Liu, D.; Christe, D.; Shakibajahromi, B.; Knittel, C.; Castaneda, N.; Breen, D.; Dion, G.; Kontsos, A. On the role of material architecture in the mechanical behavior of knitted textiles. Int. J. Solids Struct.2017, 109, 101–111. [Google Scholar] [CrossRef] [Scilit]
Gokarneshan, N.; Varadarajan, B.; Sentil Kumar, C.B.; Balamurugan, K.; Rachel, A. Engineering knits for versatile technical applications: Some insights on recent researches. J. Ind. Text.2012, 42, 52–75. [Google Scholar] [CrossRef] [Scilit]
Pavko-Čuden, A.; Rant, D. Multifunctional Foldable Knitted Structures: Fundamentals, Advances and Applications; IntechOpen: London, UK, 2017; pp. 55–84. [Google Scholar]
Kyosev, Y. Topological Modelling of Knitted Structures. In Topology-Based Modeling of Textile Structures and Their Joint Assemblies: Principles, Algorithms and Limitations; Springer International Publishing: Cham, Switzerland, 2018; pp. 91–129. [Google Scholar]
Sıddıquı, M.O.R.; Zahid, M.; Ayaz, A.; Hashmi, S.; Ahmed, A.; Sun, D. Unravelling the Complexity: A Review of Geometrical Modelling Techniques in Plain Weft Knitted Textile Structures. Tekst. Mühendis2025, 32, 210–219. [Google Scholar] [CrossRef] [Scilit]
Stoffberg, M.E.; Hunter, L.; Botha, A. The effect of fabric structural parameters and fiber type on the comfort-related properties of commercial apparel fabrics. J. Nat. Fibers2015, 12, 505–517. [Google Scholar] [CrossRef] [Scilit]
Angelova, R.A. Textiles and Human Thermophysiological Comfort in the Indoor Environment; CRC Press: Boca Raton, FL, USA, 2015. [Google Scholar]
Dell’Isola, F.; Steigmann, D.; Corte, A.D. Synthesis of fibrous complex structures: Designing microstructure to deliver targeted macroscale response. Appl. Mech. Rev.2015, 67, 060804. [Google Scholar] [CrossRef] [Scilit]
Yu, X.; Cong, H.; Liang, X.; Dong, Z. Structural design of single functional jersey with moisture comfort based on yarn combination. Text. Res. J.2023, 93, 4820–4831. [Google Scholar] [CrossRef] [Scilit]
Tang, K.H.D. Advances in Thermoregulating Textiles: Materials, Mechanisms, and Applications. Textiles2025, 5, 22. [Google Scholar] [CrossRef] [Scilit]
Jin, H.; Abu-Raya, Y.S.; Haick, H. Advanced materials for health monitoring with skin-based wearable devices. Adv. Healthc. Mater.2017, 6, 1700024. [Google Scholar] [CrossRef] [Scilit] [PubMed]
Florindo, J.B.; Backes, A.R.; de Castro, M.; Bruno, O.M. A comparative study on multiscale fractal dimension descriptors. Pattern Recognit. Lett.2012, 33, 798–806. [Google Scholar] [CrossRef] [Scilit]
Lomov, S.V.; Huysmans, G.; Verpoest, I. Hierarchy of textile structures and architecture of fabric geometric models. Text. Res. J.2001, 71, 534–543. [Google Scholar] [CrossRef] [Scilit]
Causa, A.; Netravali, A. Characterization and Measurement of Textile Fabric Properties. In Structure and Mechanics of Textile Fibre Assemblies; Woodhead Publishing: Cambridge, UK, 2008; pp. 4–47. [Google Scholar]
Vysanska, M. Computed tomography cross-sections for an objective evaluation of the textile fabric’s inner structure and its thickness. J. Eng. Fibers Fabr.2024, 19, 1–13. [Google Scholar] [CrossRef] [Scilit]
Guru, R.; Grewal, D.; Rani, J.; Fangueiro, R.; Santhanam, S. Investigating the Impact of Air Permeability and Thermal Properties on Rib Knit Structures. Text. Leather Rev.2024, 7, 1273–1289. [Google Scholar] [CrossRef] [Scilit]
Kabir, S.F.; Uluturk, I.; Pang, R.; Khadse, N.; Stapleton, S.E.; Park, J.H. Structure–property investigation of knit patterns on thermal comfort: A holistic approach. ACS Appl. Eng. Mater.2023, 1, 1455–1466. [Google Scholar] [CrossRef] [Scilit]
Zhang, Y.; Xia, X.; Ma, K.; Xia, G.; Wu, M.; Cheung, Y.H.; Yu, H.; Zou, B.; Zhang, X.; Farha, O.K.; et al. Functional textiles with smart properties: Their fabrications and sustainable applications. Adv. Funct. Mater.2023, 33, 2301607. [Google Scholar] [CrossRef] [Scilit]
Balmer, V.; Kuhn, S.V.; Bischof, R.; Salamanca, L.; Kaufmann, W.; Perez-Cruz, F.; Kraus, M.A. Design space exploration and explanation via conditional variational autoencoders in meta-model-based conceptual design of pedestrian bridges. Autom. Constr.2024, 163, 105411. [Google Scholar] [CrossRef] [Scilit]
Sisodia, A.; Burnap, A.; Kumar, V. Generative interpretable visual design: Using disentanglement for visual conjoint analysis. J. Mark. Res.2025, 62, 405–428. [Google Scholar] [CrossRef] [Scilit]
Salem, M.A.; Khalil, Z.A. An Interpretable Hybrid RF–ANN Early-Warning Model for Real-World Prediction of Academic Confidence and Problem-Solving Skills. Math. Comput. Appl.2025, 30, 140. [Google Scholar] [CrossRef] [Scilit]
Sedlmair, M.; Heinzl, C.; Bruckner, S.; Piringer, H.; Möller, T. Visual parameter space analysis: A conceptual framework. IEEE Trans. Vis. Comput. Graph.2014, 20, 2161–2170. [Google Scholar] [CrossRef] [Scilit] [PubMed]
Angelova, R.A.; Borisova, E.; Sofronova, D. Effects of Yarn Composition and Knitted Macrostructure on the Functional Properties of Smart Textiles with Optical Functionalities. Textiles2026, 6, 36. [Google Scholar] [CrossRef] [Scilit]
Woldseth, R.V.; Aage, N.; Bærentzen, J.A.; Sigmund, O. On the use of artificial neural networks in topology optimisation. Struct. Multidiscip. Optim.2022, 65, 294. [Google Scholar] [CrossRef] [Scilit]
Shantal, M.; Othman, Z.; Abu Bakar, A. Missing data imputation using correlation coefficient and min-max normalization weighting. Intell. Data Anal.2025, 29, 372–384. [Google Scholar] [CrossRef] [Scilit]
Wongoutong, C. The impact of neglecting feature scaling in k-means clustering. PLoS ONE2024, 19, e0310839. [Google Scholar] [CrossRef] [Scilit]
Suarez-Alvarez, M.M.; Pham, D.T.; Prostov, M.Y.; Prostov, Y.I. Statistical approach to normalization of feature vectors and clustering of mixed datasets. Proc. R. Soc. A Math. Phys. Eng. Sci.2012, 468, 2630–2651. [Google Scholar] [CrossRef] [Scilit]
Browne, F.; Zheng, H.; Wang, H.; Azuaje, F. From Experimental Approaches to Computational Techniques: A Review on the Prediction of Protein-Protein Interactions. Adv. Artif. Intell.2010, 2010, 924529. [Google Scholar] [CrossRef] [Scilit]
Moere, A.V.; Purchase, H. On the role of design in information visualization. Inf. Vis.2011, 10, 356–371. [Google Scholar] [CrossRef] [Scilit]
Gavrilescu, M.; Leon, F.; Ferariu, L.E.; Buțincu, C.N. A review of evolutionary optimization methods for information visualization and feature space exploration. In Proceedings of the 2024 International Conference on INnovations in Intelligent SysTems and Applications (INISTA), Craiova, Romania, 4–6 September 2024; IEEE: New York, NY, USA, 2024; pp. 1–6. [Google Scholar]
Ware, C. Information Visualization: Perception for Design; Morgan Kaufmann: San Francisco, CA, USA, 2019. [Google Scholar]
Figure 1.
Conceptual framework illustrating the rationale for selecting thickness, air permeability, and optical response as complementary structural, comfort-related, and functional parameters in the proposed exploratory design-space mapping methodology for knitted fabrics incorporating a passive smart yarn.
Figure 1.
Conceptual framework illustrating the rationale for selecting thickness, air permeability, and optical response as complementary structural, comfort-related, and functional parameters in the proposed exploratory design-space mapping methodology for knitted fabrics incorporating a passive smart yarn.
Figure 2.
Conceptual representation of the structural–optical design space.
Figure 2.
Conceptual representation of the structural–optical design space.
Figure 3.
Workflow of the exploratory design-space mapping methodology, illustrating the transformation of experimental structural and optical data into a combined structural–optical design space and its use for exploratory interpretation.
Figure 3.
Workflow of the exploratory design-space mapping methodology, illustrating the transformation of experimental structural and optical data into a combined structural–optical design space and its use for exploratory interpretation.
Figure 4.
Exploratory design-space maps of knitted fabrics based on normalised thickness (X-axis) and air permeability (Y-axis), with optical performance encoded by bubble size under different illumination conditions: (a) UV, (b) Daylight (D65), (c) OPT/Store Light (TL84), (d) Store Light (Cool White Fluorescent), and (e) Home Light (Incandescent Illuminant A). Sample indices correspond to the experimental dataset.
Figure 4.
Exploratory design-space maps of knitted fabrics based on normalised thickness (X-axis) and air permeability (Y-axis), with optical performance encoded by bubble size under different illumination conditions: (a) UV, (b) Daylight (D65), (c) OPT/Store Light (TL84), (d) Store Light (Cool White Fluorescent), and (e) Home Light (Incandescent Illuminant A). Sample indices correspond to the experimental dataset.
Table 1.
Overview of the knitted samples used for exploratory design-space mapping.
Table 1.
Overview of the knitted samples used for exploratory design-space mapping.
Sample
Pattern
Base Thread
Photoluminescent Thread Yes/No
Reflective Thread Yes/No
Picture
1
Single jersey
Cotton 264 tex
Yes
No
2
Single jersey
Cotton 264 tex
Yes
No
3
Single jersey
Cotton 264 tex
Yes
Yes
4
Single jersey
Cotton 264 tex
Yes
Yes
5
Purl
Cotton 264 tex
Yes
Yes
6
Double jersey
Cotton 264 tex
Yes
Yes
7
Single jersey
Cotton 400 tex
Yes
Yes
8
Single jersey
Cotton 400 tex
Yes
Yes
9
Purl
Cotton 400 tex
Yes
Yes
10
Double jersey
Cotton 400 tex
Yes
Yes
11
Single jersey with float
Cotton 400 tex
Yes
Yes
12
Modified purl
Cotton 400 tex
Yes
Yes
Table 2.
Illumination-specific optical equivalence based on strict numerical proximity.
Table 2.
Illumination-specific optical equivalence based on strict numerical proximity.
Illumination
Optically Similar Samples
Normalised Values
Numerical Note
UV
1–12
0.1148–0.0938
Both low and very close
Daylight (D65)
1–4
0.5188–0.5150
Practically identical
OPT
10–12
0.3625–0.3581
Minimal numerical difference
Store light
5–12
0.4131–0.4170
Nearly identical values
Home light (A)
1–3
0.5862–0.5948
Very small difference
Table 3.
Illumination-specific optical equivalence with design relevance.
Table 3.
Illumination-specific optical equivalence with design relevance.
Illumination
Optically Comparable Samples
Key Structural Differences
Design Implication
UV
1–12
Thin single jersey without reflective yarn vs. thick, highly open modified purl
Structural complexity does not guarantee stronger UV response
Daylight (D65)
1–4
Absence vs. presence of reflective yarn; different compactness
Reflective yarn does not dominate under broad-spectrum daylight
OPT
4–12
Thin single jersey vs. extremely open modified purl
Different macrostructural pathways can lead to comparable visibility
Store light
5–12
Single jersey vs. purl; similar yarn linear density
Stitch type and thickness can vary without altering perceived output
Home light (A)
3–10
Single jersey (thin yarn) vs. double jersey (thick yarn)
Warm-spectrum light reduces the impact of structural differences
Disclaimer/Publisher’s Note: The statements, opinions and data contained in all publications are solely those of the individual author(s) and contributor(s) and not of MDPI and/or the editor(s). MDPI and/or the editor(s) disclaim responsibility for any injury to people or property resulting from any ideas, methods, instructions or products referred to in the content.
Angelova, R.A.; Borisova, E.; Sofronova, D.
Exploratory Design-Space Mapping of Knitted Fabrics Based on Combined Structural, Comfort-Related, and Optical Parameters. Textiles2026, 6, 51.
https://doi.org/10.3390/textiles6020051
AMA Style
Angelova RA, Borisova E, Sofronova D.
Exploratory Design-Space Mapping of Knitted Fabrics Based on Combined Structural, Comfort-Related, and Optical Parameters. Textiles. 2026; 6(2):51.
https://doi.org/10.3390/textiles6020051
Chicago/Turabian Style
Angelova, Radostina A., Elena Borisova, and Daniela Sofronova.
2026. "Exploratory Design-Space Mapping of Knitted Fabrics Based on Combined Structural, Comfort-Related, and Optical Parameters" Textiles 6, no. 2: 51.
https://doi.org/10.3390/textiles6020051
APA Style
Angelova, R. A., Borisova, E., & Sofronova, D.
(2026). Exploratory Design-Space Mapping of Knitted Fabrics Based on Combined Structural, Comfort-Related, and Optical Parameters. Textiles, 6(2), 51.
https://doi.org/10.3390/textiles6020051
Article Metrics
No
No
Article Access Statistics
For more information on the journal statistics, click here.
Multiple requests from the same IP address are counted as one view.
Angelova, R.A.; Borisova, E.; Sofronova, D.
Exploratory Design-Space Mapping of Knitted Fabrics Based on Combined Structural, Comfort-Related, and Optical Parameters. Textiles2026, 6, 51.
https://doi.org/10.3390/textiles6020051
AMA Style
Angelova RA, Borisova E, Sofronova D.
Exploratory Design-Space Mapping of Knitted Fabrics Based on Combined Structural, Comfort-Related, and Optical Parameters. Textiles. 2026; 6(2):51.
https://doi.org/10.3390/textiles6020051
Chicago/Turabian Style
Angelova, Radostina A., Elena Borisova, and Daniela Sofronova.
2026. "Exploratory Design-Space Mapping of Knitted Fabrics Based on Combined Structural, Comfort-Related, and Optical Parameters" Textiles 6, no. 2: 51.
https://doi.org/10.3390/textiles6020051
APA Style
Angelova, R. A., Borisova, E., & Sofronova, D.
(2026). Exploratory Design-Space Mapping of Knitted Fabrics Based on Combined Structural, Comfort-Related, and Optical Parameters. Textiles, 6(2), 51.
https://doi.org/10.3390/textiles6020051