Abstract
A standardized source of light is essential for visual color assessments, which is why lighting booths were developed. For the best results in visual assessment, it is important to consider the right choice of light source, the right viewing conditions, and the variability of the viewer. To date, many light booth technologies have been introduced to meet user demands. Since most of the light sources on the market are characterized by the designer or manufacturer, the resulting variations from booth-to-booth remain. In this study, we compared the performance of two standard light booths to assess the color difference of eleven metameric pairs. In this study, we checked an earlier technology-based light booth that is still used in the textile industry and contains illuminant A (Tungsten lamp) with CCT 2700 K, TL84 (tri-band fluorescent tube) with CCT 4000 K, and simulator D65 (CCT 6500 K) with a different light booth whose original light sources have been replaced by currently available LED retro kits from equivalent CCTs. As an inexperienced customer or industrial user, our question was, how important is this replacement? The results revealed that two different standard lighting technologies with similar CCTs cannot reproduce the same estimates because the light sources produced different SPDs. It is illustrating that caution is necessary when comparing results obtained from two different light booths containing light sources with similar CCTs but different SPDs. This comparative study suggested that the variability of the light sources’ SPDs or the observer or the sample should be modeled considering light booth’s technology to estimate its contribution to the overall variability. The close relationship between perceived and CAM02-UCS suggests that if both booths are used after the light sources have been calibrated, a formula based on color appearance models must be used to predict color appearance. To obtain better agreement between perceived and calculated color difference, one must need to avoid light booths with nominally white light sources.
1. Introduction
The visual appearance of color is a sensory attribute and is the result of a complex interaction of the object, the incident light, and human perception [1,2,3,4]. Judgment of visual appearance of color is often influenced by environmental elements, surface conditions, and optical illusions. Therefore, the visual assessment of colors is particularly complex and depends on many factors, such as observer sensitivity, age and color memory, viewing angle, light source, surface condition, object’s background, area of the colored surface, and so on. To overcome these complexities in color evaluation, the implementation of color control technologies such as spectrophotometers, software, and other tools such as light booths are being developed [5]. ASTM D1729 [6] specifies the viewing geometry, quantity, and spectral properties of the lighting as well as environmental conditions for critical visual color measurements. Both the viewing environment and the lighting are critical factors for a consistent color appearance and effective color communication.
To optimally meet the application and operational requirements, there are many lighting booths on the market that are equipped with many standard light sources (the illuminant) as defined by the Commission Internationale de l’Eclairage (CIE) [7,8]. The use of high-performance light booths enables reliable color assessment and helps identify color inconsistencies, metameric effects, and the influence of brighteners. However, the performance of different light and lighting booths with the same specification can vary greatly [9]. CIE guidelines describe several parameters including lighting and sample presentation methods [10] for visual color assessment. Different sample presentation methods may introduce variations in the measurement [1], but if the same sample presentation methods are used, variations may be attributed to the light booth conditions such as the actual color temperature of the light, light intensity, lamp operation time, etc. A studied revealed that the luminance level in several light booths varied from 100 to >1000 cd/m2 [11]. There are studies that show how correlated color temperature and illuminance affect color perception [12,13,14,15] and users’ feeling [16,17,18,19].
In practice, calibrated light booths are recommended for assessing objects’ color differences [20]. Lighting booths that use older filtered technology are more expensive to maintain. Light booths that use newer fluorescent technology require much less maintenance and are more affordable; nevertheless, at present, fluorescent lamps are gradually being replaced by LED technology, so it is important to compare both technologies. To ensure correct color quality and compliance with user specifications, they only need to be recalibrated and replaced with new light. The regular and appropriate use of a light booth improves the workflow, shortens the cycle time, and shows a positive return on investment. The LED retro kits available today allow the replacement of previously used fluorescent tubes, but the important question arises as to how these fit together with the earlier usability of such a light booth.
In this study, we used two standard light booths to compare their performance in assessing the color differences of twelve metameric samples under different light sources equipped with them. We have also studied the variability within and among observer responses under two booths. Several predictive models have been developed to correlate visual assessment with measured values. The perceived values set the benchmark for the instrumental measurement comparisons [21,22,23]. Some models for calculating color difference are CIELAB, CIEDE2000 [24], OSA-UCS [25], ULAB [26], CAM02-UCS [27], and CAM16-UCS [28].
The purposes of the present study were (i) to assess and compare the visual color difference of the eleven metameric samples for two light booths, (ii) to analyze the correlation between the visual and calculated color difference under tested light sources, and (iii) to evaluate the performance of color difference formulas for experimental conditions. With this study, advantage may be taken of the special merits of a particular light booth such as affordability and easy maintenance while still enabling the comparison of results obtained for a more comprehensive but expensive light booth.
2. Materials and Methods
2.1. Samples
The visual experiment used eleven metameric pairs of samples to examine different metamerism indices under different light sources. Figure 1 depicts the distribution of eleven metameric pairs in the a*b* and L*a* plane of the CIELAB color space under Illuminant D65/2°.
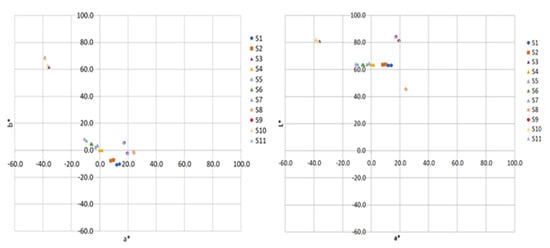
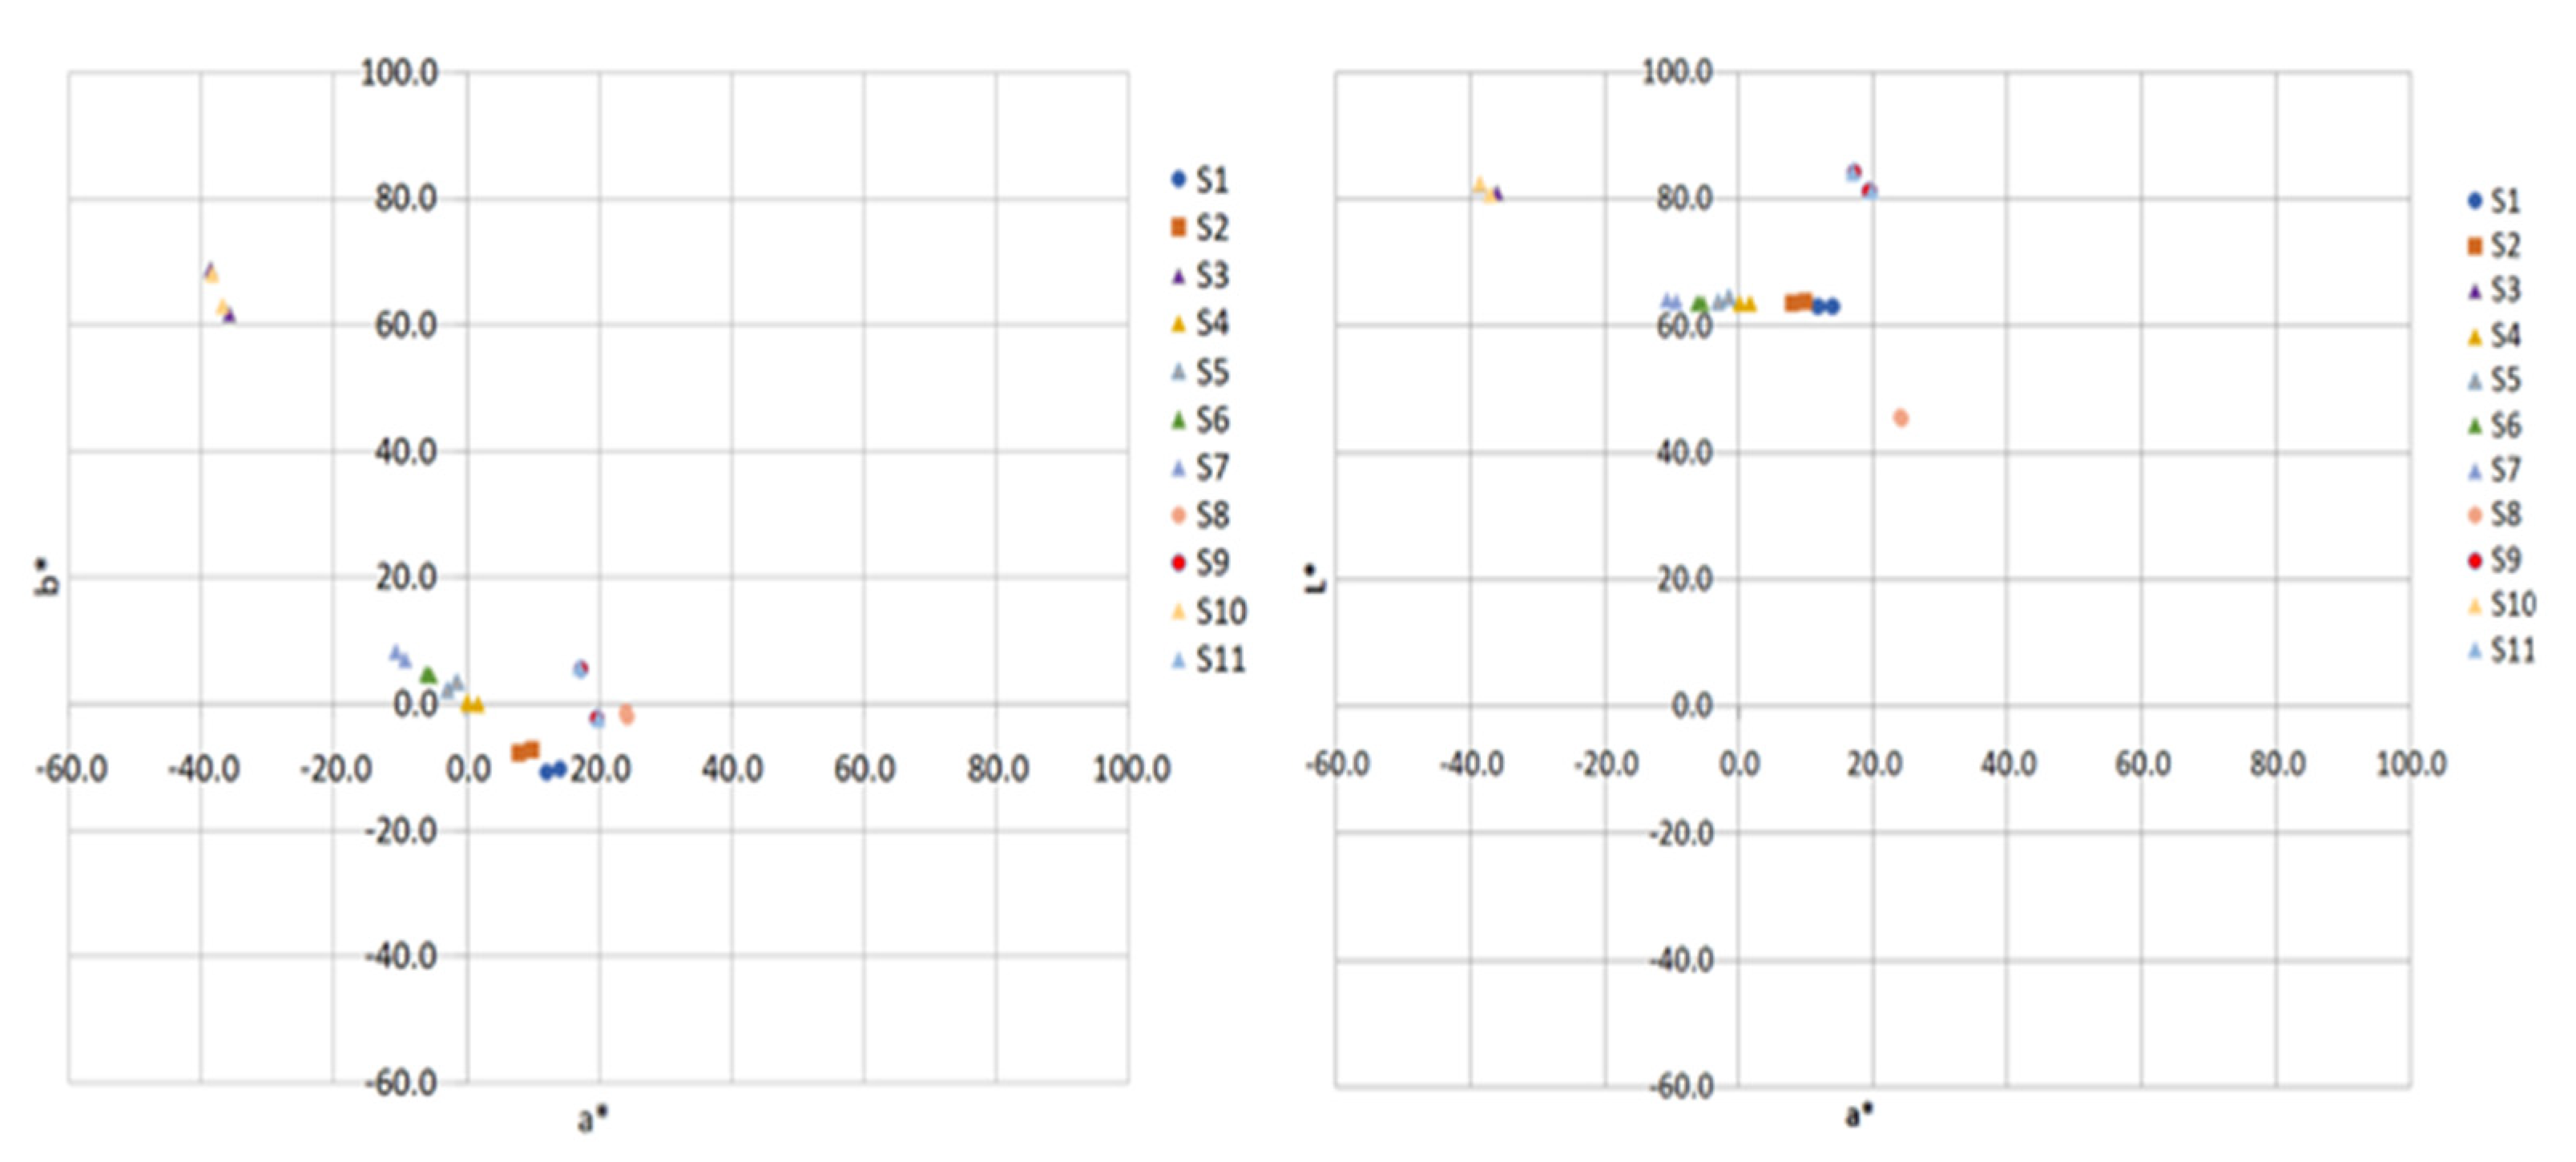
Figure 1.
Distribution of 11 sample pairs on the a*b* plane (left) and L*a* (right) plane under standard D65/2°.
As we can see from both figures, sample pairs 1 to 7 have almost a constant lightness value (64.5 approximately). Sample pairs 8, 9, and 11 have similar chroma and hue, whereas sample pairs 3 and 10 have high chroma value with nearly similar lightness. The mean color difference of the 11 metamers calculated under standard D65/2° was 3.8 ΔE*ab units.
2.2. Light Sources
The visual experiment used eleven metameric pairs of samples to examine different metamerism indices under different light sources. Two standard lighting booths were used for this experiment. Light booth I is based on an old ICS-Texicon Multilight lighting cabinet, where the original light sources were replaced by corresponding LED retro kits with similar correlated color temperature (CCT). Light booth II was Gretag Macbeth (now X-Rite) Judge-II. For the visual assessment, we selected BLED65, BLED40, and BLED27, which represent the light sources with nominal CCT 6500 K, 4000 K, and 2700 K, respectively, for light booth I; and Daylight (Simulator D65), TL84 (Tri-band fluorescent tube), and A (Tungsten lamp), which represent the light sources with a nominal CCT of 6500 K, 4000 K, and 2700 K respectively for light booth II. Throughout this article, the name of the light sources indicates their respected nominal CCT. The spectral power distribution and the colorimetric values of the different configurations was measured with a Photo Research PR-740 spectroradiometer over a plaque containing pressed Barium Sulfate white standard produced by Merck placed in the center of the bottom surface of each lighting booth. The spectral power distribution and position of the light sources in the xy chromaticity diagram are shown in Figure 2 and Figure 3, respectively.
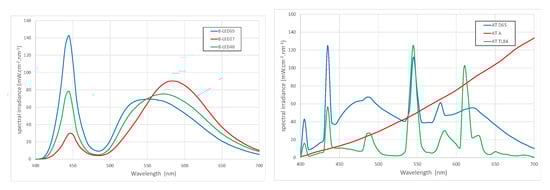
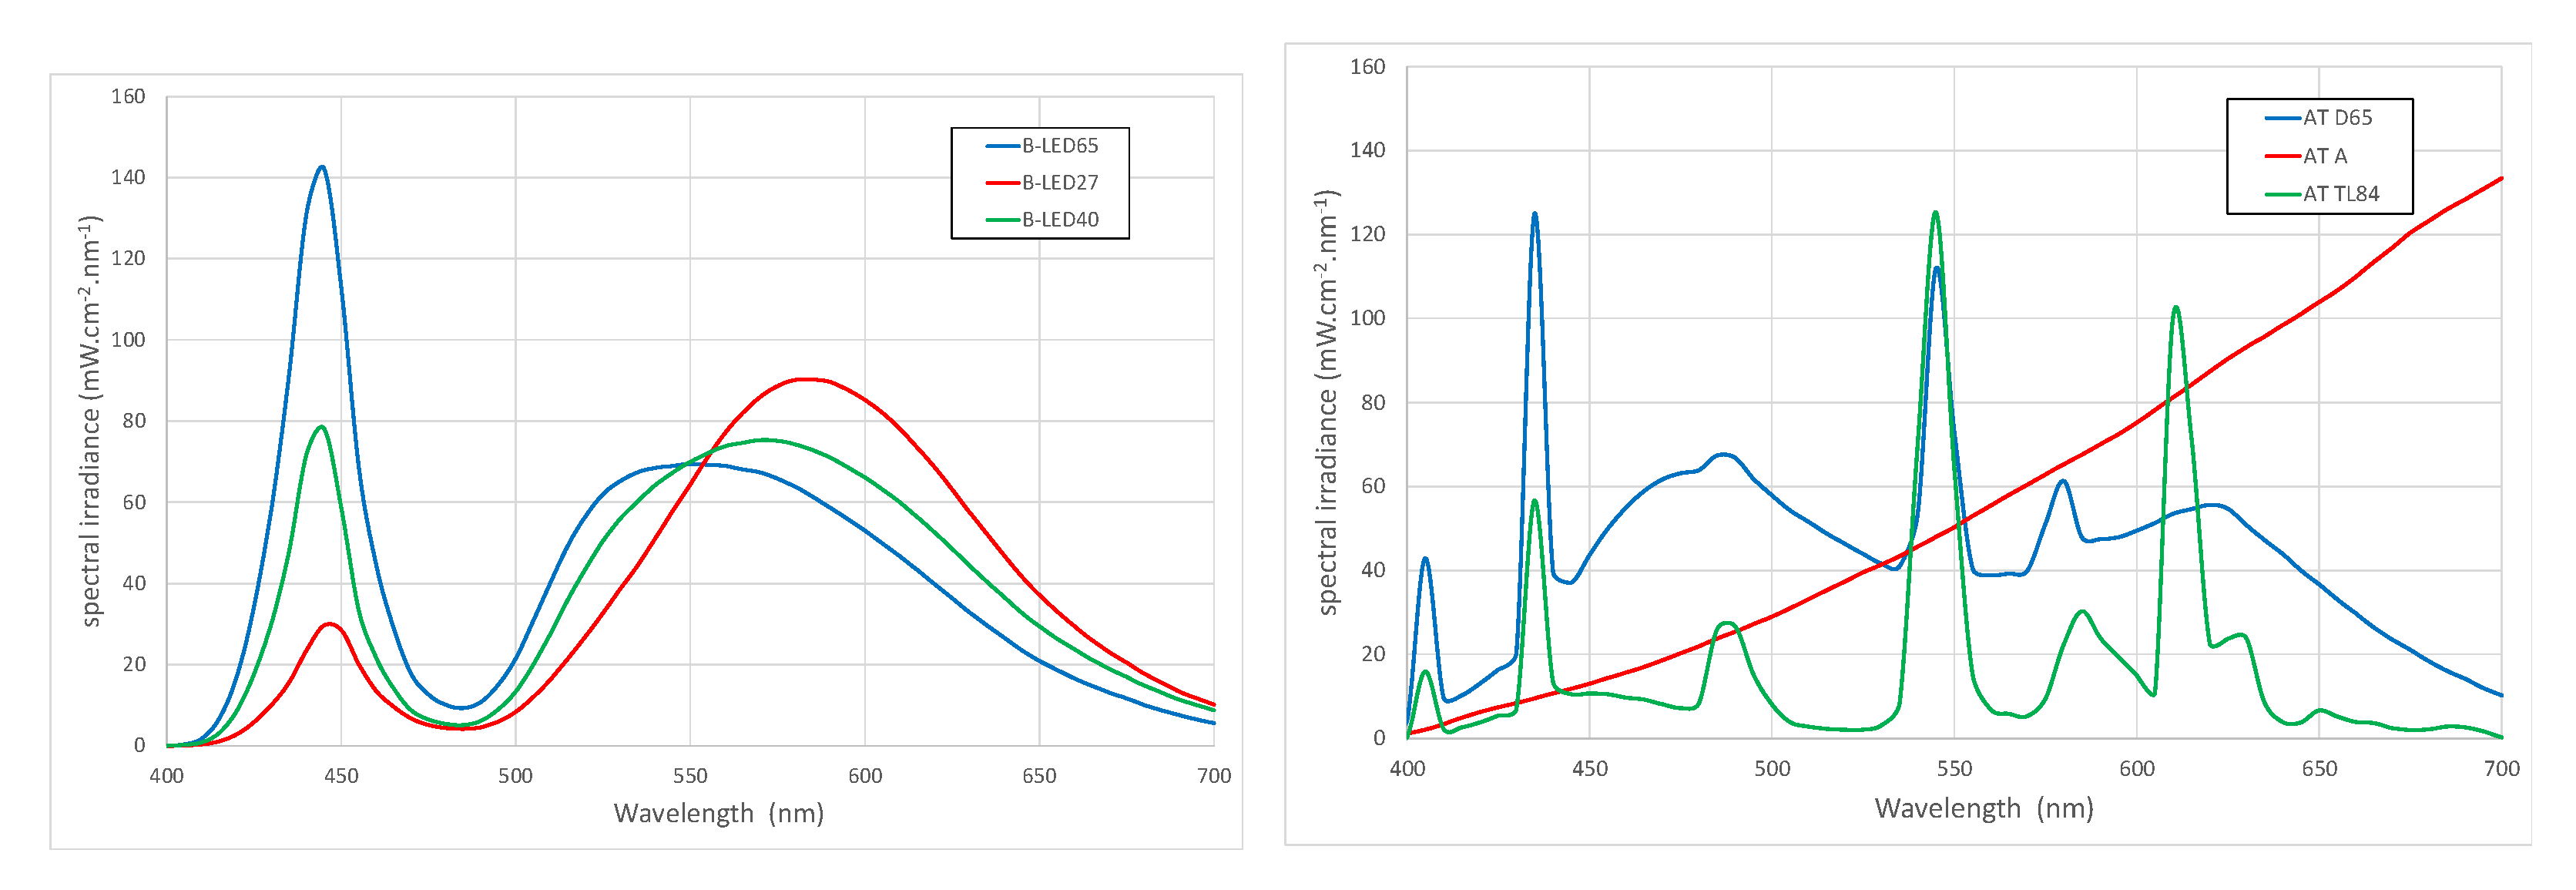
Figure 2.
SPDs of test light sources in the two test booths. Left: light booth I and right: light booth II. In the figure: BLED65, BLED40, and BLED27 representing the light sources with nominal CCT 6500 K, 4000 K, and 2700 K respectively for light booth I; and Daylight (Simulator D65), TL84 (Tri-band fluorescent tube), and A (Tungsten lamp) representing the light sources with nominal CCT values of 6500 K, 4000 K, and 2700 K respectively for light booth II.
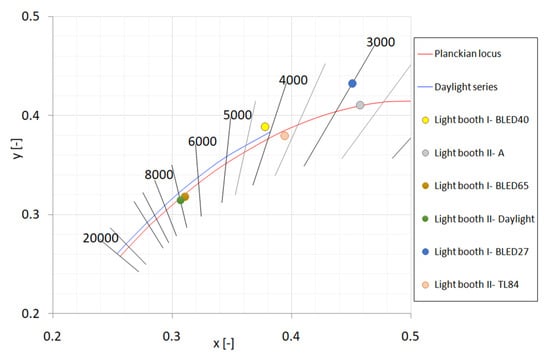
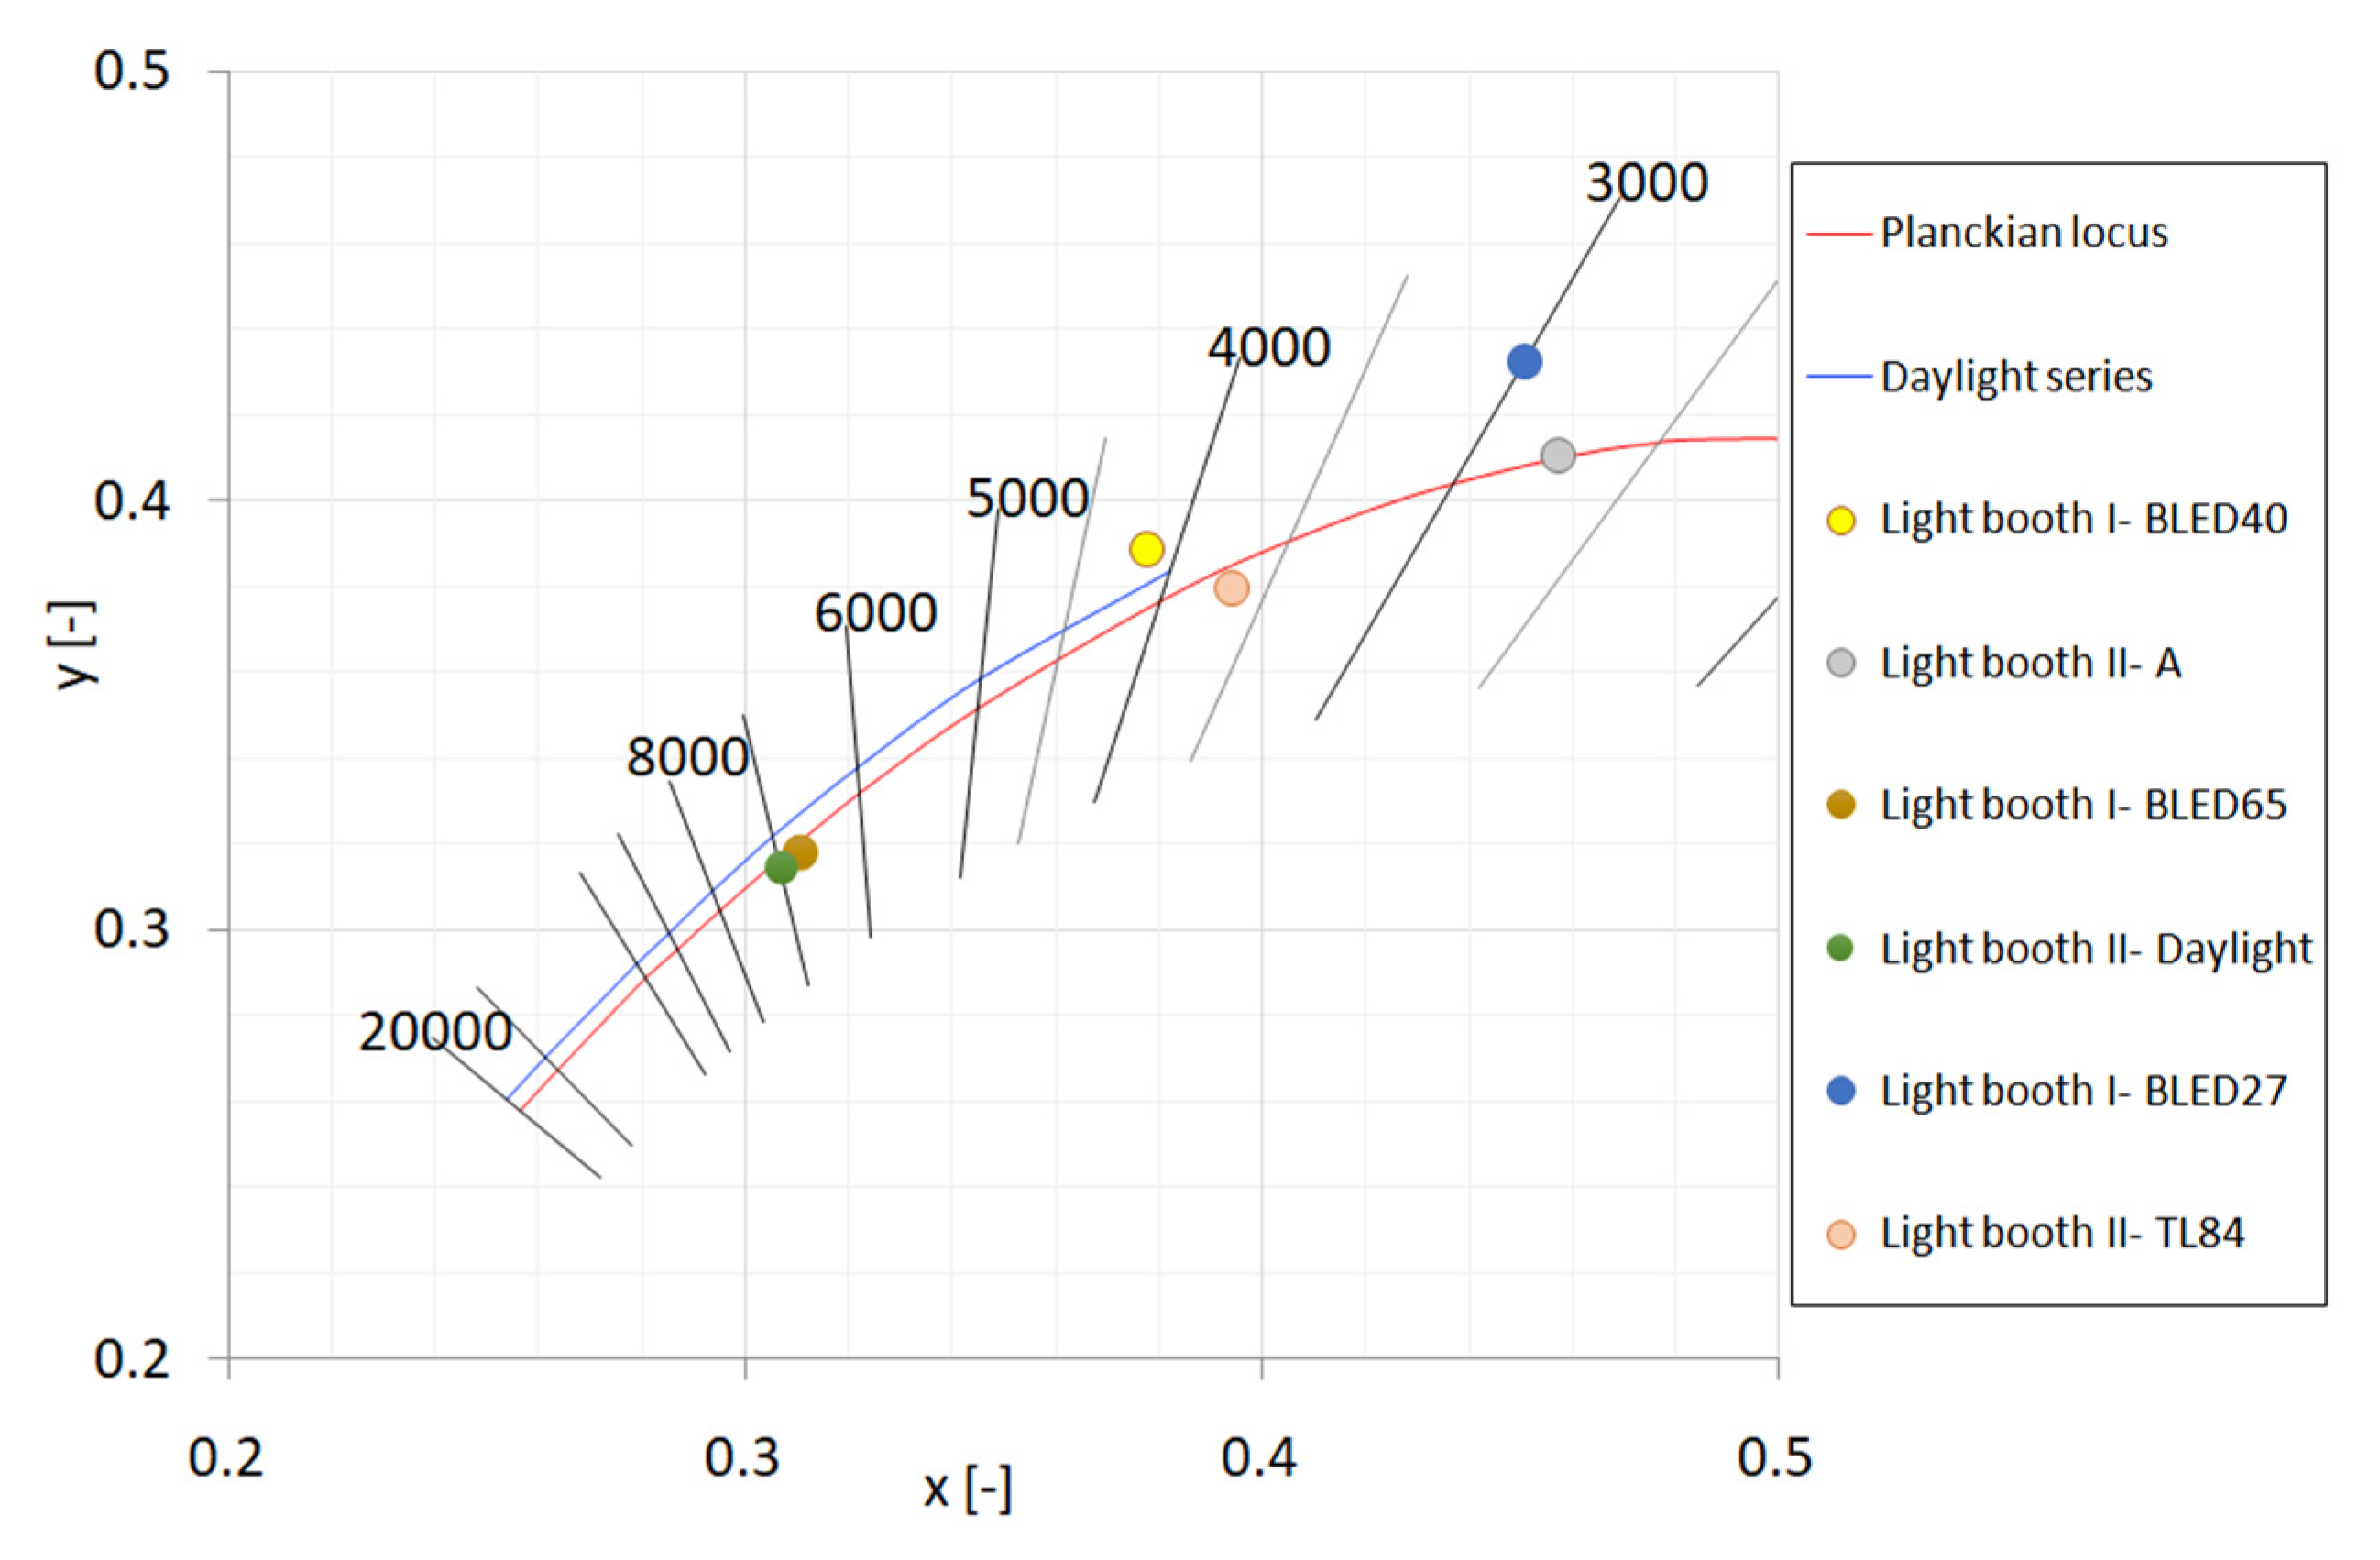
Figure 3.
Different positions of the test light sources in the xy chromaticity diagram. In the figure, BLED65, BLED40, and BLED27 represent the light sources with nominal CCT 6500 K, 4000 K, and 2700 K respectively for light booth I; and Daylight (Simulator D65), TL84 (Tri-band fluorescent tube), and A (Tungsten lamp) represent the light sources with nominal CCT 6500 K, 4000 K, and 2700 K respectively for light booth II.
Table 1 summarizes measurements of chromaticity, correlated color temperature (CCT), and luminance level. From Table 1 and Figure 3, the light sources of viewing booth II are located on or close to the Planckian locus, whereas for booth I, BLED40 and BLED27 are situated even outside the daylight series. From Table 1 and Figure 3, the light sources of viewing booth II are on or near Planckian locus, while BLED40 and BLED27 of booth I are even outside the daylight series. Figure 2 is showing that both viewing booths have a relatively different spectral quality of the light sources.

Table 1.
The parameters of the light sources. In the table, BLED65, BLED40, and BLED27 represent the light sources with nominal CCT 6500 K, 4000 K, and 2700 K, respectively for light booth I; and Daylight (Simulator D65), TL84 (Tri-band fluorescent tube) and A (Tungsten lamp) represent the light sources with nominal CCT 6500 K, 4000 K, and 2700 K respectively for light booth II.
2.3. Observers
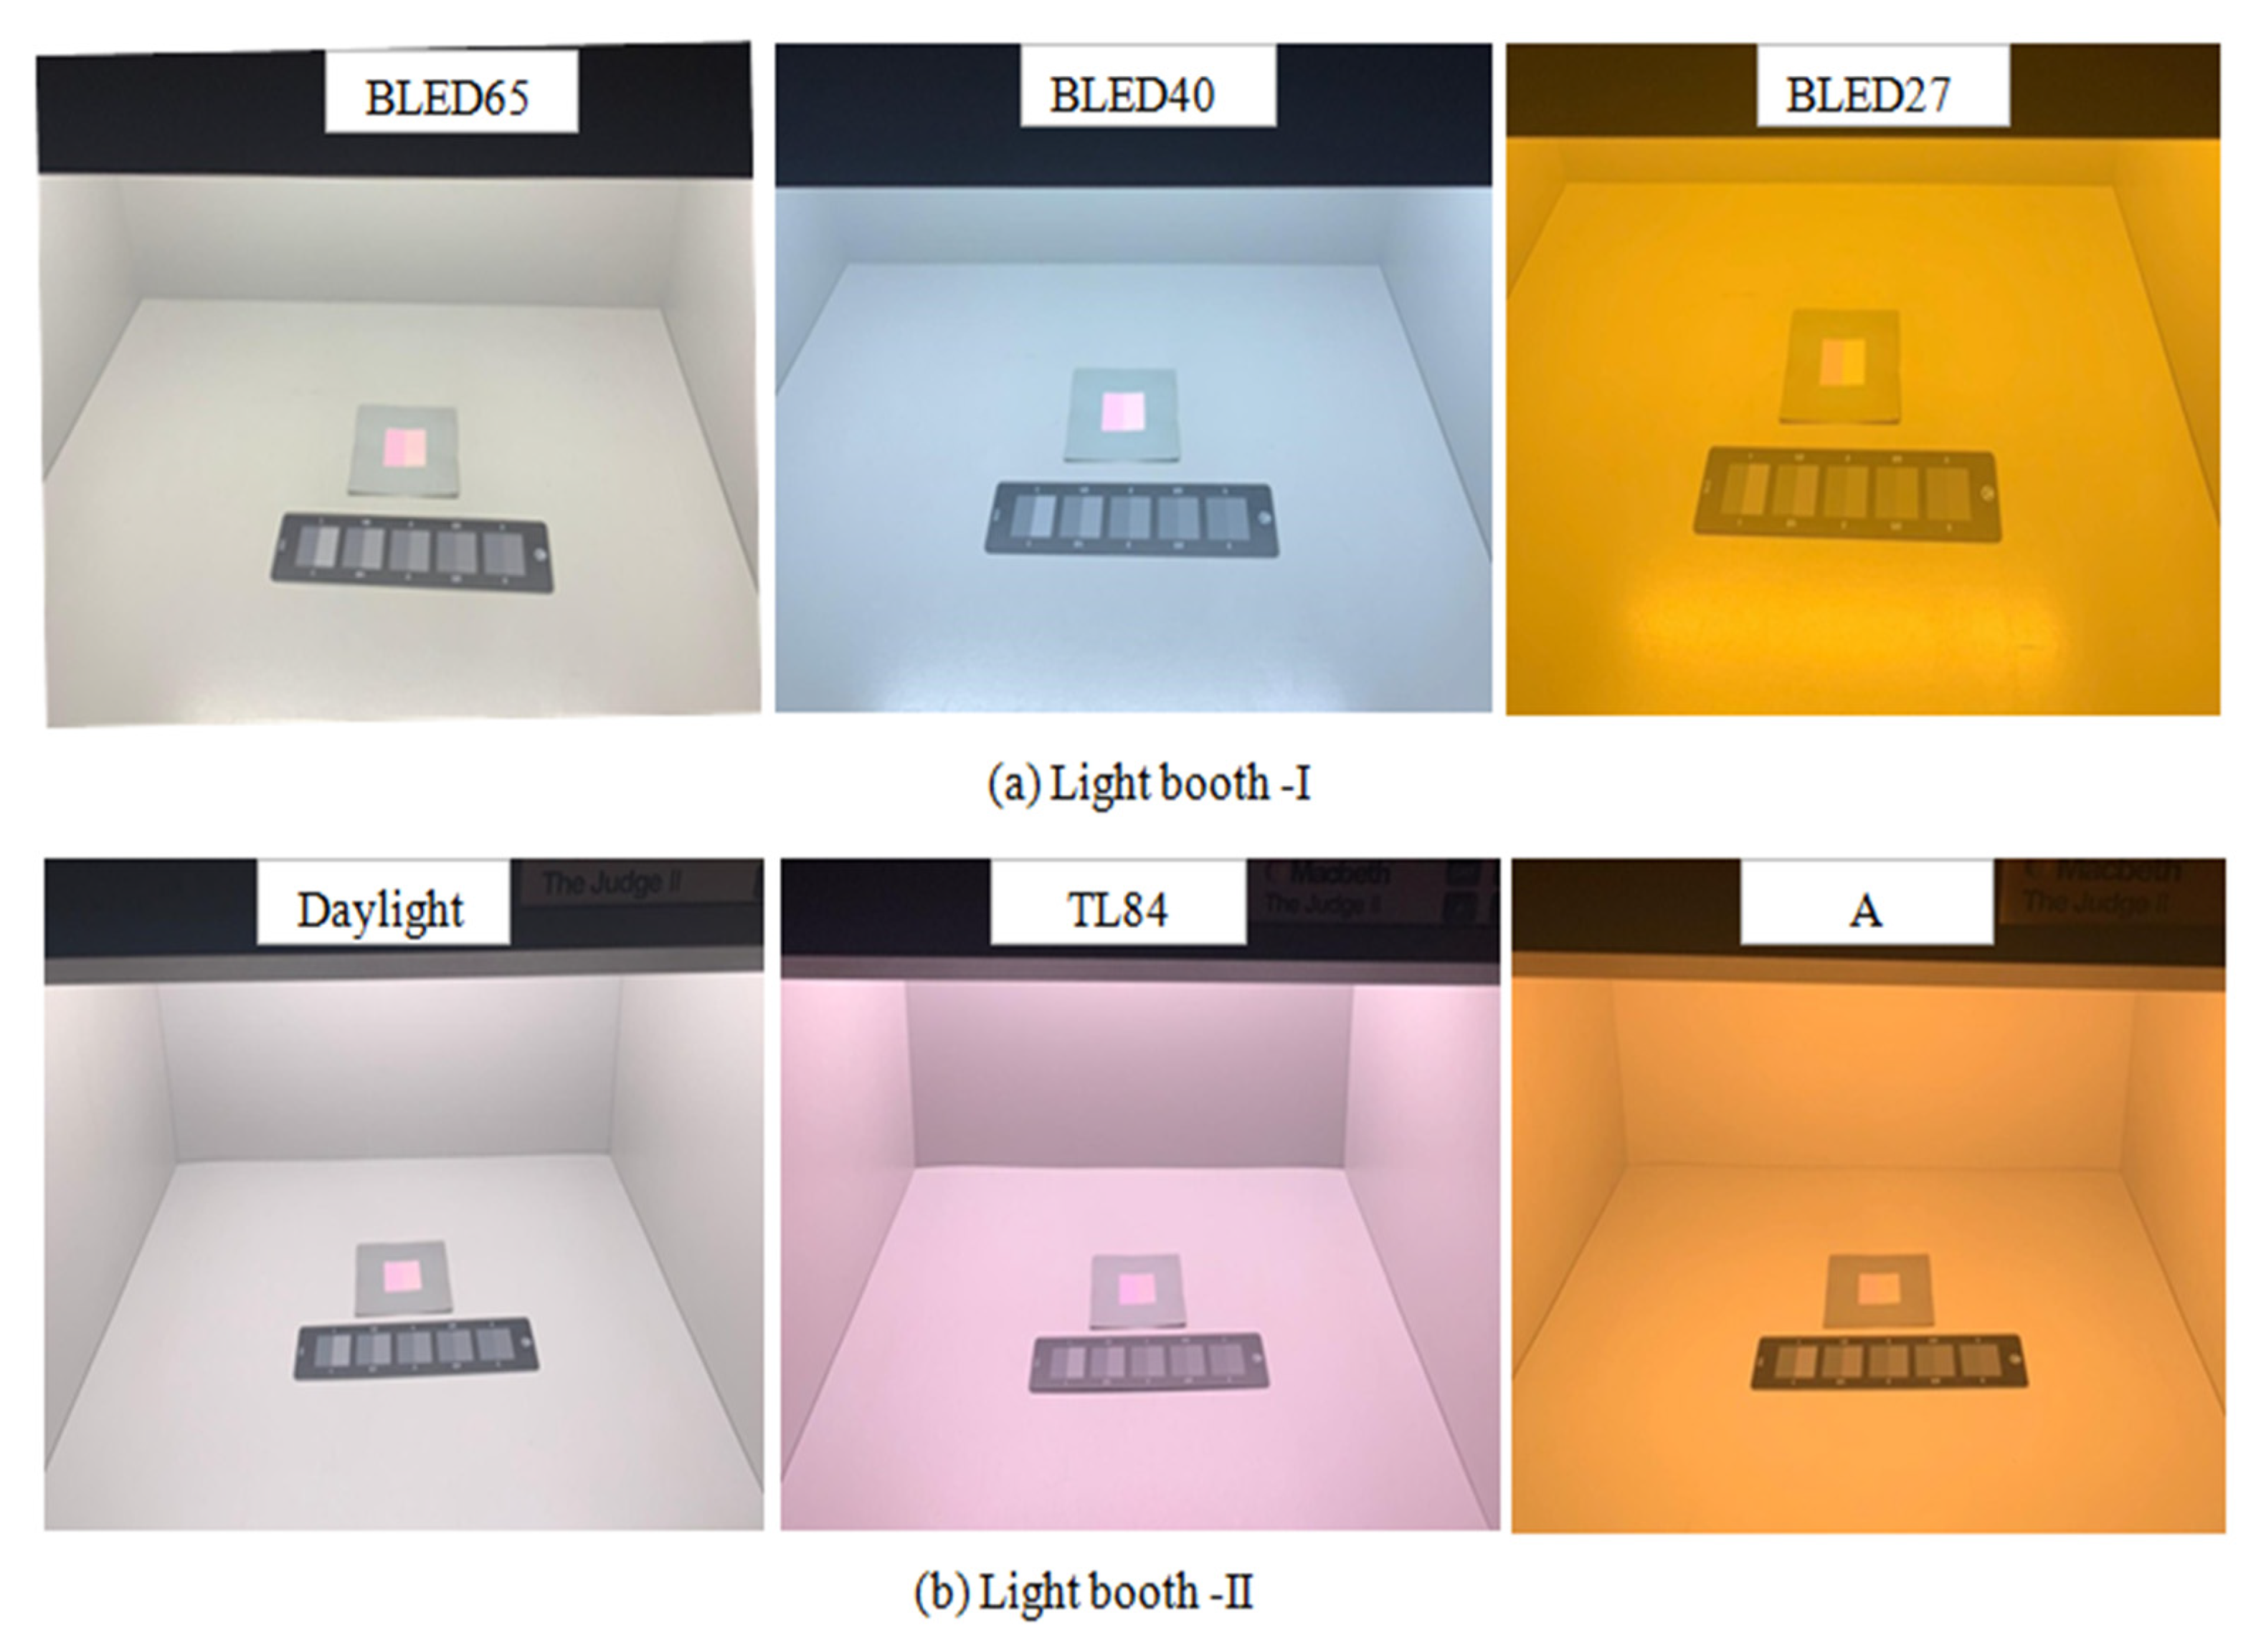
A psychophysical experiment was conducted under two standard lighting booths to obtain visual data from 10 observers for eleven metameric sample pairs. All observers had normal color vision tested by the Ishihara color vision test. A total of 11 people (6 men and 5 women) took part in the pretest, including one man with color vision deficiency. The ages of the participants ranged from 20 to 57 with the average of 31 years old and SD 13.01. Data from the observers with defective color vision were discarded. All eleven metameric pairs were presented to all observers in five consecutive sessions under testing lighting conditions. The observers were asked to adapt to the mid-gray interior of the booth for 2 min after each new lighting condition. After adaptation, they were provided with the gray scale and sample pairs.
Due to the determination method used in the experiment; the participants were required to evaluate and compare the sample pair with gray scale. Each participant was asked to determine a closest gray-scale value according to his/her own perception. The distance between observers and sample was 50 cm. The illumination: viewing geometry was always approximately 0°:45°. The visual experiment was conducted in a completely darkened room. Figure 4 is demonstrating the position of a sample pair along with gray scale during visual assessment.
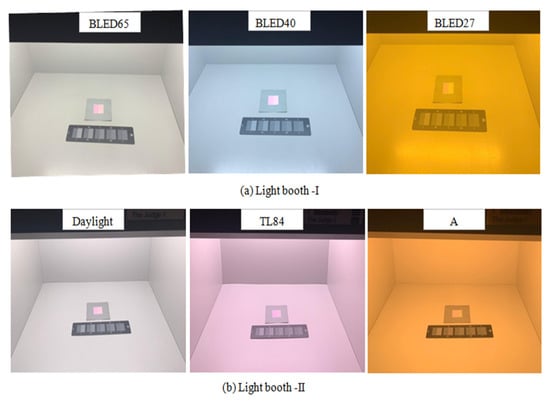
Figure 4.
Viewing condition for color difference experiment under two lighting booths.
2.4. Data Analysis
2.4.1. Standard Deviation (SD) and Standard Error of the Mean (SEM)
Standard deviation (SD) measures the deviation of the individual estimate from the mean value, while standard error of the mean (SEM) gives the accuracy of a sample’s mean by measuring the sample-to-sample variability of the sample means. The SEM describes how precise the mean of the sample is as an estimate of the true mean of the population. Standard deviation (SD) and standard error of the mean (SEM) are calculated by using Equations (1) and (2):
where = the sample’s mean and n= the sample size.
2.4.2. Visual Color Difference with Gray Scale
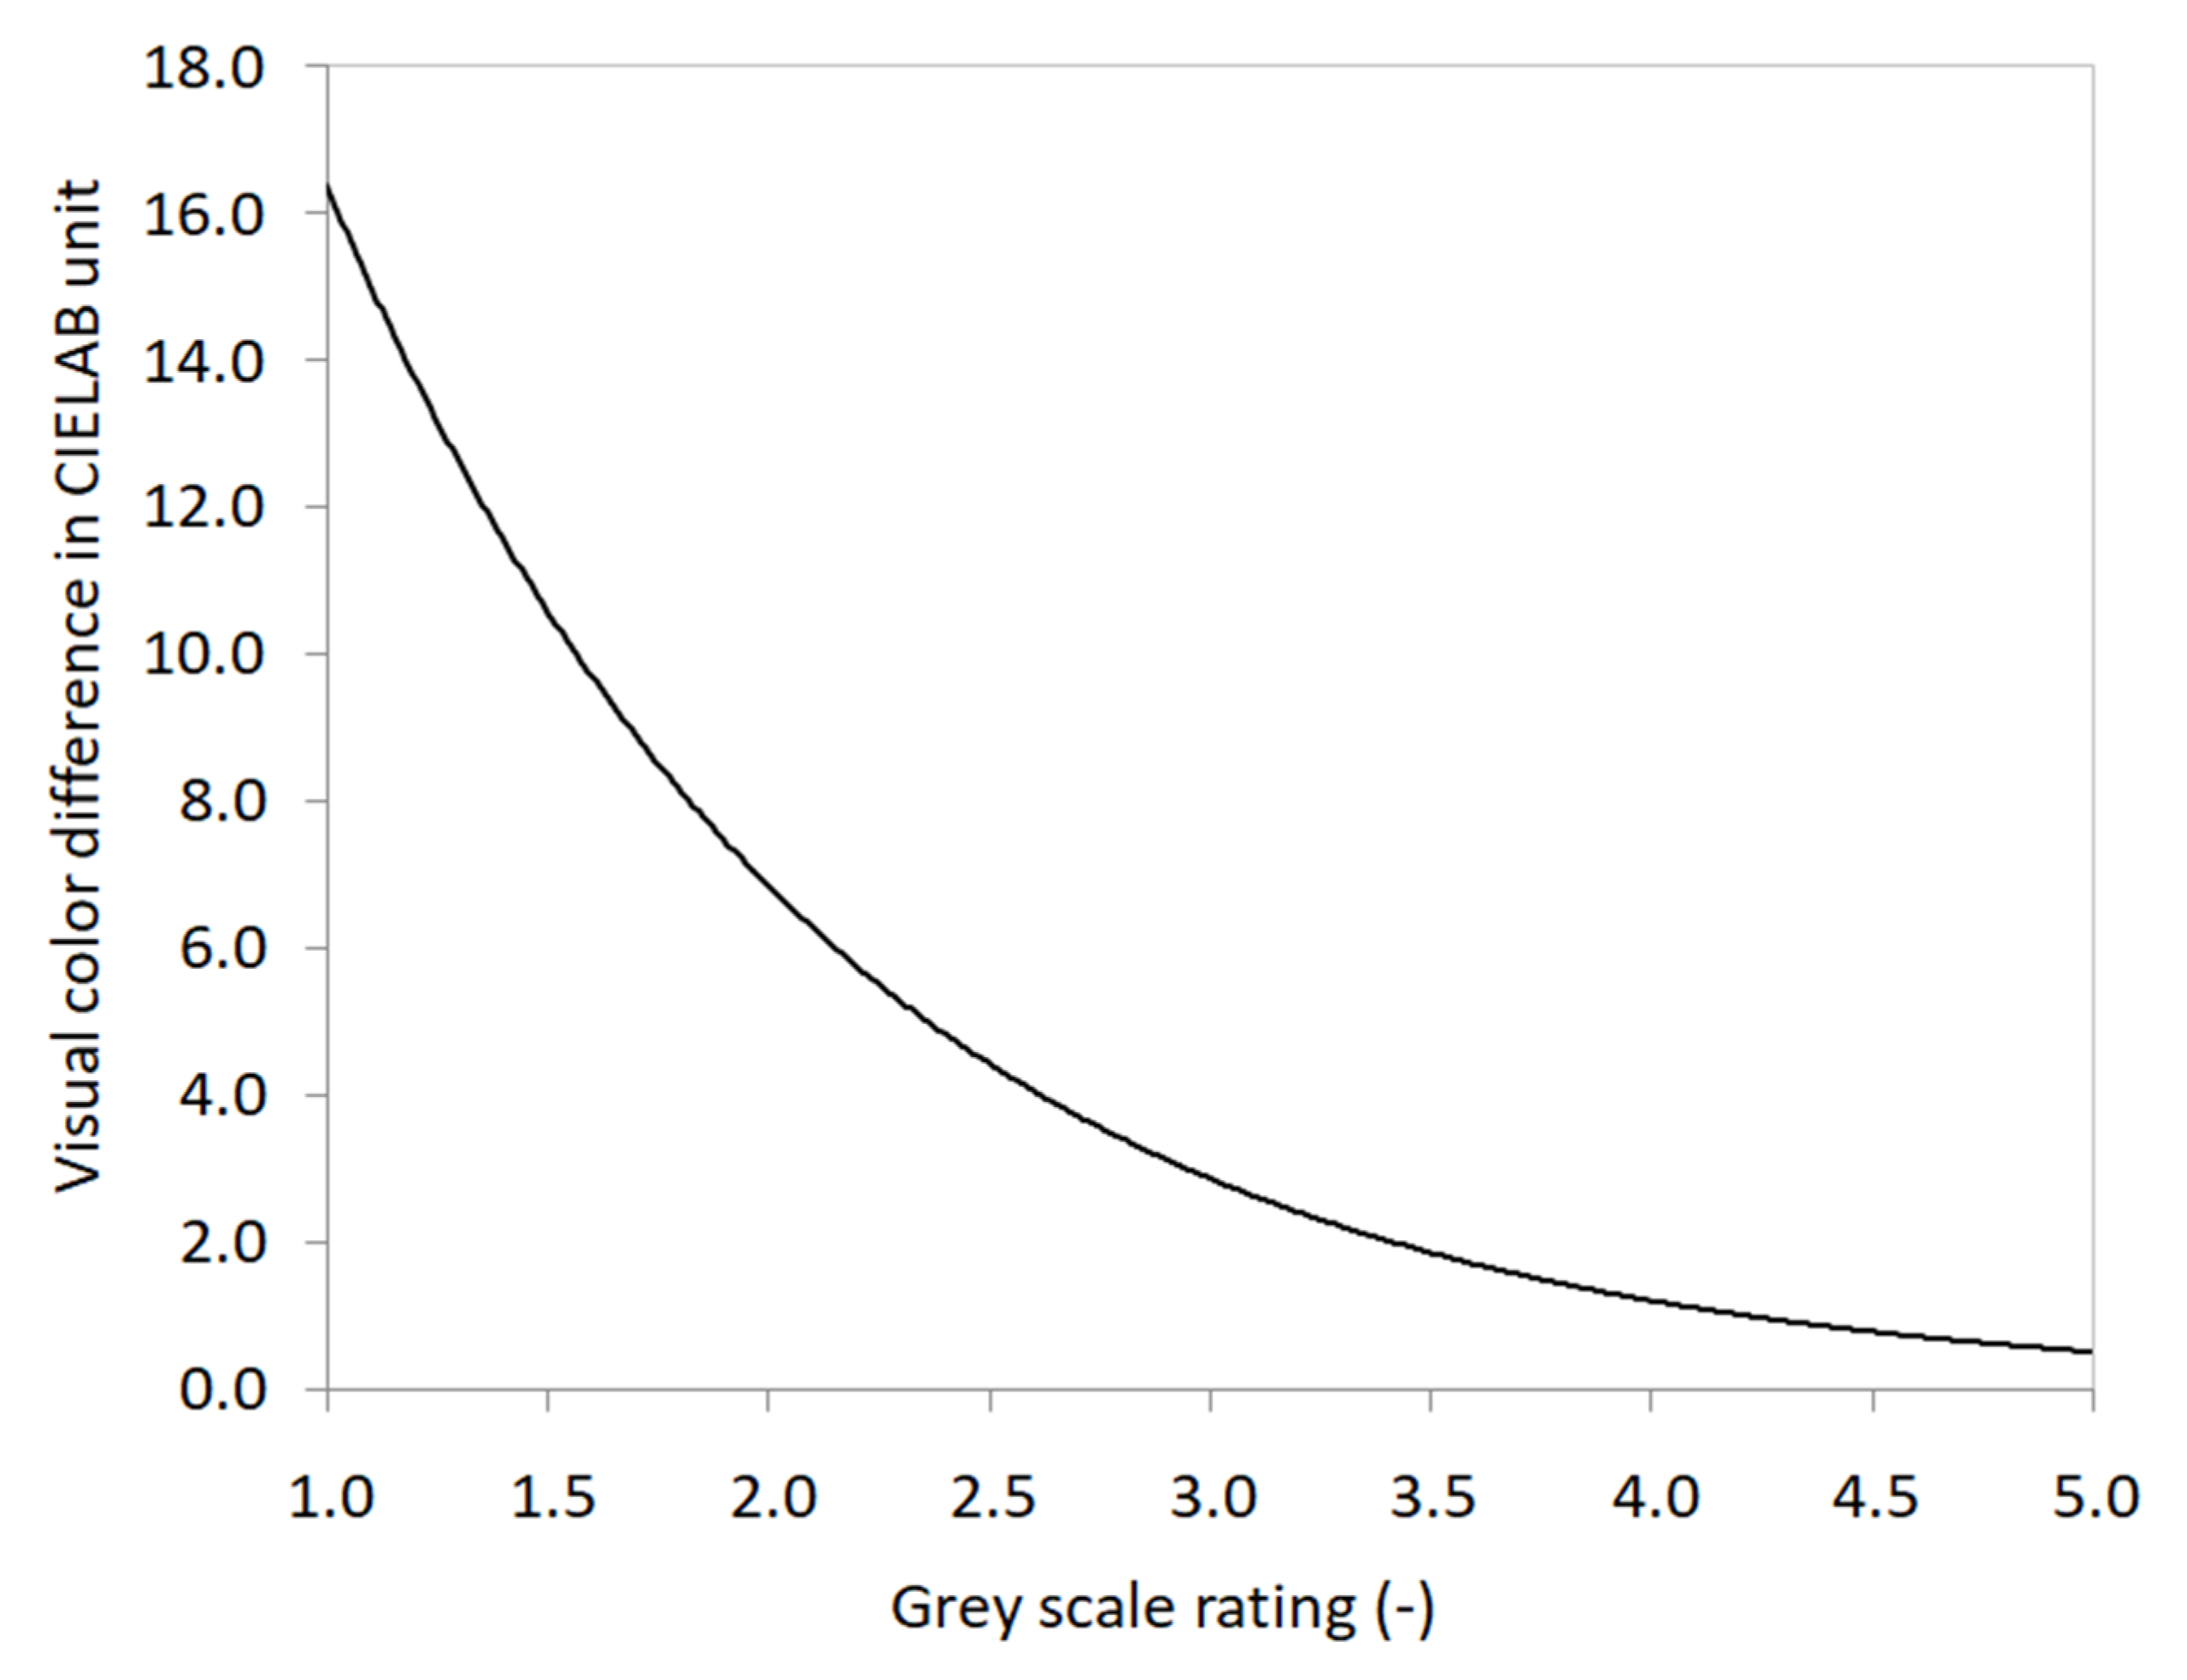
The gray scale is used to visually assess and compare the change in color difference appearance, as described in ISO 105-A02 [29]. It consists of a 9-grade point from 1 to 5 within a half-step rating of 5, 4–5, 4, 3–4, 3, 2–3, 2, 1–2, and 1, with 1 indicating extreme color differences and 5 meaning that there is no color difference in a pair. After visual assessments, the gray scale number (GS) for each pair was transformed to the corresponding visual color difference (∆V) in CIELAB unit by Equation (3):
This exponential Equation (3) is used to predict the CIELAB color difference from the gray-scale rating, as shown in Figure 5.
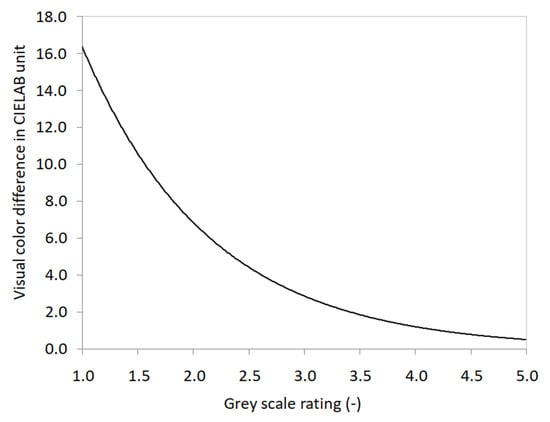
Figure 5.
Visual color difference in CIELAB unit as a function of gray-scale rating.
2.4.3. STRESS and Performance Factor (PF/3)
The repeatability and reproducibility of measurements in a psychophysical experiment depends on the ability of a single observer’s or a group of observers’ ability to produce the same measurements consistently under the same experimental setup. A higher variability of the measurement indicates a lower reliability of the estimate. In order to determine inter-variability (the deviation between the estimate of each individual from the mean) and intra-variability (the deviation between the results of an individual on repeated attempts in an experiment), a metric index, which is called the “standardized residual sum of squares” (STRESS), is used by many researchers in the color science field [30,31,32,33]. The percentage STRESS values are always between 0 and 100. STRESS values close to zero indicate a better match between two data sets. In color difference studies, a STRESS value above 35 is typically an indicator of poor performance of the color difference formula [34]. In addition to the STRESS index, the performance factor (PF) modified by Guan and Luo [35] is also used to compare the best fitted model with different experimental data sets.
The STRESS value and performance factor can be calculated by using Equation (4):
where ΔEi and ΔVi are the computed and the perceived color difference for the i =1, n sample pair respectively and F1 is an adjusting factor between ΔEi and ΔVi.
Meanwhile, the performance factor is as follows:
PF/3 = (100/3) * (Gamma − 1 + Vab + CV/100)
PF/3 is obtained as an average of three terms including the Gamma factor and two coefficients of variation Vab and CV.
3. Results and Discussion
3.1. Visual Assessment Variability within Samples under Two Lighting Booths
The effects of the light booth’s design in term of light source on the L*a*b* values and inter-observer variability are shown in Figure 6 and Figure 7, respectively. Table 2 shows that the light booth technology has a clear impact on the resulting L*a*b* values.
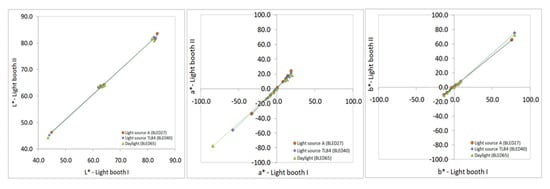
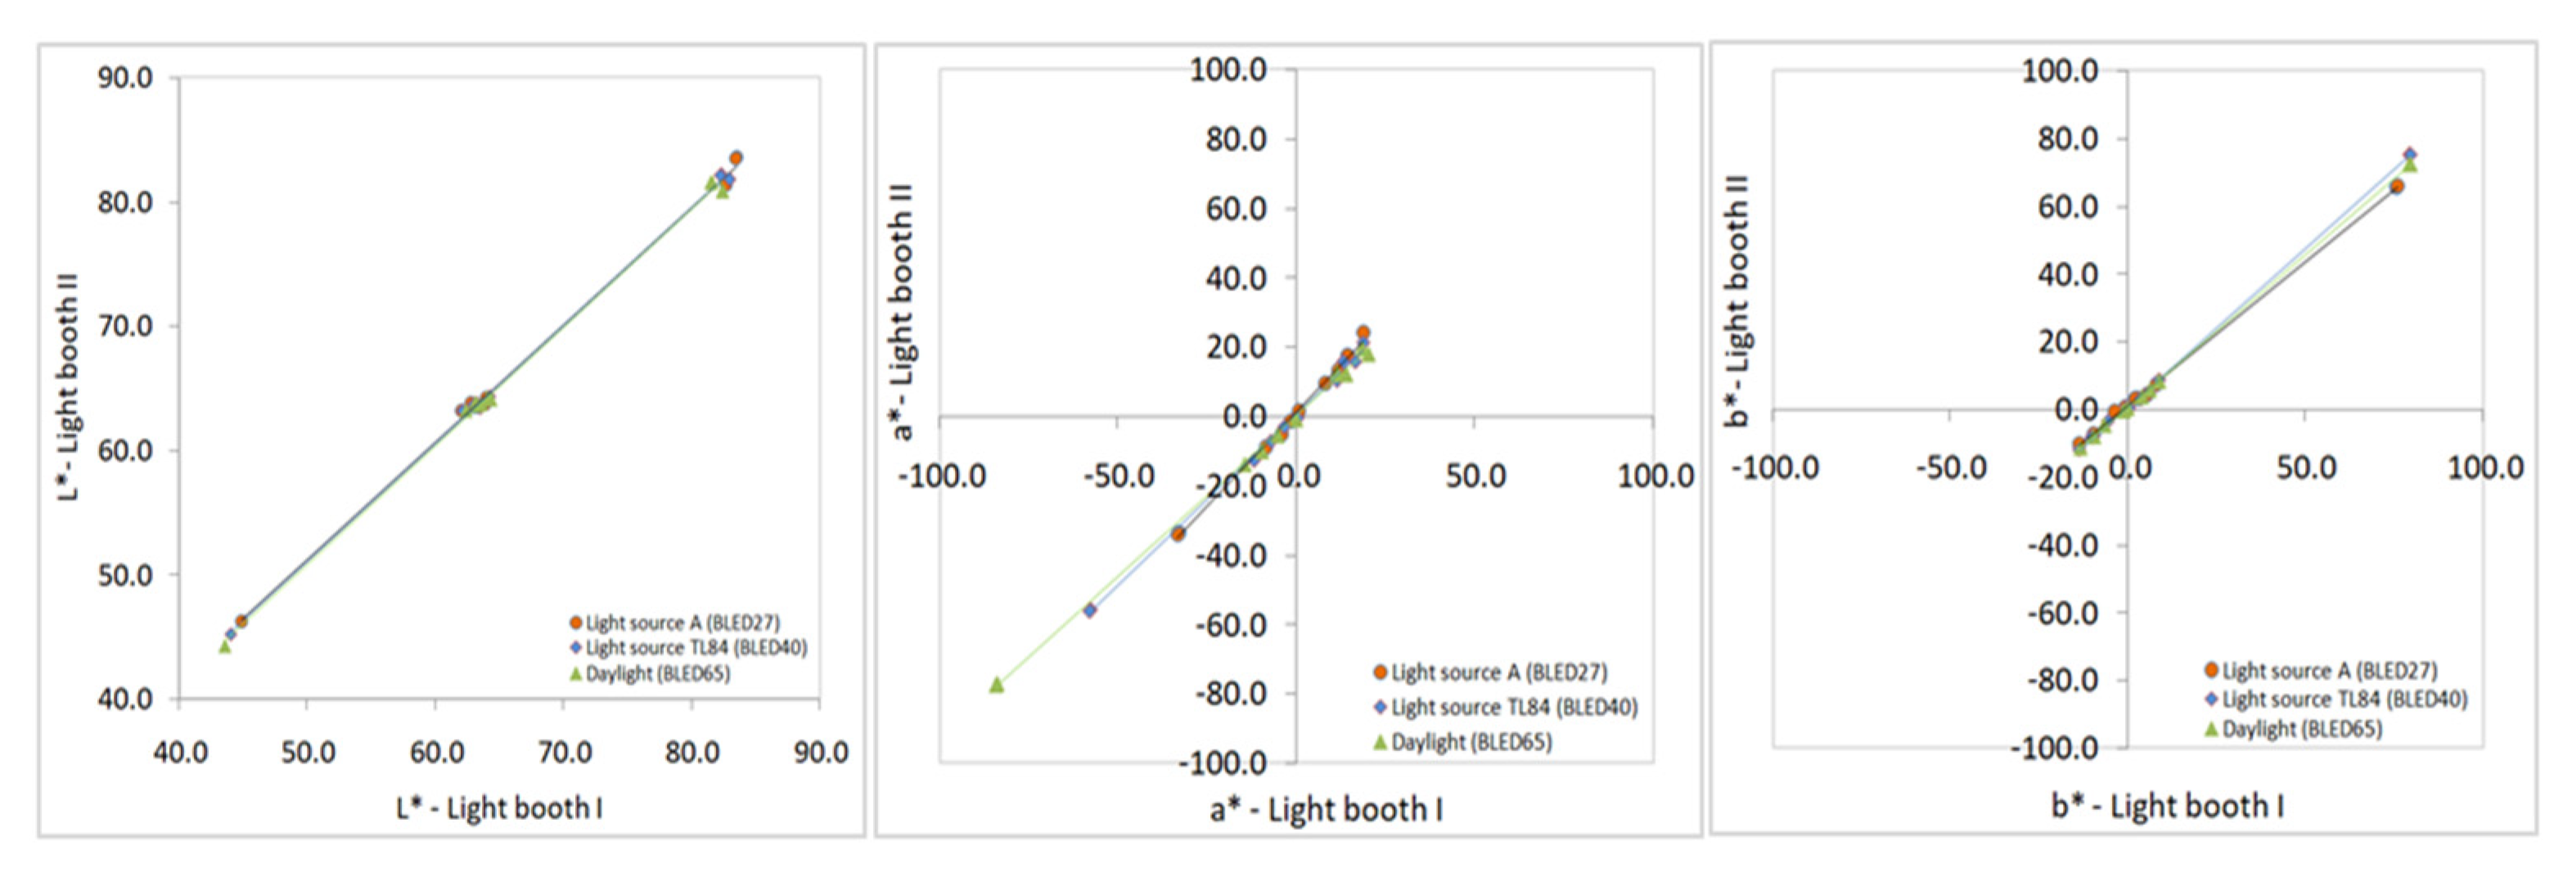
Figure 6.
CIE L*a*b* values for different light sources of the two booths. In the figure, BLED65, BLED40, and BLED27 represent the light sources with nominal CCT 6500 K, 4000 K, and 2700 K respectively for light booth I; and Daylight (Simulator D65), TL84 (Tri-band fluorescent tube), and A (Tungsten lamp) represent the light sources with nominal CCT 6500 K, 4000 K, and 2700 K, respectively for light booth II.
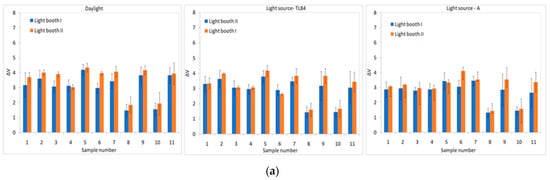

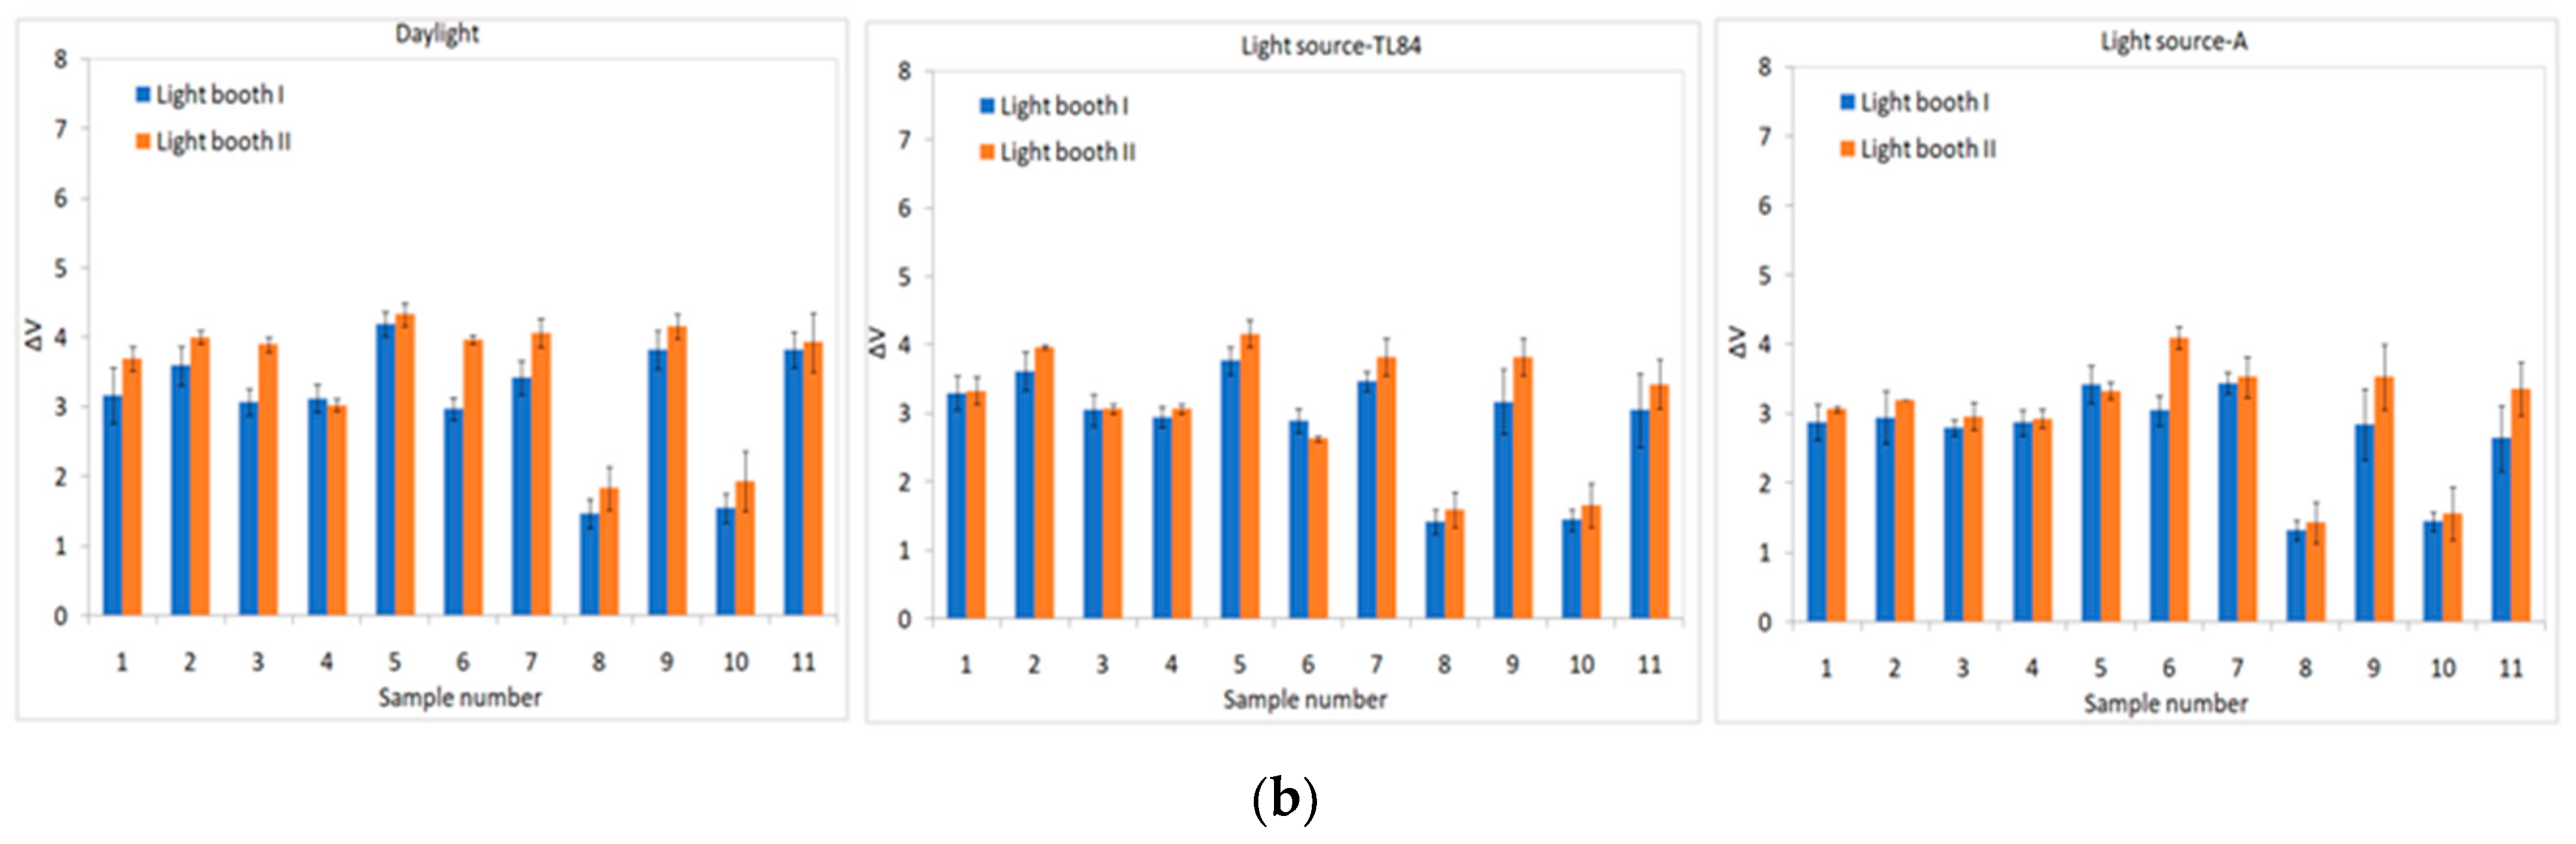
Figure 7.
Average inter-observer variability of all metameric pairs under each light source with (a) standard deviation (SD) bars; (b) standard error of the mean (SEM). In the figure, BLED65, BLED40, and BLED27 represent the light sources with nominal CCT 6500 K, 4000 K, and 2700 K, respectively for light booth I; and Daylight (Simulator D65), TL84 (Tri-band fluorescent tube), and A (Tungsten lamp) represent the light sources with nominal CCT 6500 K, 4000 K, and 2700 K respectively, for light booth II.
Table 2.
Mean CIE L*a*b* values for different light sources of the two booths. In the table, BLED65, BLED40, and BLED27 represents the light sources with nominal CCT 6500 K, 4000 K, and 2700 K respectively for light booth I; and Daylight (Simulator D65), TL84 (Tri-band fluorescent tube), and A (Tungsten lamp) represent the light sources with nominal CCT 6500 K, 4000 K, and 2700 K, respectively for light booth II.
There were significant differences between the two booths for all mean CIELAB values for the test metameric pairs, as shown in Table 2. All observed correlations, which are shown in Figure 6, agree with the hypothesis that both light booths gave the same values up to a linear transformation.
The results from Figure 7a show that the inter-variability among observers for samples 9 and 11 is large, while it is low for samples 3,4,5,6, and 7 under all experimental conditions. Almost the same average variability was found for samples 8 and 10 under CCT 4000 K and CCT 2700 K, but the highest was found for CCT 6500 K for both booths. Samples 1 and 2 showed the highest variability with changes of light sources for two booths. Among all light sources, all samples under CCT 2700 K showed a high degree of variability.
Figure 7a,b show the visual color difference among samples with standard deviation bars and standard error of the mean (SEM) bars of two light booths. In the figure, the vertical lines denote standard deviation and standard error of the mean (SEM). It also shows that the visual evaluation of the tested sample pairs was consistent.
Figure 7a shows that light booth I had a comparatively smaller influence on the visual assessment than light booth II, as expected, and the results from the standard error of the mean (SEM) of Figure 7b justified the results from Figure 7a. Analysis of the results shows that the observer and sample’s variability should be modeled considering light booth’s technology to estimate its contribution to the overall variability.
3.2. Comparison of Visual and Measured Color Difference of Two Light Booths
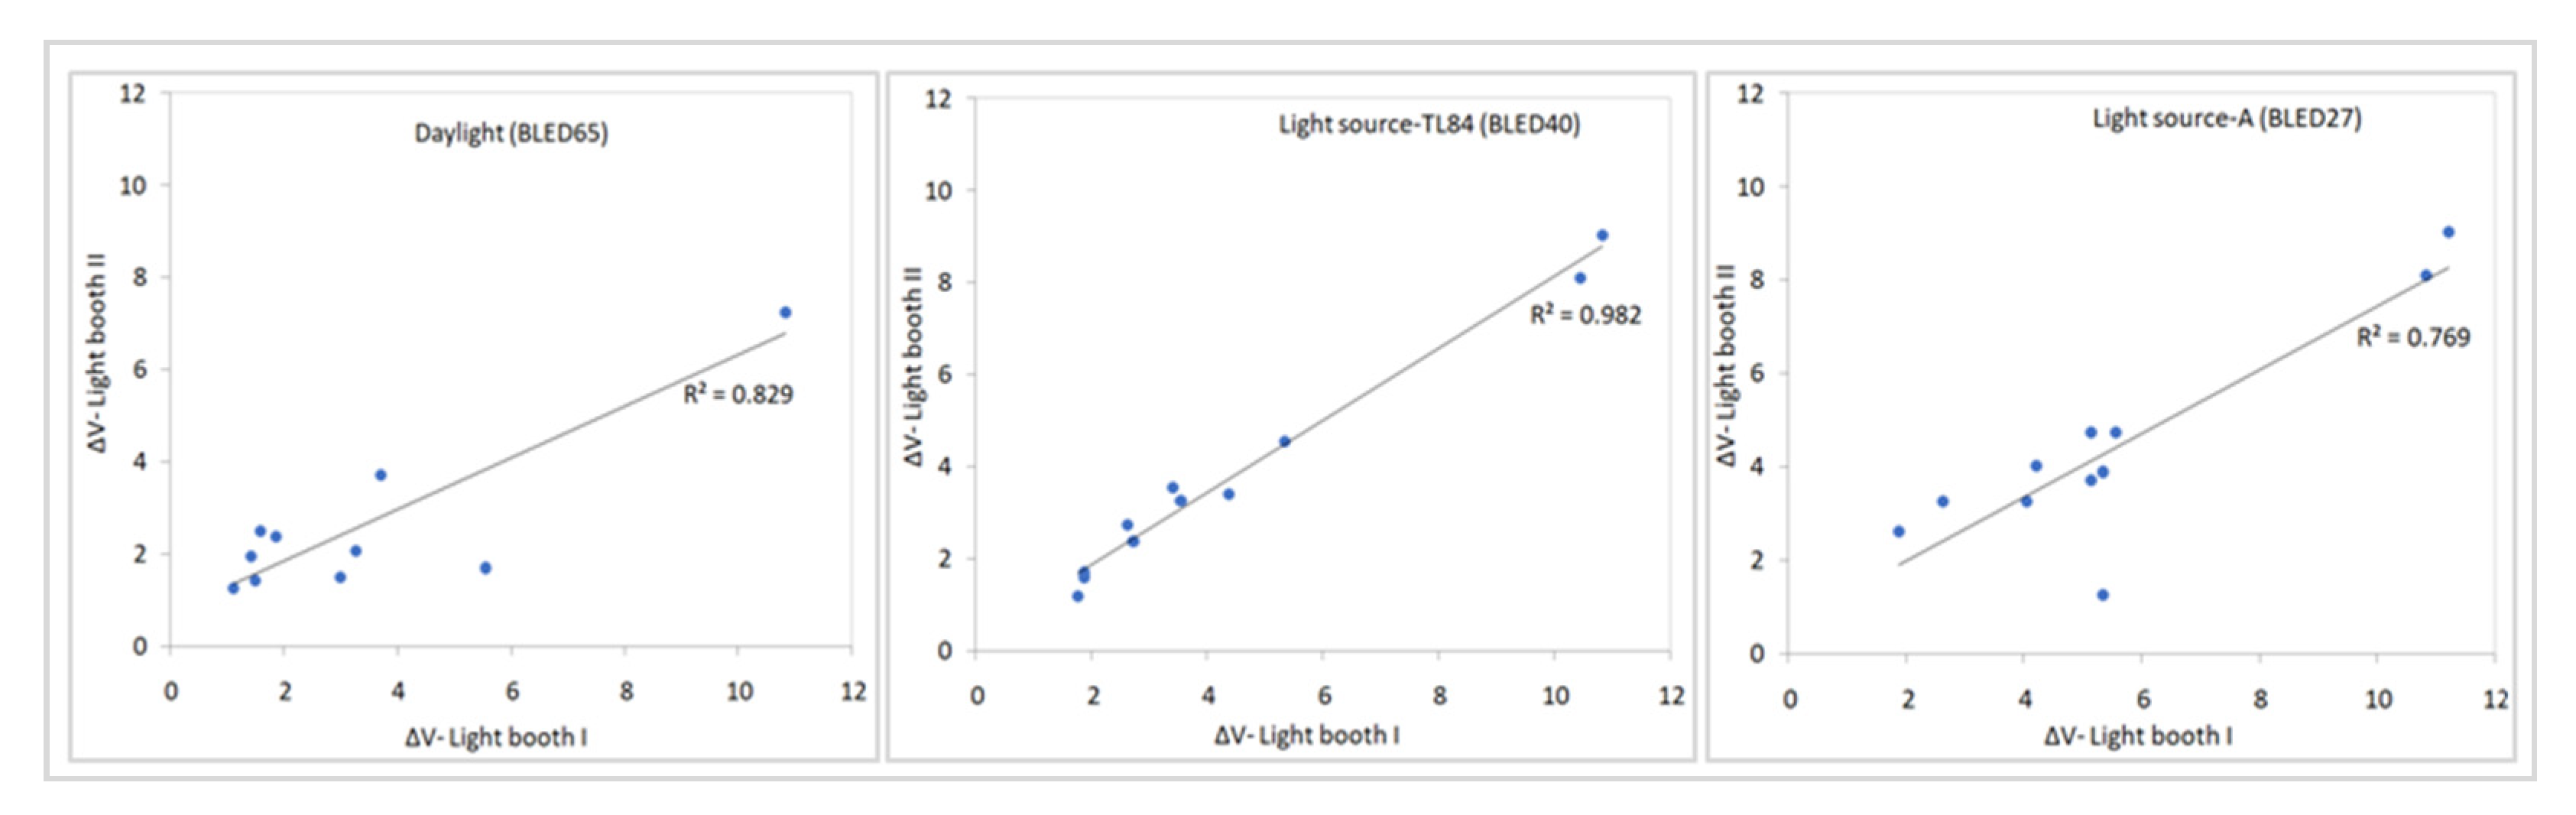
The effects of light sources on the visual and measured color differences for two different standard lighting booths are shown in Figure 8 and Figure 9. Figure 8 shows the correlation of the visual color difference between two booths under experimental lighting conditions. As shown in Figure 8, the strongest correlation was found for CCT 4000 K and a relatively poor correlation was found for CCT 2700 K. The reason could be the relatively distant position of light BLED27 of light booth I from the daylight series. As expected, observers had performed better under daylight. The measurements showed significant differences related to light booth conditions, while Figure 9 shows how visual performance correlates with the measured color differences between pairs of samples.
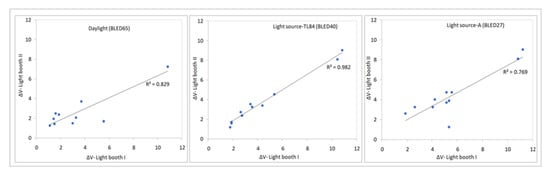
Figure 8.
Visual color difference under different light sources between two booths. In the figure, BLED65, BLED40, and BLED27 represent the light sources with nominal CCT 6500 K, 4000 K, and 2700 K respectively for light booth I; and Daylight (Simulator D65), TL84 (Tri-band fluorescent tube), and A (Tungsten lamp) represent the light sources with nominal CCT 6500 K, 4000 K, and 2700 K respectively for light booth II.
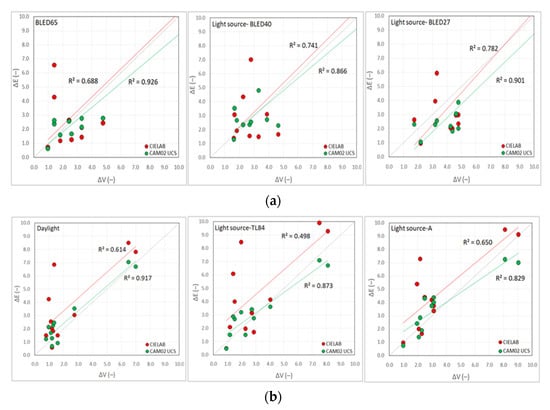
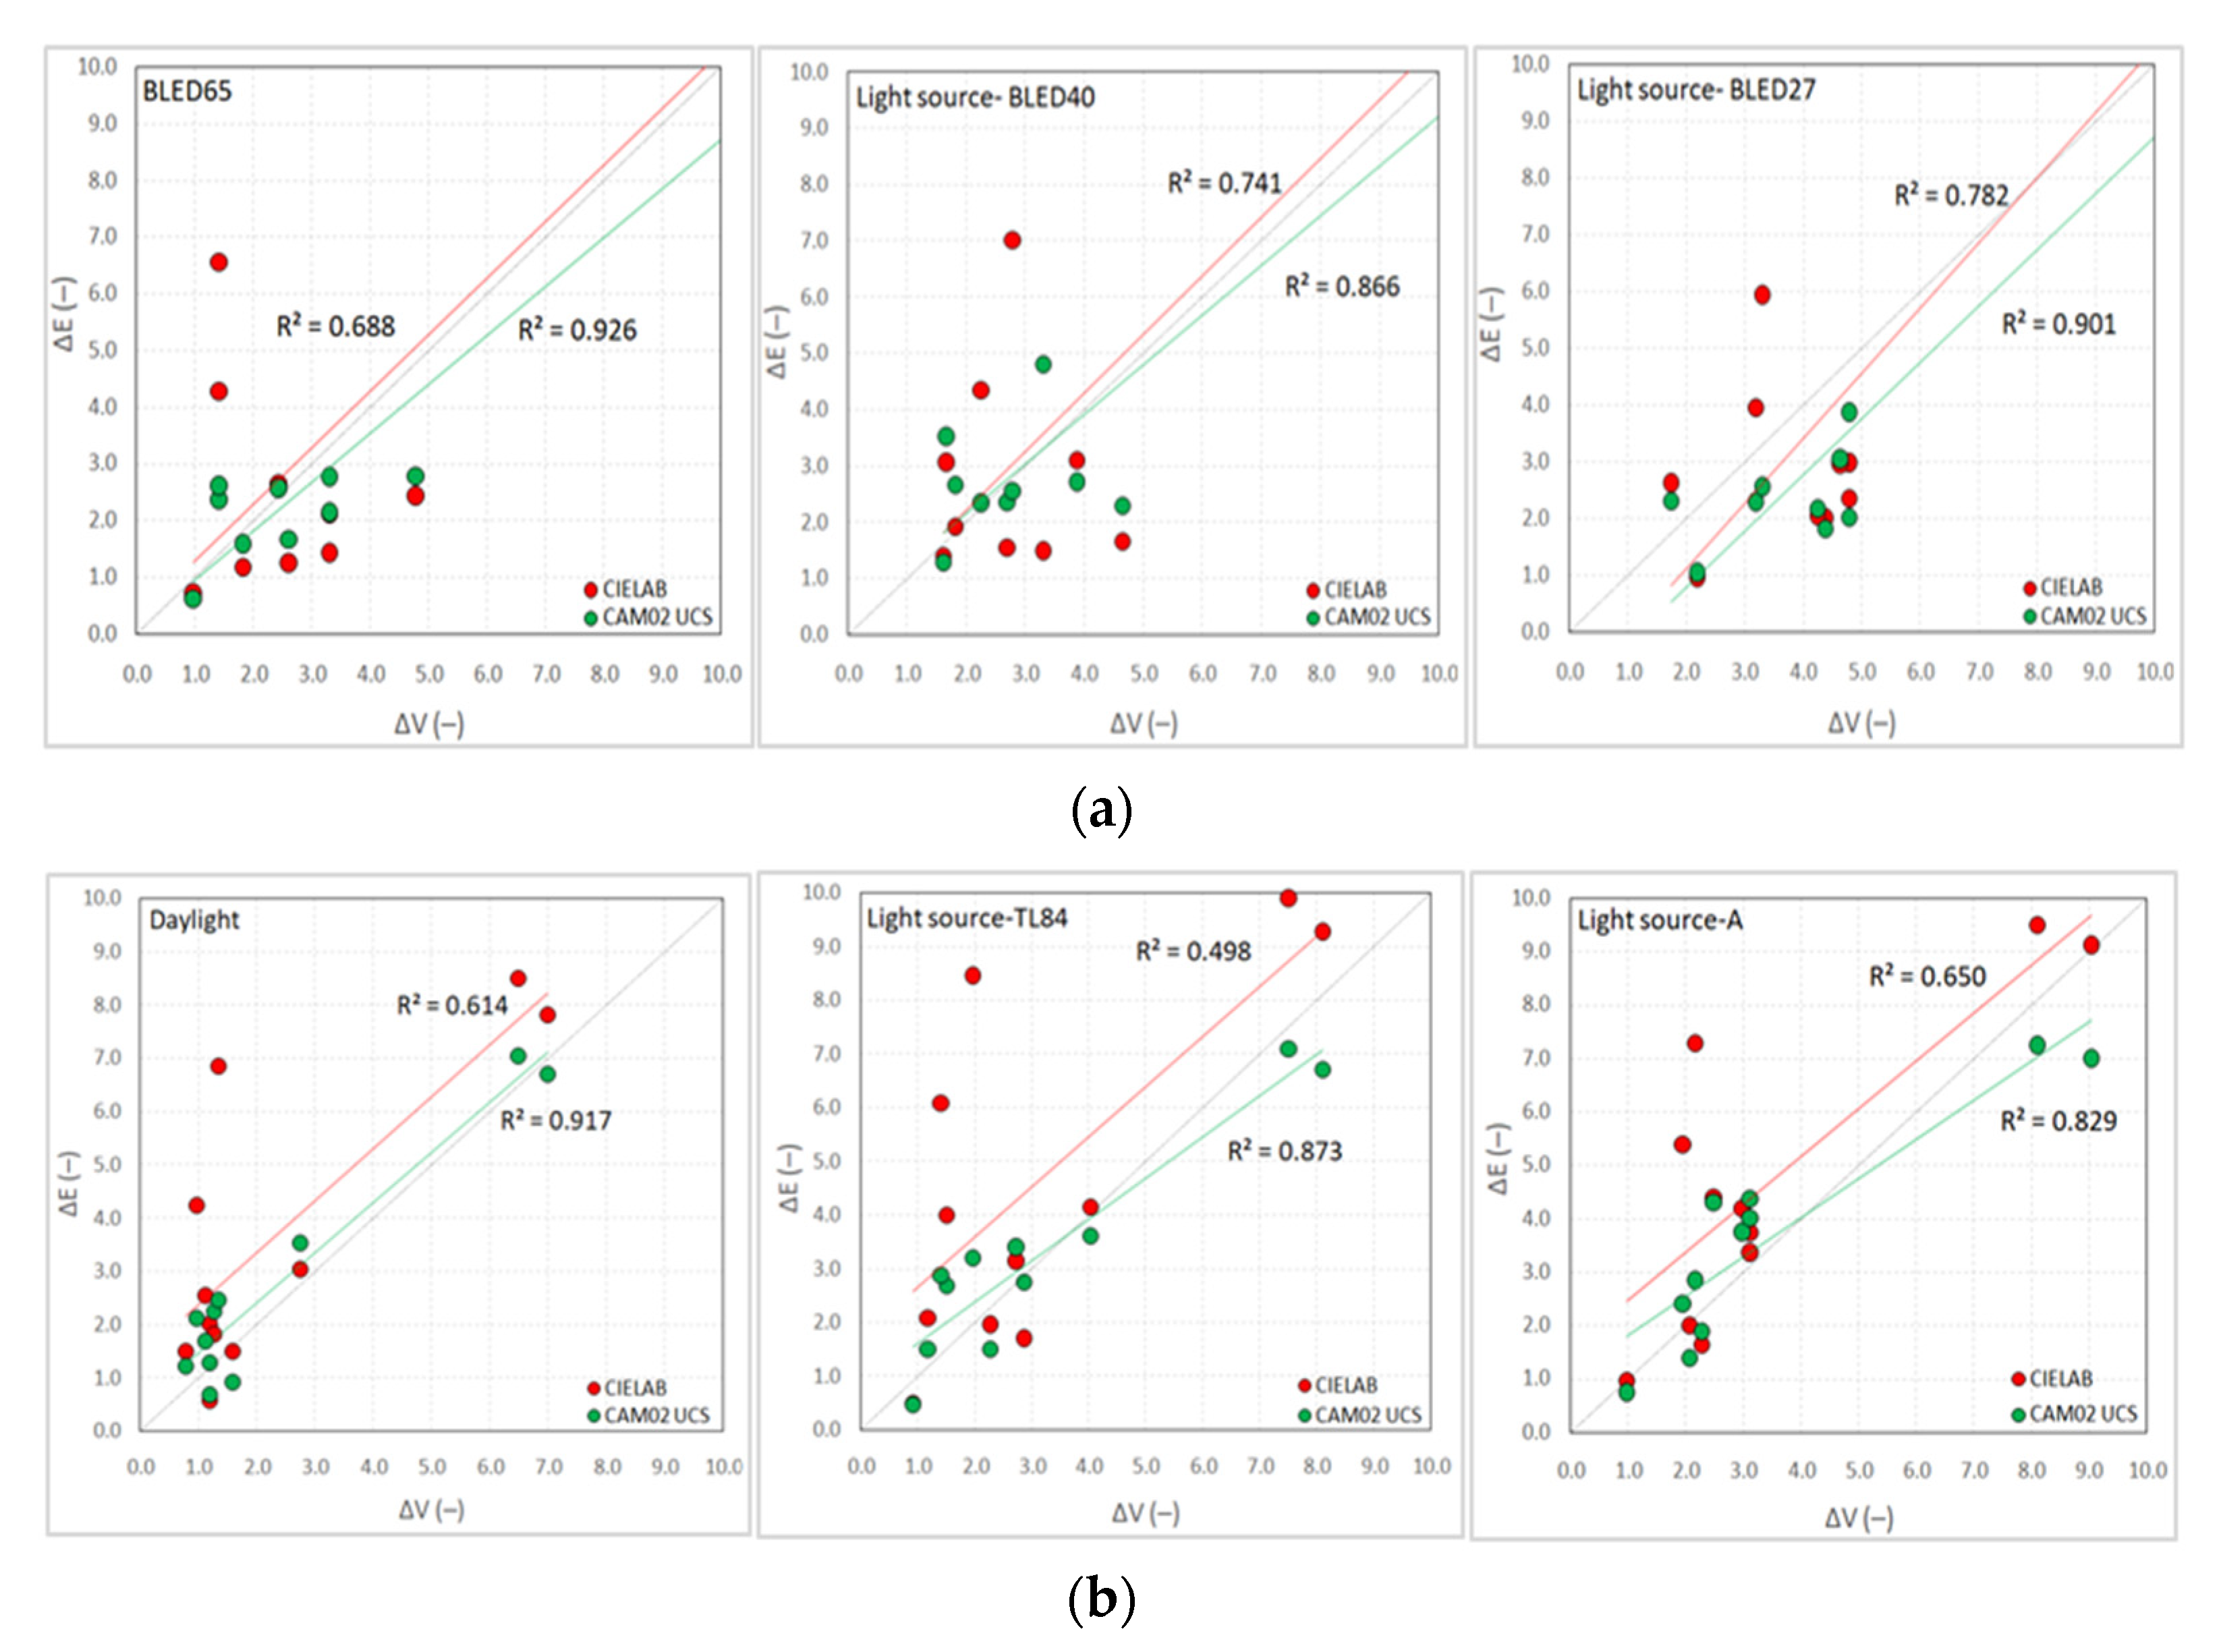
Figure 9.
Correlation between visual and formula-based color difference of different light sources. In the figure, BLED65, BLED40, and BLED27 represent the light sources with nominal CCT 6500 K, 4000 K, and 2700 K, respectively for light booth I; and Daylight (Simulator D65), TL84 (Tri-band fluorescent tube), and A (Tungsten lamp) represent the light sources with nominal CCT 6500 K, 4000 K, and 2700 K respectively for light booth II. (a) Light booth I, (b) Light booth II.
The spectra and the CCT values (from Figure 2 and Figure 3; and Table 1) show differences between the two booths. For all lighting settings, the formula based on CAM02-UCS showed better agreement than CIELAB. Both CIELAB and CAM02-UCS performed better under light booth I than light booth II as expected. Considering our results, it can be said that the variability between the visual and measured color difference is influenced by booth conditions.
3.3. Performance of Color Difference Formula
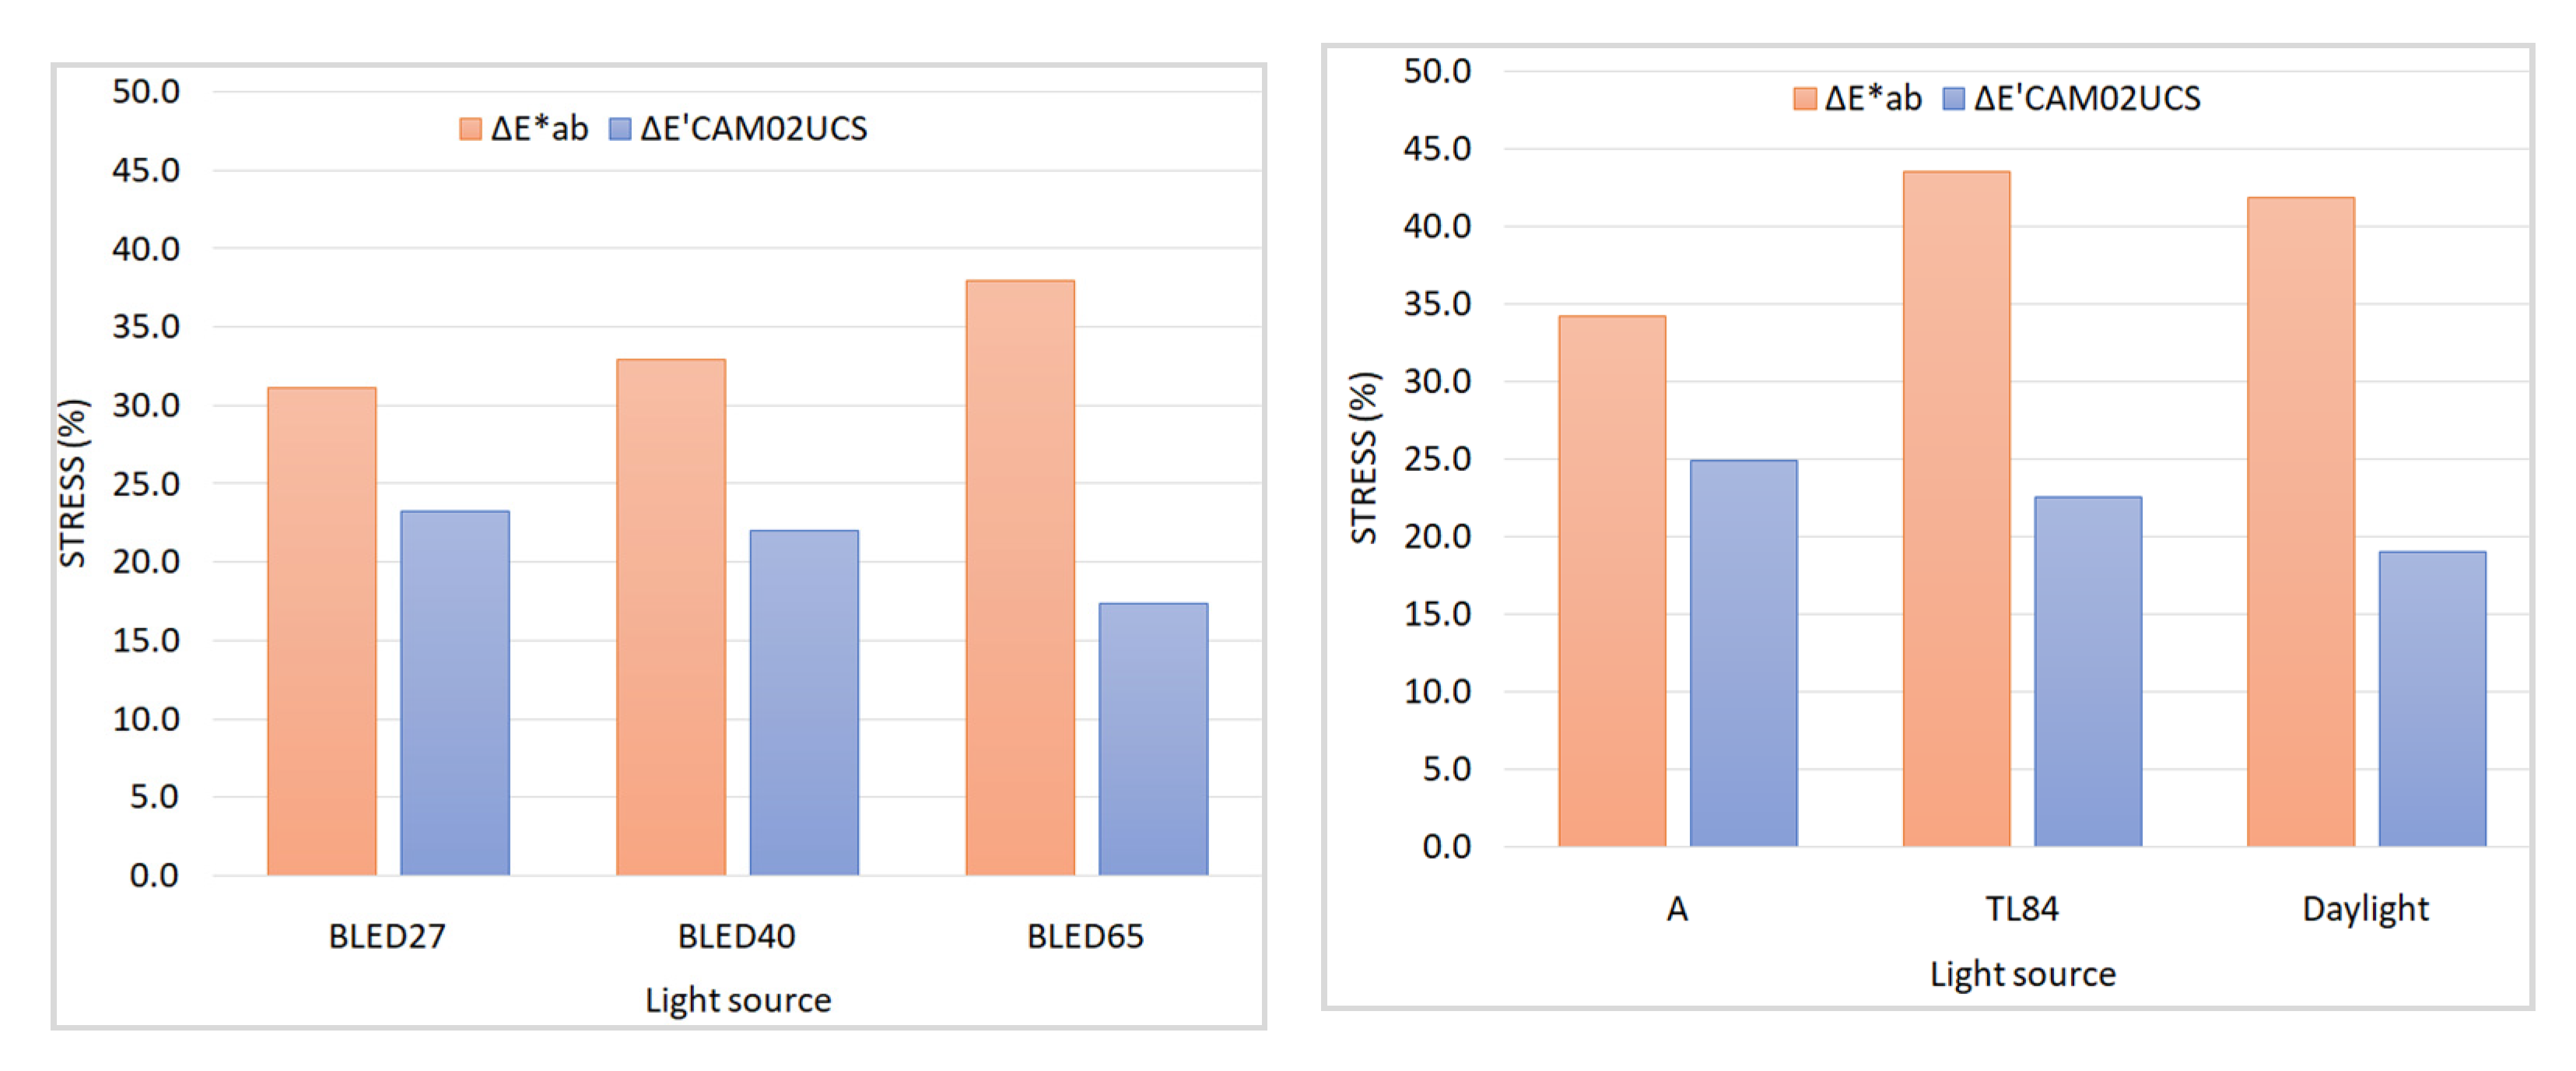
The reliability of the color difference assessment was evaluated by inter-observer variability in terms of STRESS value, performance factor (PF/3), and correlation coefficient (COQ), as shown in Figure 10 and Table 3. According to our results, all three metrics such as STRESS, PF/3, and COQ showed better results for the CAM02-UCS model than the CIELAB among all light sources. The reason for this could be that the appearance-based models predict well the role of illuminations in perceived color differences [20].
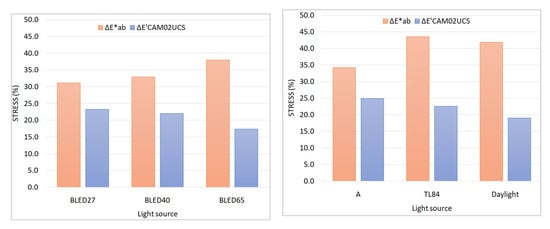
Figure 10.
Performance of color difference formula in term of STRESS. Left: light booth I, right: light booth II. In the figure, BLED65, BLED40, and BLED27 represent the light sources with nominal CCT 6500 K, 4000 K, and 2700 K respectively for light booth I; and Daylight (Simulator D65), TL84 (Tri-band fluorescent tube), and A (Tungsten lamp) represent the light sources with nominal CCT 6500 K, 4000 K, and 2700 K respectively for light booth II.
Table 3.
Performance of color difference formulas in term of STRESS, COQ, and PF/3. In the table, BLED65, BLED40, and BLED27 represent the light sources with nominal CCT 6500 K, 4000 K, and 2700 K respectively for light booth I; and Daylight (Simulator D65), TL84 (Tri-band fluorescent tube), and A (Tungsten lamp) represent the light sources with nominal CCT 6500 K, 4000 K, and 2700 K respectively for light booth II.
As can be seen from Table 1, and Figure 2 and Figure 3 in Section 2.2, the fluctuations between the SPDs and luminances of all three light sources between two booths were significant compared to CCTs. This may be the reason why the observers under light booth II had more difficulties with the visual assessment than under light booth I. Moreover, it can be seen from Table 3 that both formulas gave a comparatively better correlation coefficient but failed to show acceptable performance of fit to the current data set.
The average STRESS values for light booth I were lower than in light booth II, as can be seen from Figure 10. Our results imply that two different standard lighting technologies with the same light sources cannot reproduce the same estimates. The close relationship between perceived and CAM02-UCS suggests that if both booths are used after the light sources have been calibrated, a formula based on color appearance models must be used to predict color appearance. To obtain better agreement between perceived and calculated color difference, one must need to avoid light booths with nominally white light sources.
4. Conclusions
Visual assessments under two light booths differed because of the variation among the light sources’ spectral and colorimetric characteristics. We compared an earlier technology-based light booth, which is still used in the textile industry, and which contains illuminant A (Tungsten lamp) with CCT 2700 K, TL84 (tri-band fluorescent tube) with CCT 4000 K, and simulator D65 (CCT 6500 K), with a different light booth, whose original light sources have been replaced by currently available LED retro kits from equivalent CCTs. As an inexperienced customer or industrial user, our question was, how important is this replacement? The results indicated that two different standard lighting technologies with the similar CCTs cannot reproduce the same estimates because the light sources produced different SPDs. It is illustrating that caution is necessary when comparing results obtained from two different light booths. The variability of the light sources’ SPDs or the observer or the sample should be modeled considering the light booth’s technology to estimate its contribution to the overall variability. The close relationship between perceived and CAM02-UCS suggests that if both booths are used after the light sources have been calibrated, a formula based on color appearance models must be used to predict color appearance. To obtain better agreement between perceived and calculated color difference, one must need to avoid light booths with nominally white light sources.
Author Contributions
Conceptualization, M.V. (Michal Vik); Data curation, A.A.M.; Formal analysis, A.A.M.; Investigation, A.A.M.; Methodology, A.A.M. and M.V. (Martina Viková); Software, M.V. (Martina Viková); Supervision, M.V. (Michal Vik) and M.V. (Martina Viková); Visualization, A.A.M.; Writing—original draft, A.A.M.; Writing—review and editing, A.A.M. and M.V. (Martina Viková). All authors have read and agreed to the published version of the manuscript.
Funding
This research was funded by the Technical University of Liberec as part of the Student Grant Competition under the project number SGS-2020-6038, as provided by the Ministry of Education, Youth and Sports of the Czech Republic in the year 2020.
Institutional Review Board Statement
Not applicable.
Informed Consent Statement
Not applicable.
Data Availability Statement
The data presented in this study are available on request from the corresponding author.
Conflicts of Interest
No potential conflict of interest was reported by the authors.
References
- Hunter, R.S.; Harold, R.W. The Measurement of Appearance, 2nd ed.; Wiley-Inter Science: New York, NY, USA, 1987. [Google Scholar]
- Billmeyer, F.; Hammond, H. Color and Light. In ASTM Manual 17; ASTM: West Conshohocken, PA, USA, 1996. [Google Scholar]
- Billmeyer, F.; Saltzman, M. Principles of Color Technology, 3rd ed.; John Wiley & Sons: Hoboken, NJ, USA, 2000. [Google Scholar]
- HunterLab: The Worldstrue Measure of Color. Available online: https://www.hunterlab.com/media/documents/basics-of-color-theory.pdf (accessed on 21 November 2021).
- Datacolor. How Medication, Lighting and More Impact Color Perception. Available online: https://www.datacolor.com/factors-that-impact-color-perception/ (accessed on 21 November 2021).
- ASTM, D1729-96 (2009). Standard Practice for Visual Appraisal of Colors and Color Differences of Diffusely-Illuminated Opaque Materials; ASTM International: West Conshohocken, PA, USA, 2014; Available online: www.astm.org (accessed on 17 October 2021).
- CIE15.4:2018. Colorimetry; Commission Intermationale de I’Eclairage: Vienna, Austria, 2018. [Google Scholar]
- CIE51.2:1995. A Method for Assessing the Quality of Daylight Simulators for Colorimetry; Commission Intermationale de I’Eclairage: Vienna, Austria, 1999. [Google Scholar]
- Luo, M.R.; Lv, X. LED simulators for the reproduction of the new CIE standard LED sources. In Proceedings of the 29th Quadrennial Session of the CIE, Washington, DC, USA, 14–22 June 2019. [Google Scholar]
- CIE101-1993. Parametric Effects in Color-Difference Evaluation; Commission Intermationale de I’Eclairage Central Bureau: Vienna, Austria, 1993. [Google Scholar]
- Hinks, D.; Shamey, R. Review of retail store lighting: Implications for colour control of products. Color Technol. 2011, 127, 121–128. [Google Scholar] [CrossRef]
- Liuo, J.J. A Novel color recognition model for improvement on color differences in products via grey relational grade. Axioms 2021, 10, 266. [Google Scholar] [CrossRef]
- Xu, C.; Wu, C.F.; Xu, D.D.; Lai, Y.S. Have the Display Illumination Design Misled Customers on Color Perception? A Study on Differences of Color Caused by LED Lighting on Leather Products. In Proceedings of the AHFE 2020 Virtual Conferences on Design for Inclusion, Affective and Pleasurable Design, Interdisciplinary Practice in Industrial Design, Kansei Engineering, and Human Factors for Apparel and Textile Engineering, Chicago, IL, USA, 16–20 July 2020; Di Bucchianico, G., Shin, C., Shim, S., Fukuda, S., Montagna, G., Carvalho, C., Eds.; Springer Cham: Berlin/Heidelberg, Germany, 2020; Volume 1202, pp. 346–354. [Google Scholar]
- Dou, X.; Wu, C.F.; Lin, K.C.; Liou, J.J. What color does the consumer see? Perceived color differences in plastic products in an LED-Lit environment. Sustainability 2019, 11, 5985. [Google Scholar] [CrossRef] [Green Version]
- Chao, W.C.; Hong, L.Y.; Hsieh, M.C.; Yang, C.C.; Su, L.C. Effect of correlated colour temperature and illuminance levels on user’s visual perception under LED lighting in Taiwan. Ergonomics 2020, 63, 175–190. [Google Scholar] [CrossRef]
- Tantanatewin, W.; Inkarojrit, V. Effects of color and lighting on retail impression and identity. J. Environ. Psychol. 2016, 46, 197–205. [Google Scholar] [CrossRef]
- Lo, V.W.L.; Steemers, K.A. Measuring light in field experiments using dummies and objects: A Study of concert lighting. Light. Res. Technol. 2018, 50, 827–841. [Google Scholar] [CrossRef]
- Ru, T.; deKort, Y.A.; Smolders, K.C.H.J.; Chen, Q.; Zhou, G. Non-image forming effects of illuminance and correlated colortemperature of office light on alertness, mood, and performance across cognitive domains. Build. Environ. 2019, 149, 253–263. [Google Scholar] [CrossRef]
- Dikel, E.E.; Burns, G.J.; Veitch, J.A.; Mancini, S.; Newsham, G.R. Preferred chromaticity of color- tunable LED lighting. Leukos 2014, 10, 101–115. [Google Scholar] [CrossRef]
- Kulappurath, S.K.; Shamey, R. The effect of luminance on the perception of small color differences. Color. Res. Appl. 2021, 46, 929–942. [Google Scholar] [CrossRef]
- Setser, C.S. Color: Reflections and transmissions. J. Food Qual. 1984, 6, 183–197. Available online: https://onlinelibrary.wiley.com/doi/epdf/10.1111/j.1745-4557.1984.tb00824.x (accessed on 21 November 2021). [CrossRef]
- Strange, E.D.; Benedict, R.C.; Gugger, R.E.; Metzger, V.G.; Swift, C.E. Simplified methodology for Measuring Meat color. J. Food Sci. 1974, 39, 988–992. [Google Scholar] [CrossRef]
- Hunt, M.C.; Kropf, D.H. Fresh and cured meat color analysis. In Proceedings of the Muscle foods Symposium-Institute of Food Technologists’ Annual Meeting, Chicago, IL, USA, 8–12 June 1985. [Google Scholar]
- Luo, M.R.; Cui, G.; Rigg, B. The development of the CIE 2000 colour difference formula: CIEDE2000. Color. Res. Appl. 2001, 26, 340–350. [Google Scholar] [CrossRef]
- Claudio, O.M.M.; Huertas, R. Euclidean color difference formula for small medium color differences in log compressed OSA-UCS space. J. Opt. Soc. Am. A 2009, 26, 121–134. [Google Scholar] [CrossRef]
- Kim, D.H. The ULAB colour space. Color. Res. Appl. 2013, 40, 17–30. [Google Scholar] [CrossRef]
- Luo, M.R.; Cui, G.; Li, C. Uniform colour spaces based on CIECAM02 colour appearance model. Color. Res. Appl. 2006, 31, 320–330. [Google Scholar] [CrossRef]
- Li, C.; Li, Z.; Wang, Z.; Xu, Y.; Luo, M.R.; Cui, G.; Melgosa, M.; Brill, M.H.; Pointer, M. Comprehensive color solutions: CAM16, CAT16, and CAM16-UCS. Color. Res. Appl. 2017, 42, 703–718. [Google Scholar] [CrossRef]
- ISO 105: 1996. Textiles—Tests for Colour Fastness—Part A02: Grey Scale for Assessing Change in Colour; International Organization for Standardization: Geneva, Switzerland, 1996. [Google Scholar]
- García, P.A.; Huertas, R.; Melgosa, M.; Cui, G. Measurement of the relationship between perceived and computed color differences. J. Opt. Soc. Am. A 2007, 24, 1823–1829. [Google Scholar] [CrossRef] [PubMed]
- Shamey, R.; Cárdenas, L.M.; Hinks, D.; Woodard, R. Comparison of naïve and expert subjects in the assessment of small color differences. J. Opt. Soc. Am. A 2010, 27, 1482. [Google Scholar] [CrossRef] [PubMed]
- Barcenas, P.; Elortondo, F.P.; Albisu, M. Projective mapping in sensory analysis of ewes milk cheeses: A study on consumers and trained panel performance. Food Res. Int. 2004, 37, 723–729. [Google Scholar] [CrossRef]
- García, P.A.; Gómez-Robledo, L.; Melgosa, M.; Shamey, R.; Luo, M.R.; Hinks, D.; Cui, G. Notes on the application of the standardized residual sum of squares index for the assessment of intra-and inter–observer variability in color–difference experiments. J. Opt. Soc. Am. A 2011, 28, 949. [Google Scholar] [CrossRef]
- Wei, M.; Ma, S.; Wang, Y.; Luo, M.R. Evaluation of whiteness formulas for FWA and non-FWA whites. J. Opt. Soc. Am. A 2017, 34, 640–647. [Google Scholar] [CrossRef] [PubMed]
- Guan, S.S.; Luo, M.R. Investigation of parametric effects using small colour differences. Color. Res. Appl. 1999, 24, 331–343. [Google Scholar] [CrossRef]

Publisher’s Note: MDPI stays neutral with regard to jurisdictional claims in published maps and institutional affiliations. |
© 2021 by the authors. Licensee MDPI, Basel, Switzerland. This article is an open access article distributed under the terms and conditions of the Creative Commons Attribution (CC BY) license (https://creativecommons.org/licenses/by/4.0/).