1. Introduction
Conductive polymer composites (CPCs) are engineered materials that combine flexibility with tunable mechanical and electrical properties [
1,
2], making them attractive for a wide range of applications. Within the framework of percolation theory, the electrical behavior of CPCs is governed by the formation of interconnected conductive pathways, which arise from direct contact and quantum–mechanical tunneling between conductive fillers [
3,
4,
5,
6]. Consequently, the choice and morphology of these fillers—such as carbon black [
7,
8], carbon nanotubes (CNTs) [
9,
10,
11], and MXenes [
12,
13]—play a critical role in determining the composite’s conductivity. In particular, due to their high aspect ratio and anisotropic [
14,
15,
16], cylindrical geometry, CNTs can achieve comparable or superior conductivity at substantially lower loadings than isotropic fillers.
As illustrated in
Figure 1, isotropic fillers establish percolative connections based solely on the center-to-center distance and a characteristic tunneling threshold radius [
5,
17,
18]. In contrast, the effective interparticle distance between anisotropic fillers like CNTs depends not only on the nominal separation but also on their mutual orientation, yielding a probabilistic connectivity that enhances network formation when aligned [
19,
20]. Therefore, the orientation distribution of anisotropic fillers within the CPC matrix constitutes a key parameter that directly influences electrical performance.
Several experimental studies have demonstrated this effect by employing radio-frequency alternating electric fields to align CNTs during deposition, showing a marked increase in conductivity with improved alignment [
21]. Similarly, the electrospinning of polyethylene terephthalate (PET)/CNT blends induces the fiber–axis alignment of CNTs, resulting in enhanced conductive network connectivity and electrical conductivity [
22]. Despite these advances, quantitatively controlling CNT orientation in physical experiments to systematically map its correlation with electrical properties remains challenging.
Related quantitative experimental studies have nevertheless reported typical ranges of CNT orientation distributions in composites. For example, electrospinning processes have achieved highly aligned CNT structures with orientation standard deviations as low as 5–15° relative to the fiber axis [
22]. In contrast, composites fabricated by solution casting or melt processing often exhibit broader distributions, with standard deviations ranging from 20° to 40° [
21,
23]. These experimental observations guided the angular standard deviation ranges we explored in this study (0° to 90°), ensuring that our simulations covered both highly ordered and disordered CNT arrangements encountered in practical applications.
Since the 1980s, advances in computational simulation have increasingly supplanted time- and cost-intensive experiments across materials and chemical engineering. In this context, Monte Carlo methods—where stochastic orientation and positional variables replicate real-world uncertainties—have become a powerful tool for modeling CPCs’ mechanical, electrical, and thermal behavior. In this present study, we employ such Monte Carlo simulations to quantitatively prescribe CNT orientation, evaluate inter-filler electrical contacts, and characterize the emergent percolative conductive network [
6,
23,
24].
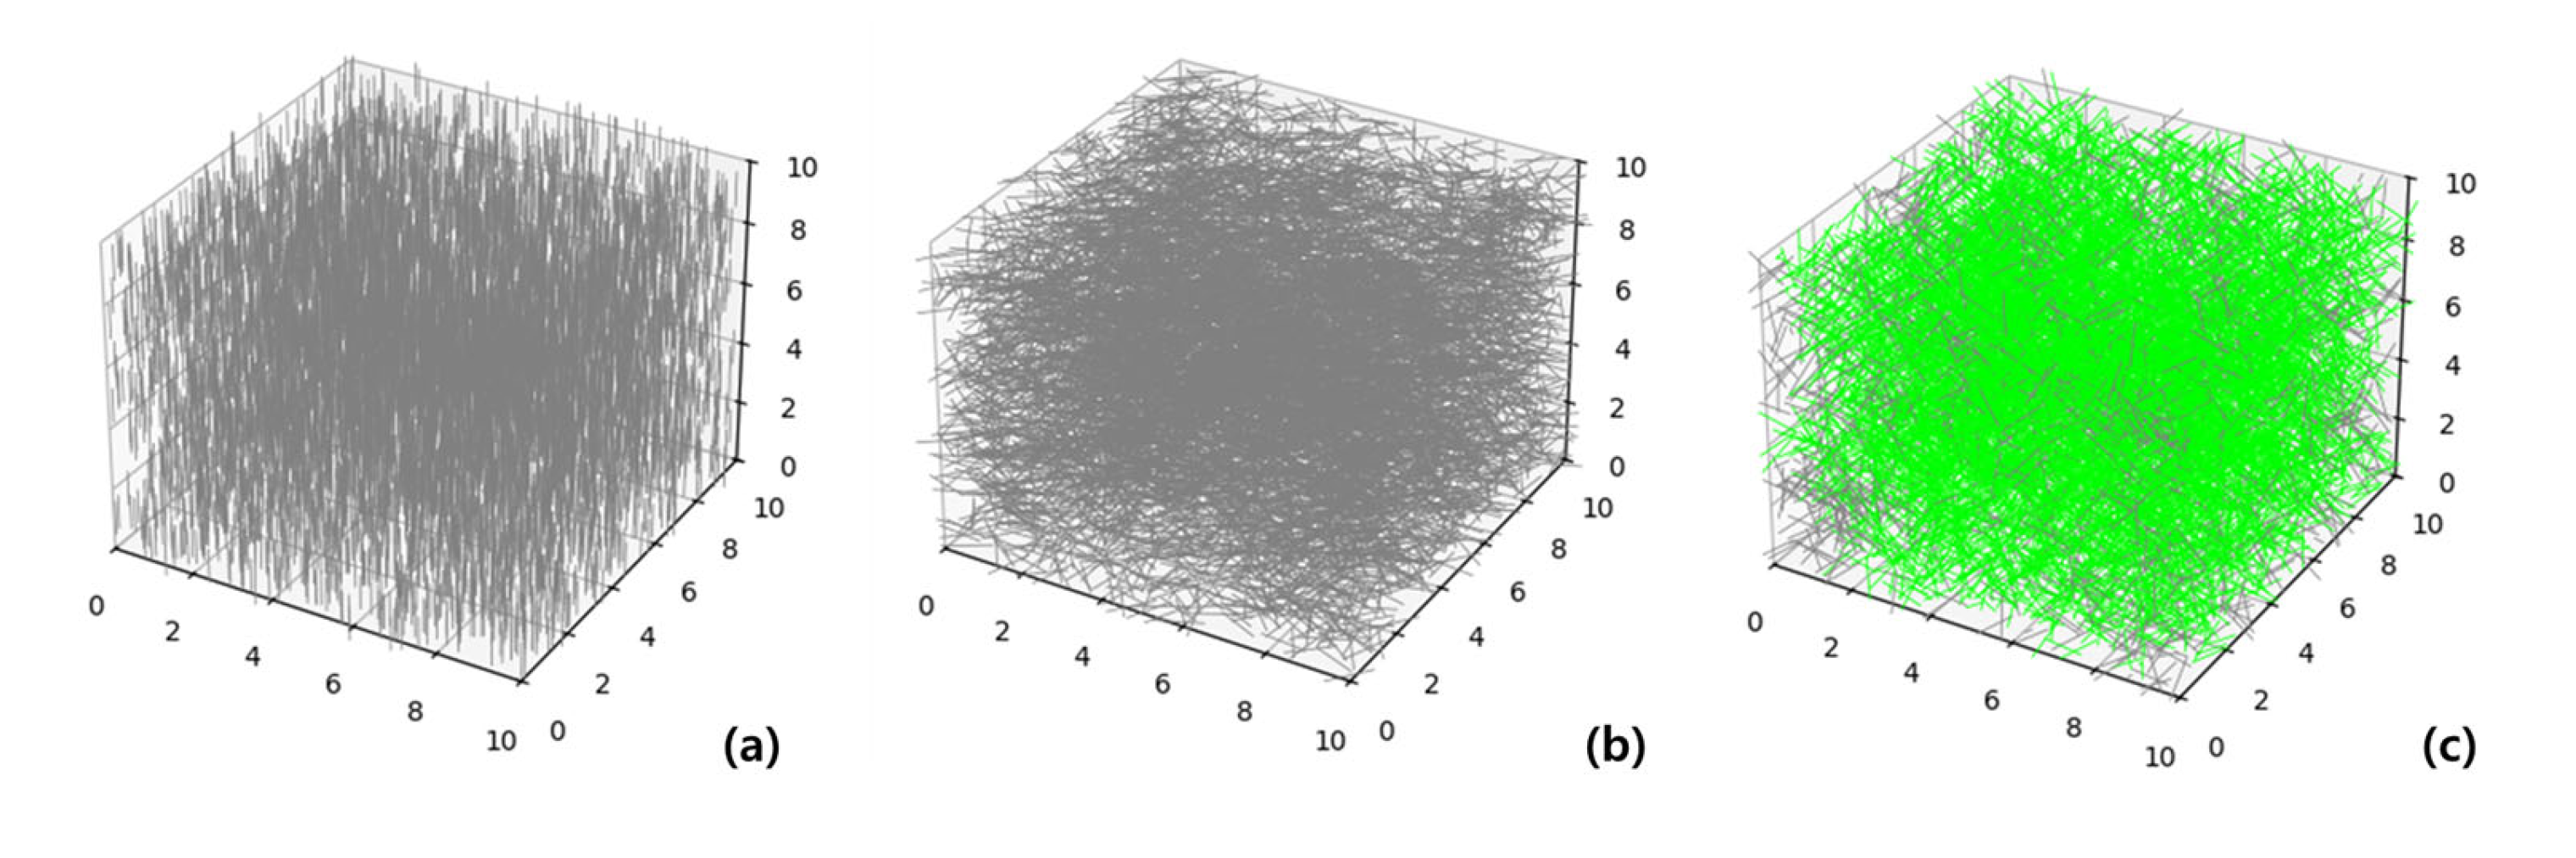
In this study, not only the orientation angle of CNTs within CPCs but also the statistical deviation related to their alignment and spatial arrangement was considered as a critical factor influencing the electrical properties. Even when conductive fillers are nominally aligned along the measurement direction, excessive regularity in their arrangement—particularly parallel alignment in a plane perpendicular to the current flow—can diminish the effective anisotropic advantages. As illustrated in
Figure 2, under identical filler volume fraction conditions, cases (a) and (b), where all conductive fillers are strictly aligned in a specific direction, fail to form a conductive network (green connections). In contrast, case (c) demonstrates that a degree of randomness in orientation allows for anisotropic effects to manifest more effectively, thereby facilitating conductive network formation through contact and tunneling.
2. Materials and Methods
2.1. Anisotropic Conductive Filler Tunneling Effect and Conductive Network Connection Mechanism
In the case of tunneling phenomena between anisotropic conductive fillers such as CNTs within CPCs, electrical conduction does not occur based on the center-to-center distance, but rather when the surface-to-surface distance between adjacent fillers falls within a critical tunneling threshold. Within the framework of percolation theory, this process is described statistically and probabilistically. Because the direct measurement of inter-filler distances is challenging, volume fraction is employed as an indirect parameter to infer the likelihood of conductive interactions. Accordingly, the tunneling-based percolation probability is expressed as a function of volume fraction, as follows [
4,
6]:
In this equation, denotes the probability of forming a conductive percolation network among CNTs dispersed within the CPC matrix. The parameter represents the volume fraction of CNTs, while refers to the critical volume fraction at which an infinite conductive cluster probability is 0.5, signifying the percolation threshold. The exponent is a non-universal as the CNT volume fraction exceeds the percolation threshold.
According to percolation theory, as the volume fraction of conductive fillers within a CPC system increases, the average interparticle distance decreases, thereby enhancing the likelihood of electrical connectivity through direct contact and quantum tunneling. The mechanism of conductive network formation in CPCs proceeds through the successive connection of neighboring conductive fillers, leading to the formation of clusters—referred to as finite clusters [
6,
25,
26]. As the filler volume fraction continues to increase, these finite clusters begin to interconnect, ultimately bridging the entire composite and forming a spanning cluster, also known as an infinite cluster. The formation of this infinite cluster marks the onset of macroscopic electrical conductivity across the CPC.
The electrical conductivity of the composite is primarily determined by the number of conductive fillers comprising this infinite cluster, as well as the intrinsic conductivity of the filler material itself. In this study, the probability of conductive network formation, denoted as
, was quantified as the ratio of the number of conductive fillers participating in the infinite cluster to the total number of conductive fillers dispersed in the CPC, as expressed by the following equation [
27,
28]:
where
is the number of CNTs forming the infinite cluster, and
is the total number of CNTs in the composite.
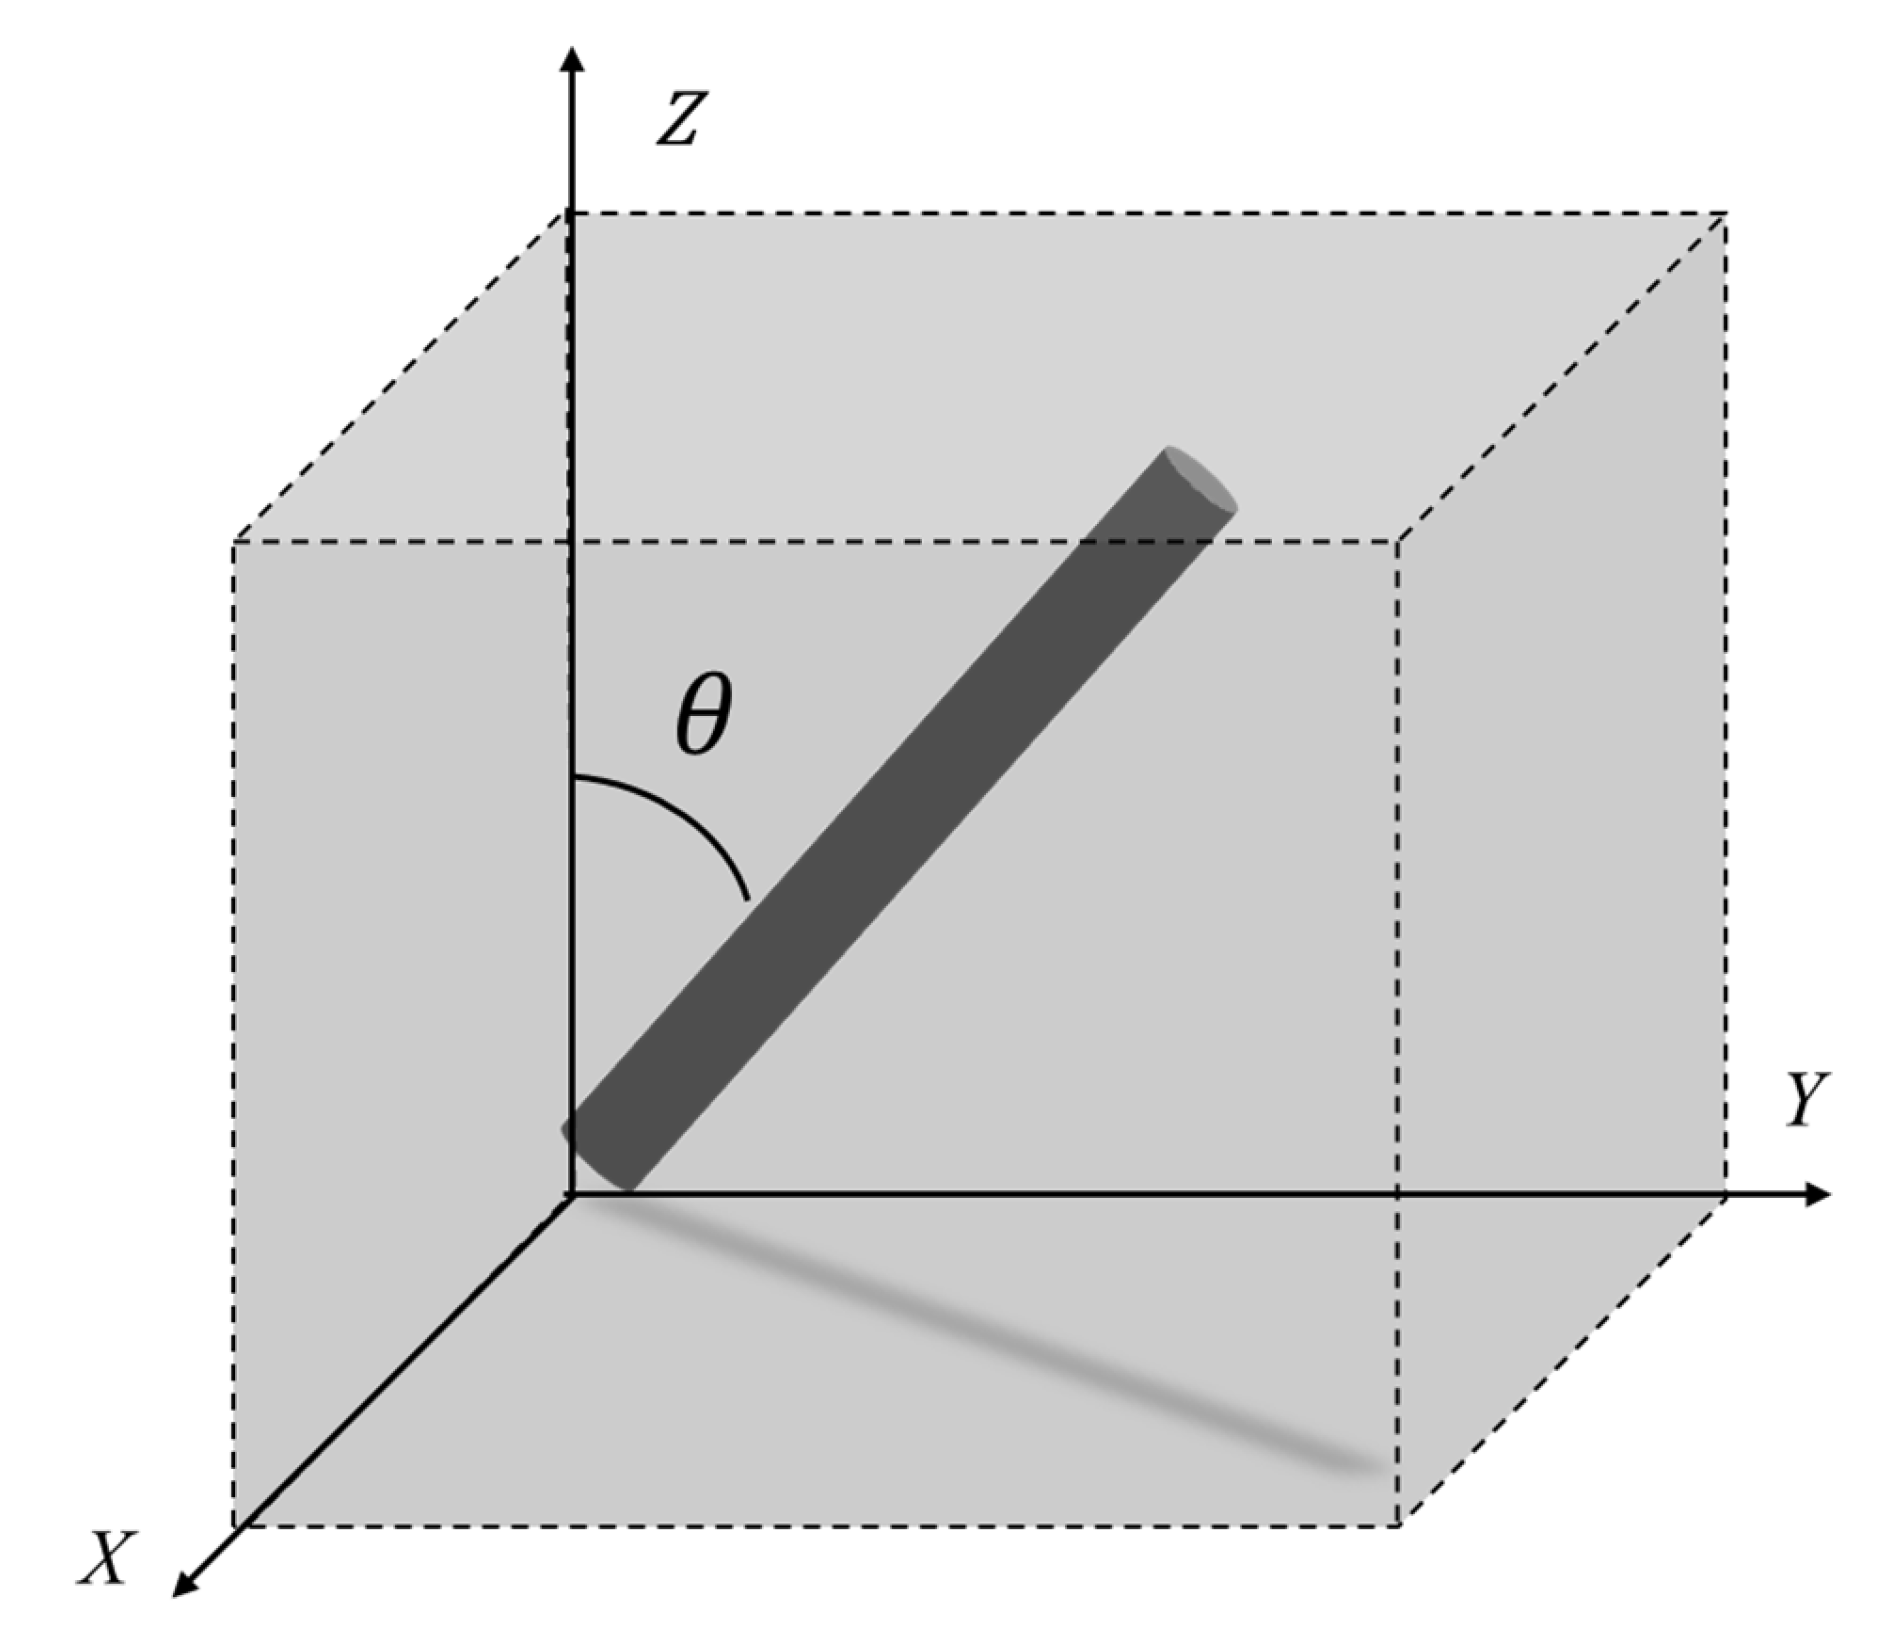
In this study, the relationship between filler orientation and conductive network formation within CPCs was quantitatively analyzed by extending the conventional orientation distribution function (ODF). As illustrated in
Figure 3, we focused on characterizing the average orientation and degree of alignment of anisotropic conductive fillers with respect to a specific axis—namely, the z-axis—using a scalar measure known as Herman’s orientation function. This function, originally formulated to describe the orientation distribution of rod-like molecules or fibers, was adapted here to interpret its impact on the percolation-driven conductive network in CPCs. The standard Herman’s orientation function is defined as follows [
29,
30,
31]:
where
is the angle between the filler axis and the reference axis (z-axis), and
is the ensemble average over all fillers. In the conventional Herman’s orientation function, a value of 1 indicates that all fillers are perfectly aligned parallel to the reference axis (i.e., the z-axis), while a value of 0 corresponds to a completely random orientation. A negative value of −0.5 arises when the fillers are aligned perpendicular to the reference axis, such as lying in the XY plane.
However, in the context of conductive network formation in CPCs, perfect alignment along the z-axis (0°) or complete alignment within the XY plane (90°) may counterintuitively reduce the probability of forming inter-filler connections along the z-direction. In other words, excessive alignment—whether vertical or horizontal—can limit the spatial overlap and angular diversity required for tunneling-based connectivity. To reflect this, the effect of filler orientation on conductive network formation is reinterpreted as a function of
, where
is the angle between the filler axis and the z-axis, as follows:
This formulation emphasizes that an intermediate orientation—neither fully aligned nor fully perpendicular—maximizes the probability of inter-filler connections contributing to a conductive path along the z-axis.
To validate the proposed reinterpretation of the orientation-dependent connectivity function, Monte Carlo simulations were conducted to investigate how variations in the orientation of anisotropic fillers, which are CNTs, affect the probability of conductive network formation in CPCs. By systematically varying orientation distributions under different conditions, we quantitatively evaluated the resulting changes in conductive connectivity. This allowed us to examine the validity of the proposed equation-based relationship between filler alignment and percolation probability.
2.2. Monte Carlo Simulation Framework for Orientation-Dependent Conductive Network in CPCs
To verify the theoretical framework described above and assess the statistical behavior of percolation under compressive alignment conditions, a Monte Carlo-based simulation was implemented as described below; a three-dimensional Monte Carlo simulation framework was programmed by Google Colab with Python 3.10. The simulation is performed within a cubic domain of dimensions 10 × 10 × 10, representing a normalized computational volume. Each rod-like filler is represented as a capped cylinder with a fixed aspect ratio
, from which its radius
and length
are determined according to the following relations:
Filler positions are initialized using a uniform random distribution, and their orientations are assigned using a polar angle drawn from a Gaussian distribution and an azimuthal angle drawn from a uniform distribution over [0, 90°]. This orientation sampling scheme enables the modeling of various alignment states, ranging from fully random to highly aligned configurations.
Filler positions are initialized using a uniform random distribution, and their orientations are assigned using a polar angle drawn from a Gaussian distribution and an azimuthal angle drawn from a uniform distribution over [0, 90°]. This orientation sampling scheme enables the modeling of various alignment states, ranging from fully random to highly aligned configurations. Importantly, our simulation operates fully in three dimensions, not in two. Each CNT filler is assigned both a polar angle and an azimuthal angle, capturing its complete 3D orientation. While much of the analysis focuses on θ due to its dominant influence on z-direction connectivity, the azimuthal angle is included to represent in-plane variability and avoid reduction to a purely 2D model. Therefore, the simulation accounts for full spatial orientation effects when evaluating conductive network formation.
To determine electrical connectivity between fillers, a two-step process is applied. First, a cKDTree algorithm is used to identify all filler pairs within a defined cutoff distance, calculated as the sum of the rod length and two times the rod radius. Next, for each candidate pair, the minimum surface-to-surface distance is computed using a vectorized GPU implementation of the three-dimensional segment–segment distance algorithm. A pair of rods is considered electrically connected if the calculated surface distance is less than a predefined tunneling threshold, which accounts for nanoscale tunneling effects and contact resistance between conductive elements. In this study, the tunneling threshold distance was set to 0.001 units, which corresponds to 1 nm, assuming that the simulation box size represents 10 μm. This value is consistent with experimental reports indicating that electron tunneling between CNTs occurs effectively over distances up to approximately 1–2 nm [
17,
18]. Setting the threshold at this scale ensures that the model captures nanoscale electrical interactions realistically while maintaining sensitivity to the geometric arrangement of CNTs.
After all pairwise connections have been identified, clusters of connected fillers are constructed using a union–find algorithm. A cluster is designated as an infinite cluster if it spans the simulation domain along the z-axis, meaning that at least one filler in the cluster intersects the bottom boundary (z = 0) and another intersects the top boundary (z = 10). This condition is evaluated by checking the z-coordinates of the two endpoints of each rod. The infinite cluster ratio, defined as the proportion of total fillers that belong to a spanning cluster, is computed for each simulation run and used as the primary indicator of percolation.
To validate the implemented Monte Carlo simulation, the first step involved benchmarking the simulation results against established findings from previous studies. In this study, the volume of a single CNT was fixed at 0.01 (in arbitrary units) to maintain a consistent total filler volume, and aspect ratios (AR) of 10, 20, and 30 were systematically tested. These baseline conditions were used to assess how filler geometry influences the formation of conductive networks.
Subsequently, for each aspect ratio, the orientation angle of CNTs with respect to the z-axis was varied from 0° to 90°, assuming symmetry, to evaluate its effect on the probability of conductive connection. Furthermore, to investigate the influence of orientation dispersion, additional simulations were conducted at mean orientation angles of 0°, 15°, 30°, 45°, 60°, 75°, and 90°, with incrementally increasing angular deviations. The resulting conductive network probabilities were then compared across all conditions to identify the critical role of both alignment and angular distribution. Additionally, simulations under each condition were performed more than 50 times.
3. Results
3.1. Conductive Percolation Network of Anisotropic Conductive Fillers (CNTs) in CPCs
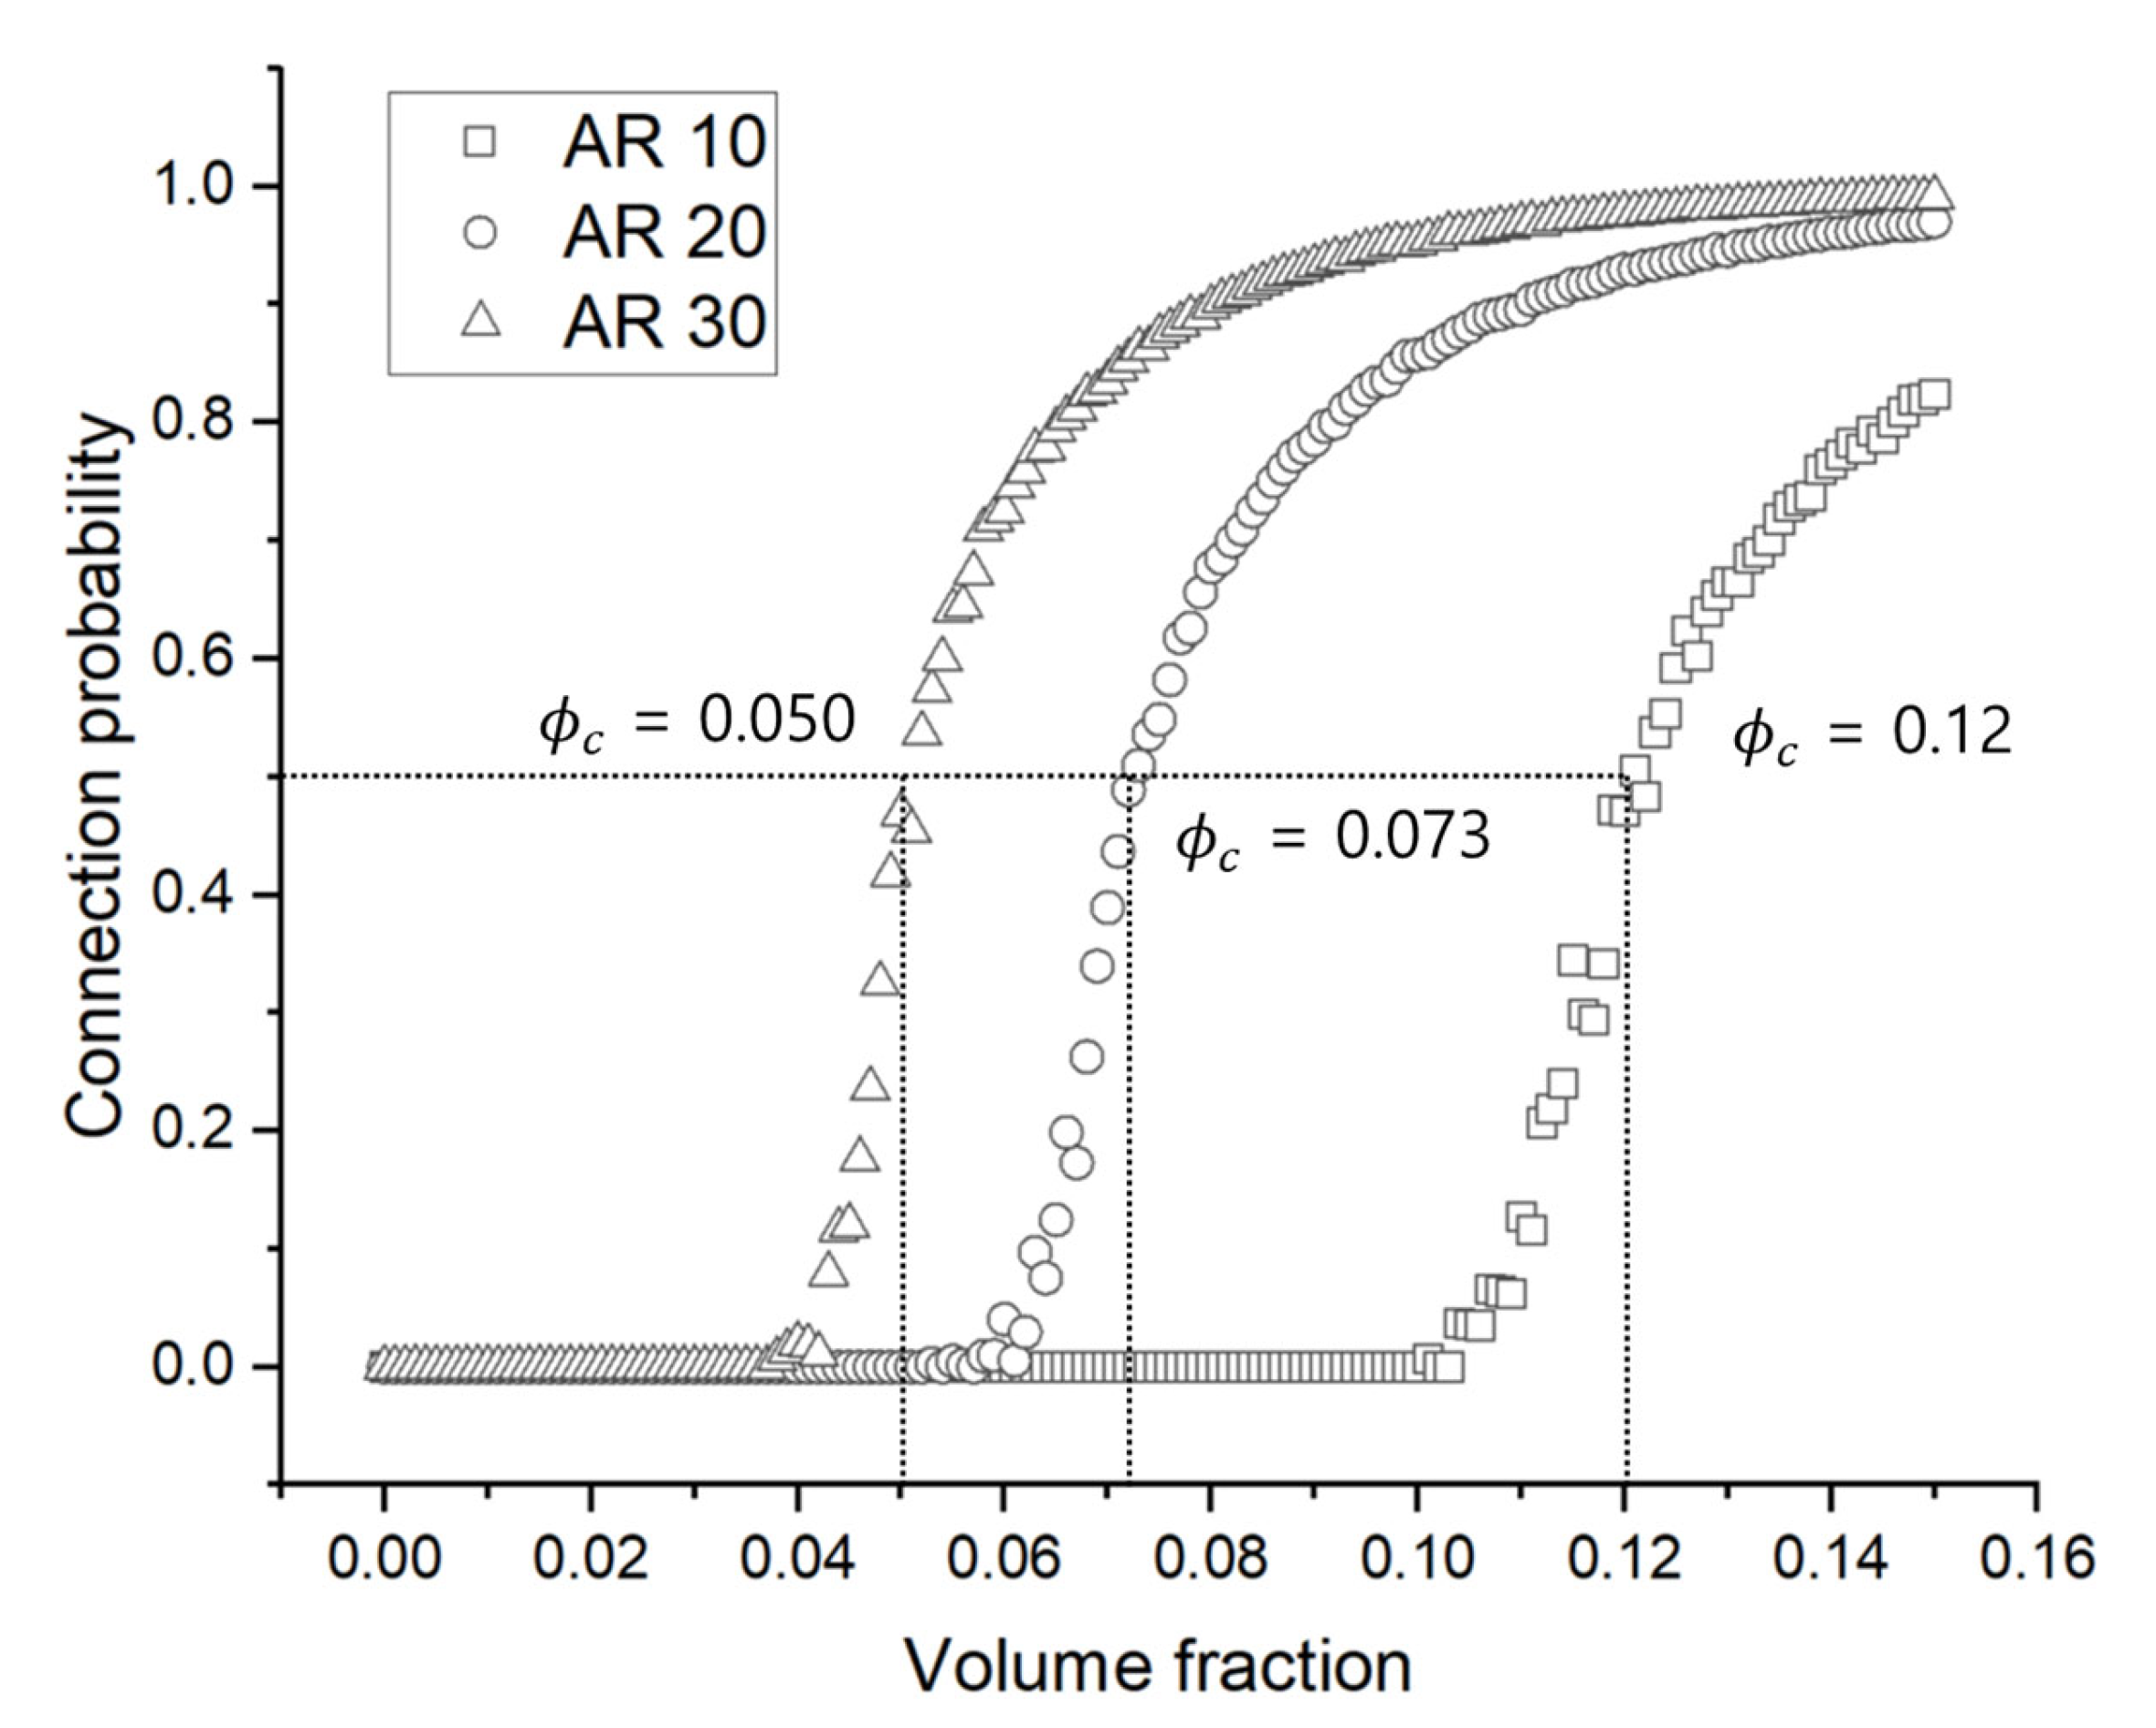
Figure 4 presents the Monte Carlo simulation results evaluating the influence of aspect ratio (AR) on the conductive network formation of anisotropic fillers, specifically CNTs. As shown in the figure, for all tested aspect ratios, the probability of conductive connection increases with higher volume fractions of CNTs. Notably, a sharp increase in connectivity is observed beyond a certain threshold, consistent with classical percolation theory. The percolation threshold—defined as the volume fraction at which the probability of connection reaches 50%—was found to be approximately 0.12, 0.073, and 0.05 for aspect ratios of 10, 20, and 30, respectively. This clearly demonstrates that as the aspect ratio increases, conductive fillers are more likely to form percolating networks, owing to enhanced geometric anisotropy and higher spatial reach. The trend observed in the simulation is in strong agreement with results reported in previous percolation-based studies. This consistency validates the reliability of the implemented connection criteria and probability assessment methods used in the Monte Carlo framework developed in this study.
To isolate and analyze the effect of orientation on conductive network formation, the volume fraction of CNTs in each aspect ratio condition was fixed at its corresponding percolation threshold, as previously determined. This approach was adopted because excessively low volume fractions result in insufficient connectivity, while overly high volume fractions lead to saturated networks. In both cases, the sensitivity of the system to orientation effects becomes negligible, thereby reducing the reliability of the observed trends. By selecting the critical volume fraction as a baseline, the orientation-dependent variations in connection probability could be evaluated under conditions where the system is most responsive to structural changes.
3.2. Orientation-Dependent Conductive Percolation Network of Anisotropic Conductive Fillers (CNTs) in CPCs
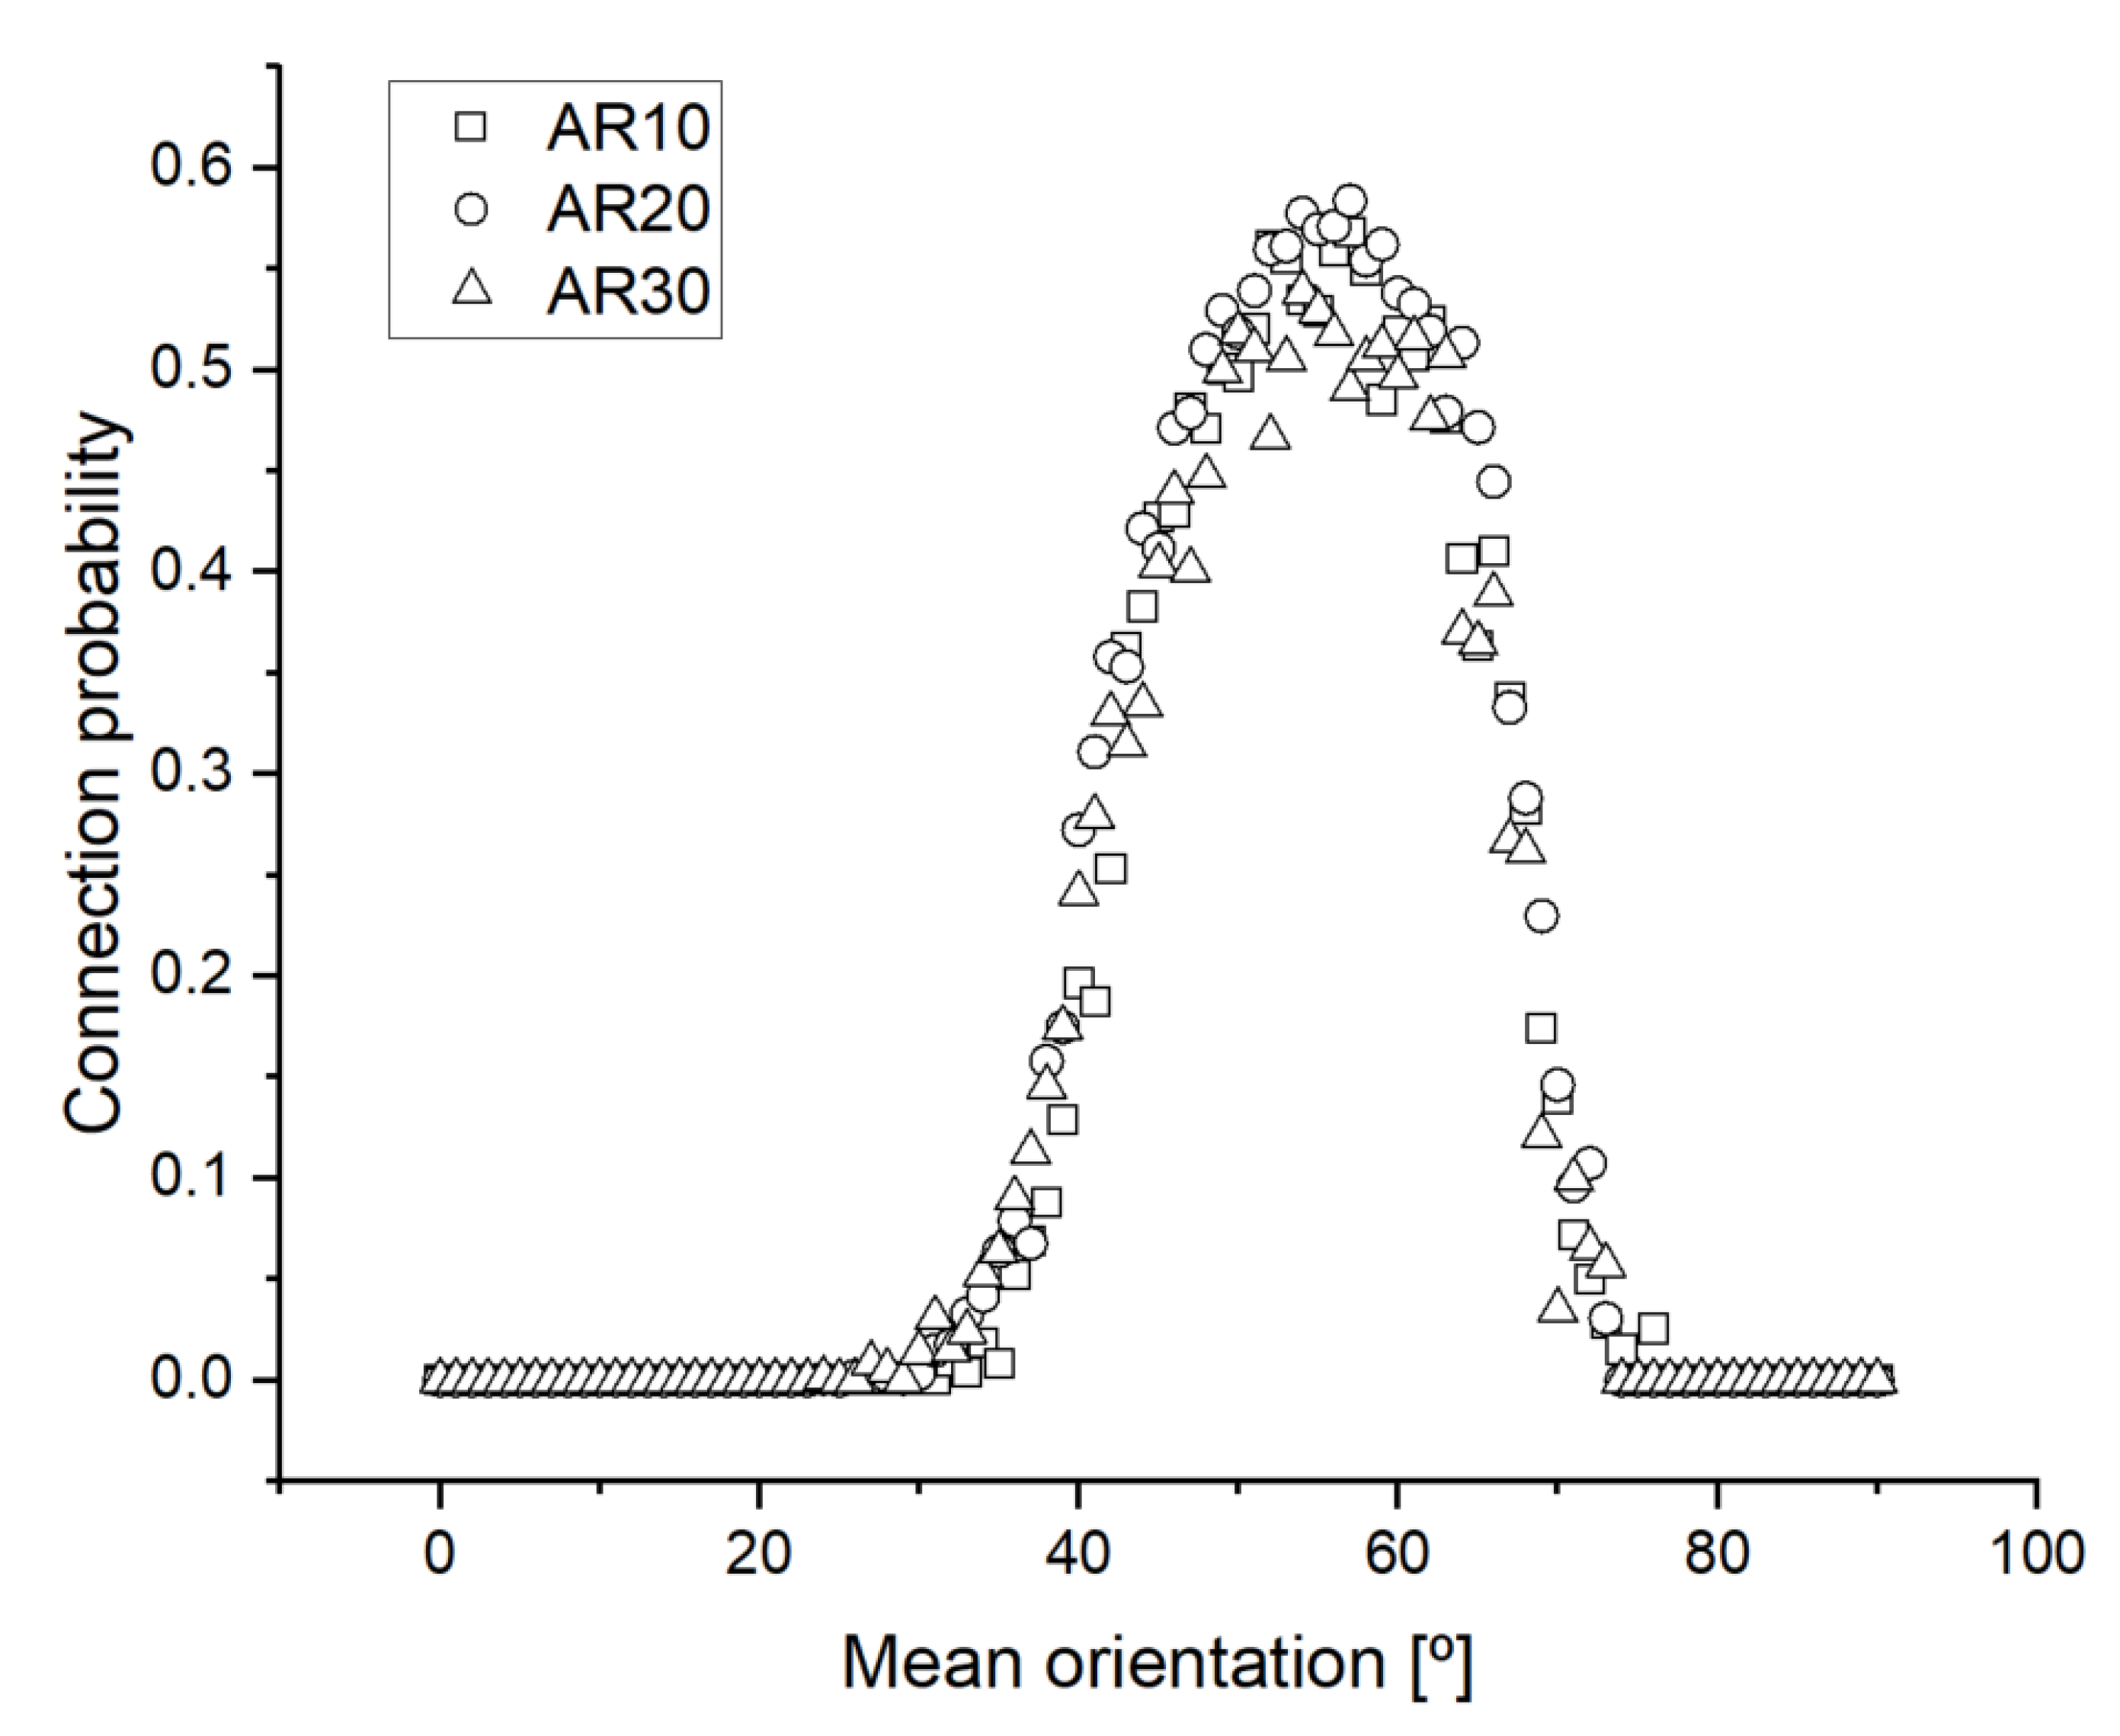
Figure 5 presents the results of simulations conducted to evaluate the effect of the mean orientation angle of CNTs on the probability of conductive network formation. In this analysis, the angular standard deviation was fixed at zero, and the mean orientation angle was varied from 0° to 90° across three aspect ratio conditions (AR = 10, 20, 30). Regardless of aspect ratio, the connection probability increased steadily between approximately 30° and 70°, with the maximum connectivity observed near 55–60°. Notably, the influence of aspect ratio on this orientation-driven trend was minimal, suggesting that the alignment angle plays a more dominant role than filler geometry under these specific conditions.
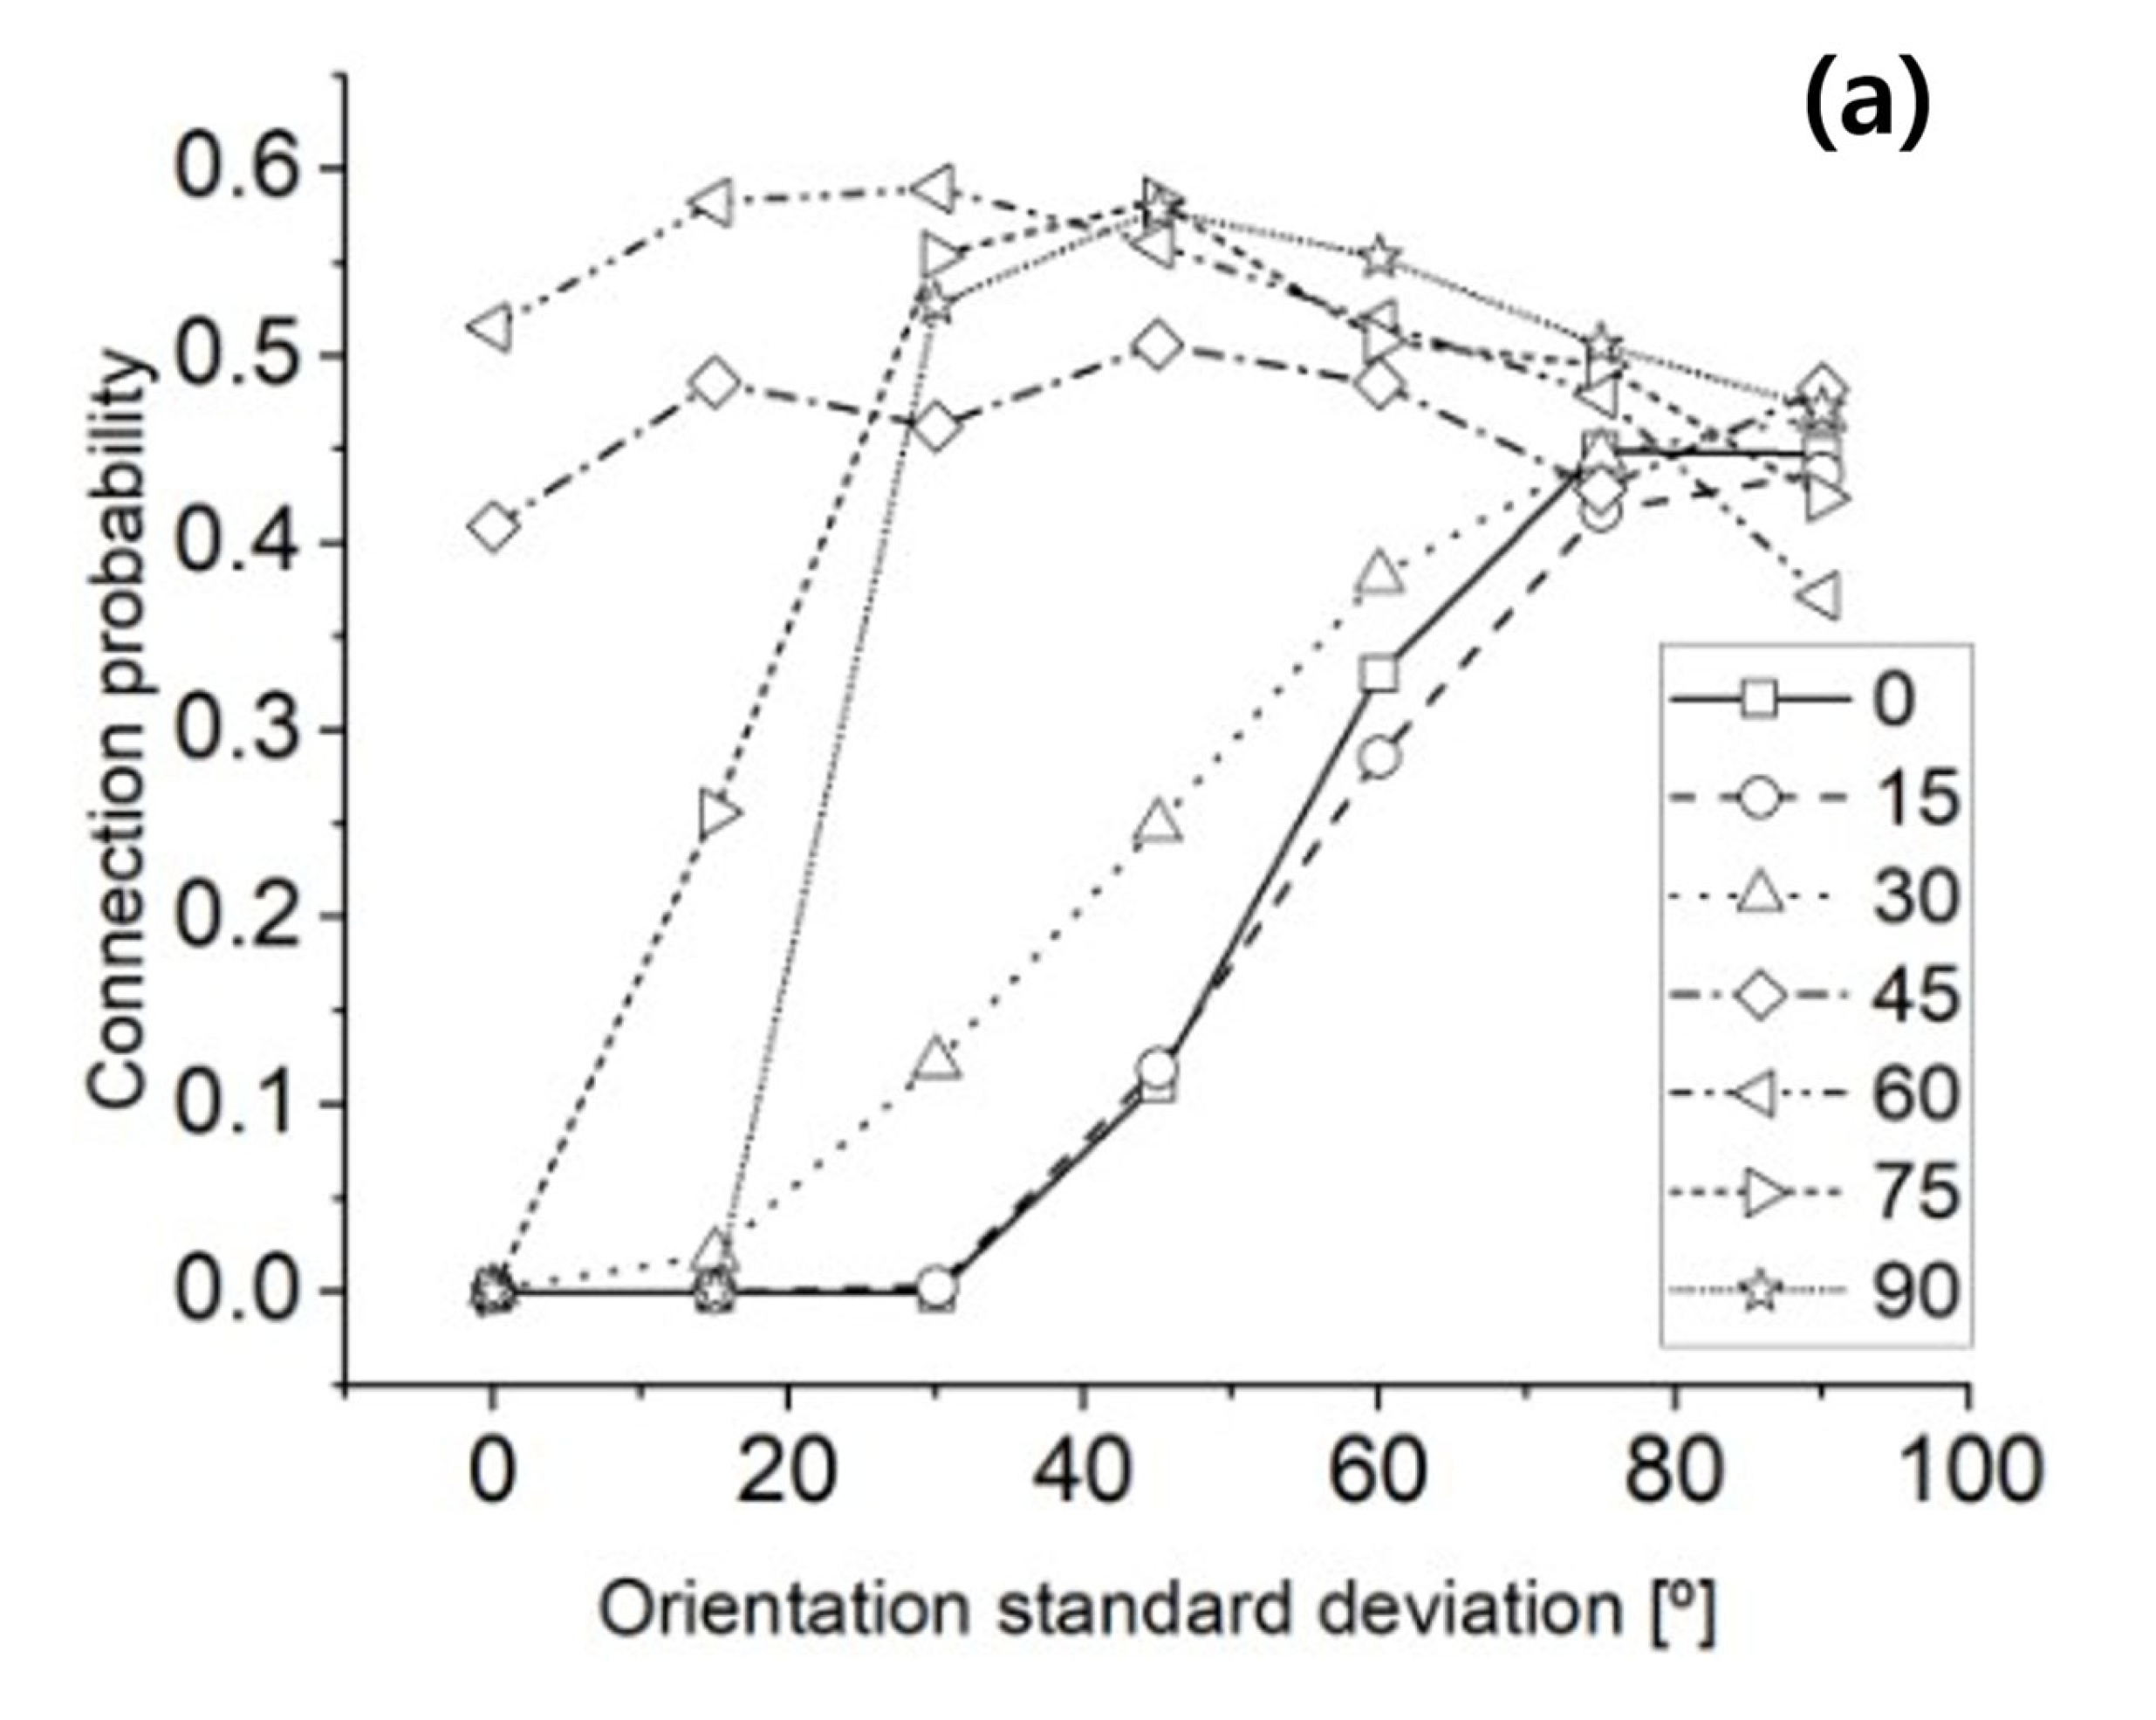
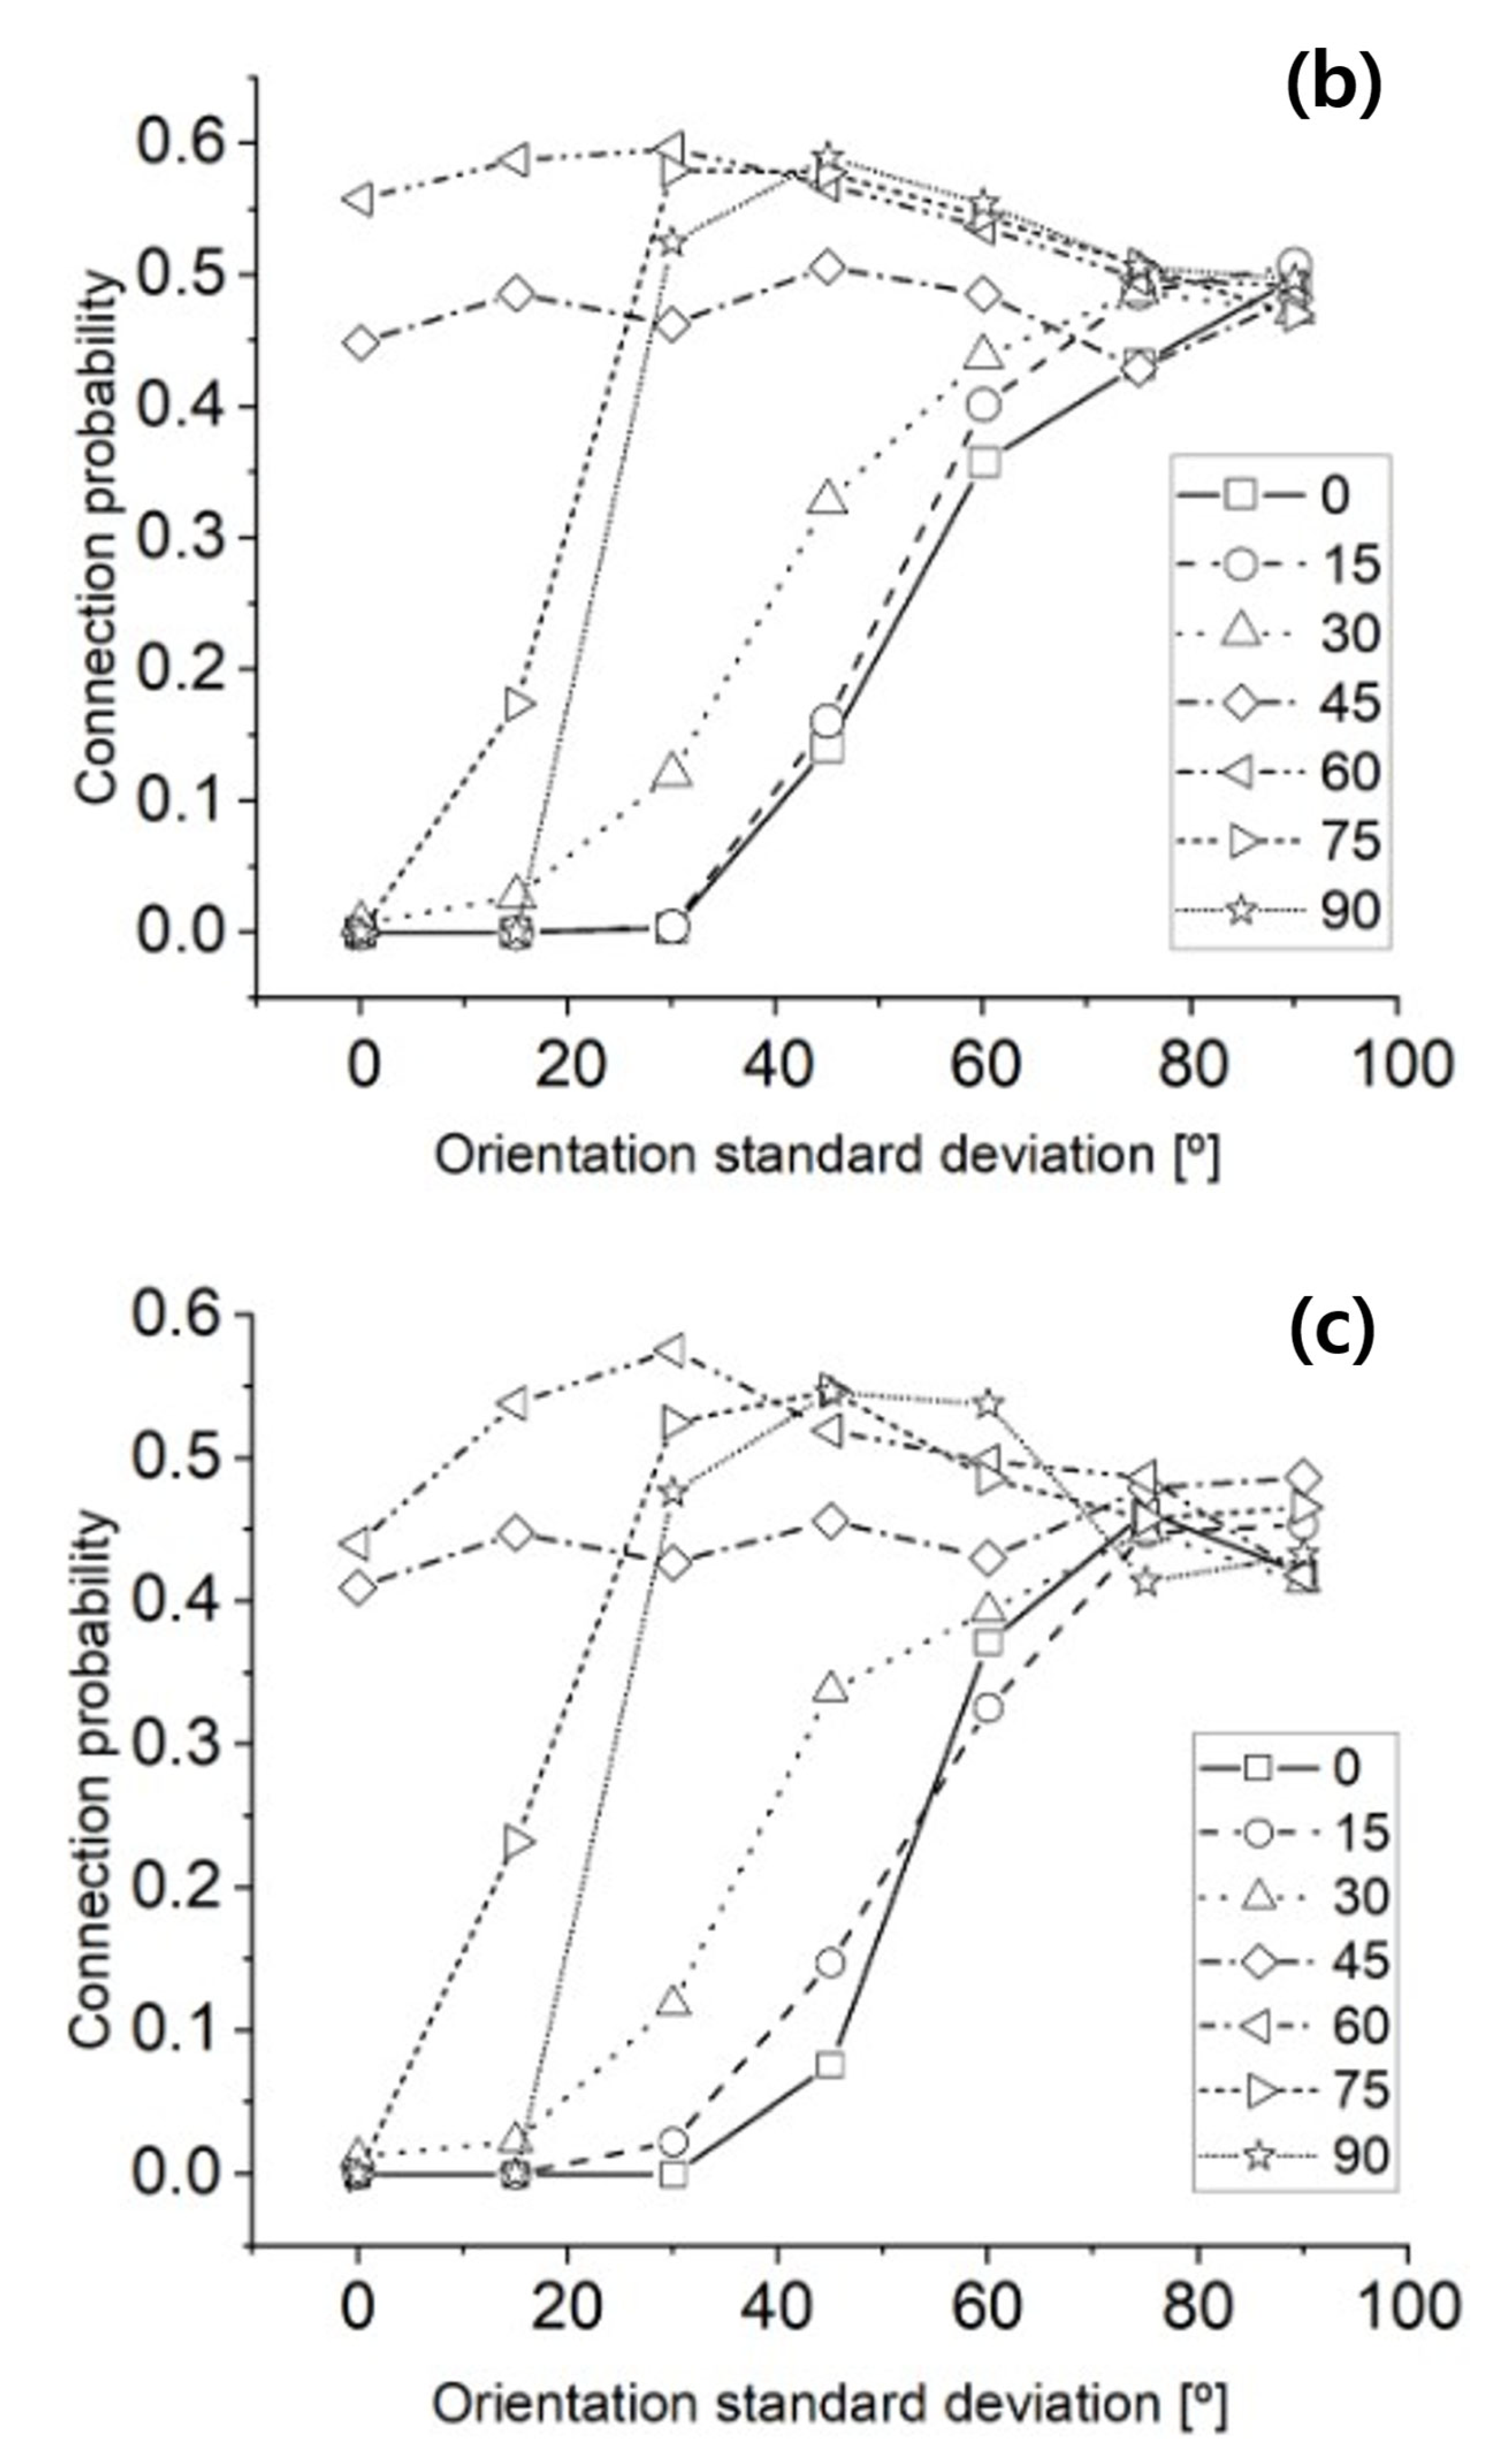
Figure 6a–c shows the results of simulations in which the standard deviation of CNT orientation was increased from 0° to 90° in 15° increments at fixed mean orientation angles spaced by 15° across the full range (0° to 90°) for AR = 10, 20, and 30, respectively. No significant differences were observed between aspect ratios, and conductive connectivity was primarily detected when the mean orientation angle was set to 45° or 60°, which were previously shown to be the most favorable orientations.
For cases with initially low connection probabilities—namely, mean angles of 0°, 15°, 30°, 75°, and 90°—a general trend of increasing connectivity with larger orientation deviations was observed. This indicates that introducing angular disorder can promote the formation of conductive networks when alignment is otherwise unfavorable. Specifically, at 75° and 90°, the connection probability increased sharply with higher deviations, whereas for 0°, 15°, and 30°, the increase was more gradual, ultimately converging toward a probability of 0.5.
4. Discussion
Prior to developing the Gaussian-based formulation (Equation (6)), we validated the orientation-dependent connectivity function proposed in Equation (4). Specifically, the Monte Carlo simulation results for connection probability under varying mean orientation angles were fitted to the theoretical curve defined by Equation (4). The fitting exhibited excellent agreement, with R2 values exceeding 0.95 across the tested angle range. This confirms that Equation (4) effectively captures the observed relationship between filler orientation and conductive network formation probability.
To more accurately represent the orientation-dependent connectivity behavior observed in the simulations, the connection probability was modeled using a Gaussian distribution centered at the empirically determined optimal mean angle. This approach accounts for the fact that the highest connectivity was observed not at 45° but at around 57.5°, and that orientation deviation away from this optimal alignment leads to reduced network formation probability.
Accordingly, the orientation-dependent probability of conductive connection can be expressed as follows:
where
is the standard deviation controlling the spread of orientation alignment for effective connection. This extended equation model captures the observed trend that conductive connectivity is maximized near a specific angle and gradually decreases for orientations deviating from this optimal alignment. It also provides a flexible framework to incorporate orientation dispersion in further analytical or numerical models.
In addition to mean orientation, the degree of orientation dispersion—characterized by the angular standard deviation—plays a critical role in determining the connectivity behavior of anisotropic fillers in CPCs. The simulation results reveal a distinct trend: when the dispersion is low (i.e., fillers are highly aligned), the mean orientation angle strongly influences the conductive network probability. However, as the angular deviation increases, the orientation of CNTs becomes increasingly randomized, and the connection probability gradually converges to a characteristic value regardless of the initial mean angle.
This convergence behavior can be attributed to the physical mechanism underlying anisotropic percolation. In highly aligned states, the inter-filler distances are constrained by the uniform directionality of the CNTs. This geometric regularity reduces the likelihood of favorable contact or tunneling conditions, thereby diminishing the inherent benefits of anisotropic morphology. In contrast, as orientation becomes more disordered, the probability of forming short-range interparticle distances from diverse angles increases. This enhances the effective use of anisotropic shapes and improves the chances of conductive connections forming via tunneling.
Figure 7 illustrates how the angular deviation of CNTs affects the spatial pathways available for electrical connections within the composite. In
Figure 7a, CNTs are initially oriented close to the z-axis (0°, 15°, and 30°). Small angular deviations cause these CNTs to tilt away from the vertical axis, creating overlap or proximity in the XY-plane between neighboring CNTs. This lateral overlap in the XY-plane can facilitate short-range tunneling paths. However, such XY connections are predominantly parallel to the plane and do not directly contribute to vertical (z-direction) electrical conduction, which is critical for through-thickness conductivity in CPCs. Therefore, while XY-plane connections increase local connectivity, they often fail to establish continuous pathways spanning the material thickness.
In
Figure 7b, CNTs are initially aligned horizontally (75° and 90°). As angular deviation increases, some CNTs begin to tilt upward from the XY-plane toward intermediate angles. This rotation creates new spatial orientations that enable face-to-face or edge-to-edge contact in directions partially aligned with the z-axis. These intermediate orientations significantly enhance the probability of forming conductive pathways that bridge the top and bottom boundaries of the composite. Consequently, while purely horizontal CNTs hinder vertical conduction, introducing angular disorder allows for parts of the filler population to reorient into more favorable angles for through-thickness connectivity.
Overall, these findings underscore the dual role of orientation dispersion in anisotropic percolation systems: while high alignment may suppress connectivity due to geometric uniformity, moderate randomness can unlock the conductive potential of anisotropic fillers by enhancing spatial accessibility and orientation diversity.
One limitation of this present study lies in the assumption of a single-axis orientation framework, where the orientation of CNTs is analyzed solely with respect to the z-axis. While this approach provides valuable insight into vertical alignment and its influence on conductive percolation, it does not account for in-plane orientation effects within the XY-plane. In real composite systems, especially under multi-directional processing or deformation, filler alignment can occur in complex three-dimensional distributions.
Therefore, future studies should extend the current model to incorporate biaxial or full 3D orientation distributions, allowing for more accurate predictions of anisotropic network formation. Specifically, evaluating the influence of in-plane (XY) alignment on tunneling probability and network connectivity will be essential for capturing the full complexity of conductive behavior in practical CPC applications.
5. Conclusions
This study presents a comprehensive investigation into how the orientation and alignment of anisotropic conductive fillers, specifically CNTs, influence the formation of conductive networks within CPCs. Through the use of Monte Carlo simulations, we have demonstrated that filler orientation is not merely a geometric parameter but a dominant structural factor that governs whether or not conductive pathways can emerge in the material.
By systematically evaluating variations in both average alignment and orientation dispersion, this work reveals that neither perfect order nor complete randomness guarantees optimal connectivity. Instead, it is the subtle interplay between directionality and diversity that enables percolation to occur most efficiently. This insight challenges conventional design assumptions, highlighting that controlling filler orientation—rather than simply maximizing filler content—is a more strategic lever for enhancing electrical performance in flexible composite systems.
Beyond the theoretical contributions, the findings suggest several practical implications. First, the proposed orientation-aware model provides a foundation for predictive simulation tools that can inform processing decisions—such as fiber spinning, printing, or stretching—to achieve targeted alignment states. Second, the framework supports the design of CPCs for applications where anisotropic behavior is advantageous, such as directional sensing, flexible electronics, or stretchable energy devices. Lastly, recognizing the limitations of single-axis orientation modeling, this study points to the importance of future models that incorporate full three-dimensional orientation distributions, especially under multi-axial mechanical deformation or complex manufacturing conditions.
Overall, this work reframes the role of filler orientation from a passive outcome of processing to an active design parameter. By doing so, it paves the way for the next generation of conductive composites where tunable anisotropy is deliberately engineered for performance, adaptability, and multifunctionality in advanced device platforms.


