Article

Prediction of Potential Habitat Distributions and Climate Change Impacts on Six Carex L. Species of Conservation Concern in Canada

School of Environment and Sustainability, University of Saskatchewan, 117 Science Place, Saskatoon, SK S7N 5C8, Canada
*
Author to whom correspondence should be addressed.
Conservation 2025, 5(4), 55; https://doi.org/10.3390/conservation5040055
Submission received: 19 July 2025 / Revised: 10 September 2025 / Accepted: 11 September 2025 / Published: 2 October 2025

Abstract

Climate change is increasingly altering ecosystems around the world and threatening biodiversity, especially species with narrow distribution ranges and a dependency on dedicated conservation practices. In Saskatchewan, Canada, the ecological significance of the genus sedge (Carex L.) from the Cyperaceae family is well recognized, yet spatially explicit forecasts of its habitats under future climate scenarios remain absent, creating a major obstacle to forward-looking conservation strategies. This study assesses the current and future habitat suitability of six sedges, including three nationally at-risk species (C. assiniboinensis, C. saximontana, C. tetanica) and three provincially rare species (C. glacialis, C. granularis, C. supina subsp. spaniocarpa). We applied the MaxEnt algorithm to model the distributions of those Carex species of conservation concern using 20 environmental predictors (19 bioclimatic variables and elevation) under baseline climate (1970–2000) and projected future scenarios for the 2030s and 2050s using SSP245 and SSP585 emission pathways. We optimized and validated models with the ENMeval package to enhance predictive reliability. Model accuracy was high (AUC = 0.88–0.99) and the results revealed a diversity of species responses: C. assiniboinensis and C. tetanica are projected to expand their suitable habitat, while C. saximontana is expected to lose high suitability areas. The distributions of C. glacialis and C. supina subsp. spaniocarpa remain restricted and relatively stable across scenarios. C. granularis is projected to have dynamic range shifts, particularly under the high-emission SSP585 scenario. Temperature-related variables were consistently the most influential predictors. These results provide critical insights into the potential impacts of climate change on Carex species of conservation concern in Canada and offer valuable guidance for prioritizing adaptive conservation planning and proactive habitat management. The diversity of species responses emphasizes the necessity of tailored conservation approaches rather than a one-size-fits-all strategy.

1. Introduction

Climate change is one of the critical drivers of biodiversity loss, altering the spatial distribution, seasonal patterns, and survival prospects of numerous species across ecosystems. A major concern is the rapid acceleration of environmental shifts, largely driven by ongoing greenhouse gas emissions on the global scale [1]. Evidence increasingly shows that species are already shifting their ranges in response to these changes [2,3,4,5]. Depending on their adaptability, some species may relocate to more favorable habitats, adjust physiologically, or face extinction if they cannot cope with new climatic conditions [6,7]. Species that are already threatened, especially those with narrow ecological niches and limited distribution, are particularly susceptible to environmental stressors associated with climate change. Anticipating their response to both current and projected climate scenarios is vital for conservation planning. Identifying and modeling the distributions of such priority species is a fundamental prerequisite for informed conservation action [8]. Moreover, shifts in species ranges, whether resulting in habitat loss or expansion can significantly influence local ecosystem dynamics [8]. Numerous studies were performed on climate change domain regarding distribution of rare and threatened species [4,9,10,11,12]. Therefore, understanding these distributional changes is essential for developing effective, adaptive conservation strategies to protect threatened species in a rapidly changing climate.
To explore suitable habitat, Species Distribution Models (SDMs) are essential tools in ecological research. These models use environmental variables and species data to estimate the geographic distribution of suitable habitats, both under current and future climate scenarios. Several modeling approaches have been developed to predict species distributions based on environmental and climatic variables. Among the most widely used are BIOCLIM [13], DOMAIN [14], GLM [15], MaxEnt [16] and GARP [17] models. However, in comparison to others, Maximum Entropy Modeling (MaxEnt) has superior performance with presence-only small sample size, and its proven reliability in modeling rare or under-recorded species [4,9,10,11,12]. MaxEnt also explores variable importance metrics, response curves, and jackknife tests, which enhance the ecological interpretability of model results [16,18]. When combined with climate change scenarios, MaxEnt provides valuable insights into how species’ suitable habitats may expand, shift, or become extinct under future environmental conditions.
The genus Carex L. (Cyperaceae), the sedge, with over 2000 species globally, is one of the most species-rich groups of vascular plants, occupying a wide variety of ecosystems including wetlands, boreal forests, alpine tundra, and grasslands. In the province of Saskatchewan in Canada, Carex represents the largest genus of vascular plants, comprising 105 documented species [19], most of which are concentrated in the central regions of the province [20]. Previous research has shown that the distribution of Carex species is strongly influenced by climatic variables: temperature and precipitation [20]. These associations suggest that ongoing climate change may significantly impact the habitat suitability of many species, particularly those already under threat. Along with climate change, sedges in unprotected areas are vulnerable to multiple human-driven pressures, such as (i) habitat loss and fragmentation, (ii) conversion of land for agriculture, (iii) rapid urban and rural development, and (iv) industrial mining activities [21]. Building on our earlier conservation gap analysis that identified 21 Carex species of conservation concern in Saskatchewan [21], the present study re-evaluates these species to model potential habitat suitability using the MaxEnt algorithm.
For Carex species, multiple studies have been observed to address knowledge gaps of the effects of climate change and support effective conservation policy [22,23,24]. Following its significance, our study represents the first spatially explicit prediction of distributions of six Carex species of conservation concern in Saskatchewan under climate change scenarios. We employ two Shared Socioeconomic Pathways (SSPs), SSP245 and SSP585, to project future habitat suitability for the 2030s and 2050s. SSP245 represents an intermediate scenario with moderate emissions and climate policy implementation, while SSP585 reflects a high-emissions, fossil-fuel-intensive trajectory. Together, these scenarios allow for a comparative assessment of how different climate futures may impact on the distribution and persistence of threatened species. Climate projections involve uncertainty due to variations in climate models, emission pathways, and ecological responses. By applying multiple SSP scenarios, this study helps address these uncertainties and offers a more reliable foundation for forecasting future habitat changes to inform conservation planning. The main objectives of this research on six priority Carex species in Saskatchewan are to (a) evaluate their current potential distribution; (b) project future shifts in their habitat suitability under SSP245 and SSP585 for the 2030s and 2050s; and (c) identify the major environmental variables influencing their spatial patterns.

2. Materials and Methods

2.1. Study Area

Figure 1 presents the geographical boundaries of the province of Saskatchewan in reference to the map of Canada, which was the focused area of our research. This province is subdivided into four distinct ecozones or biomes, which are the Prairie, Boreal Plain, Boreal Shield, and Taiga Shield. The Prairie ecozone has four distinct ecoregions that encompasses southern parts of the province. The Boreal Plain ecozone and Boreal Shield ecozones occupy central Saskatchewan with three and two distinct ecoregions, respectively. In the most northern part of the province, two distinct ecoregions are located within the Taiga Shield ecozone. Shape file of the Saskatchewan geographic boundary was sourced from our previous publication [20]. A subsequent study performed conservation gap analysis for 49 rare species and reported 21 Carex species of conservation concern in the province [21].

2.2. Species Selection

In Saskatchewan, Carex is the largest genus of vascular plants with 105 species [19]. Aligned with the list of species, primary occurrence records for this study were sourced from the W.P. Fraser Herbarium at University of Saskatchewan (SASK) mobilized by the Flora of Saskatchewan Association [25] and supplemented with additional data from the Global Biodiversity Information Facility (GBIF) [26]. The harnessed data were processed and validated in our previous research, which included 2655 presence records of 105 species [21]. In this study we re-evaluate those 21 species of conservation concern to predict habitat suitability through MaxEnt [16]. As to ensure reliability and accuracy of the prediction, it is required to have at least 5 presence records for each species [27,28]. Thus, we selected 6 out of 21 species of conservation concern that match the criterion for predicting their potential distribution and have highest conservation ranks at the national and subnational (provincial) levels. This group includes three nationally at-risk species (C. assiniboinensis, C. saximontana, C. tetanica) and three provincially rare species (C. glacialis, C. granularis, C. supina subsp. spaniocarpa) with a total 55 records that range from 5 to 15. It should be noted that none of these Carex species has occurrences in the protected areas of Saskatchewan [21]. The recorded locations of priority species were given in Figure 1. Excel files with all the records were converted into CSV files format to use in the prediction model. Below are brief conservation profiles of priority Carex species based on the data obtained in the previous assessments [20,21].
C. assiniboinensis (N3N4, S3): The species has 11 records of Occurrence (O = 11) with distribution in three ecoregions of the province (Aspen Parkland, Moist-Mixed Grassland, Mid-boreal Lowland) conditioned by the high and medium threat levels. It has an Extent of Occurrence (EOO) greater than 71,300 km2 presented by a fragmented distribution with Area of Occupancy (AOO) of 40 km2. The species populations are under threats such as agricultural and urban expansion, and to some extend mining.
C. saximontana (N3, S3): This species has the highest number of occurrences (O = 15) in four ecoregions of the province (Aspen Parkland, Moist-Mixed Grassland, Mixed Grassland, Cypress Upland), with a wide distribution (EOO = 102,091 km2; AOO = 60 km2). The species’ locations in this Prairie ecozone or biome are conditioned by the high threat level due to intensive agriculture and urban expansion.
C. tetanica (N3, S3): It has 10 recorded occurrences (O = 10) and scattered distribution across three ecoregions of the province (Moist-Mixed Grassland, Boreal Transition, Mid-boreal Lowland). The species has a large Extent of Occurrence (EOO = 33,397.1 km2) with mid-size Area of Occupancy (AOO = 40 km2). The species populations are under high threat level, such as agricultural and urban expansion, and mining.
C. glacialis (SH): The species has both small Extent of Occurrence (EOO = 477.2 km2) and Area of Occupancy (AOO = 20 km2), and only five recorded locations (O = 5) in the remote Selwyn Lake Upland ecoregion of the province. The species’ locations in this isolated ecoregion are conditioned by low threat levels. Research actions and field efforts are necessary to quantify the number of individuals in the population.
C. granularis (S2): The species has seven occurrences (O = 7) with distribution in three ecoregions of the province (Aspen Parkland, Boreal Transition, Mid-boreal Lowland) with the high and medium threat levels. It has an Extent of Occurrence (EOO) of 26,466.2 km2 with an Area of Occupancy (AOO) of 40 km2. The species populations are under threat, such as agricultural and urban expansion and partially mining.
C. supina subsp. spaniocarpa (SH): It has a total of five records of Occurrence (O = 5), covering a mid-size Extent of Occurrence (EOO) equal to 5338.9 km2 and a small Area of Occupancy (AOO = 20 km2). The species has limited distribution in two ecoregions of the province (Churchill River Upland, Selwyn Lake Upland) conditioned by the medium and low threat levels. Research actions and field efforts are necessary to quantify the number of individuals in the population.

2.3. Environmental Data Source and Variable Selection

To develop the distribution model of six priority Carex species, we considered 19 climatic data, and elevation data (Table A1). The bioclimatic variables (BIO1-BIO19), and elevation (ELV) of the current conditions (1970 to 2000) were collected with a spatial resolution of 30 arc-seconds from the publicly available resource, WorldClim 2.1 database [29]. From the same database, we also collected similar data of two future periods (2021 to 2040), and (2041 to 2060). For each period, we collected SSP 4.5 “Middle of the Road” and SSP 8.5 “Taking the Highway”, developed by IPCC and Coupled Model Intercomparison Project Phase 6 (CMIP6) [1,30]. In total, 20 variables were utilized 1 km spatial resolution that related to a surface of 0.86 km2 at the equator [31]. Following that, we extracted all the environmental data associated with the species occurrence records for Saskatchewan.
Initial screening was performed using the MaxEnt 3.4.4 software [18] to understand environmental variables affecting the prediction model with a setting of default ‘Auto features’, three replicated runs, and the jackknife test [30]. We obtained percent contribution, permutation importance, and significance of each variable. Based on that, we develop a priority ranking for the variables. For that, we considered permutation importance over percent contribution to rank each variable as it is widely considered [29,30,32]. Variables with below 1% contribution were excluded from the consideration [30,31]. We did a statistical correlation test in RStudio through (ENMTools) and (raster) package [33]. In the species distribution modeling, collinearity in environmental variables can negatively affect the overall reliability and accuracy of the prediction [30,34]. Thus, when the correlation value of the variables was |r| ≥ 0.8, we excluded one of two variables which have lower significance considering the priority ranking [30,35,36]. All the remaining variables were considered to predict the present distribution of species. However, it is assumed that the elevation will not change in future, which remains constant in our future predictions.

2.4. Model Description

In this study, we used the MaxEnt software (3.4.4.) to predict the habitat suitability [18] of six priority Carex species. The other parameters were set as follows: maximum number of iterations (500), maximum background points (10,000), convergence threshold (1 × 10⁻⁵), output format (Cloglog), and output file (asc). We also included the response curve and jackknife test of variable importance. However, the other parameters feature combination (FC) and regularization multiplier (RM) were adjusted for each model run based on R package ENMeval output [37,38]. It is because by using default settings, those parameters result in overfitting problems [30,39,40], and adjusting those parameters provides better outputs. The lowest values of AICc delta calculated by ENMeval produced a better model; thus, that combination was selected to run the model [37,41]. We evaluated the accuracy of the model through Receiver Operating Characteristic (ROC) curves and the area under the ROC curve or AUC values (Area Under Curve) [42,43]. AUC values range from 0.5 to 1, where higher values indicate more accuracy in prediction. We evaluated the AUC based on followings: fail (0.5–0.6), poor (0.6–0.7), fair (0.7–0.8), good (0.8–0.9), and excellent (0.9–1.0) [30,44].

2.5. Suitable Habitat Classification

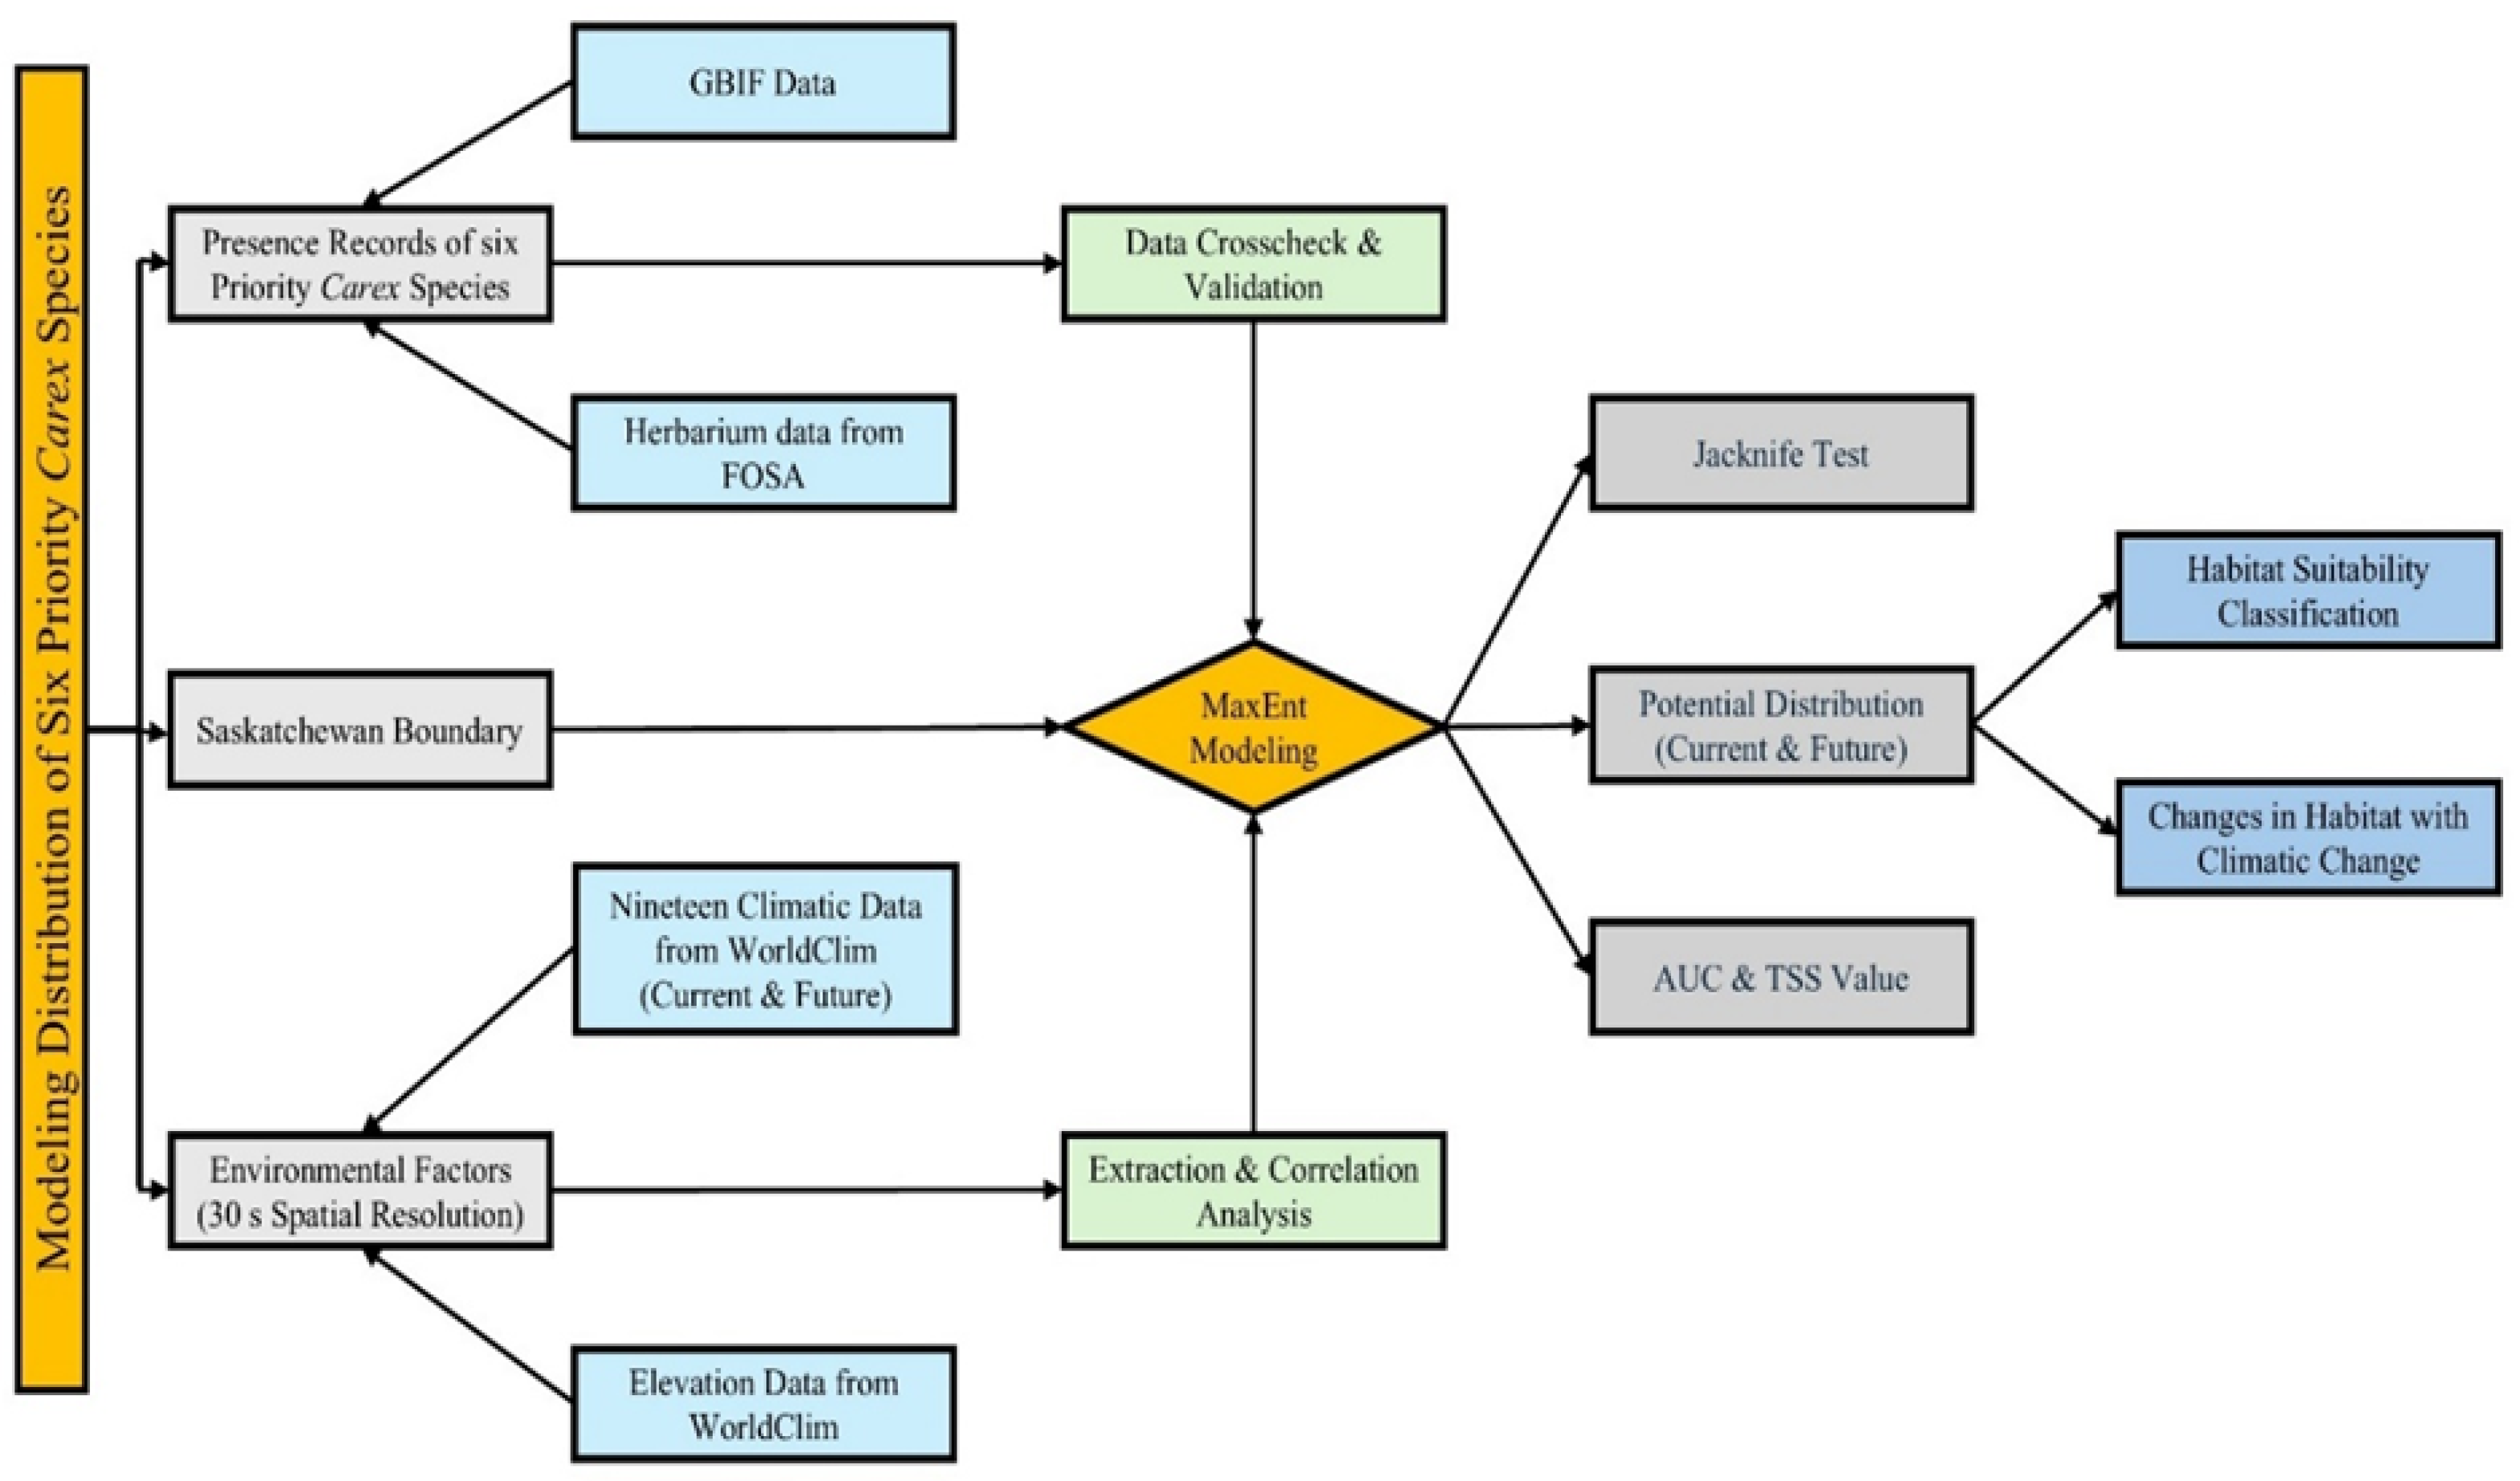
After performing the distribution modeling in MaxEnt, it produced the output in ASCII files, which were imported to ArcGIS and converted into raster files. In each cell, there are Cloglog values that range from 0 to 1, where a higher value indicates more suitability probability based on those values. We classified habitat of each priority Carex species into four categories (unsuitability, low suitability, moderate suitability, and higher suitability) using Reclassify tools in ArcGIS. We considered Jenks’ natural breaks algorithm to classify the suitability of habitat categorization that has been followed on C. alatauensis [24]. The overall major steps of the workflow for modeling priority species are presented in Figure 2.

3. Results

3.1. Model Optimization and Accuracy Evaluation

The species distribution prediction models for C. assiniboinensis, C. saximontana, C. tetanica, C. glacialis, C. supina subsp. spaniocarpa, C. granularis were 100% successfully run. We used R-Studio R package ENMeval output to test different combination of standard values. We considered RM 1 to 5 and feature classes (FC) combination (L = linear, Q = quadratic, H = hinge, P = product, and T = threshold) that produced 30 different sets of combinations to identify the best prediction results. From the different combinations, we selected the combinations that had an Akaike information criterion correction delta (ΔAICc) value of zero. All the species distribution models for priority Carex species demonstrated strong predictive performance based on AUC values (good to excellent categories). The boxplot of the AUC values of the model is presented in Figure 3.
Among the nationally at-risk species, the model for C. assiniboinensis achieved an AUC of 0.981 ± 0.005, categorized as excellent. The model was calibrated with an RM of 2 and LQ feature classes. For C. saximontana, the model yielded an AUC of 0.877 ± 0.007, which falls under the good category. This model was generated using RM = 1 and H features. The model for C. tetanica achieved an excellent AUC of 0.931 ± 0.013 with a combination of LQHP feature classes and an RM of 1.
Among the provincially rare species, C. glacialis showed the strongest model results with an AUC of 0.994 ± 0.001, the highest among all six priority species. We used a model configuration of RM = 4 and LQPHT feature classes. C. supina subsp. spaniocarpa demonstrated excellent performance, with an AUC of 0.985 ± 0.002. The model, developed with RM = 2 and LQ feature classes. C. granularis also showed excellent AUC of 0.945 ± 0.013 where RM = 1 and LQPHT feature classes were used.

3.2. Climatic Factors Influencing Potential Distribution

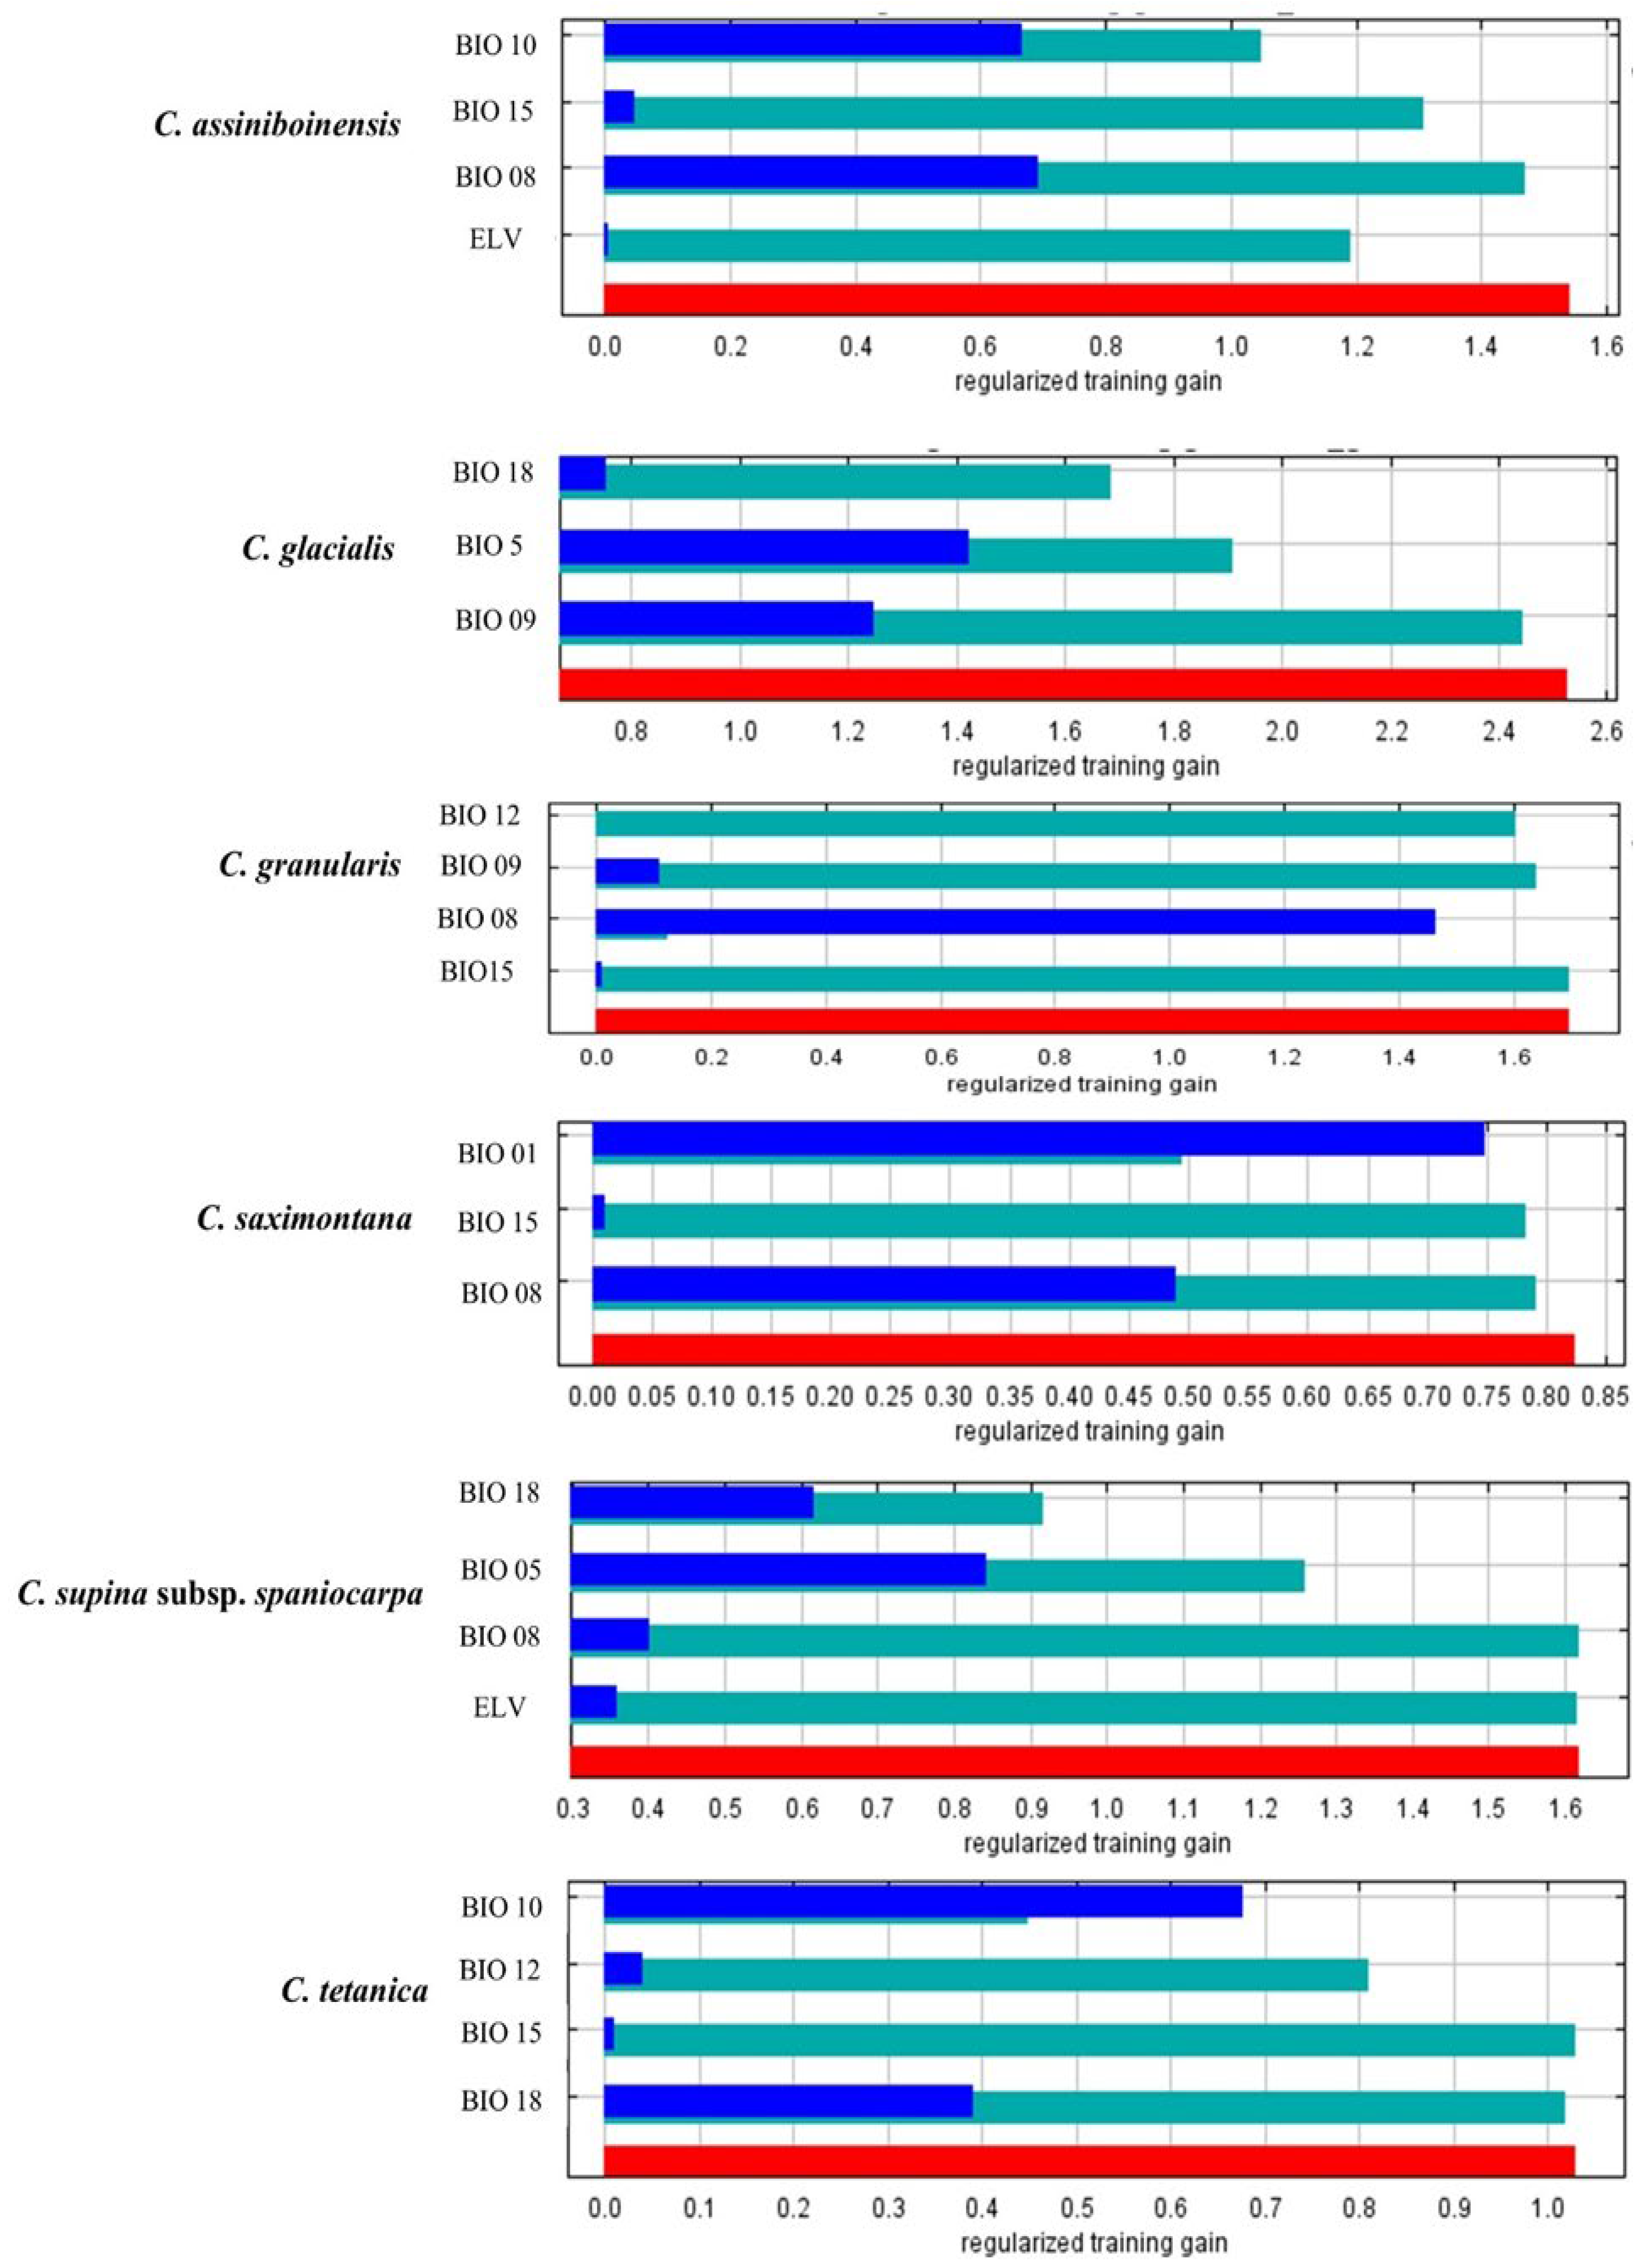
Climatic variables are influencing the potential distribution of the nationally at-risk species (C. assiniboinensis, C. saximontana, C. tetanica) along with the provincially rare species (C. glacialis, C. granularis, C. supina subsp. spaniocarpa) (Table A2). Figure 4 presents Jacknife test results of training gain for six priority sedges.
Among the nationally at-risk species, C. assiniboinensis is primarily influenced by thermal variables. BIO10 (mean temperature of the warmest quarter) and BIO8 (mean temperature of the wettest quarter) exhibit the highest permutation importance values at 31.2% and 28.9%, and elevation (ELV) also contribute to the model at lower levels, with respective permutation of 38.1% and 36.2%, respectively, to the final model. BIO15 (precipitation seasonality) contributes values of 10.7% and 15.2%, and percentage contributions of 17.6% and 7.4%. C. saximontana is driven by BIO1 (annual mean temperature), with a permutation importance of 84.4% and a percent contribution of 80%. BIO18 (precipitation of the warmest quarter) and BIO15 contribute more modestly, with permutation values of 7.3% and 6.3%, and contributions of 16.4% and 3.6%. For C. tetanica, BIO10 is the dominant variable (73.5% importance, 80% contribution), followed by BIO12 (annual precipitation; 10.3% importance, 8.3% contribution), BIO8 (10.2% importance, 9.5% contribution), and BIO15 (6.1% importance, 2.1% contribution).
Among the provincially rare species, C. glacialis is most influenced by BIO18 (precipitation of the warmest quarter; 60.8% importance, 38.6% contribution), with secondary influences from BIO5 (maximum temperature of the warmest month; 36.9% importance, 26.7% contribution) and BIO9 (mean temperature of the driest quarter; 2.3% importance, 34.6% contribution). C. granularis shows sensitivity to BIO8 (83.6% importance, 84.9% contribution), BIO15 (8.3% importance, 10.2% contribution), BIO12 (7.1% importance, 3.2% contribution), and BIO9 (0.6% importance, 1.6% contribution).

3.3. Prediction of Potential Geographic Distribution Under the Current Climatic Period

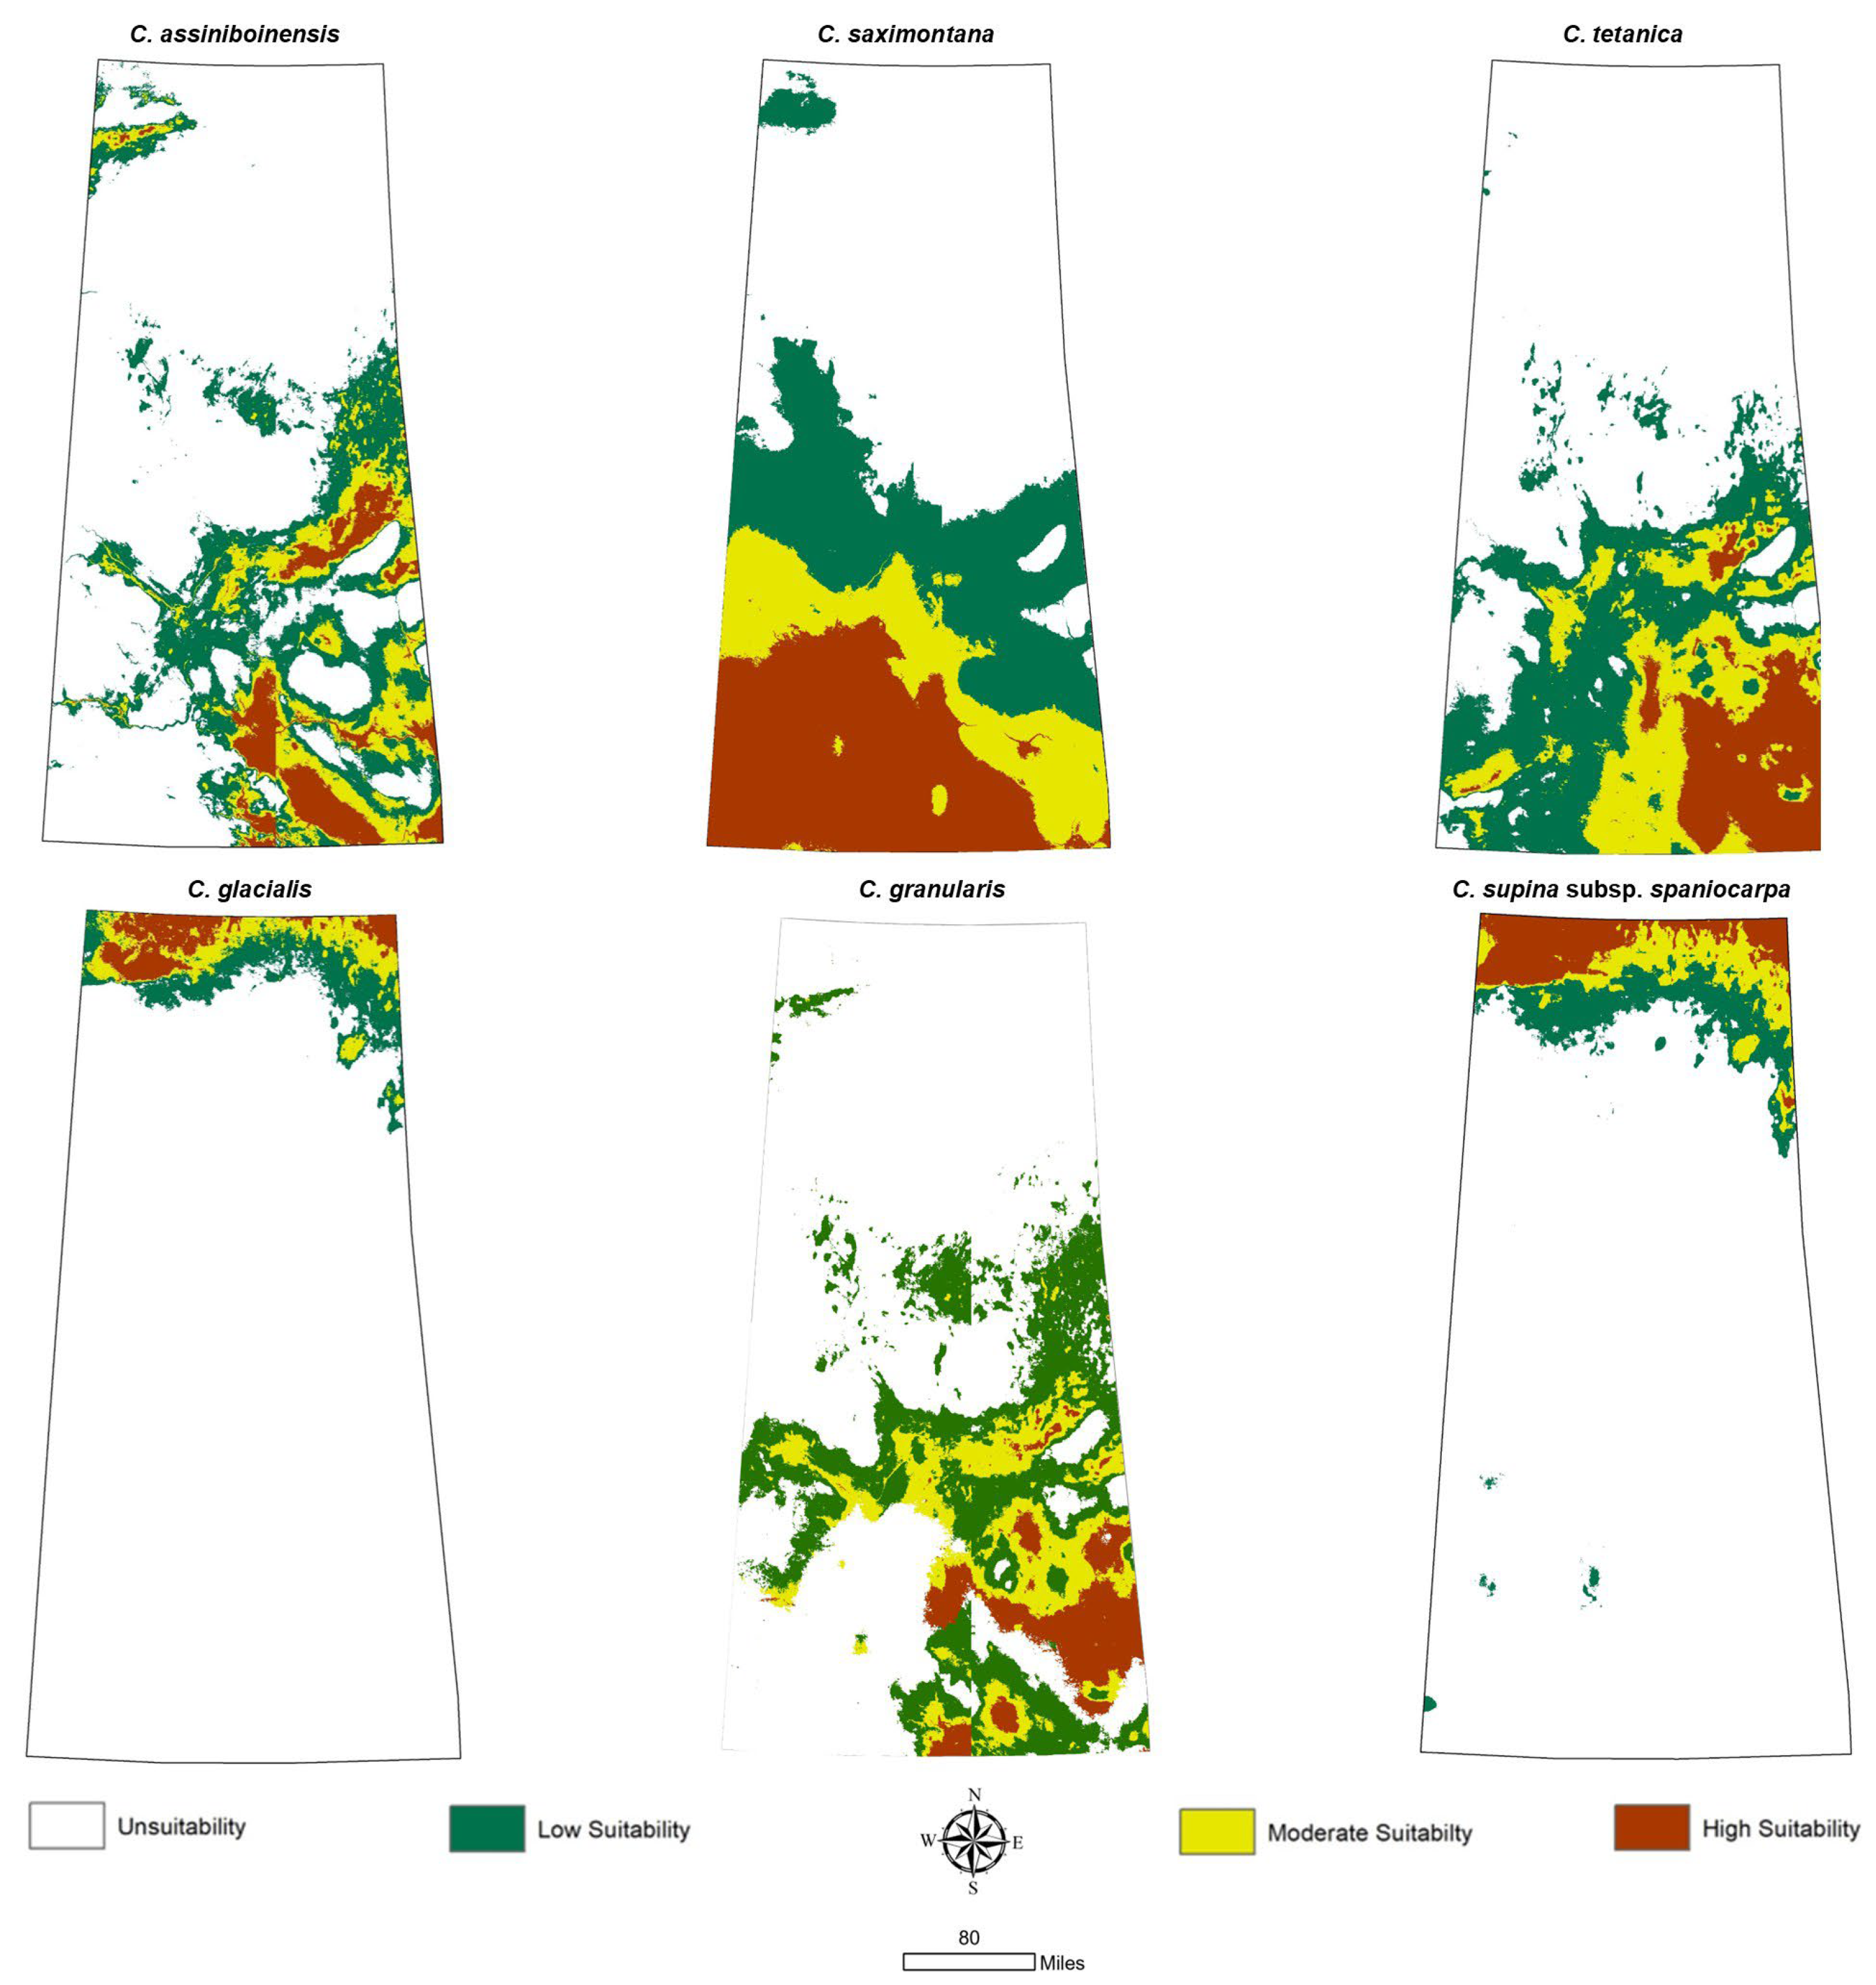
Under the current climatic conditions (1970–2000), the potential geographic distribution of six priority Carex species varies in terms of habitat suitability (Table A3, Table A4, Table A5, Table A6, Table A7 and Table A8) (Figure 5).
C. assiniboinensis, a nationally at-risk species, is primarily constrained by unsuitable environments, which make up 70.63% of the landscape. Only 4.85% of the area is classified as highly suitable, while moderate and low suitability cover 7.92% and 16.6%, respectively. Similarly, C. tetanica shows a limited extent of high suitability (8.87%), with 60.28% of the area unsuitable, and the remaining divided between moderate (11.38%) and low (19.45%) suitability zones. C. saximontana, another nationally designated species at risk, appears to have a comparatively broader distribution, with 18.95% of the area categorized as highly suitable, and a larger proportion deemed unsuitable (48.35%).
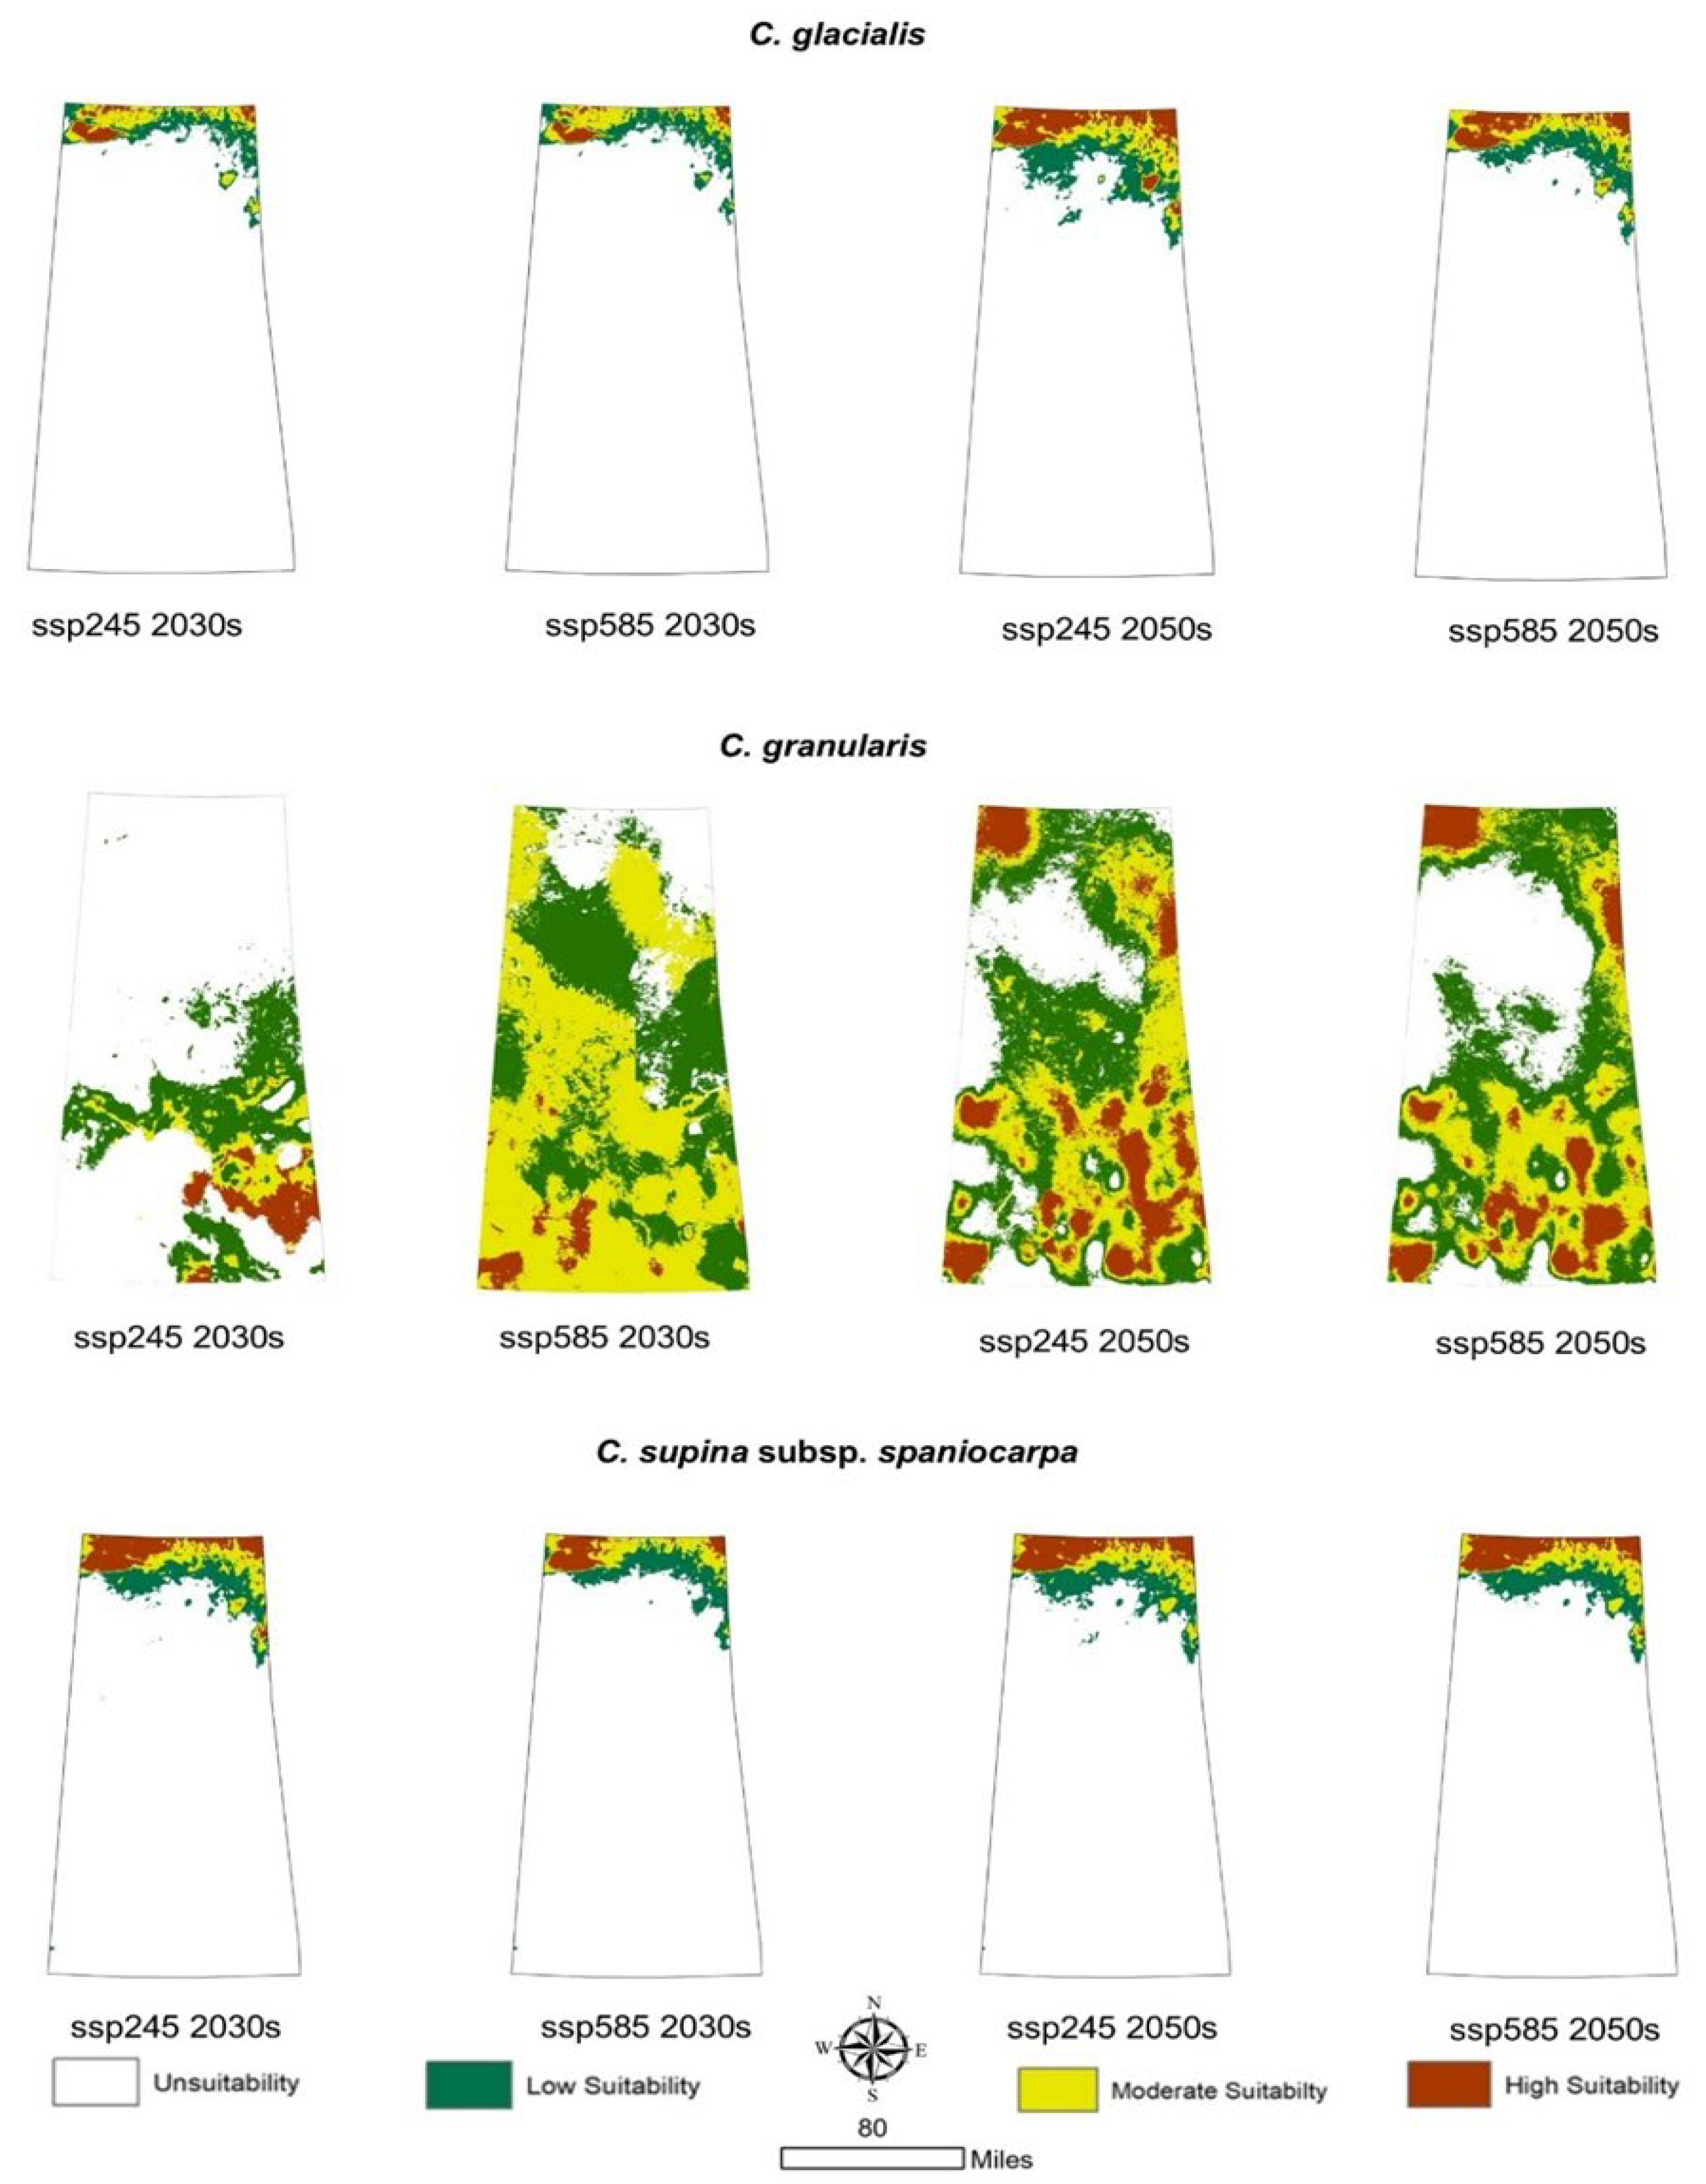
Among the provincially rare species, C. glacialis demonstrates the most restricted range, with 90.58% of the region unsuitable and a mere 2.33% classified as highly suitable. Low and moderate suitability areas together comprise less than 8% of their predicted range. C. supina subsp. spaniocarpa, on the other hand, is predominantly limited by unsuitable conditions (86.41%), with just 4.36% of the area rated as highly suitable, and the remaining 9.24% falling under low and moderate suitability classes. C. granularis shows a moderately restricted distribution, with 69% of the total area classified as unsuitable. Low suitability accounts for 18% of the landscape, while moderate and high suitability areas comprise 8% and 5%, respectively.

3.4. Prediction of Potential Geographic Distribution Under Future Climatic Scenarios

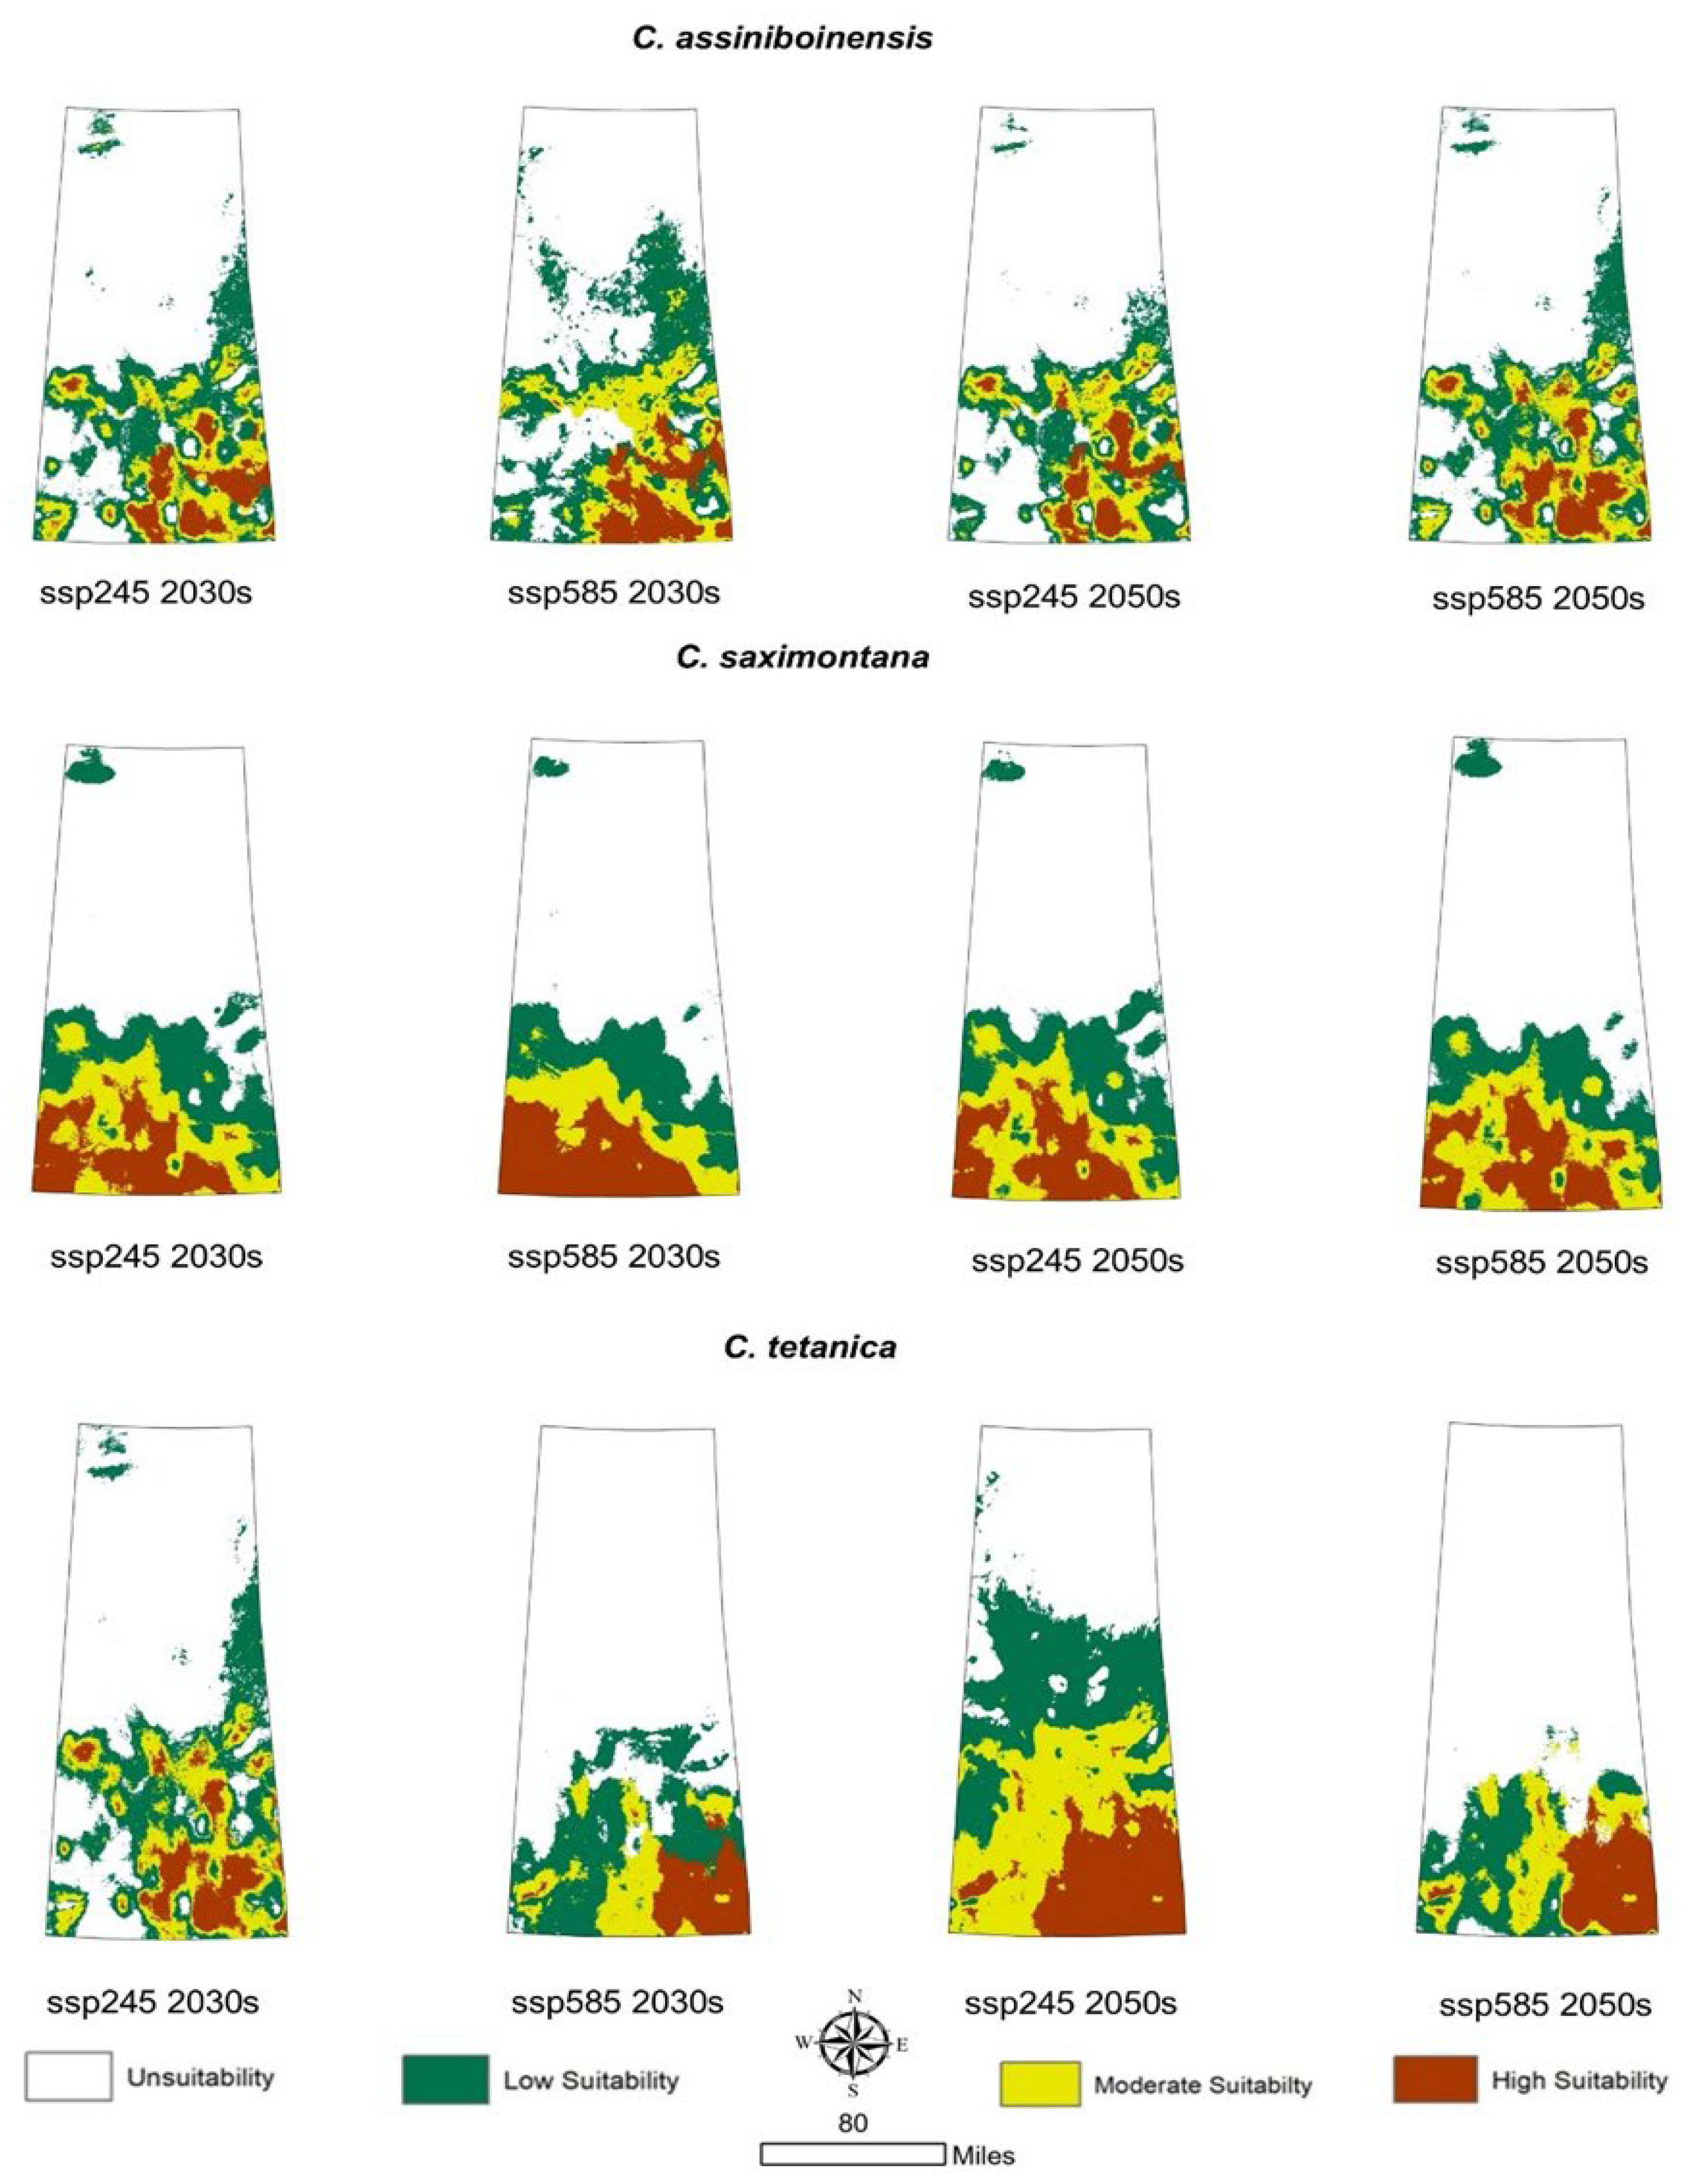
Under projected future climate scenarios, the potential distribution of suitable habitats for the nationally at-risk species (C. assiniboinensis, C. saximontana, C. tetanica) is expected to shift, with varying trends across species and emission pathways (Table A3, Table A4 and Table A5) (Figure 6).
For C. assiniboinensis, a modest increase in high suitability areas is projected for the 2030s, rising from 4.85% under current conditions to 6.41% under SSP245 and 8.33% under SSP585. However, this expansion appears to plateau or slightly decline by the 2050s, with high suitability areas covering 5.70% under SSP245 and 6.82% under SSP585. In contrast, C. saximontana is projected to experience a continuous reduction in high suitability habitat. The percentage of highly suitable areas declines from 18.95% under baseline conditions to 10.72% (SSP245) and 13.13% (SSP585) in the 2030s and further decreases to 10.81% and 10.74%, respectively, by the 2050s. These consistent declines may lead to a contraction of optimal climatic conditions for this species. C. tetanica, on the other hand, demonstrates a more favorable response to climate change, particularly under the moderate-emissions SSP245 scenario. High suitability increases from 8.87% to 10.38% in the 2030s and peaks at 14.90% in the 2050s. Under SSP585, a decline to 6.27% is projected in the 2030s, followed by a recovery to 8.18% by mid-century, indicating that this species may benefit from moderate climate change, but shows sensitivity to more extreme conditions.
For the provincially rare species (C. glacialis, C. granularis, C. supina subsp. spaniocarpa) climate projections indicate patterns of habitat suitability (Table A6, Table A7 and Table A8) (Figure 7).
C. glacialis is expected to face a marked reduction in high suitability habitat, decreasing from 2.33% under current conditions to 1.21% and 1.06% in the 2030s under SSP245 and SSP585, respectively. Although slight increases are projected by the 2050s (4.64% under SSP245 and 2.93% under SSP585), most of the landscape remains unsuitable. C. granularis is projected to undergo substantial expansion in suitable habitat under future scenarios. High suitability areas increase from 5.03% in the 2030s under SSP245 to 14.53% by the 2050s. Unsuitable habitat decreases significantly from 74.48% to 33.56%, while moderate suitability rises markedly, reaching 48.54% under SSP585 in the 2030s and 28.19% under SSP245 in the 2050s. C. supina subsp. spaniocarpa is projected to maintain a relatively stable but restricted distribution. High suitability areas fluctuate modestly from 4.36% at present to a range of 2.19–4.27% across future scenarios, with unsuitable habitat consistently exceeding ¾ area of the landscape.

3.5. Dynamic Changes in Suitable Areas Under Future Climatic Scenarios

Under projected future climate scenarios, the potential distribution of suitable habitats for the nationally at-risk species (C. assiniboinensis, C. saximontana, C. tetanica) is expected to shift, with different trends across species and emissions pathways (Table A9, Table A10 and Table A11) (Figure 8).
For C. assiniboinensis, projections indicate moderate habitat expansion by the 2030s. Under SSP245, 28.25% of the landscape remains suitable (stable), with an additional 12.20% newly gaining suitability. Under SSP585, the gain is even higher (20.17%) despite a slight decline in stable habitat (25.81%). By the 2050s, under SSP245, suitable stable habitat drops sharply; however, a substantial 32.89% of the area becomes newly suitable. Under SSP585, the species retains 25.10% of its original suitable habitat, with an additional 12.62% expansion. In contrast, C. saximontana is projected to experience a gradual contraction in climatically suitable conditions. The proportion of suitable stable habitat declines from 38.70% in the 2030s (SSP245) to 36.50% under SSP585 and remains around those levels through the 2050s. Notably, gains are minimal across scenarios, while losses remain high (11.24–15.15%). C. tetanica, on the other hand, demonstrates a more favorable response to climate change, particularly under the moderate-emission SSP245 pathway. In the 2030s, 38.89% of the habitat remains stable, with a 5.94% gain in new suitable areas. By the 2050s, stable habitat increases, while habitat gain surges to 21.67%. Under SSP585, however, suitable stable area drops to 29.38% in the 2030s and only slightly rebounds to 26.13% by the 2050s, with a concurrent increase in habitat loss (up to 14%).
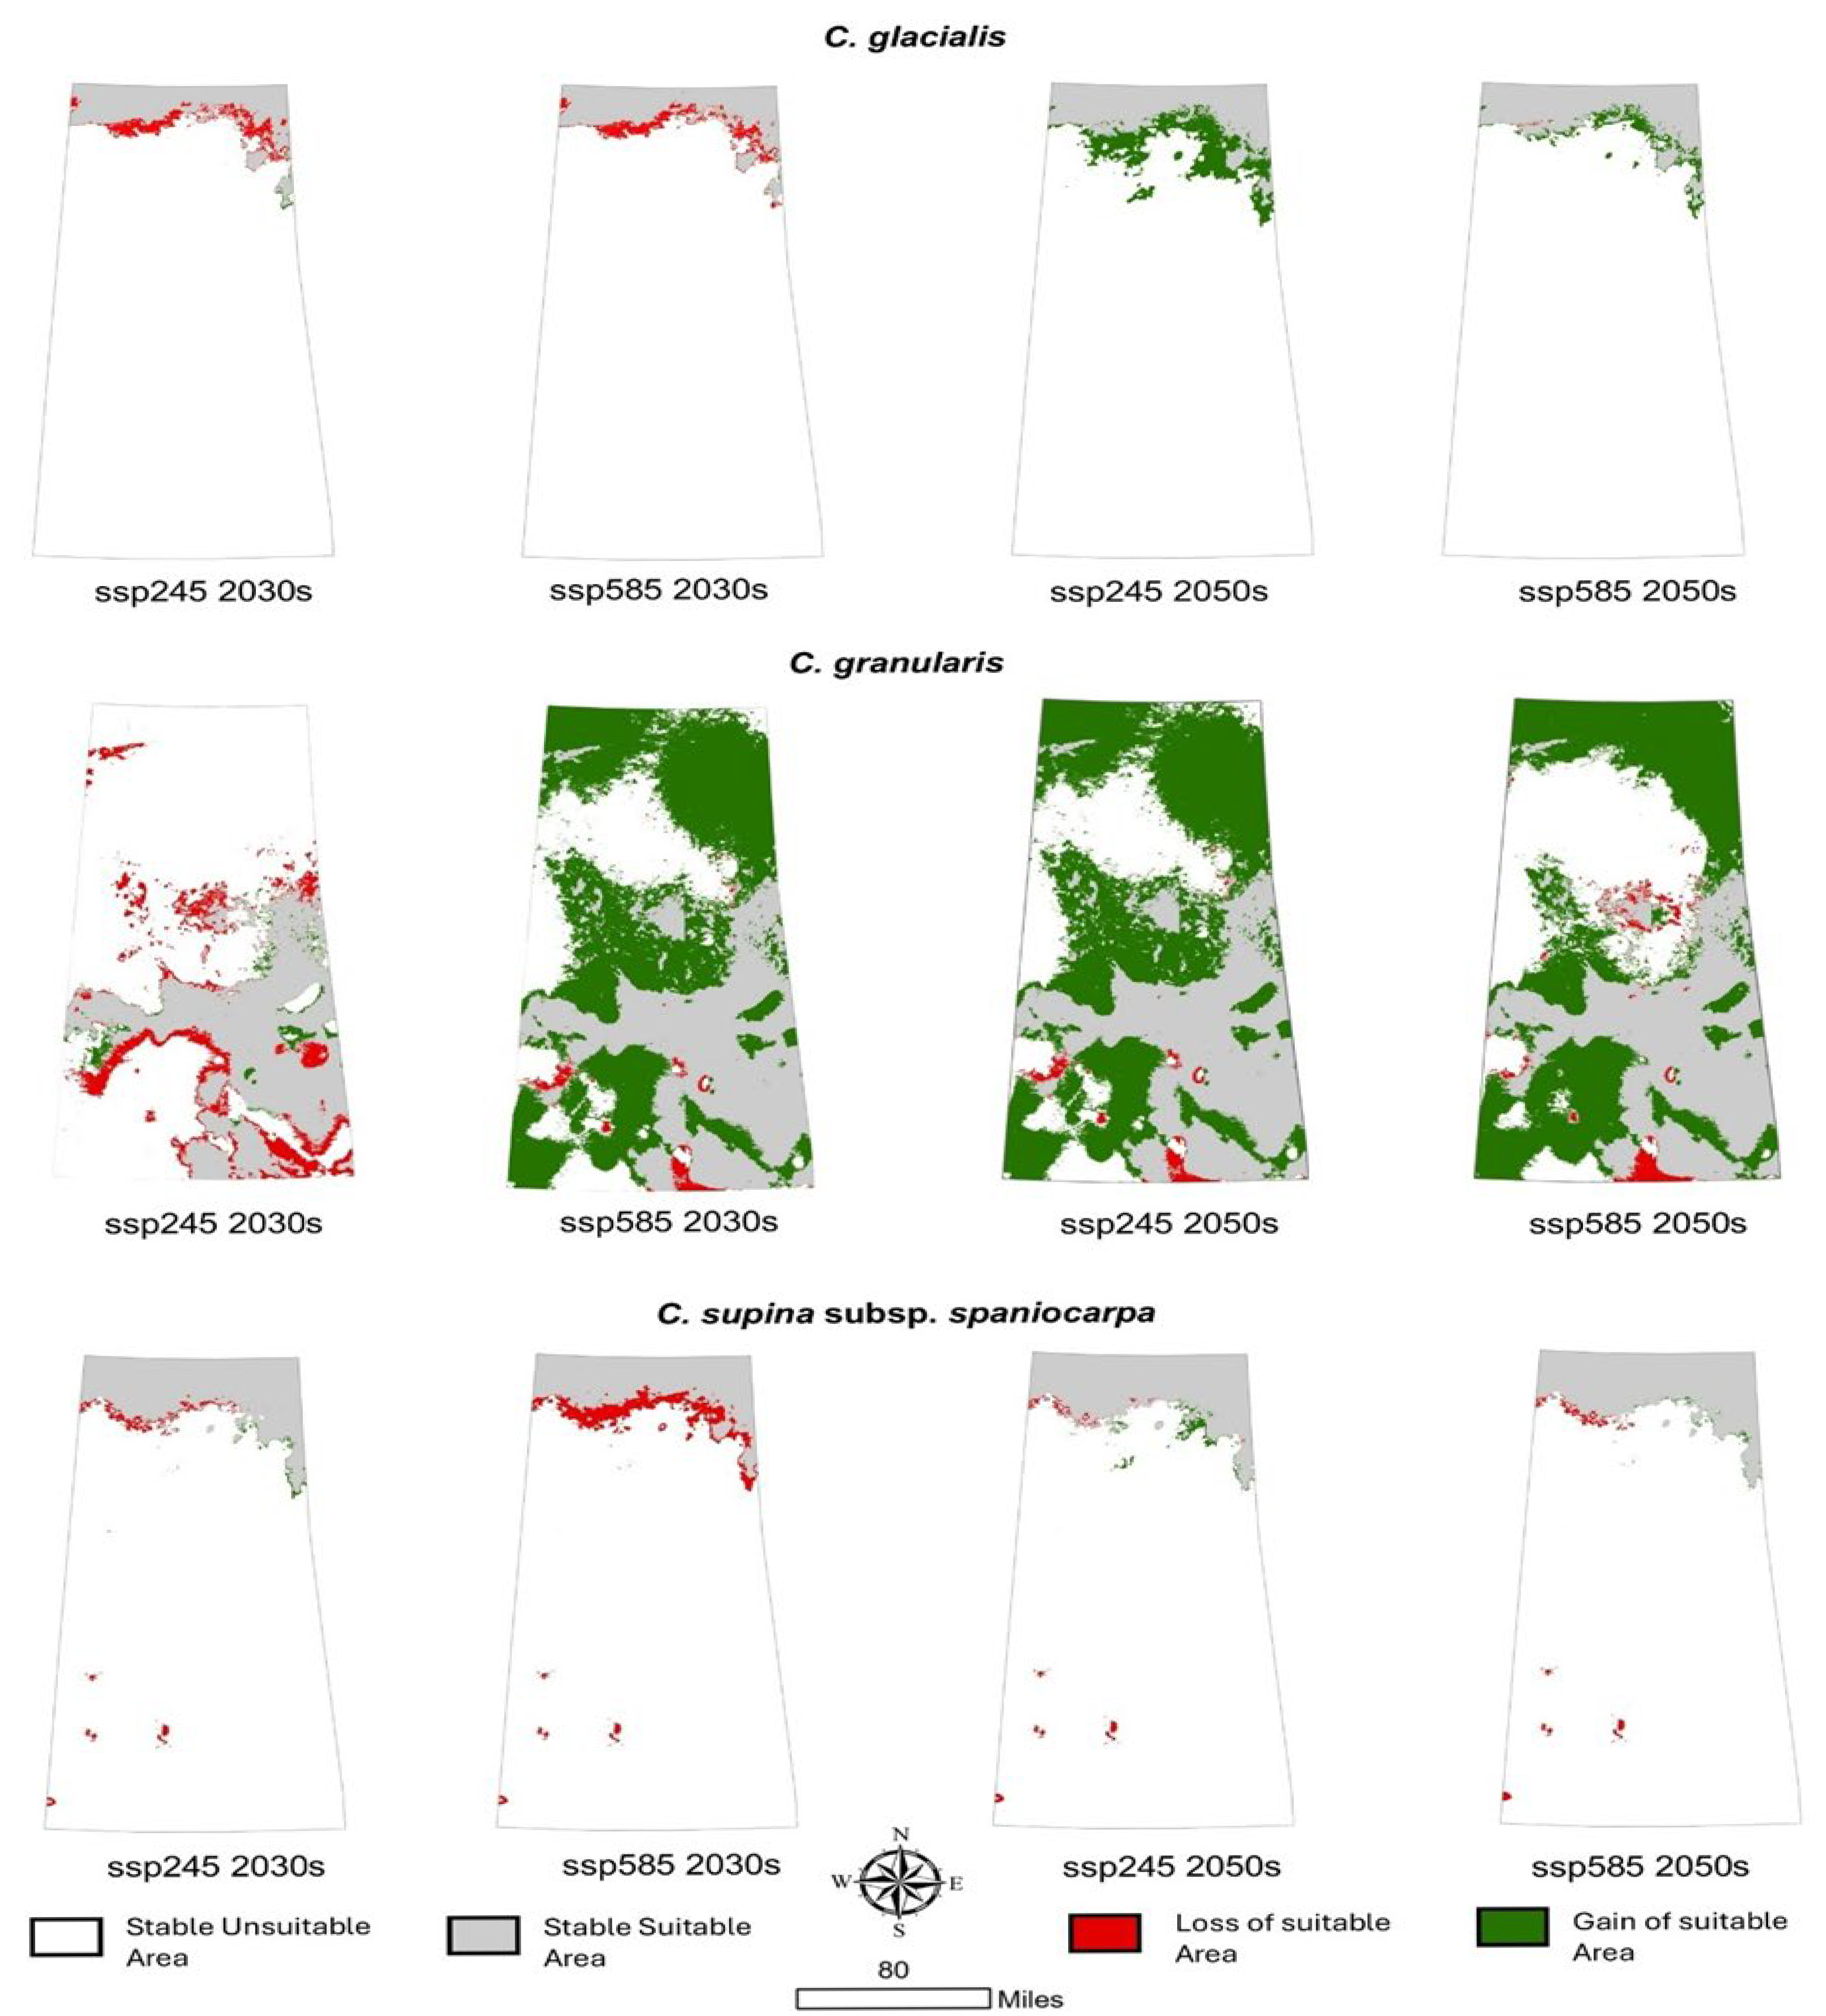
The potential distribution of suitable habitats for the provincially rare species (C. glacialis, C. granularis, C. supina subsp. spaniocarpa) is expected to shift, with varying responses across species and emissions pathways (Table A12, Table A13 and Table A14) (Figure 9).
For C. glacialis, future projections indicate a relatively stable but narrow distribution. In the 2030s, under SSP245 and SSP585, stable suitable habitat remains low (7.47% and 7.69%, respectively), with minimal gains (1.79% and 0.05%) and losses under 2%. By the 2050s, under SSP245, stable suitability increases to 9.42%, with a moderate gain (5.34%) and no loss. Under SSP585, the habitat remains mostly unchanged, with 9.4% stable, 1.69% gained, and only 0.03% lost. C. granularis is projected to experience dynamic changes in habitat conditions. In the 2030s, under SSP245, 23.99% of the habitat remains stable, with minor gain (1.53%) and notable loss (7.3%). However, under SSP585, suitable conditions expand a lot, with 54.73% of the landscape becoming newly suitable, and 30.08% remaining stable. By the 2050s, SSP245 continues to support expansion, with 45.89% gain and 30.19% stable habitat, while loss decreases to 1.1%. Under SSP585, the trend showed 37.79% gain and a minimal loss of 1.1%. During the 2030s, C. supina subsp. spaniocarpa, areas of high suitability are projected to range between 10.39% and 12.72%, accompanied by negligible habitat gains (0–0.23%) and low levels of habitat loss (0.87–3.2%). By the 2050s, the extent of stable suitable habitat remains relatively unchanged (13.04–13.14%), with only minor increases (0.21–0.58%) and small reductions (0.45–0.56%).

4. Discussion

Our study demonstrates the effective use of ecological niche modeling to understand the spatial ecology and climate sensitivity of six Carex species of conservation concern in Saskatchewan. By optimizing the MaxEnt model parameters using the ENMeval package testing various regularization multipliers and feature class combinations, we achieved strong predictive performance across all species. The success of these models, even with relatively limited occurrence data, highlights their robustness and applicability in data-scarce contexts. While this study focused exclusively on climatic variables and did not incorporate anthropogenic factors, it offers essential baseline insights into species–climate relationships. Climatic factors are one of the important factors that affect distribution of species on large scale [24]. In regions with limited ecological data or large-scale landscapes like the province of Saskatchewan, which is larger than any country located entirely in Europe, climate-based modeling serves as a valuable starting point for future conservation planning.
Building on our earlier findings that Carex species are closely associated with temperature and precipitation [20], this analysis provides a more refined understanding of species-specific climatic drivers. Prior study on C. alatauensis in China also revealed temperature and precipitation related variables influenced its distribution [24]. Our findings reveal species-specific responses to climate variables, with temperature-related factors: BIO10 (Mean Temperature of the Warmest Quarter), BIO1 (Annual Mean Temperature), and BIO5 (Maximum Temperature of the Warmest Month) emerging as dominant predictors across most of our priority species. In addition to that, Precipitation variables, particularly BIO18 (Precipitation of the Warmest Quarter) and BIO15 (Precipitation Seasonality), also played important roles. These findings emphasize that both thermal and moisture regimes are critical in defining suitable habitats for Carex species, in line with the genus known association with hydrological gradients.
Under current climatic conditions, species like C. glacialis and C. supina subsp. spaniocarpa are confined to narrow ecological niches, with limited highly suitable habitat. Future projections under SSP245 and SSP585 scenarios suggest mixed outcomes. C. tetanica and C. granularis are likely to benefit from an expansion of climatically favorable areas, while others like C. saximontana and C. glacialis are projected to experience sharp declines in suitable habitats. These divergent trends reflect the species-specific nature of climate change impacts on biodiversity. Importantly, the study also illustrates the usefulness of applying MaxEnt in regions with limited ecological data. Saskatchewan’s vast and ecologically diverse landscape poses challenges for ground-based monitoring of rare species, making predictive tools like MaxEnt essential for identifying areas of conservation priority.
While this study focused primarily on climatic drivers, future assessments may consider additional factors: land use change, soil properties, and anthropogenic disturbances to provide a more holistic understanding of habitat dynamics. As with most correlative SDMs, our models assume unlimited dispersal, which may be unrealistic for Carex species with limited seed dispersal capabilities. We also did not account for potential evolutionary adaptation, which could alter species’ climate tolerances over time. Additionally, our models excluded biotic interactions such as competition, herbivory, and mutualisms that can shape realized distributions.
From a conservation planning perspective, this research contributes critical baseline information for targeted protection and restoration efforts. The nationally at-risk Carex species, which show high vulnerability to climatic shifts, may be prioritized for monitoring and management. Conversely, the apparent climate adaptability of the provincially rare Carex species presents opportunities for ecosystem resilience planning and habitat connectivity enhancement. Our study provides critical insight into how the priority Carex species in Saskatchewan may respond to climate change identifying its gain and loss. These findings highlight the necessity of integrating predictive modeling into conservation planning, especially under rapid environmental change. The combined use of climate sensitivity analysis and spatial distribution mapping provides an essential framework for informing habitat protection, restoration, and long-term biodiversity management under changing environmental conditions.

5. Conclusions

This study presents the first detailed, spatially explicit analysis of climate change impacts on six Carex species of conservation concern in Saskatchewan, providing an essential foundation for effective biodiversity management. Our findings not only reveal the climate sensitivity of these species but also demonstrate the value of predictive modeling in anticipating biodiversity changes before they are evident in the field. Using optimized MaxEnt models and species-specific climatic drivers, we identified both potential climate refugia and areas at heightened risk—information that can be directly applied to proactive conservation planning.
From a management perspective, the results support practical actions including implementing long-term monitoring of Carex populations in areas projected to lose suitable habitat, surveying projected gain areas to confirm colonization and guide habitat management, and incorporating model outputs into provincial protected-area planning. This proactive, scenario-based approach can help move conservation planning from reactive responses toward anticipatory strategies that safeguard vulnerable species and strengthen ecological resilience in the face of climate change. In vast, data-scarce landscapes of Saskatchewan, this approach serves as early information, enabling conservation efforts to move from reactive to anticipatory, thereby safeguarding vulnerable species and supporting long-term ecological resilience.

Author Contributions

Conceptualization, V.K.; methodology, K.C. and V.K.; software, K.C.; validation, V.K. and K.C.; formal analysis, K.C.; investigation, V.K. and K.C.; resources, V.K.; data curation, V.K. and K.C.; writing—original draft preparation, K.C.; writing—review and editing, V.K.; visualization, K.C.; supervision, V.K.; project administration, V.K.; funding acquisition, V.K. All authors have read and agreed to the published version of the manuscript.

Funding

This research was partially supported by the Shyluk Nature’s Health Fund (#428371) at the University of Saskatchewan.

Data Availability Statement

The data that supports the findings of this study are available from the corresponding author upon request. Some data used in this study are available online (GBIF).

Acknowledgments

The authors would like to acknowledge A. Stewart and O. Godfrey for their involvement during initial phases of the project. We also thank the anonymous reviewers that contributed to improving the quality of the manuscript with their comments.

Conflicts of Interest

The authors declare no conflicts of interest.

Appendix A

Table A1. Description of environmental factors used in the MaxEnt model for priority Carex species in Saskatchewan.
FactorDescription of FactorUnit
BIO1Annual Mean Temperature°C
BIO2Mean Diurnal Range (mean of monthly (max–min temp)°C
BIO3Isothermality (BIO2/BIO7) (×100)Dimensionless
BIO4Temperature Seasonality (standard deviation × 100)°C
BIO5Max Temperature of Warmest Month°C
BIO6Min Temperature of Coldest Month°C
BIO7Temperature Annual Range (BIO5–BIO6)°C
BIO8Mean Temperature of Wettest Quarter°C
BIO9Mean Temperature of Driest Quarter°C
BIO10Mean Temperature of Warmest Quarter°C
BIO11Mean Temperature of Coldest Quarter°C
BIO12Annual Precipitationmm
BIO13Precipitation of Wettest Monthmm
BIO14Precipitation of Driest Monthmm
BIO15Precipitation Seasonality (Coefficient of Variation)%
BIO16Precipitation of Wettest Quartermm
BIO17Precipitation of Driest Quartermm
BIO18Precipitation of Warmest Quartermm
BIO19Precipitation of Coldest Quartermm
ELVElevationm
Table A2. Major climatic factors influencing potential distribution of priority Carex species in Saskatchewan.
SpeciesEnvironmental VariablesPermutation ImportancePercent
Contribution
C. assiniboinensisBIO1031.238.1
BIO828.936.2
BIO1510.717.6
ELV15.27.4
C. glacialisBIO1860.838.6
BIO536.926.7
BIO92.334.6
C. granularisBIO884.983.6
BIO1510.28.3
BIO123.27.1
BIO91.60.6
C. saximontanaBIO184.480
BIO187.316.4
BIO156.33.6
C. supina subsp. spaniocarpaBIO1864.560.8
BIO534.639.2
C. tetanicaBIO1073.580
BIO1210.38.3
BIO810.29.5
BIO156.12.1
Table A3. Suitable area of C. assiniboinensis under different climatic scenarios (km2).
TimeScenarioUnitUnsuitabilityLow
Suitability
Moderate
Suitability
High
Suitability
Present (1970–2000) km2460,421.65108,235.6351,640.1231,602.60
%70.6316.607.924.85
2030s (2021–2040)SSP245km2405,177.7134,046.970,823.6941,851.64
%62.1520.5610.866.41
SSP585km2350,406.32163,141.2284,000.0154,352.44
%53.7525.0212.888.33
2050s (2041–2060)SSP245km2435,102114,147.765,45737,192.94
%66.7417.5110.045.70
SSP585km2405,506.00127,676.7974,279.6344,437.58
%62.2019.5911.396.82
Table A4. Suitable area of C. saximontana under different climatic scenarios (km2).
TimeScenarioUnitUnsuitabilityLow
Suitability
Moderate
Suitability
High
Suitability
Present (1970–2000) km2315,195.04138,229.5374,918.59123,541.79
%48.3521.2011.4918.95
2030s (2021–2040)SSP245km2397,905.04106,058.1278,041.7769,893.05
%61.0316.2611.9710.72
SSP585km2413,945.3894,845.3757,461.9985,646.74
%63.4914.548.8113.13
2050s (2041–2060)SSP245km2388,359.11110,912.2882,149.7070,477.89
%59.5717.0112.6010.81
SSP585km2410,318.5592,413.7879,130.2770,037.38
%62.9414.1712.1310.74
Table A5. Suitable area of C. tetanica under different climatic scenarios (km2).
TimeScenarioUnitUnsuitabilityLow
Suitability
Moderate
Suitability
High
Suitability
Present (1970–2000) km2392,988.75126,842.9774,218.4957,849.39
%60.2819.4511.388.87
2030s (2021–2040)SSP245km2359,657.68138,002.0186,565.8567,673.45
%55.1721.1613.2710.38
SSP585km2456,205.46107,144.1247,654.9740,894.94
%69.9816.447.316.27
2050s (2041–2060)SSP245km2251,735.77162,927.77140,372.4596,863.01
%38.6224.9921.5314.9
SSP585km2472,979.4968,621.1356,963.3553,336.02
%72.5510.538.7388.18
Table A6. Suitable area of C. glacialis under different climatic scenarios (km2).
TimeScenarioUnitUnsuitabilityLow
Suitability
Moderate
Suitability
High
Suitability
Present (1970–2000) km2590,469.3927,801.8618,436.3515,192.4
%90.584.2652.8282.33
2030s (2021–2040)SSP245km2601,839.524,621.0617,535.787903.65
%92.323.7772.691.21
SSP585km2601,452.1125,948.1117,606.956892.83
%92.263.982.7011.06
2050s (2041–2060)SSP245km2555,675.4639,761.8426,199.6830,262.52
%85.246.0994.0194.64
SSP585km2579,653.5430,595.7822,535.7719,114.91
%88.924.6933.4572.93
Table A7. Suitable area of C. granularis under different climatic scenarios (km2).
TimeScenarioUnitUnsuitabilityLow
Suitability
Moderate
Suitability
High
Suitability
Present (1970–2000) km2447,937.5119,198.851,941.8232,821.9
%68.7118.287.975.03
2030s (2021–2040)SSP245km2485,550.9106,840.433,693.425,815.3
%74.4816.395.173.96
SSP585km299,021.47218,768316,431.417,679.11
%15.1933.5648.542.71
2050s (2041–2060)SSP245km2155,927.7217,480.6183,753.194,738.63
%33.5633.3628.1914.53
SSP585km2213,339.6209,602.5155,726.773,231.22
%32.7332.1523.8011.23
Table A8. Suitable area of C. supina subsp. spaniocarpa under different climatic scenarios (km2).
TimeScenarioUnitUnsuitabilityLow
Suitability
Moderate
Suitability
High
Suitability
Present (1970–2000) km2563,283.9435,401.3224,808.9928,405.75
%86.415.433.814.36
2030s (2021–2040)SSP245km2567,456.0233,542.5524,506.2926,394.63
%87.055.153.764.05
SSP585km2584,142.8532,601.3920,868.4414,287.32
%89.615.013.2012.19
2050s (2041–2060)SSP245km2562,405.9236,806.0524,850.0827837.45
%86.275.643.8124.27
SSP585km2565,538.1233,631.2625,194.3727536.25
%86.755.1593.8654.22
Table A9. Dynamic changes in suitable habitat of C. assiniboinensis under future climatic scenarios.
TimeScenarioUnitUnsuitability
Stable
Suitability
Stable
GainLoss
2030s (2021–2040)SSP245km2360,976.2184,130.579,562.0327,231.31
%55.3728.2512.204.18
SSP585km2328,912.6168,255131,509.123,223.35
%50.4525.8120.173.56
2050s (2041–2060)SSP245km2375,4012358.29214,409.659,731.14
%57.590.3632.899.16
SSP585km2378,159.7163,641.482,261.9727,836.95
%58.0125.1012.624.27
Table A10. Dynamic changes in suitable habitat of C. saximontana under future climatic scenarios.
TimeScenarioUnitUnsuitability
Stable
Suitability
Stable
GainLoss
2030s (2021–2040)SSP245km2313,476.1252,272.11726.584,425.31
%48.0938.700.2612.95
SSP585km2315,202.1237,958.90.598,738.51
%48.3536.500.0015.15
2050s (2041–2060)SSP245km2315,095.3263,438.5107.2573,258.91
%48.3340.410.0211.24
SSP585km2312,869.7239,253.92332.9197,443.51
%47.9936.700.3614.95
Table A11. Dynamic changes in suitable habitat of C. tetanica under future climatic scenarios.
TimeScenarioUnitUnsuitability
Stable
Suitability
Stable
GainLoss
2030s (2021–2040)SSP245km2354,273.1253,525.638,715.975385.38
%54.3438.895.940.83
SSP585km2388,847191,552.24142.0267,358.78
%59.6529.380.6410.33
2050s (2041–2060)SSP245km2251,736.8258,910.8141,252.50
%38.6239.7221.670.00
SSP585km2384,399.5170,330.88589.7388,579.98
%58.9726.131.3213.59
Table A12. Dynamic changes in suitable habitat of C. glacialis under future climatic scenarios.
TimeScenarioUnitUnsuitability
Stable
Suitability
Stable
GainLoss
2030s (2021–2040)SSP245km2579,853.448,698.8311,679.811,667.98
%88.957.471.791.79
SSP585km2590,121.650,100.09347.811,330.53
%90.527.690.051.74
2050s (2041–2060)SSP245km2555,672.561,427.1134,796.933.51
%85.249.425.340.00
SSP585km2579,469.161,246.1911,000.27184.42
%88.899.401.690.03
Table A13. Dynamic changes in suitable habitat of C. granularis under future climatic scenarios.
TimeScenarioUnitUnsuitability
Stable
Suitability
Stable
GainLoss
2030s (2021–2040)SSP245km2437,966.6156,378.29970.947,584.3
%67.1823.991.537.30
SSP585km291,177.44196,118.5356,7617844.01
%13.9930.0854.731.20
2050s (2041–2060)SSP245km2148,753.2196,788299,184.37174.48
%22.8230.1945.891.10
SSP585km2201,612.1192,235.111,727.44246,325.3
%30.9329.491.8037.79
Table A14. Dynamic changes in suitable habitat of C. supina subsp. spaniocarpa under future climatic scenarios.
TimeScenarioUnitUnsuitability
Stable
Suitability
Stable
GainLoss
2030s (2021–2040)SSP245km2561,754.482,913.961529.515702.1
%86.1712.720.230.87
SSP585km2563,283.967,757.15020,858.92
%86.4110.390.003.20
2050s (2041–2060)SSP245km2559,481.285,690.843802.742925.22
%85.8213.140.580.45
SSP585km2561,919.884,997.751364.133618.31
%86.2013.040.210.56

References

  1. IPCC. Climate Change 2023: Synthesis Report. Contribution of Working Groups I, II and III to the Sixth Assessment Report of the Intergovernmental Panel on Climate Change; Lee, H., Romero, J., Eds.; IPCC: Geneva, Switzerland, 2022; Available online: https://www.ipcc.ch/assessment-report/ar6 (accessed on 1 July 2025).
  2. Kong, F.; Tang, L.; He, H.; Yang, F.; Tao, J.; Wang, W. Assessing the impact of climate change on the distribution of Osmanthus fragrans using Maxent. Environ. Sci. Pollut. Res. 2021, 28, 34655–34663. [Google Scholar] [CrossRef] [PubMed]
  3. Lee, C.M.; Lee, D.-S.; Kwon, T.-S.; Athar, M.; Park, Y.-S. Predicting the global distribution of Solenopsis geminata (Hymenoptera: Formicidae) under climate change using the MaxEnt model. Insects 2021, 12, 229. [Google Scholar] [CrossRef] [PubMed]
  4. Gao, X.; Liu, J.; Huang, Z. The impact of climate change on the distribution of rare and endangered tree Firmiana kwangsiensis using the Maxent modeling. Ecol. Evol. 2022, 12, e9165. [Google Scholar] [CrossRef] [PubMed]
  5. Hosseini, N.; Ghorbanpour, M.; Mostafavi, H. Habitat potential modelling and the effect of climate change on the current and future distribution of three Thymus species in Iran using MaxEnt. Sci. Rep. 2024, 14, 3641. [Google Scholar] [CrossRef]
  6. Pettorelli, N. Climate change as a main driver of ecological research. J. Appl. Ecol. 2012, 49, 542–545. [Google Scholar] [CrossRef]
  7. Smallwood, P.A.; Trapnell, D.W. Species distribution modeling reveals recent shifts in suitable habitat for six North American Cypripedium spp. (Orchidaceae). Divers 2022, 14, 694. [Google Scholar] [CrossRef]
  8. Mkala, E.M.; Muthoni, F.K.; Ngumbau, V.M.; Ndang’ang’a, K.P.; Wambua, L.; Musili, P.M.; Mwachala, G.; Hu, G.-W.; Yan, H.-F. Predicting the potential impacts of climate change on the endangered endemic Annonaceae species in East Africa. Heliyon 2023, 9, e14613. [Google Scholar] [CrossRef]
  9. Zhang, H.; Zhao, H. Study on rare and endangered plants under climate: MaxEnt modeling for identifying hot spots in Northwest China. Cerne 2021, 27, e102667. [Google Scholar] [CrossRef]
  10. Ouyang, X.; Bai, S.; Strachan, G.B.; Chen, A. Simulation of the potential distribution of rare and endangered Satyrium species in China under climate change. Ecol. Evol. 2022, 12, e9054. [Google Scholar] [CrossRef]
  11. Lian, Y.; Bai, Y.; Huang, Z.; Ali, M.; Wang, J.; Chen, H. Spatio-temporal changes and habitats of rare and endangered species in Yunnan Province based on MaxEnt model. Land 2024, 13, 240. [Google Scholar] [CrossRef]
  12. Yao, W.; Luo, Z.; Zhang, X.; Zhu, Y.; Li, H.; Wang, B.; Xu, L. Prediction of potential habitat distributions and climate change impacts on the rare species Woonyoungia septentrionalis (Magnoliaceae) in China based on MaxEnt. Plants 2024, 14, 86. [Google Scholar] [CrossRef]
  13. Booth, T.H.; Nix, H.A.; Busby, J.R.; Hutchinson, M.F. BIOCLIM: The first species distribution modelling package, its early applications and relevance to most current MaxEnt studies. Divers. Distrib. 2014, 20, 1–9. [Google Scholar] [CrossRef]
  14. Carpenter, G.; Gillison, A.N.; Winter, J. DOMAIN: A flexible modelling procedure for mapping potential distributions of plants and animals. Biodivers. Conserv. 1993, 2, 667–680. [Google Scholar] [CrossRef]
  15. Guisan, A.; Edwards, T.C., Jr.; Hastie, T. Generalized linear and generalized additive models in studies of species distributions: Setting the scene. Ecol. Model. 2002, 157, 89–100. [Google Scholar] [CrossRef]
  16. Phillips, S.J.; Dudík, M.; Schapire, R.E. A maximum entropy approach to species distribution modeling. In Proceedings of the Twenty-First International Conference on Machine Learning (ICML 2004), Banff, AB, Canada, 4–8 July 2004; ACM Press: New York, NY, USA, 2004. [Google Scholar] [CrossRef]
  17. Sánchez-Flores, E. GARP modeling of natural and human factors affecting the potential distribution of the invasives Schismus arabicus and Brassica tournefortii in ‘El Pinacate y Gran Desierto de Altar’ Biosphere Reserve. Ecol. Model. 2007, 204, 457–474. [Google Scholar] [CrossRef]
  18. Phillips, S.J.; Anderson, R.P.; Schapire, R.E. Maximum entropy modeling of species geographic distributions. Ecol. Model. 2006, 190, 231–259. [Google Scholar] [CrossRef]
  19. Danylyk, I.M.; Kricsfalusy, V.V. Phytogeographical differentiation of the genus Carex (Cyperaceae) in Saskatchewan, Canada. Thaiszia J. Bot. 2020, 30, 001021. [Google Scholar] [CrossRef]
  20. Kricsfalusy, V.V.; Godfrey, A.; Chakma, K.; Stewart, A.; Danylyk, I.M. Evaluating the diversity, distribution patterns and habitat preferences of Carex species (Cyperaceae) in western Canada using geospatial analysis. Biodivers. Data J. 2025, 13, e144840. [Google Scholar] [CrossRef]
  21. Kricsfalusy, V.; Chakma, K.; Godfrey, A. Integrating herbarium data with spatial biodiversity assessment into conservation plans: A case study of the genus Carex L. (Cyperaceae) in Saskatchewan, Canada. Nat. Conserv. 2025, 59, 65–88. [Google Scholar] [CrossRef]
  22. Benítez-Benítez, C.; Sanz-Arnal, M.; Urbani, M.; Jiménez-Mejías, P.; Martín-Bravo, S. Dramatic impact of future climate change on the genetic diversity and distribution of ecologically relevant Western Mediterranean Carex (Cyperaceae). PeerJ 2022, 10, e13464. [Google Scholar] [CrossRef]
  23. Qi, Q.; Liu, B.; Zhang, Y.; Wang, H.; Jin, Y.; Liu, G.; Guo, M. Evolution of potential spatial distribution patterns of Carex tussock wetlands under climate change scenarios, Northeast China. Chin. Geogr. Sci. 2022, 32, 142–154. [Google Scholar] [CrossRef]
  24. Xing, Y.; Yang, H.; Zhang, Y.; Liu, X.; He, Y.; Xu, W. The current distribution of Carex alatauensis in the Qinghai—Tibet Plateau estimated by MaxEnt. Agronomy 2023, 13, 564. [Google Scholar]
  25. FOSA. Flora of Saskatchewan Association Carex Occurrence Dataset; Nature Saskatchewan: Regina, SK, Canada, 2021. [Google Scholar]
  26. GBIF. The Global Biodiversity Information Facility, GBIF.org GBIF Occurrence Download; GBIF: Copenhagen, Denmark, 2024; Available online: https://doi.org/10.15468/dl.ez4xa9 (accessed on 10 September 2025).
  27. Pearson, R.G.; Raxworthy, C.J.; Nakamura, M.; Peterson, A.T. Predicting species distributions from small numbers of occurrence records: A test case using cryptic geckos in Madagascar. J. Biogeogr. 2007, 34, 102–117. [Google Scholar] [CrossRef]
  28. Wang, Y.; Xie, L.; Zhou, X.; Chen, R.; Zhao, G.; Zhang, F. Prediction of the potentially suitable areas of Leonurus japonicus in China based on future climate change using the optimized MaxEnt model. Ecol. Evol. 2023, 13, e10597. [Google Scholar] [CrossRef] [PubMed]
  29. Songer, M.; Delion, M.; Biggs, A.; Huang, Q. Modeling impacts of climate change on giant panda habitat. Int. J. Ecol. 2012, 2012, 108752. [Google Scholar] [CrossRef]
  30. Fick, S.E.; Hijmans, R.J. WorldClim 2: New 1-km spatial resolution climate surfaces for global land areas. Int. J. Climatol. 2017, 37, 4302–4315. [Google Scholar] [CrossRef]
  31. Pica, A.; Vela, D.; Magrini, S. Forest orchids under future climate scenarios: Habitat suitability modelling to inform conservation strategies. Plants 2024, 13, 1810. [Google Scholar] [CrossRef]
  32. Wei, B.O.; Wang, R.; Hou, K.; Wang, X.; Wu, W. Predicting the current and future cultivation regions of Carthamus tinctorius L. using MaxEnt model under climate change in China. Glob. Ecol. Conserv. 2018, 16, e00477. [Google Scholar] [CrossRef]
  33. Rs. Team. RStudio: Integrated Development for R; RStudio: Boston, MA, USA, 2015; Available online: https://cir.nii.ac.jp/crid/1370004240607707919 (accessed on 9 July 2025).
  34. Sillero, N.; Barbosa, A.M. Common mistakes in ecological niche models. Int. J. Geogr. Inf. Sci. 2021, 35, 213–226. [Google Scholar] [CrossRef]
  35. Shrestha, N. Detecting multicollinearity in regression analysis. Am. J. Appl. Math. Stat. 2020, 8, 39–42. [Google Scholar] [CrossRef]
  36. Deng, X.; Xu, D.; Liao, W.; Wang, R.; Zhuo, Z. Predicting the distributions of Scleroderma guani (Hymenoptera: Bethylidae) under climate change in China. Ecol. Evol. 2022, 12, e9410. [Google Scholar] [CrossRef]
  37. Muscarella, R.; Galante, P.J.; Soley-Guardia, M.; Boria, R.A.; Kass, J.M.; Uriarte, M.; Anderson, R.P.; McPherson, J. ENMeval: An R package for conducting spatially independent evaluations and estimating optimal model complexity for MAXENT ecological niche models. Methods Ecol. Evol. 2014, 5, 1198–1205. [Google Scholar] [CrossRef]
  38. Kass, J.M.; Muscarella, R.; Galante, P.J.; Bohl, C.L.; Pinilla-Buitrago, G.E.; Boria, R.A.; Soley-Guardia, M.; Anderson, R.P. ENMeval 2.0: Redesigned for customizable and reproducible modeling of species’ niches and distributions. Methods Ecol. Evol. 2021, 12, 1602–1608. [Google Scholar] [CrossRef]
  39. Shcheglovitova, M.; Anderson, R.P. Estimating optimal complexity for ecological niche models: A jackknife approach for species with small sample sizes. Ecol. Model. 2013, 269, 9–17. [Google Scholar] [CrossRef]
  40. Morales, N.S.; Fernández, I.C.; Baca-González, V. MaxEnt’s parameter configuration and small samples: Are we paying attention to recommendations? A systematic review. PeerJ 2017, 5, e3093. [Google Scholar] [CrossRef]
  41. Warren, D.L.; Seifert, S.N. Ecological niche modeling in Maxent: The importance of model complexity and the performance of model selection criteria. Ecol. Appl. 2011, 21, 335–342. [Google Scholar] [CrossRef] [PubMed]
  42. Merow, C.; Smith, M.J.; Silander, J.A. A practical guide to MaxEnt for modeling species’ distributions: What it does, and why inputs and settings matter. Ecography 2013, 36, 1058–1069. [Google Scholar] [CrossRef]
  43. West, A.M.; Kumar, S.; Brown, C.S.; Stohlgren, T.J.; Bromberg, J. Field validation of an invasive species Maxent model. Ecol. Inform. 2016, 36, 126–134. [Google Scholar] [CrossRef]
  44. Wang, F.; Yuan, X.; Sun, Y.; Liu, Y. Species distribution modeling based on MaxEnt to inform biodiversity conservation in the Central Urban Area of Chongqing Municipality. Ecol. Indic. 2024, 158, 111491. [Google Scholar] [CrossRef]
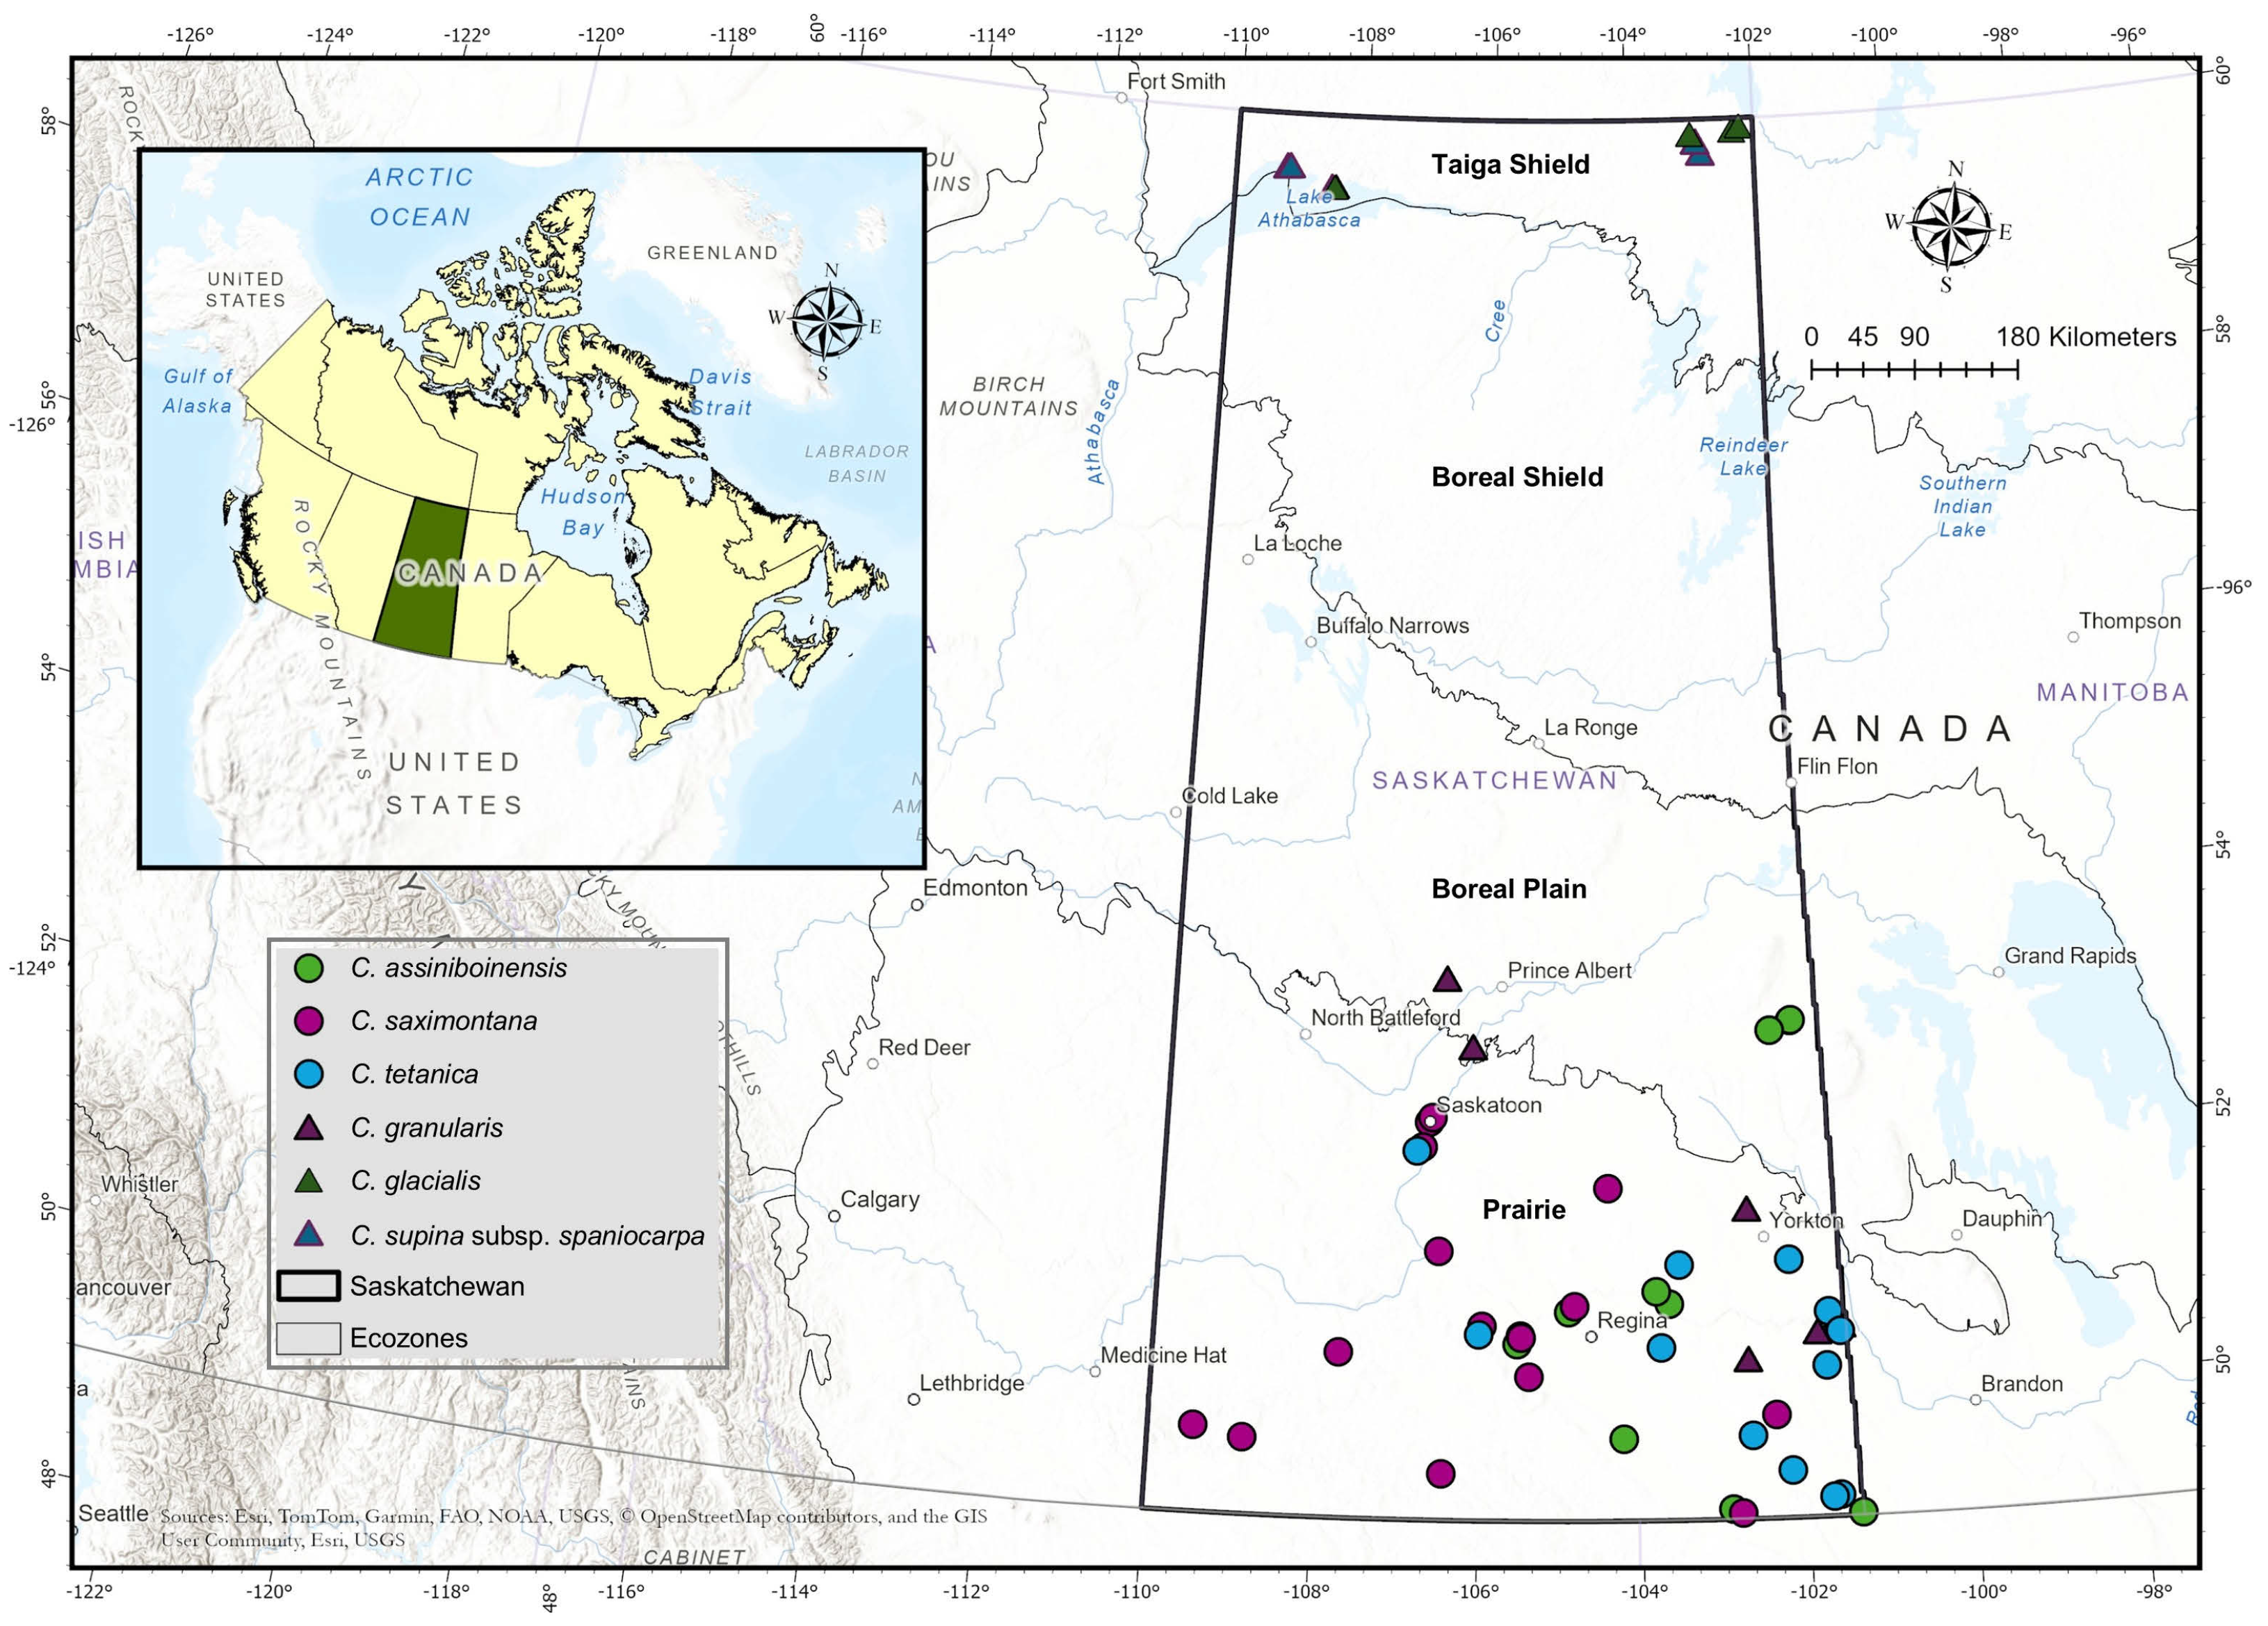
Figure 1. Map showing the location of the study area in Canada, and occurrence records of priority Carex species.
Conservation 05 00055 g001
Figure 2. Workflow of the methodology used for the MaxEnt modeling for priority Carex species.
Conservation 05 00055 g002
Figure 3. Mean Area Under Curve (AUC) values of the prediction model for priority Carex species.
Conservation 05 00055 g003
Figure 4. Environmental variable contributions to species distribution models (SDMs) for priority Carex species.
Conservation 05 00055 g004
Figure 5. Prediction of potential suitable habitats for priority Carex species for current scenario (1970–2000).
Conservation 05 00055 g005
Figure 6. Prediction of potential suitable habitat distribution of the nationally at-risk Carex species under future climate conditions (2030–2050).
Conservation 05 00055 g006
Figure 7. Prediction of potential suitable habitat distribution of the provincial rare Carex species under future climate conditions (2030–2050).
Conservation 05 00055 g007
Figure 8. Spatial changes in geographical distribution of the nationally at-risk Carex species under future climatic scenarios (2030–2050).
Conservation 05 00055 g008
Figure 9. Spatial changes in geographical distribution of the provincially rare Carex species under future climatic scenarios (2030–2050).
Conservation 05 00055 g009
Disclaimer/Publisher’s Note: The statements, opinions and data contained in all publications are solely those of the individual author(s) and contributor(s) and not of MDPI and/or the editor(s). MDPI and/or the editor(s) disclaim responsibility for any injury to people or property resulting from any ideas, methods, instructions or products referred to in the content.