Abstract
The rubber plantations in Sankuru province, located in the Democratic Republic of Congo (DRC), have historically been pivotal to the regional economy. However, the absence of suitable silvicultural practices has promoted self-regeneration, resulting in the proliferation of diverse species. This study aims to characterize species richness and plant structure of these plantations. To this end, 80 subplots measuring 0.25 hectares were meticulously established, with a proportionate division between state-owned and farmer plantations. The results obtained from this study indicate that these plantations are home to approximately 105 species, classified into 33 distinct botanical families, with dominant families such as Fabaceae, Meliaceae, Euphorbiaceae, Olacaceae, Clusiaceae, and Moraceae. Despite the similarity between the two types of plantations (Cs = 58%), significant disparities were observed in terms of individuals, 635 ± 84.06 and 828 ± 144.62 (p < 10−3); species, 41 ± 7.49 and 28 ± 4.59 (p < 10−3); families, 19 ± 3.06 and 16 ± 1.62 (p < 10−2); and basal area, 29.88 ± 5.8 and 41.37 ± 7.57 (p < 10−2) for state and peasant plantations, respectively. State plantations exhibited greater diversity (H′ = 1.87) and enhanced equity (J’ = 0.43) than peasant plantations. The diametric structure exhibited an inverted J-shaped distribution, indicating constant and regular regeneration of these plantations. The upper canopy dominates the vertical structure in both types of plantations, with a significantly higher proportion in peasant plantations (83.60%) than in state plantations (73.8%), ANOVA (F (2.24 = 21.78), df = 24; p = 4.03 × 10⁻⁶). The findings indicate that the sustainable management of these plantations could incorporate agroecological principles to promote the coexistence of rubber production and biodiversity conservation while contributing to the restoration of degraded ecosystems and the well-being of local communities.
1. Introduction
Rubber plantations (Hevea brasiliensis) play a significant role in tropical agriculture, particularly in Africa [1,2], where they are crucial for the production of latex, which serves as a vital source of income for numerous rural communities [3]. However, the research on these plantations has been predominantly focused on their economic profitability, often neglecting their ecological potential [4]. The transition from forests to rubber plantations has resulted in alterations in biodiversity, particularly in terms of floristic diversity [5,6]. This alteration in floristic diversity can be attributed to the management, inputs, and maintenance activities associated with rubber plantations [6]. It is imperative to acknowledge that how rubber plantations are developed and managed exerts a significant influence on the impact of rubber farming on floristic diversity [7].
A study by Lan et al. [7] on the Chinese island of Hainan demonstrated that “naturally managed rubber plantations” (with prohibited use of herbicides, avoided clearing of vegetation, and minimum use of compound fertilizers and pesticides), also known as “rubber forests”, can harbor a floristic diversity similar to that of forests. Studies conducted in rubber plantations of this nature on the island of Java and in the Sumatra region of Indonesia, Vietnam, and Malaysia have found that “rubber forests” exhibit a biodiversity comparable to that of secondary forests [8,9].
In the Democratic Republic of Congo (DRC), thousands of hectares of abandoned rubber plantations, including some in the Lodja and Lomela territories of Sankuru Province, are notable for their substantial rubber plantations, both industrial and village-based [1,10,11]. The area once encompassed 7000 hectares, but recent estimations place it at approximately 2000 hectares between 1960 and 2020 [11]. Having lain fallow for a considerable duration, rubber plantations in Sankuru are presently being invaded by other forest species, thereby diversifying the flora accompanying the rubber tree [11]. The classification of rubber plantations in Sankuru depends on the ownership and management type. They can be categorized into four distinct classes: state-owned (managed by the National Institute for Agronomic Study and Research (INERA)), industrial (private companies), religious (Catholic missions), and peasant (local communities) [1]. Presently, the precise surface area of these historic rubber plantations and their contribution to the conservation of woody plant diversity remain poorly documented [11].
In contrast to Asian contexts and other African regions such as Côte d’Ivoire, where rubber plantations are generally large-scale, intensive, and oriented towards latex production [12,13,14,15], the historic plantations of Sankuru are distinguished by their absence of silvicultural treatment for several decades [1,16,17]. Considered a natural heritage by local communities, they provide a range of ecosystem services that go far beyond the sole function of latex production [1,16]. This distinction offers a unique opportunity to examine how management practices and ecological outcomes vary according to geographical and socio-economic contexts. In this way, analysis of the Sankuru plantations not only helps to understand local specificities but also contributes to international debates on alternative forms of sustainable rubber farming and conservation strategies in anthropized landscapes [1,18].
Furthermore, local livelihoods directly interfere with biodiversity conservation objectives. For example, communities’ dependence on latex as their main source of income can lead to overexploitation practices, limiting natural regeneration [12]. On the other hand, the collection of non-timber forest products (NTFPs) such as fruits, bark, or medicinal plants often promotes the maintenance of functional plant diversity, as these products require the preservation of a number of wild species [1,18]. Thus, a balance between direct economic uses (latex) and indirect ecosystem services (NTFPs, biodiversity) is essential to reconcile local development and conservation objectives [19].
Unfortunately, tropical plantation biodiversity, particularly within African rubber systems, remains under-researched [18]. The existing literature predominantly focuses on Asian and Amazonian contexts [20,21,22,23], with limited exploration of the links between floristic structure and spatial indicators, such as the Normalized Difference Vegetation Index (NDVI), in African settings.
Furthermore, while historical rubber plantations in Sankuru have profoundly influenced the region’s socio-economic landscape, their floristic diversity and structural characteristics from an ecological conservation perspective have received scant attention [1,10,11]. Rubber plantations, often primarily viewed through an economic lens, are infrequently studied for their contribution to biodiversity and ecosystem service management [1]. This limited understanding hinders their integration into broader strategies for sustainable natural resource management [1,18], despite acknowledged contributions of agricultural plantations to ecosystem services [1,24,25].
This study addresses these research gaps by comprehensively analyzing the ecological dynamics of historical rubber plantations in Sankuru, specifically in areas with restricted management and silvicultural treatments. Our overarching objective is twofold: firstly, to assess the floristic diversity and structural characteristics of these plantations to evaluate their ecological value for biodiversity conservation; and secondly, to analyze how different management practices influence these ecological attributes, achieved by comparing intensively managed state-owned plantations with extensively managed peasant plantations. By establishing a correlation between rubber trees and their associated flora, we aim to validate the hypothesis that the absence of silvicultural treatments fosters the proliferation of spontaneous species, thereby diversifying the floristic composition. We anticipate observing variations in floristic composition between plantation types due to their differing development and management histories. Furthermore, we expect both plantation types to exhibit an inverted J-shaped diametric structure (dominance of younger trees), indicating effective natural regeneration dynamics and good ecological sustainability [26].
The findings of this research are anticipated to inform national and regional policies concerning sustainable land management and forest conservation. By highlighting the ecological role of historical rubber plantations, this study can contribute to discussions on integrating these systems into REDD+ strategies, territorial planning, and incentive mechanisms for sustainable agroforestry. Ultimately, this research provides a scientific foundation to guide decisions regarding agroforestry project subsidies, forest landscape management, and the enhancement of anthropized ecosystems [1,16].
2. Materials and Methods
2.1. Study Area
The present study was carried out in the historical rubber plantations located in the Lodja and Lomela territories in Sankuru Province (Figure 1), a forest province of the Democratic Republic of the Congo (DRC). Geographically located at 3°21′27″ S and 23°35′48″ E, Sankuru Province comprises 6 territories, 42 sectors, 415 groupings, and 3838 villages. The population of Sankuru is estimated at 3,952,756 [27]. Rubber plantations are predominantly situated along the Lodja-Lomela axis, encompassing three distinct zones [11]. The geographical area under consideration is located in the southern portion of the Cuvette Centrale of the Congo Basin, within the geographical boundaries of Salonga National Park. The region’s topography is predominantly characterized by plateaus, with altitudes ranging from 300 to 700 m. As previously documented, the region’s soils are predominantly sandy or sandy clay [27]. The climate of Sankuru Province is bimodal, with two seasons that occur at approximately the same time in different territories: a rainy season from mid-August to mid-May and a sub-dry season from mid-May to mid-August. Notably, the province’s northern region experiences the most substantial rainfall during December and from mid-April to mid-May [2].
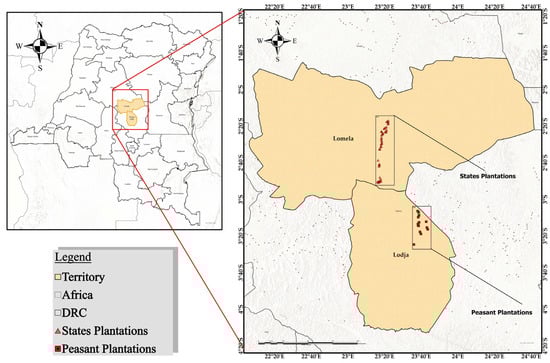
Figure 1.
Location of the study area in Sankuru Province, Democratic Republic of Congo. The map shows the two target areas: Lomela, where the state plantations are located (symbolized by red triangles), and Lodja, where the peasant plantations are located (symbolized by red squares). The inset on the left shows the location of Sankuru Province within the national and continental context.
2.2. Data Collection
2.2.1. Inventory Method
The statistical inventory method was employed for the present study, given the size and typology of the rubber plantations in Sankuru. The objective of this inventory was to ascertain the woody potential in the plots in the two territories of Lodja and Lomela. Two distinct categories of plantations were considered: state-owned and peasant plantations. State plantations are those managed by INERA at Mukumari, territory of Lomela (150 km from Lodja). The peasant plantations are the Endjondjo, Etakamela, Loketo, Shenga, and Tsheko plantations (scattered throughout the Lodja territory) managed by local communities. The rationale behind this distinction is rooted in the observed disparities in management practices and economic interests between these two distinct categories of plantations within the region [1].
2.2.2. Experimental Design, Sampling, and Botanical Inventory
To characterize floristic diversity in the historical plantations of the two territories of Lodja and Lomela (Table 1), a floristic inventory campaign was carried out over five months from September 2023 to January 2024. The adopted system consisted of one-hectare (1 ha) plots subdivided into four 2500-square-meter (50 m × 50 m) subplots, resulting in an inventory area of 0.25 ha. These subplots were arranged in two L-shaped layouts within each plantation, which was selected for an inventory of tree flora [26,28]. In the 0.25-hectare plots, all plant species encountered were identified, and individuals of tree species with a diameter at breast height (DBH) equal to or greater than 10 cm were numbered, identified, and counted [26,28], enabling basal area (G) to be calculated [28]. The selection of the 0.25-hectare plots was guided by the study’s primary objectives: characterizing the floristic diversity and structural characteristics of historical rubber plantations. The total height of each tree was measured, to the nearest dm, using the Vertex V (Haglof Sweden®, USA).

Table 1.
Number of plots and total area surveyed in both plantation types.
For species not identified in the field, samples were collected for subsequent analysis in a herbarium. The species were identified and verified at the herbarium of the National Institute for Agronomic Study and Research of Yangambi (INERA/Yangambi). Subsequently, a comprehensive list of the reported plant species was meticulously compiled. The families and genera were validated against the APG IV classification system [29], accessed at (https://africanplantdatabase.ch) (accessed on 21 February 2024). Subsequent taxonomic corrections and family assignments were performed using the successive “getTaxonomy” and “TNRS” functions in the BIOMASS package of the R software [30].
In addition, Hawthorne’s work Lisingo [26], Beina [31], Hamiliton [32], Senterre [33], Tchouto [34] and Nshimba [35] was used as a reference to group species according to their temperament: shade-tolerant or “shade-bearer” species (T); semi-tolerant or “non-pioneer light demanding” species (NP), which can tolerate some shade in their early life but cannot grow without progressive light; and strict heliophilous or “pioneer” species (P), which require the permanent presence of light for seed germination and the development of individuals at all stages. Data regarding the chorology and phytogeographical distribution of species were obtained from the extant literature, principally from the floras of Lebrun and Stork [36] and the works of Ndjele [37], Sonké [38], Senterre [33], Nshimba [35], and Lisingo [26]. Additionally, online databases (www.tropicos.org and www.ville-ge.ch/musinfo/bd/cjb/africa) (accessed on 26 February 2024) were consulted. The spacings applied during their establishment were utilized to assess the initial density of rubber plantations in Sankuru province. The establishment of rubber plantations in this region occurred in the 1939s, employing a spacing configuration of 6.66 m × 3.33 m, corresponding to an initial density of 495 trees per hectare, equivalent to 297 trees per 60 ares plot [39].
2.3. Data Analysis
Monitoring dendrometry parameters has facilitated the characterization of rubber plantations and their associated plant communities concerning diversity and structure. The variables selected to express these parameters are derived directly from field measurements [28].
2.3.1. Composition and Floristic Richness of Rubber Plantations
The floristic composition and richness of each rubber plantation type were assessed by analyzing various floristic indicators, including the number of individuals, species, genera, and families, and basal area per sample subplot (or per 0.25 ha). Relative abundance and dominance were calculated for each species and family, along with an importance value index, to classify species and families according to their level of importance in rubber plantations. The values of these indicators were calculated using Microsoft Excel® 2021.
Welch’s t-test was implemented through the R Commander and vegan package usage in similar ecological studies [30,40,41] to assess the equality of mean densities (individuals, species, and families) and mean basal area of the two plantation types. The rationale behind employing this parametric test stemmed from the findings of the Shapiro–Wilk normality test and the Fisher test, which attested to the normality and equality of variances across the diverse sets of data collected.
- Degree of disturbance of rubber plantations
To assess the level of disturbance of rubber plantations in Sankuru, the degree of disturbance of each type of plantation was evaluated. This was achieved by determining the weight of pioneer species in relation to the total number of species inventoried. The “ Pioneer” index [30] was calculated for this purpose according to Equation (1):
In this study, pi represents the number of individuals of pioneer species, np denotes the number of individuals of non-pioneer but heliophilous species, and N signifies the total number of individuals of all species inventoried. PI ranges from 0, indicating an absence of pioneer species and, consequently, an absence of disturbance, to 100, representing all species as pioneers, resulting in a complete disturbance or secondarization of the forest. This Pioneer Index is an effective metric for evaluating the extent of disturbance or degradation within a forest ecosystem. It can distinguish secondary and mature forests at the 50% threshold [42]. The 50% threshold of the Pioneer Index allows secondary forests to be distinguished from mature forests. Secondary forests are dominated by pioneer species, with an index greater than 50%, reflecting young vegetation or vegetation undergoing regeneration. In contrast, mature forests have a majority of shade-tolerant species, with a Pioneer Index below 50%, reflecting a more stable and ecologically advanced forest structure [26,43].
The decision to calculate the pioneer species index as part of this study was based on the importance of understanding the ecological role of pioneer species in Sankuru’s historic rubber plantations. The evaluation of this index facilitated a more profound comprehension of the dynamics of plant succession and the process of ecological regeneration in these plantations. Furthermore, it facilitated the identification of species that promote the evolution of plant communities over time. Moreover, the index has contributed to our understanding of the capacity of these plantations to restore themselves naturally, while assessing the impact of human management on biodiversity. This comprehensive approach offers a more nuanced perspective on the floristic structure of plantations, thereby facilitating biodiversity conservation and the sustainability of agricultural practices within these ecosystems.
This study presents the first application of the proposed index to the historical rubber plantations of Sankuru, offering a novel yet preliminary framework for evaluating biodiversity patterns, ecological regeneration potential, and their broader relevance within a human-modified tropical landscape.
- Relative density
The abundance, or relative density, of a species or family is the ratio of the number of individuals of a species or family to the total number of individuals in the sample. The relative density (Dr) for each species and family was calculated using the following Equation (2):
The decision to assess relative density is based on the importance of understanding species distribution within these two types of plantations. This methodological approach facilitates a more profound comprehension of floristic diversity and enables the monitoring of the evolution of historical rubber plantations. Consequently, it enhances sustainable management and conservation of local ecosystems in Sankuru.
- Relative dominance
Relative dominance is defined as the ratio of the basal area of a given species or family to the total basal area. The relative dominance (Dor) for each species and family was calculated using the following Equation (3):
The decision to assess relative dominance in this study was based on the need to understand the impact of the most abundant species (basal area) within the historical rubber plantations of Sankuru. This approach facilitated the identification of species that dominate the plant landscape, thereby influencing the structure and dynamics of local ecosystems. By assessing relative dominance, we could better understand the mechanisms of natural regeneration, the interactions between species, and their role in the ecological balance of plantations. This approach is instrumental in formulating sustainable management and conservation strategies tailored to the unique characteristics of Sankuru ecosystems.
- Importance value index
The importance value index is a metric that quantifies a species’ dominance within a specific environment. It is calculated by the sum of relative abundance (Dr) and relative dominance (Dor), with a range of values from 0 to 100. The importance value index has been calculated for species and families in state and farmer plantations using Formula (4) for species and Formula (5) for families.
In this study, a family’s relative diversity (Dir) is the ratio between the number of species in the family and the total number of species. The relative abundance (Dr) is expressed as the ratio between the number of species in the family and the total number of species. The relative dominance (Dor) is calculated as the ratio between the number of species in the family and the total number of species. The rationale for evaluating the species importance value index in this study is predicated on the necessity to obtain an integrated measure of the relative importance of each species within historical rubber plantations. The utilization of this index in the present study enables the identification of species that necessitate consideration for developing sustainable management strategies, thereby fostering biodiversity conservation in rubber plantations within the Sankuru region.
- Species rarefaction and individual-species curves
The species rarefaction is a graphical representation of the increase in species found in a biotope as a function of the number of samples taken. The individuals-species curve, on the other hand, signifies the number of individuals per species surveyed. The species rarefaction and individual-species curves were calculated using the specaccum function in the vegan package of R software [30], using the random method. The red line in the center represents the area-species curve, and the colored area (green or pink) represents the confidence interval. The confidence interval was calculated at a 95% confidence level, representing the margin of error considered in this analysis to assess the robustness and sufficiency of the sampling effort.
The choice to evaluate the area-species and individual-species curves in this study is based on the desire to analyze the dynamics of floristic diversity within the historical rubber plantations of Sankuru. The area-species curve is a quantitative metric that quantifies the relationship between the number of species present and the sample area. It provides information on species richness and distribution in different plantation areas. Conversely, the individual-species curve facilitates the visualization of species distribution according to their abundance, thereby identifying the most abundant and the rarest species. This, in turn, contributes to a more profound comprehension of the plant community’s structural dynamics. The integration of richness and abundance dimensions offered by these two curves provides fundamental insights into the ecological equilibrium and species diversity within these plantations. This, in turn, enables the adaptation of sustainable management strategies to ensure the preservation of local biodiversity and the regeneration of tropical ecosystems in the Sankuru region.
- Horizontal and vertical structure
The horizontal structure of a stand refers to the distribution of tree diameters, while the vertical structure refers to the distribution of heights, i.e., the stratification of the stand [44,45]. These two structures are essential for understanding the complexity, biodiversity, and resilience of forest ecosystems. About horizontal structure, tree populations were classified into 10 diameter classes (0–10 cm; 10–20 cm; 20–30 cm; 30–40 cm; 40–50 cm; 50–60 cm; 60–70 cm; 70–80 cm; 80–90 cm and 90–100 cm) to characterize the two plantation types and compare them in stand structure. The diameter classes were established using diameter at breast height (dbh) data as a reference. Diameter-class analysis reveals age structure, regeneration status, and potential management needs in Sankuru’s rubber plantations.
In addition, the vertical structure of the historic rubber plantations in Sankuru was analyzed by grouping the inventoried individuals into three distinct strata, based on their height measured in meters. The upper canopy includes trees that are 30 m or taller (≥30 m), representing the dominant trees in the stand. The sub-canopy includes trees that are at least 20 m tall but less than 30 m (≥20 m), constituting the intermediate strata. Finally, the shrub layer corresponds to small trees, ranging in height from 5 to 10 m. This classification makes it possible to assess the vertical complexity of the stand, evaluate its ecological maturity, and identify the regeneration dynamics underway in these anthropized forest systems. We used one-way ANOVA to compare structural parameters across diameter classes; vertical structure and plantation types; where normality or homoscedasticity failed, we applied the Kruskal–Wallis’s test. The horizontal and vertical structures of the former Lodja and Lomela plantations were then compared. To this end, an analysis of variance was performed to assess differences between plantations and standardized values of structural parameters.
2.3.2. Characterization of Floristic Diversity in Rubber Plantations
Quantitative diversity, which considers both species richness and the number of individuals within a species, was evaluated using the Shannon-Wiener [46], Simpson [47], and Piélou [48] diversity and equitability indices. These indices were calculated using PAST 4.0.3 software [45]. The Shannon-Wiener diversity index was calculated using the following formula [49]:
In this study, H′ is defined as the Shannon diversity index, n is the total number of species recorded in the ecosystem in question, and Pi is the individual proportion of species i. The Shannon index is a widely used metric for assessing species richness and evenness in an ecosystem [50]. In the context of our study, this index is particularly relevant for quantifying the diversity of plant species present in historical rubber plantations. Higher values of the index indicate greater specific diversity. This index enabled a comparative analysis of plant diversity between state-owned and peasant plantations, providing crucial information for understanding the impact of plantation management and structure on local biodiversity [50]. The Shannon diversity index (H′) generally varies between 1 and 5 bits in comparable forest ecosystems, although it has no fixed upper limit, as its value depends directly on the number of species present and the distribution of their abundance [51]. In addition, diversity indices were calculated for each sampling unit, corresponding to a 0.25 ha inventory plot within each plantation type, in order to enable a meaningful comparison between the different floristic and ecological structures at the local level [26].
Simpson’s index, developed by Edward Simpson in 1949, is a metric for assessing biodiversity. It calculates the probability that two randomly selected individuals belong to the same species. The formula employed to calculate Simpson’s index is as follows (7):
In this study, Simpson’s index (1 − D) was employed to measure diversity, with S representing the number of species, ni denoting the number of individuals of species i, and N signifying the total number of individuals. This index will have a value of 1 to determine maximum diversity, while minimum diversity (all individuals belonging to a single species) is indicated by a value of 0.
The Piélou equitability index was calculated using the following Formula (8):
In this study, J is defined as Pielou’s equitability index, H′ is Shannon’s diversity index, S is the total number of species recorded in the ecosystem under consideration, and ln is the natural logarithm. Ln S is the theoretical maximum diversity value. The J equitability index quantifies the distribution of individuals across the species present in an ecosystem. It facilitates the assessment of population distribution across species within a plantation, potentially unveiling significant ecological dynamics such as the dominance of one species over others. The J index ranges from 0 to 1, with higher values indicating more balanced environments, and 1 representing the maximum attainable value. Student’s t-test assessed the equality of the mean values of Shannon’s diversity index, Simpson’s diversity index, and Pielou’s equitability index.
The Shannon-Wiener, Simpson, and Piélou indices were selected based on their demonstrated capacity to furnish pertinent information concerning biodiversity. These indices were chosen to support the study’s objective of characterizing the floristic diversity and ecological dynamics of rubber plantations in Sankuru. These indices enabled the exploration of the complex relationships between plantation management, species diversity, and the ecosystem services provided by these plantations. This exploration contributed to a better understanding of the mechanisms of conservation and sustainable management of natural resources in this region.
2.3.3. Assessing the Similarity of Different Plantations
The degree of floristic similarity between different rubber plantation sites is determined using Sørensen’s similarity coefficient. This coefficient is a quantitative metric that quantifies the degree of similarity between two environments [52]. The coefficient is calculated by the following Formula (9):
In ecological analysis, Sørensen’s coefficient of similarity (Cs) is a metric that quantifies the degree of similarity between two biological communities, or environments, A and B. The coefficient is calculated as follows: Cs = where a is the number of species common to environments A and B, b is the number of species found in environment B, and c is the number of species found in environment A. This coefficient measures the similarity between the two environments regarding their floral composition. This index is frequently employed in ecological studies to compare the specific composition of diverse plant communities [50]. In this study, we used this coefficient to assess the floristic similarity between different rubber plantations, specifically between state and peasant plantations, to elucidate the similarities and differences in the species present. This is imperative for the analysis of local biodiversity and the management of these ecosystems. This analysis is crucial for assessing the role of historical rubber plantations in terms of biodiversity conservation and for formulating recommendations for the sustainable management of natural resources [51]. The range of Cs values is from 0 to 100%.
The greater the number of species common to the plantations, the more Cs approaches 100%. Conversely, when the floristic dissimilarity is high, the similarity coefficient approaches 0. It is widely accepted that two environments are considered similar when the similarity coefficient is greater than or equal to 50% [51]. Conversely, if the similarity coefficient is less than 50%, it is concluded that there is an absence of similarity between the floristic lists of the environments in question [50].
The Sørensen similarity index was selected over the Jaccard index in this study due to its higher sensitivity to shared species, making it more appropriate for capturing floristic similarity in ecosystems where species recurrence is ecologically meaningful. In the case of the historical rubber plantations of Sankuru where decades of silvicultural abandonment have allowed for spontaneous vegetation dynamics numerous plant species consistently recur across plots. The Sørensen index thus offers a more robust measure of compositional overlap and ecological continuity, facilitating a nuanced interpretation of spatial patterns in floristic structure and successional processes within these anthropogenically modified forest systems [26].
Furthermore, a range of statistical tests were utilized to identify significant differences between plantation types. For instance, Pearson’s χ2 test was applied to examine the association between plantation categories (state-owned versus peasant) and the distribution of species based on their ecological requirements (pioneer, non-pioneer, shade-tolerant). Cramer’s V was used to measure the strength of this association, especially for qualitative variables such as ecological temperaments. Fisher’s exact test was employed to compare the proportions of endemic species between plantations. Finally, for continuous variables that failed to meet the assumption of normality, such as species richness or tree density, the non-parametric Mann–Whitney U test was used to compare distributions between the two management systems. Finally, Welch’s t-test, a variant of the classic t-test, was used to compare the initial density, number of trees, number of species, number of genera, number of families and basal are averages between the two types of plantations without assuming equality of variances between the groups. All analyses were conducted using R software version 4.4.1 [30], with a significance threshold set at p < 0.05.
3. Results
3.1. Rubberwood Density in the Inventory Year (2023) for Both Types of Plantations
Figure 2 shows the data on the current density of rubber plantations in Sankuru.
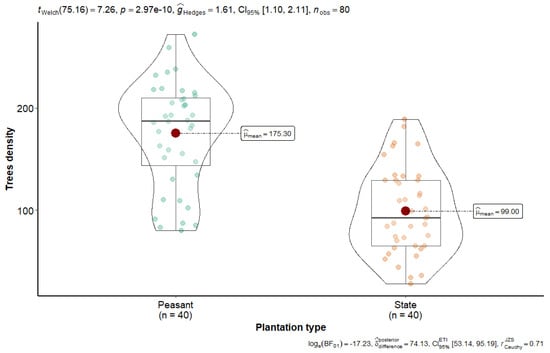
Figure 2.
The current number of rubber stems per inventory plot for the two Sankuru plantation types.
Figure 2 shows that stem density in the Sankuru rubber plantations is significantly higher in peasant plantations, averaging 175 per 0.25 ha subplot (equivalent to 700 stems per ha), compared to state plantations, which exhibit a lower density of 99 stems per 0.25 ha per subplot (equivalent to 396 stems per ha). A statistical analysis, employing Welch’s t-test, revealed a significant disparity between the two types of plantations regarding stem density (t (≈75) = 7.26, p = 2.97 × 10⁻¹⁰). These findings offer intriguing prospects for an integrated approach to managing these historic plantations, particularly within the framework of an agroforestry model. These results suggest that agroforestry practices should adjust planting density according to management type (state vs. peasant) to strike a balance between production and conservation. This difference supports our hypothesis that smallholder management results in higher tree densities.
3.2. Floristic Composition of Sankuru Rubber Plantations
3.2.1. Floristic Richness and Basal Area
The floristic inventory documented 1630 tree-plant individuals, comprising 105 species, 90 genera, and 33 botanical families (Table 2) within the rubber plantations of Sankuru Province, collectively classified based on their typology (state and peasant). Regarding species richness, the Fabaceae family is the most abundant, with 22 species, accounting for 20.95% of all species found in the rubber plantations. It is followed by the Meliaceae (8.57%), Euphorbiaceae (6.67%), Olacaceae (5.71%), Clusiaceae and Moraceae (4.76% each), as well as Phyllanthaceae, Annonaceae, Apocynaceae, and Malvaceae (3.81% each). The remaining families are represented by one to two species. In addition to Hevea brasiliensis, the most common species include Plagiostyles africana, Petersianthus macrocarpus, Hymenocardia ulmoides, Piptadeniastrum africanum, Bellucia grossularioides, Barteria nigritana, Caloncoba welwitschii, Pterocarpus soyauxii, Grewia trinervia, and Gilletiodendron kisantuense.
Table 2.
Composition metrics and floristic richness for two plantation types in Sankuru (n = 10 plots per type; Welch’s t-test).
Considered separately, in state plantations (n = 10), mean density was 635 ± 84 trees ha−1, with 41 ± 7.5 species ha−1 and a basal area of 29.88 ± 5.8 m2 ha−1; in peasant plantations, 828 ± 144.6 trees ha−1, 28 ± 4.6 species ha−1, and 41.37 ± 7.6 m2 ha−1 (Table 2).
The mean basal area of state plantations was 29.88 ± 5.8 m2 ha−1, compared to 41.37 ± 7.57 m2 ha−1 observed in peasant plantations (see Figure 3). This discrepancy can be attributed to a high density of small-diameter trees, resulting in a low sum of tree cross-sections measured at 1.30 m from the ground. State and farmer plantations of Hevea brasiliensis are characterized by a predominance of small-diameter trees, with few large-diameter trees, resulting in a high density of small-diameter trees per hectare. Welch’s t-test revealed a significant difference for density (t = 4.61; p = 3.45 × 10⁻⁴), species richness (t = 4.61; p = 3.45 × 10⁻⁴), family richness (t = 3.30; p = 5.56 × 10⁻³), and basal area (t = −3.81; p = 1.42 × 10⁻³).
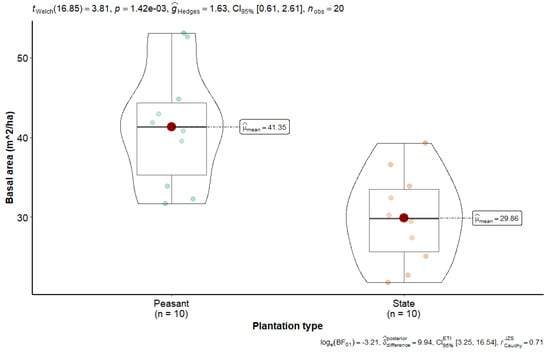
Figure 3.
Basal area of state and peasant rubber plantations in Sankuru.
Higher basal area in peasant plantations suggests the need for targeted thinning to optimize growth and ecosystem services. In an integrated approach to managing these plantations, this information underscores the importance of promoting agroforestry practices that balance tree density, regeneration, and growth. A sustainable management strategy for historical rubber plantations, involving effective control of density and species composition, will enhance plantation productivity, improve their capacity to sequester carbon, preserve biodiversity, and provide various ecosystem services to local communities. This will ensure their long-term sustainability in an agroforestry context.
3.2.2. Relative Abundance
Figure 4 and Figure 5 illustrate the most prominent species and families, in terms of both species and individuals, in the Sankuru rubber plantations. It should be noted that only the top ten families and species are shown in Figure 4, and they are listed in descending order of relative abundance or frequency. The ten most abundant species in state plantations alone represent 94%. They are Hevea brasiliensis (84.72%), Plagiostyles africana (2.65%), Barteria nigritana (2.32%), and Hymenocardia ulmoides (0.94%), Funtumia elastica (0.77%), Petersianthus macrocarpus (0.66%), Piptadeniastrum africanum (0.66%), Antiaris toxicaria (0.52%), Symphonia globulifera (0.50%), and Trilepisium madagascariense (0.48%). The remaining 5.78% of the identified species are classified as “other.” In peasant plantations, the top ten species account for 87% of the total, comprising Hevea brasiliensis (62.33%), Plagiostyles africana (7.98%), Petersianthus macrocarpus (4.82%), Hymenocardia ulmoides (3, 87%), Bellucia grossularioides (2.58%), Caloncoba welwitschii (1.45%), Piptadeniastrum africanum (1.18%), Barteria nigritana (0.94%), Carapa procera (0.88%), and Grewia trinervia (0.85%). The remaining species represent only 13.11%, 58 species in total.
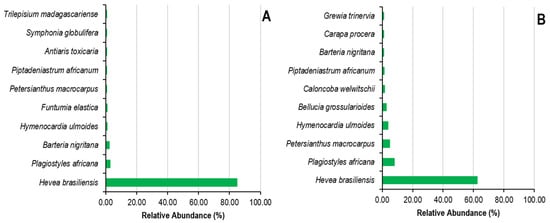
Figure 4.
Relative abundance of plant species in state (A) and peasant (B) rubber plantations in Sankuru province.
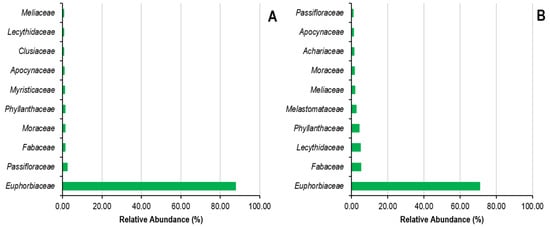
Figure 5.
Relative abundance of botanical families in state (A) and peasant (B) rubber plantations in Sankuru province.
Concerning the classification of plant families, state plantations are predominantly comprising Fabaceae (24%), Meliaceae (10.67%), Olacaceae (6.67% each), Clusiaceae and Phyllanthaceae (5.33% each), Apocynaceae, Moraceae and Myristicaceae (4% each), and Anacardiaceae (2.67%) (Figure 5). In contrast, peasant plantations are dominated by the Fabaceae (14.86%), Euphorbiaceae (9.46%), Meliaceae (8.11%), Moraceae (6.76%), Phyllanthaceae (5.41%), Apocynaceae, Burseraceae, Clusiaceae, Malvaceae, and Myristicaceae families (4.05% each) (Figure 5). In addition, the species Plagiostyles africana, Petersianthus macrocarpus, Hymenocardia ulmoides, Piptadeniastrum africanum, Bellucia grossularioides, Caloncoba welwitschii, and Barteria nigritana are the most represented in state and farmer plantations, in conjunction with Hevea brasiliensis.
The primary implication of these results (Figure 4 and Figure 5) within the framework of an integrated management approach is the necessity of introducing agroforestry practices that promote enhanced coexistence between rubber and other plant species. This approach would contribute to enhanced biodiversity and strengthened ecosystem services, ensuring the sustainability of plantations by stabilizing soils, increasing carbon sequestration, and more balancedly meeting the needs of local communities. This integrated management approach is poised to establish a sustainable agricultural model that prioritizes economic productivity and environmental conservation.
3.2.3. Relative Dominance of Species
The relative dominance of the top ten species and the top seven botanical families in Sankuru rubber plantations is demonstrated in Figure 6. In state-owned plantations, the top ten species exhibit an 87% relative dominance, while the remaining 64 species collectively account for 13%. The ten species are Hevea brasiliensis (61.18%), Plagiostyles africana (6.37%), Petersianthus macrocarpus (5.34%), Hymenocardia ulmoides (4.41%), Piptadeniastrum africanum (3.68%), Bellucia grossularioides (1.82%), Albizia gummifera (1.17%), Pterocarpus soyauxii (1.09%), Gilletiodendron kisantuense (1.04%), and Grewia trinervia (0.89%). In Peasant’s plantations, the top ten species exhibit a relative dominance of 94.69% compared to 5.1% for the remaining 65 species. The ten species are Hevea brasiliensis (84.17%), Plagiostyles africana (2.64%), Piptadeniastrum africanum (2.49%), Trilepisium madagascariense (1.03%), Petersianthus macrocarpus (0.91%), Barteria nigritana (0.80%), Hymenocardia ulmoides (0.77%), Pterocarpus soyauxii (0.70%), Funtumia elastica (0.64%), and Antiaris toxicaria (0.54%).
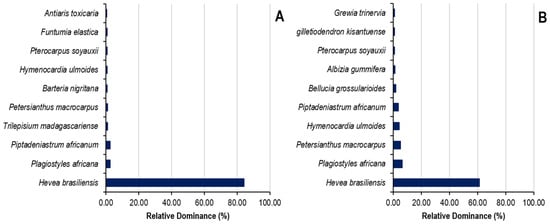
Figure 6.
Relative dominance of species in state (A) and peasant (B) rubber plantations in Sankuru province.
3.2.4. Relative Dominance of Families
The relative dominance of families of the top ten species and top seven botanical families in Sankuru rubber plantations is demonstrated in Figure 7. Regarding the relative dominance of the families listed in state plantations, the first seven families demonstrate 93% relative dominance, compared with 17% for the remaining 22 families. Of these seven families, Euphorbiaceae (69.05%), Fabaceae (9.56%), Lecythidaceae (5.34%), Phyllanthaceae (5.17%), Melastomataceae (1.82%), Moraceae (1.19%), and Meliaceae (1.05%) are shown in Figure 6. In peasant plantations, the first seven families exhibit a relative dominance of 96%, while the remaining 25 demonstrate a relative dominance of 14%. A closer look at the seven families reveals the following: Euphorbiaceae (87.12%), Fabaceae (3.69%), Moraceae (1.92%), Passifloraceae (0.80%), Phyllanthaceae (0.95%), Apocynaceae (0.89%), and Myristicaceae (0.56%).
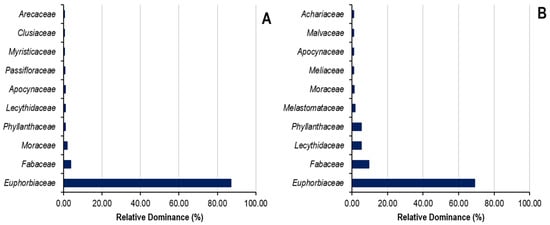
Figure 7.
Relative dominance of families in state (A) and peasant (B) rubber plantations in Sankuru province.
This relative dominance of species and families may have implications for the ecological resilience of plantations, their ability to support functional biodiversity, and their long-term sustainability. In an integrated approach to managing historical rubber plantations, these results highlight the importance of enhancing floristic diversity and promoting agroforestry practices that facilitate the coexistence of rubber with other plant species. Such a strategy could enhance the sustainability of plantations, improve their ecological stability, and meet the socio-economic needs of local communities by diversifying available resources.
3.2.5. Species Rarefaction Curve
The species-individual curve, also called the species rarefaction curve, is a graphical representation of the relationship between species richness and the number of individuals. This curve illustrates that species richness increases with the number of individuals in both types of rubber plantations (Figure 8). There is an exponential increase in species up to around 150 individuals, with a more pronounced increase for state-owned plantations, resulting in a higher species richness in the latter than in peasant plantations. Beyond this number of individuals, the rate of increase in species richness plateaus, stabilizing at a higher level above 200 individuals. A similar trend is observed in the species rarefaction curve. The area-species curve demonstrates a substantial increase in species richness with an increase in the sampled area up to 2 hectares. Beyond this threshold, the increase in species richness plateaus, and the number of species stabilizes at approximately 72 species at 3.5 hectares of sampled area.
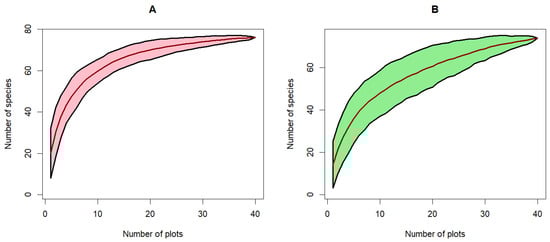
Figure 8.
Species rarefaction curve in rubber historical plantations in Sankuru province. (A): State plantations and (B): Peasant plantations.
The species rarefaction curves in both types of plantations show a tendency toward stabilization, indicating that the majority of species present have been sampled. This asymptote suggests that the sampling effort is sufficient to represent the floristic richness of the plantations studied reliably, thus confirming our sampling effort hypothesis.
3.2.6. Importance Value Index of Species and Families
An analysis of the importance value index of species and families reveals the top ten species and top seven botanical families for each of the two types of rubber plantations (see Table 3 and Figure 9). The seven families that dominate state plantations in terms of importance value are Euphorbiaceae (69.96%), Fabaceae (7.33%), Lecythidaceae (5.08%), Phyllanthaceae (4.74%), Melastomataceae (2.20%), and Meliaceae (1.44%). The dominant species are Hevea brasiliensis (61.76%), Plagiostyles africana (7.17%), Petersianthus macrocarpus (5.08%), Hymenocardia ulmoides (4.14%), Piptadeniastrum africanum (2.43%), and Bellucia grossularioides (2.20%).
Table 3.
List of plant species on Sankuru rubber plantations, ranked in order of decreasing Importance Value Index (IVI) value.
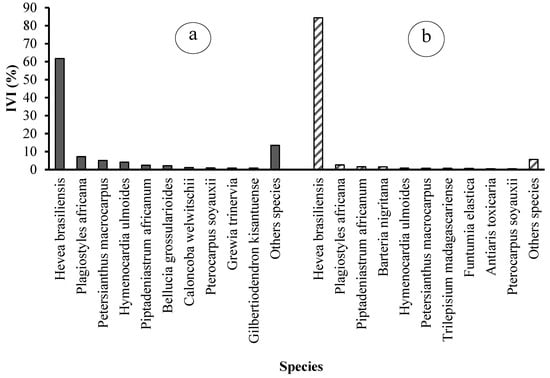
Figure 9.
Importance Values Index (IVI) of the ten main plant species in (a) state-owned and (b) peasant rubber plantations in Sankuru.
These six families collectively represent 89% of the importance value, with the remaining 21 families accounting for a mere 11% (Figure 9). In peasant plantations, the seven dominant families are Euphorbiaceae (87.45%), Fabaceae (2.53%), Moraceae (1.61%), Passifloraceae (1.56%), Phyllanthaceae (1.09%), and Apocynaceae (0.90%). The remaining 24 families collectively account for 12.55% of the total (Figure 10). The most prevalent species are Hevea brasiliensis (84.44%), Plagiostyles africana (2.64%), Piptadeniastrum africanum (1.58%), Barteria nigritana (1.56%), Hymenocardia ulmoides (0.86%), and Petersianthus macrocarpus (0.79%) (Figure 10).
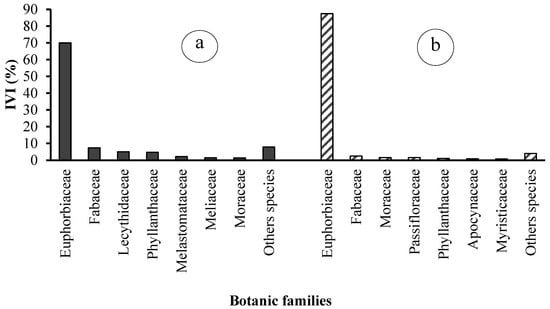
Figure 10.
Importance Values Index (IVI) of the ten main families in (a) state-owned and (b) peasant rubber plantations in Sankuru.
Regarding the importance value index, both types of plantations are characterized by species and botanical families that are relatively the same. It should also be noted that the rubber tree is more dominant in peasant plantations than in state plantations, so the proportion of companion species is lower in the former than in the latter.
The results of Table 4 underscore the significance and necessity of managing floristic diversity in these plantation systems, as evidenced by the findings on the importance value of species and families. In an integrated management approach, promoting a management strategy that balances rubber dominance with preserving and enhancing diversity among companion species is imperative. This approach contributes to the long-term ecological sustainability of plantations. Integrating agroecological principles and practices, such as agroforestry, is essential for enhancing the resilience of plantation ecosystems. This integration fosters a symbiotic relationship between latex production and biodiversity conservation, supporting long-term socio-environmental sustainability objectives.
Table 4.
List of botanical families in Sankuru rubber plantations, ranked in order of decreasing Importance Value Index (IVI) value.
3.3. Floristic Diversity of Sankuru Rubber Plantations
The floristic diversity of rubber plantations was assessed using the Shannon, Simpson, Piélou, and Sørensen indices. The results of the floristic diversity indices and the statistical analyses applied are shown in Figure 11 and Table 5.
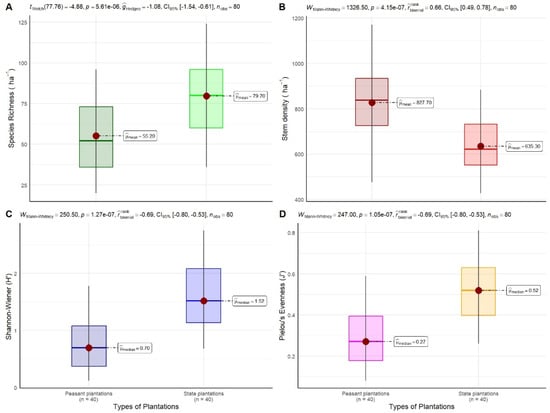
Figure 11.
Comparison of ecological parameters between peasant and state rubber plantations in Sankuru, DR Congo: (A) species richness, (B) stem density (trees/ha), (C) Shannon-Wiener diversity index, and (D) Pielou equitability. The Welch t-test was used to compare species richness, and the Mann–Whitney test was used to compare stem density, the Shannon-Wiener diversity index (H′), and Pielou’s evenness (J’).
Table 5.
Floristic diversity index values for Sankuru rubber plantations (p-value the Mann–Whitney test, N1 = N2 = 10).
3.3.1. Shannon Diversity Index
The Shannon-Wiener diversity index (H′) exhibited considerable variation among the various types of rubber plantations, with values ranging from 0.93 for peasant plantations to 1.87 for state plantations. Substantial variability exists within the plantation types. These findings indicate that Sankuru’s rubber plantations exhibit a limited species diversity, irrespective of their typology. The statistical analysis, employing the Mann–Whitney test, reveals that the mean values of the Shannon index for these two categories of plantations are statistically different (p < 0.001), with state plantations exhibiting greater diversification compared to peasant plantations. The findings indicate that prevailing practices, notably the absence of silvicultural treatments, hinder the harmonious coexistence of rubber and other species, thereby compromising the resilience of these systems to environmental and economic disturbances.
3.3.2. Simpson’s Diversity Index
The total Simpson index values range from 0.28 for peasant plantations to 0.60 for state plantations. These values indicate that floristic diversity is lower in peasant plantations, where trees have less than a 30% chance of belonging to different species. In contrast, state plantations exhibit higher diversity, with trees having a 60% probability of belonging to different species. This suggests a more equitable distribution of species and a more diverse plant ecosystem. Moreover, the Mann–Whitney test outcomes demonstrate that the mean values of this index, ascertained for each of the two plantation types, exhibit significant disparities (p < 0.001).
The practical implications of these results underscore that farmer plantations could benefit from improved management practices to encourage species diversification and limit the dominance of one or a few species. For state-owned plantations, although diversity is comparatively higher, it remains imperative to maintain or enhance this diversity through sustainable management practices (silvicultural treatments), notably by reinforcing agroecological principles and promoting harmonious coexistence between rubber production and biodiversity conservation. The statistical analysis (Mann–Whitney test: p < 0.001) substantiates the necessity to prioritize the distinctions between these two categories of plantations, underscoring the indispensability of context-specific management strategies to optimize ecosystem services and ensure the long-term viability of these plantations.
3.3.3. Piélou Equitability Index
Piélou’s equitability index reveals values of 0.22 for peasant plantations and 0.43 for state plantations. These findings suggest that the distribution of individuals across the 105 species is less balanced in peasant plantations compared to state plantations. This suggests that certain species exhibit higher levels of dominance in peasant plantations, leading to a greater concentration of individuals within a smaller number of species. Conversely, state plantations exhibit a more equitable distribution of individuals across species. This observation is further substantiated by a statistically significant disparity (p < 0.001) as determined by the Mann–Whitney test, which lends further credence to the hypothesis that the ecological framework of state plantations is more balanced than that of peasant plantations. These findings imply that enhancing the management of species diversity in peasant plantations could lead to a more equitable distribution of individuals, potentially strengthening the ecological resilience of plantations and promoting sustainable natural resource management.
3.3.4. Floristic Similarity of Different Plantation Types
Sørensen’s coefficient of similarity (Cs) was employed to assess the floristic affinities between the two distinct types of plantations inventoried. The resultant value of Cs was 57.72, approximately equal to 58. This coefficient value suggests that the two kinds of rubber plantations are not significantly different in terms of the species that comprise them, exhibiting a degree of similarity of 58%. Consequently, the two plantations are deemed to belong to a shared floristic community. The independent Student’s t-test, applied to compare the means of the various parameters of floristic richness and diversity (e.g., different densities [individuals, species, genera, family], basal area, Shannon, Simpson, and Piélou indices), demonstrated that the two plantations differ in terms of composition, floristic richness, and diversity.
3.4. Structure of Rubber Plantations in Sankuru
As illustrated in Figure 12, the distribution of trees by diameter class is depicted in the state and peasant rubber plantations studied. The old, abandoned Hevea brasiliensis plantations (state and peasant) generally have a greater number of small-diameter trees, with few large-diameter trees. In state-run and peasant plantations, the largest number of trees is found in the first four diameter classes [10–40 cm]. The observed structure is characterized by an irregular, inverted J-shape, indicative of a substantial presence of small-diameter trees, interspersed with a limited number of large-diameter trees. In state plantations, the diameter ranges from 10 cm to 101.35 cm, while in peasant plantations, the diameter ranges from 10 cm to 114.64 cm. This inverted-J distribution suggests good regeneration but indicates the need for selective thinning of small stems to enhance stand value.
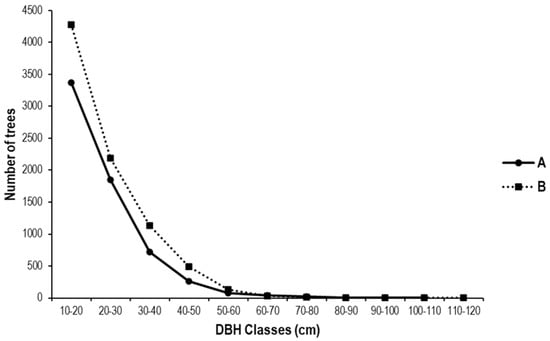
Figure 12.
Diameter structure of trees in (A) the state and (B) peasant rubber plantations in Sankuru. A logarithmic scale was used to better visualize the distribution of tree foot measurements in diameter classes. Classes were created using a 10 cm diameter at breast height (dbh) step.
3.5. Vertical Structure of Rubber Plantations in Sankuru
The results in Figure 13 show the vertical structure of rubber plantations in Sankuru. It highlights significant differences between the two types of plantations, as indicated by the ANOVA test (F(2.24 = 21.78), df = 24; p = 4.03 × 10⁻⁶). In both types of plantations, most individuals are found in the upper canopy, with a higher proportion in peasant plantations (83.60%) than in state plantations (73.8%). This high concentration in the upper stratum reflects the dominance of mature Hevea trees. However, the lower strata, namely the subcanopy and the shrub stratum, are proportionally more represented in state plantations, with 16.3% and 9.9% of individuals, respectively, compared with 14.8% and 7.6% in farmer plantations. Greater vertical complexity in state plantations points to more advanced natural regeneration under less intensive management.

Figure 13.
Vertical structure of historical rubber plantations in Sankuru, showing the distribution of individuals according to three vegetation strata: the upper canopy (≥30 m), under canopy (20–30 m), shrub stratum (5–10 m).
3.6. Species Light—Requirement Composition
The results in Figure 14 show a significant difference in the functional composition of species in terms of species temperament between peasant and state plantations. In the peasant plantations, pioneer species, which are highly heliophilic, account for 94% of individuals, reflecting a dominance of species adapted to open or regularly disturbed environments. State plantations, on the other hand, have a more diversified structure, with 84% pioneer species but a higher proportion of non-pioneer (10%) and shade-tolerant (5%) species. This more balanced structure may reflect different silvicultural management practices, higher plantation density, or more advanced ecological dynamics. The chi-square test (χ2 = 417, p < 0.001) and Cramer’s V index (0.168) confirm that the distribution of light requirement types is significantly related to plantation type. When evaluated individually, peasant plantations exhibit a higher degree of disturbance, with a pioneer index (PI) of 76.70%, compared with 70.27% in state plantations. The results of Welch’s t-test, indicate that the mean values of the pioneer index proportions, as determined for each of the two plantation types, are statistically different (t = 6.23, p = 0.001028). Dominance of pioneers suggests frequent canopy disturbances; management should foster shade-tolerant understory recruitment.
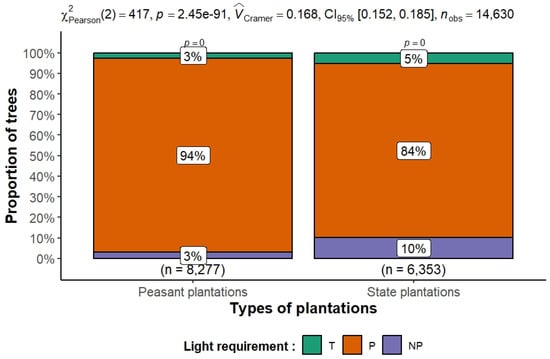
Figure 14.
Distribution of species according to temperament (T: shade tolerant, P: pioneer, NP: non-pioneer) in the two types of rubber plantations in Sankuru. Pearson’s chi-square test (χ2) was used to assess the association between plantation type (peasant vs. state-owned) and the distribution of trees according to their light requirements: Tolerant (T), Pioneer (P), and Non-Pioneer (NP). The sample size was 8277 individuals for peasant plantations and 6353 individuals for state-owned plantations, for a total of 14,630 individuals.
3.7. Chorological Spectra and Phytogeographical Affinity of Two Plantation Types
Table 6 below shows the phytogeographical distribution spectra calculated for each plantation type.
Table 6.
Phytogeographical distribution spectra of species inventoried in Sankuru rubber plantations. BGC: Lower Guinean Congolese, OGC: Omni-Guinea-Congolese, C: Congolese, FC: Species endemic to the Central Forest, AA: Afro-American, AM: Afro-Malgache, Paleo: Paleotropical, Pan: Pantropical, AT: Afro-Tropical.
An analysis of Table 6 reveals that the floristic composition of Sankuru’s rubber plantations is predominantly characterized by the Guinea-Congolese element, irrespective of the plantation type, including the Omni-Guinea-Congolese and Lower Guinean Congolese phytochories. Fisher’s exact test applied to the comparison of proportions of endemic species between the two types of plantations (86.48% vs. 82.2%) indicates that the difference is not statistically significant (p > 0.1), suggesting chorological homogeneity between the two management systems. High Guinea-Congolese endemism makes these species ideal candidates for locally adapted agroforestry mixtures.
4. Discussion
4.1. Methodological
4.1.1. Inventory Protocol and Sampling
The present study was predicated on the statistical inventory technique (sampling) for data collection. The delimitation of each plot and the location of trees were based on the method developed by Picard [28], and the transects were open and oriented east–west, in line with the methodology used in the work of Lokonda [53] and Gillet [54]. The inventory devices were installed to circumvent the edge effect, a phenomenon that could compromise the results’ veracity. This approach aligns with the methodologies outlined in the works of Kasekete et al. [55]. Conventionally, data collection systems have centered on stands of trees with a diameter of DBH ≥ 10 cm or greater. This threshold value was selected in our study to ensure the comparability of our results with those obtained in other systems in tropical plantations [26,56,57,58,59].
The selection of our protocol was predicated on a compromise between the size and number of sampling units. As asserted by Blanc’s study [60], an extensive sampling area enhances the quality of a formation’s description. However, this approach concomitantly restricts the number of formations that can be examined, thereby impeding the comprehensive analysis of stand diversity on a large scale, constituting our study’s primary objective. Given these considerations, we focused on smaller areas (0.25 ha) to study specific diversity. However, a disadvantage of our methodological approach is that it minimizes the information provided by the undergrowth and regeneration (trees ˂ 10 cm dhp), representing a significant proportion of diversity in forest dynamics [33,61,62,63]. This trade-off may underestimate recruitment dynamics in the understory.
To ensure long-term sustainability, future research should concentrate on natural regeneration strategies in these historic rubber plantations. Specifically, further investigation is warranted into the efficacy of agroforestry practices and the introduction of floristic assemblages in enhancing the vertical structure of plantations, thereby fostering their resilience in the face of environmental disturbances. Addressing the identified limitations, integrating novel long-term monitoring approaches, and conducting further studies on the ecological and socio-economic dynamics of these plantations would enhance our understanding of the sustainability challenges faced by rubber plantations in Sankuru province [64]. Developing more integrated and sustainable long-term management strategies is contingent upon the execution of such future research.
4.1.2. Floristic and Structural Characterization of Sankuru Rubber Plantations
The composition, richness, and floristic diversity of rubber plantations were the focus of a study that utilized various parameters, including the number of individuals, species, genera, families, and importance value. We applied standard diversity (Shannon, Simpson, Pielou) and similarity (Sørensen) indices, following [7,26].
The classification of rubber plantations in Sankuru is determined by the type of owner, including state-owned plantations, peasant plantations owned by farmers, religious plantations owned by Catholic missions, and industrial plantations owned by rubber companies. In the present study, we have considered both peasant and state-owned plantations, considering that industrial and religious plantations can be regarded similarly to state-owned plantations [1,11]. In this study, religious and industrial plantations were grouped together with state plantations due to their similar level of management intensity to that observed in peasant plantations [1]. The sampling effort employed in this study (10 hectares for each type of plantation) is adequate, as the area-species curve indicates that the number of species scarcely increases beyond 2.5 hectares of sampled area (see Section 3.2.5).
4.2. Current Density of Historical Rubber Plantations in Sankuru
A critical first step in understanding the impact of historical rubber plantations on local ecosystems and the regional economy is to assess the current density of such plantations in the Sankuru region. The planting of rubber trees in this area has been extensive since the early 1940s, primarily driven by the increasing demand for natural rubber. The data collected in this study indicate that current plantation densities vary considerably between the two types of plantations t (≈75) = 7.26, p = 2.97 × 10⁻¹⁰). On average, peasant plantations, where cultivation practices are primarily maintained by the peasant owners, exhibited an average density of approximately 700 trees per hectare. In contrast, state-owned plantations, which are virtually abandoned with a complete absence of maintenance, showed an average density of 396 trees per hectare [1,2,17]. These plantations are susceptible to infestations, leading to the death of the rubber trees and the subsequent colonization by other species. The higher density of rubber stems per hectare in the peasant plantations, which exceeded the initial density when the plantations were established, can be explained by strong natural rubber regeneration. This phenomenon aligns with the findings reported by Bustillo et al. [65], who documented an average of 506 rubber trees per hectare in H. brasiliensis plantations at Yangambi in the DRC, this density is lower than the value obtained for small farmers.
Conversely, the low density (396 stems per hectare) observed in state-owned plantations can be attributed to various factors, including the aging of trees, inadequate maintenance, and the gradual conversion of land to alternative agricultural uses, such as slash-and-burn agriculture. Furthermore, Lan et al. [7] have noted that natural succession and the invasion of other plant species can also contribute to a reduction in rubber tree density. The environmental impact associated with these plantations must also be considered. Intensive rubber monoculture can lead to a decrease in local biodiversity, as well as soil degradation due to unsustainable cultivation practices [66]. Given these density differences, integrating agroforestry (see Section 3.1) offers a pathway to combine rubber yield with ecosystem restoration. This is imperative to ensure economic profitability and preserve Sankuru’s ecological capital [18].
4.3. Floristic Composition of Historical Rubber Plantations in Sankuru
4.3.1. Floristic Richness, Specificity, Diversity, and Similarity Indices
We recorded 105 tree species across state and peasant plantations; richness was higher in state plantations (75 vs. 74 species, Table 2). These findings are consistent with those reported by Lan et al. [7] in a rubber plantation under natural management on Hainan Island in southern China. The dominant species were primarily affiliated with nine families. The most prevalent families are Fabaceae (18), Meliaceae (8), Euphorbiaceae (5), Olacaceae (5), Clusiaceae (4), Phyllanthaceae (4), Apocynaceae (3), Moraceae (3), and Myristicaceae (3). The predominance of these families in Sankuru’s natural forests underscores their ecological significance. This assertion is further substantiated by Fonu’s [67] study, which examined the floristic diversity of sacred forests in the Lukumbe sector of Sankuru Province. The study revealed that the families with the highest species representation were Fabaceae, Euphorbiaceae, and Olacaceae. Furthermore, the most significant species in rubber plantations are those characteristic of the northern Sankuru region, which is occupied by evergreen rainforest, with the dominant species being sun-loving species [68,69].
The level of floristic diversity expressed in terms of Shannon and Simpson diversity indices and Pielou’s equitability index demonstrates that Sankuru rubber plantations are characterized by a paucity of diversity and an imbalanced distribution of individuals across species. This diversity is also lower than in secondary forests [70]. Welch’s t-test reveals a statistically significant difference in floristic diversity between state and peasant plantations, with the former exhibiting greater diversity. The results of this study demonstrate the absence of substantial differences between the botanical families of importance in terms of species accompanying the rubber tree in state plantations and those of peasant plantations. A study by Lan et al. [7] on the Chinese island of Hainan revealed that rubber plantations managed closely to natural “rubber forests” exhibit a degree of floristic diversity comparable to that observed in natural tropical forests (DBH ≥ 5 cm).
The trends as mentioned above were reported by Gouyon et al. [8] in their study of “Jungle rubber” agroforestry systems in southeast Sumatra, Indonesia, and by Wibawa et al. in their research of rubber plantations on the island of Java, also in Indonesia (DBH ≥ 5 cm). In Jambi Province, rubber forests contain 116 tree species [71]. These results differ from those of the present study. This discrepancy can be attributed to the diameter threshold used for species enumeration. The former research enumerated all individuals with a diameter of 5 cm or greater at breast height, whereas the latter used a diameter threshold of 10 cm. Peasant H. brasiliensis plantations exhibit a significantly higher number of individuals per hectare, accompanied by smaller mean diameters, than state H. brasiliensis plantations (p-value equal to 0.00034). The dispersal mechanisms of these species, which are believed to underlie the observed biodiversity in these plantations initially dominated by a single species, are thought to be influenced by disturbances such as clearings or areas affected by falling trees, leading to the formation of mosaics [72].
In this case, the disturbed areas of the rubber plantations played a pivotal role in these dynamics, promoting colonization by pioneer species and the growth of individuals in the undergrowth [73]. Consequently, these species modify the structure and composition of Sankuru’s rubber plantations over time. The greater the windfall, defined as the mortality of rubber trees due to falling, the greater the luminosity, thereby offering pioneer species the opportunity to establish and grow rapidly. A robust correlation has been observed between tree density, both within rubber trees and across the entire plantation, and various floristic diversity indices, including H, 1-D, and J. Canopy gaps from root-rot mortality foster pioneer colonization, consistent with Schnitzer and Bongers [69]. The presence of holes left by dead rubber trees was more pronounced on state-owned plantations than on peasant plantations, as evidenced during inventories. A correlation analysis revealed a strong negative correlation between density (number of plants per hectare) and diversity and equitability indices. These findings are consistent with those reported by Schnitzer and Bongers [74], who noted that the density of anemochore-dispersing trees in African forests is associated with the impact of anthropogenic disturbance.
The observed variation in compositional indicators and floristic richness between the two plantation types (Table 2) highlights the imperative for an integrated management framework tailored to rubber plantations. Such a framework should strategically balance the conservation of floristic diversity and species composition to enhance ecosystem resilience. Specifically, optimizing both species richness and tree density is critical to sustaining biodiversity within these agroforestry systems, while simultaneously maintaining or improving productivity. Implementing this dual-focused management paradigm is essential to securing the long-term ecological sustainability of Sankuru’s historic rubber plantations, alongside ensuring tangible socio-economic benefits for local communities [1,16].
4.3.2. Species Rarefaction Curve and Area-Species Curve
The present study’s findings demonstrate that species richness increases proportionately to the area sampled in the two types of rubber plantations in the two territories of Lodja and Lomela. These findings are consistent with those reported by Appiah-Badu et al. [75] in rubber plantations in the Awudua forest of Ghana, who also observed an increase in species richness with increasing area sampled. The area-species curve, which depicts species accumulation as a function of area sampled, distinctly demonstrates the variation in species numbers among the two types of plantations. State plantations exhibited a higher species richness than peasant plantations, irrespective of the area under consideration.
The shape of the curves indicates that the sampling effort was sufficient to capture the maximum number of species, as the increase in area sampled has a negligible influence on the number of species [76]. These outcomes are analogous to those reported by Lan et al. [7] in naturally managed rubber plantations on Hainan Island in China, who found that over 90% of the dominant species were already present in 1 ha of sampled area.
4.4. Structure of Historical Rubber Plantations in Sankuru
In the context of rubber plantations, it has been observed that the distribution of trees into different diameter classes aligns closely with the decreasing exponential model, wherein the number of individuals decreases as diameter classes progress to higher values [58]. The Sankuru rubber plantations exhibit an inverted J-shaped structure indicating stable regeneration, characteristic of undisturbed tropical forests, with a substantial presence of small-diameter trees and a limited number of large trees. This distribution resembles other authors’ descriptions of forest formations in the sub-region [75]. This distribution indicates a regular dynamic, denoting constant regeneration over time, and characterizes a stable stand where woody individuals provide mutual support [26]. As regards the vertical structure, the Anova test (p = 4.03 × 10⁻⁶) reveals statistically significant differences in the vertical structure between the two types of plantations. Greater strata evenness in state plantations implies less intense thinning and higher structural complexity.
This distribution is regarded as an indicator of equilibrium in forest structure, particularly in natural stands. The diametric structure observed in the Sankuru rubber plantations can be attributed to their current state, which is beginning to resemble a natural forest [18]. This study’s findings are consistent with those reported by Lan et al. [7] in naturally managed rubber plantations on Hainan Island.
4.5. Functional Composition and Disturbance in Historic Rubber Plantations in Sankuru: Challenges for Biodiversity Conservation
The results of the study on the temperament of floristic species in historical rubber plantations in Sankuru indicate a strong dominance of pioneer species, particularly in peasant plantations where they represent 94% of individuals, compared with 84% in state plantations. This predominance of heliophilous species is indicative of a regeneration that is strongly oriented towards opportunistic species, which are generally associated with open or degraded environments. In contrast, state plantations exhibit a more diversified functional structure, including a significant proportion of shade-tolerant (5%) and non-pioneer (10%) species. This finding suggests that these plantations experience more stable ecological conditions and a more advanced process of ecological succession.
These results suggest that state plantations possess a higher ecological potential to function as biodiversity refuges or corridors. From a conservation perspective, it is imperative to promote silvicultural and agroforestry practices that limit excessive disturbance and encourage the gradual establishment of slow-growing species with high ecological value, notably legumes [1,18]. The promotion of a heterogeneous plant cover, incorporating non-pioneer species, would enhance the resilience of plantations and maximize their contribution to regional biodiversity conservation [7]. In this context, the rehabilitation of Sankuru’s historic rubber plantations in an agroforestry system is imperative not only for biodiversity conservation but also for local economic revitalization. The sustainable cultivation of rubber plants from renewable resources has the potential to restore ecosystem services and enhance carbon storage, even in degraded land [18].
4.6. The Role of Sankuru Rubber Plantations as Secondary Reservoirs of Guinean-Congolese Biodiversity and Ecological Corridors in a Deforestation Context
The flora of the Sankuru rubber plantations is dominated by the proportion of Guineo-Congolese elements in general, irrespective of the plantation type (including primarily Omni-Guineo-Congolese and Bas-Guineo-Congolese phytochories). This robust predominance unequivocally substantiates the assertion that the flora of the Sankuru region is affiliated with the expansive Guineo-Congolese phytogeographical region, a geographical entity distinguished by its remarkable biodiversity and a conspicuously elevated level of endemism. These results align with those of other researchers, who have corroborated the notion that the Guineo-Congolese region encompasses the dense rainforests of Central Africa, a major center of floristic diversity on the African continent [26,35,37]. The observed high degree of floral diversity indicates complex evolutionary processes, including allopatric speciation and periods of ecological stability [59]. These phenomena have facilitated the accumulation and preservation of ancient lineages, contributing to the biodiversity observed in the region [59].
The results of this study underscore the potential of Sankuru’s rubber plantations to function as secondary reservoirs of biodiversity and ecological corridors. The floristic composition of these communities, characterized by a preponderance of Guineo-Congolese species, underscores their potential for a pivotal role in the in situ conservation of native flora, particularly in deforestation and habitat fragmentation [18]. To this end, it is imperative to incorporate these plantations into regional conservation strategies. These objectives may encompass the promotion of sustainable agroforestry practices, the establishment of ecological corridors connecting plantations to remaining natural forests, and the dissemination of knowledge regarding the significance of biodiversity among local communities [1,18]. Such an approach would contribute to preserving Sankuru’s floristic wealth and maintaining essential ecosystem services for local populations. In this context, Sankuru’s rubber plantations offer a distinctive opportunity to harmonize agricultural production and biodiversity conservation [18]. Consequently, integrating these measures into sustainable natural resource management policies is strongly recommended to ensure the sustainability of the region’s forest ecosystems [1,18].
4.7. Implications for Biodiversity Conservation
The observation of notable floristic diversity in Sankuru’s historic rubber plantations suggests the potential for these plantations to play a crucial role in biodiversity conservation. A diversified rubber plantation, characterized by a substantial presence of indigenous plant species, can function as a habitat for diverse flora and fauna, including endangered species. Integrating agroforestry management practices that promote biodiversity can effectively preserve local ecosystems while ensuring sustainable production. Furthermore, these plantations can function as ecological corridors, facilitating the migration and reproduction of regional species and thereby mitigating the risk of extinction. Implementing agroforestry techniques can reduce the restoration of ecosystem services while ensuring the continued economic productivity of these plantations [66].
As transition zones between agricultural and natural areas in the Salonga National Park landscape [1,11], these plantations can be rehabilitated to improve their ability to restore vegetation cover, prevent soil erosion, and promote natural forest regeneration. The integration of rubber plantations with other woody and non-woody species could thus help strengthen the resilience of local ecosystems to climate change while minimizing the environmental impact of agricultural practices [18]. The active involvement of local communities in decision-making processes concerning the utilization and management of their natural resources is imperative. Educational programs that focus on raising awareness about the ecological benefits associated with responsible management can reinforce this community commitment. Involving local populations directly in environmental monitoring, reforestation, or agricultural diversification initiatives can foster a sense of ownership, encouraging their involvement [1,18,64].
The findings of this study underscore the ecological importance of establishing habitat corridors that connect historical rubber plantations with adjacent remnant natural forests to enhance landscape connectivity and bolster ecosystem resilience. Such connectivity is critical for facilitating gene flow, species dispersal, and the maintenance of ecological processes across fragmented tropical landscapes. Effective implementation of these corridors necessitates the active participation of local communities, achieved through targeted environmental education, capacity-building initiatives, and participatory monitoring frameworks. These community-based approaches align with national biodiversity conservation policies and complement ongoing REDD+ programs in DRC, thereby fostering synergistic outcomes for both conservation and sustainable development.
5. Conclusions
This study evaluated floristic richness and stand structure in historical rubber plantations of Sankuru Province (DRC), highlighting their potential role in biodiversity conservation within anthropized tropical landscapes. The findings indicate that these plantations are not merely simple monocultures but also significant habitats for various plant diversity. Floristic analysis revealed a variety of associated species that contribute to the balance of these ecosystems, including Plagiostyles africana (2.65%), Barteria nigritana (2.32%), Hymenocardia ulmoides (0.94%), Funtumia elastica (0.77%), Petersianthus macrocarpus (0.66%), Piptadeniastrum africanum (0.66%), Antiaris toxicaria (0.52%), Symphonia globulifera (0.50%), and Trilepisium madagascariense (0.48%).
The basal area exhibited statistical variation between plantations, with state plantations registering an average of 29.88 m2 ha−1 and peasant plantations registering an average of 41.37 m2 ha−1. The distribution of individuals in diameter classes resembles an inverted J-shaped exponential curve. This indicates a regular dynamic, denoting constant regeneration of the rubber tree and its flora over time. This inverted-J distribution indicates continuous recruitment and a stable regeneration dynamic. However, the structure of plantations is often influenced by cultivation practices and human intervention, requiring particular attention to avoid degradation. Acknowledging these trees’ pivotal function in sustaining local biodiversity and augmenting ecosystem services is imperative. Our findings underscore the need for agroecological interventions such as mixed-species enrichment and selective thinning to balance latex production with biodiversity conservation.
This study underscores the significance of a holistic approach to ensure that the economic potential offered by rubber plantations is leveraged without compromising their ecological value. The necessity for enhanced collaboration among local farmers, researchers, and policymakers is underscored when formulating sustainable initiatives that aspire to safeguard this distinctive natural heritage while addressing the socio-economic requirements of local communities. We recommend that peasant plantations, extension services, and policymakers jointly develop integrated agroforestry guidelines. Future research should quantify carbon sequestration under mixed-species canopies and assess socio-economic benefits for local communities. By implementing these strategies, Sankuru’s rubber plantations can become models of sustainable agricultural landscapes in the Congo Basin.
Author Contributions
J.M.T., S.S.N., O.L.R., and J.P.M.T.H., conceptualization, methodology, formal analysis; J.M.T. wrote the first draft of the article; J.P.A., Y.U.S., L.A.B., P.B.L., M.K.N., J.B.B., J.L.O.-A., J.M.M., and J.P.M.M. were responsible for proofreading the text; S.S.N., O.L.R., and J.P.M.T.H., validation and supervision. All authors have read and agreed to the published version of the manuscript.
Funding
This research was fully funded by the European Union/ENABEL Project: DeSIRA Agroforêt COD20006/DA 113220000037.
Institutional Review Board Statement
Not applicable.
Informed Consent Statement
Not applicable.
Data Availability Statement
The database can be available on a reasonable request.
Acknowledgments
The first author would like to thank the following individuals for their valuable support during the field survey: Pierre Albert Ngueliele, Albert Angbonga, François Tshamba, Victor Okitana, and Héritier Mpo†. We also express our sincere gratitude to the local populations for their active participation and indispensable contribution to the realization of this study. Furthermore, we warmly thank all the reviewers for their constructive and insightful comments, whose high-quality revisions significantly improved the clarity, rigor, and overall quality of the manuscript.
Conflicts of Interest
The authors declare no conflicts of interest.
Abbreviations
The following abbreviations are used in this manuscript:
| DBH | Diameter at Breast Height |
| G | Basal Area |
| DRC | Democratic Republic of the Congo |
| INERA | National Institute for Agronomic Study and Research |
| PI | Pioneer Index |
| NDVI | Normalized Difference Vegetation Index |
| NTFP | Non-Timber Forest Product |
| REDD+ | Reducing Emissions from Deforestation and Forest Degradation. The “+” refers to the Role of Conservation, Sustainable Forest Management, and Enhancement of Forest Carbon Stocks in Developing Countries |
References
- Tiko, J.M.; Ndjadi, S.S.; Obandza-ayessa, J.L.; Banga, D.B.; Balandi, J.B.; Musavandalo, C.M.; Pierre, J.; Mweru, M.; Michel, B.; Rakotondrasoa, O.L.; et al. Farmers’ Perception of Ecosystem Services Provided by Historical Rubber Plantations in Sankuru Province, DR Congo. Conservation 2025, 5, 7. [Google Scholar] [CrossRef]
- Michel, B.; Lumbuenamo, R.; Konunga, G.; Kasereka, P. Développement des Outils et Méthodes d’Aide à la Décision dans des Dires Protégées (AP) Diblées par le 11ème FED en République Démocratique du Congo, 2016; Union Européenne—Délégation en République Démocratique du Congo: Kinshasa, Democratic Republic of the Congo, 2017. [Google Scholar]
- Gitz, V.; Meybeck, A.; Pinizzotto, S.; Nair, L.; Penot, E.; Baral, H.; Xu, J. Sustainable Development of Rubber Plantations: Challenges and Opportunities. In Proceedings of the XV World Forestry Congress, Seoul, Republic of Korea, 2–6 May 2022; pp. 1–10. [Google Scholar]
- Lewis, S.L.; Edwards, D.P.; Galbraith, D. Increasing Human Dominance of Tropical Forests. Science 2015, 349, 827–832. [Google Scholar] [CrossRef] [PubMed]
- Li, H.; Aide, T.M.; Ma, Y.; Liu, W.; Cao, M. Demand for Rubber Is Causing the Loss of High Diversity Rain Forest in SW China. Biodivers. Conserv. 2007, 16, 1731–1745. [Google Scholar] [CrossRef]
- Patari, P.; Barma, M.D.; Devi, H.B.; Dasgupta, S. Large Scale Hevea Brasiliensis Plantation Impact on Non-Human Primate and Floral Diversity in Khowai District of Tripura. Environ. Ecol. 2023, 41, 1400–1407. [Google Scholar] [CrossRef]
- Lan, G.; Wu, Z.; Chen, B.; Xie, G. Species Diversity in a Naturally Managed Rubber Plantation in Hainan Island, South China. Trop. Conserv. Sci. 2017, 10, 1940082917712427. [Google Scholar] [CrossRef]
- Gouyon, A.; de Foresta, H.; Levang, P. Does ‘Jungle Rubber’ Deserve Its Name? An Analysis of Rubber Agroforestry Systems in Southeast Sumatra. Agrofor. Syst. 1993, 22, 181–206. [Google Scholar] [CrossRef]
- Wibawa, G.; Joshi, L.; Van Noordwijk, M.; Penot, E. Rubber Based Agroforestry Systems (RAS) as Alternatives for Rubber Monoculture System. In Proceedings of the International Natural Rubber Conference—IRRDB Annual Meeting, Ho Chi Minh City, Vietnam, 13–17 November 2006; p. 22. [Google Scholar]
- Beuve-Mery, J. Enquête Socio-Économique Dans Les Territoires de Lodja—Lomela—Kole, Province Du Sankuru, RDC Contribuant à La Formulation d’ Un Projet de Promotion Des Activités Génératrices de Revenu Dans La Zone d’ Influence Du Parc de La Salonga. Unpublished Master’s Thesis, Université de Liège, Liège, Belgique, 2015; p. 116. [Google Scholar]
- De Roover, E. Analyse de la chaîne de valeur hévéa selon la méthode VCA4D, dans les territoires de Lodja et Lomela, province du Sankuru, RDC, en vue de la relance de la filière. Unpublished Master’s Thesis, Université de Liège, Liège, Belgique, 2022. 109. Available online: https://matheo.uliege.be/bitstream/2268.2/13863/4/TFE_final_DEROOVER.pdf (accessed on 16 December 2024).
- Wang, Y.; Hollingsworth, P.M.; Zhai, D.; West, C.D.; Green, J.M.H.; Chen, H.; Hurni, K.; Su, Y.; Warren-Thomas, E.; Xu, J.; et al. High-Resolution Maps Show That Rubber Causes Substantial Deforestation. Nature 2023, 623, 340–346. [Google Scholar] [CrossRef] [PubMed]
- APROMAC. Production de Caoutchouc en Côte d’Ivoire. Available online: https://journals.plos.org/plosone/article?id=10.1371/journal.pone.0038970 (accessed on 18 December 2024).
- Ballo, E.K. Effet de Differentes Techniques Culturales sur les Parametres agro- Physiologiques et Sanitaires de l’Hevea (Hevea brasiliensis MUELL. ARG) au Sud-Ouest de la Côte d’Ivoire Candidat. 2019. Available online: https://dicames.online/jspui/handle/20.500.12177/4010?mode=full (accessed on 19 December 2024).
- Coulibaly, B. Évaluation de la capacité de séquestration de Carbone par une Plantation d’hévéa en Côte d’Ivoire; Centre National de Recherche Agronomique (CNRA): Abidjan, Côte d’Ivoire, 2023. [Google Scholar]
- Nsele, M.K.; Ndjadi, S.S.; Musavandalo, C.M.; Mujike, D.N.; Bachinyaga, I.M.; Kalumbu, J.T.; Mutwedu, E.M.; Tiko, J.M.; Murhula, S.I.; Tshamba Y’onyowokoma, F.; et al. Community Perceptions and Determinants of the Sustained Conservation of Historical Rubber Plantations in the Lomela and Lodja Territories, Sankuru Province, Democratic Republic of the Congo. Conservation 2025, 5, 33. [Google Scholar] [CrossRef]
- Enabel. Description de l’action. In Neutralité Climatique, Conservation et économie Verte à Partir d’une Filière Hévéa Inclusive dans les Territoires de Lomela et Lodja (Province du Sankuru); Enabel: Bruxelles, Belgium, 2022; Volume 32, pp. 1–39. Available online: https://www.google.com/url?sa=t&source=web&rct=j&opi=89978449&url=https://capacity4dev.europa.eu/media/127576/download/6b4f3f2d-8b32-4267-94b2-72f8b4953b40_en&ved=2ahUKEwisjJ_OsZqLAxVbr1YBHfKBIG0QFnoECBIQAQ&usg=AOvVaw0N_YbUHrjYaX1gPjI5tqtl (accessed on 3 June 2023).
- Tiko, J.M.; Ndjadi, S.S.; Obandza-ayessa, J.L.; Pierre, J.; Mweru, M.; Michel, B.; Beeckman, H.; Rakotondrasoa, O.L.; Pierre, J.; To, M. Carbon Sequestration Potential in Rubber Plantations: A Complementary Approach to Tropical Forest Conservation Strategies, a Review. Earth 2025, 6, 21. [Google Scholar] [CrossRef]
- Singh, W.; Zakari, S.; Wu, J.; Yang, B.; Jiang, X.J.; Zhu, X.; Zou, X.; Zhang, W.; Chen, C.; Singh, R.; et al. A Global Review of Rubber Plantations: Impacts on Ecosystem Functions, Mitigations, Future Directions, and Policies for Sustainable Cultivation. Sci. Total Environ. 2021, 796, 148948. [Google Scholar] [CrossRef] [PubMed]
- da Silva, L.P.; Heleno, R.H.; Costa, J.M.; Valente, M.; Mata, V.A.; Gonçalves, S.C.; da Silva, A.A.; Alves, J.; Ramos, J.A. Natural Woodlands Hold More Diverse, Abundant, and Unique Biota than Novel Anthropogenic Forests: A Multi-Group Assessment. Eur. J. For. Res. 2019, 138, 461–472. [Google Scholar] [CrossRef]
- Dow Goldman, E.; Weisse, M.; Harris, N.; Schneider, M. Estimating the Role of Seven Commodities in Agriculture-Linked Deforestation: Oil Palm, Soy, Cattle, Wood Fiber, Cocoa, Coffee, and Rubber; World Resources Institute: Washington, DC, USA, 2020; pp. 1–22. [Google Scholar] [CrossRef]
- Descals, A.; Wich, S.; Meijaard, E.; Gaveau, D.L.A.; Peedell, S.; Szantoi, Z. High-Resolution Global Map of Smallholder and Industrial Closed-Canopy Oil Palm Plantations. Earth Syst. Sci. Data 2021, 13, 1211–1231. [Google Scholar] [CrossRef]
- Carlson, K.M.; Curran, L.M.; Ratnasari, D.; Pittman, A.M.; Soares-Filho, B.S.; Asner, G.P.; Trigg, S.N.; Gaveau, D.A.; Lawrence, D.; Rodrigues, H.O. Committed Carbon Emissions, Deforestation, and Community Land Conversion from Oil Palm Plantation Expansion in West Kalimantan, Indonesia. Proc. Natl. Acad. Sci. USA 2012, 109, 7559–7564. [Google Scholar] [CrossRef] [PubMed]
- Zou, R.; Sultan, H.; Muse Muhamed, S.; Khan, M.N.; Pan, J.; Liao, W.; Li, Q.; Cheng, S.; Tian, J.; Cao, Z.; et al. Sustainable Integration of Rubber Plantations within Agroforestry Systems in China: Current Research and Future Directions. Plant Sci. Today 2024, 11, 421–431. [Google Scholar] [CrossRef]
- Qi, D.; Wu, Z.; Yang, C.; Tao, Z.; Zhao, L.; Zhang, Y.; Fu, Q. Exploration and Practice of Rubber Based Agroforestry Complex Systems in China. Adv. Biosci. Biotechnol. 2023, 14, 479–491. [Google Scholar] [CrossRef]
- Lisingo, J. Organisation Spatiale de La Diversité Spécifique d’arbres En Forêt Tropicale Dans Le Bassin Nord-Est de La Cuvette Centrale Congolaise Département d’Ecologie et Gestion Des Ressources Végétales. Ph.D. Thesis, University of Kisangani, Kisangani, Democratic Republic of the Congo, 2016. [Google Scholar]
- Ngueliele, A. La Problématique de la Gestion Des Déchets Liquides Dans la Province du Sankuru en République Démocratique du CONGO. Unpublished P.h.D. Thesis, Université Libre de Bruxelles, Bruxelles, Belgium, 2022. [Google Scholar]
- Picard, N. Manuel de Construction d’ Équations Allométriques Pour l’Estimation Du Volume et La Biomasse Des Arbres; Food and Agriculture Organization of the United Nations: Rome, Italy, 2012. [Google Scholar]
- Apg, I.V. An Update of the Angiosperm Phylogeny Group Classification for the Orders and Families of Flowering Plants: APG IV. Bot. J. Linn. Soc. 2016, 181, 1–20. [Google Scholar] [CrossRef]
- R Core Team. A Language and Environment for Statistical Computing—[Logiciel]; R Foundation for Statistical Computing: Vienna, Austria, 2023. [Google Scholar]
- Beina, D. Diversité Floristique de La Forêt Dense Semi-Décidue de Mbaïki, En République Centrafricaine: Étude Expérimentale de l’impact de Deux Types d’intervention Sylvicole. Ph.D. Thesis, Université de Picardie Jules Verne, Amiens, France, 2011; p. 218. [Google Scholar]
- Hamiliton, A. African Forests. In Tropical Rain Forest Ecosystems: Biogeographical and Ecological Studies (Ecosystems of the World 14B); Leith, H., Werger, M.J.A., Eds.; Elsevier: Amsterdam, The Netherlands, 1989; Volume 4, pp. 155–182. [Google Scholar]
- Senterre, B. Recherches Méthodologiques Pour La Typologie de La Végétation et La Phytogéographie Des Forêts Denses d’Afrique Tropicale. Acta Bot. Gall. 2005, 152, 409–419. [Google Scholar] [CrossRef]
- Tchouto, M.G.P.; De Boer, W.F.; De Wilde, J.J.F.E.; Van der Maesen, L.J.G. Diversity Patterns in the Flora of the Campo-Ma’an Rain Forest, Cameroon: Do Tree Species Tell It All? Biodivers. Conserv. 2006, 15, 1353–1374. [Google Scholar] [CrossRef]
- Nhimba, S.M. Étude floristique, écologique et phytosociologique des forêts de l’île Mbiye à Kisangani, République Démocratique du Congo. P.h.D. Thesis, Université libre de Bruxelles, Faculté des Sciences—Sciences biologiques, Bruxelles, Belgium, 2008. [Google Scholar]
- Lebrun, J.P.; Stork, A.L.; Goldblatt, P.; Gautier, L.; Polhill, R.M. Enumération Des Plantes à Fleurs d’Afrique Tropicale; Conservatoire et Jardin Botaniques de la Ville de Geneve: Genève, Switzerland, 1997; Volume 4, p. 178. [Google Scholar]
- Ndjele, M. Les Éléments Phytogéographiques Endémiques Dans La Flore Vasculaire Du Zaïre. Ph.D. Thesis, Université Libre de Bruxelles, Bruxelles, Belgium, 1998. [Google Scholar]
- Sonké, B. Études floristiques et structurales des forêts de la Réserve de Faune du Dja (Cameroun). Ph.D. Thesis, Faculté des Sciences, Université Libre de Bruxelles (ULB), Bruxelles, Belgium, 1998; p. 267. [Google Scholar]
- Collier, J. L’hévéaculture chez les autochtones du Nord-Sankuru. Bulletin Agricole du Congo belge. 1957. Vol. XLVIII, N°6, p. 1465. Available online: https://www.abebooks.com/book-search/title/bulletin-agricole-du-congo-belge/?utm_source=chatgpt.com (accessed on 3 June 2023).
- Fox, J. Using the R Commander; Chapman and Hall/CRC: Boca Raton, FL, USA, 2017. [Google Scholar] [CrossRef]
- Fox, J.; Bouchet-Valat, M. Rcmdr: R Commander (2.9-2) [Logiciel]. 2024. Available online: https://cran.r-project.org/web/packages/Rcmdr/index.html (accessed on 16 December 2024).
- Hawthorne, W. Holes and the Sums of Parts in Ghanaian Forest: Regeneration, Scale and Sustainable Use. Proc. R. Soc. Edinb. Sect. B Biol. Sci. 1996, 104, 75–176. [Google Scholar] [CrossRef]
- Aya Diane, H.L. Biodiversité et Gestion Durable Des Ecosystèmes Végétation Des Zones Anciennement Occupées Par Les Plantations Au Sud-Est Du Parc National de Taï (Sud-Ouest de La Côte d’Ivoire). Geoscience 2023. [Google Scholar] [CrossRef]
- Picard, N.; Saint-André, L.; Henry, M. Manual for Building Tree Volume and Biomass Allometric Equations: From Field Measurement to Prediction. Manual for Building Tree Volume and Biomass Allometric Equations: From Field Measurement to Prediction, FAO; Food and Agricultural Organization of the United Nations: Rome, Italy, 2012. [Google Scholar]
- Bauwens, S.; Fayolle, A. Protocole de Collecte Des Données Sur Le Terrain et Au Laboratoire Nécessaires Pour Quantifier La Biomasse Aérienne Des Arbres et Pour l’établissement d’équations Allométriques; Nature +: London, UK, 2014. [Google Scholar]
- Shannon, C.E. A Mathematical Theory of Communication. Bell Syst. Tech. J. 1948, 27, 379–423. [Google Scholar] [CrossRef]
- Simpson, E.H. Measurement of Diversity. Nature 1949, 163, 688. [Google Scholar] [CrossRef]
- Pielou, E.C. Shannon’s Formula as a Measure of Specific Diversity: Its Use and Misuse. Am. Nat. 1966, 100, 463–465. [Google Scholar] [CrossRef]
- Hammer, Ø.; Harper, D.A.T.; Ryan, P.D. Past: Paleontological Statistics Software Package for Education and Data Analysis. Palaeontol. Electron. 2001, 4, 9. [Google Scholar]
- Felfili, J.M.; da Silva Júnior, M.C.; Sevilha, A.C.; Fagg, C.W.; Teles Walter, B.M.; Nogueira, P.E.; Rezende, A.V. Diversity, Floristic and Structural Patterns of Cerrado Vegetation in Central Brazil. Plant Ecol. 2004, 175, 37–46. [Google Scholar] [CrossRef]
- Magurran, A.E. Measuring Biological Diversity. 2004, p. 264. Available online: http://www2.ib.unicamp.br/profs/thomas/NE002_2011/maio10/Magurran%202004%20c2-4.pdf (accessed on 1 June 2025).
- Sørensen, T. A Method of Establishing Groups of Equal Amplitude in Plant Sociology Based on Similarity of Species and Its Application to Analyses of the Vegetation on Danish Commons. Biol. Shrifter 2024, 4, 1–32. [Google Scholar]
- Lokonda, M. Structure Forestière, Propriétés Physico-Chimiques Du Sol et Indices Pédo-Anthracologiques de Perturbations Comparés Entre La Forêt Monodominante à Gilbertiodendron Dewevrei (De Wild.) J. Léonard et La Forêt Mixte Adjacente. Cas de La Réserve Forestière. Ph.D. Thesis, Université de Kisangani, Kisangani, Democratic Republic of the Congo, 2018. [Google Scholar]
- Gillet, J. Mosaïque Forestière Du Nord de La République Du Congo: Origines et Modalités de Gestion Du Congo: Origines et Modalités de Gestion. République du Congo. 2013. Available online: https://agris.fao.org/search/en/providers/122397/records/64738c6cce9437aa76febe17 (accessed on 16 December 2024).
- Kasekete, D.K.; Ligot, G.; Mweru, J.P.M.; Drouet, T.; Rousseau, M.; Moango, A.; Bourland, N. Growth, Productivity, Biomass and Carbon Stock in Eucalyptus Saligna and Grevillea Robusta Plantations in North Kivu, Democratic Republic of the Congo. Forests 2022, 13, 1508. [Google Scholar] [CrossRef]
- Doucet, J.-L. L’alliance Délicate de La Gestion Forestière et de La Biodiversité Dans Les Forêts Du Centre de Gabon. Ph.D. Thesis, Faculté Universitaire des Sciences Agronomiques de Gembloux, Gembloux, Belgium, 2003; p. 323. [Google Scholar] [CrossRef]
- Sonké, B. Forêts de La Reserve Du Dja (Cameroun), Études Floristiques et Structurales. Scr. Bot. Belg. 2004, 32, 144. [Google Scholar]
- Gonmadje, C.F.; Doumenge, C.; Sunderland, T.C.H.; Balinga, M.P.B.; Sonké, B. Analyse Phytogéographique Des Forêts d’Afrique Centrale: Le Cas Du Massif de Ngovayang (Cameroun). Plant Ecol. Evol. 2012, 145, 152–164. [Google Scholar] [CrossRef]
- Hubau, W.; Lewis, S.L.; Phillips, O.L.; Affum-Baffoe, K.; Beeckman, H.; Cuní-Sanchez, A.; Daniels, A.K.; Ewango, C.E.N.; Fauset, S.; Mukinzi, J.M.; et al. Asynchronous Carbon Sink Saturation in African and Amazonian Tropical Forests. Nature 2020, 579, 80–87. [Google Scholar] [CrossRef] [PubMed]
- Blanc, L. Les Formations Forestières Du Parc National de Cat Tien (Viêtnam): Caractérisation Structurale et Floristique, Étude de La Régénération Naturelle et de La Dynamique Successionnelle. Ph.D. Thesis, Université Claude Bernard-Lyon, Villeurbanne, France, 1998. [Google Scholar]
- Phillips, O.L.; Martínez, R.V.; Vargas, P.N.; Monteagudo, A.L.; Zans, M.E.C.; Sánchez, W.G.; Cruz, A.P.; Timaná, M.; Yli-Halla, M.; Rose, S. Efficient Plot-Based Floristic Assessment of Tropical Forests Oliver. J. Trop. Ecol. 2003, 19, 629–645. [Google Scholar] [CrossRef]
- Kouob, B.S. Organisation de La Diversité Végétale Dans Les Forêts Matures de Terre Ferme Du Sud-Est Cameroun. Ph.D. Thesis, Université Libre de Bruxelles, Brussels, Belgium, 2009; p. 188. [Google Scholar]
- Amani, C. Vegetation Patterns and Role of Edaphic Heterogeneity on Plant Communities in Semi-Deciduous Forests from the Congo Basin; Universite Libre De Bruxelles: Brussel, Belgium, 2011; pp. 2010–2011. [Google Scholar]
- Mobunda, J.; Ndongo, E.; Miafuntila, B.P.; Ebwa, J.; Meniko, J.P. Analyse Socio-Environnementale Des Indicateurs de La Dynamique Du Climat Tels Que Perçus Par La Population Riveraine de La Réserve Forestière de Masako. Rev. Marocaine Sci. Agron. Vétérinaires 2020, 8, 151–157. [Google Scholar]
- Bustillo, E.; Raets, L.; Beeckman, H.; Bourland, N.; Rousseau, M.; Hubau, W.; De Mil, T. Evaluation Du Potentiel Énergétique de La Biomasse Aérienne Ligneuse Des Anciennes Plantations de l’INERA Yangambi; CIFOR: Bogor, Indonesia, 2018. [Google Scholar]
- Yuan, X.; Yang, B.; Liu, W.; Wu, J.; Li, X. Intercropping with Cash Crops Promotes Sustainability of Rubber Agroforestry: Insights from Litterfall Production and Associated Carbon and Nutrient Fluxes. Eur. J. Agron. 2024, 154, 127071. [Google Scholar] [CrossRef]
- Anahendo, F. Contribution à l’Étude Des Forets Sacrées Du Secteur Lukumbe En République Démocratique Du Congo. Mouv. Enjeux Sociaux 2022, 122, 94–101. [Google Scholar]
- Ayingweu, C.L. Analyse Phytogeographique de La Flore Forestiere Du Secteur Du Kasai Au Congo-Kinshasa. Syst. Geogr. Plants 2001, 71, 859. [Google Scholar] [CrossRef]
- Leplae, E. La Culture de l’Hévéa Au Congo Belge. Rev. Bot. Appliquée D’agriculture Colon. 1926, 6, 204–218. [Google Scholar] [CrossRef]
- Meniko, T.H.; Drazo, A.; Iyongo, L.; Mweru, M.; Akaibe, D.; Bogaert, J. Affiliation Aux Habitats et Mobilité Spécifique de Rongeurs Dans Un Paysage Fragmenté à Masako. In Les Forêts de la Tshopo: Écologie, Histoire et Composition; Presses Agronomiques de Gembloux: Gembloux, Belgium, 2020; p. 31. [Google Scholar]
- Joshi, L. Jungle Rubber: A Traditional Agroforestry System Under Pressure; International Centre for Research in Agroforestry (ICRAF): Bogor, Indonesia, 2002. [Google Scholar]
- Awokou, K.; Ganglo, C.; Azontondé, H.; Adjakidje, V.; De Foucault, B. Caractéristiques Structurales et Écologiques Des Phytocénoses Forestières de La Forêt Classée d’itchèdè (Département Du Plateau, Sud-Est Bénin). Sci. Nat. 2009, 6, 127–139. [Google Scholar] [CrossRef]
- Devineau, J.L. Structure et Dynamique de Quelques Forets Tropophiles del’ Ouest Africain (Cote d’ivoire). Ph.D. Thesis, Université Pierre et Marie Curie-Paris VI, Paris, France, 2009; p. 71. [Google Scholar]
- Schnitzer, S.A.; Bongers, F. Increasing Liana Abundance and Biomass in Tropical Forests: Emerging Patterns and Putative Mechanisms. Ecol. Lett. 2011, 14, 397–406. [Google Scholar] [CrossRef] [PubMed]
- Appiah-Badu, K.; Anning, A.K.; Eshun, B.; Mensah, G. Land Use Effects on Tree Species Diversity and Soil Properties of the Awudua Forest, Ghana. Glob. Ecol. Conserv. 2022, 34, e02051. [Google Scholar] [CrossRef]
- Norden, N.; Chazdon, R.L.; Chao, A.; Jiang, Y.; Vílchez-Alvarado, B. Resilience of Tropical Rain Forests: Tree Community Reassembly in Secondary Forests. Ecol. Lett. 2009, 12, 385–394. [Google Scholar] [CrossRef] [PubMed]
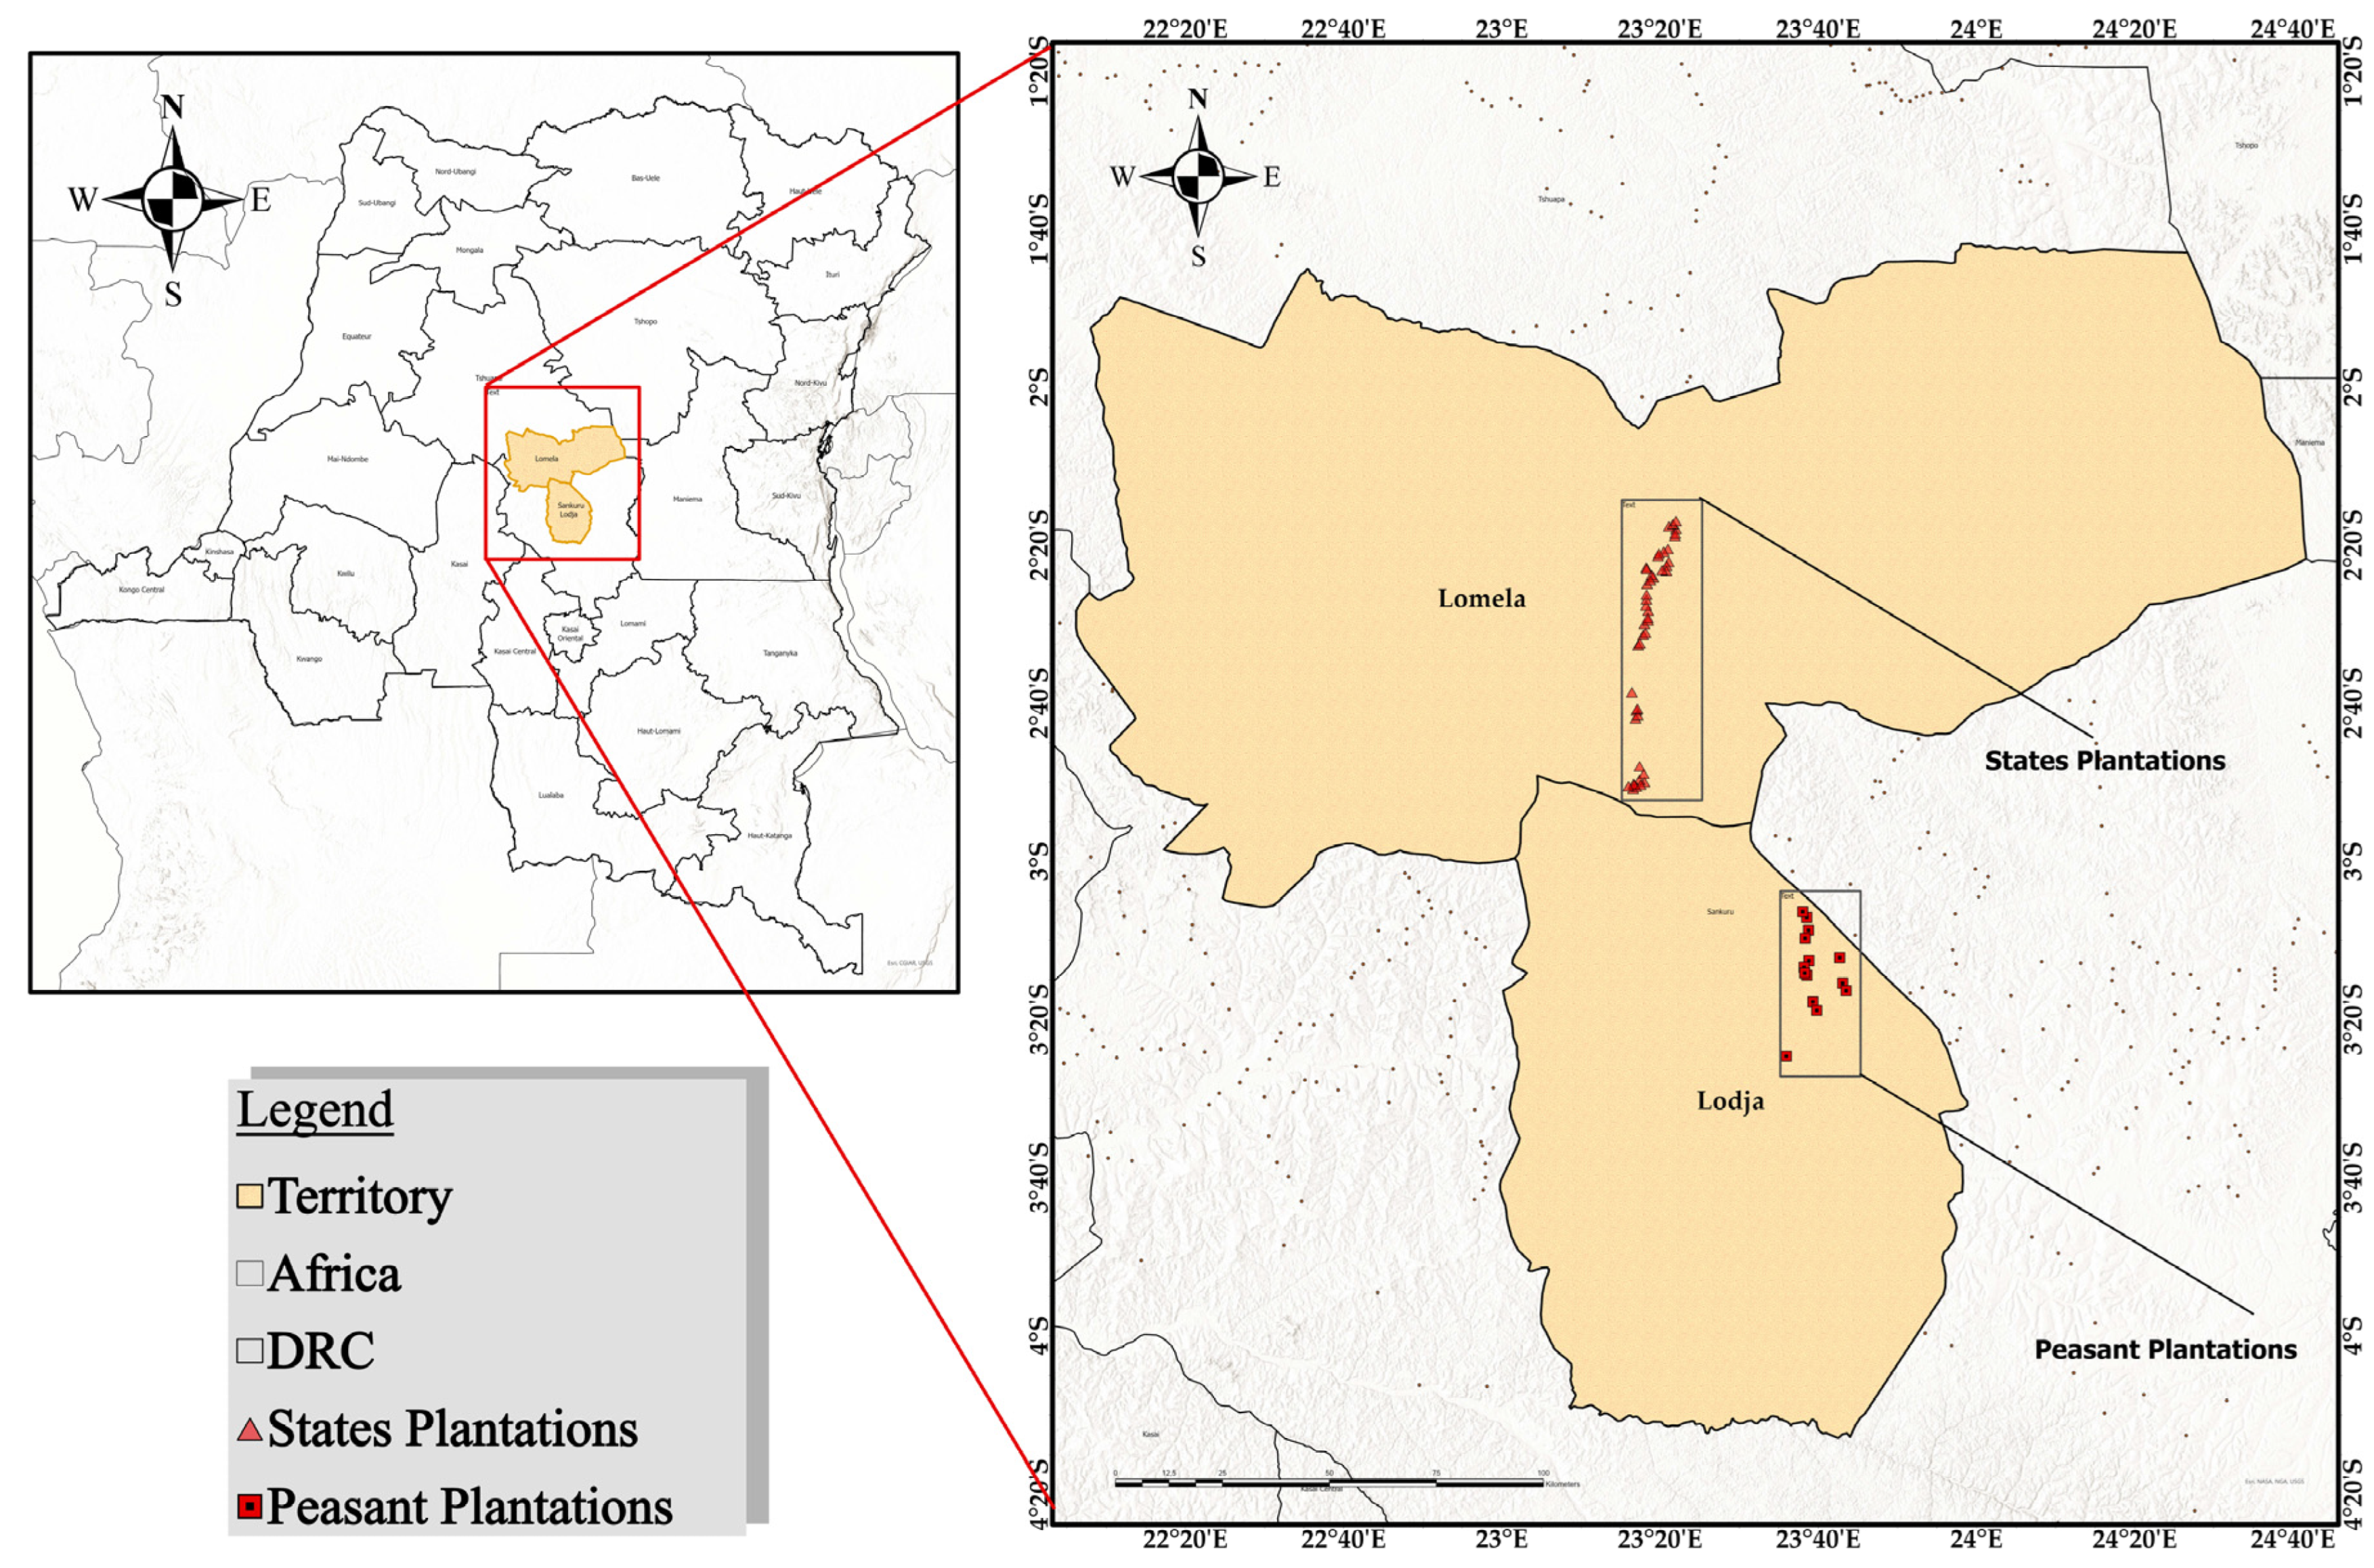
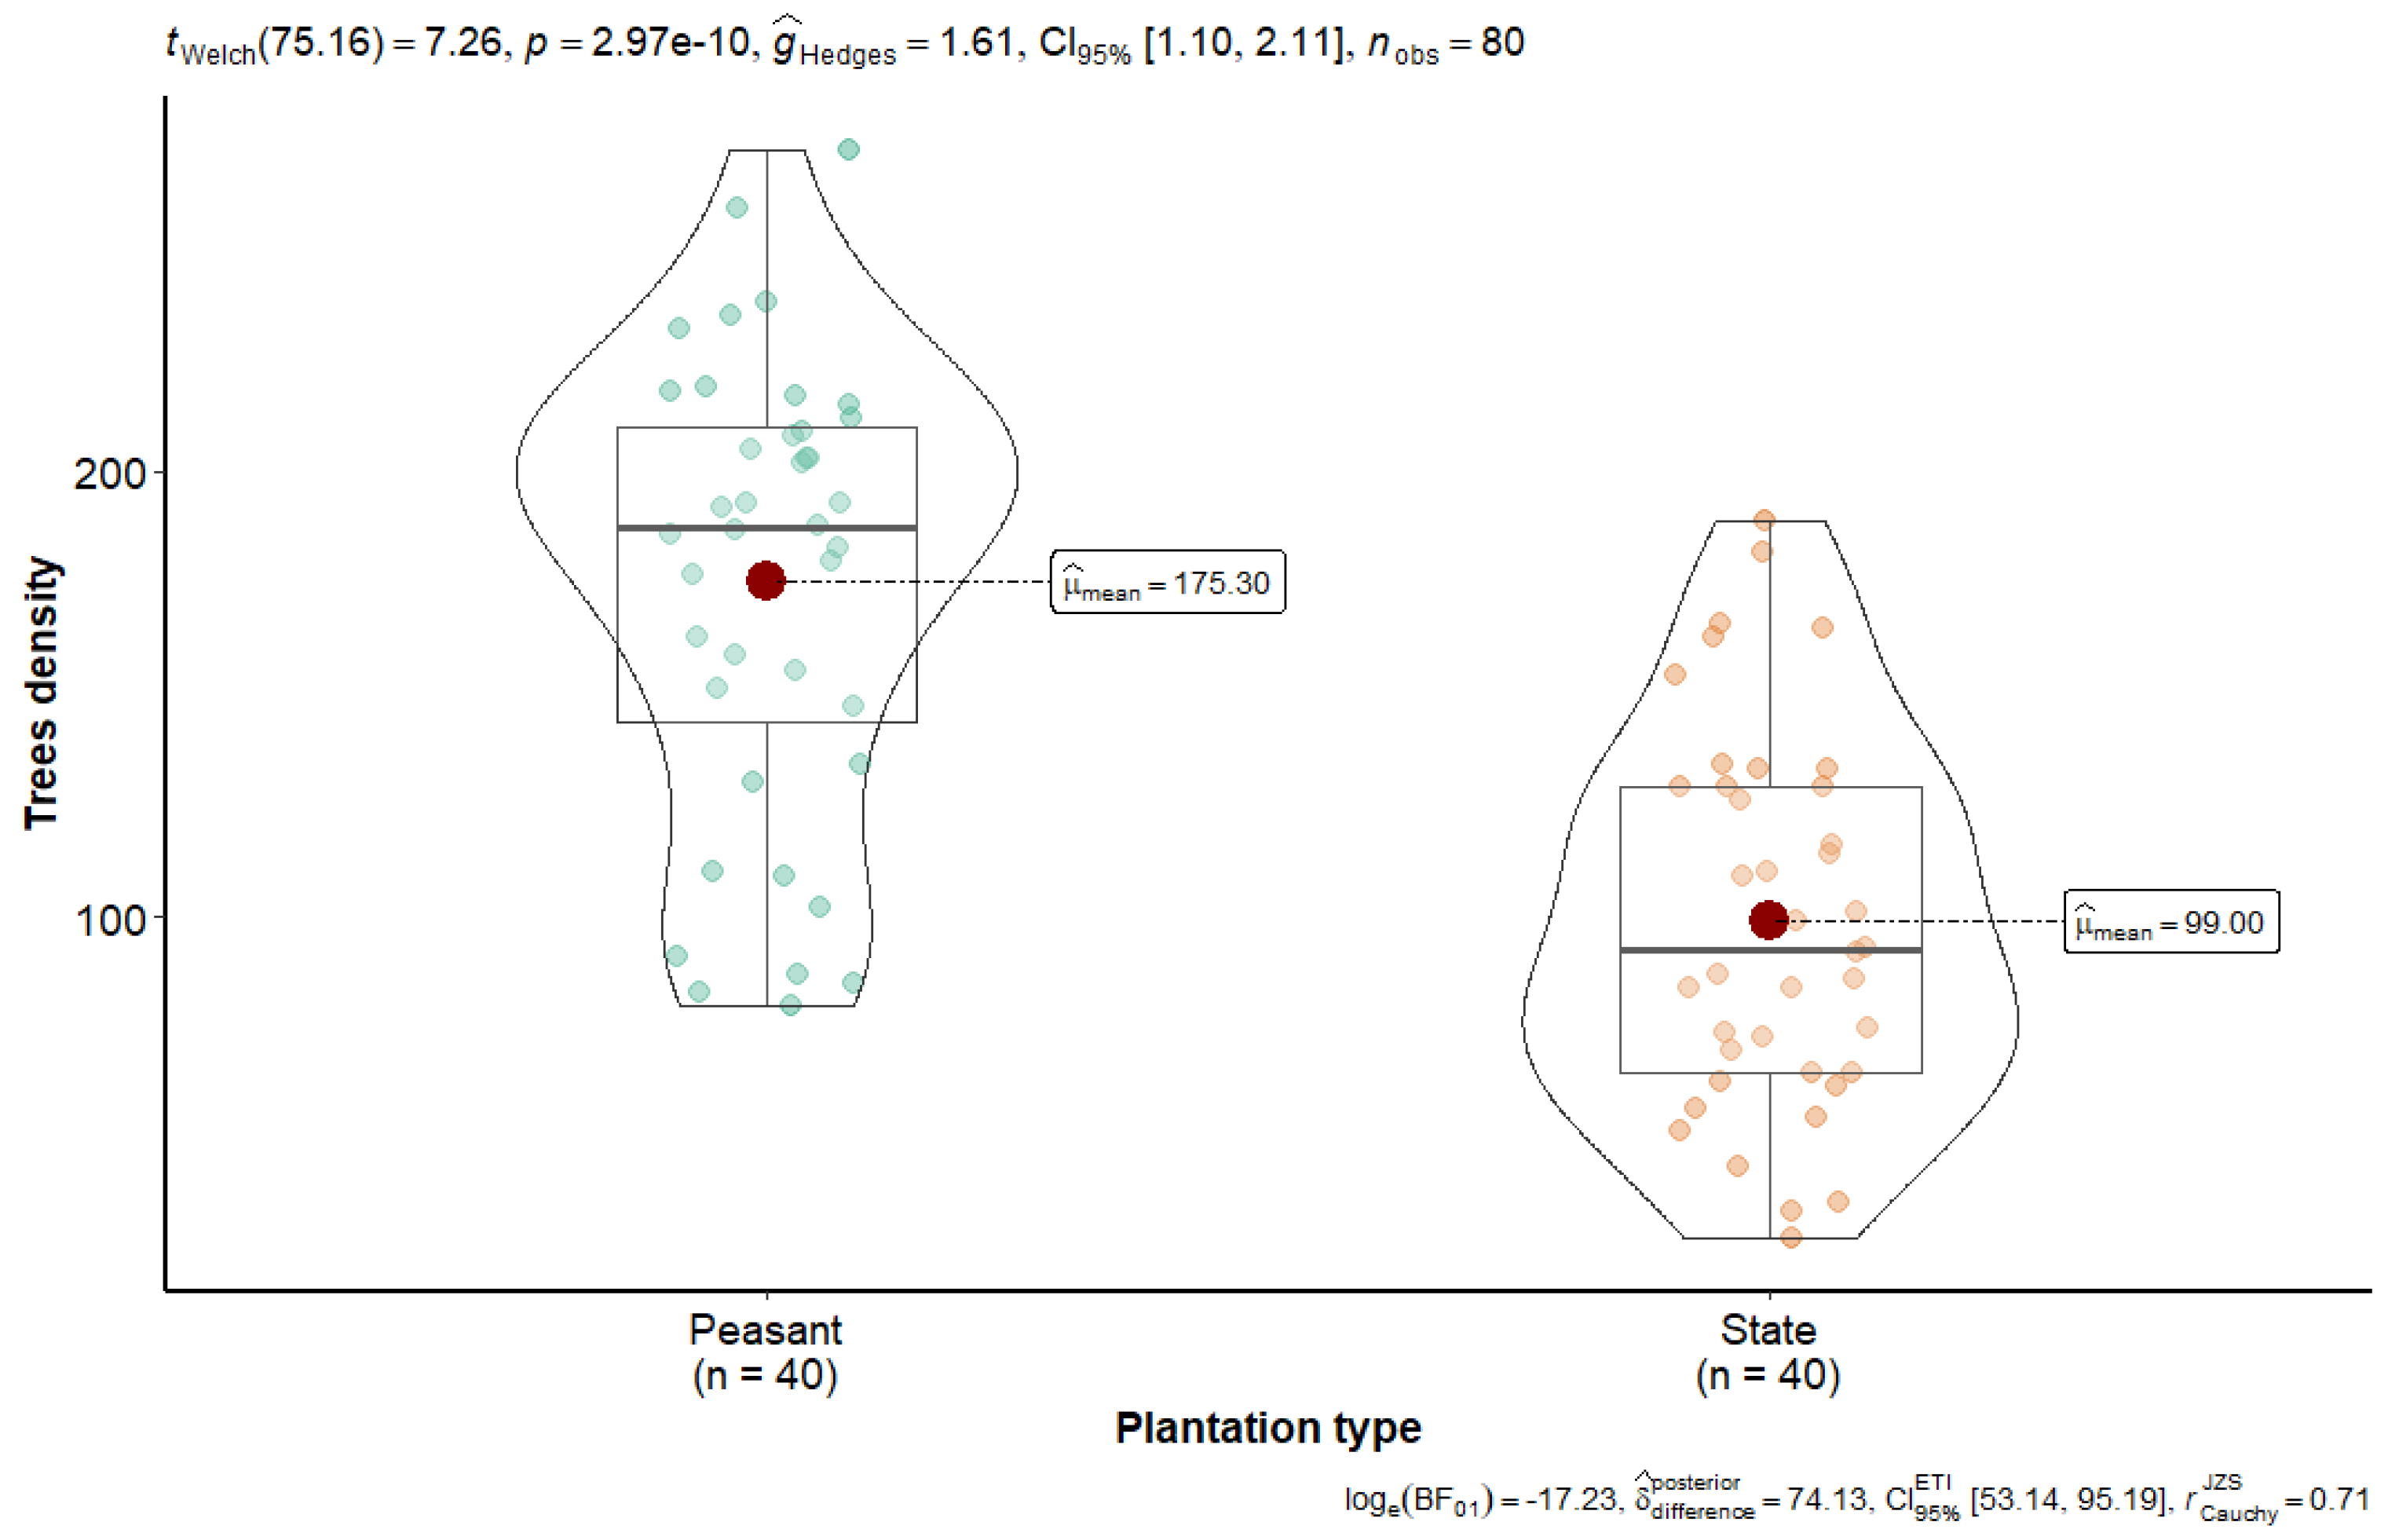
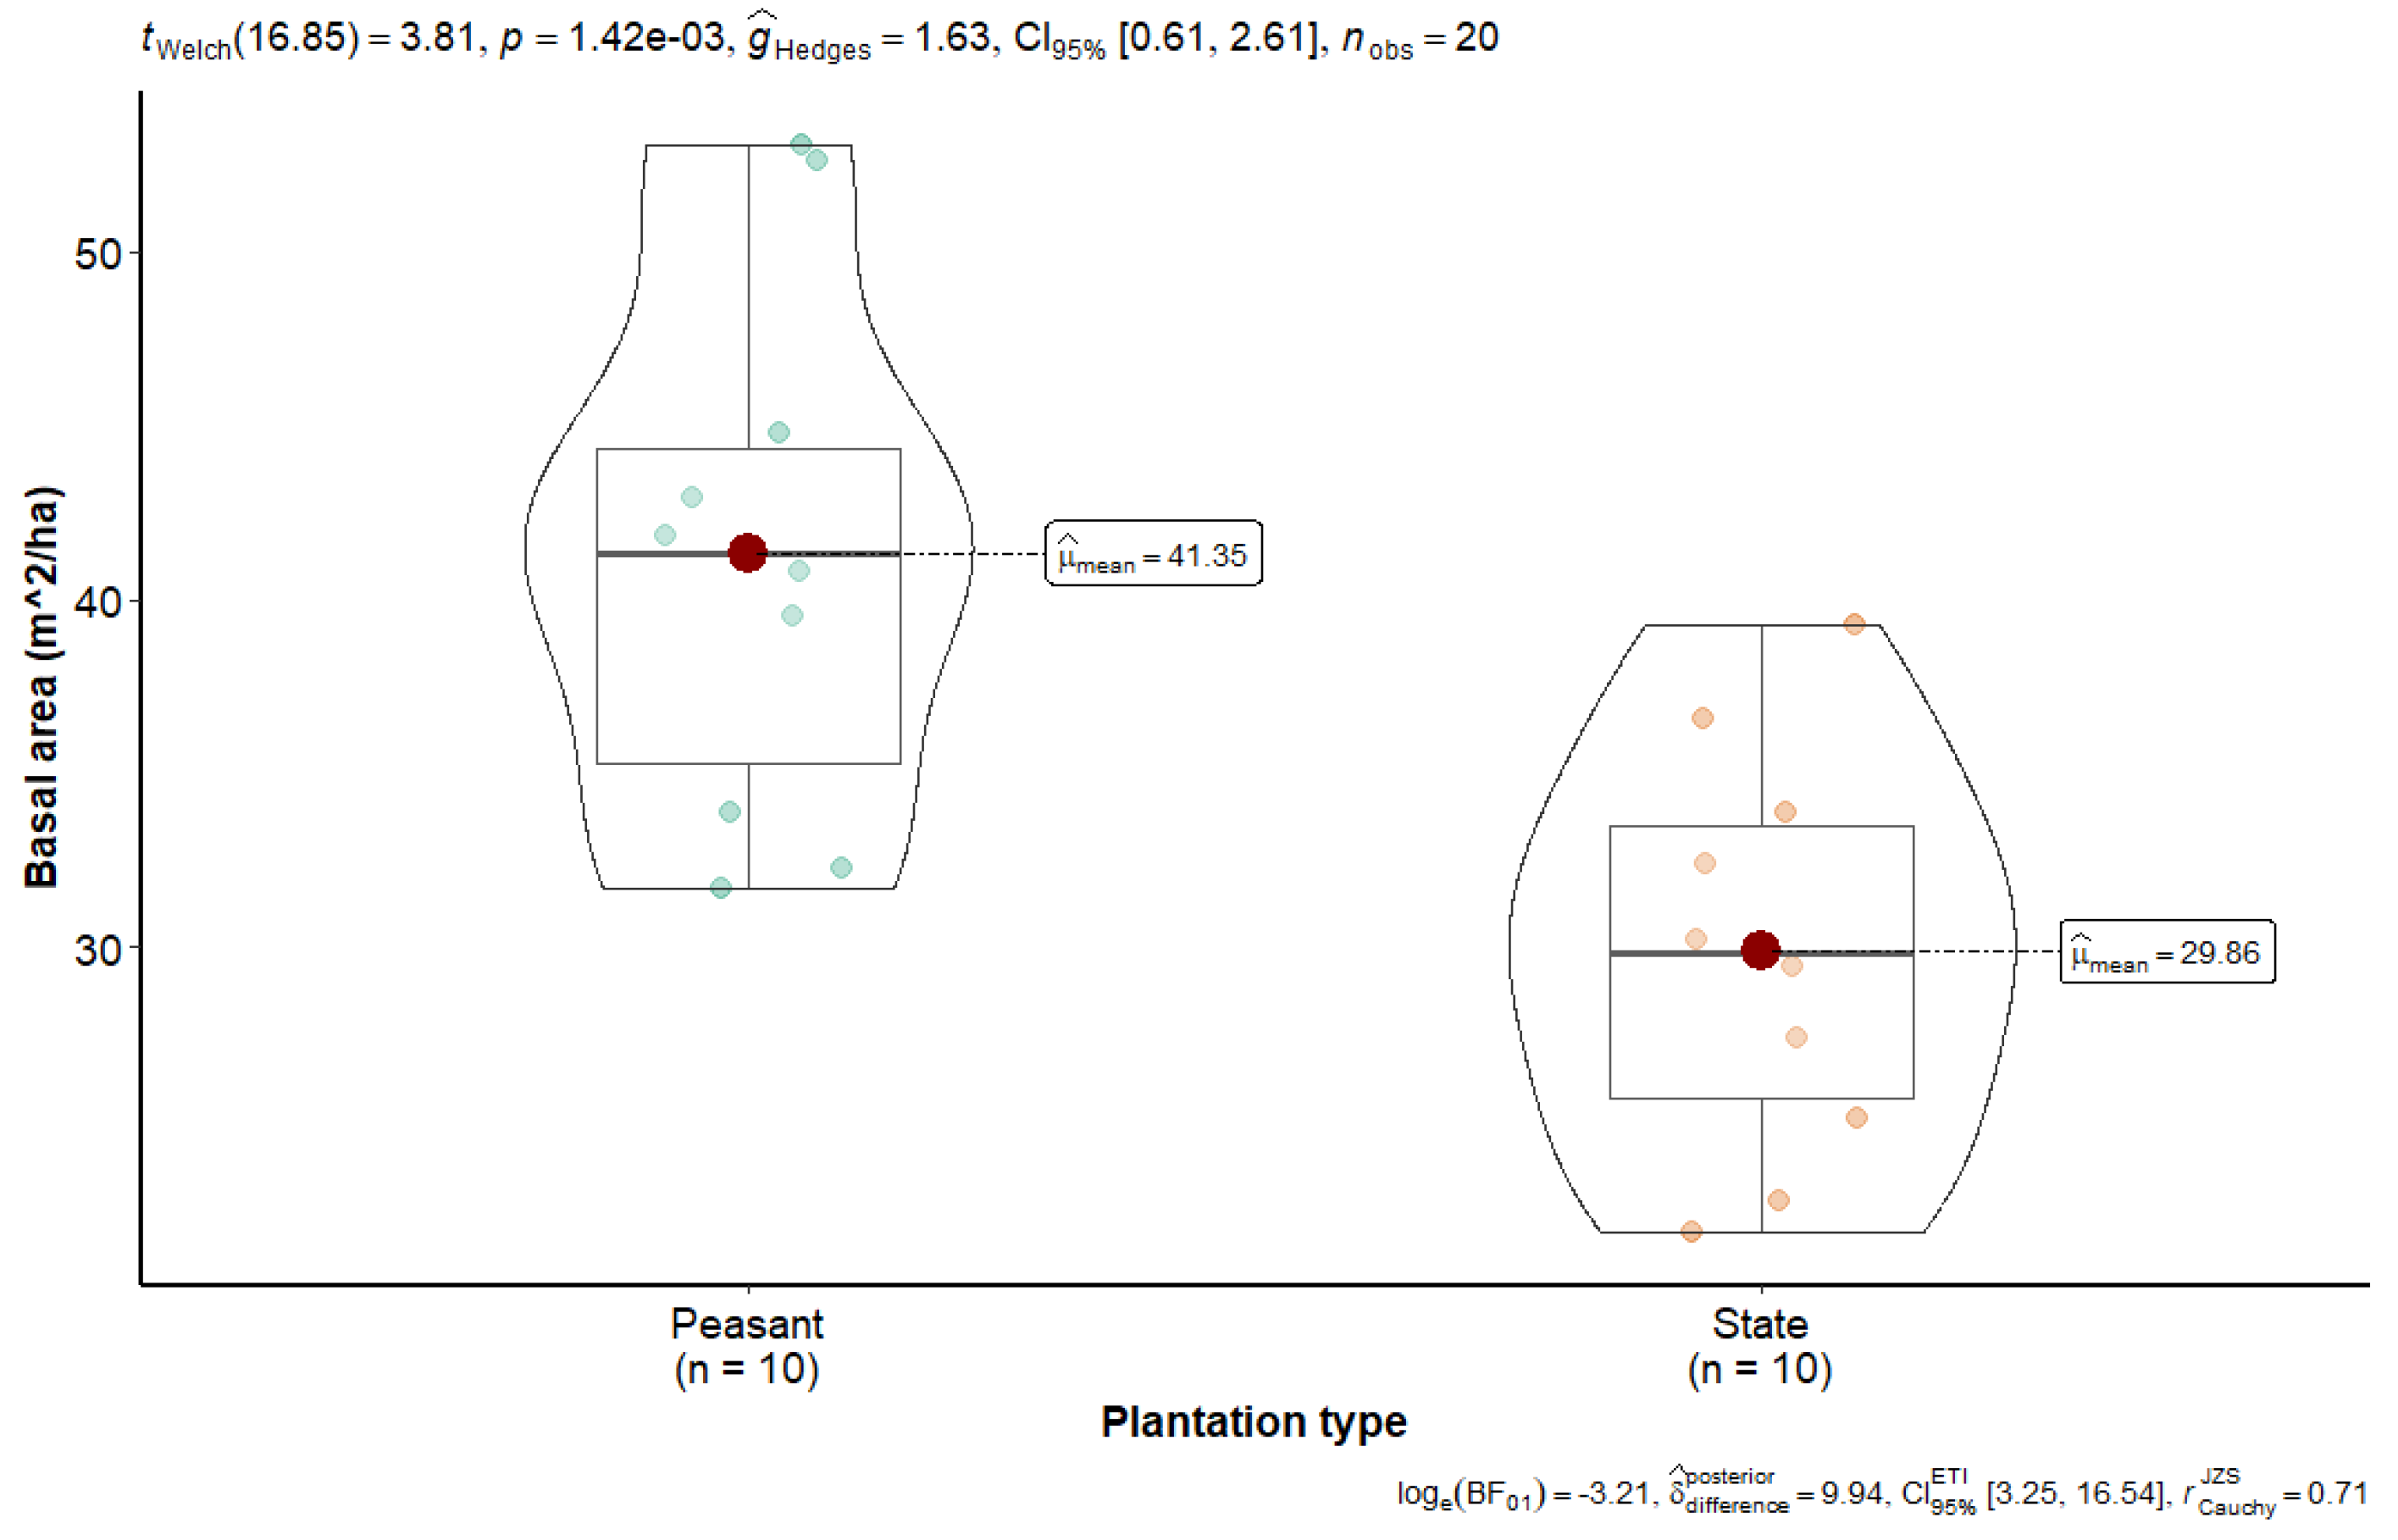
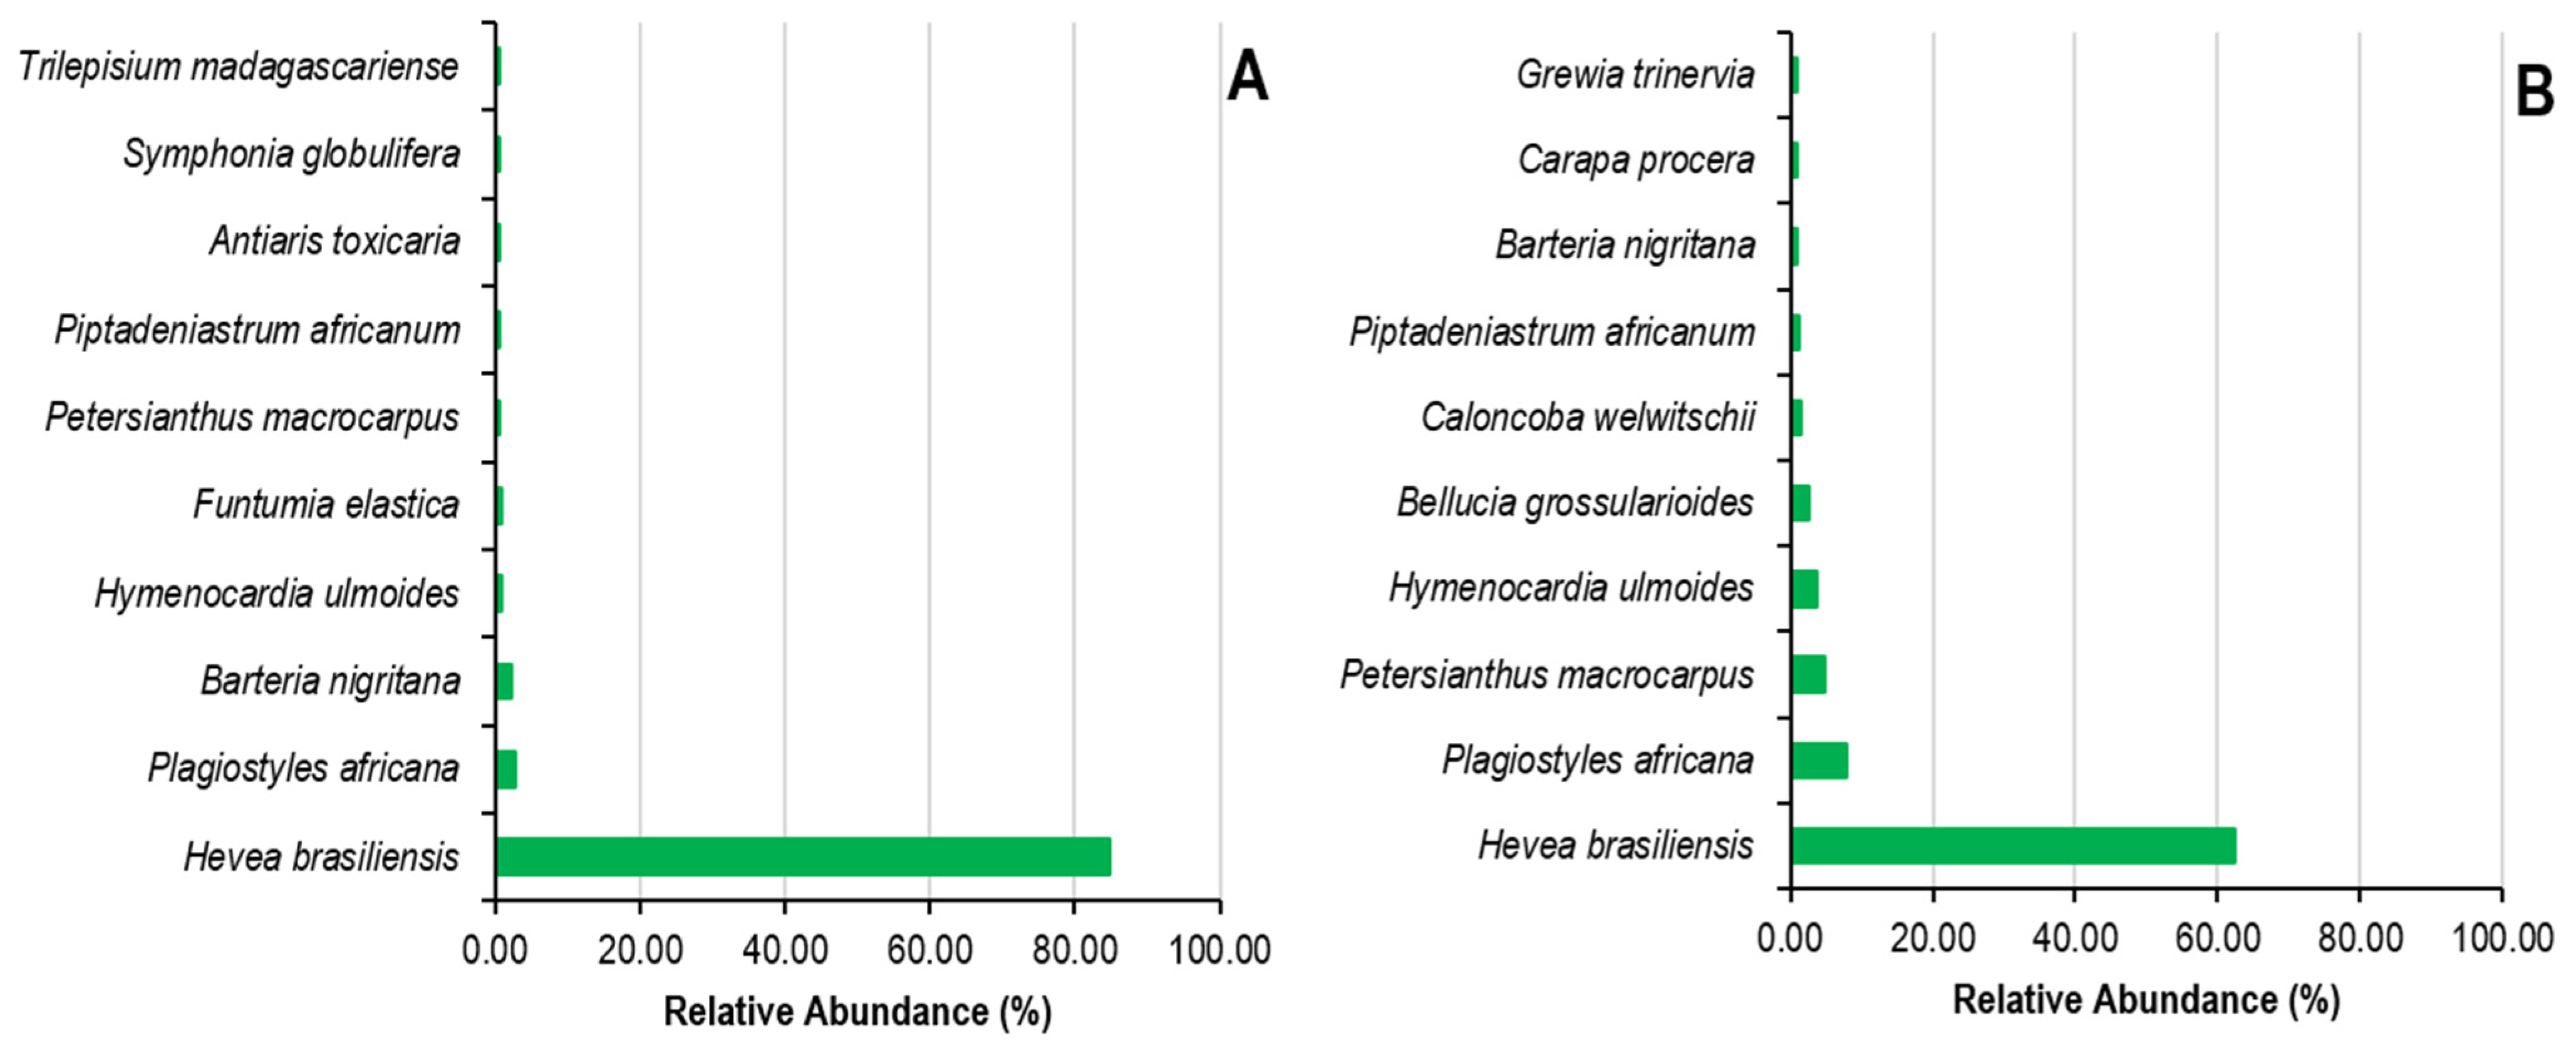
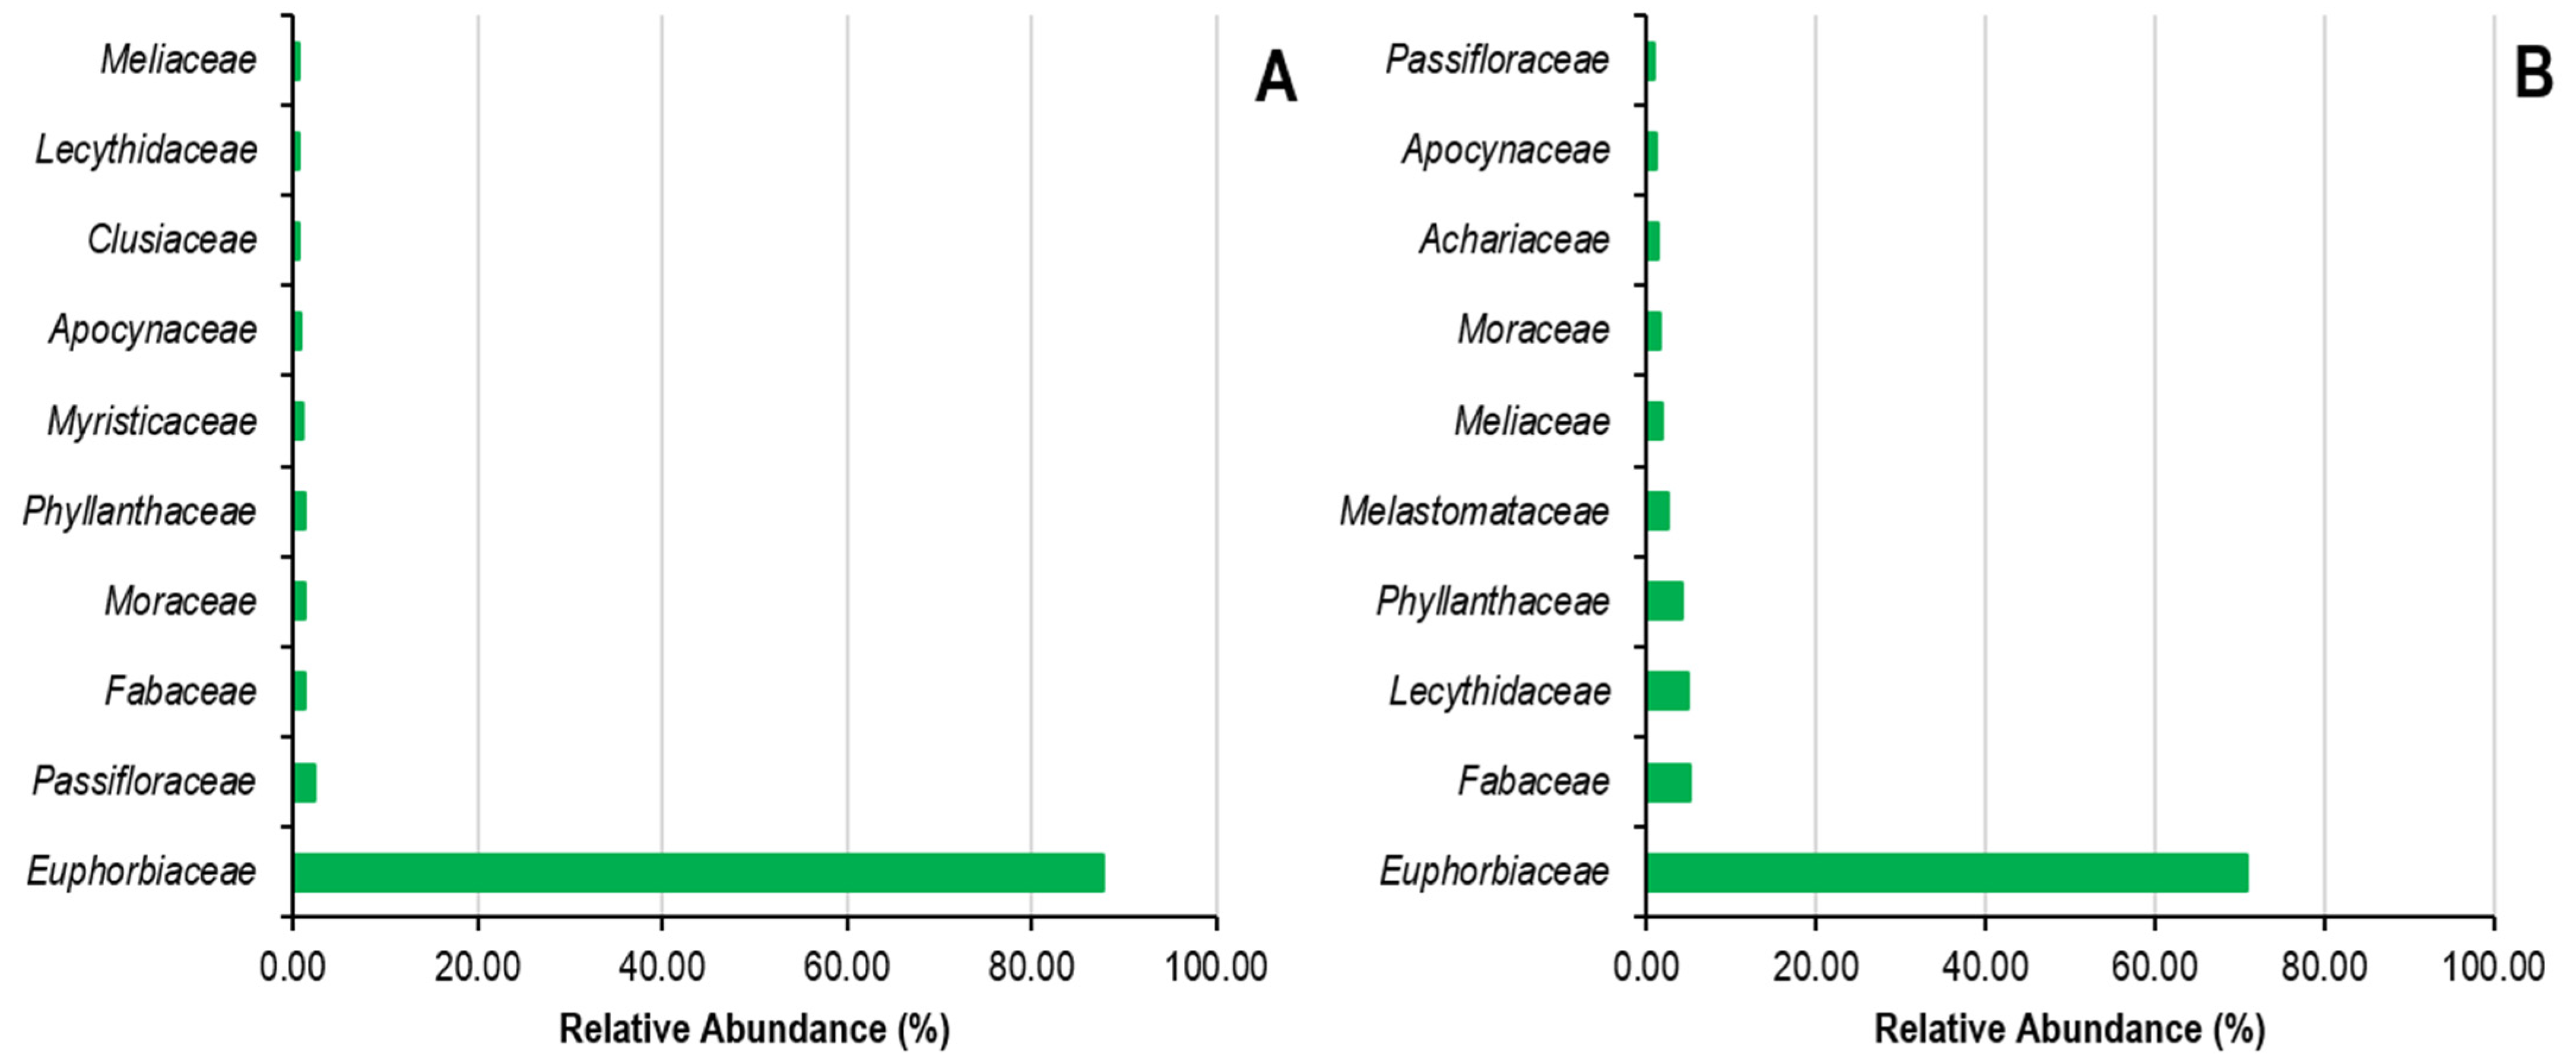
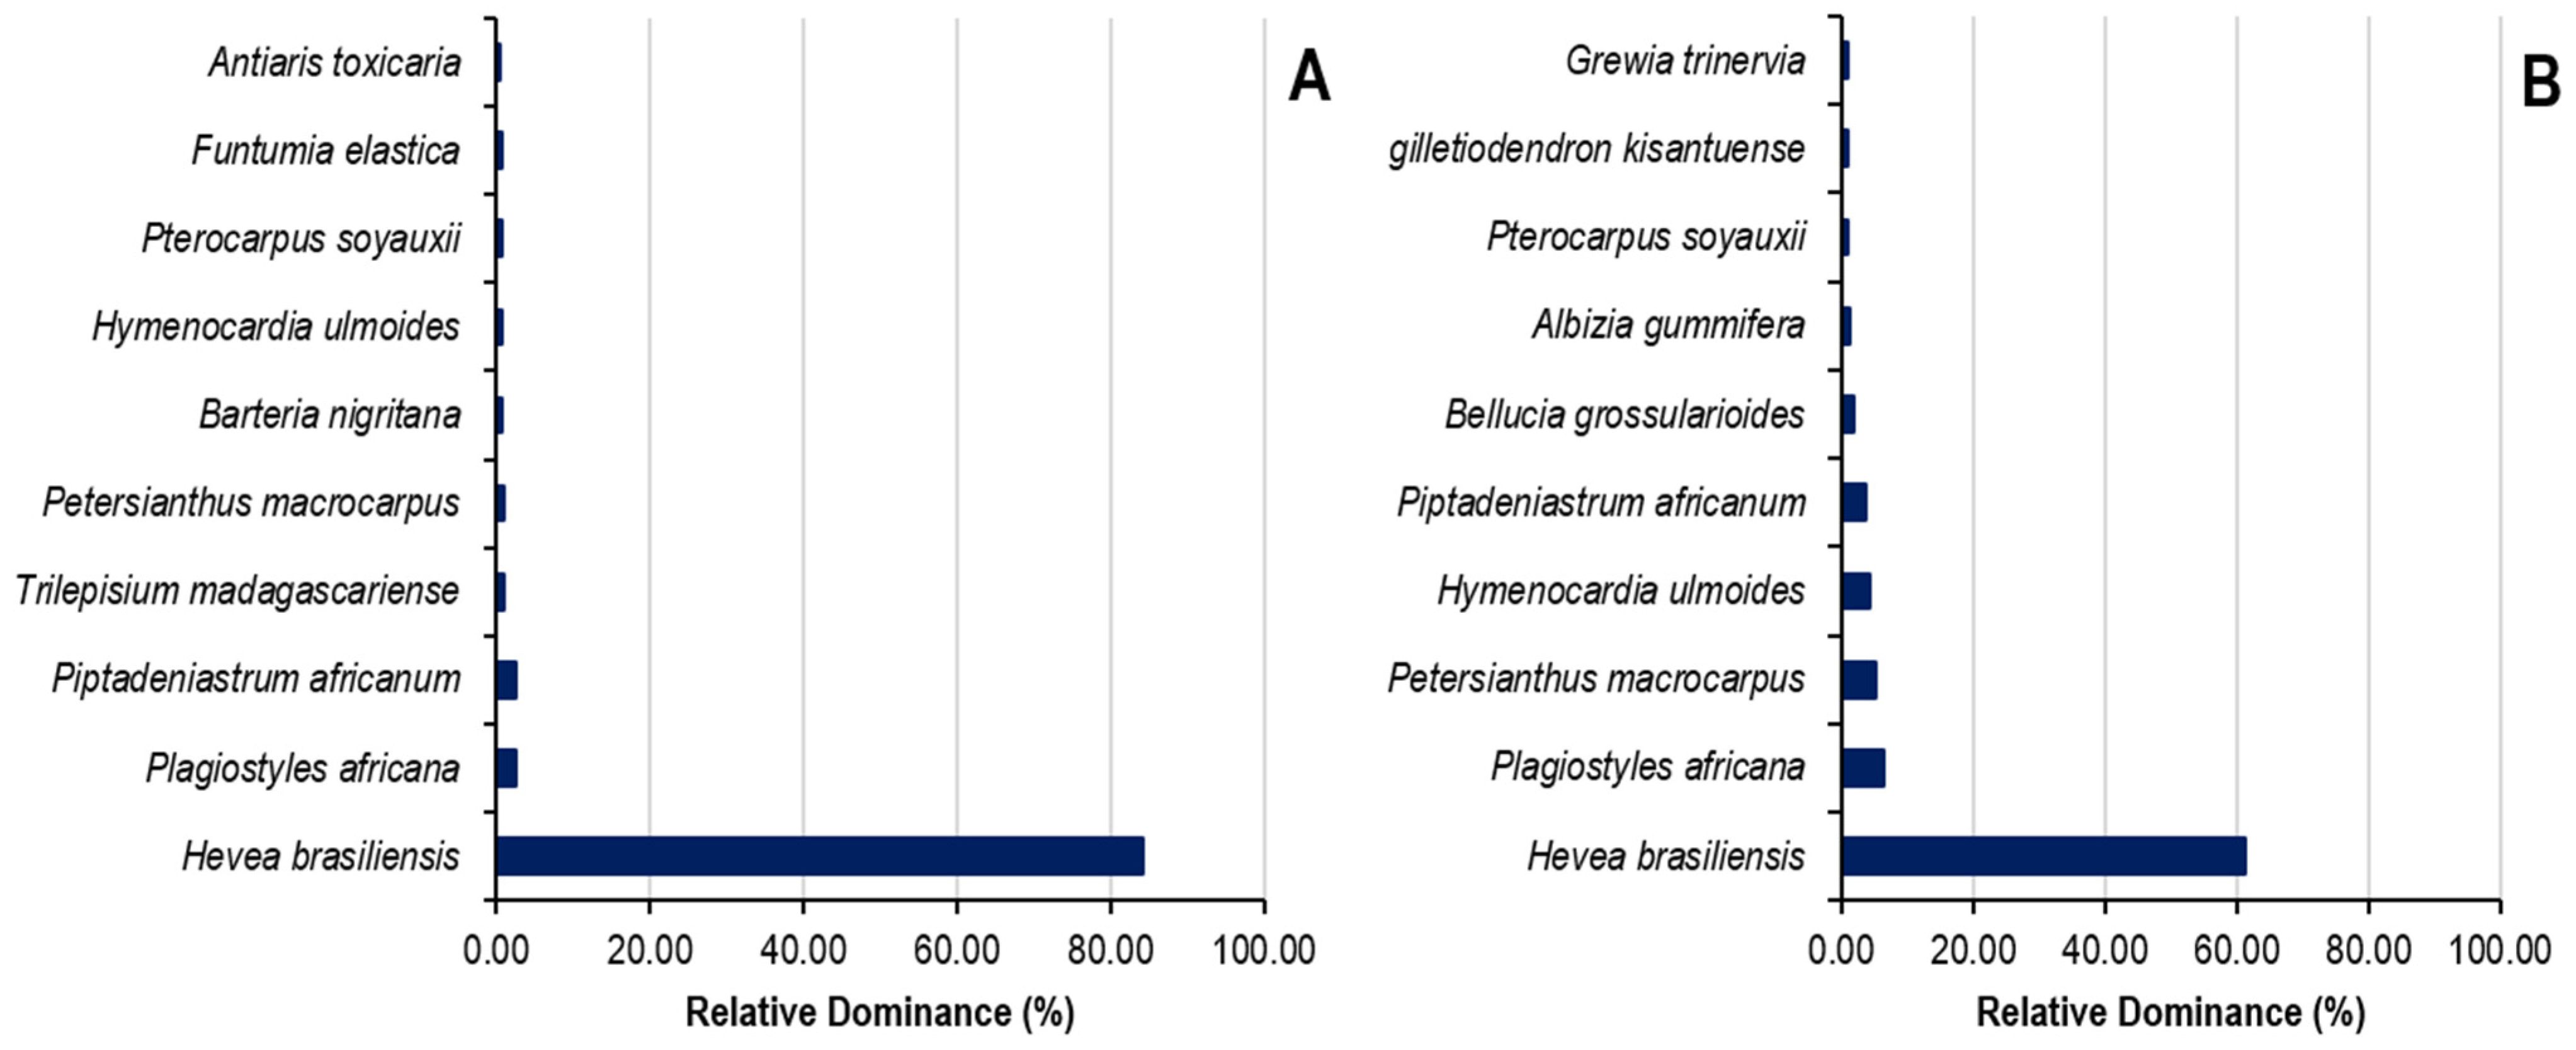
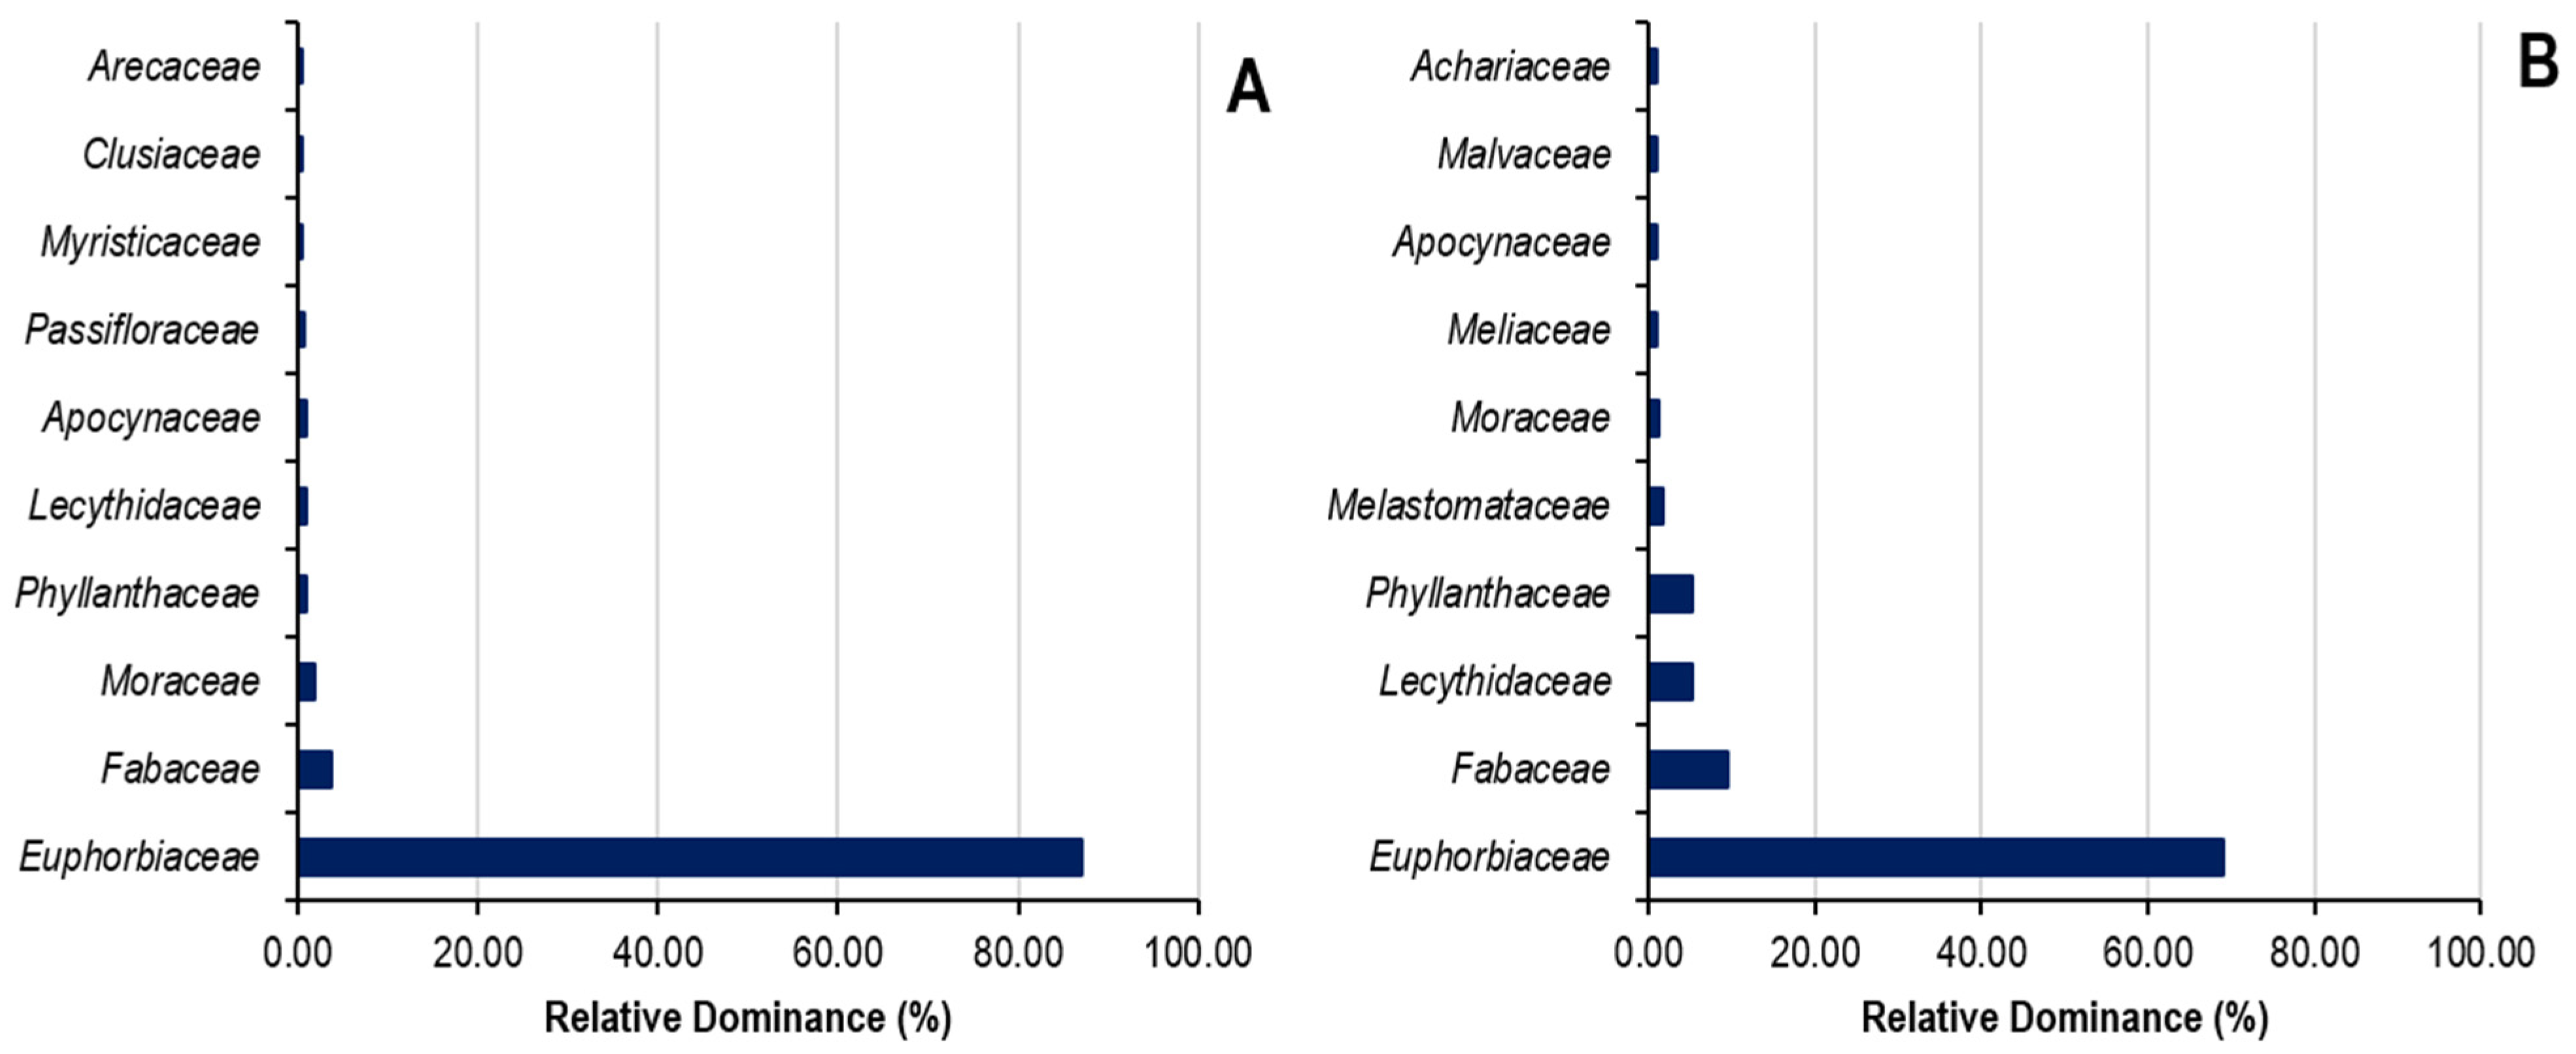
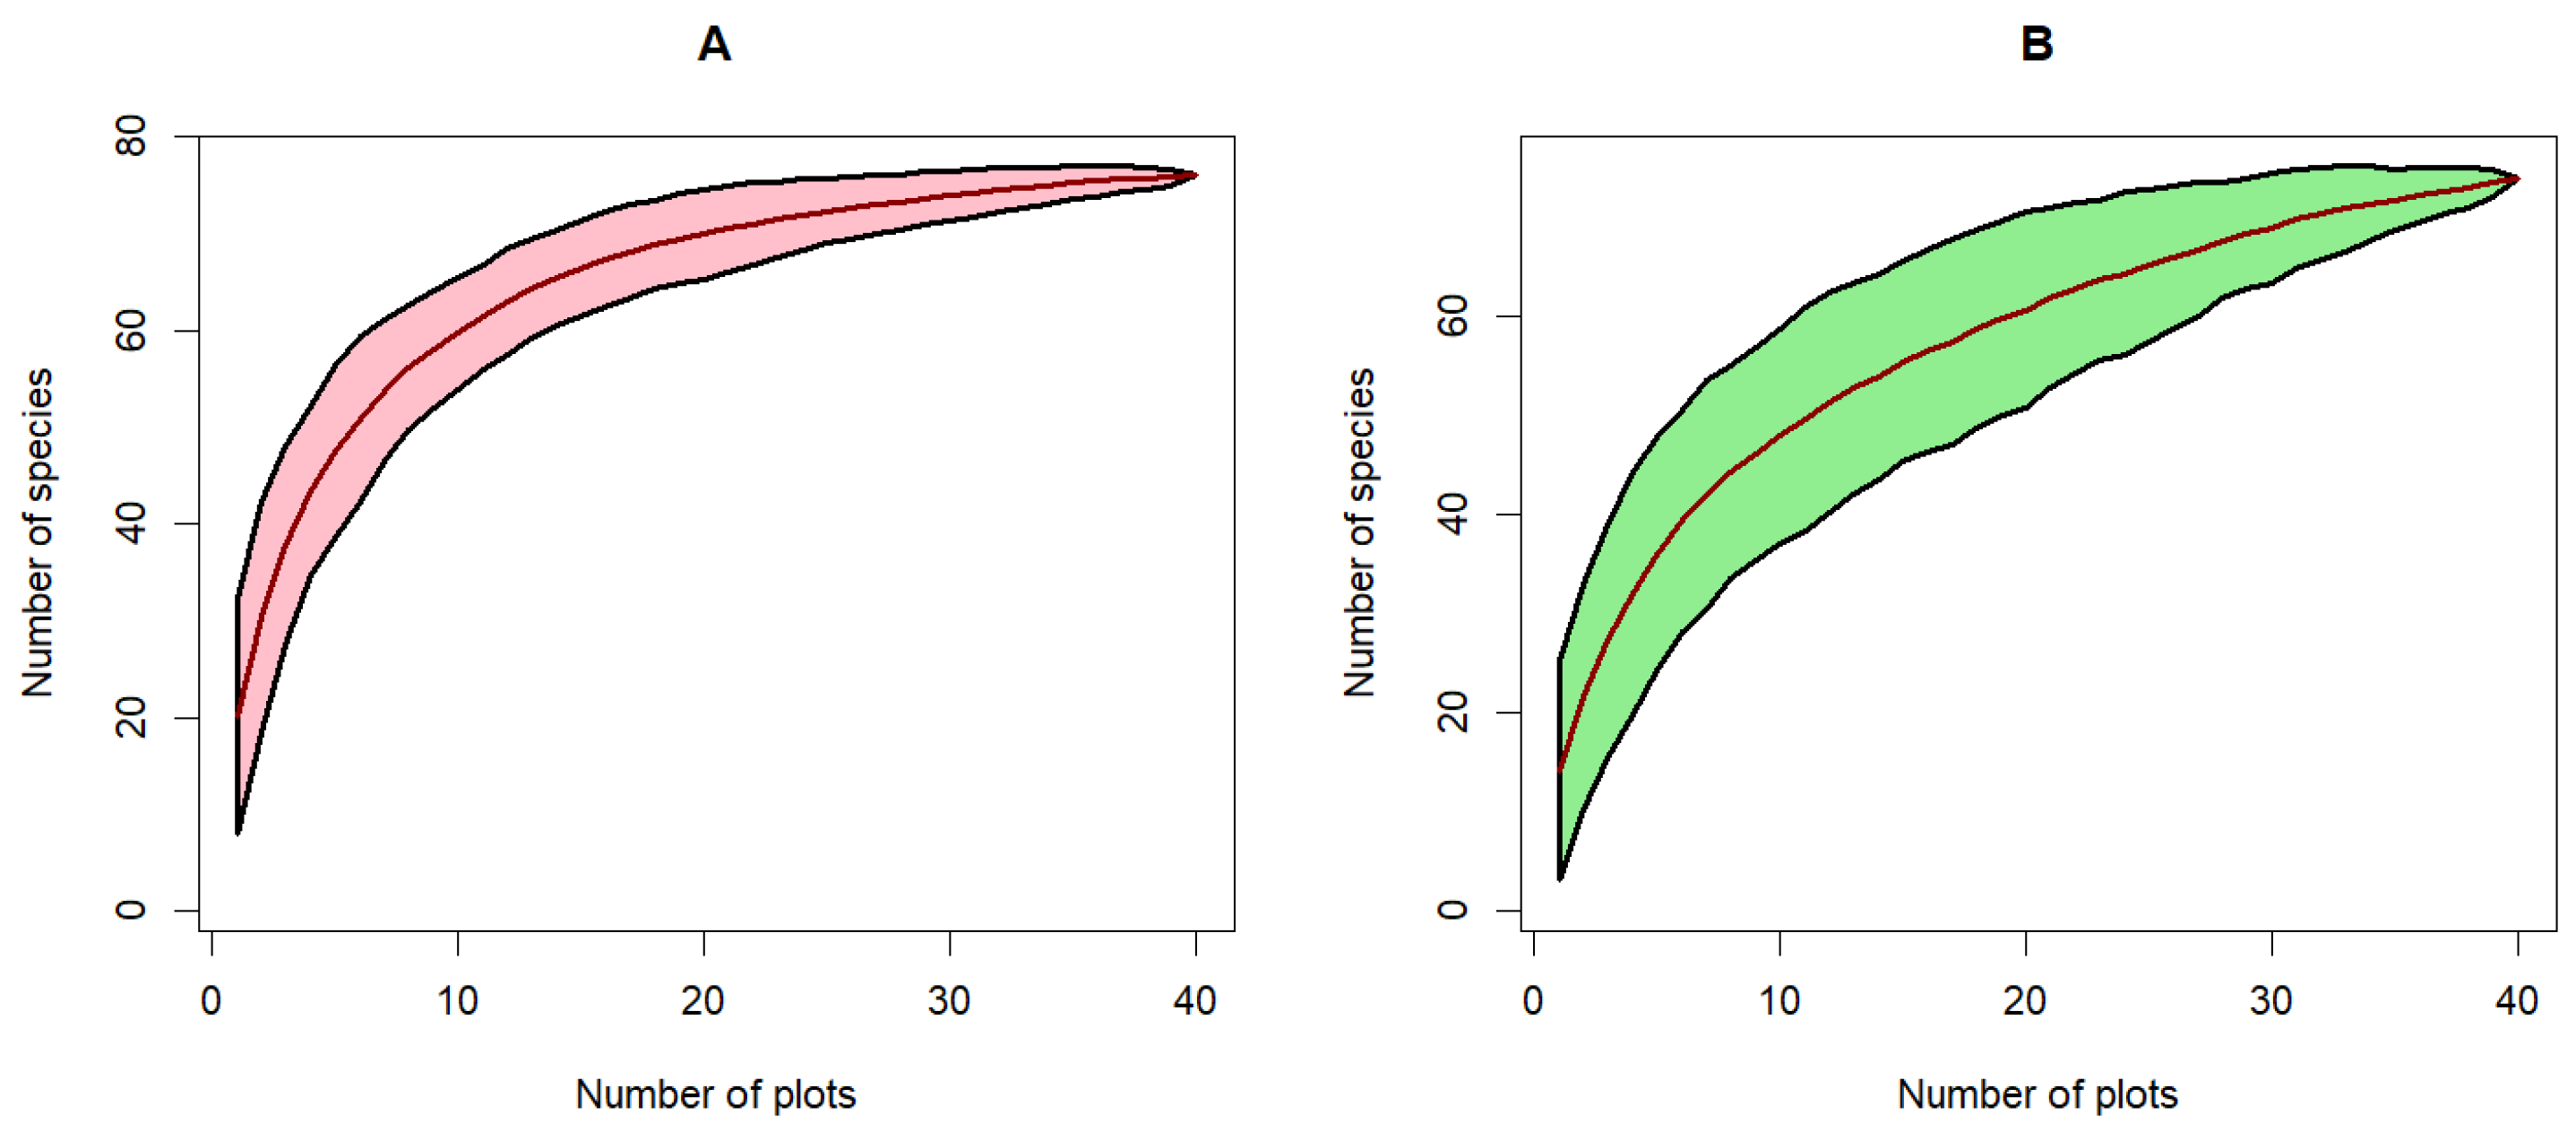


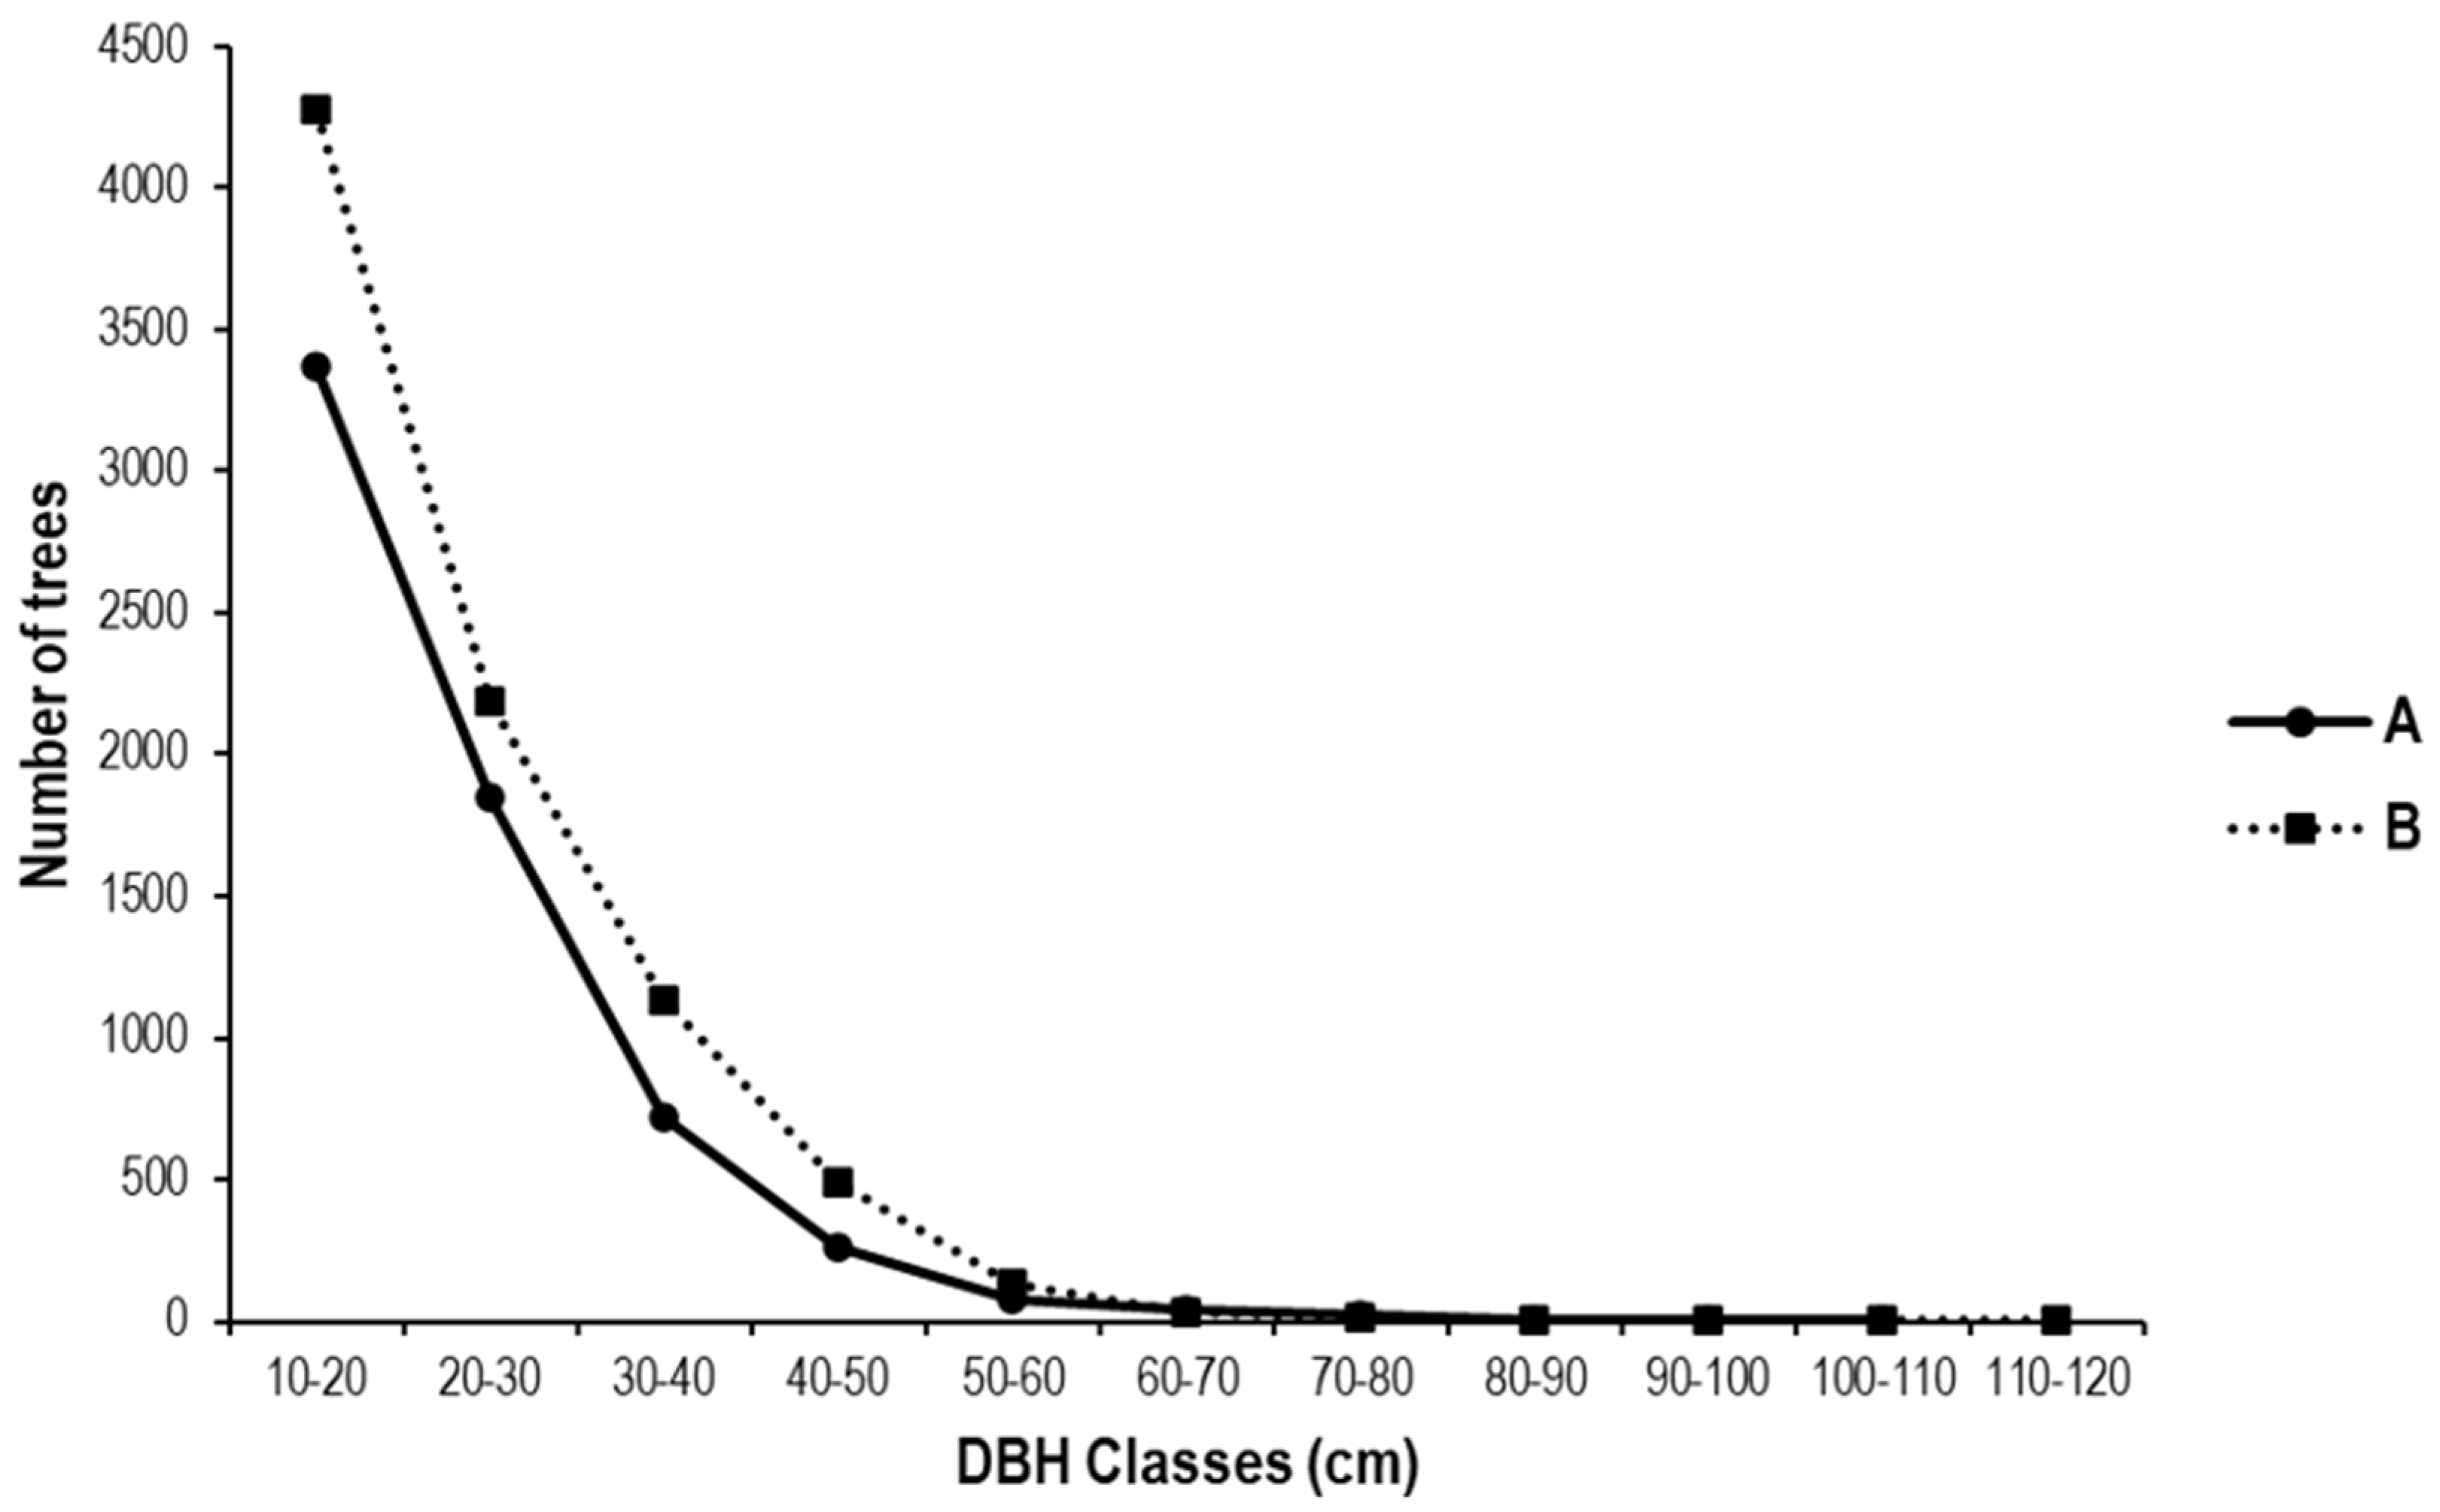
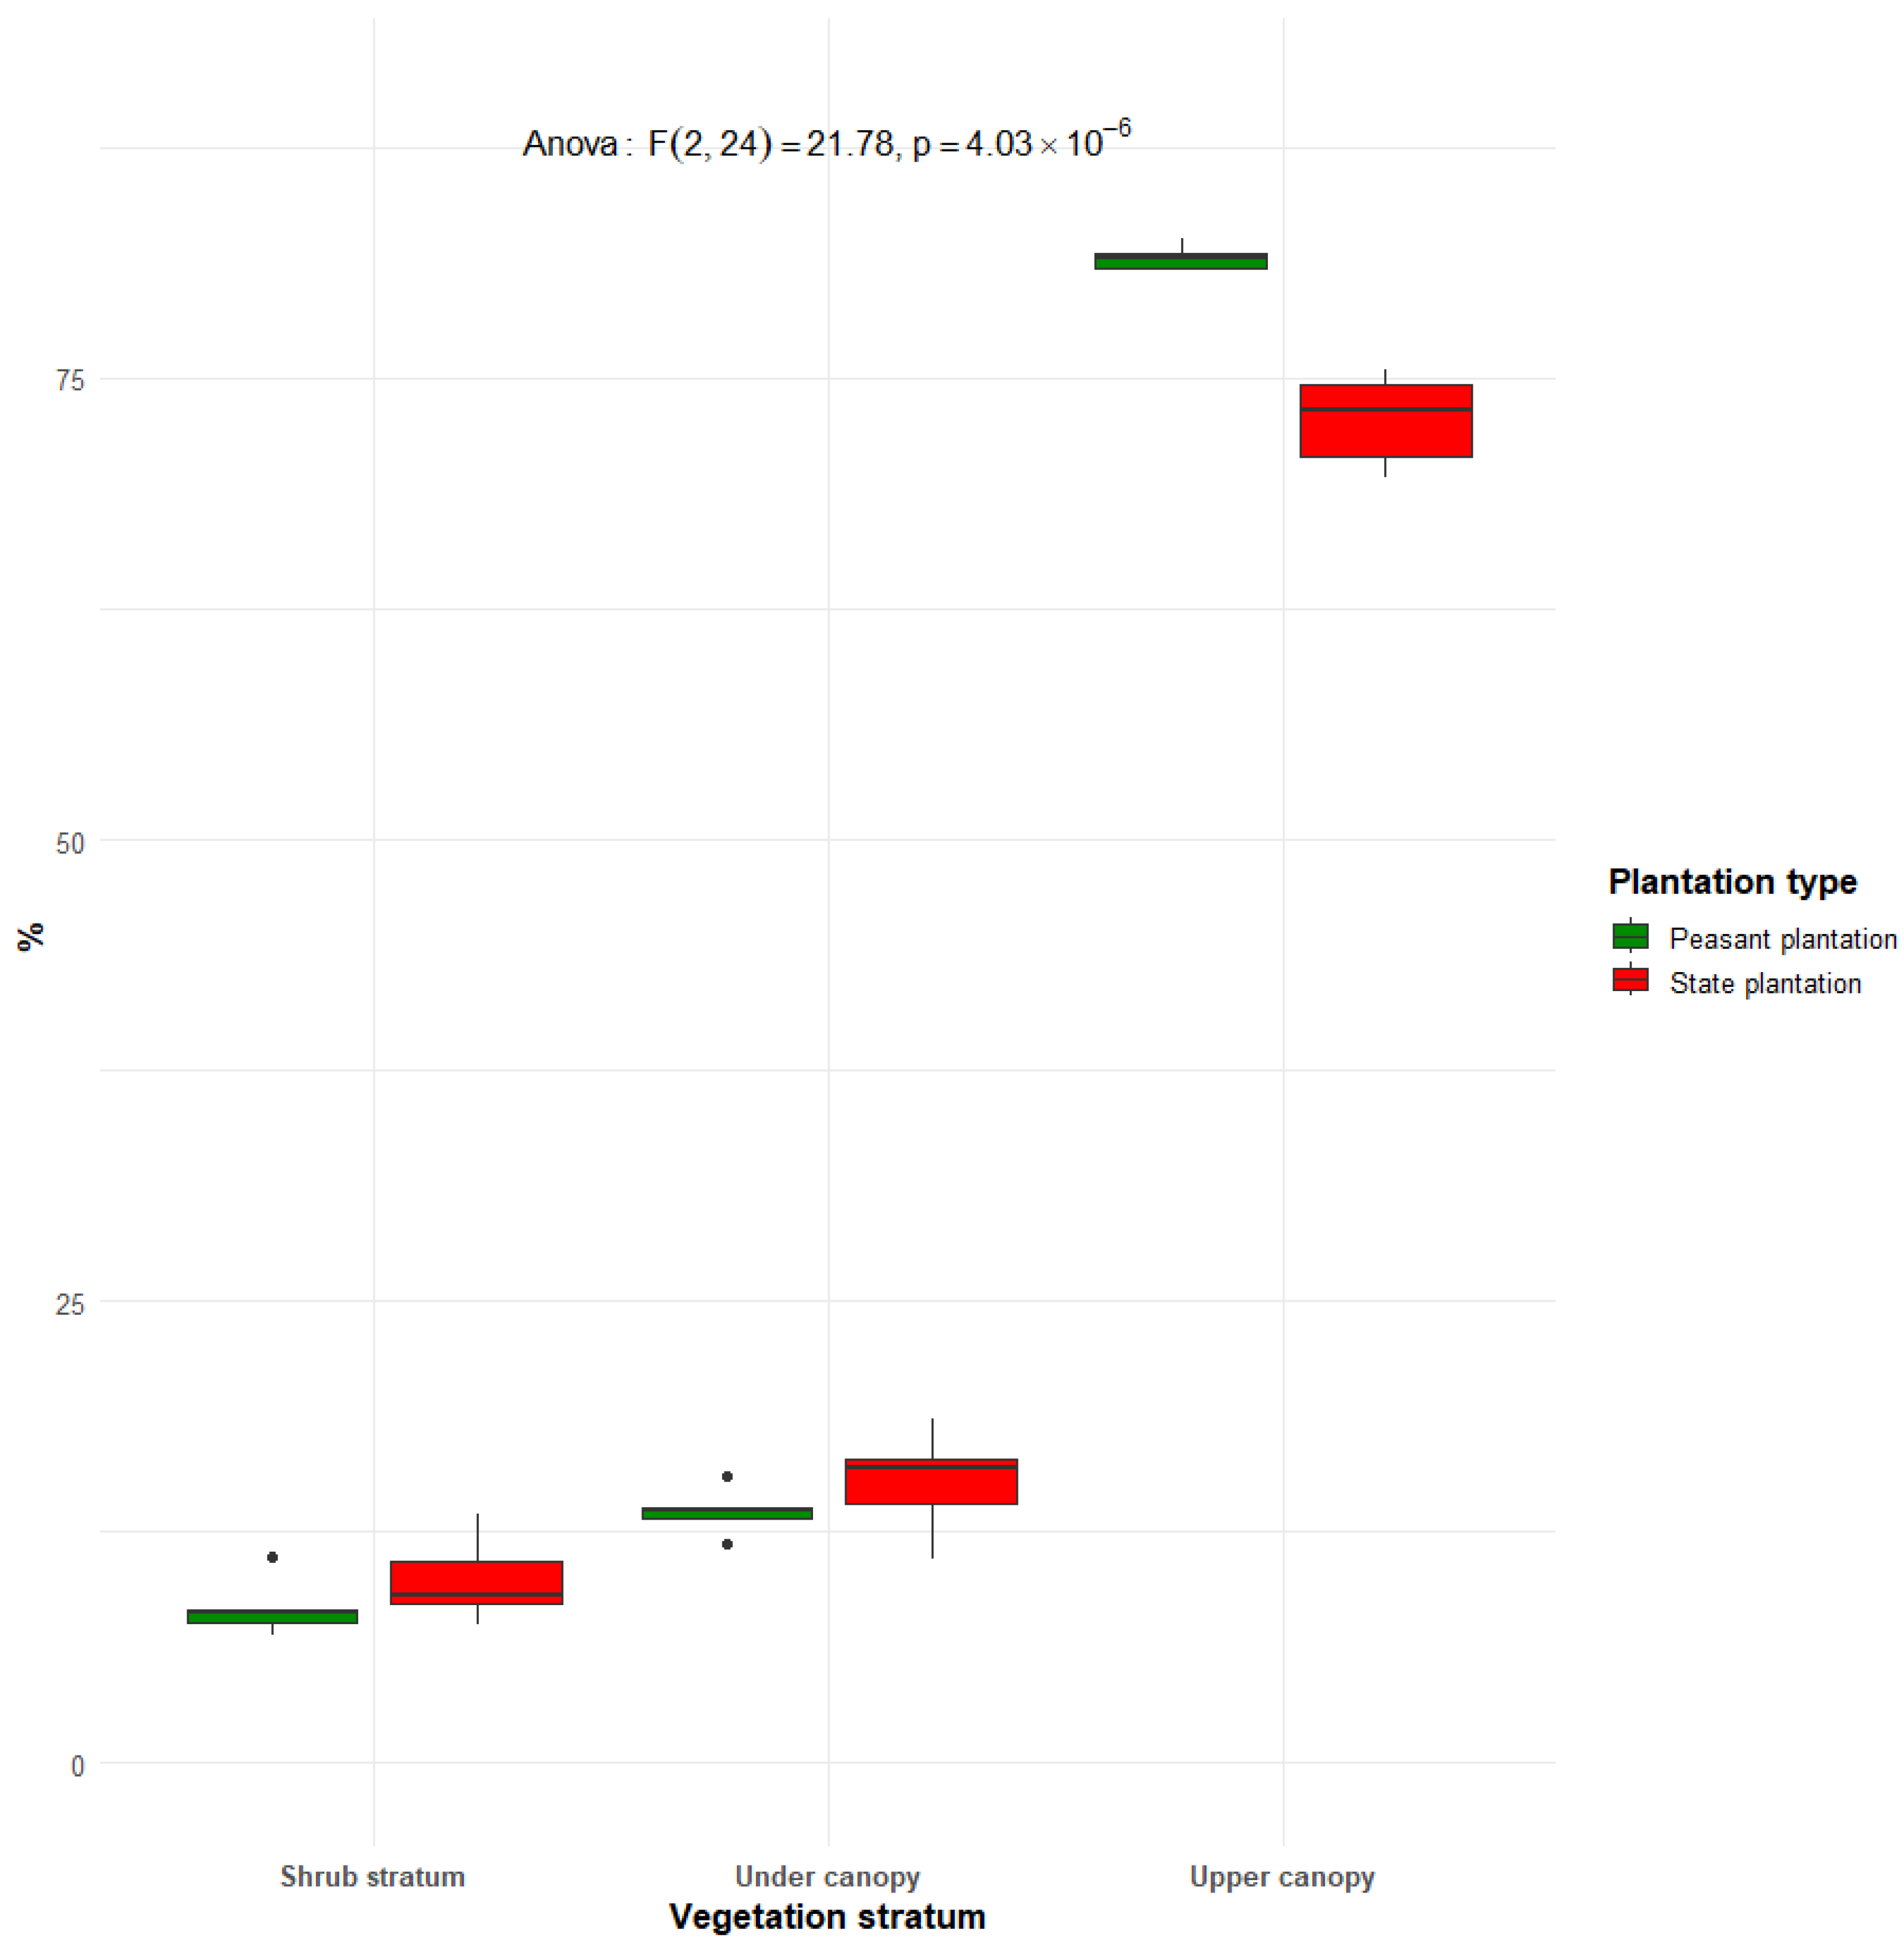

Disclaimer/Publisher’s Note: The statements, opinions and data contained in all publications are solely those of the individual author(s) and contributor(s) and not of MDPI and/or the editor(s). MDPI and/or the editor(s) disclaim responsibility for any injury to people or property resulting from any ideas, methods, instructions or products referred to in the content. |
© 2025 by the authors. Licensee MDPI, Basel, Switzerland. This article is an open access article distributed under the terms and conditions of the Creative Commons Attribution (CC BY) license (https://creativecommons.org/licenses/by/4.0/).