Article

Gas Exchange and Chlorophyll Fluorescence Responses of Açaí and Juçara Palms Under Salt Stress

by
Tâmara Moreira Silva
1,
Almy Junior Cordeiro de Carvalho
1,
Paulo Cesar dos Santos
2,*,
Marta Simone Mendonça Freitas
1,
Rozane Franci de Moraes Tavares
3,
Adrielly de Jesus Canedo
1,
Álan Chrisleyr Maracahipes
3,
Alessandro Coutinho Ramos
4,
Vinicius de Freitas Manhães
1,
Moises Zucoloto
2,
Leandro Pin Dalvi
2,
Henrique Duarte Vieira
1,
Mirian Peixoto Soares da Silva
5,
Osvaldo Sebastião de Oliveira Filho
1 and
Marlene Evangelista Vieira
6
1
Center for Agricultural Science and Technologies, Northern Fluminense State University Darcy Ribeiro (UENF), Campos dos Goytacazes 28013-602, RJ, Brazil
2
Center for Agricultural Sciences and Engineering, Department of Agronomy, Federal University of Espírito Santo (UFES), Alegre Campus, Alegre 29500-000, ES, Brazil
3
Faculty of Agricultural, Biological and Applied Social Sciences, State University of Mato Grosso (UNEMAT), Nova Xavantina 78690-000, MT, Brazil
4
Laboratory of Environmental Microbiology and Biotechnology, Vila Velha University (UVV), Vila Velha 29102-920, ES, Brazil
5
Agricultural Coordination, Federal Institute of Education, Science and Technology of Tocantins (IFTO), Pedro Afonso Campus, Pedro Afonso 77710-000, TO, Brazil
6
Analysis and Plant Nutrition Laboratory, Amapá State University, Lakes Territory Campus, Amapá 68901-258, AP, Brazil
*
Author to whom correspondence should be addressed.
Stresses 2026, 6(3), 53; https://doi.org/10.3390/stresses6030053
Submission received: 11 June 2026 / Revised: 21 July 2026 / Accepted: 27 July 2026 / Published: 3 August 2026
(This article belongs to the Section Plant and Photoautotrophic Stresses)

Abstract

The genus Euterpe, which includes açaí palm (Euterpe oleracea) and juçara palm (Euterpe edulis), plays an important socioeconomic and environmental role in Brazil. However, soil and water salinization is a global issue that compromises agricultural productivity by affecting plant physiological and metabolic processes. This study aimed to evaluate the physiological responses of young açaí and juçara plants under salt stress. The experiment was conducted in a randomized complete block design in a 5 × 2 factorial arrangement, consisting of five irrigation water salinity levels (0.1, 1.0, 2.0, 3.0, and 5.0 dS m−1) and two Euterpe species (açaí and juçara), with four replicates. After 104 days of stress exposure, gas exchange, chlorophyll ‘a’ fluorescence, relative chlorophyll index (SPAD), and sodium, chloride, and phenolic compounds were evaluated. Increasing salinity caused linear reductions in the maximum quantum yield and potential photochemical efficiency of PSII, accompanied by an increase in F0/Fm, indicating impaired PSII photochemical performance and photoinhibition. Stomatal conductance and transpiration also decreased significantly with increasing salinity, with reductions of up to 41.33% and 35.48%, respectively, at the highest salinity level. Salt stress negatively affected the physiological performance of both palm species through stomatal limitation and reduced photosystem II efficiency. However, açaí plants exhibited greater tolerance to salt stress than juçara plants.

1. Introduction

The exploitation of natural resources in the Amazon region represents an economically important activity driven by the wide diversity of non-timber forest products (NTFPs), which play a fundamental role in floodplain, seasonally flooded, and upland forest ecosystems. These environments, characterized by high soil moisture, provide an important source of income for traditional and quilombola communities based on family farming systems [1,2].
Concerns regarding the conservation of native species have increased interest in Juçara palm (Euterpe edulis Mart.) not only for heart-of-palm extraction, but also for fruit production and pulp processing, which are highly similar to those of açaí palm fruits produced in the Amazon region. Both açaí and juçara palms play important ecological roles in flooded environments, especially along riverbanks, due to their tolerance to high soil moisture conditions, contributing to sediment retention and water quality preservation [3,4].
The recognition of açaí palm (Euterpe oleracea Mart.) as an economically important fruit crop is relatively recent. Fruit extraction from native forests represents an important production chain in Brazil. In recent years, the increasing demand for processed açaí pulp, particularly in the South and Southeast regions of the country, has stimulated the expansion of technified cultivation systems not only in the Amazon region, but also in several other Brazilian states [5,6].
Plant species differ considerably in their tolerance to environmental stresses such as cold, heat, drought, flooding, and salinity. Water in its liquid form is essential for plant growth, acting not only as a medium for metabolic reactions but also for nutrient transport within plant tissues. Although some species can survive dehydration and freezing conditions, plant growth is not possible in the absence of liquid water [7]. In this context, soil and water salinization has become a global problem, affecting approximately 1.1 billion hectares, corresponding to nearly 7% of the Earth’s surface, and is considered one of the main causes of crop productivity losses worldwide [8,9].
Salinity can interfere with virtually all physiological and metabolic processes in plants [10]. Its effects depend on several factors, including species, cultivar, phenological stage, salt composition, stress intensity and duration, irrigation management, and edaphoclimatic conditions [11,12].
Salt stress affects plant development through a two-phase process, beginning with an immediate osmotic effect followed by ionic toxicity during prolonged exposure. Excessive accumulation of sodium (Na+) and chloride (Cl) ions in plant tissues disrupts the K+/Na+ balance and cellular homeostasis, resulting in nutritional imbalance and impairment of essential physiological functions [13,14].
In addition, salt stress promotes ultrastructural damage to chloroplasts and disrupts thylakoid membrane organization, directly affecting photochemical efficiency and inhibiting key enzymes such as ribulose-1,5-bisphosphate carboxylase/oxygenase (RuBisCO), thereby severely impairing photosynthesis [15]. Salinity-induced photochemical inhibition involves reductions in photosystem II (PSII) quantum efficiency and impairment of electron transport, favoring the generation of reactive oxygen species (ROS) and the occurrence of photoinhibition [16].
Although palm species generally show satisfactory development under saline conditions, tolerance to elevated salinity levels varies according to the species. In this context, the aim of this study was to evaluate the physiological responses of young açaí and juçara plants under salt stress.

2. Results

2.1. Relative Chlorophyll Content and Chlorophyll Fluorescence

No significant differences were observed between species or salinity levels for relative chlorophyll content (SPAD), with similar mean values for both açaí and juçara, averaging 39.41 SPAD units (Table 1). However, açaí showed slightly higher performance than juçara, exhibiting approximately 5% higher leaf greenness, whereas juçara showed a 5% reduction relative to the overall mean.
Chlorophyll fluorescence parameters were similar between species, with comparable mean values for Fv/Fm, F0/Fm, and Fv/F0 (Table 1). Açaí maintained PSII quantum yield approximately 3% above the overall mean, whereas juçara showed a 24% reduction in its photosynthetic performance index compared to the mean.
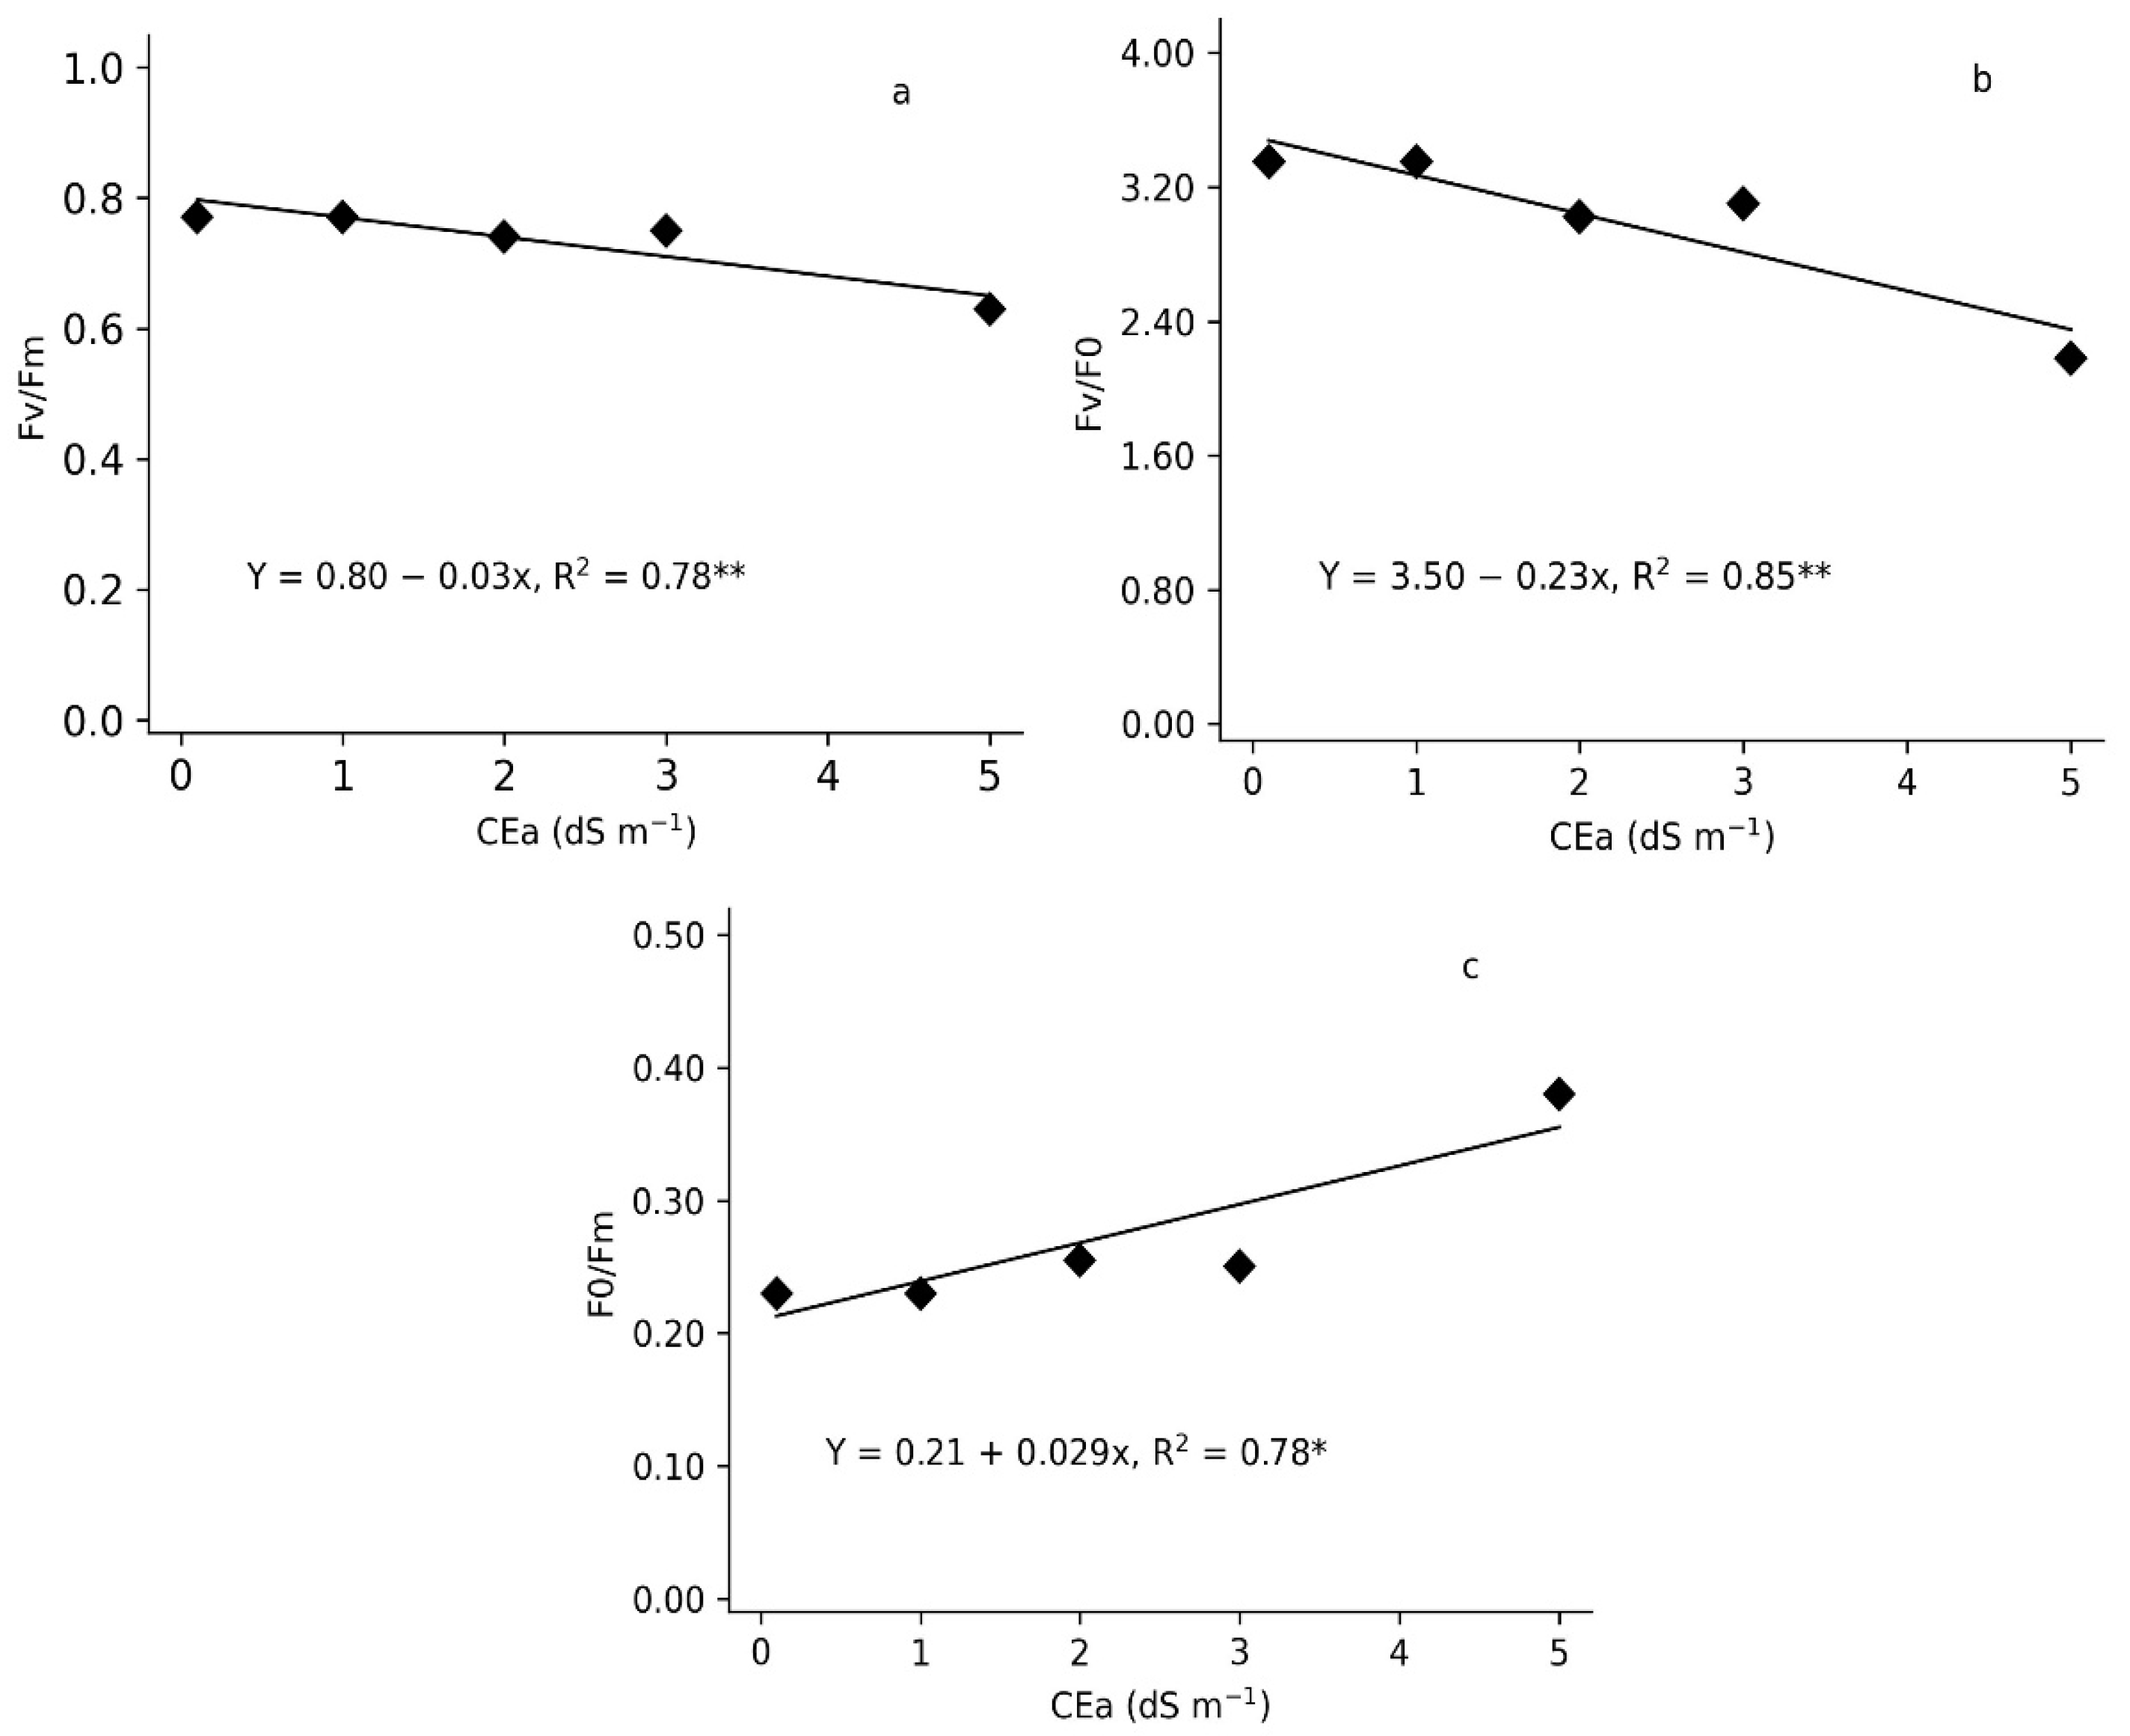
Regarding salinity, significant linear decreases were observed for Fv/Fm and Fv/F0 and increases for F0/Fm with increasing electrical conductivity of irrigation water (ECw), regardless of species (Figure 1). As shown in Figure 1a, the highest Fv/Fm value (0.77) was observed in the control treatment (ECw = 0.1 dS m−1), with a reduction of 4% from ECw = 1.0 dS m−1 and reaching a 20% decrease at ECw = 5.0 dS m−1. Increasing salinity resulted in a linear reduction of 33% in Fv/F0 when comparing the highest salinity level to the control. In contrast, F0/Fm increased by 69% with increasing salinity (Figure 1b,c), indicating that both species were under salt stress.

2.2. Gas Exchange

Statistically, açaí and juçara plants showed similar responses for most gas exchange variables, except for net photosynthetic rate and water-use efficiency (Table 2). From a physiological perspective, however, most responses differed between the species evaluated. The predominance of statistical similarity may be associated with the high variability (CV%) inherent to the physiological nature of these variables, as well as to species-specific genetic characteristics and their independent responses to increasing electrical conductivity in the growth medium.
Açaí plants exhibited higher mean values for most gas exchange variables, except for intercellular CO2 concentration, for which juçara showed the highest mean value, approximately 13% greater than that observed in açaí plants. Compared with juçara, açaí showed increases of 28% in stomatal conductance, 49% in net photosynthetic rate, 22% in transpiration, 19% in water-use efficiency, and 6% in leaf temperature (Table 2).
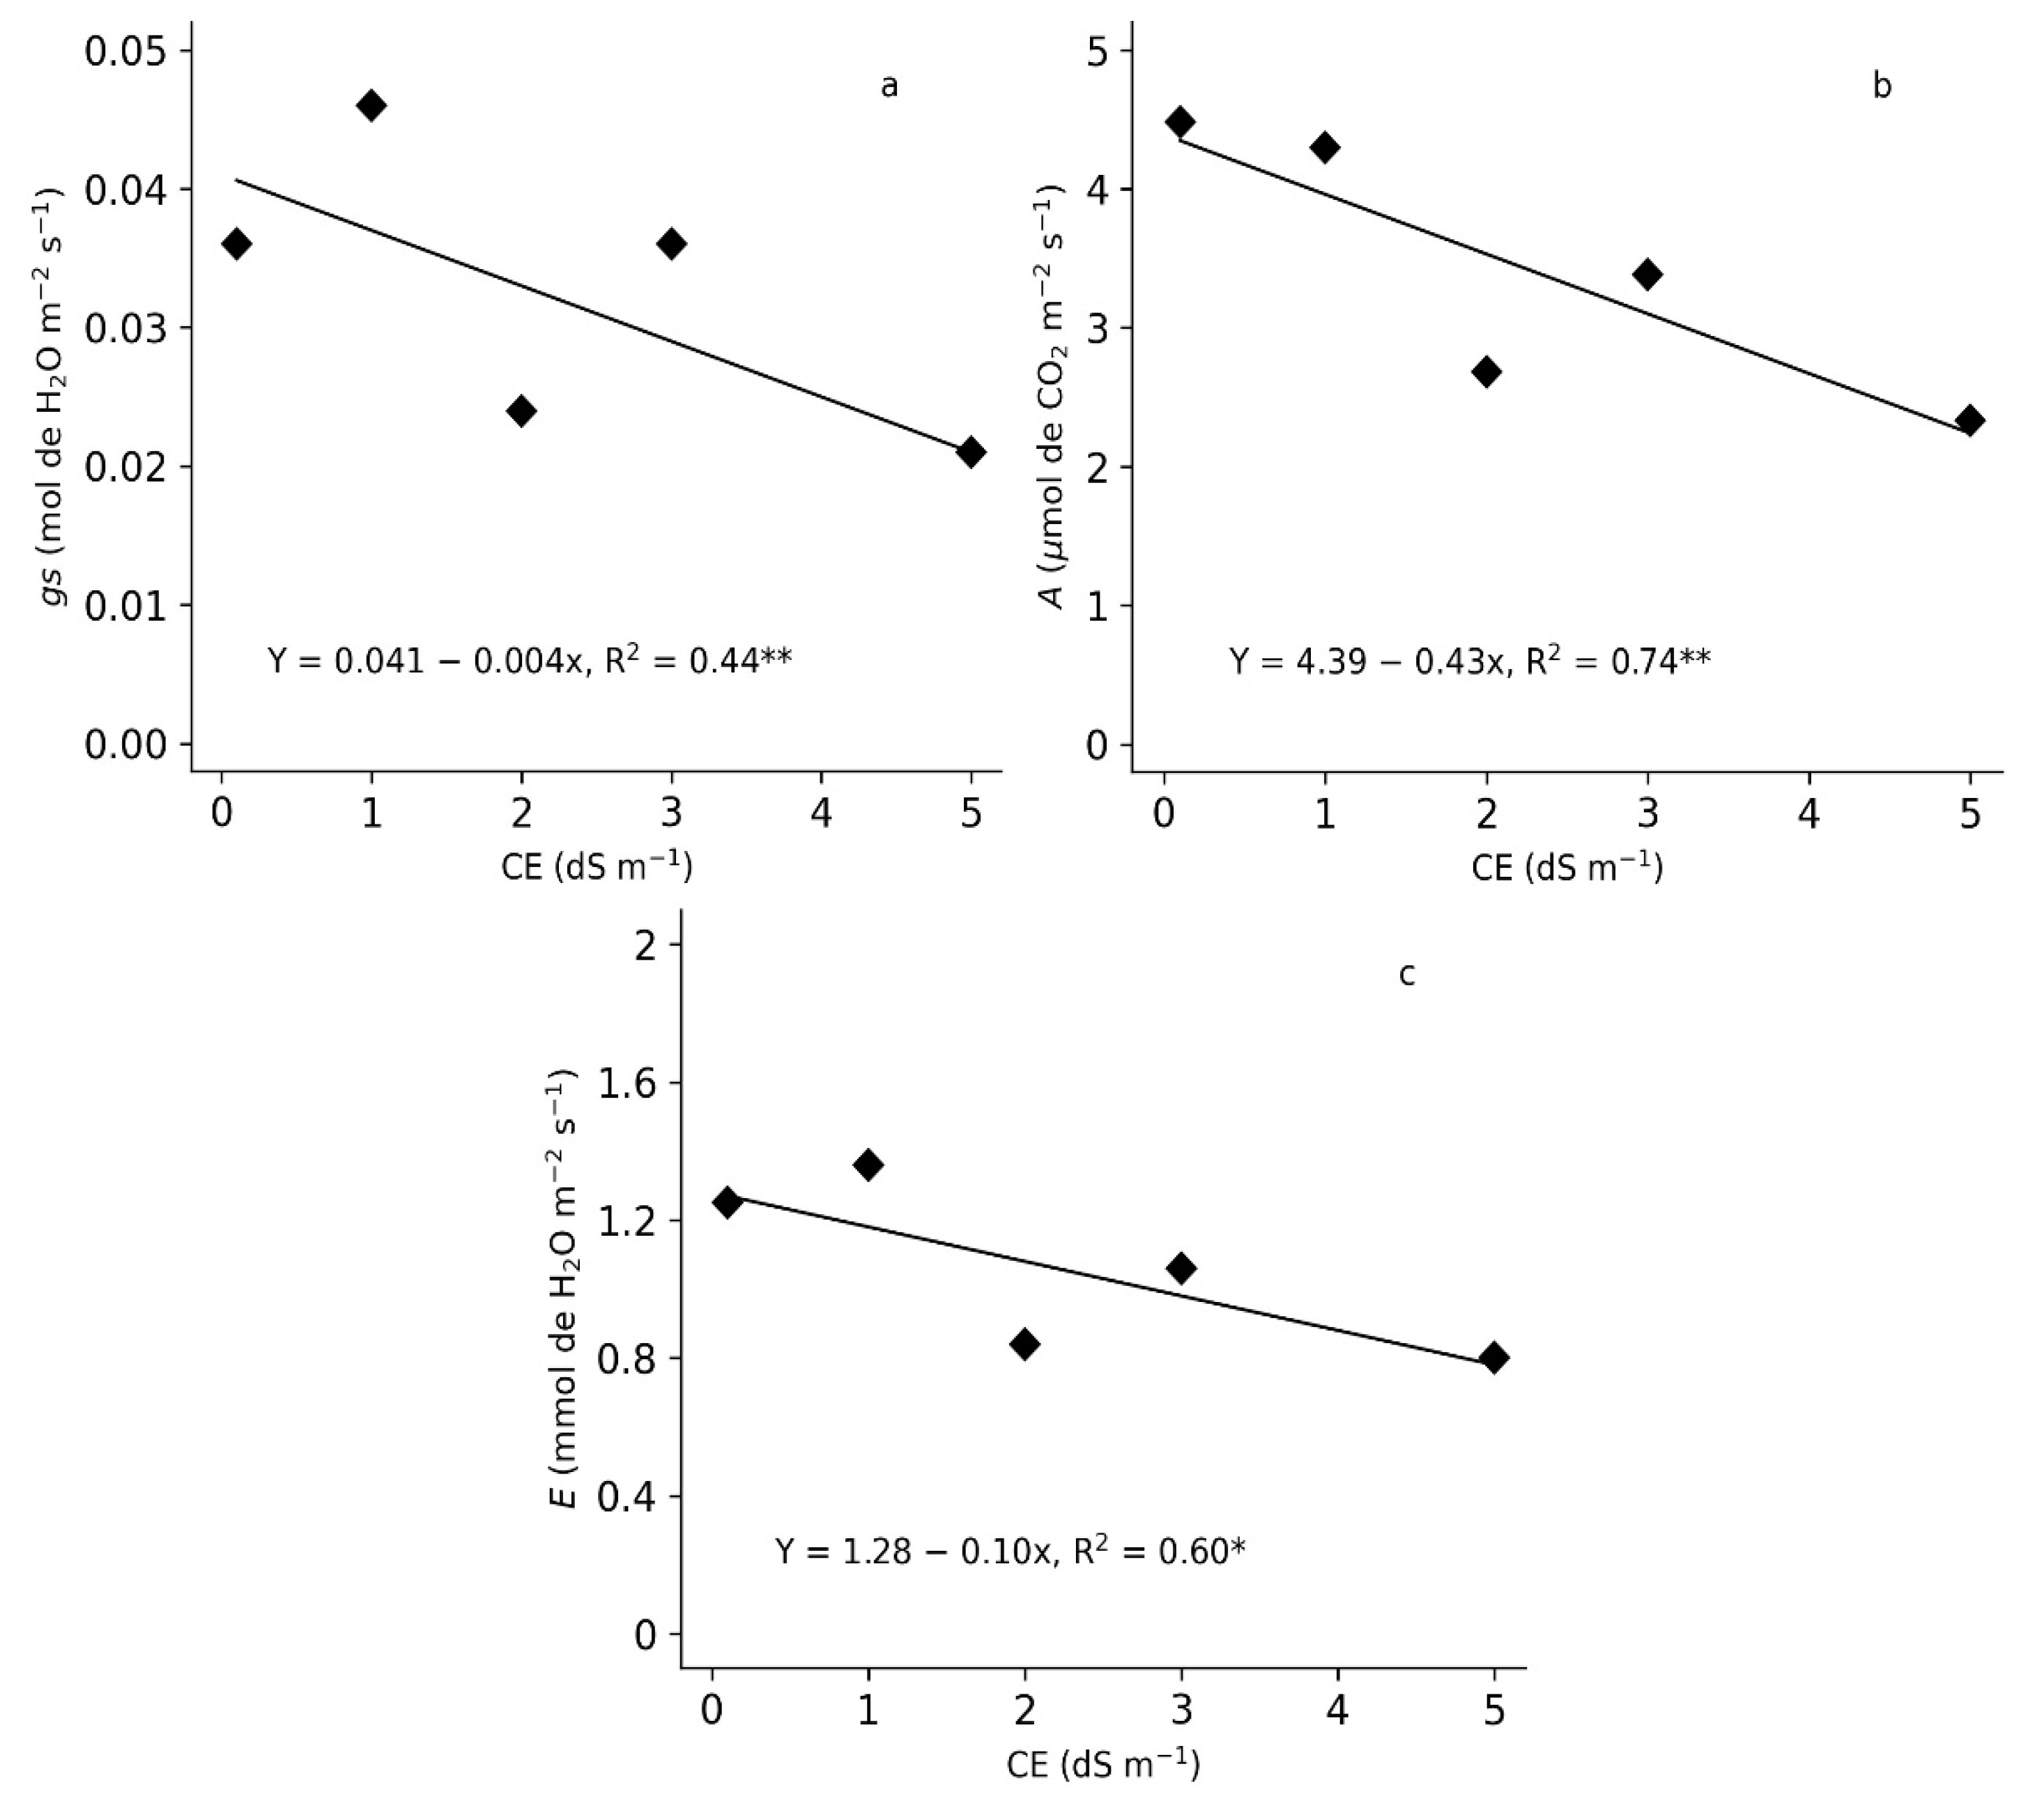
Higher reductions in stomatal conductance were observed with increasing salinity levels, decreasing from 0.036 to 0.021 mol H2O m−2 s−1 in the control treatment and under EC of 5.0 dS m−1, respectively (Figure 2a). The highest net photosynthetic rate was observed in the control treatment and decreased linearly with increasing salinity, reaching its lowest value at the highest salinity level. Net photosynthetic rates were 4.48 and 2.34 μmol CO2 m−2 s−1 in the control and 5 dS m−1 treatments, respectively (Figure 2b). Similarly, transpiration reflected the effects observed for stomatal conductance and net photosynthetic rate, decreasing from 1.24 mmol H2O m−2 s−1 at EC of 0.1 dS m−1 to 0.80 mmol H2O m−2 s−1 at EC of 5.0 dS m−1 (Figure 2c). The reductions in stomatal conductance, net photosynthetic rate and transpiration under the highest electrical conductivity treatment were 41.33%, 48% and 35.48%, respectively, compared with the control.

2.3. Sodium, Chloride, and Phenolic Compounds

Regarding salinity, the addition of NaCl to the irrigation water increased Na+ and Cl ion concentrations in plant tissues. No statistical differences were observed between species for Na+ and Cl contents or accumulation; however, the plants differed in relation to phenolic compound content and accumulation (Table 3).
For phenolic compounds, the highest mean values were observed in plants for both concentration and accumulation. Açaí increased phenolic compound production by 31% for concentration and 24.2% for accumulation relative to the overall mean, whereas juçara showed reductions of 31% and 24.2%, respectively (Table 3).

3. Discussion

Increasing irrigation water salinity caused consistent changes in the physiological responses of both Euterpe species. The linear reductions in stomatal conductance, transpiration, and net CO2 assimilation, together with the changes in chlorophyll fluorescence parameters, indicate that salinity affected both CO2 diffusion and the photochemical functioning of the photosynthetic apparatus.
The physiological response of plants to salt stress is a complex process involving distinct phases, including ionic imbalance and cellular water deficit [13]. The immediate plant response to salinity is associated with the osmotic component of stress, characterized by reduced substrate water potential, which restricts water uptake by roots [15]. This process triggers a series of signaling pathways; after sensing Na+ accumulation and hyperosmotic conditions, plants increase Ca2+ levels and activate reactive oxygen species (ROS) signaling pathways involved in ion balance maintenance and osmotic homeostasis, inducing phytohormonal signaling, particularly through the abscisic acid pathway, ultimately resulting in stomatal closure [17]. This mechanism was evidenced in the present study by the linear reduction in stomatal conductance and transpiration, leading to decreased net photosynthetic rate with increasing electrical conductivity of the irrigation water (Figure 2a–c).
As salt exposure continued, ionic effects associated with the accumulation of Na+ and Cl in plant tissues may also have contributed to the physiological responses. Although the species did not differ statistically in Na+ and Cl concentration or accumulation, juçara plants showed numerically higher mean values than açaí plants (Table 3). Therefore, these numerical differences should not be interpreted as evidence of contrasting ionic tolerance between the species. Excessive Na+ and Cl accumulation may disrupt ion homeostasis, interfere with K+, Ca2+, and Mg2+ nutrition, and impair metabolic and enzymatic processes [18].
Net CO2 assimilation decreased linearly from the control treatment to the highest irrigation water salinity level, with estimated values ranging from 4.35 to 2.24 µmol CO2 m−2 s−1, respectively, according to the fitted regression equation (Figure 2b). Similar trends were observed for stomatal conductance and transpiration, indicating that reduced stomatal aperture contributed to the decline in carbon assimilation by restricting CO2 diffusion into the leaf. However, the gas-exchange responses alone do not demonstrate that photosynthetic inhibition was exclusively or predominantly stomatal.
The concurrent reductions in stomatal conductance, transpiration, and net CO2 assimilation indicate an important stomatal contribution to photosynthetic inhibition through restricted CO2 diffusion. However, the absence of a significant change in intercellular CO2 concentration does not demonstrate the predominance of stomatal limitation, because Ci reflects the balance among stomatal conductance, mesophyll conductance, and biochemical CO2 consumption.
The changes in chlorophyll fluorescence demonstrate that a non-stomatal, photochemical component was also involved. Reduced CO2 assimilation decreases the use of excitation energy in carbon metabolism, which may increase excitation pressure on PSII and favor the formation of reactive oxygen species [18]. In the present study, the reductions in Fv/Fm and Fv/F0 with increasing salinity indicate lower maximum and potential photochemical efficiency of PSII, respectively [19]. The accompanying increase in F0/Fm is mathematically complementary to the reduction in Fv/Fm and reflects a decline in maximum PSII efficiency rather than an independent measurement of thermal energy dissipation.
At the higher salinity levels, Fv/Fm values were below the range commonly reported for non-stressed leaves, indicating increasing photochemical stress [20,21]. The reduction in Fv/F0 further supports the occurrence of impaired PSII photochemical activity [22,23]. The relatively high F0/Fm values observed under the control treatment indicate a pre-existing limitation in maximum PSII efficiency; however, the causes of this response cannot be determined from the present experiment. However, because temperature and relative humidity effects were not independently tested, this possibility should be interpreted cautiously.
When species means were compared across salinity levels, açaí plants exhibited higher net CO2 assimilation and water-use efficiency than juçara plants (Table 2). These differences indicate higher overall physiological performance of açaí under the experimental conditions. Nevertheless, because the salinity responses presented in Figure 1 and Figure 2 represent means across species, these main effects should not be interpreted as evidence that the species differed in the magnitude of their response to increasing salinity.
Despite the functional alterations observed in the photosynthetic apparatus, salinity did not significantly affect the relative chlorophyll index (SPAD) in either species (Table 1). Thus, relative chlorophyll abundance was maintained during the experimental period, whereas PSII functional responses were affected by increasing irrigation water salinity. This finding reinforces the importance of integrating pigment-related and physiological measurements when assessing the responses of Euterpe species to environmental conditions, because changes in physiological performance are not necessarily accompanied by proportional changes in other plant attributes [24].
The production of secondary metabolites, including phenolic compounds such as anthocyanins, flavonoids, and lignoids, occurs naturally in plants; however, in açaí and juçara species, this production is particularly pronounced because their stems, flowers, and fruits are naturally rich in these compounds [25,26]. This characteristic contributes to their adaptive capacity and survival under environmental stimuli and various stress conditions, including salinity. The accumulation of these compounds is associated with signaling metabolic pathways involved in stress mitigation, particularly in response to reactive oxygen species, which are highly reactive and capable of interacting with biomolecules, thereby altering biochemical and physiological activities [27]. However, the differences observed in phenolic compound concentration and accumulation represent species main effects and should not, by themselves, be interpreted as evidence of salinity-induced phenolic production.
The maintenance of the SPAD index despite the reductions in Fv/Fm and Fv/F0 and the increase in F0/Fm is physiologically consistent because these measurements characterize different attributes of the photosynthetic apparatus. The SPAD index provides an indirect estimate of relative chlorophyll abundance and leaf greenness, whereas chlorophyll fluorescence provides information on PSII photochemistry, electron transport, and the use and dissipation of absorbed excitation energy. Therefore, PSII functionality may decline without a proportional change in the relative chlorophyll index [28]. Under the conditions of the present study, salinity impaired PSII functional efficiency without causing a detectable alteration in relative chlorophyll abundance.
The concurrent reductions in stomatal conductance, transpiration, and net CO2 assimilation indicate an important stomatal contribution to photosynthetic inhibition through restricted CO2 diffusion. However, the simultaneous changes in chlorophyll fluorescence parameters demonstrate an additional non-stomatal component associated with impairment of PSII photochemistry. The absence of a significant change in intercellular CO2 concentration does not exclude either mechanism, because this variable reflects the balance among stomatal conductance, mesophyll conductance, and biochemical CO2 consumption. Because CO2-response curves and mesophyll conductance were not evaluated, the relative contributions of stomatal, mesophyll, biochemical, and photochemical limitations could not be quantitatively partitioned [29]. Physiological responses reported for date palm seedlings exposed to seawater similarly indicate that salinity tolerance in palms involves coordinated adjustments in gas exchange, water relations, and ion homeostasis [30].
Overall, the reduction in photosynthetic performance under salt stress involved both stomatal and non-stomatal components. Reduced stomatal conductance restricted CO2 diffusion, whereas the declines in Fv/Fm and Fv/F0 indicated impairment of PSII photochemistry. These responses occurred without a significant change in the relative chlorophyll index, showing that PSII functional efficiency was more responsive to salinity than relative chlorophyll abundance under the conditions of this study.

4. Materials and Methods

4.1. Plant Material and Experimental Design

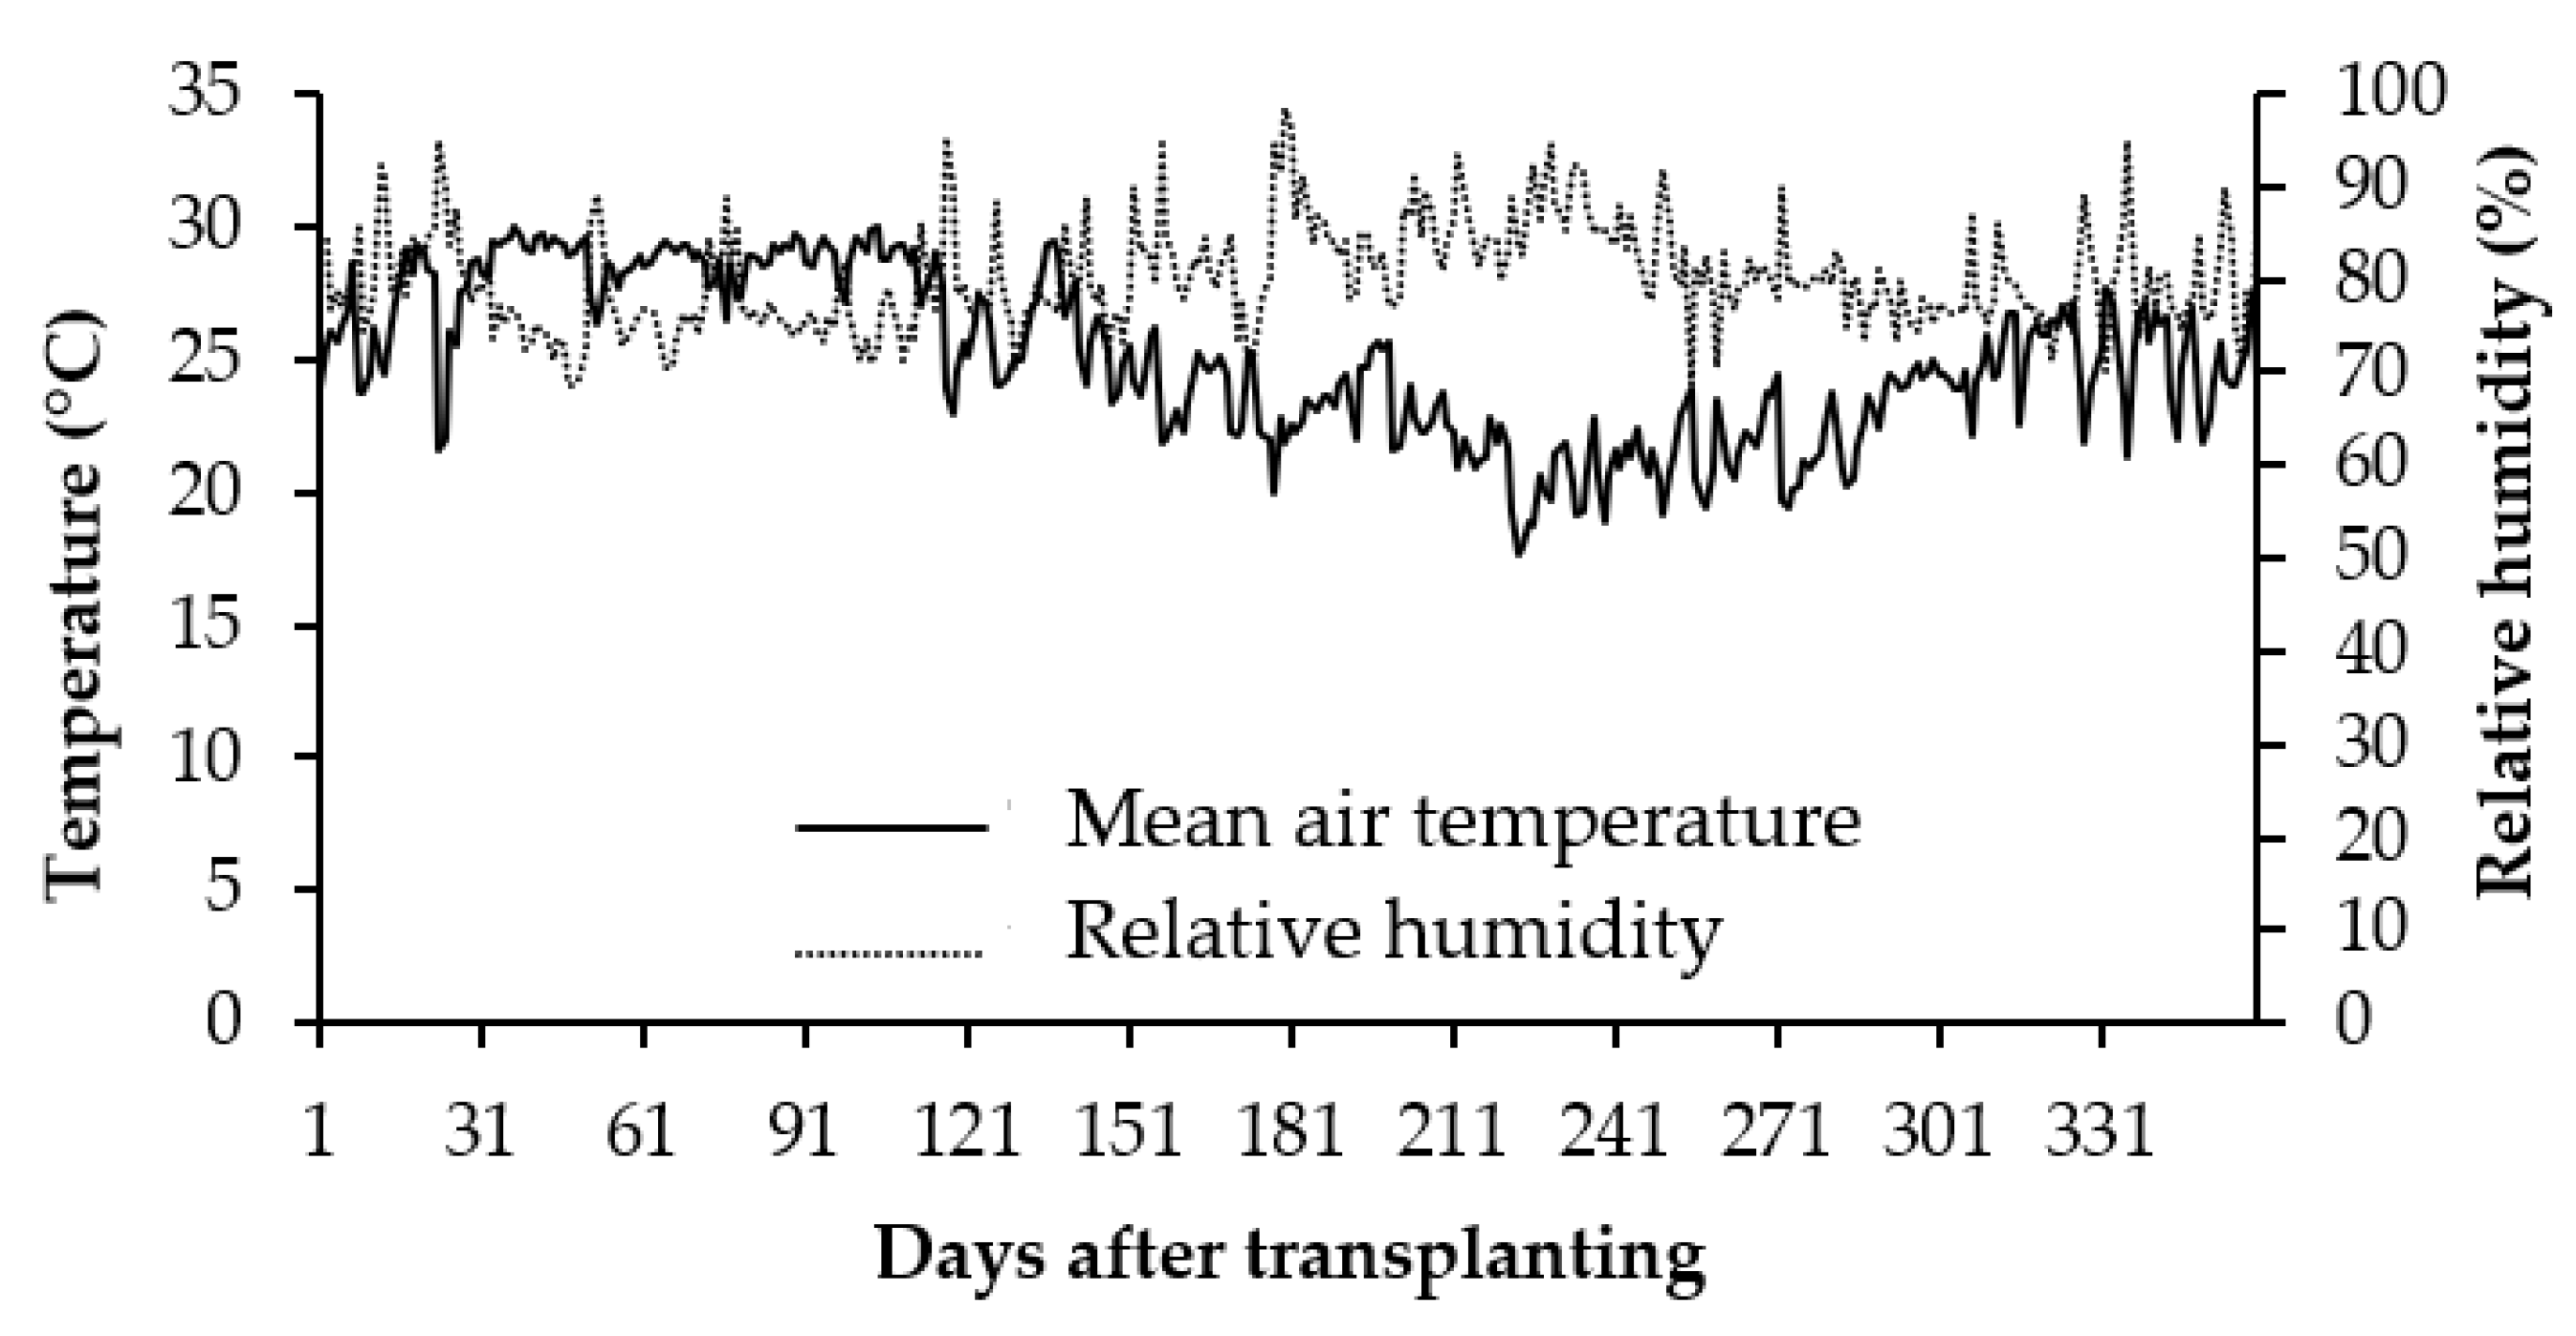
The experiment was conducted in a greenhouse without active control of air temperature or relative humidity. These environmental variables were monitored using a WATCH DOG Weather Station (Spectrum Technologies, Inc., Aurora, IL, USA), programmed to record data at 1 h intervals. During the experimental period, air temperature ranged from 17.7 to 30.0 °C, whereas relative humidity ranged from 68.5% to 98.5% (Figure 3). Seedlings were initially produced in 290 cm3 plastic tubes filled with a substrate composed of sand and Basaplant® Hortaliças BX (Indústria e Comércio de Insumos Agrícolas Ltd.a, São Paulo, Brazil). Juçara seeds were collected from a forest area in Venda Nova, Espírito Santo State, Brazil, and provided by the Instituto Capixaba de Pesquisa, Assistência Técnica e Extensão Rural (Incaper). Açaí seeds, originating from the Amazon region and genetically improved by Embrapa (Brasília, Brazil) for upland cultivation, were supplied by the Active Germplasm Bank of Embrapa Amazônia Oriental, Belém, Pará State, Brazil.
At 120 days after sowing, the seedlings were transplanted into 16 L black polyethylene pots filled with a substrate composed of soil, sand, and Basaplant® Hortaliças BX at a 1:1:1 ratio (v/v/v). The substrate was fertilized according to its chemical characteristics (Table 4) and the nutritional requirements of the plants, following Cravo et al. [31]. The experiment was arranged in a randomized complete block design in a 5 × 2 factorial arrangement. The first factor consisted of five irrigation water electrical conductivity levels (ECw: 0.1, 1.0, 2.0, 3.0, and 5.0 dS m−1), with 0.1 dS m−1, without NaCl addition, considered the control. The second factor consisted of two palm species: açaí (Euterpe oleracea Mart. cv. BRS Pará; registration no. 11.300 RNC/MAPA [32]) and juçara (Euterpe edulis Mart.). Ten treatments were evaluated using four replicates, with two pots per experimental unit and one plant per pot.
Saline solutions were prepared by adding sodium chloride (NaCl) to tap water with an initial electrical conductivity (ECw) of 0.1 dS m−1. The amount of salt required to obtain each salinity level (Table 2) was calculated using Equation (1):
Cs = 0.01 × [(CEd − CEau)/Gp] × Peq
where Cs = salt concentration (g L−1); ECd = desired electrical conductivity (dS m−1); ECw = electrical conductivity of the supply water (dS m−1); Peq = equivalent weight; and Gp = purity degree of the salt, according to Cavalcante et al. (2010) [33].
Irrigation was controlled by the gravimetric method, replacing the volume of water lost by evapotranspiration to maintain substrate moisture above 70% of field capacity (FC). Pots were weighed every 2 days at a fixed time to determine water consumption, and the required volume was reapplied. The volume of water applied per plant (Va) was calculated as:
Va = PM100% FC − Pa
where Va = applied water volume (mL); Pa = current pot weight (kg); and PM100%FC = mean pot weight at 100% field capacity (kg).
Electrical conductivity of the prepared solutions was verified using a digital bench conductivity meter (model MCA-150.1, MS Tecnopon, Piracicaba, SP, Brazil). Solutions were prepared weekly and stored in sealed containers in a cool, shaded environment to prevent changes due to temperature fluctuations and evaporation.
Treatments were initiated at 210 days after transplanting (DAT), when seedlings were fully established. Plants were subjected to three stress periods of 30 days each, interspersed with a leaching fraction corresponding to 20% of the total applied water volume, to minimize salt accumulation in the substrate (Table 5). Treatments were resumed after 7 days, when substrate moisture reached the minimum threshold (70% FC). The total duration of stress imposition was 104 days, after which evaluations were performed.

4.2. Chlorophyll Fluorescence and Gas Exchange Analyses

Relative chlorophyll content was measured using a portable chlorophyll meter (SPAD-502, Konica Minolta, Tokyo, Japan). Chlorophyll a fluorescence was determined using a non-modulated fluorometer (Pocket PEA Chlorophyll Fluorimeter®, Hansatech Instruments Ltd., Norfolk, UK) after the leaves had been dark-adapted for 30 min. The measured and calculated fluorescence parameters included initial fluorescence (F0), maximum fluorescence (Fm), variable fluorescence (Fv = Fm − F0), maximum quantum yield of PSII (Fv/Fm), maximum photochemical efficiency of PSII (Fv/F0), basal non-photochemical quantum yield (F0/Fm), and performance index (PI).
Gas exchange measurements were performed on the middle third of the most recently fully expanded leaf between 08:00 and 10:00 h using an infrared gas analyzer (LCpro-SD Portable Photosynthesis System®, ADC BioScientific Limited, London, UK). The equipment was operated at a constant airflow of 300 mL min−1 and a photosynthetic photon flux density of 1200 µmol m−2 s−1. The evaluated variables were leaf temperature (Tleaf, °C), intercellular CO2 concentration (Ci, µmol mol−1), stomatal conductance (gs, mol H2O m−2 s−1), net photosynthetic rate (A, µmol CO2 m−2 s−1), and transpiration rate (E, mmol H2O m−2 s−1). Instantaneous water-use efficiency was calculated as the ratio between net photosynthetic rate and transpiration rate (WUE = A/E).

4.3. Sodium, Chloride, and Phenolic Compound Concentration and Content

Chemical analyses were performed using oven-dried leaf and stem tissues to determine foliar concentrations and shoot contents. Phenolic compounds were quantified based on the methodology for total soluble polyphenol content in alcoholic solution, using the method described by Anderson and Ingram (1994) [34], through reaction with the Folin–Dennis reagent and absorbance reading at 760 nm using a Specord UV-Vis spectrophotometer (Analytik Jena, Jena, Germany). Sodium (Na+) and chloride (Cl) concentrations were determined according to the methodology recommended by Silva (1999) [35].

4.4. Statistical Analysis

Initially, data normality was assessed using the Shapiro–Wilk test. Data were subjected to analysis of variance (ANOVA) using the F-test (p ≤ 0.05). When significant, means for species were compared using Tukey’s test (p ≤ 0.05). The effect of salinity levels (ECw) was evaluated by regression analysis. Statistical analyses were performed using Sisvar 5.6 software [36].

5. Conclusions

Salt stress reduces the physiological performance of young açaí and juçara plants by promoting stomatal closure, decreasing gas exchange, and impairing the photochemical efficiency of photosystem II. The reduction in net photosynthesis was primarily associated with stomatal limitation and was further aggravated by photoinhibition at higher salinity levels, without significant changes in chlorophyll content. Açaí plants exhibited greater tolerance to salt stress than juçara plants, as evidenced by higher photosynthetic rates and greater water-use efficiency.

Author Contributions

Conceptualization, T.M.S., A.J.C.d.C. and P.C.d.S.; methodology, T.M.S., A.J.C.d.C., P.C.d.S., M.S.M.F., R.F.d.M.T., A.C.R., V.d.F.M. and H.D.V.; formal analysis, T.M.S., P.C.d.S., R.F.d.M.T., Á.C.M. and M.Z.; investigation, T.M.S., P.C.d.S., R.F.d.M.T., A.d.J.C., Á.C.M., M.E.V., A.C.R., V.d.F.M. and H.D.V.; data curation, T.M.S., P.C.d.S., R.F.d.M.T. and Á.C.M.; resources, A.J.C.d.C., M.S.M.F. and H.D.V.; supervision, A.J.C.d.C. and P.C.d.S.; project administration, A.J.C.d.C.; funding acquisition, A.J.C.d.C.; validation and interpretation of data, T.M.S., A.J.C.d.C., P.C.d.S., M.S.M.F., M.Z., L.P.D., M.P.S.d.S. and O.S.d.O.F.; visualization, T.M.S., P.C.d.S., R.F.d.M.T., M.E.V., Á.C.M., M.Z. and L.P.D.; writing—original draft preparation, T.M.S.; writing—review and editing, T.M.S., A.J.C.d.C., P.C.d.S., M.S.M.F., R.F.d.M.T., A.d.J.C., Á.C.M., A.C.R., V.d.F.M., M.E.V., M.Z., L.P.D., H.D.V., M.P.S.d.S. and O.S.d.O.F. All authors have read and approved the final version of the manuscript and agree to be accountable for all aspects of the work. All authors have read and agreed to the published version of the manuscript.

Funding

The authors acknowledge the financial support for this research and the doctoral scholarship provided by Coordenação de Aperfeiçoamento de Pessoal de Nível Superior (CAPES). The authors also thank Fundação de Amparo à Pesquisa do Estado do Rio de Janeiro (FAPERJ) and Fundação de Amparo à Pesquisa e Inovação do Espírito Santo (FAPES) for financial support and for promoting scientific and technical publications.

Institutional Review Board Statement

Not applicable.

Informed Consent Statement

Not applicable.

Data Availability Statement

The original contributions presented in this study are included in the article. Further inquiries can be directed to the corresponding author(s).

Acknowledgments

The authors would like to thank the Laboratory of Tropical Plant Physiology (LFIT), Center for Agricultural Sciences and Technologies (CCTA), at the State University of Northern Rio de Janeiro (UENF), for providing the facilities and technical support for this research. We are especially grateful to Almy Junior Cordeiro de Carvalho for his supervision and guidance. We also thank our colleagues and laboratory collaborators, Paulo Cesar Santos, Gabriella Linhares, Marlon Altoé, Aurilena Aviz, and Rozane Franci, as well as the undergraduate students Adonay Aguiar and Rosana Nani, for their invaluable support, dedication, and contributions throughout this study.

Conflicts of Interest

The authors declare no conflicts of interest.

References

  1. Vianna, L.F.; Zambonim, F.; Pandolfo, C. Potential Cultivation Areas of Euterpe edulis (Martius) for Rainforest Recovery, Repopulation and Açaí Production in Santa Catarina, Brazil. Sci. Rep. 2023, 13, 6272. [Google Scholar] [CrossRef] [Scilit] [PubMed]
  2. IBGE. Production from Plant Extraction and Silviculture; Brazilian Institute of Geography and Statistics (IBGE): Rio de Janeiro, Brazil, 2024. Available online: https://biblioteca.ibge.gov.br/index.php/biblioteca-catalogo?view=detalhes&id=774 (accessed on 15 June 2026).
  3. Farias, M. Reinventing the Human–Euterpe edulis Relationship: From Heart of Palm to Açaí. Master’s Thesis, Federal University of Santa Catarina, Florianópolis, Brazil, 2009. Available online: https://repositorio.ufsc.br/bitstream/handle/123456789/106683/266262.pdf?sequence=1 (accessed on 15 June 2026).
  4. Martins, S.V.; Souza, M.N. Cultivation of Juçara Palm (Euterpe edulis Mart.): Heart-of-Palm Production and Forest Restoration; Aprenda Fácil Editora: Viçosa, Brazil, 2009; 107p. [Google Scholar]
  5. Martins, C.C.; Nakagawa, J.; Bovi, M.L.A. Evaluation of the physiological quality of açaí seeds. Rev. Bras. Frutic. 2009, 31, 231–235. [Google Scholar] [CrossRef] [Scilit]
  6. de Oliveira, E.P.; Ximenes, L.C.; Gama, J.R.V.; Vieira, T.A. Non-wood forest product extractivism: A case study of Euterpe oleracea Martius in the Brazilian Amazon. Sustainability 2025, 17, 464. [Google Scholar] [CrossRef] [Scilit]
  7. Flowers, T.J.; Colmer, T.D. Plant salt tolerance: Adaptations in halophytes. Ann. Bot. 2015, 115, 327–331. [Google Scholar] [CrossRef] [Scilit] [PubMed]
  8. Martínez, N.; López, C.; Basurto, M.; Pérez, R. Efectos por salinidad en el desarrollo vegetativo. Medio Ambiente Desarro. Sustentable 2010, 5, 156–161. [Google Scholar]
  9. Singh, A. Soil salinity: A global threat to sustainable development. Soil Use Manag. 2022, 38, 39–67. [Google Scholar] [CrossRef] [Scilit]
  10. Zhu, J.K. Salt and drought stress signal transduction in plants. Annu. Rev. Plant Biol. 2002, 53, 247–273. [Google Scholar] [CrossRef] [Scilit]
  11. Hasegawa, P.M.; Bressan, R.A.; Zhu, J.K.; Bohnert, H.J. Plant cellular and molecular responses to high salinity. Annu. Rev. Plant Physiol. Plant Mol. Biol. 2000, 51, 463–499. [Google Scholar] [PubMed]
  12. Tester, M.; Davenport, R. Na+ tolerance and Na+ transport in higher plants. Ann. Bot. 2003, 91, 503–527. [Google Scholar] [CrossRef] [Scilit] [PubMed]
  13. Ibrahimova, U.; Kumari, P.; Yadav, S.; Rastogi, A.; Antala, M.; Suleymanova, Z.; Ziveak, M.; Tahjib-Ul-Arif, M.; Hussain, S.; Abdelhamid, M.; et al. Progress in understanding salt stress response in plants using biotechnological tools. J. Biotechnol. 2021, 329, 180–191. [Google Scholar] [CrossRef] [Scilit] [PubMed]
  14. Balasubramaniam, T.; Shen, G.; Esmaeili, N.; Zhang, H. Plants’ response mechanisms to salinity stress. Plants 2023, 12, 2253. [Google Scholar] [CrossRef] [Scilit] [PubMed]
  15. Zhao, S.; Zhang, Q.; Liu, M.; Zhou, H.; Ma, C.; Wang, P. Regulation of plant responses to salt stress. Int. J. Mol. Sci. 2021, 22, 4609. [Google Scholar] [CrossRef] [Scilit] [PubMed]
  16. Dhokne, K.; Pandey, J.; Yadav, R.M.; Ramachandran, P.; Rath, J.R.; Subramanyam, R. Change in the photochemical and structural organization of thylakoids from pea (Pisum sativum) under salt stress. Plant Physiol. Biochem. 2022, 177, 46–60. [Google Scholar] [CrossRef] [Scilit] [PubMed]
  17. Trușcă, M.; Gâdea, Ș.; Vidican, R.; Stoian, V.; Vâtcă, A.; Balint, C.; Stoian, V.A.; Horvat, M.; Vâtcă, S. Exploring the research challenges and perspectives in ecophysiology of plants affected by salinity stress. Agriculture 2023, 13, 734. [Google Scholar] [CrossRef] [Scilit]
  18. Hameed, A.; Ahmed, M.Z.; Hussain, T.; Aziz, I.; Ahmad, N.; Gul, B.; Nielsen, B.L. Effects of salinity stress on chloroplast structure and function. Cells 2021, 10, 2023. [Google Scholar] [CrossRef] [Scilit] [PubMed]
  19. Xiao, F.; Zhou, H. Plant salt response: Perception, signaling, and tolerance. Front. Plant Sci. 2023, 13, 1053699. [Google Scholar] [CrossRef] [Scilit] [PubMed]
  20. Björkman, O.; Demmig, B. Photon yield of O2 evolution and chlorophyll fluorescence characteristics at 77 K among vascular plants of diverse origins. Planta 1987, 170, 489–504. [Google Scholar] [CrossRef] [Scilit] [PubMed]
  21. Bolhar-Nordenkampf, H.R.; Long, S.P.; Baker, N.R.; Oquist, G.; Schreiber, U.; Lechner, E.G. Chlorophyll fluorescence as probe of the photosynthetic competence of leaves in the field: A review of current instrument. Funct. Ecol. 1989, 3, 497–514. [Google Scholar] [CrossRef] [Scilit]
  22. Rohácek, K. Chlorophyll fluorescence parameters: The definitions, photosynthetic meaning, and mutual relationships. Photosynthetica 2002, 40, 13–29. [Google Scholar] [CrossRef] [Scilit]
  23. Zanandrea, I.; Nassi, F.L.; Turchetto, A.C.; Braga, E.J.B.; Peters, J.A.; Bacarin, M.A. Effect of salinity on fluorescence parameters in Phaseolus vulgaris. Rev. Bras. Agrociência 2006, 12, 157–161. [Google Scholar]
  24. Zonta, L.V.; Dos Santos, P.C.; Tavares, R.F.d.M.; Carvalho, A.J.C.d.; Freitas, M.S.M.; Vieira, H.D.; Moraes, S.d.P.C.B.; Bento, C.d.S.; Zucoloto, M.; Ramos, A.C.; et al. Açaí and Juçara Residues as Substrate Components for Euterpe edulis Seedling Production: Growth, Nutrient Status and Physiological Responses. Horticulturae 2026, 12, 663. [Google Scholar] [CrossRef] [Scilit]
  25. Menezes, E.M.S.; Torres, A.T.; Sabaa Srur, A.U. Nutritional value of lyophilized açaí pulp (Euterpe oleracea Mart.). Acta Amaz. 2008, 38, 311–316. [Google Scholar]
  26. Vannuchi, N.; Jamar, G.; Pisani, L.; Braga, A.R.C.; Rosso, V.V. Chemical composition, bioactive compounds extraction, and observed biological activities from jussara (Euterpe edulis): The exotic and endangered Brazilian superfruit. Compr. Rev. Food Sci. Food Saf. 2021, 20, 3192–3224. [Google Scholar] [CrossRef] [Scilit] [PubMed]
  27. Kumar, K.; Debnath, P.; Singh, S.; Kumar, N. An overview of plant phenolics and their involvement in abiotic stress tolerance. Stresses 2023, 3, 570–585. [Google Scholar] [CrossRef] [Scilit]
  28. Baker, N.R. Chlorophyll Fluorescence: A Probe of Photosynthesis In Vivo. Annu. Rev. Plant Biol. 2008, 59, 89–113. [Google Scholar] [CrossRef] [Scilit] [PubMed]
  29. Chen, T.-W.; Kahlen, K.; Stützel, H. Disentangling the Contributions of Osmotic and Ionic Effects of Salinity on Stomatal, Mesophyll, Biochemical and Light Limitations to Photosynthesis. Plant Cell Environ. 2015, 38, 1528–1542. [Google Scholar] [CrossRef] [Scilit] [PubMed]
  30. Du, B.; Ma, Y.; Yáñez-Serrano, A.M.; Arab, L.; Fasbender, L.; Alfarraj, S.; Albasher, G.; Hedrich, R.; White, P.J.; Werner, C.; et al. Physiological Responses of Date Palm (Phoenix dactylifera) Seedlings to Seawater and Flooding. New Phytol. 2021, 229, 3318–3329. [Google Scholar] [CrossRef] [Scilit] [PubMed]
  31. Cravo, M.S.; Viégas, I.J.M.; Brasil, E.C. Fertilization and Liming Recommendations for the State of Pará, 1st ed.; Revista Atual: Belém, Brazil, 2010; 262p. [Google Scholar]
  32. MAPA—Ministry of Agriculture and Livestock. National Register of Cultivars (RNC): Registered Cultivars and Cultivated Species. Available online: https://sistemas.agricultura.gov.br/snpc/cultivarweb/detalhe_cultivar.php?codsr=11288&codverif=0 (accessed on 20 May 2026).
  33. Cavalcante, I.H.L.; Dias, T.J. Sources and salinity levels of irrigation water in the production of papaya seedlings cv. Sunrise Solo. Semin. Ciênc. Agrár. 2010, 31, 1281–1290. [Google Scholar]
  34. Anderson, J.D.; Ingram, J.S.I. Tropical Soil Biology and Fertility: A Handbook of Methods, 2nd ed.; CAB International: Wallingford, UK, 1994; p. 265. Available online: https://www.ovid.com/jnls/soilsci/abstract/00010694-199404000-00012~tropical-soil-biology-and-fertility-a-handbook-of-methods (accessed on 20 June 2026).
  35. Silva, F.C. Manual of Chemical Analyses of Soils, Plants, and Fertilizers; Embrapa Comunicação para Transferência de Tecnologia: Brasília, Brazil, 1999; 370p. [Google Scholar]
  36. Ferreira, D.F. SISVAR: A Computer Analysis System to Fixed Effects Split Plot Type Designs. Rev. Bras. Biom. 2019, 37, 529–535. Available online: http://www.biometria.ufla.br/index.php/BBJ/article/view/450 (accessed on 10 May 2026). [CrossRef] [Scilit]
Figure 1. Maximum quantum yield of PSII (Fv/Fm) (a), basal non-photochemical quantum yield (F0/Fm) (b), and maximum photochemical efficiency of PSII (Fv/F0) (c) [mean of both Euterpe species] in açaí and juçara plants at 16 months after sowing, subjected to increasing irrigation water salinity (EC). Regression (* p = 0.05 and ** p = 0.01).
Stresses 06 00053 g001
Figure 2. Stomatal conductance (gs) (a), net photosynthesis (A) (b), and transpiration (E) (c) [mean across both Euterpe species] in açaí and juçara plants at 16 months after sowing under increasing irrigation water salinity levels (EC). Regression (* p = 0.05 and ** p = 0.01).
Stresses 06 00053 g002
Figure 3. Mean air temperature (°C) and relative humidity (%) inside the greenhouse during the experimental period.
Stresses 06 00053 g003
Table 1. Relative chlorophyll content (SPAD) and chlorophyll a fluorescence parameters, including maximum quantum yield of PSII (Fv/Fm), basal non-photochemical quantum yield (F0/Fm), maximum photochemical efficiency of PSII (Fv/F0), and performance index (PI) [mean across five electrical conductivity levels] in açaí and juçara plants at 16 months after sowing, subjected to irrigation water salinity (EC).
SpeciesSPADFv/FmF0/FmFv/F0PI
Açaí41.22 a 10.751 a0.249 a3.138 a2.02 a
Juçara37.61 a 10.712 a0.288 a2.836 a1.54 a
Mean39.410.730.272.991.78
CV%16.711.9432.7920.6760.13
1 Means followed by the same letters within the column do not differ significantly at p ≤ 0.05 by Tukey’s test. CV = coefficient of variation.
Table 2. Mean values of gas exchange variables, including leaf temperature (Tleaf), stomatal conductance (gs), net photosynthetic rate (A), transpiration (E), water-use efficiency (WUE), and intercellular CO2 concentration (Ci) [mean across the five irrigation water electrical conductivity levels] in young açaí and juçara plants at 16 months after sowing under increasing salinity levels (EC) in the irrigation water.
SpeciesTleafgsA
°C(mol de H2O m−2 s−1)(µmol de CO2 m−2 s−1)
Açaí37.72 a0.037 a4.11 a
Juçara35.67 a0.029 a2.75 b
Mean35.690.0333.430
CV%2.0146.7430.50
SpeciesEWUECi
(mmol de H2O m−2 s−1)(A/E)
Açaí1.16 a 13.46 a200.05 a
Juçara0.95 a2.91 b225.90 a
Mean1.103.18212.98
CV%30.7624.462.01
Means followed by the same letter within the column do not differ significantly at the 5% probability level according to Tukey’s test. CV = coefficient of variation.
Table 3. Leaf concentration (Conc., g kg−1) and shoot accumulation (Acc., mg plant−1) of sodium (Na+), chloride (Cl), and phenolic compounds in açaí and juçara plants at 16 months after sowing under increasing salinity levels (EC) in the irrigation water.
SpeciesNa+ClPhenolic Compounds
Conc.
g kg−1
Acc.
mg Plant−1
Conc.
g kg−1
Acc.
mg Plant−1
Conc.
g kg−1
Acc.
mg Plant−1
Açaí2.65 a 150.72 a0.98 a22.20 a30.37 a434.02 a
Juçara3.11 a 161.58 a1.11 a25.20 a16.09 b265.12 b
Mean2.8856.151.0423.6823.22349.57
CV%31.634.1742.4248.669.3428.07
1 Means followed by different letters within the column differ significantly at the 5% probability level according to Tukey’s test. CV = coefficient of variation.
Table 4. Chemical characteristics of the substrate (soil + sand + Basaplant®, 1:1:1, v/v) used for the growth of Euterpe species under irrigation water salinity. Campos dos Goytacazes, RJ, Brazil.
pH S-SO4 P K Ca Mg Na Al H + Al C OM
(H2O) --- mg dm−3 --- ------------------ mmolc dm−3 -------------------- --- g dm−3 ---
5.5 163 47 1.8 27.9 15.7 1.8 0.00 34.3 21.1 36.38
CECSBVmISNaFeCuZnMnB
mmolc dm−3---------------------- % ------------------------------------ mg dm−3 ------------------
81.5 47.2 58 0 2 37.68 0.45 4.29 30 0.43
pH = hydrogen ion concentration, S = Sulfur, P = phosphorus, K = potassium, Ca = calcium, Mg = magnesium, Na = sodium, Al = aluminum, H = hydrogen, C = carbon, OM = organic matter, CEC = cation exchange capacity, SB = sum of bases, V = base saturation, (%); m = aluminum saturation CEC = cation exchange capacity, (%); ISNa = sodium saturation index, Fe = Iron, Zn = zinc, Cu = copper, Mn = manganese, B = boron.
Table 5. Volume of water applied during stress periods and leaching fraction throughout the experimental period.
Stress Period Accumulated Volume (Va) Leaching Fraction (V)
(days) (L)(L)
302.820.57
605.101.02
906.00----
Disclaimer/Publisher’s Note: The statements, opinions and data contained in all publications are solely those of the individual author(s) and contributor(s) and not of MDPI and/or the editor(s). MDPI and/or the editor(s) disclaim responsibility for any injury to people or property resulting from any ideas, methods, instructions or products referred to in the content.