


Abstract
Salt stress represents one of the main challenges for global agricultural production, and digital phenotyping has emerged as a promising alternative for identifying popcorn genotypes tolerant to salt stress. This study evaluated the accumulation of plant pigments in response to salt stress in 49 popcorn genotypes (7 inbred lines and 42 F1 hybrids). Seeds were subjected to two saline conditions: without salt stress (NS—0 mM NaCl) and salt stressed (SS—100 mM NaCl). The evaluation included physiological parameters, and morphological and colorimetric attributes based on the CIELab color space were analyzed using the GroundEye® system. Additionally, the salt stress tolerance index (SSTI) was calculated for all assessed genotypes. The SSTI ranged from 0.55 to 0.83, with values closer to 1.0 indicating higher tolerance to the stressor. Among the evaluated genotypes, L472 and four of its hybrids stood out for their salinity tolerance, as they combined efficient maintenance of chlorophyll content with higher SSTI estimates. In contrast, L217 and two of its hybrids were identified as sensitive, exhibiting some of the lowest SSTI estimates and significant accumulation of anthocyanins, which, in this study, indicated a response mechanism to oxidative damage. Digital phenotyping associated with CIELab colorimetric analysis constitutes an objective tool for identifying tolerant genotypes, thereby accelerating breeding programs aimed at developing cultivars adapted to saline environments.
1. Introduction
The growing demand for greater efficiency in plant breeding programs has highlighted a concerning asymmetry: while genomic technologies have advanced significantly in recent decades, phenotypic evaluation methodologies have not progressed at the same pace. This disparity, recognized in the literature as the “phenotyping bottleneck,” represents one of the main obstacles to genetic gain, as it compromises the accuracy of the statistical models used in breeding programs [1,2,3].
In this context, digital phenotyping has emerged as a promising alternative for overcoming these limitations, enabling the capture of phenotypic data with greater precision and on a large scale [3]. This approach allows for quantitative analyses of both plant structure and function, providing essential support for the identification and selection of traits of agronomic interest [4]. Among the available methodologies, digital image processing stands out, as it uses computer vision techniques to extract relevant information [5], producing reproducible results across different breeding strategies [6]. This approach involves the development of specialized algorithms and the analysis of two-dimensional (2D) and three-dimensional (3D) images and can also be integrated with systems based on different electromagnetic spectra and imaging technologies, such as visible light, infrared, X-rays, and magnetic systems [7].
The applicability of digital phenotyping has been widely demonstrated in economically important crops. In wheat, studies have reported its use in estimating plant height and yield [8], as well as in determining biophysical and biochemical attributes, such as chlorophyll content, leaf nitrogen, and biomass [9]. Similar results have been obtained in corn and rice [10]. More recently, images obtained by unmanned aerial vehicles have been successfully used to estimate soybean maturity dates and wheat plant height [11], highlighting the potential of this technology for large-scale field applications.
Among the phenotypic traits that can be evaluated using these tools, plant pigments stand out, as their accumulation can be captured and quantified through colorimetric analyses of digital images. This perspective is particularly relevant in the study of abiotic stresses, such as salinity, since pigment responses constitute sensitive indicators of the physiological changes triggered by this condition.
Salinity tolerance is a complex characteristic that varies not only among species, but also among genotypes within the same species, requiring the development of specific evaluation and selection strategies to obtain plants adapted to this condition. To ensure survival, plants employ a combination of physiological mechanisms, mainly including osmotic adjustment, ionic homeostasis, and protection of the photosynthetic apparatus. The strengthening of the antioxidant system is central to this adaptive response, with the accumulation of plant pigments being one of its most representative components, whether red, green or yellow [12,13].
Red pigments belong to the flavonoid class, a group of secondary metabolites that play a fundamental role in plant adaptation to environmental variations. Among them are anthocyanins, water-soluble pigments responsible for a wide range of colors from pink to blue [14,15]. Although anthocyanins act systemically and in diverse ways in response to salt stress, their biological importance and potential as phenotypic indicators in breeding programs still require further investigation [16].
Anthocyanin biosynthesis is normally induced by environmental factors, and a growing body of evidence confirms that its accumulation constitutes a relevant adaptive strategy in response to salinity [17,18,19]. These compounds stand out as potent antioxidants capable of scavenging reactive oxygen species (ROS), mediating signaling cascades, protecting the photosynthetic apparatus, delaying leaf senescence, and contributing to osmotic homeostasis [18,19,20]. Due to these properties, anthocyanin accumulation is already considered a selection criterion for genotypes tolerant to salt stress [21].
Similarly, yellow pigments play an important role in adapting plants to adverse conditions. Carotenoid biosynthesis is normally stimulated under stress conditions [13], with lutein and zeaxanthin standing out for their critical functions in chlorophyll photoprotection and the maintenance of photosynthetic efficiency [22,23]. Under environmental stress, plants tend to exhibit higher proportions of carotenoids relative to chlorophyll, increasing the pool of xanthophylls, such as zeaxanthin, antheraxanthin, and violaxanthin, to dissipate excess light energy via thermal pathways and protect the photosynthetic apparatus against the formation of ROS [24]. Zeaxanthin, in particular, acts proactively in the thermal dissipation of excess energy and in the direct neutralization of damage caused by singlet oxygen [22,25], also serving as a physical stabilizer of photosynthetic membranes [26].
Given the above, this study aimed to (i) evaluate the effect of salt stress on popcorn seed germination and seedling development; (ii) evaluate the physiological response and accumulation of plant pigments in popcorn genotypes subjected to salt stress; (iii) quantify changes in the colorimetric coordinates (CIELab A* and B*) of popcorn seedlings under contrasting saline conditions; and (iv) identify superior genotypes regarding tolerance to salt stress.
The results demonstrate that the accumulation of plant pigments is a potential indicator for identifying popcorn genotypes with tolerance to salt stress.
2. Results
2.1. Genetic Variability and Response Under Salt Stress
Individual analyses of variance for CIELab A* and B* indicated significant differences (p ≤ 0.01), according to the F test, between the two saline conditions for both evaluated traits (Table 1).
Table 1.
A summary of analysis of variance and genetic and environmental parameters of traits related to the accumulation of green–red (CIELab A*) and blue–yellow (CIELab B*) spectrum pigments in seedlings of 7 lines and 42 hybrids of popcorn (Zea mays L. var. everta) subjected to two saline conditions: without salt stress (0 mM NaCl) and salt-stressed (100 mM NaCl).
In the environment without salt stress, the genotypic variance (σ2g), which refers to the portion of the observed variation that is due to genetic differences between genotypes, and the environmental variance (σ2e), which refers to the portion of the observed variation that is caused by environmental conditions, for CIELab A* were 0.28 and 0.04, respectively, while the mean was −0.62. (Table 1). Under salt stress conditions, a change in the mean was observed, increasing to 0.69. The variances remained similar, with values of 0.21 for σ2g and 0.03 for σ2e (Table 1).
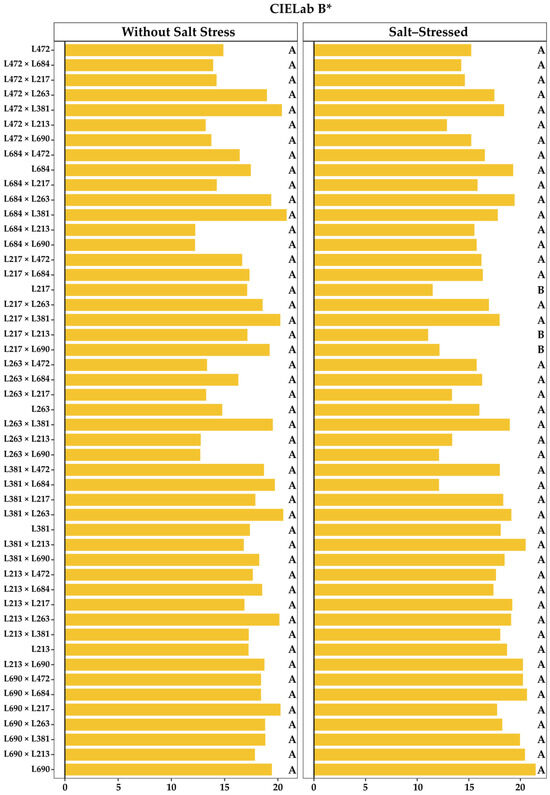
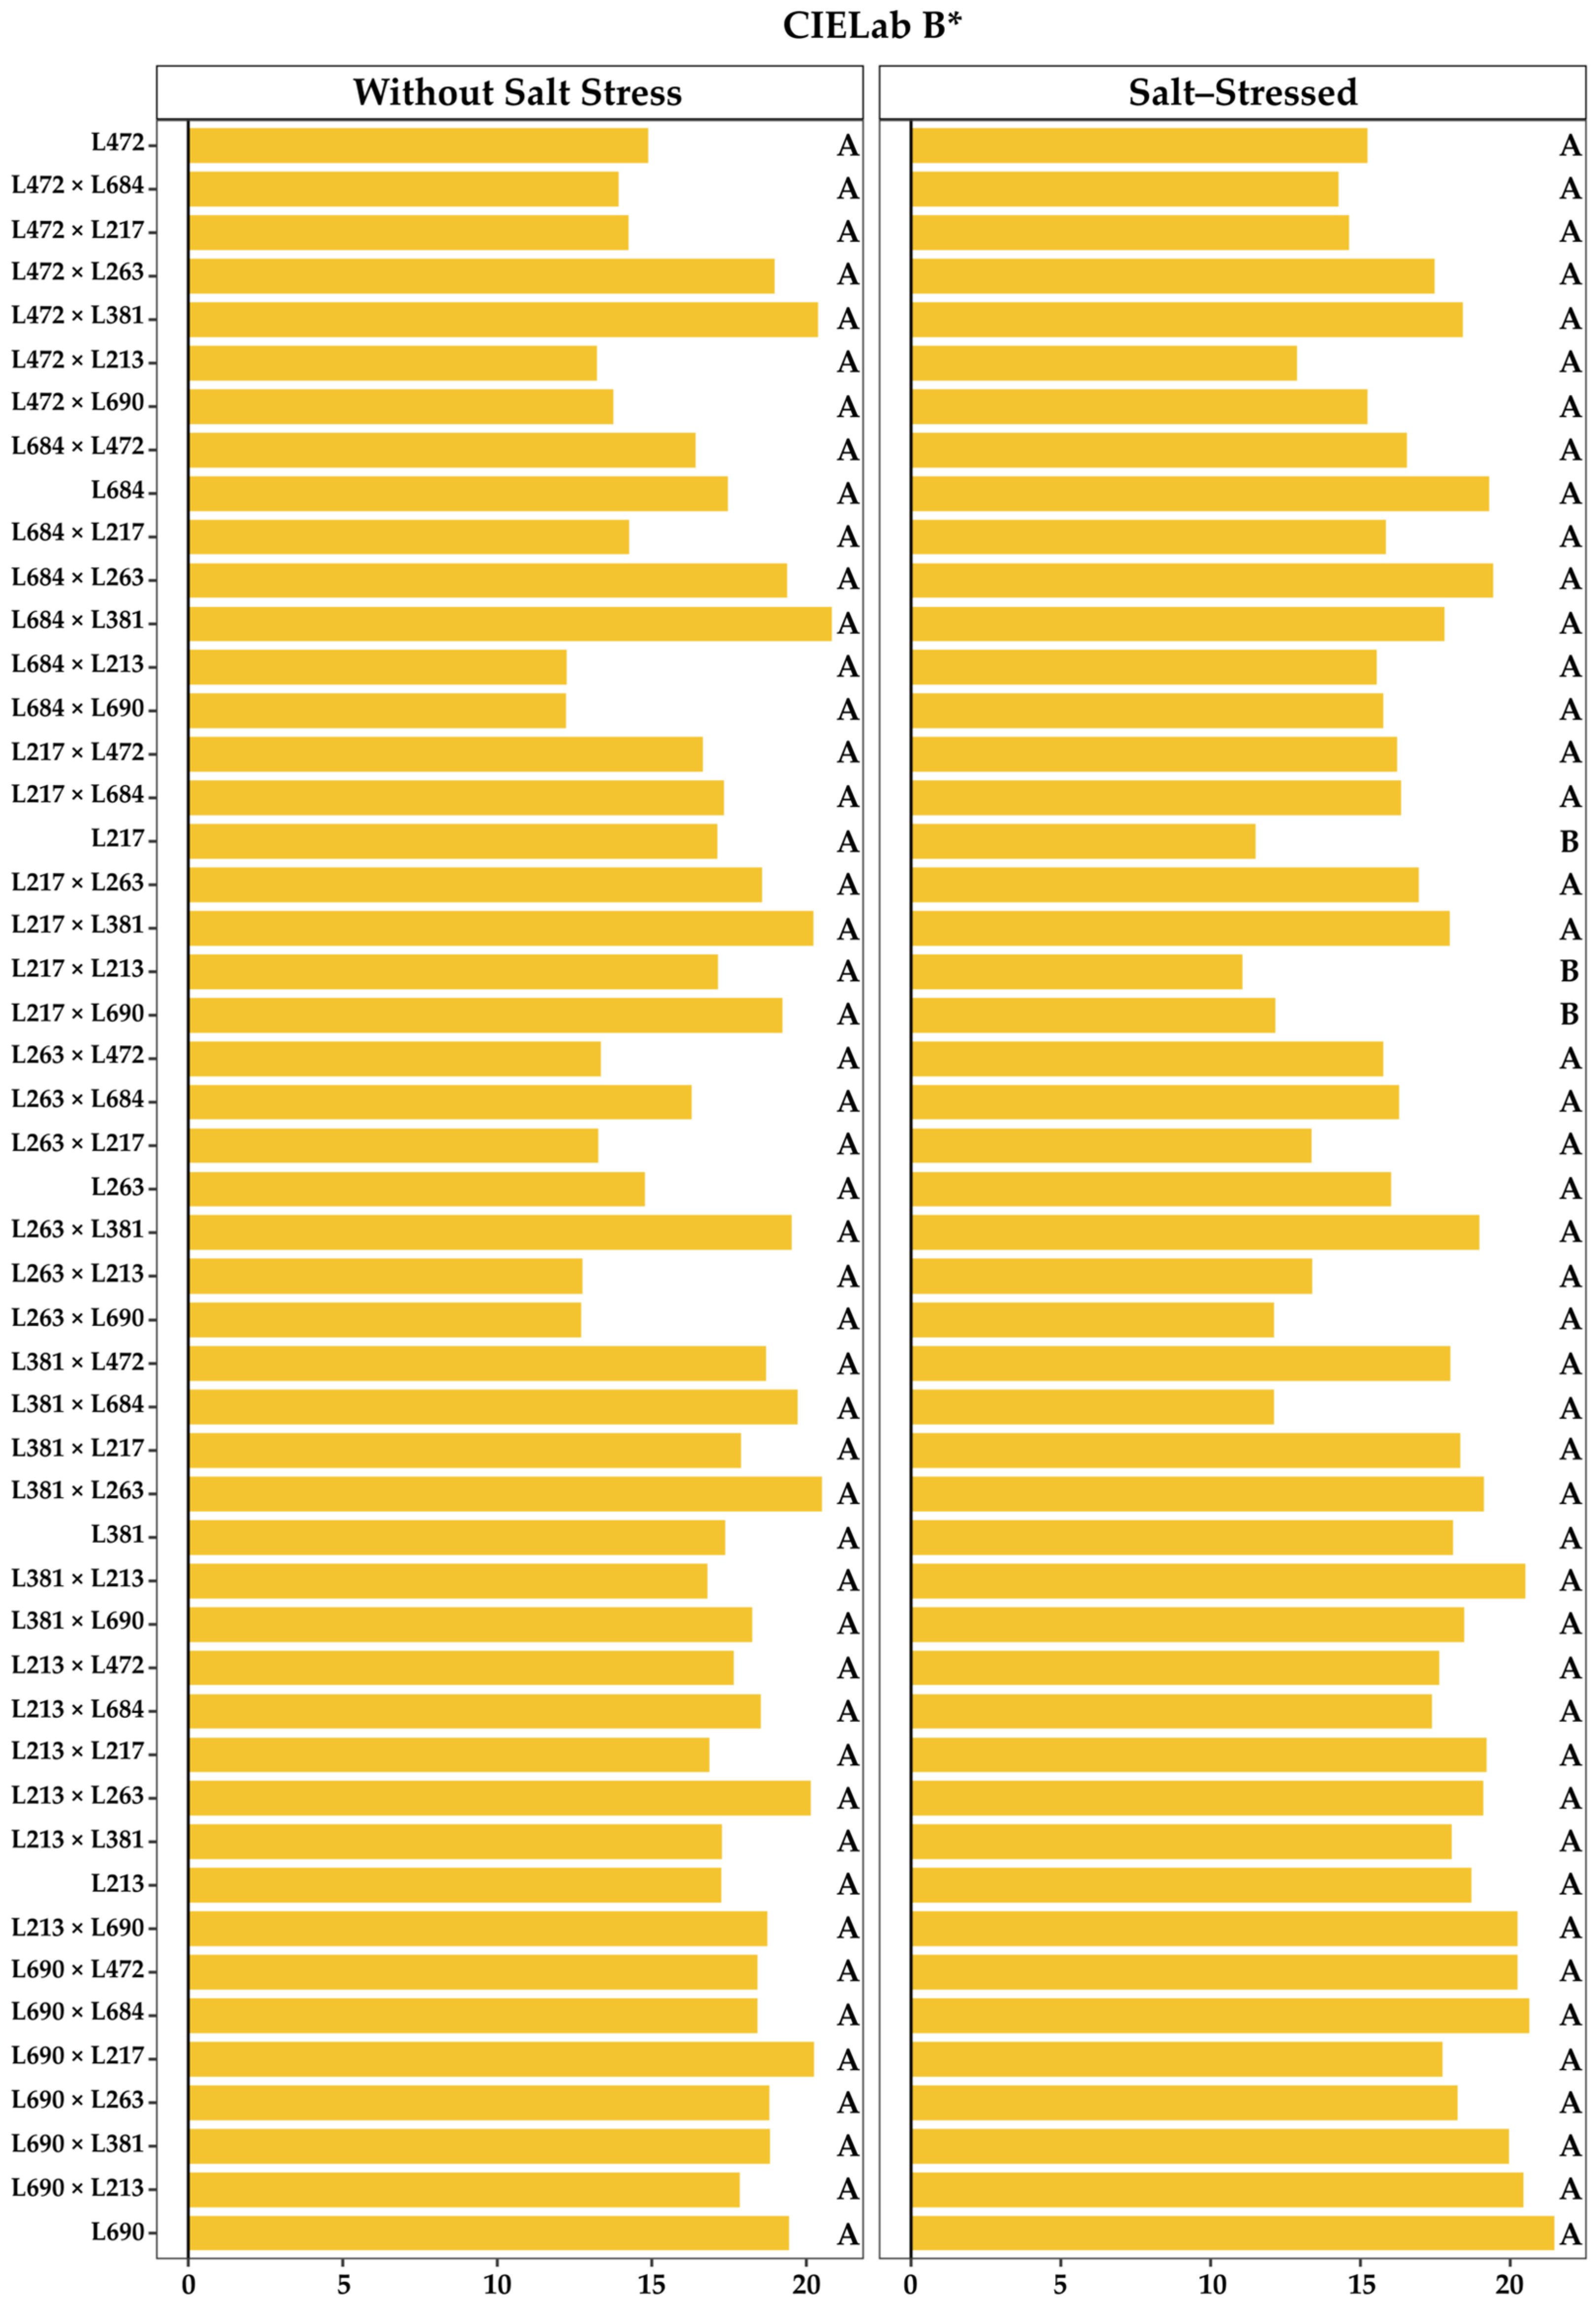
For CIELab B*, σ2g and σ2e were 4.74 and 1.45, respectively, in the environment without salt stress, and 5.30 and 1.31, respectively, in the environment with salt stress (Table 1). Although the mean expression of the trait remained practically constant in both environments, with values of 17.06 in the environment without salt stress and 17.05 under salt stress (Table 1), some genotypes showed changes in their mean values when exposed to salt stress.
The combined analysis of CIELab A* indicated statistically significant effects (p ≤ 0.01) for genotypes, saline conditions, and their interaction. For CIELab B*, only the environmental effect was not significant (Table 1).
2.2. Screening of Popcorn Genotypes for Salt Tolerance via Salt Stress Tolerance Index
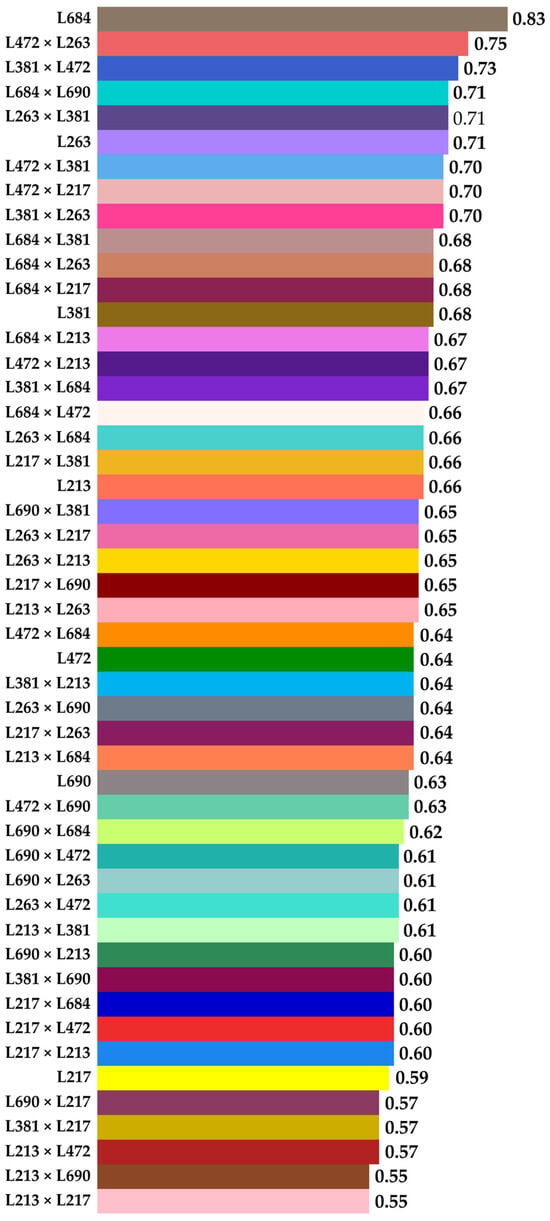
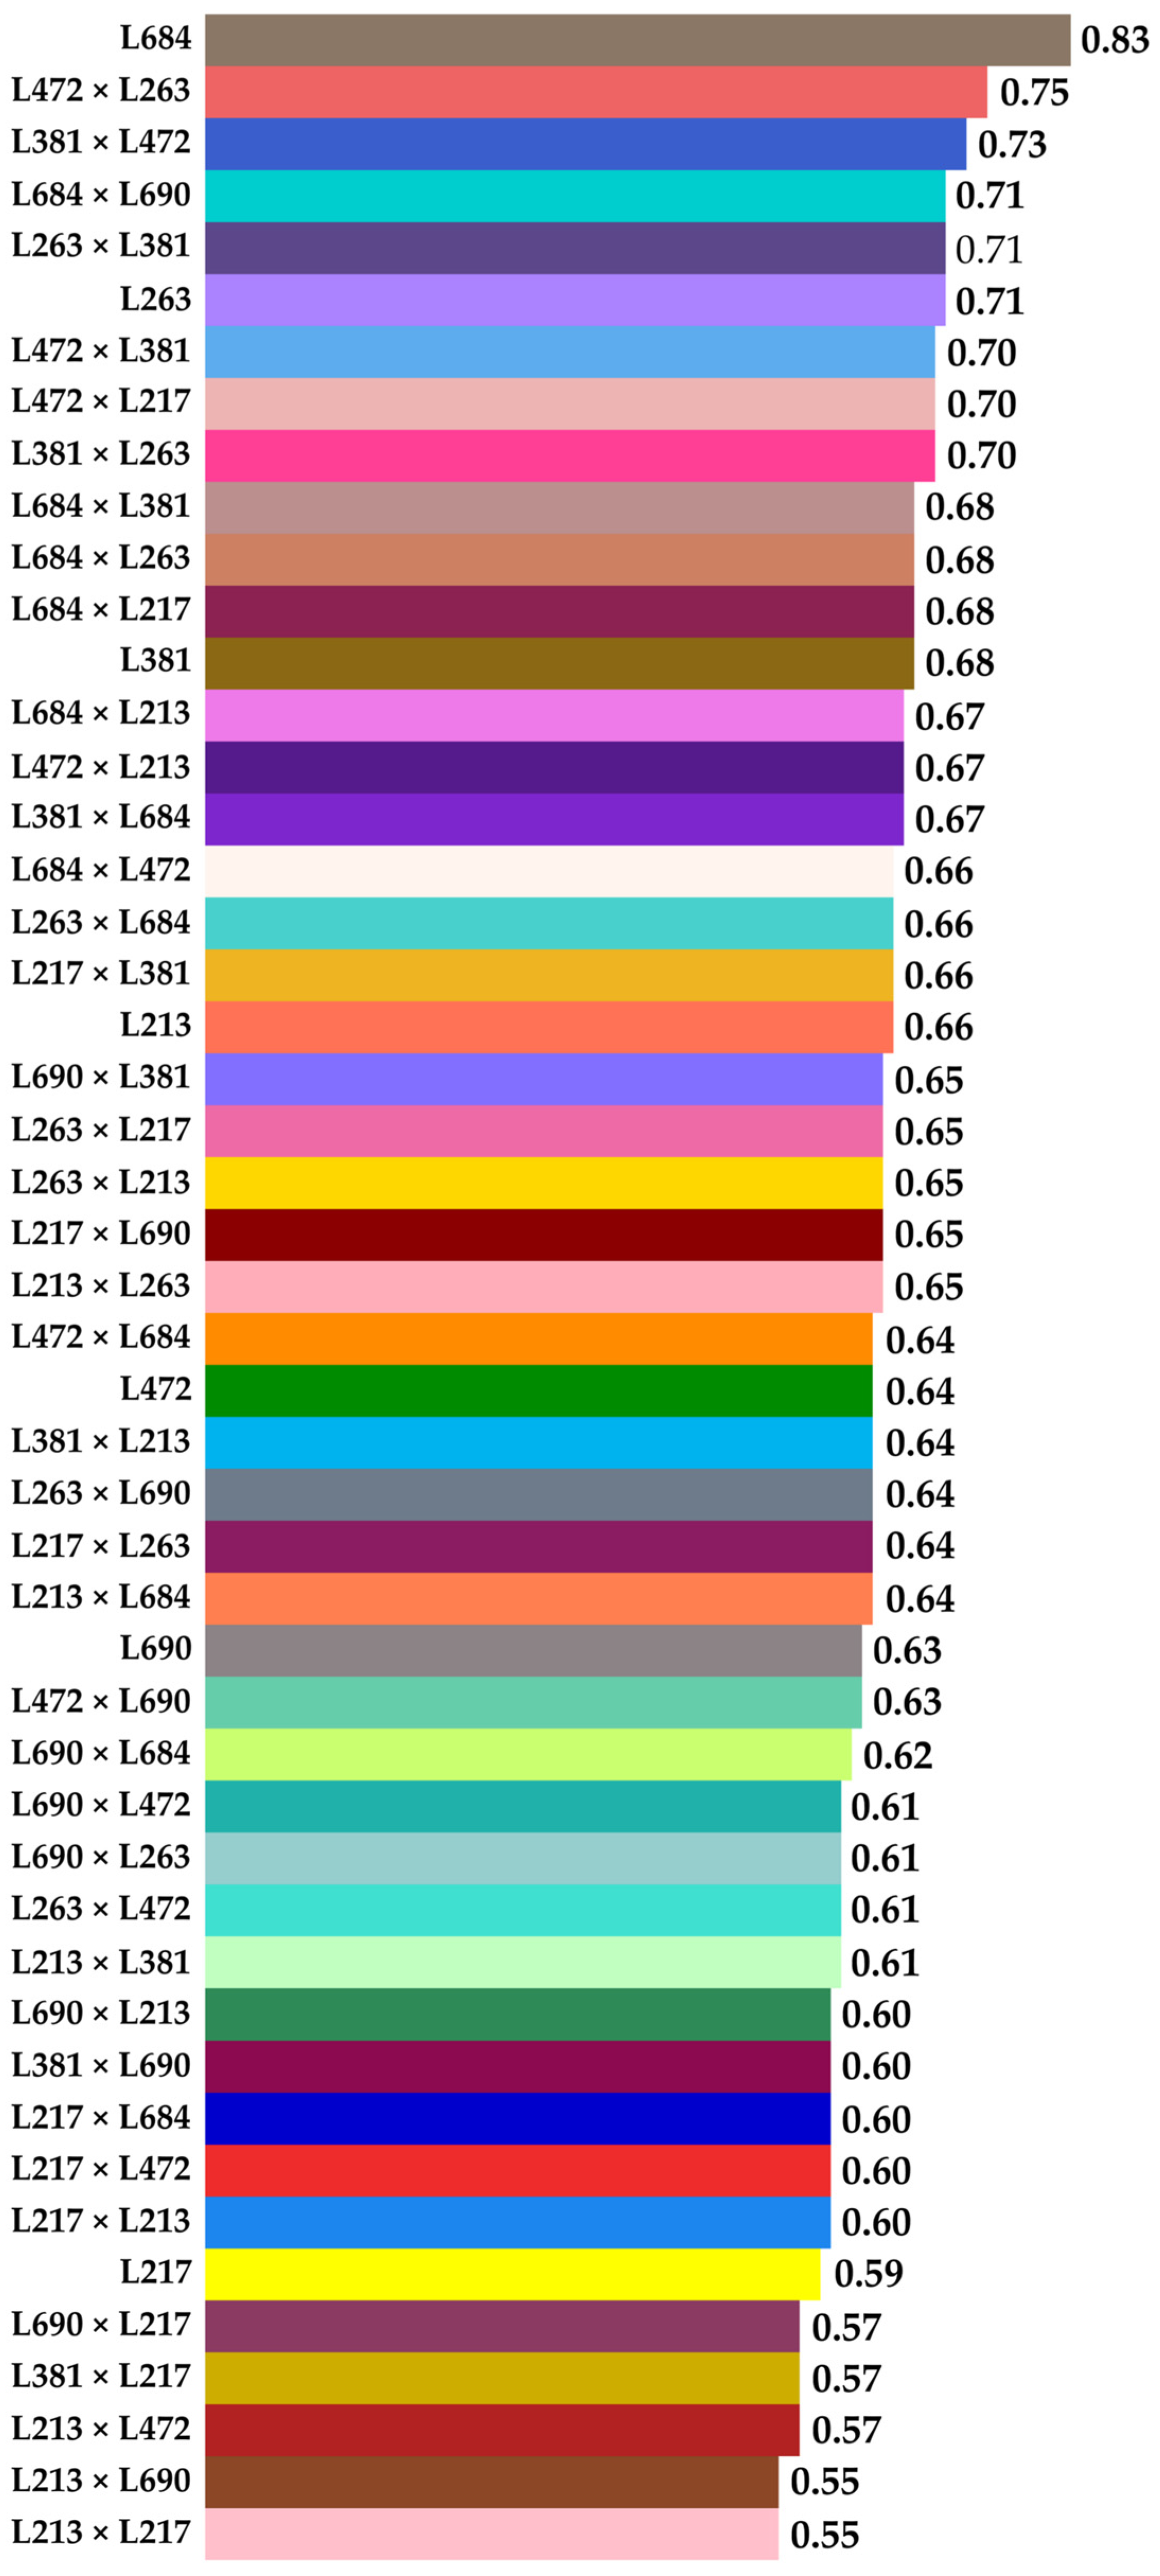
The estimates of the salt stress tolerance index (SSTI) represent the mean salt stress tolerance value for each genotype evaluated, obtained from the value of then traits assessed. To obtain the SSTI estimates, only those traits whose mean values exhibited a decrease under salt stress conditions were selected. The SSTI estimates ranged from 0.55 to 0.83 (Figure 1), with values closer to 1.0 indicating higher tolerance to the evaluated stress. Among the evaluated inbred lines, L684, L263 and L381 showed the highest estimates, with 0.84, 0.71 and 0.68, respectively. Regarding the hybrids, L472 × L263 (0.75), L381 × L472 (0.73) L684 × L690 (0.71) and L263 × L381 (0.71) stood out with the highest estimates. It was observed that hybrids with the highest SSTI estimates were obtained when a parent previously classified as tolerant was used as the female genitor (Figure 1 and Table S2). Conversely, the inbred lines L217 (0.59) and L690 (0.63), and the hybrids L213 × L217 (0.55) and L213 × L690 (0.55) exhibited the lowest SSTI estimates, indicating their lower capacity for salt stress tolerance. Hybrid crosses with the lowest SSTI estimates were obtained when the female parent was one of the lines previously classified as sensitive (Figure 1 and Table S2).
Figure 1.
The salt stress tolerance index of 7 lines and 42 hybrids of popcorn (Zea mays L. var. everta) calculated from the evaluation of ten physical and physiological traits of seeds and seedlings.
2.3. Dynamics of Plant Pigment Accumulation Under Salt Stress
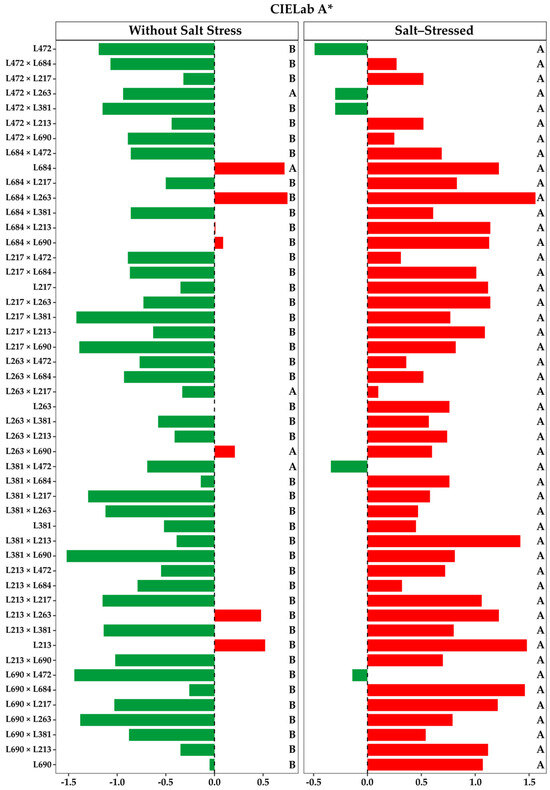
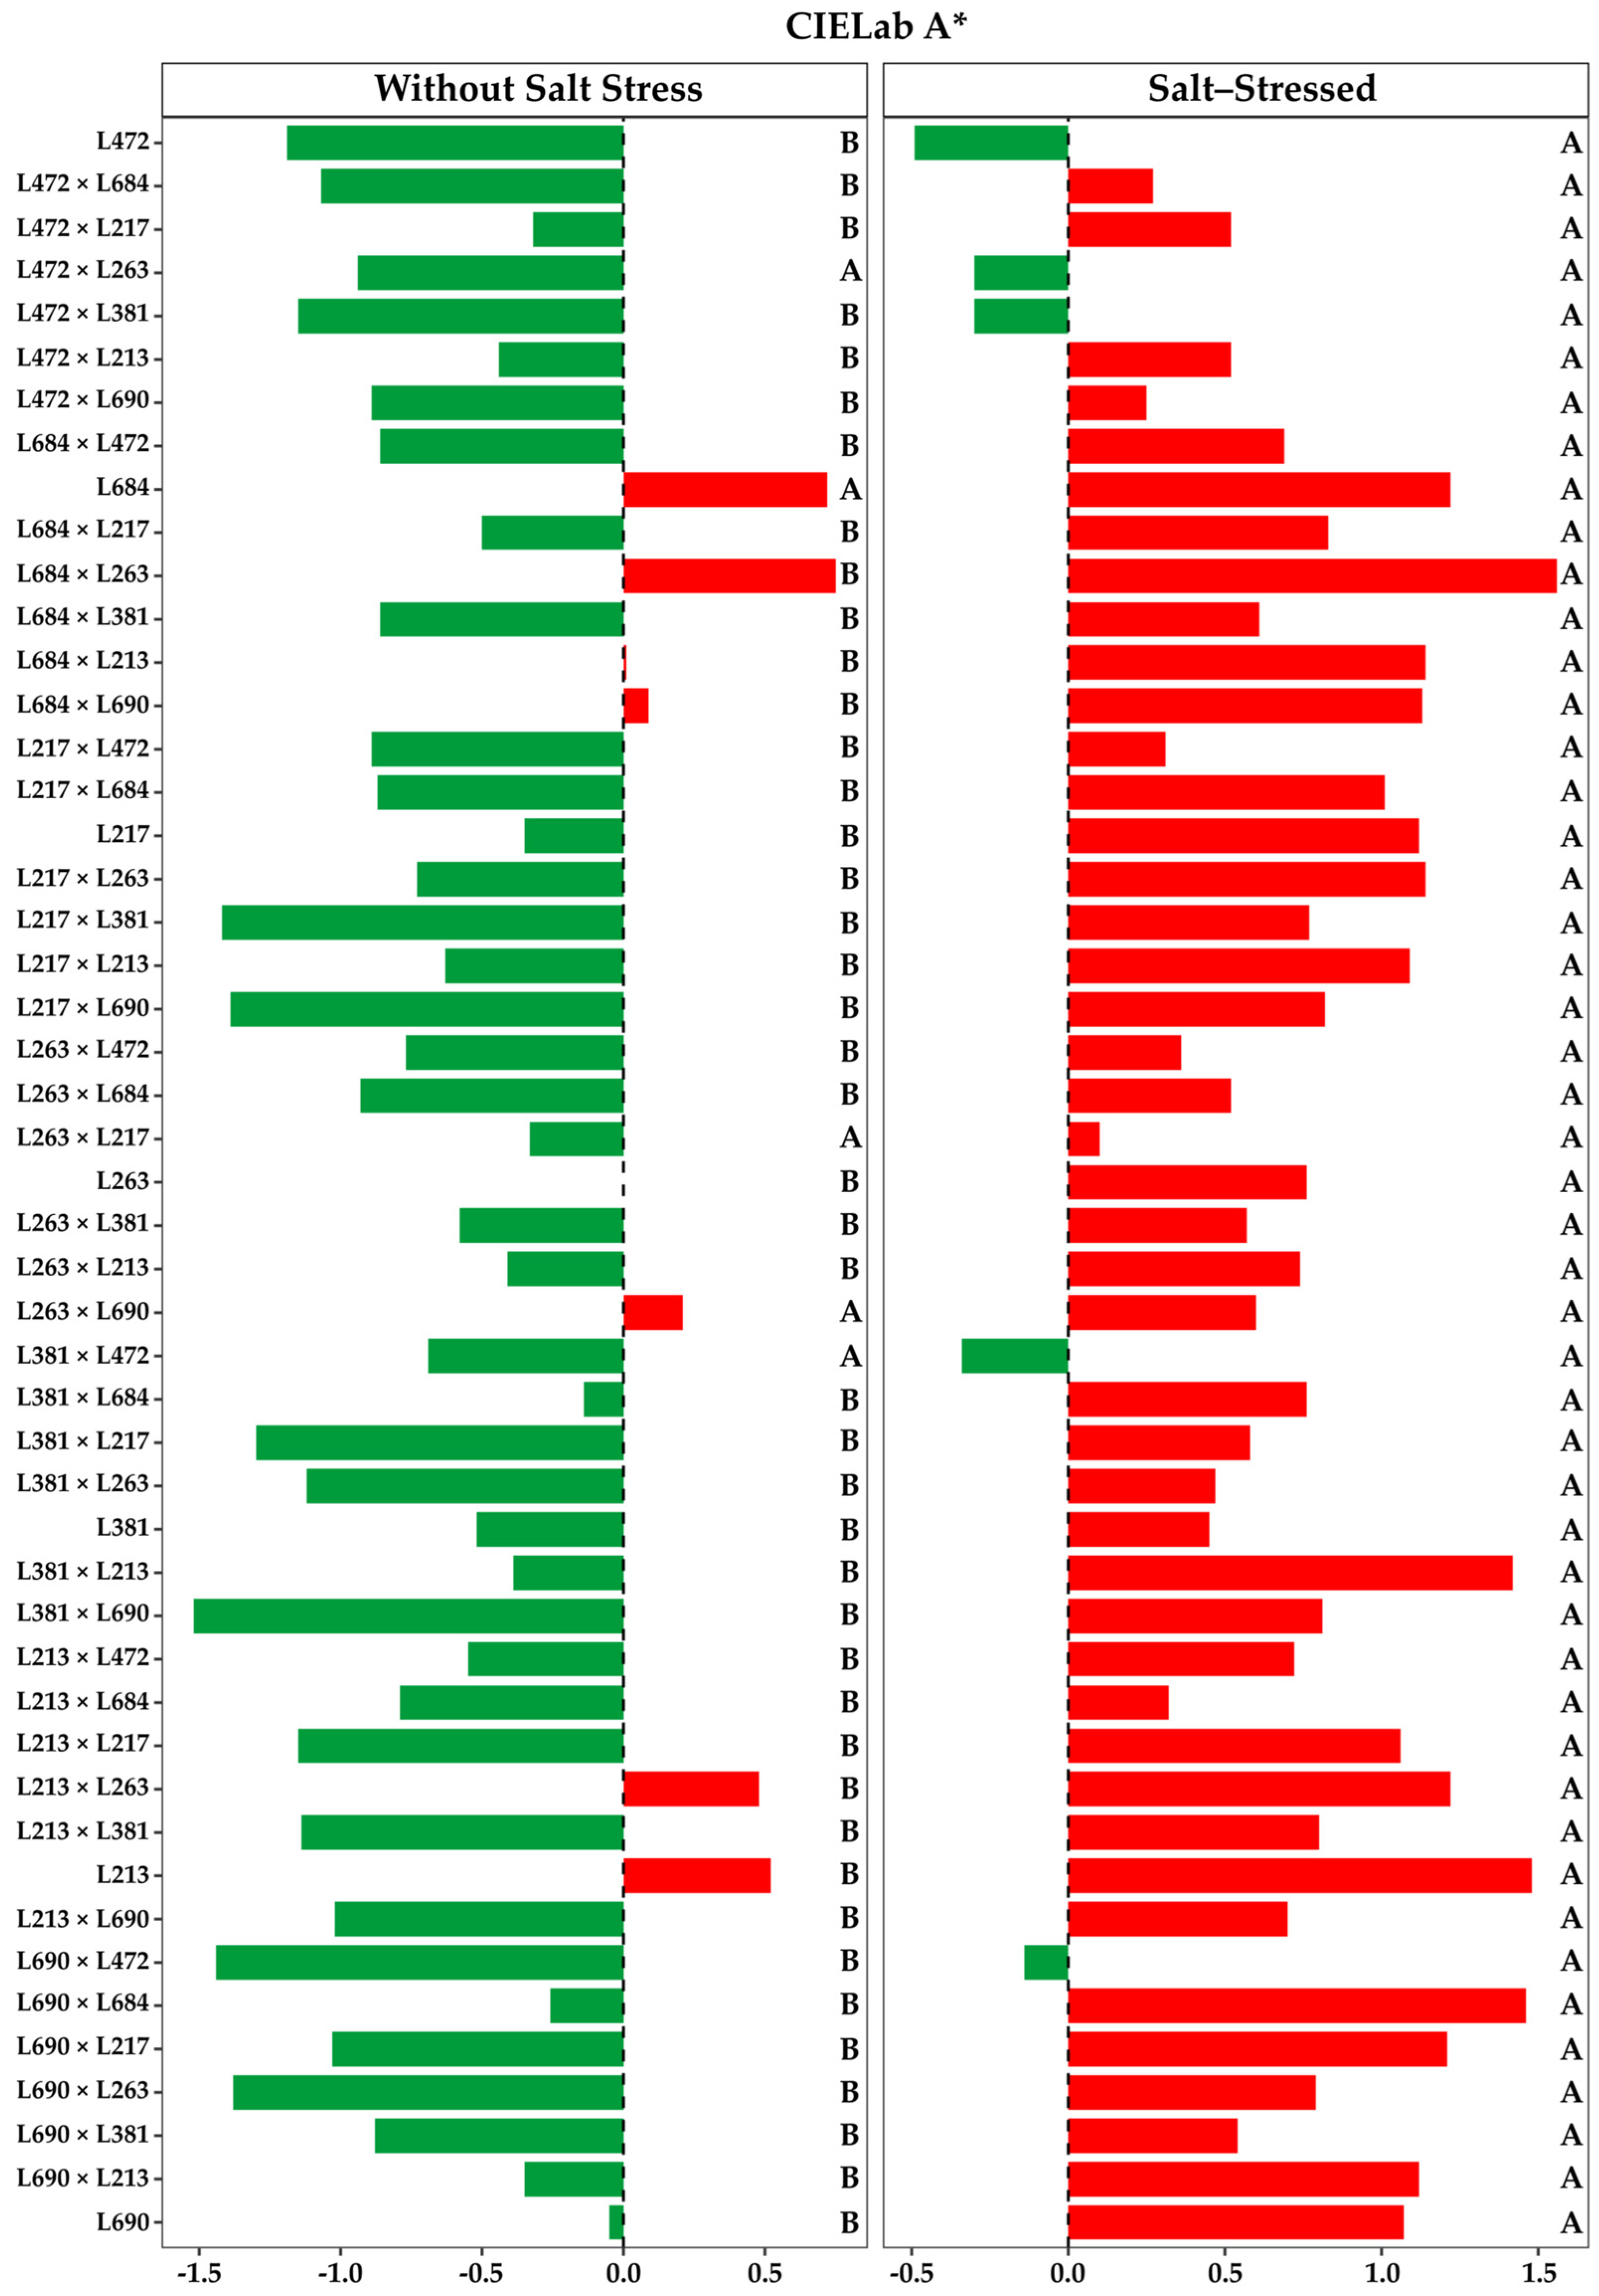
The mean grouping analysis for CIELab A* showed that, in general, there was a tendency toward increased accumulation of red pigments in the genotypes evaluated under salt stress, since the values of this trait increased by an average of 1.31 (Figure 2 and Figure 3). However, parent L472 and the hybrids L472 × L263, L381 × L472, L472 × L381, and L690 × L472 maintained higher accumulation of green pigments even under salt stress conditions (Figure 2 and Figure 3). These genotypes, which showed some of the highest SSTI estimates (0.64 for L472; 0.75 for L472 × L263; 0.73 for L381 × L472; 0.70 for L472 × L381; and 0.61 for L690 × L472) (Figure 1), consequently exhibited the smallest increases in CIELab A* (0.705 for L472; 0.645 for L472 × L263; 0.348 for L381 × L472; and 0.850 for L472 × L381) (Figure 2 and Figure 4).
Figure 2.
Estimates of mean CIELab A* and predominance of pigmentation in the green–red spectrum of 7 lines and 42 hybrids of popcorn (Zea mays L. var. everta) subjected to two saline conditions: without salt stress and salt-stressed. Uppercase letters to the right of the bars indicate homogeneous groups formed by the Scott–Knott clustering analysis (p ≤ 0.01). Genotypes with the same letter in both saline conditions do not differ significantly between the two environments.
Figure 3.
Estimates of mean CIELab B* and predominance of pigmentation in the blue–yellow spectrum of 7 lines and 42 hybrids of popcorn (Zea mays L. var. everta) subjected to two saline conditions: without salt stress and salt stressed. Uppercase letters to the right of the bars indicate homogeneous groups formed by the Scott–Knott clustering analysis (p ≤ 0.01). Genotypes with the same letter in both saline conditions do not differ significantly between the two environments.
Figure 4.
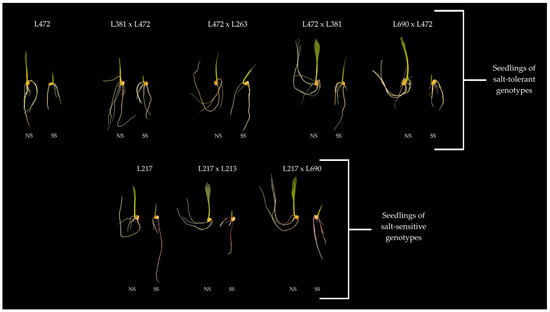
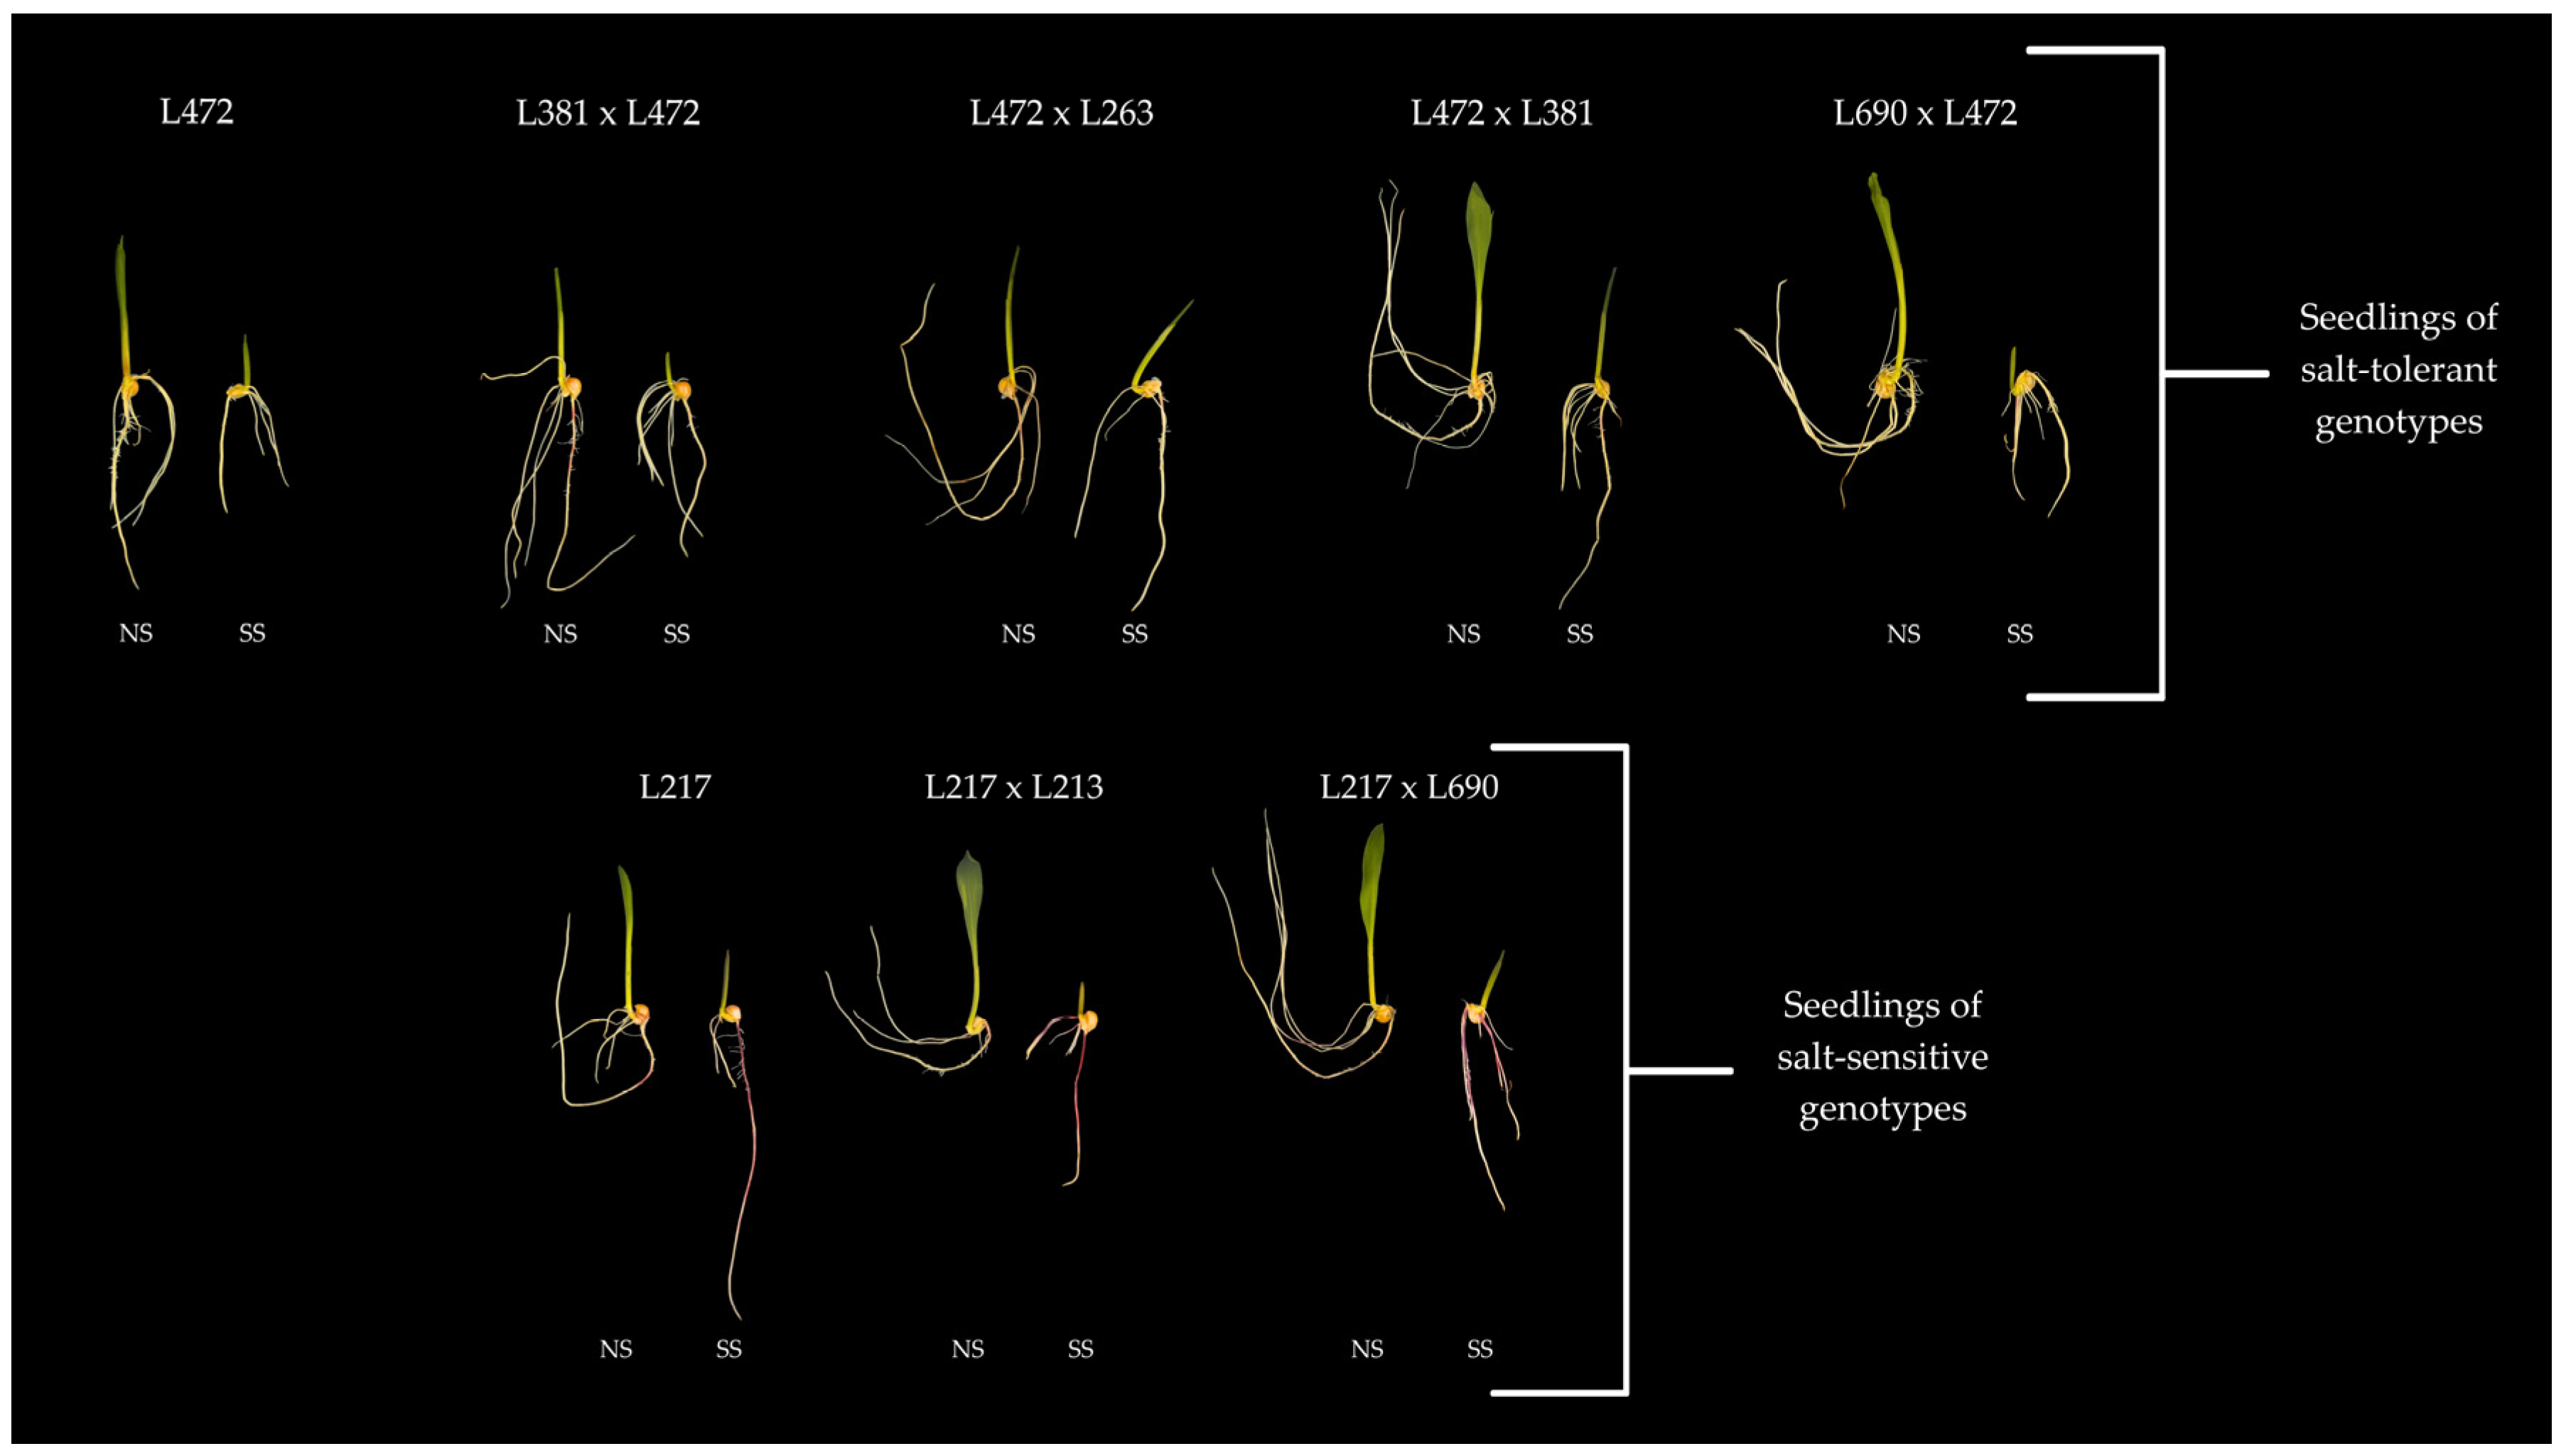
Visual aspect and pigment accumulation predominance of green pigments (negative CIELab A* values) and red pigments (positive CIELab A* values) in popcorn genotypes (Zea mays L. var. everta) subjected to two saline conditions: without salt stress (NS—0 mM NaCl) and salt–stressed (SS—100 mM NaCl). Image from digital phenotyping performed using GroundEye® S120 (mini) equipment.
On the other hand, analysis of the pigments represented by CIELab B* revealed no accumulation of blue pigments. The mean accumulation of yellow pigments was statistically similar under both saline conditions, although a slight increase was observed for most genotypes.
Parent L217 and the hybrids L217 × L213 and L217 × L690 were exceptions, as they showed a reduction in the mean accumulation of yellow pigments (Figure 4). In contrast to the more tolerant genotypes, these materials exhibited some of the lowest SSTI estimates (0.59 for L217; 0.60 for L217 × L213; and 0.65 for L217 × L690) (Figure 1) and, concomitantly, showed some of the greatest increases in red pigmentation (2.208 for L217 × L690; 1.720 for L217 × L213; and 1.470 for L217) (Figure 2 and Figure 4).
3. Discussion
The CIELab system is widely used in plant physiology as a non-destructive method for the objective quantification of plant pigments. The A* parameter is frequently correlated with chlorophyll content, in which more negative values indicate a higher content of green pigments, and with anthocyanins, for which positive values indicate reddish pigmentation. The B* parameter, in turn, is associated with the presence of carotenoids and xanthophylls, with more positive values indicating a greater predominance of yellow pigments [27]. The use of this system allows for precise and non-invasive monitoring of physiological changes, such as maturation, senescence, and responses to biotic and abiotic stresses [28,29].
The estimates of genotypic and environmental variance showed similar magnitudes in the two evaluated environments, suggesting that the stress was not sufficient to reduce the expression of variability or disproportionately increase experimental noise. Stressed environments can maintain the proportion of genetic variance relative to environmental variance [30], thereby allowing for effective genotype selection in both environments [31].
The salt stress applied in this study was sufficient to differentiate the environments for CIELab A*, confirming the existence of genetic variability among the tested genotypes and highlighting the significant changes caused by salt stress in the mean values of the trait. The results for this parameter indicated that salt stress induced an increase in the accumulation of red pigments in most evaluated genotypes, with an average increase of 1.31 in the A* coordinate. This increase was more pronounced in genotypes with the lowest SSTI estimates, such as L217, L217 × L213, and L217 × L690, which simultaneously showed some of the greatest increases in reddish pigmentation. In contrast, some of the genotypes with the highest SSTI estimates, such as L472 and four of its hybrids, maintained negative A* coordinate values, indicating their ability to preserve green pigments even under salt stress conditions. This observed distinction in the pattern of anthocyanin accumulation between tolerant and sensitive genotypes highlights the need for further reflection on the actual biological role of this pigment in response to salt stress.
Anthocyanins play an important role in neutralizing ROS and are widely cited as protective compounds [20,32], since abiotic stresses induce anthocyanin production [32] as a strategy to mitigate ongoing damage, contributing to osmoregulation and the scavenging of excess ROS [12]. Thus, leaves rich in these pigments may exhibit a greater capacity to neutralize ROS [33,34,35].
The relationship between stress and anthocyanin accumulation is reinforced by studies on salinity. Increasing salt concentrations have been shown to induced more intense anthocyanin production in tomato and red cabbage plants [21]. Similarly, anthocyanin synthesis has been documented as an adaptive response to salt stress in sugarcane varieties [36], while wheat genotypes with high anthocyanin levels have demonstrated the ability to maintain greater biomass production under salt stress [37].
However, the accumulation of anthocyanins under stress conditions presents ambiguous interpretations that require careful evaluation, since high levels of this pigment may also indicate greater susceptibility to the stress in question. In wheat plants subjected to osmotic stress caused by heavy metals, for instance, the most sensitive line was observed to produce the highest levels of anthocyanins [38]. This finding indicated severe stress and may be associated with the results observed here for genotypes L217, L217 × L213, and L217 × L690, which showed the lowest SSTI estimates and some of the highest anthocyanin accumulations.
The mean clustering analysis for CIELab A* revealed that, although most genotypes showed increased accumulation of red pigments under salt stress, some maintained negative A* coordinate values, indicating a predominance of green pigments even under stress conditions. This behavior was observed in parent L472 and in hybrids L381 × L472, L472 × L263, L472 × L381, and L690 × L472, which simultaneously exhibited some of the highest SSTI estimates, suggesting that the maintenance of chlorophyll levels under stress may be associated with greater salt stress tolerance in these genotypes.
Chlorophyll biosynthesis may increase under moderate salt stress conditions [39]. However, severe stress conditions can cause pigment decline in more sensitive plants due to oxidative and photosynthetic damage [40]. Ionic toxicity and osmotic stress resulting from salinity may compromise the structural integrity of chloroplasts, destabilizing the metabolic homeostasis between the biosynthesis and degradation of photosynthetic pigments. This imbalance results in a progressive decline in leaf chlorophyll concentration, impairing the plant’s light absorption capacity and photochemical efficiency.
In Sesuvium portulacastrum genotypes subjected to salt stress, chlorophyll levels were found to decrease as salt concentration increased [41], corroborating the behavior observed in the most sensitive genotypes in the present study. Similarly, a 24% reduction in total chlorophyll estimates has been reported in Mesosphaerum suaveolens (L.) plants subjected to stress [42].
On the other hand, genotypes capable of maintaining higher chlorophyll levels are often considered more tolerant to salt stress due to the presence of protective mechanisms that confer greater efficiency to the photosynthetic apparatus [43]. In general, salt-tolerant genotypes exhibit a smaller decrease in chlorophyll content or greater chlorophyll retention compared to sensitive ones [44]. For instance, when evaluating Chilean strawberry (Fragaria chiloensis) genotypes subjected to salt stress, tolerant genotypes successfully maintained chlorophyll levels, whereas sensitive ones showed significant reductions and impaired photosynthetic responses [45]. These studies corroborate the results observed here for genotypes L472, L381 × L472, L472 × L263, L472 × L381, and L690 × L472, which maintained chlorophyll content more effectively and exhibited some of the highest SSTI estimates. Therefore, the greater accumulation of green pigments in tolerant popcorn genotypes strongly indicates their superior ability to maintain physiological homeostasis and metabolic health under stress conditions.
The results observed for CIELab B* indicate that the applied salt stress promoted a complex genotype × saline condition interaction, since the ranking of some genotypes changed regarding the accumulation of the evaluated pigments. This parameter refers to carotenoids, more specifically lutein and zeaxanthin, yellowish pigments of the xanthophyll subclass that have well-studied roles in the photoprotection of chlorophyll and photosynthesis [22,23] and whose biosynthesis is stimulated under stress [13]. These pigments contribute to responses to the most varied types of abiotic stresses [46] and act in protection against ROS in chloroplasts [47].
Under salt stress, carotenoid content may respond in diverse ways, depending on the severity of the stress and the specific tolerance capacity of the genotype. In maize plants subjected to increasing NaCl concentrations, pigment content decreased progressively [48]. However, inoculation with plant growth-promoting bacteria has been found to restore carotenoid levels through the reduction of oxidative stress markers, suggesting that the maintenance of carotenoids under salinity is intrinsically linked to a more efficient antioxidant defense system [48]. Similarly, in tomato families, the most salt-tolerant genotypes maintained or increased carotenoid biosynthesis as a physiological strategy, thereby mitigating cell membrane degradation and preserving photosynthetic efficiency [49].
This adaptive response, however, is bounded by metabolic thresholds. Beyond these limits, stress becomes overwhelming and deleterious. This can be observed in the present study for genotypes L217, L217 × L213, and L217 × L690, which exhibited a reduction in mean CIELab B* values under salt stress. This decline coincides with the lowest SSTI estimates and the highest anthocyanin accumulations recorded, suggesting that in these sensitive genotypes, the salt stress was sufficiently severe to compromise the structural integrity of the chloroplasts, impairing carotenoid biosynthesis and destabilizing the photosynthetic apparatus. A reduction in carotenoid and xanthophyll levels under stress reflects a failure of the antioxidant system to maintain chloroplast redox balance, which inevitably leads to progressive photosynthetic impairment [50].
It is important to emphasize that, since this study was conducted under controlled conditions, these results should be interpreted as an initial screening step. Subsequent validation under field conditions is essential to ensure that the accumulation of these pigments maintains its predictive effectiveness under the numerous edaphoclimatic variations encountered in agricultural environments.
4. Materials and Methods
4.1. Plant Material
The plant material consisted of 49 popcorn genotypes, including 7 inbred lines (Table S1) from the Germplasm Bank of the State University of Norte Fluminense Darcy Ribeiro (UENF) and 42 hybrids (Table S2) resulting from crosses among these lines. In a previous study involving 31 inbred lines, the parental genotypes were classified according to their tolerance or sensitivity to salt stress during the initial development stage [51,52,53,54].
The F1 hybrids were obtained by crossing the seven lines (L472, L684, L217, L263, L381, L213, and L690) according to a complete diallel scheme.
4.2. Experimental Procedure
Seeds from the 49 popcorn genotypes were subjected to two saline conditions (SCs): without salt stress (NS) and salt–stressed (SS). Under the non-saline stress condition, the substrate (germination paper) was moistened with pure deionized water (electrical conductivity of 0.2847 dS m−1 at 25 °C) at a proportion equivalent to 2.5 times the dry weight of the paper. Under the salt stress condition, the substrate was moistened with deionized water supplemented with non-iodized sodium chloride (NaCl) at a concentration of 100.00 mM (electrical conductivity of 9.3 dS m−1 at 25 °C).
In both conditions, the paper rolls were packed in transparent polyethylene bags and placed in germination chambers with temperatures regulated between 20 and 30 °C and a photoperiod adjusted to 8 h of light and 16 h of darkness per day. Substrate moisture was monitored daily throughout the experimental period and, whenever necessary, pure deionized water was added in both saline conditions.
The experiments were conducted in a randomized block design with four replicates of 25 seeds each and were carried out at the Plant Technology Laboratory—Seed Production and Technology Section of the State University of Norte Fluminense Darcy Ribeiro (LFIT/UENF).
4.3. Evaluated Traits
The 49 genotypes were evaluated for seed physiological traits, as well as for the physical and physiological characteristics of the seedlings, according to the Rules for Seed Testing [41].
Normal seedlings and abnormal seedlings (ASs) were counted; germination percentage (GER) was determined on the seventh day after test establishment, and the results were expressed as percentages [55]. The germination speed index (GSI) was determined using the formula proposed by [56], based on the daily counting of seeds displaying at least 0.4 cm of radicle protrusion.
To determine shoot dry weight (SDW) and root dry weight (RDW), ten seedlings were used, separated into shoots and roots, placed in kraft paper envelopes, and dried in a forced-air circulation oven at a constant temperature of 65 °C for 72 h. After drying, the samples were cooled in a desiccator and weighed using a balance with 0.0001 g precision. The results were expressed in mg/seedling−1.
4.4. Digital Phenotyping
Digital phenotyping of seedlings was performed using GroundEye® S120 (mini) equipment (Tbit, Lavras, Brazil), evaluating ten seedlings per replicate. The seedlings were placed in an acrylic tray and subjected to image capture in a standardized camera, under constant and diffuse internal illumination, ensuring the repeatability of the analyses. GroundEye software (1.7.14) was used to perform the mathematical conversion of luminance and chromaticity values. The system automatically acquires and segments the images using digital processing algorithms and artificial intelligence, allowing for the acquisition of geometric and colorimetric data of the root and stem systems of the seedlings.
Color quantification for estimating pigment accumulation was performed using the CIELab color system, an international standard developed by the Commission Internationale de l’Éclairage (CIE) in 1976 [57], considering the parameters A* and B*, used to quantify color variations associated with pigment accumulation. The chromaticity coordinates A* and B* represent opposite color axes: the A* axis ranges from green (negative values) to red (positive values), whereas the B* axis ranges from blue (negative values) to yellow (positive values) [58]. The L* coordinate represents lightness but was not evaluated in the present study.
The following geometric characteristics were analyzed: seedling area (AREA), shoot width (SW), root width (RW), number of branches (NB), shoot length (SL), root length (RL), and total seedling length (TL).
4.5. Salt Stress Tolerance Index
The Salt Stress Tolerance Index (SSTI) was calculated according to the methodology proposed by [59]. The equation adopted was as follows:
where SSTI = Salt Stress Tolerance Index; Yn = value evaluated in the environment without salt stress; and Ys = value evaluated in the environment with salt stress. For this calculation, estimates from ten traits that showed reductions in their mean values under salt stress were used. The tolerance indices ranged from 0.0 to 1.0, with values closer to 1.0 indicating greater tolerance to salt stress and values closer to 0.0 indicating lower tolerance.
4.6. Statistical Analyses
The data obtained were subjected to individual and combined analyses of variance, and the variables that showed significant differences between treatments at the 1% probability level (p ≤ 0.01) according to the F-test were further analyzed using the Scott–Knott mean clustering test at the same significance level.
Data analyses were performed using Genes software (1990.2026.1), adopting the statistical models described below:
For the individual analysis, = the observation referring to the effect of genotype i (I = 1, 2, …, 49) in block j (j = 1, 2); µ = a general constant; = the effect of genotype i; = the effect of block k j and = the experimental error, assumed to be NID with mean 0 and variance .
For the combined analysis, = the observation of genotype i (i = 1, 2, …, 49) in block j (j = 1, 2, 3, 4) in salinity condition k (k = 1, 2); µ = a general constant; = the effect of genotype i; = the effect of block j within saline condition k; = the effect of saline condition k; = the effect of genotype × salinity condition interaction; and = the experimental error, assumed to be normally and independently distributed (NID) with mean 0 and variance . In the combined analysis, the source of variation ‘genotype’ was considered random and ‘salinity condition’ was considered fixed.
The plots were generated using R software (4.5.1), using the packages “GGPlot2”, “tidyr”, and “dplyr”.
5. Conclusions
The results demonstrate that the accumulation of plant pigments is a potential indicator for discriminating popcorn genotypes regarding their tolerance to salt stress.
Maintaining high chlorophyll levels under salt stress was associated with high estimates of the SSTI, suggesting that it may be a potential indicator of tolerant genotypes. In contrast, the most sensitive genotypes exhibited intensified anthocyanin accumulation under salt stress, a response that, in the present study, appears to reflect oxidative damage rather than an effective protective mechanism.
Digital phenotyping associated with CIELab colorimetric analysis constitutes an objective alternative for the selection of popcorn genotypes tolerant to salt stress.
The results obtained in this study may contribute to the screening of lines in popcorn breeding programs and to the selection of superior genotypes with respect to salinity tolerance.
Supplementary Materials
The following supporting information can be downloaded at: https://www.mdpi.com/article/10.3390/stresses6030039/s1, Table S1: Identification and information on generation, country of origin, provenance, climatic adaptation, seed color and cycle of the seven inbred lines; Table S2: List of hybrids obtained through diallel crosses and ranking of the parental lines regarding tolerance to salt stress. References [51,52,53,54] are cited in the supplementary materials.
Author Contributions
J.D.G.A., R.d.S., A.T.d.A.J. and H.D.V. conceived the study; J.D.G.A. and R.d.S. conducted the experiments; J.D.G.A., R.d.S., A.P.L.d.M.B. and L.P.S.S. performed data analysis; J.D.G.A. wrote the manuscript; R.d.S. and H.D.V. critically reviewed the manuscript. All authors have read and agreed to the published version of the manuscript.
Funding
This research was funded by Conselho Nacional de Desenvolvimento Científico e Tecnológico–CNPq and Fundação Carlos Chagas Filho de Amparo à Pesquisa do Estado do Rio de Janeiro under projects numbers 130517/2024-0, E-26/204.334/2021 and E-26/204.335/2021.
Institutional Review Board Statement
Not applicable.
Informed Consent Statement
Not applicable.
Data Availability Statement
All data generated or analyzed are included within this article or in the Supplementary Information. The data are available from the corresponding author upon reasonable request.
Conflicts of Interest
The authors declare no conflicts of interest.
Abbreviations
The following abbreviations are used in this manuscript:
| UENF | State University of Northern Rio de Janeiro |
| NS | No stress |
| SS | Salt stress |
| SC | Saline condition |
| GER | Germination |
| AS | Abnormal seedling |
| GSI | Germination Speed Index |
| AREA | Seedling area |
| SW | Shoot width |
| RW | Root width |
| NB | Number of branches |
| SL | Shoot length |
| RL | Root length |
| TL | Total seedling length |
| SDW | Shoot dry weight |
| RDW | Root dry weight |
| SSTI | Salt Stress Tolerance Index |
References
- Desta, Z.A.; Ortiz, R. Genomic selection: Genome-wide prediction in plant improvement. Trends Plant Sci. 2014, 19, 592–601. [Google Scholar] [CrossRef] [Scilit] [PubMed]
- Santos, T.T.; Yassitepe, J.E.d.C.T. Fenotipagem de plantas em larga escala: Um novo campo de aplicação para a visão computacional na agricultura. Embrapa 2014, 5, 85–100. [Google Scholar]
- Araus, J.L.; Kefauver, S.C.; Zaman-Allah, M.; Olsen, M.S.; Cairns, J.E. Translating High-Throughput Phenotyping into Genetic Gain. Trends Plant Sci. 2018, 23, 451–466. [Google Scholar] [CrossRef] [Scilit] [PubMed]
- Fiorani, F.; Schurr, U. Future Scenarios for Plant Phenotyping. Annu. Rev. Plant Biol. 2013, 64, 267–291. [Google Scholar] [CrossRef] [Scilit] [PubMed]
- Gunasekaran, S. Nondestructive Food Evaluation: Techniques to Analyze Properties and Quality; Marcel Dekker: New York, NY, USA, 2001; pp. 1–423. [Google Scholar]
- Meyering, B.; Barriball, S.; Schlautman, B. Deep learning driven, image-based phenotyping of seed processing efficiency in sainfoin (Onobrychis viciifolia). Front. Plant Sci. 2025, 16, 1655350. [Google Scholar] [CrossRef] [Scilit] [PubMed]
- Pandey, P.; Chaudhary, P.; Waldhwa, G. Image analysis techniques in agriculture. Int. J. Eng. Technol. 2013, 5, 127–133. [Google Scholar]
- Swain, K.C.; Thomson, S.J.; Jayasuriya, H.P.W. Adoption of an Unmanned Helicopter for Low-Altitude Remote Sensing to Estimate Yield and Total Biomass of a Rice Crop. Trans. ASABE 2010, 53, 21–27. [Google Scholar] [CrossRef] [Scilit]
- Makanza, R.; Zaman-Allah, M.; Cairns, J.; Magorokosho, C.; Tarekegne, A.; Olsen, M.; Prasanna, B. High-Throughput Phenotyping of Canopy Cover and Senescence in Maize Field Trials Using Aerial Digital Canopy Imaging. Remote Sens. 2018, 10, 330. [Google Scholar] [CrossRef] [Scilit] [PubMed]
- Buchaillot, M.L.; Gracia-Romero, A.; Vergara-Diaz, O.; Zaman-Allah, M.A.; Tarekegne, A.; Cairns, J.E.; Prasanna, B.M.; Araus, J.L.; Kefauver, S.C. Evaluating Maize Genotype Performance under Low Nitrogen Conditions Using RGB UAV Phenotyping Techniques. Sensors 2019, 19, 1815. [Google Scholar] [CrossRef] [Scilit] [PubMed]
- Volpato, L.; Pinto, F.; González-Pérez, L.; Thompson, I.G.; Borém, A.; Reynolds, M.; Gérard, B.; Molero, G.; Rodrigues, F.A. High Throughput Field Phenotyping for Plant Height Using UAV-Based RGB Imagery in Wheat Breeding Lines: Feasibility and Validation. Front. Plant Sci. 2021, 12, 591587. [Google Scholar] [CrossRef] [Scilit] [PubMed]
- Dabravolski, S.A.; Isayenkov, S.V. The Role of Anthocyanins in Plant Tolerance to Drought and Salt Stresses. Plants 2023, 12, 2558. [Google Scholar] [CrossRef] [Scilit] [PubMed]
- Uarrota, V.G.; Stefen, D.L.V.; Leolato, L.S.; Gindri, D.M.; Nerling, D. Revisiting Carotenoids and Their Role in Plant Stress Responses: From Byosinthesis to Plant Signaling Mechanisms during Stress. In Antioxidants and Antioxidant Enzymes in Higher Plants; Gupta, D.K., Palma, J.M., Corpas, F.J., Eds.; Springer: Cham, Switzerland, 2018; pp. 207–232. [Google Scholar] [CrossRef] [Scilit]
- Mackon, E.; Mackon, G.C.J.D.E.; Ma, Y.; Kashif, M.H.; Ali, N.; Usman, B.; Liu, P. Recent Insights into Anthocyanin Pigmentation, Synthesis, Trafficking, and Regulatory Mechanisms in Rice (Oryza sativa L.) Caryopsis. Biomolecules 2021, 11, 394. [Google Scholar] [CrossRef] [Scilit] [PubMed]
- Mansour, M.M.F. Anthocyanins: Biotechnological targets for enhancing crop tolerance to salinity stress. Sci. Hortic. 2023, 319, 112182. [Google Scholar] [CrossRef] [Scilit]
- Ahmadzai, A.S.; Hu, C.; Zhang, C.; Li, Y. Mechanisms of anthocyanin-mediated salt stress alleviation and cellular homeostasis in plants. Plant Growth Regul. 2025, 105, 655–673. [Google Scholar] [CrossRef] [Scilit]
- Cheruth, A.J.; Ramadhan, K.I.M.; Kurup, S.S. Calcium supplementation ameliorates salinity stress in Lactuca sativa plants. J. Appl. Hortic. 2016, 18, 138–140. [Google Scholar] [CrossRef] [Scilit]
- Al-Sammarraie, O.N.; Alsharafa, K.Y.; Al-limoun, M.O.; Khleifat, K.M.; Al-Sarayreh, S.A.; Al-Shuneigat, J.M.; Kalaji, H.M. Effect of various abiotic stressors on some biochemical indices of Lepidium sativum plants. Sci. Rep. 2020, 10, 20986. [Google Scholar] [CrossRef] [Scilit] [PubMed]
- Duan, H.; Tiika, R.J.; Tian, F.; Lu, Y.; Zhang, Q.; Hu, Y.; Cui, G.; Yang, H. Metabolomics analysis unveils important changes involved in the salt tolerance of Salicornia europaea. Front. Plant Sci. 2023, 13, 1097076. [Google Scholar] [CrossRef] [Scilit] [PubMed]
- Kaur, S.; Tiwari, V.; Kumari, A.; Chaudhary, E.; Sharma, A.; Ali, U.; Garg, M. Protective and defensive role of anthocyanins under plant abiotic and biotic stresses: An emerging application in sustainable agriculture. J. Biotechnol. 2023, 361, 12–29. [Google Scholar] [CrossRef] [Scilit] [PubMed]
- Eryilmaz, F. The Relationships between Salt Stress and Anthocyanin Content in Higher Plants. Biotechnol. Biotechnol. Equip. 2006, 20, 47–52. [Google Scholar] [CrossRef] [Scilit]
- Demmig-Adams, B.; Polutchko, S.K.; Adams, W.W., III. Structure-Function-Environment Relationship of the Isomers Zeaxanthin and Lutein. Photochem 2022, 2, 308–325. [Google Scholar] [CrossRef] [Scilit]
- Niyogi, K.K. Photoprotection Revisited: Genectic and Molecular Approaches. Annu. Rev. Plant Biol. 1999, 50, 333–359. [Google Scholar] [CrossRef] [Scilit] [PubMed]
- Demmig-Adams, B.; Stewart, J.J.; López-Pozo, M.; Polutchko, S.K.; Adams, W.W., III. Zeaxanthin, a Molecule for Photoprotection in Many Different Environments. Molecules 2020, 25, 5825. [Google Scholar] [CrossRef] [Scilit] [PubMed]
- Baroli, I.; Niyogi, K.K. Molecular Genetics of Xanthophyll-Dependent Photoprotection in Green Algae and Plants. Philos. Trans. R. Soc. Lond. B Biol. Sci. 2000, 355, 1385–1394. [Google Scholar] [CrossRef] [Scilit] [PubMed]
- Havaux, M. Carotenoids and Membrane Stabilizers in Chloroplasts. Trends Plant Sci. 1998, 3, 147–151. [Google Scholar] [CrossRef] [Scilit]
- Gitelson, A.A.; Solovchenko, A. Non-invasive quantification of foliar pigments: Possibilities and limitations of reflectance- and absorbance-based approaches. J. Photochem. Photobiol. B-Biol. 2018, 178, 537–544. [Google Scholar] [CrossRef] [Scilit] [PubMed]
- Liew, O.; Chong, P.; Li, B.; Asundi, A. Signature Optical Cues: Emerging Technologies for Monitoring Plant Health. Sensors 2008, 8, 3205–3239. [Google Scholar] [CrossRef] [Scilit] [PubMed]
- Ang, M.C.Y.; Lew, T.T.S. Non-destructive Technologies for Plant Health Diagnosis. Front. Plant Sci. 2022, 13, 884454. [Google Scholar] [CrossRef] [Scilit] [PubMed]
- Muhammad, R.W.; Qayyum, A.; Hamza, A.; Ahmad, M.Q.; Naseer, N.S.; Liaqat, S.; Ahmad, B.; Malik, W.; Noor, E. Analysis of genetic traits for drought tolerance in maize. Genet. Mol. Res. 2015, 14, 13545–13565. [Google Scholar] [CrossRef] [Scilit] [PubMed]
- Talabi, A.O.; Badu-Apraku, B.; Fakorede, M.A.B. Genetic Variances and Relationship among Traits of an Early Maturing Maize Population under Drought-stress and Low Nitrogen Environments. Crop Sci. 2017, 57, 681–692. [Google Scholar] [CrossRef] [Scilit]
- Naing, A.H.; Kim, C.K. Abiotic stress-induced anthocyanins in plants: Their role in tolerance to abiotic stresses. Physiol. Plant. 2021, 172, 1796–1807. [Google Scholar] [CrossRef] [Scilit] [PubMed]
- Gould, K.S.; McKelvie, J.; Markham, K.R. Do anthocyanins function as antioxidants in leaves? Imaging of H2O2 in red and green leaves after mechanical injury. Plant Cell Environ. 2002, 25, 1261–1269. [Google Scholar] [CrossRef] [Scilit]
- Landi, M.; Tattini, M.; Gould, K.S. Multiple functional roles of anthocyanins in plant-environment interactions. Environ. Exp. Bot. 2015, 119, 4–17. [Google Scholar] [CrossRef] [Scilit]
- Xu, Z.; Mahmood, K.; Rothstein, S.J. ROS Induces Anthocyanin Production Via Late Biosynthetic Genes and Anthocyanin Deficiency Confers the Hypersensitivity to ROS-Generating Stresses in Arabidopsis. Plant Cell Physiol. 2017, 58, 1364–1377. [Google Scholar] [CrossRef] [Scilit] [PubMed]
- Wahid, A.; Ghazanfar, A. Possible involvement of some secondary metabolites in salt tolerance of sugarcane. J. Plant Physiol. 2006, 163, 723–730. [Google Scholar] [CrossRef] [Scilit] [PubMed]
- Mbarki, S.; Sytar, O.; Zivcak, M.; Abdelly, C.; Cerda, A.; Brestic, M. Anthocyanins of Coloured Wheat Genotypes in Specific Response to Salt Stress. Molecules 2018, 23, 1518. [Google Scholar] [CrossRef] [Scilit] [PubMed]
- Shoeva, O.Y.; Khlestkina, E.K. Anthocyanins participate in the protection of wheat seedlings against cadmium stress. Cereal Res. Commun. 2018, 46, 242–252. [Google Scholar] [CrossRef] [Scilit]
- Shah, S.H.; Houborg, R.; MacCabe, M.F. Response of Chlorophyll, Carotenoid and SPAD-502 Measurement to Salinity and Nutrient Stress in Wheat (Triticum aestivum L.). Agronomy 2017, 7, 61. [Google Scholar] [CrossRef] [Scilit]
- Hammami, Z.; Tounsi-Hammami, S.; Nhamo, N.; Rezgui, S.; Trifa, Y. The efficiency of chlorophyll fluorescence as a selection criterion for salinity and climate aridity tolerance in barley genotypes. Front. Plant Sci. 2024, 15, 1324388. [Google Scholar] [CrossRef] [Scilit] [PubMed]
- Wang, Y.; Ma, W.; Fu, H.; Li, L.; Ruan, X.; Zhang, X. Effects of Salinity Stress on Growth and Physiological Parameters and Related Gene Expression in Different Ecotypes of Sesuvium portulacastrum on Hainan Island. Genes 2023, 14, 1336. [Google Scholar] [CrossRef] [Scilit] [PubMed]
- Nóbrega, J.S.; Bruno, R.d.L.A.; Figueiredo, F.R.A.; Silva, T.I.d.; Fátima, R.T.d.; Ribeiro, J.E.d.S.; Ferreira, J.T.A.; Nascimento, R.G.d.S. Acúmulo de biomassa e pigmentos fotossintéticos em plantas de Mesosphaerum suaveolens (L.) Kuntze sob estresse salino e doses de ácido salicílico. Res. Soc. Dev. 2020, 9, e328953286. [Google Scholar] [CrossRef] [Scilit]
- Paulus, D.; Dourado Neto, D.; Frizzone, J.A.; Soares, T.M. Produção e indicadores fisiológicos de alface sob hidroponia com água salina. Hortic. Bras. 2010, 28, 29–35. [Google Scholar] [CrossRef] [Scilit]
- Nounjan, N.; Theerakulpisut, P. Physiological evaluation for salt tolerance in green and purple leaf color rice cultivars at seedling stage. Physiol. Mol. Biol. Plants 2021, 27, 2819–2832. [Google Scholar] [CrossRef] [Scilit] [PubMed]
- Garriga, M.; Retamales, J.B.; Romero-Bravo, S.; Caligari, P.D.S.; Lobos, G.A. Chlorophyll, anthocyanin, and gas exchange changes assessed by spectroradiometry in Fragaria chiloensis under salt stress. J. Integr. Plant Biol. 2014, 56, 505–515. [Google Scholar] [CrossRef] [Scilit] [PubMed]
- Bhoi, A.; Yadu, B.; Chandra, J.; Keshavkant, S. Contribuition Os Strigolactone Biosynthesis and Signaling Genes and Abiotic Stresses. Planta 2021, 254, 28. [Google Scholar] [CrossRef] [Scilit] [PubMed]
- Dall’Osto, L.; Lico, C.; Alric, J.; Giuliano, G.; Havaux, M.; Bassi, R. Lutein Is Needed for Efficient Chlorophyll Triplet Quenching in the Major LHCII Antenna Complex of Higher Plants and Effective Photoprotection in Vivo under Strong Light. BMC Plant Biol. 2006, 6, 32. [Google Scholar] [CrossRef] [Scilit] [PubMed]
- Ali, B.; Hafeez, A.; Afridi, M.S.; Javed, M.A.; Sumaira; Suleman, F.; Nadeem, M.; Ali, S.; Alwahibi, M.S.; Elshikh, M.S.; et al. Bacterial-Mediated Salinity Stress Tolerance in Maize (Zea mays L.): A Fortunate Way toward Sustainable Agriculture. ACS Omega 2023, 8, 20471–20487. [Google Scholar] [CrossRef] [Scilit] [PubMed]
- Eynizadeh, P.; Ravari, S.Z.; Moradi, M.; Dehghani, A.; Dehghani, H. Determining tolerant tomato genotypes to salt stress according to physiological and morphological matter. AoB Plants 2023, 15, plad037. [Google Scholar] [CrossRef] [Scilit] [PubMed]
- Demming-Adams, B.; Hodges, A.K.; Polutchko, S.K.; Adams, W.W., III. Zeaxanthin and Other Carotenoids: Roles in Abiotic Stress Defense with Implicantions for Biotic Defense. Plants 2025, 14, 2703. [Google Scholar] [CrossRef] [Scilit] [PubMed]
- Souza, R.d.; Vieira, H.D.; Kamphorst, S.H.; Lima, V.J.d.; Azeredo, E.P.; Amaral Junior, A.T.d. Early Selection of Popcorn Lines for Tolerance to Salt Stress. Stresses 2026, 6, 9. [Google Scholar] [CrossRef] [Scilit]
- Santos, T.d.O.; Amaral Júnior, A.T.d.; Bispo, R.B.; Lima, V.J.d.; Kamphorst, S.H.; Leite, J.T.; Santos Júnior, D.R.d.; Santos, P.H.A.D.; Oliveira, U.A.d.; Schmitt, K.F.M.; et al. Phenotyping Latin American Open-Pollinated Varieties of Popcorn for Environments with Low Water Availability. Plants 2021, 10, 1211. [Google Scholar] [CrossRef] [Scilit] [PubMed]
- Leite, J.T.; Amaral Júnior, A.T.d.; Kamphorst, S.H.; Lima, V.J.d.; Santos Júnior, D.R.d.; Alves, U.O.; Azeredo, V.C.; Pereira, J.L.; Bispo, R.B.; Schmidt, K.F.M.; et al. All Are in a Drought, but Some Stand Out: Multivariate Analysis in the Selection of Agronomic Efficient Popcorn Genotypes. Plants 2022, 11, 2275. [Google Scholar] [CrossRef] [Scilit] [PubMed]
- Kurosawa, R.d.N.F.; Vivas, M.; Amaral Júnior, A.T.d.; Ribeiro, R.M.; Miranda, S.B.; Pena, G.F.; Leite, J.T.; Mora, F. Popcorn germplasm resistance to fungal diseases caused by Exserohilum turcicum and Bipolaris maydis. Bragantia 2017, 77, 36–47. [Google Scholar] [CrossRef] [Scilit]
- Brasil. Regras Para Análise de Sementes; Ministério da Agricultura, Pecuária e Abastecimento, Secretaria de Defesa Agropecuária: Brasília, Brazil, 2025.
- Maguire, J.D. Speed of germination: Aid in selection and evaluation for seedling emergence and vigor. Crop Sci. 1962, 2, 176–177. [Google Scholar] [CrossRef] [Scilit]
- Flavier, K.; McLellan, J.; Botoy, T.; Waterman, K.C. Accelerated shelf life modeling of appearance change in drug products using ASAPprime®. Pharm. Dev. Technol. 2022, 27, 740–748. [Google Scholar] [CrossRef] [Scilit] [PubMed]
- Durmus, D. CIELAB color space boundaries under theoretical spectra and 99 test color samples. Color Res. Appl. 2020, 45, 796–802. [Google Scholar] [CrossRef] [Scilit]
- Fernandez, G.C.J. Effective selection criteria for assessing stress tolerance. In Proceedings of the International Symposium on Adaptation of Food Crops to Temperature and Water Stress; Asian Vegetable Research and Developmente Center: Tainan City, Taiwan, 1992; pp. 257–270. [Google Scholar]

Disclaimer/Publisher’s Note: The statements, opinions and data contained in all publications are solely those of the individual author(s) and contributor(s) and not of MDPI and/or the editor(s). MDPI and/or the editor(s) disclaim responsibility for any injury to people or property resulting from any ideas, methods, instructions or products referred to in the content. |
© 2026 by the authors. Licensee MDPI, Basel, Switzerland. This article is an open access article distributed under the terms and conditions of the Creative Commons Attribution (CC BY) license.