Article

Nitric Oxide Modulates Salt Stress Tolerance in Lettuce

by
Isabelly Cristina da Silva Marques
1,
Dayane Mércia Ribeiro Silva
2,
Geane Lourenço Bispo
1,
Francisco de Assis de Oliveira
3,
Elizabeth Orika Ono
4 and
João Domingos Rodrigues
4,*
1
Department of Horticulture, School of Agricultural Sciences, São Paulo State University (Unesp), Botucatu 18610-034, SP, Brazil
2
Postdoctoral at the Graduate Program in Agriculture and Environment, Alagoas Federal University (UFAL), Arapiraca 57309-005, AL, Brazil
3
Department of Agronomic and Forestry Sciences, Federal Rural University of the Semiarid Region (Ufersa), Mossoró 59625-900, RN, Brazil
4
Department of Botany, Institute of Biosciences, São Paulo State University (Unesp), Botucatu 18618-000, SP, Brazil
*
Author to whom correspondence should be addressed.
Stresses 2023, 3(4), 701-716; https://doi.org/10.3390/stresses3040048
Submission received: 28 August 2023 / Revised: 25 September 2023 / Accepted: 28 September 2023 / Published: 7 October 2023
(This article belongs to the Collection Feature Papers in Plant and Photoautotrophic Stresses)

Abstract

:
Crops are constantly threatened by salinity. Nitric oxide (NO) is an attenuating agent for salt stress; however, the specific roles of NO in gas exchange and lettuce production are not well established. The objective of this study was to evaluate the application of different concentrations of sodium nitroprusside (SNP) as an agent to mitigate salt stress in lettuce plants. Lettuce seedlings in pots were subjected to irrigation without and with saline water (0.2 and 3.5 dS m−1) and applications of different concentrations (0, 50, 100, 150, and 200 µM) of SNP, a NO donor. Saline stress negatively affected lettuce development with a reduction of 29.5% in leaf area, 6.3% in relative water content in the leaf, 17.2% in stem diameter, and 10.7% in dry matter mass in the control, but the application of SNP mitigated the deleterious effects of salt stress. Concentrations between 100 and 150 µM of SNP improved the photosynthetic metabolism of lettuce under salinity, with an increase of 46.7% in CO2 assimilation and 42.3% in fresh matter mass. Pearson’s correlation showed that fresh matter correlated positively with CO2 assimilation. Therefore, SNP can be used to mitigate salt stress in lettuce.

1. Introduction

Excessive salts in soil and water are a common challenge in agriculture [1,2,3]. This issue is exacerbated by factors such as saline water, shallow water tables, and low precipitation, leading to the accumulation of salts in the topsoil layer [4]. Reduced precipitation and high evaporative demand contribute to increased surface soil salinity, and saline water intrusion through rivers and groundwater in coastal regions results in widespread salinization [5,6].
Salinity represents one of the most significant limitations to agricultural productivity, as it adversely affects plant growth and development [2,7]. Its use induces changes in plant metabolism, as the high salt concentration in the root zone of sensitive plants promotes a reduction in water uptake and, consequently, stomatal closure, leading to reduced CO2 uptake, constraining photosynthesis, inhibiting cell division, and resulting in reduced plant growth [8,9].
The use of saline water has a significant impact on soil–water–plant relations, as it often restricts normal physiological activity and the productive capacity of crops. At elevated levels of salinity, crop growth and leaf surface expansion are adversely affected due to osmotic effects, water deficit, nutritional imbalance, and oxidative stress [2,7,10].
Many crops, such as onion, tomato, spinach, and lettuce, are considered sensitive or moderately sensitive to salinity, and the negative impact of this stress on plant growth leads to yield losses and potential profits [11,12]. Therefore, it has been crucial to study the physiological responses [3,8,9] and productivity [5,10] of crops under such conditions, as well as their effects on the soil [4,7].
Lettuce (Lactuca sativa L.) is a globally significant crop due to its adaptability to different climates and its nutritional value, providing essential fibers, vitamins, and minerals. In Brazil, it is one of the most commonly consumed leafy vegetables in its natural form, becoming a fundamental part of Brazilian meals [13]. However, when exposed to saline environments exceeding the electrical conductivity threshold of 1.3–2.0 dS m−1, lettuce experiences reduced growth and productivity, impacting its quality and appearance [3,10]. Therefore, the development and implementation of new agricultural technologies that mitigate the effects of salinity on vegetables emerge as promising alternatives to sustain production under this challenging condition.
In addition to various pre-existing techniques to mitigate salinity, such as soil and water conservation, drainage, the application of organic and mineral amendments, phytohormones, and genetic improvement, among others, an alternative to reverse potential damage from saline stress is the use of nitric oxide (NO). This molecule is capable of freely diffusing through cell membranes and promoting physiological acclimation responses in plants under adverse conditions [14,15,16].
Due to its high lipophilic nature, NO (Nitric Oxide) is readily released from cell membranes, playing a crucial role in various physiological reactions such as growth, development, regulation of stomatal conductance, flowering, seed germination, and response to both biotic and abiotic stresses [17,18,19,20]. Studies indicate that under stress conditions, there may be an increase in the endogenous concentration of NO in plant tissues involved in signaling or intracellular redox protection, through the formation of peroxynitrite and S-nitrosothiols [21,22]. Therefore, the exposure of lettuce plants to exogenous NO through a donor (sodium nitroprusside—SNP) may activate defense mechanisms in response to saline stress and minimize yield losses.
In saline conditions, the application of NO has been effective in enhancing plant resistance and reducing losses [23,24,25]. Regarding the benefits of NO in the metabolism of salt-stressed plants, it has been observed that the application of a NO donor, such as sodium nitroprusside (SNP), reduces oxidative damage in garlic plants [26]. Additionally, the presence of this molecule stimulated the accumulation of the amino acid proline, as well as phenolic compounds and flavonoids in corn seedlings [27]. Furthermore, NO has been shown to improve photosynthetic efficiency in wheat plants and productive attributes in lentil plants [28,29]. However, research on the role of NO in lettuce under salt stress is still in its infancy, highlighting the need for future studies to understand its mechanisms [15,30].
This research was conducted with the aim of assessing the mitigating effect of different concentrations of SNP on the morphophysiology and productivity of curly lettuce plants grown under saline stress. The hypothesis raised in this study is that an appropriate concentration of SNP promotes an increase in photosynthetic efficiency and, therefore, mitigates the deleterious effects of saline stress, resulting in reduced productivity losses.

2. Results

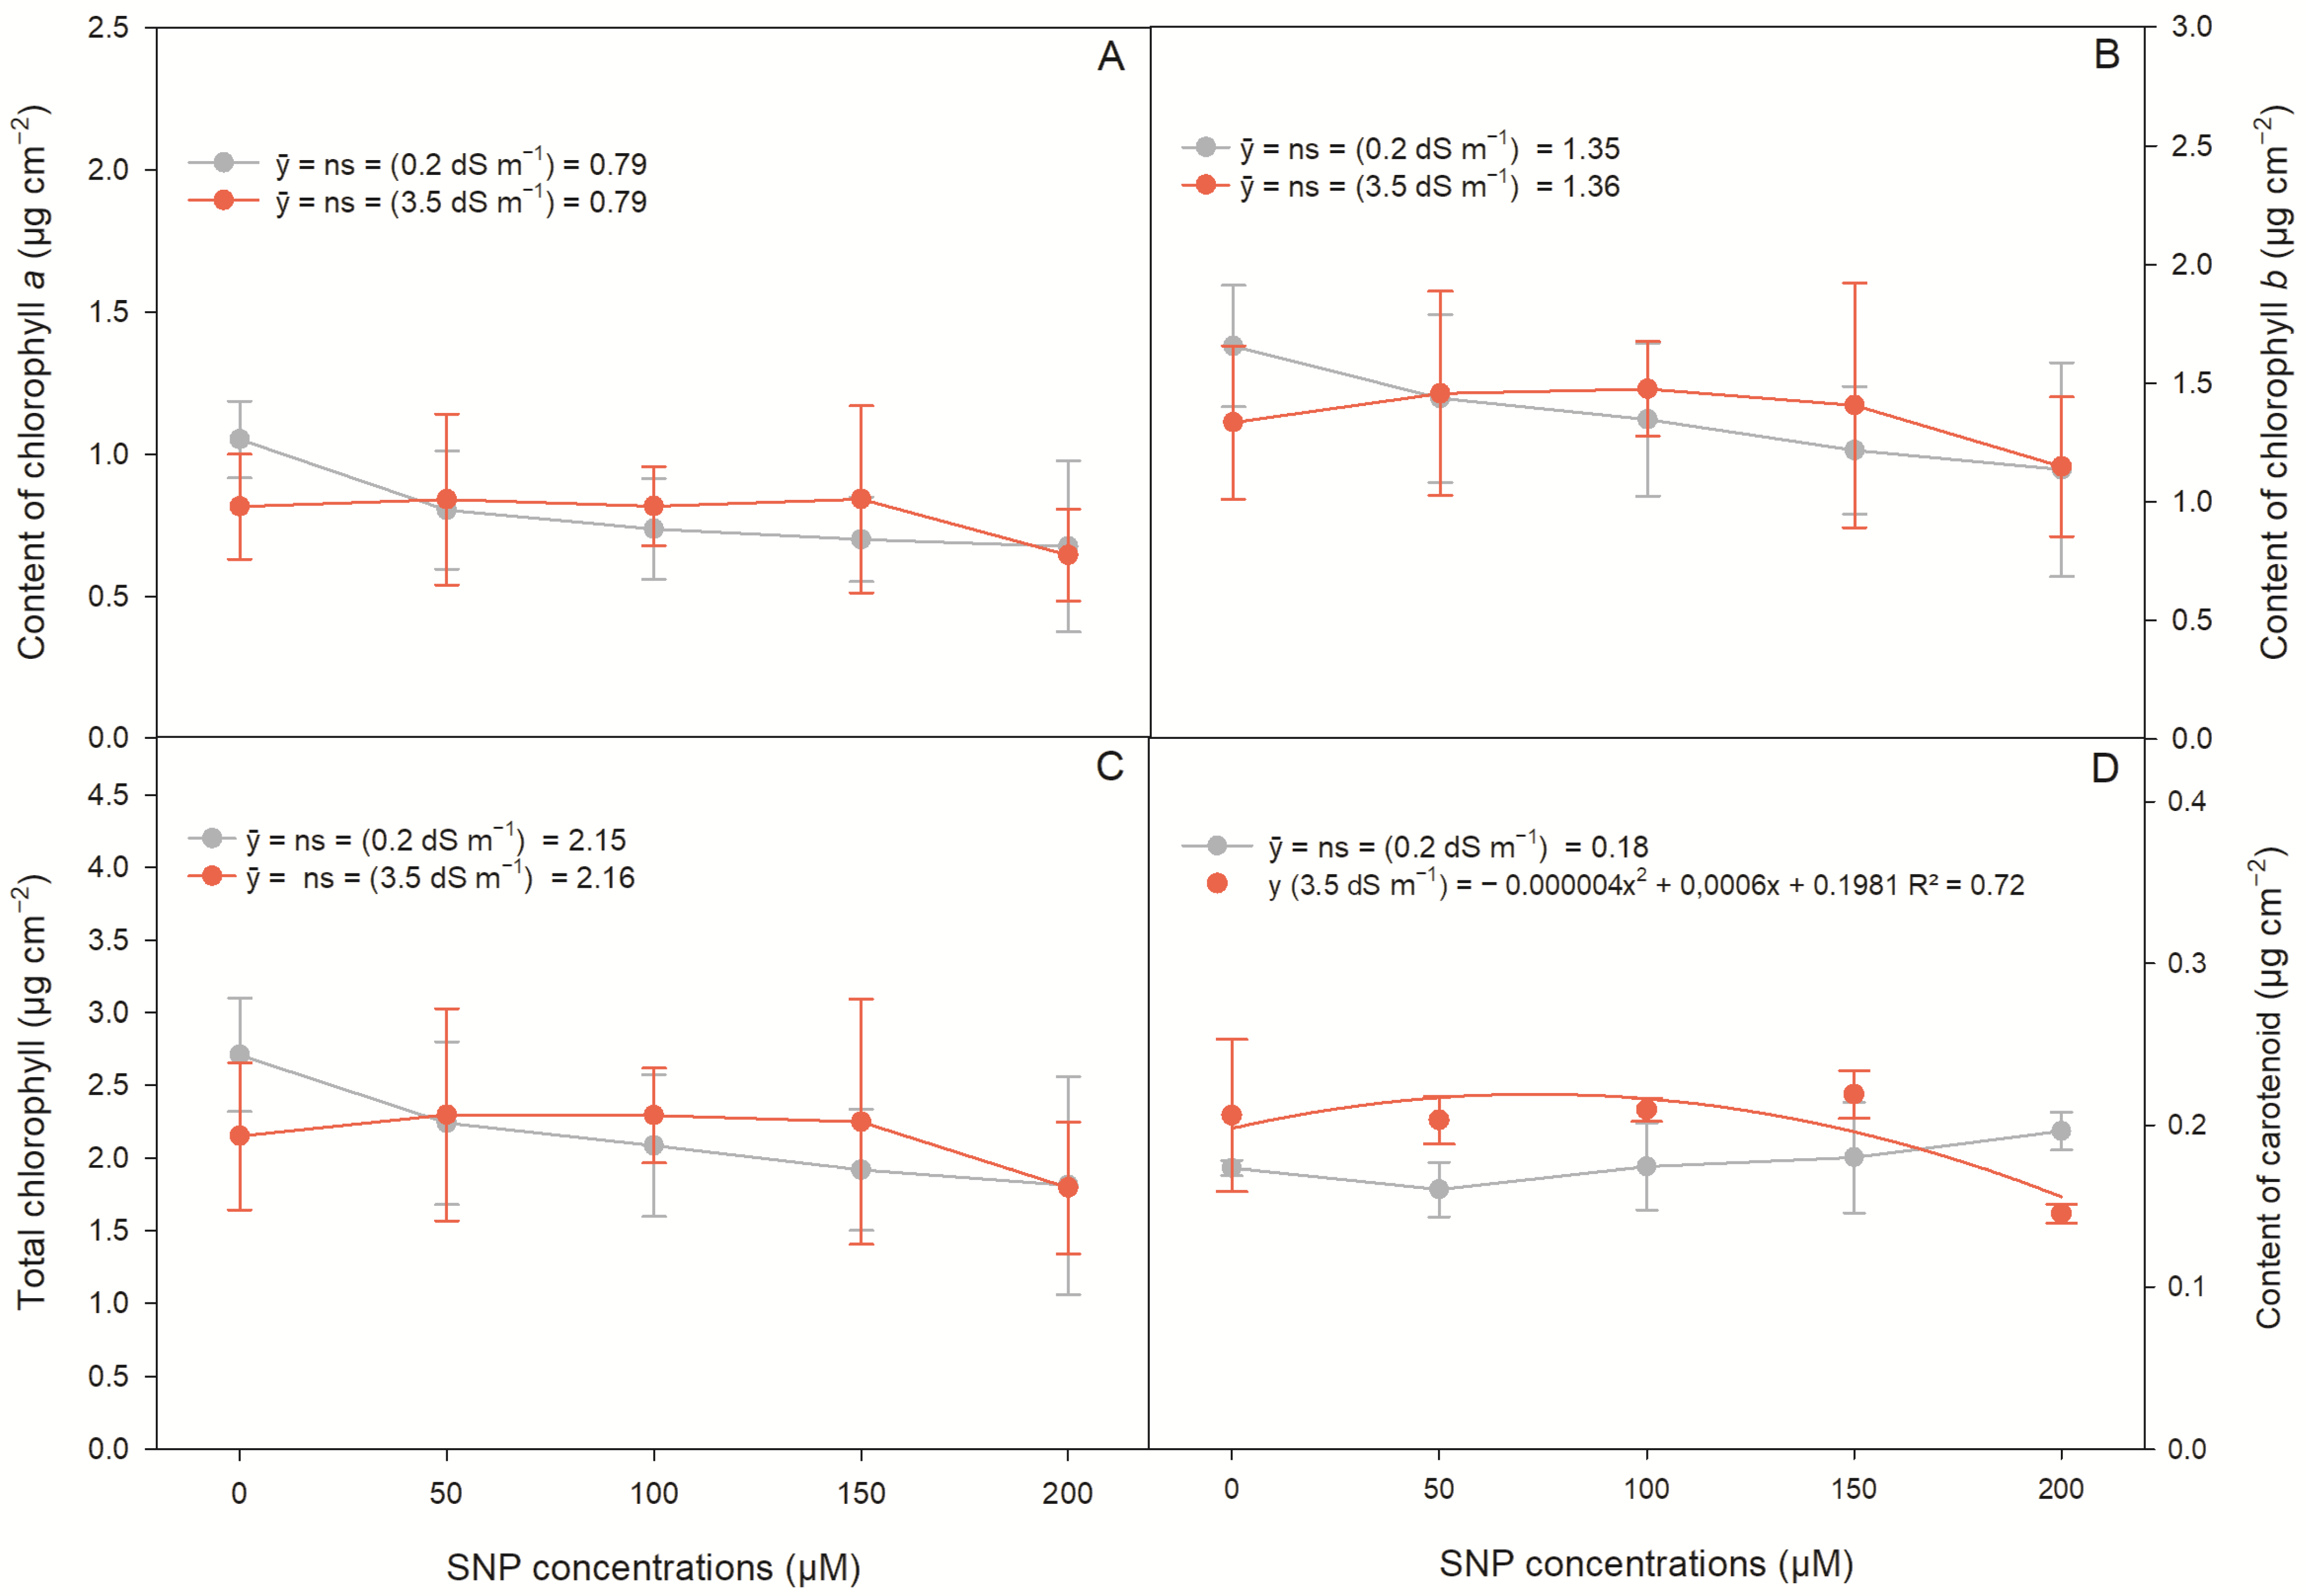
2.1. Photosynthetic Pigments in Lettuce Plants

The treatments tested did not influence the content of chlorophyll a, chlorophyll b, and total chlorophyll (Table 1).
However, it is important to note that there was a significant interaction between SNP concentrations and salt stress on carotenoid content (Table 1). Based on the presumed regression curve fitting, there was a 15.7% increase in carotenoid content in stressed plants when the SNP concentration was considered as 75 μM, compared to the control group (Figure 1D).

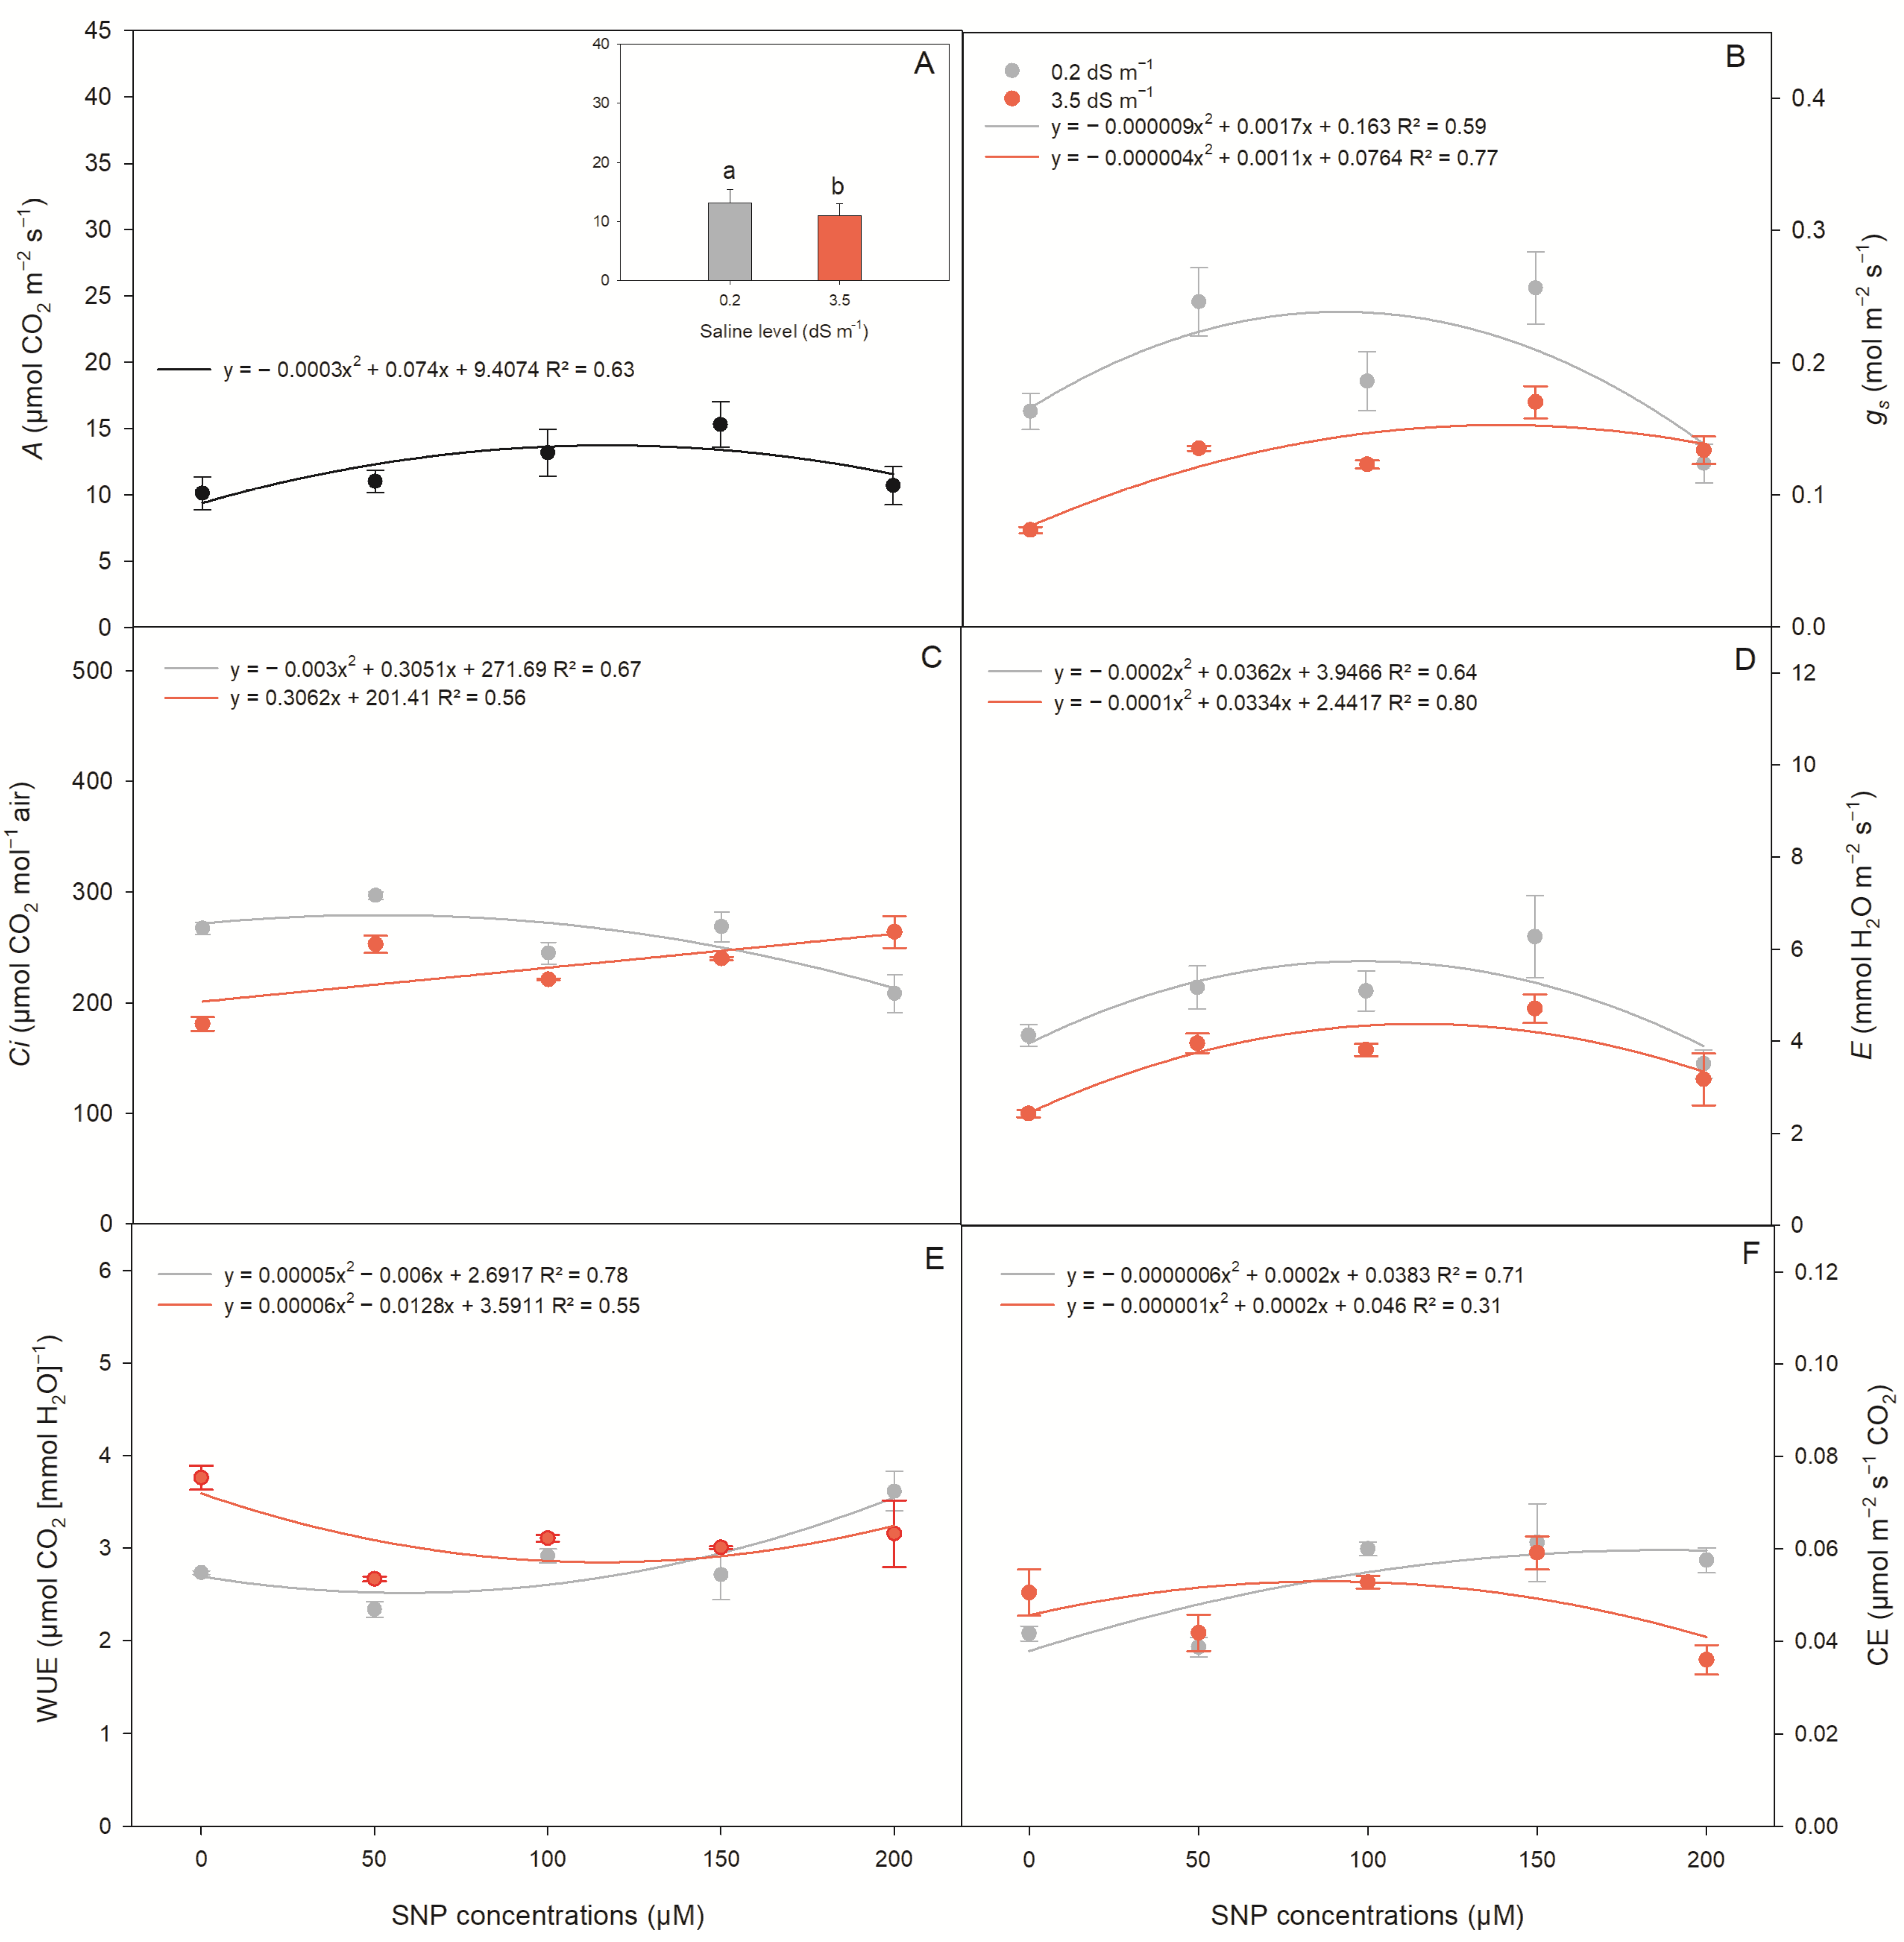
2.2. Gas Exchange in Lettuce Plants

CO2 assimilation (A) was influenced by isolated factors (SNP concentrations and salt stress), while stomatal conductance (gs), internal carbon concentration (Ci), transpiration (E), water use efficiency (WUE), and carboxylation efficiency (CE) were influenced by the interaction of SNP concentrations with salt stress (Table 2).
Through polynomial regression adjustment, the application of 123 μM of SNP promoted an increase in A of 46.7% about the 0 μM of SNP concentration. Salt stress caused a 19.19% reduction in A (Figure 2A). The increase in SNP concentrations favored gs, regardless of stress conditions. In the absence of salt stress, the maximum gs was observed through quadratic regression fitting at 94 μM of SNP concentration, while in plants under saline stress, at the maximum point of the curve (138 μM of SNP), there was an increase of 87.5% in gs compared to plants that did not receive SNP (Figure 2B).
It was found that Ci was positively affected by the application of SNP, as this variable increased as the tested concentrations increased. Under salt stress, the maximum linear concentration of 200 μM of SNP increased Ci by 30.4% compared to the control. In the absence of salt stress, the application of 50.85 μM of SNP to the curve fit provided the highest internal carbon concentration in lettuce plants (Figure 2C).
The increase in SNP concentrations promoted a higher E, both in the absence and presence of salt stress. In stressed plants, maximum E was observed under a concentration of 167 μM of SNP. In the absence of salt stress, plants showed a higher E under a concentration of 90.5 μM of SNP (Figure 2D).
Lettuce plants irrigated with saline water and under SNP application reduced WUE. Under salt stress, a lower WUE was observed at 107 μM of SNP by the curve fitting equation, with an 18.9% reduction relative to the 0 μM of SNP concentration. Plants grown at a lower saline level (0.2 dS m−1) showed a reduction in WUE up to a concentration of 60 μM of SNP according to equational interpolation, which generated a 7% reduction in WUE compared to the control (Figure 2E).
SNP concentrations favored the increase in CE, regardless of salt stress. In the absence of salt stress and under maximum curve adjustment, presumably from the application of 167 μM of SNP, there was a 66.6% increase in CE compared to no SNP application. In stressed plants, this adjustment showed higher CE under the concentration of 100 μM of SNP (Figure 2F).

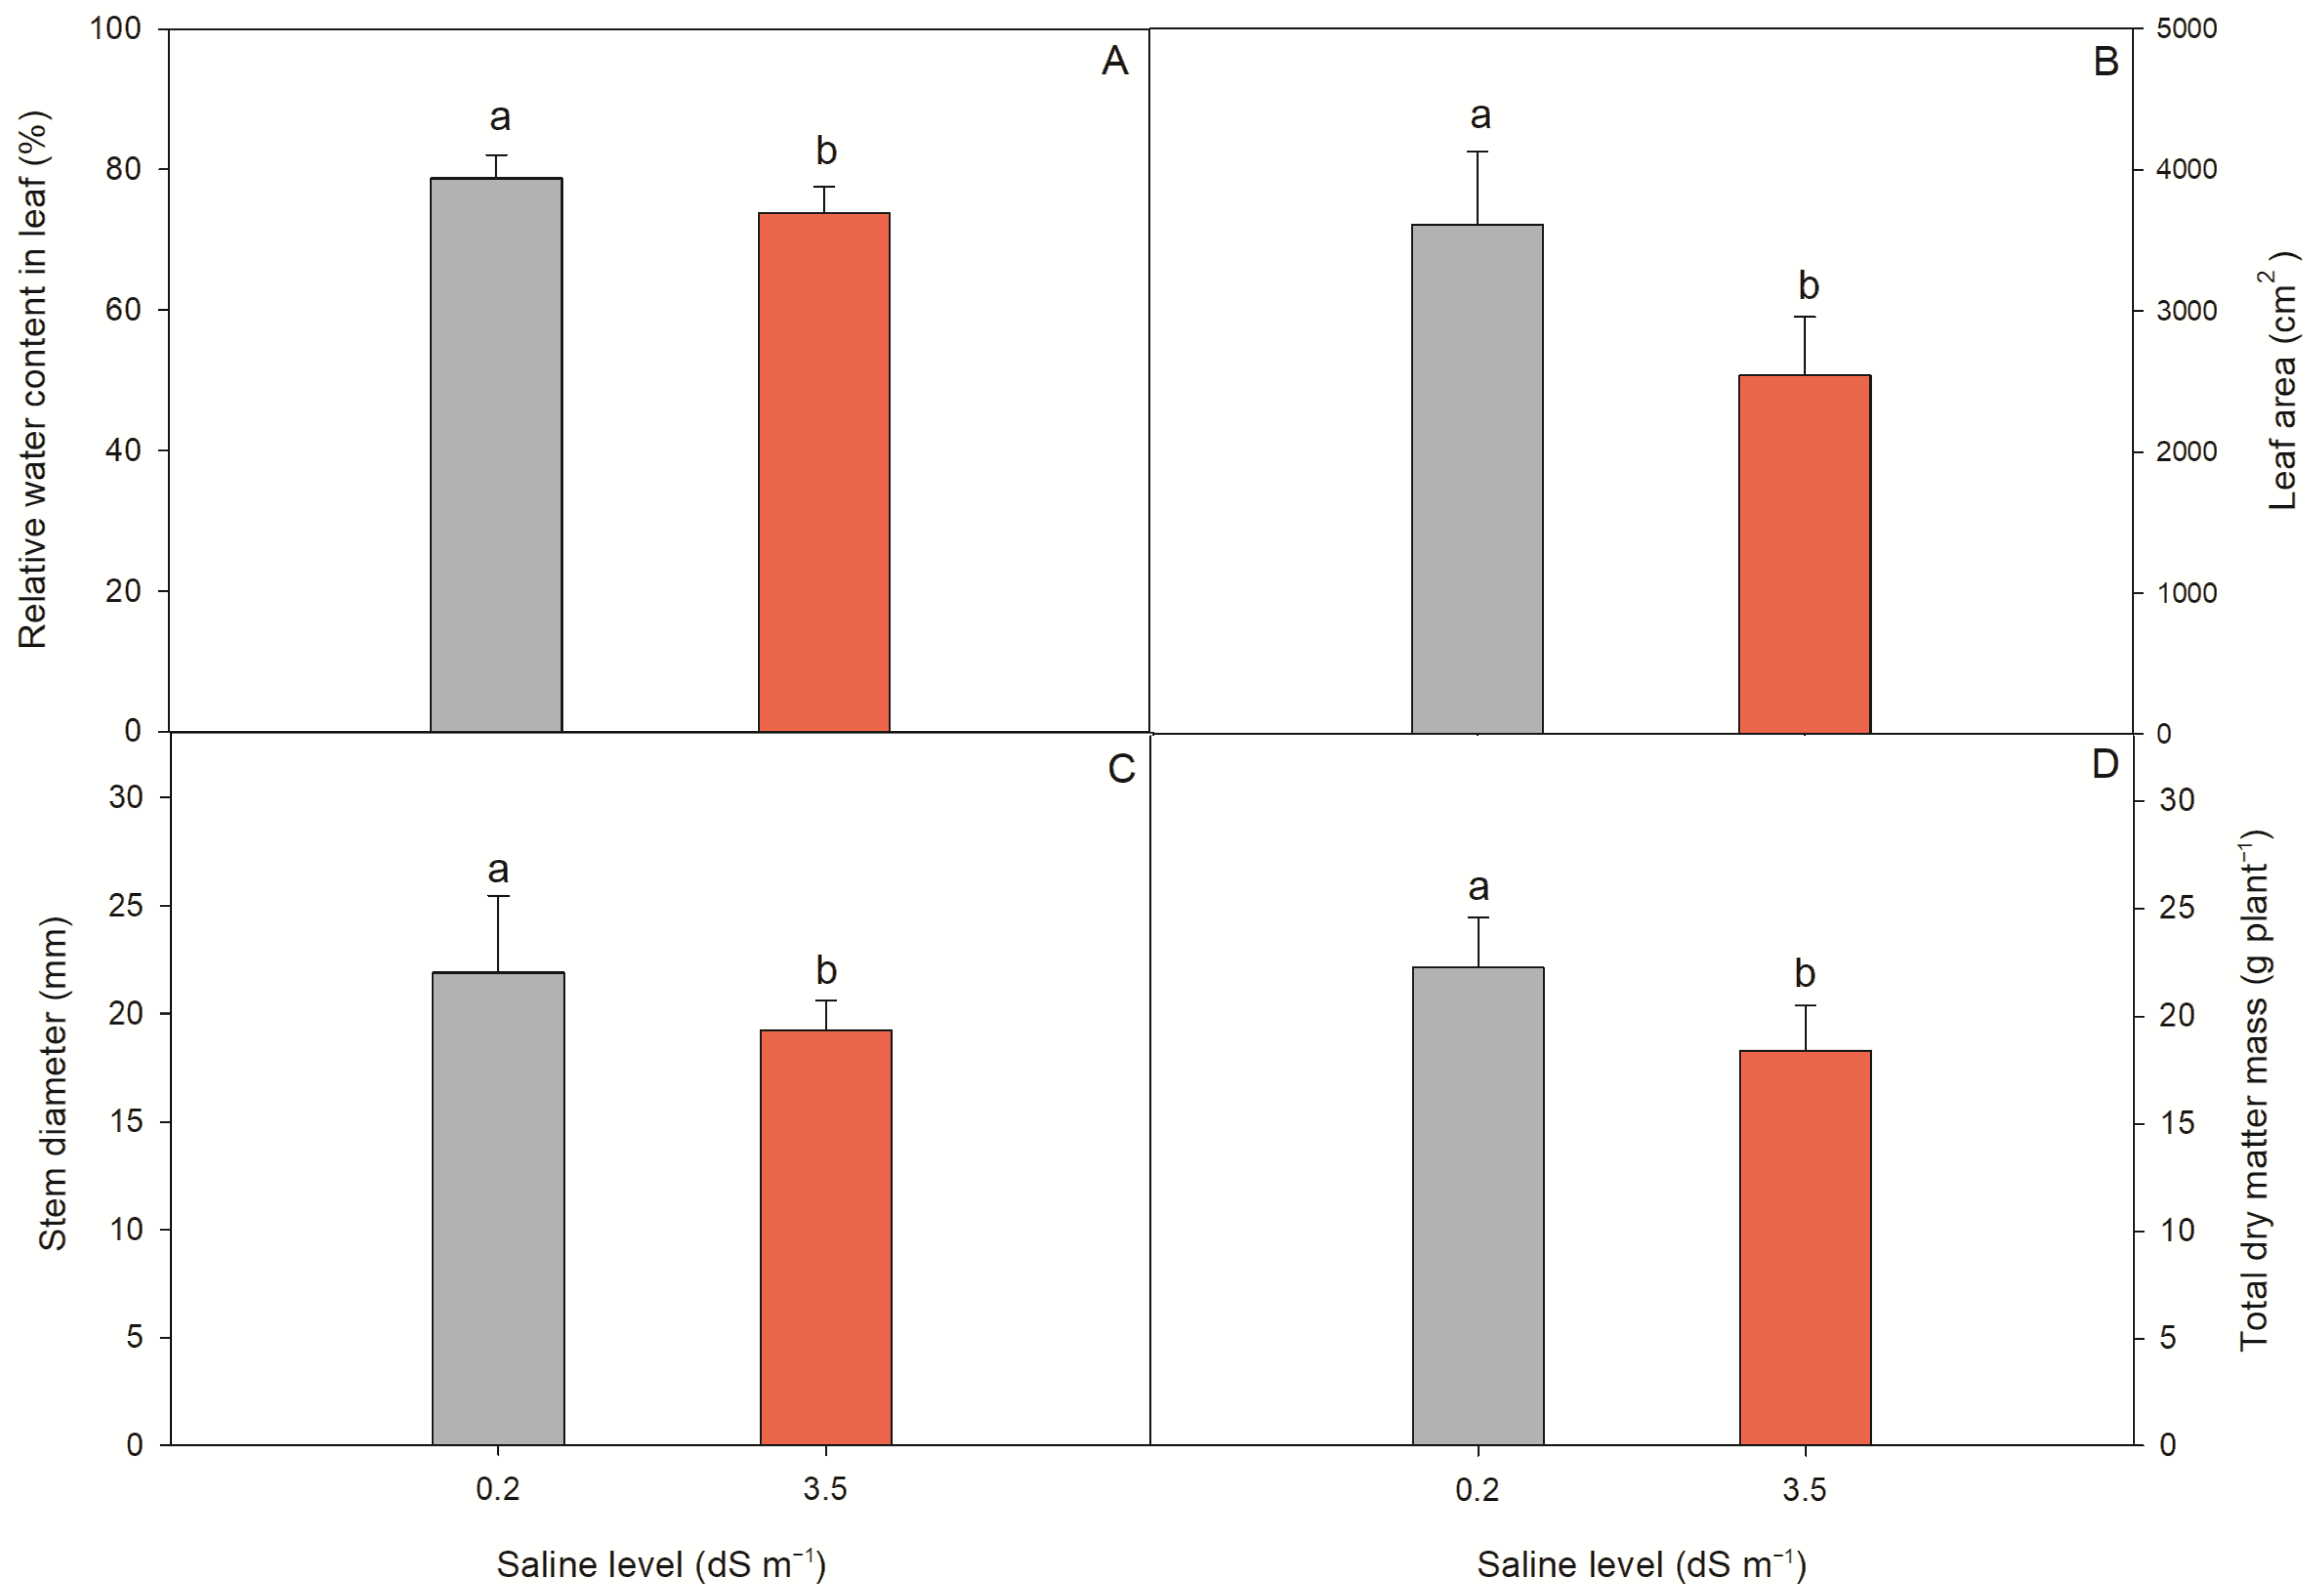
2.3. Morpho-Physiological Parameters of Lettuce Plants

Relative water content in the leaf (RWC), leaf area (LA), stem diameter (SD), and total dry matter mass (TDM) were influenced only by the salinity effect (Table 3).
Exposure to salt stress caused a reduction of 6.3% in RWC (Figure 3A), 29.5% in LA (Figure 3B), 17.2% in SD (Figure 3C), and 10.7% in TDM (Figure 3D), respectively, in the control.

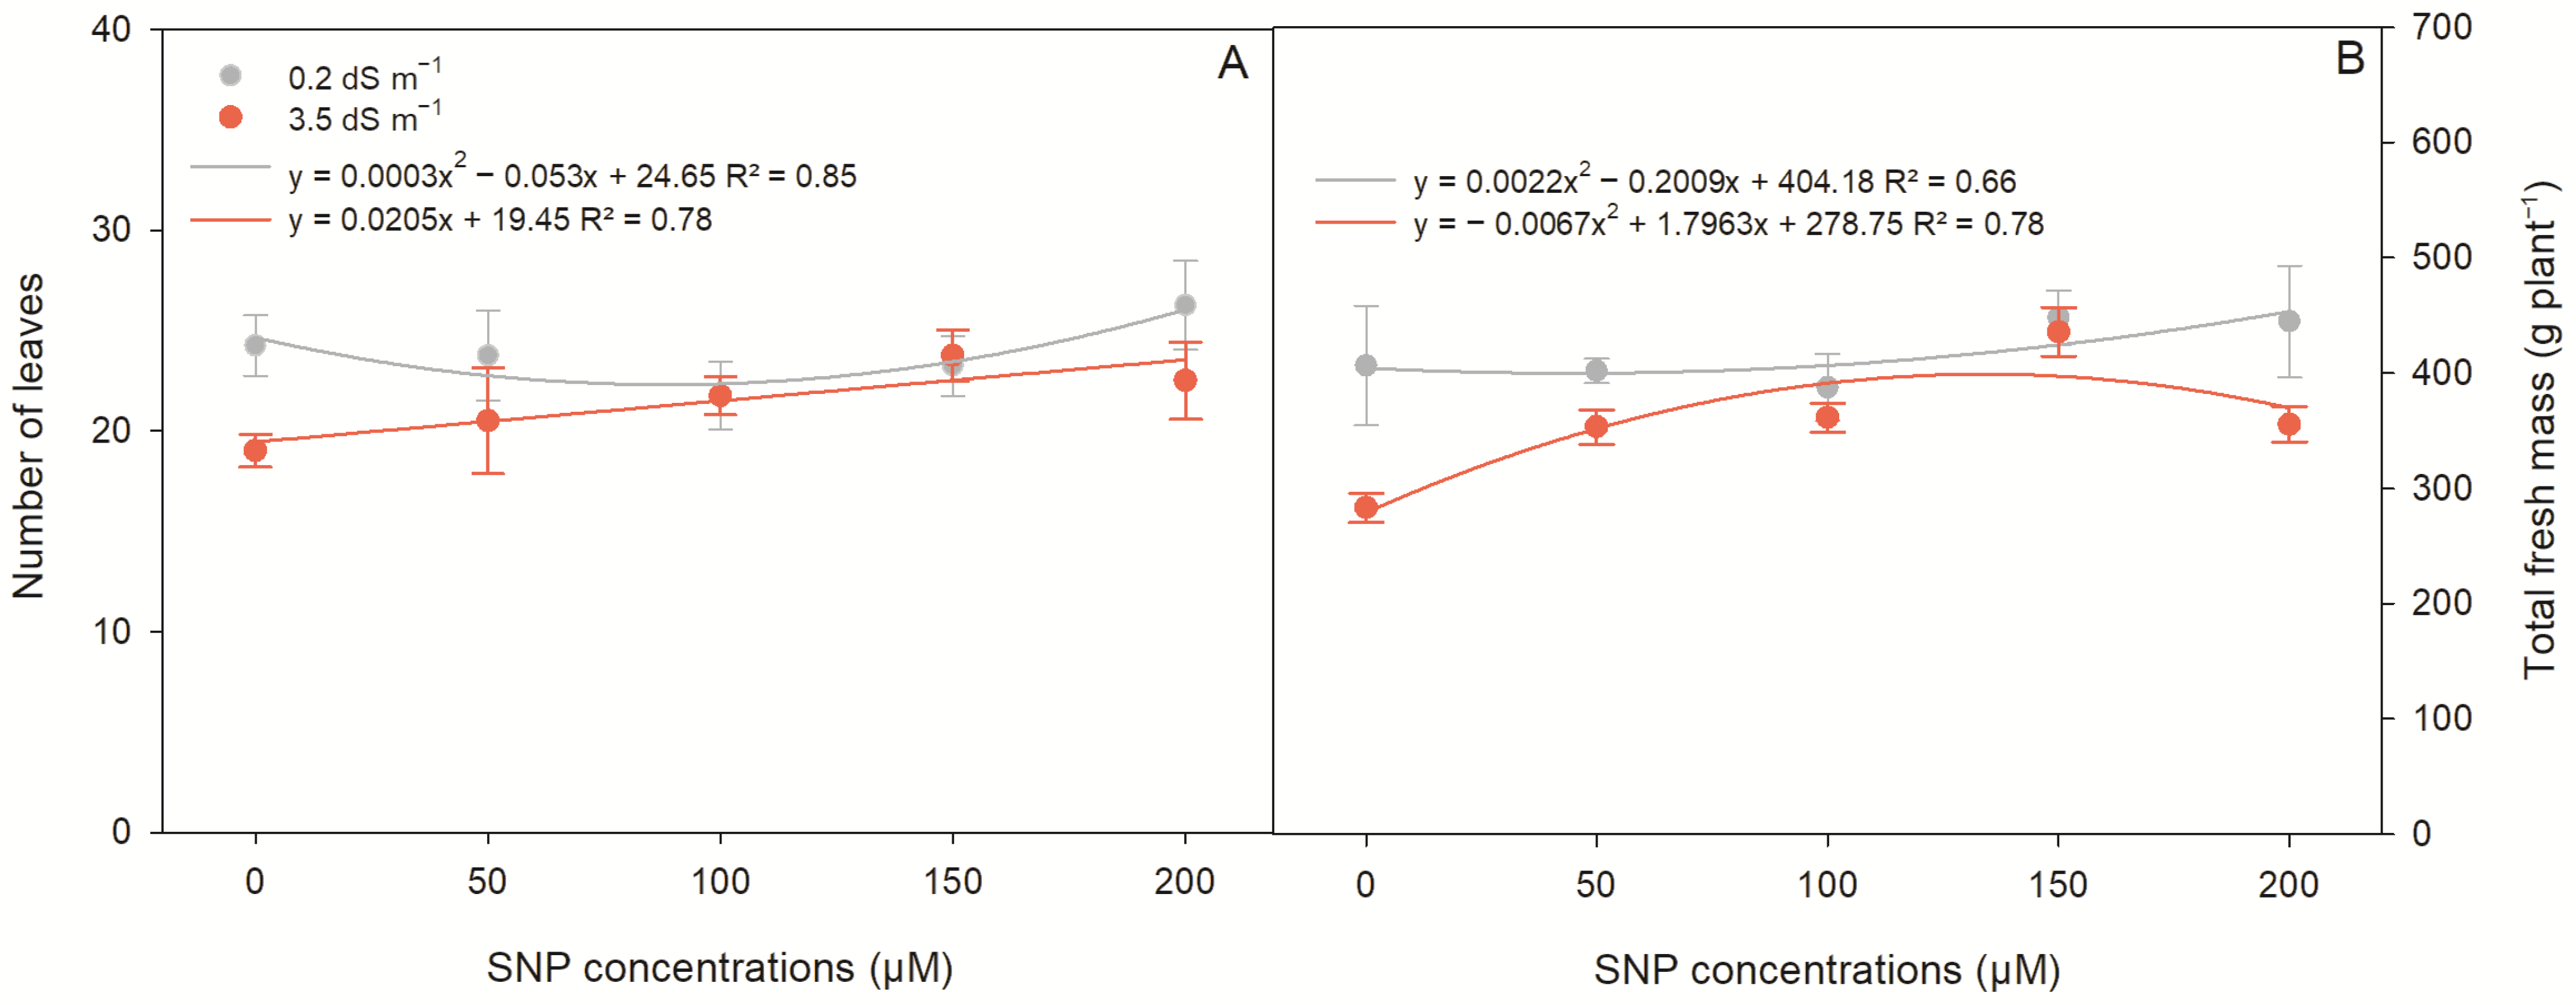
2.4. Productive Parameters of Lettuce Plants

The number of leaves (NL) and total fresh mass (TFM) were influenced by the interaction of factors, SNP concentrations, and salt stress (Table 4).
In the absence of salt stress (0.2 dS m−1), NL was reduced to a concentration of 88 μM of SNP according to the equational curve fit, with subsequent increase. On the other hand, in plants subjected to saline stress, there was a linear increase in NL up to the maximum concentration of 200 μM of SNP (Figure 4A).
In plants cultivated without salt stress, there was an increase in TFM under the maximum concentration of 200 μM of SNP, while in plants subjected to salt stress, the highest TFM was obtained at a concentration of 134 μM of SNP when fitting the curve, with an increase of 43.2% compared to control plants (Figure 4B).
Pearson’s correlation showed that lettuce TFM was correlated mainly by A, gs, E, RWC, SD, and NL, with a significance of 1%. TFM was correlated with Ci, CE, LA, and TDM at 5% significance. In addition to TFM, A correlated with gs, E, CE, and LA at 1% significance. TDM showed a positive correlation with RCW, SD, NL, and TFM and a significance of 5%, 1%, 5% and 5%, respectively (Figure 5).

3. Discussion

Saline stress poses a serious threat to agricultural production, being considered the primary abiotic factor that restricts plant growth and biomass, as documented in previous studies [7,8,9,10,11,12,13,14,15,16,17,18,19,20,21,22,23,24,25,26,27,28,29,30,31,32]. This compromises ionic homeostasis, affects photosynthetic activity, impairs water relations, and triggers osmotic and oxidative stress [7,32,33]. The results of this study corroborate these observations, as saline stress had a significantly negative impact on lettuce development, resulting in a substantial reduction in biomass production.
Agriculture sustainability and food security require addressing saline stress using environmentally conscious methods [33]. It has been demonstrated that exogenous applications of sodium nitroprusside (SNP) mitigate the deleterious effects of salinity, regulating chloroplast content and photosynthetic metabolism, while also promoting productivity gains [3,29,34,35].
Chlorophyll content can be compromised under saline conditions, either due to pigment synthesis inhibition [36,37] or its degradation [38]. However, in this study, no effects of saline stress or SNP application on chlorophyll content were observed, consistent with the findings of [39] when assessing the quality and preservation of lettuce grown with saline water in a protected ambient.
According to reference [40], the concentration of chlorophyll in plants subjected to saline stress conditions can exhibit significant variations, varying depending on the species, and in more susceptible plants, there may be a notable reduction. However, our results revealed an increase in carotenoid content in lettuce when subjected to the combination of SNP application and saline stress, demonstrating that SNP has an attenuating effect and reinforces the mechanisms of the plant’s defenses.
As they act to protect the photosynthetic apparatus, carotenoids are considered an important line of defense against stress [41,42]; in addition, they act as antioxidant compounds, of a non-enzymatic nature, acting directly in the elimination of reactive oxygen species, reducing the damage caused by oxidative stress, which increases in stress conditions [43,44].
Our results agree with [3], which also found an increase in carotenoid content in lettuce plants subjected to short-term salt stress in the presence of SNP, emphasizing that the application of nitric oxide provided via SNP donor contributes to increase the concentration of this pigment and action in mitigating the deleterious effects caused by salinity.
In this study, we observed a significant deterioration in the gas exchange of lettuce plants due to exposure to salinity. Indeed, saline stress has the potential to profoundly impact the CO2 assimilation process in stressed plants, primarily due to the osmotic and ionic imbalances that originate from this stress [2,3,33]. This adverse condition leads to stomatal closure and cellular toxicity [3,45], which, in turn, results in increased resistance to CO2 diffusion in the leaf mesophyll, ultimately leading to a reduced rate of photosynthesis [46].
Under high concentrations of salts, plants may have lower stomatal conductance, lower internal CO2 concentration, and lower photosynthesis, as a strategy to reduce excessive water loss through transpiration due to the water deficit generated by the osmotic effect of salinity [3]. However, the application of SNP proved to be effective in attenuating the deleterious effects of salinity on lettuce in this study. The partial closure of the stomata is induced through the concentrations of abscisic acid (ABA) present in the medium that acts in the transduction of signals involving nitric oxide in the regulation of guard cells [47].
Our results have shown that the increase in transpiration rate in plants under higher concentrations of SNP is a result of the enhanced stomatal conductance, which promotes an increase in internal CO2 concentration and greater CO2 assimilation. These effects were reflected in fresh mass gains in lettuce. This process contributed to minimizing the damage caused by stress, enabling the continued development of the plant.
The favoring of photosynthetic metabolism of lettuce plants under salinity and NO application, especially at concentrations above 100 μM of SNP, can be explained by the fundamental role of NO in ABA synthesis. The presence of NO in plant tissue inhibits ABA synthesis by promoting nitrosylation and inactivating kinase OST1, a fundamental protein for stomatal regulation that allowed a greater supply of CO2 in the leaf mesophyll used in photosynthesis and kept the processes aimed at plant growth active [48].
Our research corroborates the results observed by [35], in which NO improved the photosynthetic performance of the plant and culminated in a higher transpiration rate through stomatal opening and CO2 diffusion to the leaf mesophyll and, consequently, a higher photosynthetic rate.
The water content in the leaves plays an essential role in photosynthesis, as water is required for the efficient transport of nutrients from the soil to the leaves, providing electrons during photolysis, maintaining the turgidity of leaf cells for gas exchange, and participating in the chemical reactions of photosynthesis [14]. Salinity results in significant reductions in the relative water content of lettuce leaves, decreasing tolerance to stress-induced dehydration. Leaf relative water content is a crucial indicator of a plant’s ability to cope with dehydration and is highly impacted under stress conditions [44]. Abiotic stresses can compromise tissue hydration and affect physiological processes during plant development [23,49], as evidenced by the results of this study.
The reduction in leaf water availability due to saline stress also affected the morphological characteristics of lettuce, with a notable impact on leaf area, which was the most affected variable in this study. This response represents a plant adaptation to the saline environment, achieved either by reducing leaf emission or by decreasing the size of leaf blades [50], as a strategy to mitigate water loss through transpiration [51].
The negative effect of salinity on morphophysiological and productive parameters in crops is well documented in the literature [25,52,53], and the damage may be associated with osmotic, toxic, and nutritional effects, given the accumulation of salts in the root zone, compromising the physiological and biochemical mechanisms of the plant [14].
The application of nitric oxide (NO) provides plants with increased salinity tolerance, as evidenced by the growth stimulation of lettuce seedlings cultivated in a saline medium for a short period, as previously reported [3]. These findings align with the results of this study. Additionally, it is believed that nitric oxide plays a pivotal role in plant growth and developmental regulation under stress conditions, highlighting its protective effect [54].
The maintenance of desirable commercial traits in lettuce was promoted by the action of nitric oxide through the preservation of plant photosynthetic metabolism under stressful salinity conditions. However, evidence despite that exogenous NO application favors the mitigation of abiotic stress effects [24,25,34,55,56], its impact on lettuce production still requires further clarification. Therefore, this research points towards future investigations on the role of nitric oxide in lettuce production parameters, especially under field conditions, as studies simulating field conditions are essential to provide future directions and explore the mechanisms of NO action in new technologies [16,30].
Under saline conditions, lettuce plants faced significant challenges, including water loss and ionic imbalance. Nitric oxide (NO) acted as a key regulator, assisting the plants in coping with these stresses. It played a role in modulating stomatal opening and closing, thereby controlling transpiration, and reducing water loss. Additionally, NO positively influenced photosynthetic metabolism and ensured an adequate supply of carbon for plants under saline stress. Thus, nitric oxide emerges as a promising tool in the quest for effective strategies to mitigate salt stress, with significant implications for agriculture in soil saline-affected environments.

4. Materials and Methods

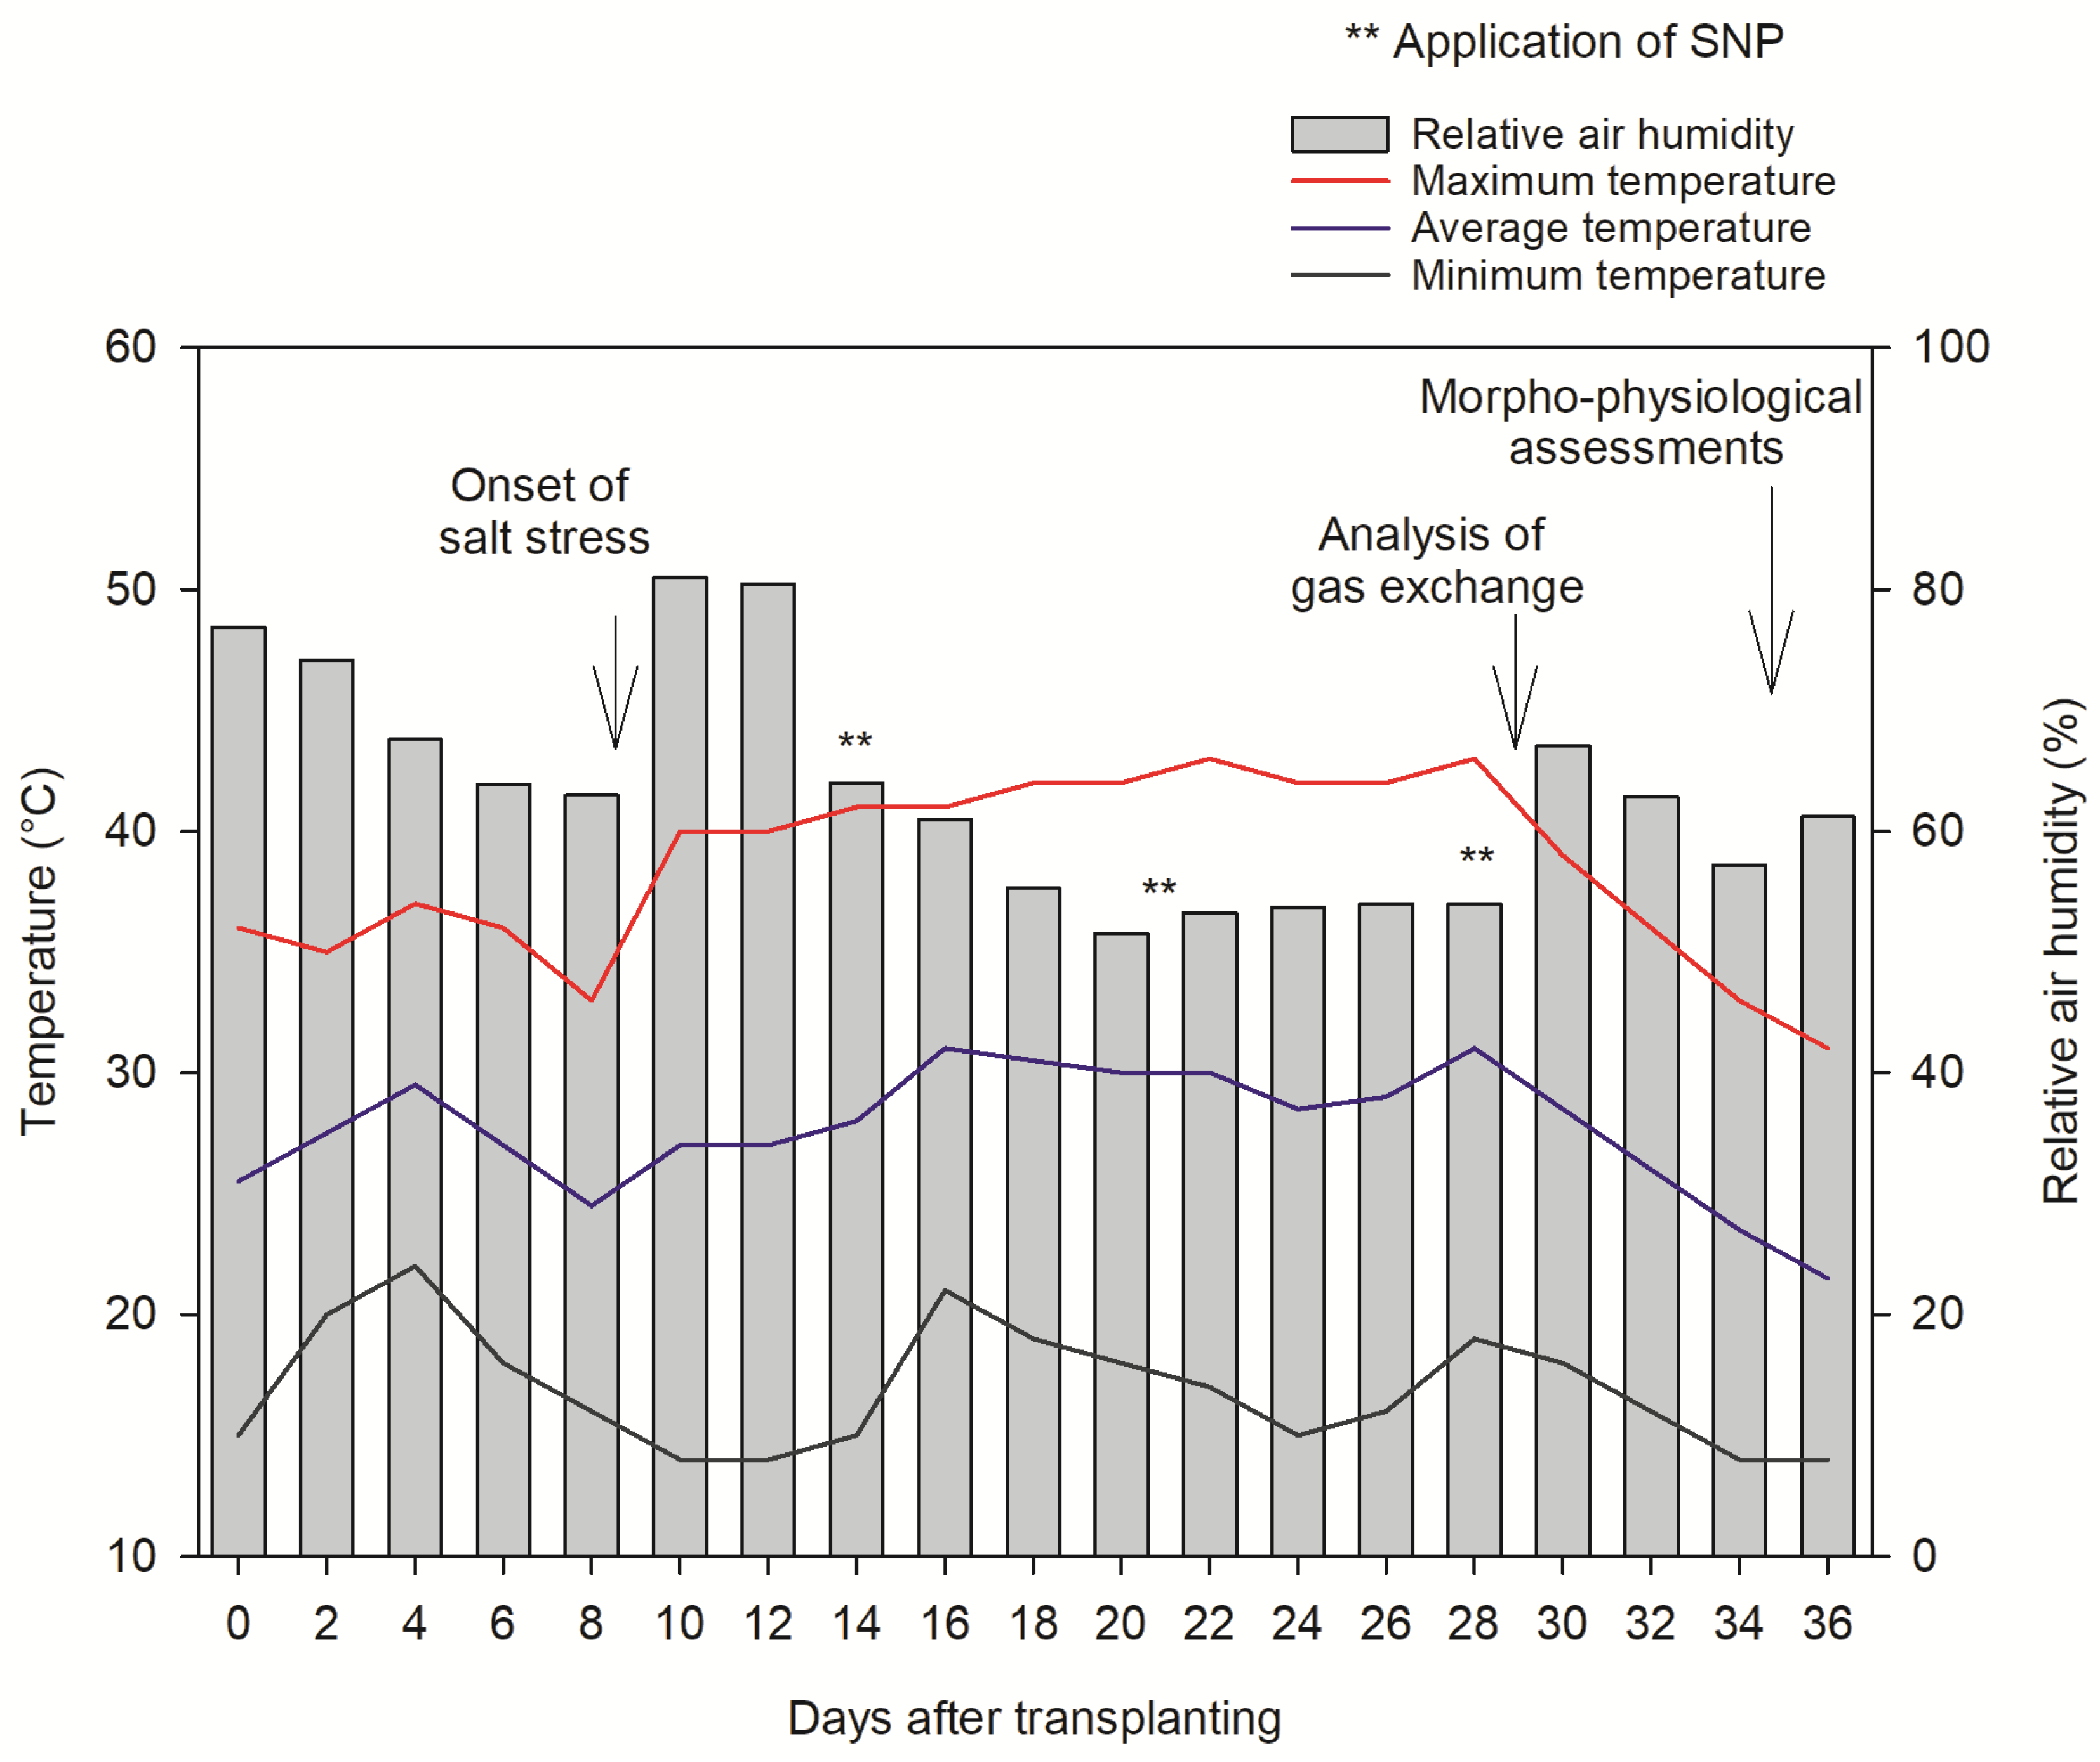
4.1. Experiment Design

The experiment was carried out in a greenhouse, between April and May 2021, at the Teaching, Research, and Production Farm of São Manuel (22°43′52″ S, 48°34′14″ W and 709 m high), at the Faculty of Agricultural Sciences, Botucatu Campus, São Paulo State University, in the city of São Manuel, state of São Paulo, Brazil. The climate of the region is of type B2rB’3a’, according to Thornthwaite’s classification, characterized by a humid, mesothermal climate and concentration of potential evapotranspiration in the summer of 33% and small water deficit in April, July, and August. The annual average air temperature is 20.3 °C, with rainfall of 1428.4 mm [57].
Greenhouse climate conditions of temperature (maximum and minimum) and relative air humidity were logged throughout the experiment using Datalogger (Instrutherm, HT-500: São Paulo, Brazil) (Figure 6).
The experimental design adopted was in randomized blocks, in a 5 × 2 factorial scheme, where the first factor constituted five concentrations of sodium nitroprusside (SNP) (0, 50, 100, 150, and 200 µmol), nitric oxide donor and the second factor was composed of two saline levels of irrigation water (0.2 dS m−1: treatment without salt stress; 3.5 dS m−1 treatment with salt stress), with four replications of five plants each one, totaling 40 experimental units. Each experimental unit consisted of five plants.
The variety tested in this study was “Vera” (Seeds—Sakata, São Paulo, Brasil), curly lettuce, which has broad leaves, high crispness, an average cycle of 60 days, resistance to bolting, and good adaptation to hydroponic cultivation. The seedlings were produced in polystyrene trays filled with Carolina Soil® commercial substrate. The transplanting of seedlings to 2.8 L plastic pots filled with coconut fiber occurred 25 days after sowing (DAS) when they had three developed leaves.
The SNP (Dinâmica, Indaituba, Brazil) was used in the dihydrate form, presenting the following specifications: Na2[Fe(CN)5NO]·2H2O, with a molecular mass of 297.95 g mol L−1, minimum purity level 99%, chloride (Cl) max. 0.02%; sulfate (SO4) max. 0.01% and insoluble materials max. 0.01%.
SNP applications were made weekly (foliar application), at 14, 21, and 28 days after transplanting (DAT), totaling three applications throughout the experiment. For the application of the concentrations, the dilution of each one of them in water from the experimental area was previously prepared, for later application in a manual CO2 pressurized sprayer, with sprayer liquid 0.3 bar, full conical nozzles, a spray volume of 200 L ha−1, and CO2 constant pressure of 1.5 bar, with the aid of a plastic curtain between treatments to avoid drift.
For the lowest saline level, water from the supply sector of the experimental area was used, which presented electrical conductivity in the range of 0.2 dS m−1 (Table 5); the highest saline level, 3.5 dS m−1, was obtained by dissolving sodium chloride (NaCl) in water used at a saline level of 0.2 dS m−1, whose salinity was kept adjusted with the aid of a conductivity meter benchtop Tec-4MP Tecnal® (Tecnal, Piracicaba-SP, Brazil).

4.2. Crop Management and Fertirrigation

The irrigation system adopted was adjusted for semi-hydroponic cultivation, and the nutrient solutions were applied daily, obeying the saline level of the treatment in a volume sufficient to ensure minimal drainage of the vessels, with no return of the solution to the reservoir. This system was composed of two plastic reservoirs (360 L), with an electric pump attached to each reservoir, an outlet in lateral polyethylene lines with a diameter of 16 mm, microtube emitters of 40 cm in length, and self-compensating drip with a flow of 4.5 L h−1. To activate the system, a digital timer (TMDS0BC) Exatron® (Exatron, Canoas-RS, Brazil) was used with daily events programmed for minimal drainage of the vessels.
The availability of nutrients for culture was supplied through the recommendation suggested by [58] for hardwoods, with the 1.000 L preparation having the following composition: 750 g m−3 of calcium nitrate [Ca(NO3)2], 500 g m−3 of potassium nitrate [KNO3], 150 g m−3 of monomeric phosphate-MAP, 400 g m−3 of magnesium sulfate [MgSO4], 0.15 g m−3 of copper sulfate [CuSO4], 0.3 g m−3 of zinc sulfate [ZnSO4], 1.5 g m−3 of manganese sulfate [MnSO4], 1.8 g m−3 of boric acid [H3BO3], 0.15 g m−3 of sodium molybdate [Na2MoO4], and 16 g m−3 of iron chelate [Fe-EDTA]—13%. The application of this recommendation was adjusted to 50% of the ionic strength since coconut fiber was used as a support substrate for plants, and this can contribute to the increase in salinity.

4.3. Parameters Analyzed

The plants were harvested at 35 days after transplanting (DAT) when they presented a commercial pattern (leaves completely expanded and without sprouting), where the following parameters were evaluated: gas exchange, contents of photosynthetic pigments, relative water content in leaf, leaf area, stem diameter, number of leaves, total fresh mass, and total dry mass.
Gas exchanges were measured in two plants per replication (n = 4) using an Infra-Red Gas Analyzer (IRGA), model LI-6400, LI-COR (Lincoln, NE, USA), open system of photosynthesis with CO2 analyzer, and water vapor via infrared radiation. The measurements were conducted after NO applications, at 29 DAP, between 8:00 and 11:00 AM, using atmospheric CO2 concentration, with constant ambient temperature, humidity, and photosynthetically active radiation (PAR) (1000 µmol photons m−2 s−1): CO2 assimilation rate (A, μmol CO2 m−2 s−1), stomatal conductance (gs, mol m−2 s−1), the internal concentration of CO2 in the leaf (Ci, µmol CO2 mol−1 air), and transpiration rate (E, mmol H2O m−2 s−1). The measurements above were calculated using the general gas exchange equation of [59] through the data analysis program of the equipment. The water use efficiency (US, µmol CO2 (mmol H2O)−1) was calculated based on the A/E ratio, and carboxylation efficiency (CE, µmol m−2 s−1 CO2) was calculated based on the A/Ci ratio.
Chloroplast pigments were quantified in fresh leaf tissues of one plant per replication (n = 4) via extraction in N-dimethylformamide (DMS) solution and subsequent determination by spectrophotometry (Shimadzu, UV-2700, Kyoto, Japan). The content of chlorophylls a, b, and carotenoids was determined. A leaf disc with a known area was removed from the lettuce leaf, and immersed in N-dimethylformamide solution for 24 h in the dark. After this period, the absorbance of this solution was determined via spectrophotometry at wavelengths of 664 nm, 647 nm, and 480 nm, respectively [60].
Relative water content in the leaf (RWC) was obtained by determining the fresh, turgid, and dry mass of 24 leaf discs, measuring 1.1671 cm² in area, taken from different positions on the lettuce leaf. The mass values were submitted to Equation (1) [61].
RWC = (FM − DM)/(MT − DM) × 100%
where RWC is the relative water content in the leaf (%); MF is the fresh mass of leaf discs (g); DM is the dry matter mass of leaf discs (g); and MT is the mass of turgid matter in the leaf discs (g).
To determine the variables, leaf area, diameter, number of leaves, total fresh mass, and total dry matter mass, two plants per replication were used (n = 4).
The leaf area meter determined the leaf area of the plants in each plot (LI-COR Biosciences Inc., LI-3100C, Lincoln, NE, USA). The diameter at the plant neck was measured using a digital caliper (MeterMall, 150 mm and reading 0.1 mm, Marysville, WA, USA).
The number of leaves was determined by direct counting of fully formed leaves.
To obtain the total fresh mass, the plants were weighed on a precision analytical balance (0.05 g) (Shimadzu, BL-3200H, Kyoto, Japan) with stem and leaves, whose mass was expressed in grams. The total dry matter mass was quantified by placing the plants in an identified paper bag and placed in an oven with forced air circulation (Fanem, 330/5, São Paulo, Brazil) for complete drying of the material to constant mass under temperature of 65 °C (±1). After complete drying of the material, they were weighed on a precision digital scale (0.01 g) (Bel, S2202, Monza, Italy).

4.4. Statistical Analysis

The data were initially subjected to Levene’s homogeneity test, and normality was assessed using the Shapiro–Wilk test, both with a significance level of p > 0.05. Once these conditions were met, the analysis of variance was performed using the F-test and polynomial regression. The means of salinity levels (0.2 dS m−1 and 3.5 dS m−1) were compared using the Tukey test at a 5% significance level, and factor interaction was modeled through polynomial regression using the SISVAR® statistical software (Lavras, Brazil) [62].

5. Conclusions

Considering the aspects outlined in this research, we emphasize the negative impacts induced by saline stress on lettuce growth and harvest, as evidenced by a notable reduction in gas exchange, leaf water content, leaf area, leaf count, and fresh plant mass. However, it is worth noting that the application of SNP (sodium nitroprusside) at concentrations between 100 and 150 µM exhibited a significantly positive effect in mitigating these adverse salinity effects. SNP contributed to the enhancement of plant metabolism, resulting in a noteworthy increase in lettuce productivity.
The findings of this study unequivocally indicate that foliar application of SNP as a source of nitric oxide provides robust evidence regarding the role of this compound in promoting salinity tolerance and enhancing lettuce crop yield. These findings hold substantial implications within the agricultural context, suggesting that the manipulation of nitric oxide may constitute an effective strategy to address salinity-related challenges in lettuce cultivation and potentially in other agricultural environments.
As we progress, it is essential to conduct further research in diverse agricultural settings to validate and extend these findings. Additionally, future research endeavors may focus on exploring practical applications of nitric oxide in agriculture, aiming to develop sustainable strategies to enhance crop resilience under adverse conditions, thereby ensuring food security in the context of global challenges.

Author Contributions

Conceptualization, I.C.d.S.M., E.O.O. and J.D.R.; methodology, I.C.d.S.M., D.M.R.S., G.L.B. and F.d.A.d.O.; software, I.C.d.S.M. and D.M.R.S.; validation, I.C.d.S.M., D.M.R.S., G.L.B. and F.d.A.d.O.; formal analysis, I.C.d.S.M.; investigation, I.C.d.S.M., D.M.R.S. and G.L.B.; resources, I.C.d.S.M.; data curation, I.C.d.S.M., E.O.O. and J.D.R.; writing—original draft preparation, I.C.d.S.M.; writing—review and editing, E.O.O. and J.D.R.; visualization, I.C.d.S.M., D.M.R.S., G.L.B., F.d.A.d.O., E.O.O. and J.D.R.; supervision, J.D.R.; project administration, I.C.d.S.M., E.O.O. and J.D.R.; funding acquisition, E.O.O. and J.D.R. All authors have read and agreed to the published version of the manuscript.

Funding

This research was funded by Coordenação de Aperfeiçoamento de Pessoal de Nível Superior (CAPES), grant number 001.

Data Availability Statement

All data are included in the main text.

Acknowledgments

The authors would like to express their gratitude to the School of Agronomy Science of Universidade Estadual Paulista “Júlio de Mesquita Filho” (UNESP), Botucatu Campus, and its servers, who contributed to the development of this study, and Coordenação de Aperfeiçoamento de Pessoal de Nível Superior (CAPES), Brazil, for the financial support this research.

Conflicts of Interest

The authors declare no conflict of interest.

References

  1. Sharma, D.K.; Chaudhari, S.K.; Singh, A. In salt affected soils agroforestry is a promising option. Indian Farming 2014, 63, 19–22. [Google Scholar]
  2. Farouk, S.; Al-Huqail, A.A. Sustainable biochar and/or melatonin improve salinity tolerance in borage plants by modulating osmotic adjustment, antioxidants, and ion homeostasis. Plants 2022, 11, 765. [Google Scholar] [CrossRef] [PubMed]
  3. Campos, F.V.; Oliveira, J.A.; Pereira, M.G.; Farnese, F.S. Nitric oxide and phytohormone interactions in the response of Lactuca sativa to salinity stress. Planta 2019, 250, 1475–1489. [Google Scholar] [CrossRef] [PubMed]
  4. Nachshon, U. Cropland soil salinization and associated hydrology: Trends, processes and examples. Water 2018, 10, 1030. [Google Scholar] [CrossRef]
  5. Hu, H.; Zhang, M.; Fu, M.; Qin, J.; Chen, J.; Feng, Y.; Li, G.; Zhai, M.; Zhang, Y.; Ning, T. Water sources effects on soil salinity and biomass production of agriculture and agroforest systems in raised fields. J. Plant Interact. 2020, 15, 303–312. [Google Scholar] [CrossRef]
  6. Liu, D.; She, D.; Mu, X. Water flow and salt transport in bare saline-sodic soils subjected to evaporation and intermittent irrigation with saline/distilled water. Land. Degrad. Dev. 2019, 30, 1204–1218. [Google Scholar] [CrossRef]
  7. Yang, A.; Akhtar, S.S.; Li, L.; Fu, Q.; Li, Q.; Naeem, M.A.; He, X.; Zhang, Z.; Jacobsen, S.-E. Biochar mitigates combined effects of drought and salinity stress in Quinoa. Agronomy 2020, 10, 912. [Google Scholar] [CrossRef]
  8. Carillo, P.; Raimondi, G.; Kyriacou, M.C.; Pannico, A.; El-Nakhel, C.; Cirillo, V.; Colla, G.; Pascale, S.; Rouphael, Y. Morpho-physiological and homeostatic adaptive responses triggered by omeprazole enhace lettuce tolerance to salt stress. Sci. Hortic. 2019, 249, 22–30. [Google Scholar]
  9. Hniličková, H.; Hnilička, F.; Martinkova, J.; Kraus, K. Efects of salt stress on water status, photosynthesis and chlorophyll fuorescence of rocket. Plant Soil. Environ. 2017, 63, 362–367. [Google Scholar] [CrossRef]
  10. Kim, H.; Jeong, H.; Jeon, J.; Bae, S. Efects of irrigation with saline water on crop growth and yield in greenhouse cultivation. Water 2016, 8, 127. [Google Scholar] [CrossRef]
  11. Machado, R.M.A.; Serralheiro, R.P. Soil Salinity: Effect on Vegetable Crop Growth. Management Practices to Prevent and Mitigate Soil Salinization. Horticulturae 2017, 3, 30. [Google Scholar] [CrossRef]
  12. Adhikari, B.; Olorunwa, O.J.; Wilson, J.C.; Barickman, T.C. Morphological and Physiological Response of Different Lettuce Genotypes to Salt Stress. Stresses 2021, 1, 285–304. [Google Scholar] [CrossRef]
  13. Cavalcante, D.A.; Leite Júnior, B.R.D.C.; Lima, A.A.; Tribst, M.C.; Cristianini, M. Sanitização de alface americana com água ozonizada para inativação de Escherichia coli O157:H7. Segurança Aliment. Nutr. 2014, 21, 373–378. [Google Scholar] [CrossRef]
  14. Taiz, L.; Zeiger, E. Fisiologia e Desenvolvimento Vegetal, 6th ed.; Artmed: Porto Alegre, Brazil, 2017; 888p. [Google Scholar]
  15. Sami, F.; Faizan, M.; Faraz, A.; Siddiqui, H.; Yusuf, M.; Hayat, S. Nitric oxide-mediated integrative alterations in plant metabolism to confer abiotic stress tolerance, NO crosstalk with phytohormones and NO-mediated post translational modifications in modulating diverse plant stress. Nitric Oxide 2018, 73, 22–38. [Google Scholar] [CrossRef]
  16. Sousa, L.F.; Menezes-Silva, P.E.; Lourenço, L.L.; Galmés, J.; Guimarães, A.C.; Silva, A.F.; Lima, A.P.R.; Henning, L.M.M.; Costa, A.C.; Silva, F.G.; et al. Improving water use efficiency by changing hydraulic and stomatal characteristics in soybean exposed to drought: The involvement of nitric oxide. Physiol. Plant 2019, 168, 576–589. [Google Scholar] [CrossRef]
  17. Corpas, F.J.; Leterrier, M.; Valderrama, R.; Airaki, M.; Chaki, M.; Palma, J.M.; Barroso, J.B. Nitric oxide imbalance provokes a nitrosative response in plants under abiotic stress. Plant Sci. 2011, 181, 604–611. [Google Scholar] [CrossRef]
  18. Neil, S.J.; Desikan, R.; Hancock, J.T. Nitric oxide signalling in plants. New Phytol. 2003, 159, 11–35. [Google Scholar] [CrossRef]
  19. Khurana, A.; Khurana, J.P.; Babbar, S.B. Nitric oxide induces flowering in the Duckweed Lemma aequinoctialis Welw. (Syn. L. paucicostata Hegelm.) under noninductive conditions. J. Plant Growth Regul. 2011, 30, 378–385. [Google Scholar] [CrossRef]
  20. Hajihashemi, S.; Skalicky, M.; Brestic, M.; Pavla, V. Effect of sodium nitroprusside on physiological and anatomical features of salt-stressed Raphanus sativus. Plant Physiol. Biochem. 2021, 169, 160–170. [Google Scholar] [CrossRef]
  21. Ahmad, P.; Ahanger, M.A.; Alyemeni, M.N.; Wijaya, L.; Alam, P. Exogenous application of nitric oxide modulates osmolyte metabolism, antioxidants, enzymes of ascorbate-glutathione cycle and promotes growth under cadmium stress in tomato. Protoplasma 2018, 255, 79–93. [Google Scholar]
  22. Kaya, C.; Ashraf, M.; Alyemeni, M.N.; Ahmad, P. Nitrate reductase rather than nitric oxide synthase activity is involved in 24-epibrassinolide-induced nitric oxide synthesis to improve tolerance to iron deficiency in strawberry (Fragaria × annassa) by up regulating the ascorbate-glutathione cycle. Plant Physiol. Biochem. 2020, 151, 486–499. [Google Scholar] [CrossRef]
  23. Farouk, S.; Al-Huqail, A.A. Sodium nitroprusside application regulates antioxidant capacity, improves phytopharmaceutical production and essential oil yield of marjoram herb under drought. Ind. Crops Prod. 2020, 158, 113034. [Google Scholar] [CrossRef]
  24. Farouk, S.; Al-Ghamdi, A.A.M. Sodium nitroprusside application enhances drought tolerance in marjoram herb by promoting chlorophyll biosynthesis and enhancing osmotic adjustment capacity. Arab. J. Geosci. 2021, 14, 430. [Google Scholar] [CrossRef]
  25. Gomes, M.A.C.; Pestana, I.A.; Santa-Catarina, C.; Hauser-Davis, R.A.; Suzuki, M.S. Salinity effects on photosynthetic pigments, proline, biomass and nitric oxide in Salvinia auriculata Aubl. Acta Limnol. Bras. 2017, 29, e9. [Google Scholar] [CrossRef]
  26. Astaneh, R.K.; Bolandnazar, S.; Nahandi, F.Z. Exogenous nitric oxide protect garlic plants against oxidative stress induced by salt stress. Plant Stress 2022, 5, 100101. [Google Scholar] [CrossRef]
  27. Mohamed, A.A.; Khan, E.A.; Misra, A.N. Mitigation effect of exogenous nitric oxide (NO) on some metabolic compounds of maize seedling grown under salt stress. J. Phys. Conf. Ser. 2019, 1294, 052008. [Google Scholar] [CrossRef]
  28. Alnusairi, G.S.H.; Mazrou, Y.S.A.; Qari, S.H.; Elkelish, A.A.; Soliman, M.H.; Eweis, M.; Abdelaal, K.; El-Samad, G.A.; Ibrahim, M.F.M.; ElNahhas, N. Exogenous Nitric Oxide Reinforces Photosynthetic Efficiency, Osmolyte, Mineral Uptake, Antioxidant, Expression of Stress-Responsive Genes and Ameliorates the Effects of Salinity Stress in Wheat. Plants 2021, 10, 1693. [Google Scholar] [CrossRef] [PubMed]
  29. Yasir, T.A.; Khan, A.; Skalicky, M.; Wasaya, A.; Rehmani, M.I.A.; Sarwar, N.; Mubeen, K.; Aziz, M.; Hassan, M.M.; Hassan, F.A.S.; et al. Exogenous Sodium Nitroprusside Mitigates Salt Stress in Lentil (Lens culinaris Medik.) by Affecting the Growth, Yield, and Biochemical Properties. Molecules 2021, 26, 2576. [Google Scholar] [CrossRef] [PubMed]
  30. Santisree, P.; Bhatnagar-Mathur, P.; Sharma, K.K. NO to drought-multifunctional role of nitric oxide in plant drought: Do we have all the answers? Plant Sci. 2015, 239, 44–55. [Google Scholar] [CrossRef]
  31. Zhang, P.; Liu, L.; Wang, X.; Wang, Z.; Zhang, H.; Chen, J.; Liu, X.; Wang, Y.; Li, C. Beneficial effects of exogenous melatonin on overcoming salt stress in sugar beets (Beta vulgaris L.). Plants 2021, 10, 886. [Google Scholar] [CrossRef]
  32. Ren, J.; Ye, J.; Yin, L.; Li, G.; Deng, X.; Wang, S. Exogenous melatonin improves salt tolerance by mitigating osmotic, ion, and oxidative stresses in maize seedlings. Agronomy 2020, 10, 663. [Google Scholar] [CrossRef]
  33. Khan, I.; Muhammad, A.; Chattha, M.U.; Skalicky, M.; Chattha, M.B.; Ayub, M.A.; Anwar, M.R.; Soufan, W.; Hassan, M.U.; Rahman, M.A.; et al. Mitigation of salinity-induced oxidative damage, growth, and yield reduction in fine rice by sugarcane press mud application. Front. Plant Sci. 2022, 13, 840900. [Google Scholar] [CrossRef] [PubMed]
  34. Silveira, N.M.; Frungillo, L.; Marcos, F.C.; Pelegrino, M.T.; Miranda, M.T.; Seabra, A.B.; Salgado, I.; Machado, E.C.; Ribeiro, R.V. Exogenous nitric oxide improves sugarcane growth and photosynthesis under water deficit. Planta 2016, 244, 181–190. [Google Scholar] [CrossRef] [PubMed]
  35. Jabeen, Z.; Fayyaz, H.A.; Irshad, F.; Hussain, N.; Hassan, M.N.; Li, J.; Rehman, S.; Haider, W.; Yasmin, H.; Mumtaz, S.; et al. Sodium nitroprusside application improves morphological and physiological attributes of soybean (Glycine max L.) under salinity stress. PLoS ONE 2021, 16, e0248207. [Google Scholar] [CrossRef] [PubMed]
  36. Melo, H.F.; Souza, E.R.; Duarte, H.H.F.; Cunha, J.C.; Santos, H.R.B. Gas exchange and photosynthetic pigments in bell pepper irrigated with saline water. Rev. Bras. Eng. Agricola Ambient. 2017, 21, 38–43. [Google Scholar] [CrossRef]
  37. Alzahib, R.H.; Migdadi, H.M.; Al Ghamdi, A.A.; Alwahibi, M.S.; Ibrahim, A.A.; Al-Selwey, W.A. Assessment of morpho-physiological, biochemical and antioxidant responses of tomato landraces to salinity stress. Plants 2021, 10, 696. [Google Scholar] [CrossRef]
  38. Jamil, M.; Rehman, S.U.; Lee, K.J.; Kim, J.M.; Kim, H.; Rha, E.S. Salinity reduced growth PS2 photochemistry and chlorophyll content in radish. Sci. Agric. 2007, 64, 111–118. [Google Scholar] [CrossRef]
  39. Sarmento, J.D.A.; Morais, P.L.D.; Almeida, M.L.B.; Sousa Neto, O.N.; da Silva Dias, N. Qualidade e conservação da alface cultivada com rejeito da dessalinização. Rev. Caatinga 2014, 27, 90–97. [Google Scholar] [CrossRef]
  40. Ashraf, M.; Harris, P.J.C. Photosynthesis under stressful environments: An overview. Photosynthetica 2013, 51, 163–190. [Google Scholar] [CrossRef]
  41. Gururani, M.A.; Venkatesh, J.; Tran, L.S.P. Regulation of photosynthesis during abiotic stress-induced photoinhibition. Mol. Plant 2015, 8, 1304–1320. [Google Scholar] [CrossRef]
  42. Ahmad, P.; Abdel Latef, A.A.; Hashem, A.; Abd Allah, E.F.; Gucel, S.; Tran, L.-S.P. Nitric oxide mitigates salt stress by regulating levels of osmolytes and antioxidant enzymes in chickpea. Front. Plant Sci. 2016, 7, 347. [Google Scholar] [CrossRef]
  43. Rahman, A.; Hossain, M.D.S.; Mahmud, J.-A.L.; Nahar, K.; Hasanuzzaman, M.; Fujita, M. Manganese-induced salt stress tolerance in rice seedlings: Regulation of ion homeostasis, antioxidant defense and glyoxalase systems. Physiol. Mol. Biol. Plants 2016, 22, 291–306. [Google Scholar] [CrossRef] [PubMed]
  44. Silva, D.M.R.; Santos, J.C.C.; Rosa, V.R.; Santos, A.L.F.; Silva, M.A. Tolerance to water deficiency in safflower (Carthamus tinctorius L.) modulated by potassium fertilization. Acta Physiol. Plant 2022, 44, 99. [Google Scholar] [CrossRef]
  45. Roy, S.J.; Negrão, S.; Tester, M. Salt resistant crop plants. Curr. Opin. Biotechnol. 2014, 26, 115–124. [Google Scholar] [CrossRef]
  46. Souto Filho, L.T.; Laime, E.M.O.; Fernandes, P.D.; Suassuna, J.F.; Silva, R.C. Efeito da salinidade nas trocas gasosas de duas cultivares de cana-de-açúcar. Eng. Ambient. 2014, 11, 67–82. [Google Scholar]
  47. Fahad, S.; Hussain, S.; Bano, A.; Saud, S.; Hassan, S.; Shan, D.; Tabassum, M.A. Potential role of phytohormones and plant growth-promoting rhizobacteria in abiotic stresses: Consequences for changing environment. Environ. Sci. Pollut. Res. 2015, 22, 4907–4921. [Google Scholar] [CrossRef] [PubMed]
  48. Wang, P.; Du, Y.; Hou, Y.J.; Zhao, Y.; Hsu, C.C.; Yuan, F.; Zhu, J.K. Nitric oxide negatively regulates abscisic acid signaling in guard cells by S-nitrosylation of OST1. Proc. Natl. Acad. Sci. USA 2015, 112, 613–618. [Google Scholar] [CrossRef]
  49. Lakzayi, M.; Sabbagh, E.; Rigi, K.; Keshtehgar, A. Effect of salicylic acid on activities of antioxidant en-zymes, flowering and fruit yield and the role on reduce of drought stress. Int. J. Farming Allied Sci. 2014, 3, 980–987. [Google Scholar]
  50. Oliveira, F.A.; Oliveira, M.K.T.; Lima, L.A.; Alves, R.C.; Régis, L.R.L.; Santos, S.T. Estresse salino e biorregulador vegetal em feijão caupi. Irriga 2017, 22, 314–329. [Google Scholar] [CrossRef]
  51. Oliveira, F.A.; Medeiros, J.F.; Oliveira, M.K.T.; Souza, A.A.T.; Fereira, J.A.; Souza, M.S. Interação entre salinidade e bioestimulante na cultura do feijão caupi. Rev. Bras. Eng. Agricola Ambient. 2013, 17, 465–471. [Google Scholar] [CrossRef]
  52. Paulus, D.; Paulus, E.; Nava, G.A.; Moura, C.A. Crescimento, consumo hídrico e composição mineral de alface cultivada em hidroponia com águas salinas. Rev. Ceres 2012, 59, 110–117. [Google Scholar] [CrossRef]
  53. Moraes, D.P.; Fernandes, A.L.M.; Dias, N.S.; Cosme, C.R.; Souza Neto, O.N. Rejeito salino e solução nutritiva em alface cultivada em sistema hidropônico. Magistra 2014, 26, 353–360. [Google Scholar]
  54. Sanz, L.; Albertos, P.; Mateos, I.; Sánchez-Vicente, I.; Lechón, T.; Fernández-Marcos, M.; Lorenzo, O. Nitric oxide (NO) and phytohormones crosstalk during early plant development. J. Exp. Bot. 2015, 66, 2857–2868. [Google Scholar] [CrossRef] [PubMed]
  55. Silveira, N.M.; Marcos, F.C.C.; Frungillo, L.; Moura, B.B.; Seabra, A.B.; Salgado, I.; Machado, E.C.; Hancock, J.T.; Ribeiro, R.V. S-nitrosoglutathione spraying improves stomatal conductance, Rubisco activity and antioxidant defense in both leaves and roots of sugarcane plants under water deficit. Physiol. Plant 2017, 160, 383–395. [Google Scholar] [CrossRef]
  56. Badem, A.; Söylemez, S. Effects of nitric oxide and silicon application on growth and productivity of pepper under salinity stress. J. King Saud. Univ. Sci. 2022, 34, 102189. [Google Scholar] [CrossRef]
  57. Cunha, A.R.; Martins, D. Classificação climática para os municípios de Botucatu e São Manuel, SP. Irriga 2009, 14, 1–11. [Google Scholar] [CrossRef]
  58. Furlani, P.R.; Silveira, L.C.P.; Bolonhezi, D.; Faquim, V. Cultivo Hidropônico de Plantas; Instituto Agronômico: Campinas, Brazil, 1999; 52p. [Google Scholar]
  59. Von Caemmerer, S.; Farquhar, G.D. Some relationships between the biochemistry of photosynthesis and the gas exchange of leaves. Planta 1981, 153, 376–387. [Google Scholar] [CrossRef]
  60. Wellburn, A.R. The spectral determination of chlorophylls a and b; as well as total carotenoids; using various solvents with spectrophotometers of different resolution. J. Plant Physiol. 1994, 144, 307–313. [Google Scholar] [CrossRef]
  61. Barrs, H.D.; Weatherley, P.E. A re-examination of the relative turgidity technique for estimating water deficits in leaves. Aust. J. Biol. Sci. 1962, 15, 413–428. [Google Scholar] [CrossRef]
  62. Ferreira, D.F. Sisvar: A computer statistical analysis system. Cienc. Agrotecnologia 2011, 35, 1039–1042. [Google Scholar] [CrossRef]
Figure 1. Photosynthetic pigments of lettuce plants subjected to the application of different concentrations of sodium nitroprusside (SNP) and saline levels. Content of chlorophyll a (A), content of chlorophyll b (B), total chlorophyll (C), and content of carotenoid (D). ns = not significant. Red lines indicate lettuce responses at a salinity level of 3.5 dS m−1, while gray lines indicate lettuce responses at a salinity level of 0.2 dS m−1. The results followed the statistical unfolding of SNP concentrations within each salinity level, and the significance of this statistical unfolding was adjusted to the regression model using an F-test. The error bars show the standard deviation. n = 4 (number of replicates).
Stresses 03 00048 g001
Figure 2. Physiological characteristics of lettuce plants subjected to the application of different concentrations of sodium nitroprusside (SNP) and saline levels. CO2 assimilation—A ((A)—corresponds to the significance of the isolated effect of SNP concentrations and salinity levels); stomatal conductance—gs (B); internal CO₂ concentration—Ci (C); transpiration—E (D); water use efficiency—WUE (E); carboxylation efficiency—CE (F). Red lines and red bar indicate lettuce responses at a salinity level of 3.5 dS m−1, while gray lines and gray bar indicate lettuce responses at a salinity level of 0.2 dS m−1. The results followed the statistical unfolding of SNP concentrations within each salinity level, and the significance of this statistical unfolding was adjusted to the regression model using an F-test. The error bars show the standard deviation. n = 4 (number of replicates).
Stresses 03 00048 g002
Figure 3. Morphophysiological characteristics of lettuce plants subjected to the saline levels. Relative water content in leaf (A), leaf area (B), stem diameter (C), and total dryer matter mass (D). Means followed by the same letter do not differ from each other via the Tukey test at 5% probability. Red bar indicate lettuce responses at a salinity level of 3.5 dS m−1 and gray bar indicate lettuce responses at a salinity level of 0.2 dS m−1. The error bars show the standard deviation. n = 4 (number of replicates).
Stresses 03 00048 g003
Figure 4. Productive parameters of lettuce plants subjected to the application of different concentrations of sodium nitroprusside (SNP) and saline levels. Number of leaves (A) and total fresh mass (B). Red lines indicate lettuce responses at a salinity level of 3.5 dS m−1, while gray lines indicate lettuce responses at a salinity level of 0.2 dS m−1. The results followed the statistical unfolding of SNP concentrations within each salinity level, and the significance of this statistical unfolding was adjusted to the regression model using an F-test. The error bars show the standard deviation. n = 4 (number of replicates).
Stresses 03 00048 g004
Figure 5. Pearson’s correlation between the variables: chlorophyll a (Chlor a), chlorophyll b (Chlor b), total chlorophyll (Chlor a + b), carotenoids (Carotenoid), CO2 assimilation (A), stomatal conductance (gs), internal carbon concentration (Ci), transpiration (E), water use efficiency (WUE), carboxylation efficiency (CE), relative water content in leaf (RWC), leaf area (LA), stem diameter (SD), total dry matter mass (TDM), number of leaves (NL), and total fresh matter mass (TFM). *, ** = significant at 0.05 and 0.01 probability levels, respectively.
Stresses 03 00048 g005
Figure 6. Maximum, minimum, and average temperature and average air relative humidity in the greenhouse during the experiment. The arrows indicate the moment of onset of saline stress, as well as all analyses carried out during the study. Sodium nitroprusside (SNP).
Stresses 03 00048 g006
Table 1. Summary of the analysis of variance of photosynthetic pigments of content of chlorophyll a (Cla), content of chlorophyll b (Clb), total chlorophyll (Cla + Clb), and content of carotenoid (carotenoids) of lettuce plants, treated with sodium nitroprusside (SNP—0, 50, 100, 150, and 200 μM) and saline levels (0.2 and 3.5 dS m−1). 1 SNP conc. (SC) = SNP concentrations; CV = coefficient of variation; ns, ** = not significant and 0.01 probability levels, respectively. Means followed by the same letter in the column do not differ via Tukey test at 0.05 probability level. n = 4 (number of replicates).
Photosynthetic Pigments
Source of VariationDF Mean Squares
ClaClbCla + ClbCarotenoids
Saline levels (SL)10.00003 ns0.00032 ns0.00015 ns0.00390 **
SNP conc. (SC) 140.07817 ns0.15612 ns0.43721 ns0.00096 ns
SL × SC40.04235 ns0.07828 ns0.23439 ns0.00316 **
CV (%) 27.1825.8926.1811.98
Saline levels Test of means
0.2 dS m−1 0.79 a1.35 a2.15 a0.17 b
3.5 dS m−1 0.79 a1.36 a2.15 a0.19 a
Table 2. Summary of the analysis of variance of CO2 assimilation (A), stomatal conductance (gs), internal carbon concentration (Ci), transpiration (E), water use efficiency (WUE), and carboxylation efficiency (CE) of lettuce plants, treated with sodium nitroprusside (SNP—0, 50, 100, 150, and 200 μM) and saline levels (0.2 and 3.5 dS m−1). 1 SNP conc. (SC) = SNP concentrations; CV = coefficient of variation; ns, *, ** = not significant, and significant at 0.05 and 0.01 probability levels, respectively. Means followed by the same letter in the column do not differ via Tukey test at 0.05 probability level. n = 4 (number of replicates).
Gas Exchange
Source of VariationDF Mean Squares
AgsCiEWUECE
Saline levels (SL)146.29 **0.0462 **6521.46 **14.81 **0.76 **0.00014 **
SNP conc. (SC) 1436.98 **0.0130 **3299.54 **6.90 **0.95 **0.00053 **
SL × SC41.17 ns0.0043 **5328.74 **0.56 *0.55 *0.00026 **
CV (%) 6.719.223.939.975.727.70
Saline levels Test of means
0.2 dS m−1 13.14 a0.19 a257.36 a4.82 a2.85 b0.051 a
3.5 dS m−1 10.99 b0.12 b231.82 b3.61 b3.13 a0.048 b
Table 3. Summary of the analysis of variance of relative water content (RWC), leaf area (LA) stem diameter (SD), and total dry matter mass (TDM) of lettuce plants, treated with sodium nitroprusside (SNP—0, 50, 100, 150, and 200 μM) and saline levels (0.2 and 3.5 dS m−1). 1 SNP conc. (SC) = SNP concentrations; CV = coefficient of variation; ns, ** = not significant and 0.01 probability levels, respectively. Means followed by the same letter in the column do not differ via Tukey test at 0.05 probability level. n = 4 (number of replicates).
Morphophysiological Characteristics
Source of VariationDFMean Squares
RWCLASDTDM
Saline levels (SL)1244.89 **11,425,114.60 **146.6 **69.16 **
SNP conc. (SC) 1410.88 ns395,811.06 ns2.91 ns4.86 ns
SL × SC410.29 ns57,283.00 ns10.08 ns6.00 ns
CV (%) 4.8615.689.5814.08
Saline levels Test of means
0.2 dS m−1 78.76 a3612.78 a22.24 a21.90 a
3.5 dS m−1 73.81 b2543.90 b18.41 b19.27 b
Table 4. Summary of the analysis of variance of number of leaves (NL) and total fresh mass (TFM) of lettuce plants, treated with sodium nitroprusside (SNP—0, 50, 100, 150, and 200 μM) and saline levels (0.2 and 3.5 dS m−1). 1 SNP conc. (SC) = SNP concentrations; CV = coefficient of variation; *, ** = significant at 0.05 and 0.01 probability levels, respectively. Means followed by the same letter in the column do not differ via Tukey test at 0.05 probability level. n = 4 (number of replicates).
Productive Parameters
Source of VariationDFMean Squares
NLTFM
Saline levels (SL)155.22 **359,883.80 **
SNP conc. (SC) 1415.41 *10,418.80 **
SL × SC48.66 *4224.70 **
CV (%) 7.767.29
Saline levels Test of means
0.2 dS m−1 23.8 a417.74 a
3.5 dS m−1 21.5 b357.76 b
Table 5. Chemical characteristics of the supply water.
pHECNPKCaMgSNa
dS m−1 mg L−1
6.180.2022.001.0010.0014.004.004.000.80
EC: electric conductivity. Nitrogen (N), phosphorus (P), potassium (K), calcium (Ca), magnesium (Mg), sulfur (S), and sodium (Na).
Disclaimer/Publisher’s Note: The statements, opinions and data contained in all publications are solely those of the individual author(s) and contributor(s) and not of MDPI and/or the editor(s). MDPI and/or the editor(s) disclaim responsibility for any injury to people or property resulting from any ideas, methods, instructions or products referred to in the content.

