Article

Comparative Study of Trehalose and Trehalose 6-Phosphate to Improve Antioxidant Defense Mechanisms in Wheat and Mustard Seedlings under Salt and Water Deficit Stresses

1
Department of Plant Pathology, Faculty of Agriculture, Sher-e-Bangla Agricultural University, Sher-e-Bangla Nagar, Dhaka 1207, Bangladesh
2
Laboratory of Plant Stress Responses, Department of Applied Biological Sciences, Faculty of Agriculture, Kagawa University, Miki-Cho 761-0795, Japan
3
Planning and Development Department, Osaka R & D Lab., Daihachi Chemical Industry Co., Ltd., 5-7 Chodo 3-Chome, Higashiosaka 577-0056, Japan
4
New Business Development Department, Hayashibara Co., Ltd., Nihon-Seimei Okayama Bldg. II Shinkan, 1-1-3 Shimoishii, Okayama 700-0907, Japan
*
Author to whom correspondence should be addressed.
Stresses 2022, 2(3), 336-354; https://doi.org/10.3390/stresses2030024
Submission received: 25 July 2022 / Revised: 29 August 2022 / Accepted: 30 August 2022 / Published: 5 September 2022
(This article belongs to the Special Issue Physiological and Molecular Mechanisms of Plant Stress Tolerance)

Abstract

:
Trehalose 6-phosphate (T6P) regulates sugar levels and starch metabolism in a plant cell and thus interacts with various signaling pathways, and after converting T6P into trehalose (Tre), it acts as a vital osmoprotectant under stress conditions. This study was conducted using wheat (Triticum aestivum L. cv. Norin 61) and mustard (Brassica juncea L. cv. BARI sharisha 13) seedlings to investigate the role of Tre and T6P in improving salt and water deficit stress tolerance. The seedlings were grown hydroponically using Hyponex solution and exposed to salt (300 and 200 mM NaCl for wheat and mustard, respectively) and water deficit (20 and 12% PEG 6000 for wheat and mustard, respectively) stresses with or without Tre and T6P. The study demonstrated that salt and water deficit stress negatively influenced plant growth by destroying photosynthetic pigments and increasing oxidative damage. In response to salt and water deficit stresses, the generation of H2O2 increased by 114 and 67%, respectively, in wheat seedlings, while in mustard, it increased by 86 and 50%, respectively. Antioxidant defense systems were also altered by salt and water deficit stresses due to higher oxidative damage. The AsA content was reduced by 65 and 38% in wheat and 61 and 45% in mustard under salt and water deficit stresses, respectively. The subsequent negative results of salinity and water deficit can be overcome by exogenous application of Tre and T6P; these agents reduced the oxidative stress by decreasing H2O2 and TBARS levels and increasing enzymatic and non-enzymatic antioxidants. Moreover, the application of Tre and T6P decreased the accumulation of Na in the shoots and roots of wheat and mustard seedlings. Therefore, the results suggest that the use of Tre and T6P is apromising strategy to alleviate osmotic and ionic toxicity in plants under salt and water deficit stresses.

1. Introduction

The production and sustainability of global agricultural food are facing serious threats due to undesirable environmental stresses, including salinity and water deficit stresses. The growth and productivity of plants are strongly affected by higher salt concentration, which creates both osmotic and ionic imbalances in plant cells, thus leading to increased reactive oxygen species (ROS) generation [1]. Higher Na concentration inhibits the uptake of K by plant cells, resulting in the disturbance of the intracellular ionic balance [2]. Due to low K concentration, some cellular mechanisms, such as protein synthesis, enzyme activities, and the biosynthesis of photosynthetic pigments, are hampered [3,4]. Furthermore, salinity influences cellular ROS generation, which causes oxidative damage and cell membrane injury [5,6]. Water deficit is another common environmental stress linked to other stresses such as salinity, heat, heavy metals, etc., and severely affects plant growth, metabolism, and productivity [7]. The adverse effects of water deficit include nutrient imbalance, alterations in metabolic activities, and impaired growth. Under water deficit stress, the accumulation of mineral nutrients is inhibited due tohampered root growth [8]. The initiation of osmotic stress due to water shortage causesthe disturbance of membrane permeability, osmolyte accumulation, and photosynthetic machinery function [9]. The accumulation of ROS under water deficit stress accelerates the disruption of the ultrastructure and cellular membranes, proteins, and nucleic acids [10]. Therefore, studying the mechanisms of salt and water deficit stress is important for improved plant tolerance and ensuring sustainable food security.
Under stress conditions, plants induce defensive mechanisms by activating various signaling cascades [11]. In response to salt, the most common strategies of plants are membrane component modification, ion transfer into vacuoles, and synthesis of organic components in the cytoplasm [12]. Under salt stress, plants also develop strategies such as regulating ion uptake by roots, inhibiting ion transportation into different plant parts, altering plant hormones and photosynthetic mechanisms, and regulating enzymatic and non-enzymatic antioxidant mechanisms [13]. To avoid water deficit-induced damage, plants initially activate defense mechanisms to regulate the osmotic imbalance. Plants synthesize various cellular solutes, such as proline, trehalose (Tre), glycine betaine, etc., which act as osmolytes [14]. These osmolytes are free-radical scavengers and help to maintain the redox potential in cells by regulating antioxidant levels [15]. In response to stress, enzymatic and non-enzymatic antioxidants work together to mitigate ROS-induced damage [16].
Trehalose (α,α-1,1-linked D-glucopyranosyl D-glucopyranoside) is a non-reducing disaccharide that is commonly found in fungi, bacteria, invertebrates, and plants [7]. In lower organisms, Tre acts as a source of carbon and energy, but in higher animals or plants, it functions as an osmoprotectant under unfavorable environmental conditions, thus protecting the structure of the cellular membrane from stress-induced damage [17]. As an osmoprotectant, Tre is able to play a protective role in improving plant tolerance to various abiotic stresses, especially water deficit and salinity [18]. In plants, Tre is synthesized in a two-step process: first, the precursor of Tre, trehalose-6-phosphate (T6P), is produced with the help of the enzyme trehalose-6-phosphate synthase (TPS); then, T6P is dephosphorylated to Tre by the enzyme trehalose-6-phosphate phosphatase (TPP) [19]. Recently, T6P, a key signaling metabolite that regulates the assimilation of carbon and sugar levels in plants, showed significant function in plant growth and development [20]. Although some studies have already reported that exogenous application of Tre mitigated salt and water deficit-induced damage in the plant, to the best of our knowledge, there are no reports on the comparative study of Tre and T6P to mitigate oxidative damage in plants under salt and water deficit stresses. Therefore, the aim of our current study was to investigate the role of Tre and T6P (precursor of Tre) in alleviating salt and water deficit-induced oxidative damage and antioxidant defense mechanisms in wheat and mustard seedlings.

2. Results

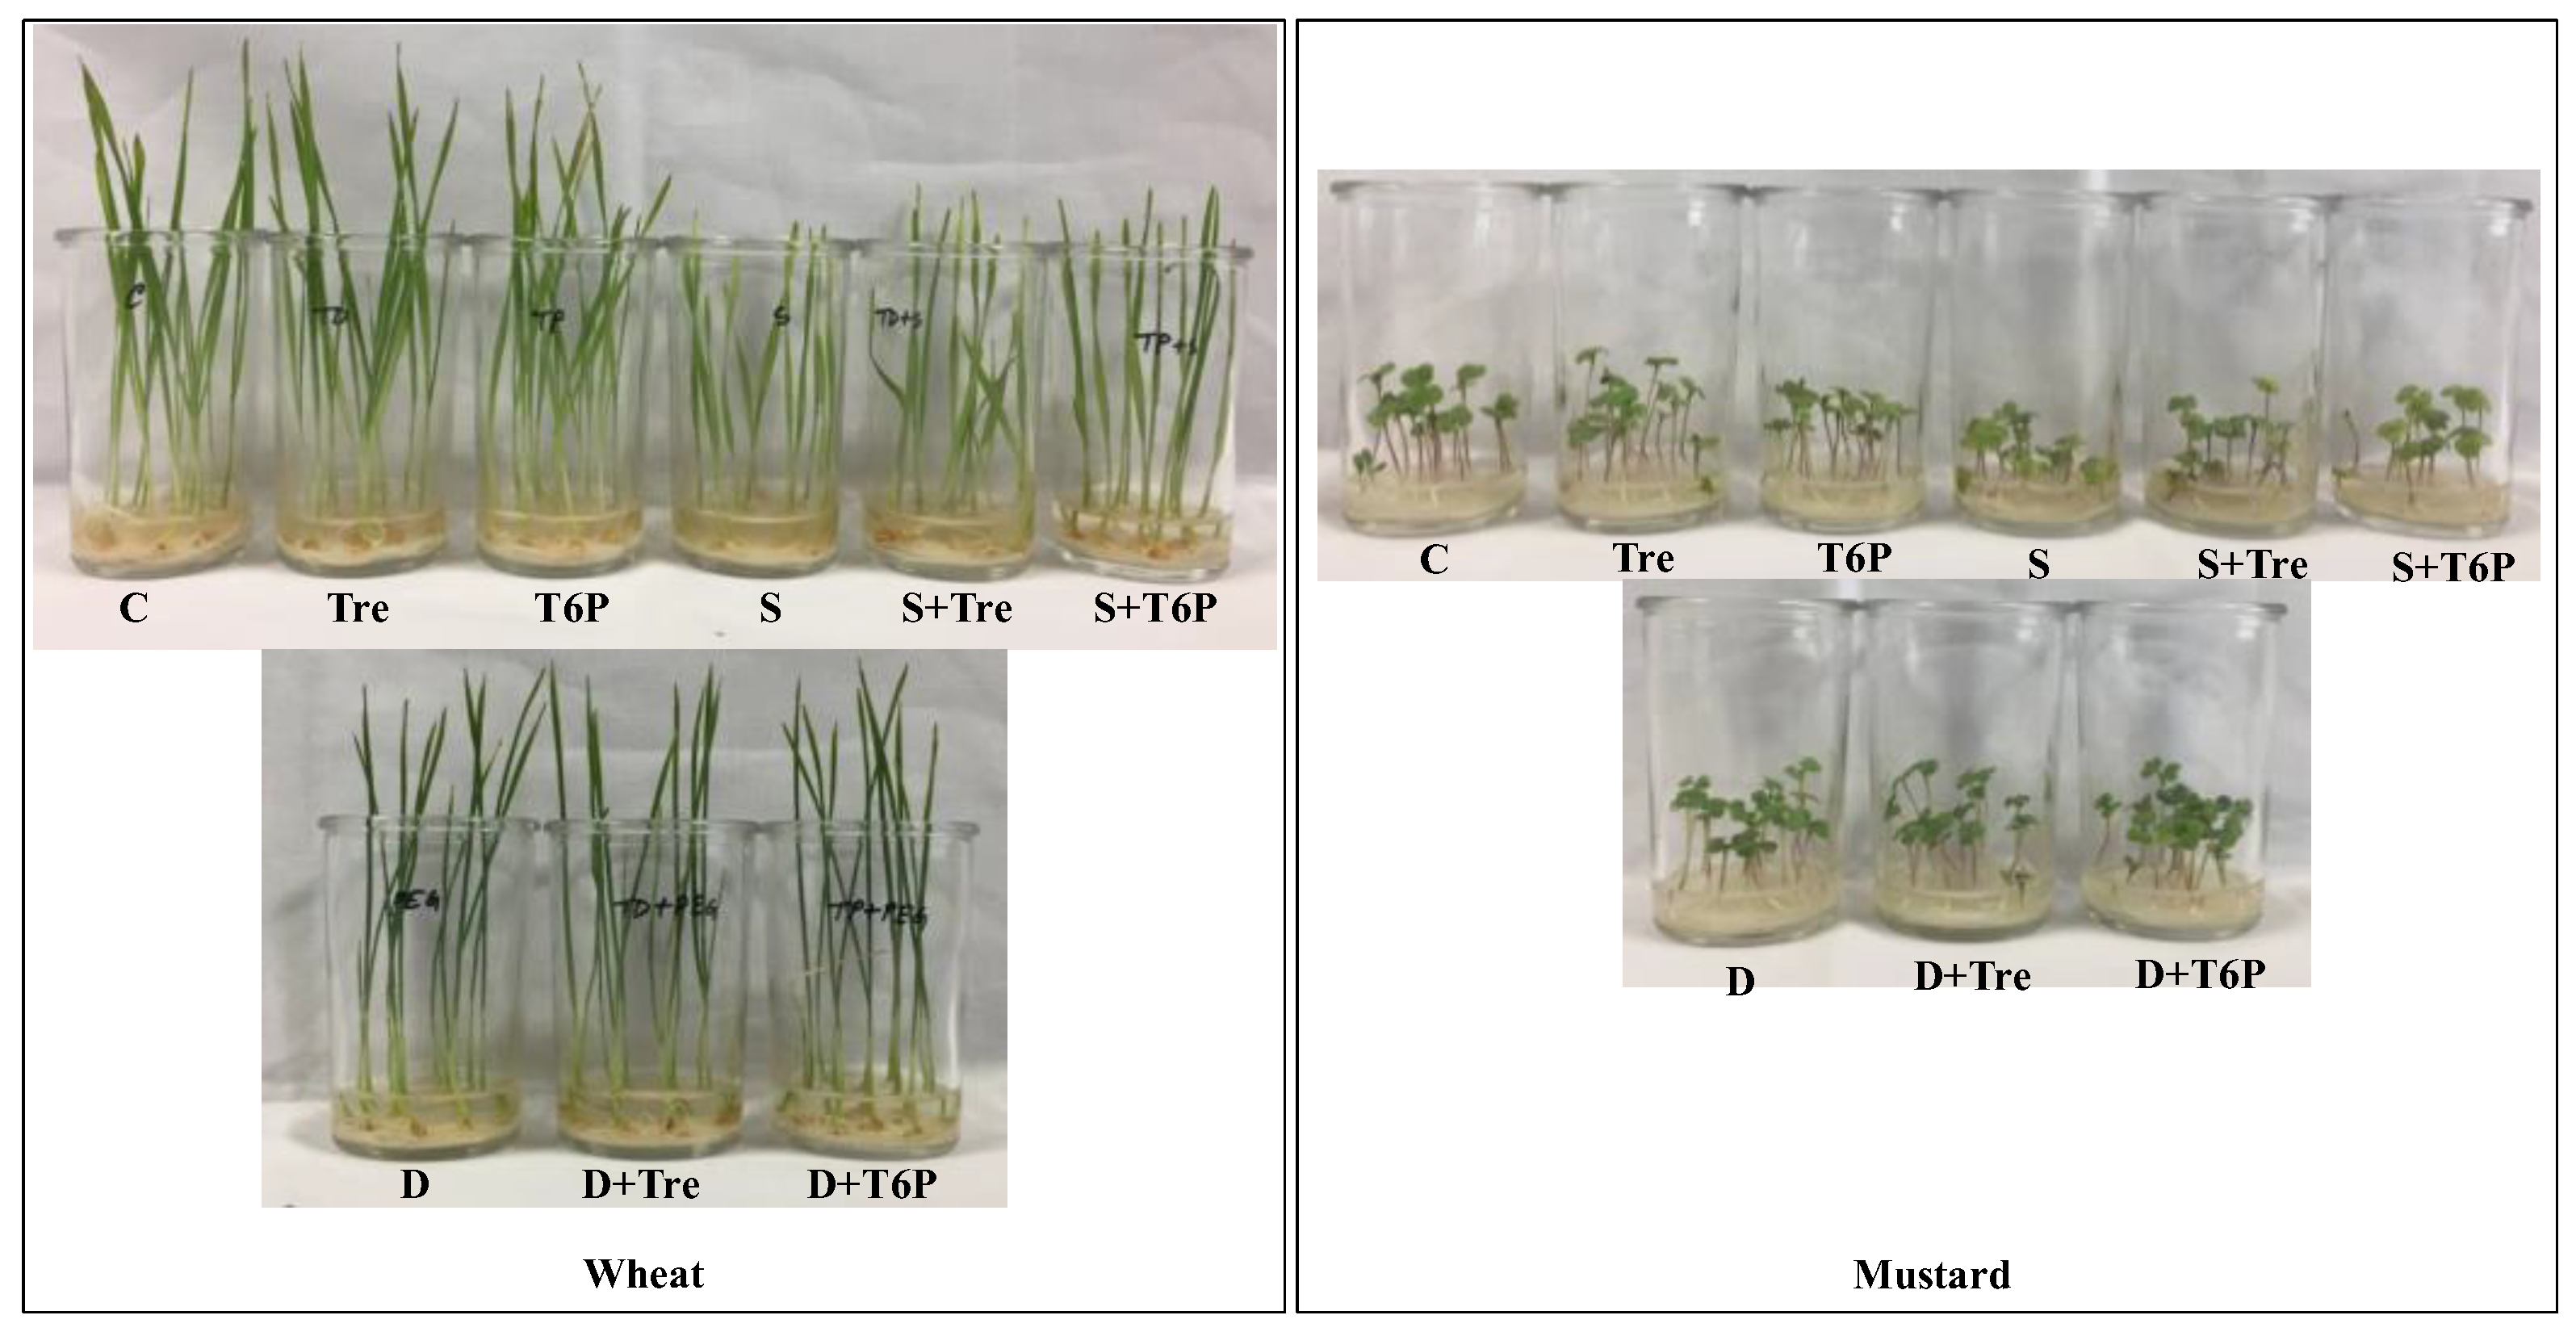
2.1. Growth of Wheat and Mustard Seedlings Was Improved by Trehalose and T6P Application under Salt and Water Deficit Stress

Wheat and mustard seedlings showed growth reduction in response to salinity and water deficit stresses, but the effect of salinity and water deficit on the growth of Tre- and T6P-pretreated seedlings was weaker (Figure 1).

2.2. Trehalose and T6P Improved Photosynthetic Pigments under Salt and Water Deficit Stress

Salt and water deficit stress reduced the contents of chlorophyll (chl) a (by 66 and 31%, respectively), chl b (by 74 and 53%, respectively), chl (a + b) (by 69 and 39%, respectively), and carotenoid (car, by 78 and 44%, respectively) in wheat seedlings compared to unstressed control seedlings. However, seedlings pretreated with Tre and T6P showed increased chl and car contents compared to salt-treated seedlings only, where chl (a + b) improved by 28 and 48%, and car improved by 33 and 52%, respectively. Moreover, Tre- and T6P-pretreated seedlings had improved chl a (by 9 and 23%, respectively), chl b (by 30 and 42%, respectively), chl (a + b) (by 15 and 28%, respectively), and car (by 33 and 49%, respectively) contents compared to water deficit-stressed seedlings only (Table 1).
In mustard seedlings, salt and water deficit stresses decreased the chl a (by 50 and 37%, respectively), chl b (by 46 and 41%, respectively), chl (a + b) (by 48 and 39%, respectively), and car (by 44 and 29%, respectively) contents compared to control seedlings. Seedlings pretreated with Tre and T6P showed improved chl a (by 7 and 49%, respectively), chl b (by 15 and 31%, respectively), chl (a + b) (by 14 and 42%, respectively), and car (by 10 and 19%, respectively) contents compared to salt-stressed seedlings. Under the water deficit condition, Tre and T6P pretreatments also improved photosynthetic pigment content, while chl (a + b) increased by 23 and 47%, and car increased by 14 and 31%, respectively, compared to water deficit-stressed seedlings only (Table 2).

2.3. Trehalose Contents Increased Due to the Application of Trehalose and T6P under Salt and Water Deficit Stress

Trehalose content increased under salt and water deficit stresses by 38 and 18% in wheat seedlings compared to the control. Pretreatment with Tre and T6P further increased it by 12 and 5%, respectively, compared to salt-treated seedlings and by 17 and 6%, respectively, compared to water deficit-stressed seedlings only (Table 1). On the other hand, Tre content decreased by 19% under salt stress and increased by 23% under water deficit stress in mustard seedlings compared to control seedlings. However, exogenous application of Tre and T6P increased the Tre contents under both salt and water deficit stresses compared to stressed seedlings (Table 2).

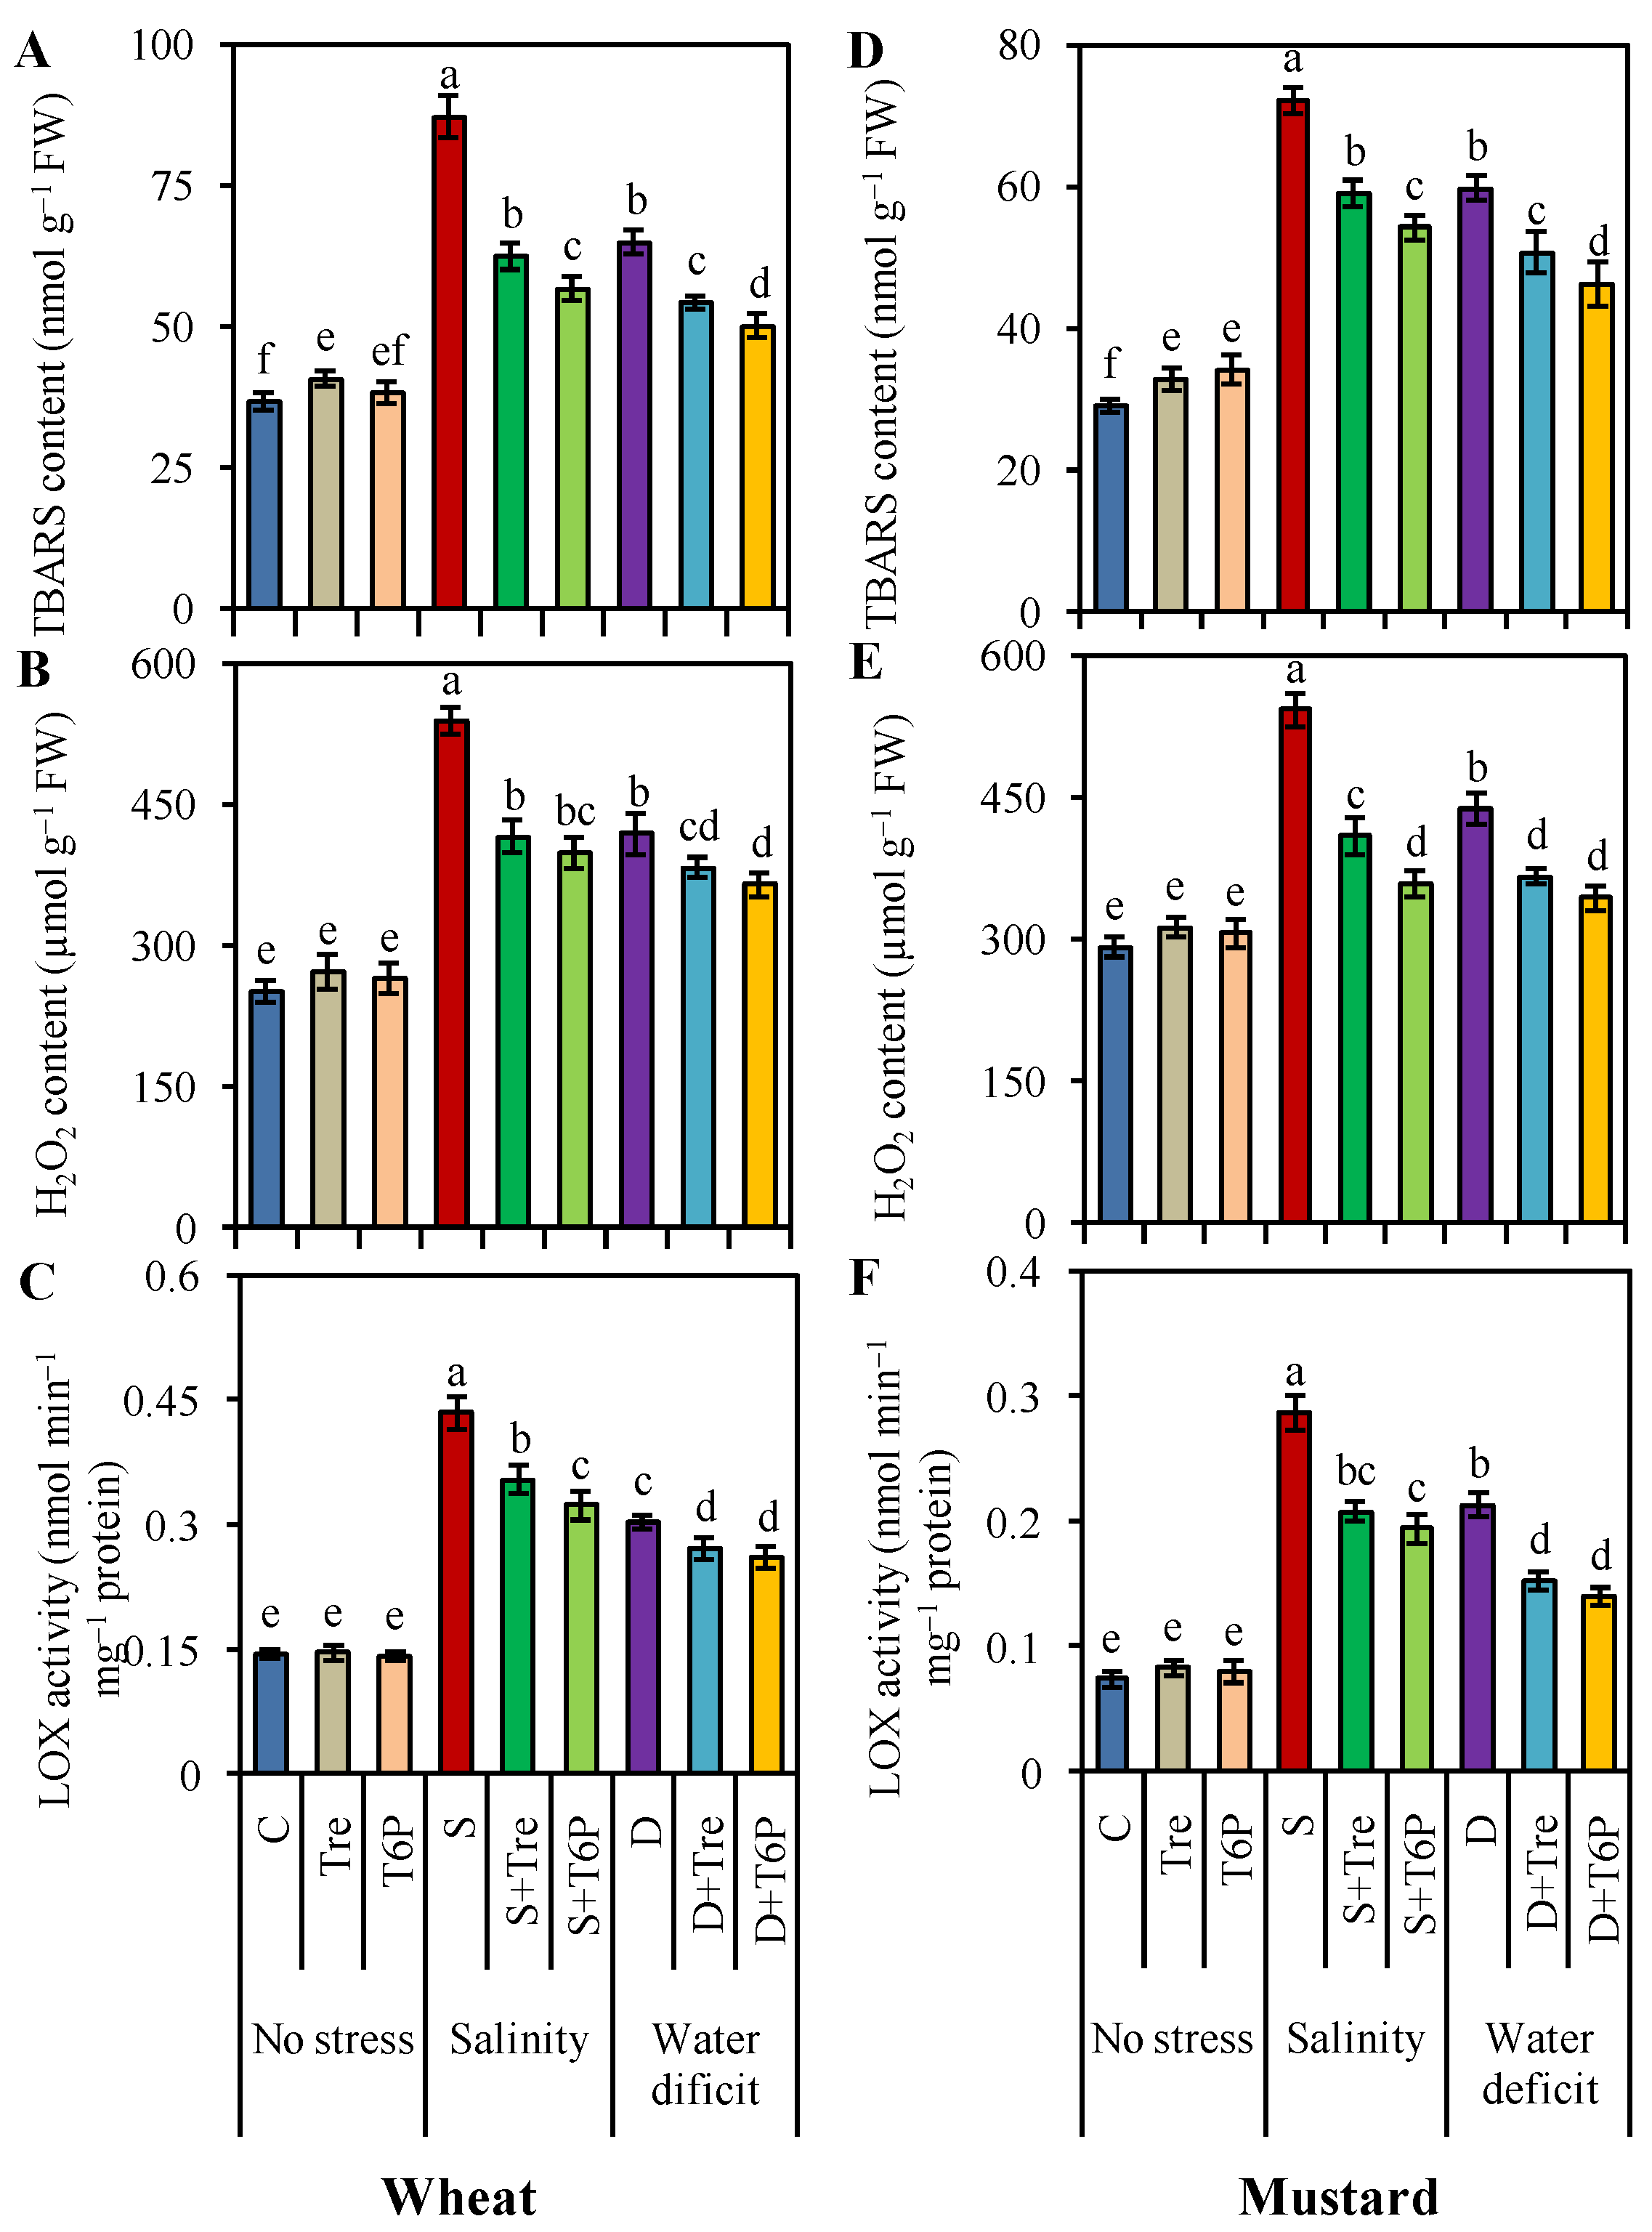
2.4. Trehalose and T6P Reduced Oxidative Stress Indicators

Increased levels of thiobarbituric acid-reactive substances (TBARS, by 138 and 77%) and hydrogen peroxide (H2O2, by 114 and 67%) and higher lipoxygenase (LOX) activity (by 200 and 109%) were observed in wheat seedlings exposed to salt and water deficit treatments, respectively, compared with the unstressed control plants. Pretreatment with Tre and T6P reduced the TBARS (by 28 and 35%), H2O2 (by 23 and 26%) levels, and LOX activity (by 19 and 26%) in response to salinity compared to the salt-stressed control seedlings. The levels of TBARS, H2O2, and LOX activity were also reduced by Tre and T6P under water deficit stress compared to stress only (Figure 2A–C).
Higher TBARS (by 149 and 106%), H2O2 (by 86 and 50%), and LOX activity (by 288 and 188%) were also found in mustard seedlings under salt and water deficit stresses, respectively, compared to control plants. However, pretreatment of seedlings with Tre and T6P reduced the TBARS (by 18 and 25%), H2O2 (by 25 and 34%) contents, and LOX activity (by 28 and 32%) in response to salinity compared to salt-stressed seedlings. Under water deficit stress, the contents of TBARS, H2O2, and LOX activity were also reduced by Tre and T6P compared to stress only (Figure 2D–F).

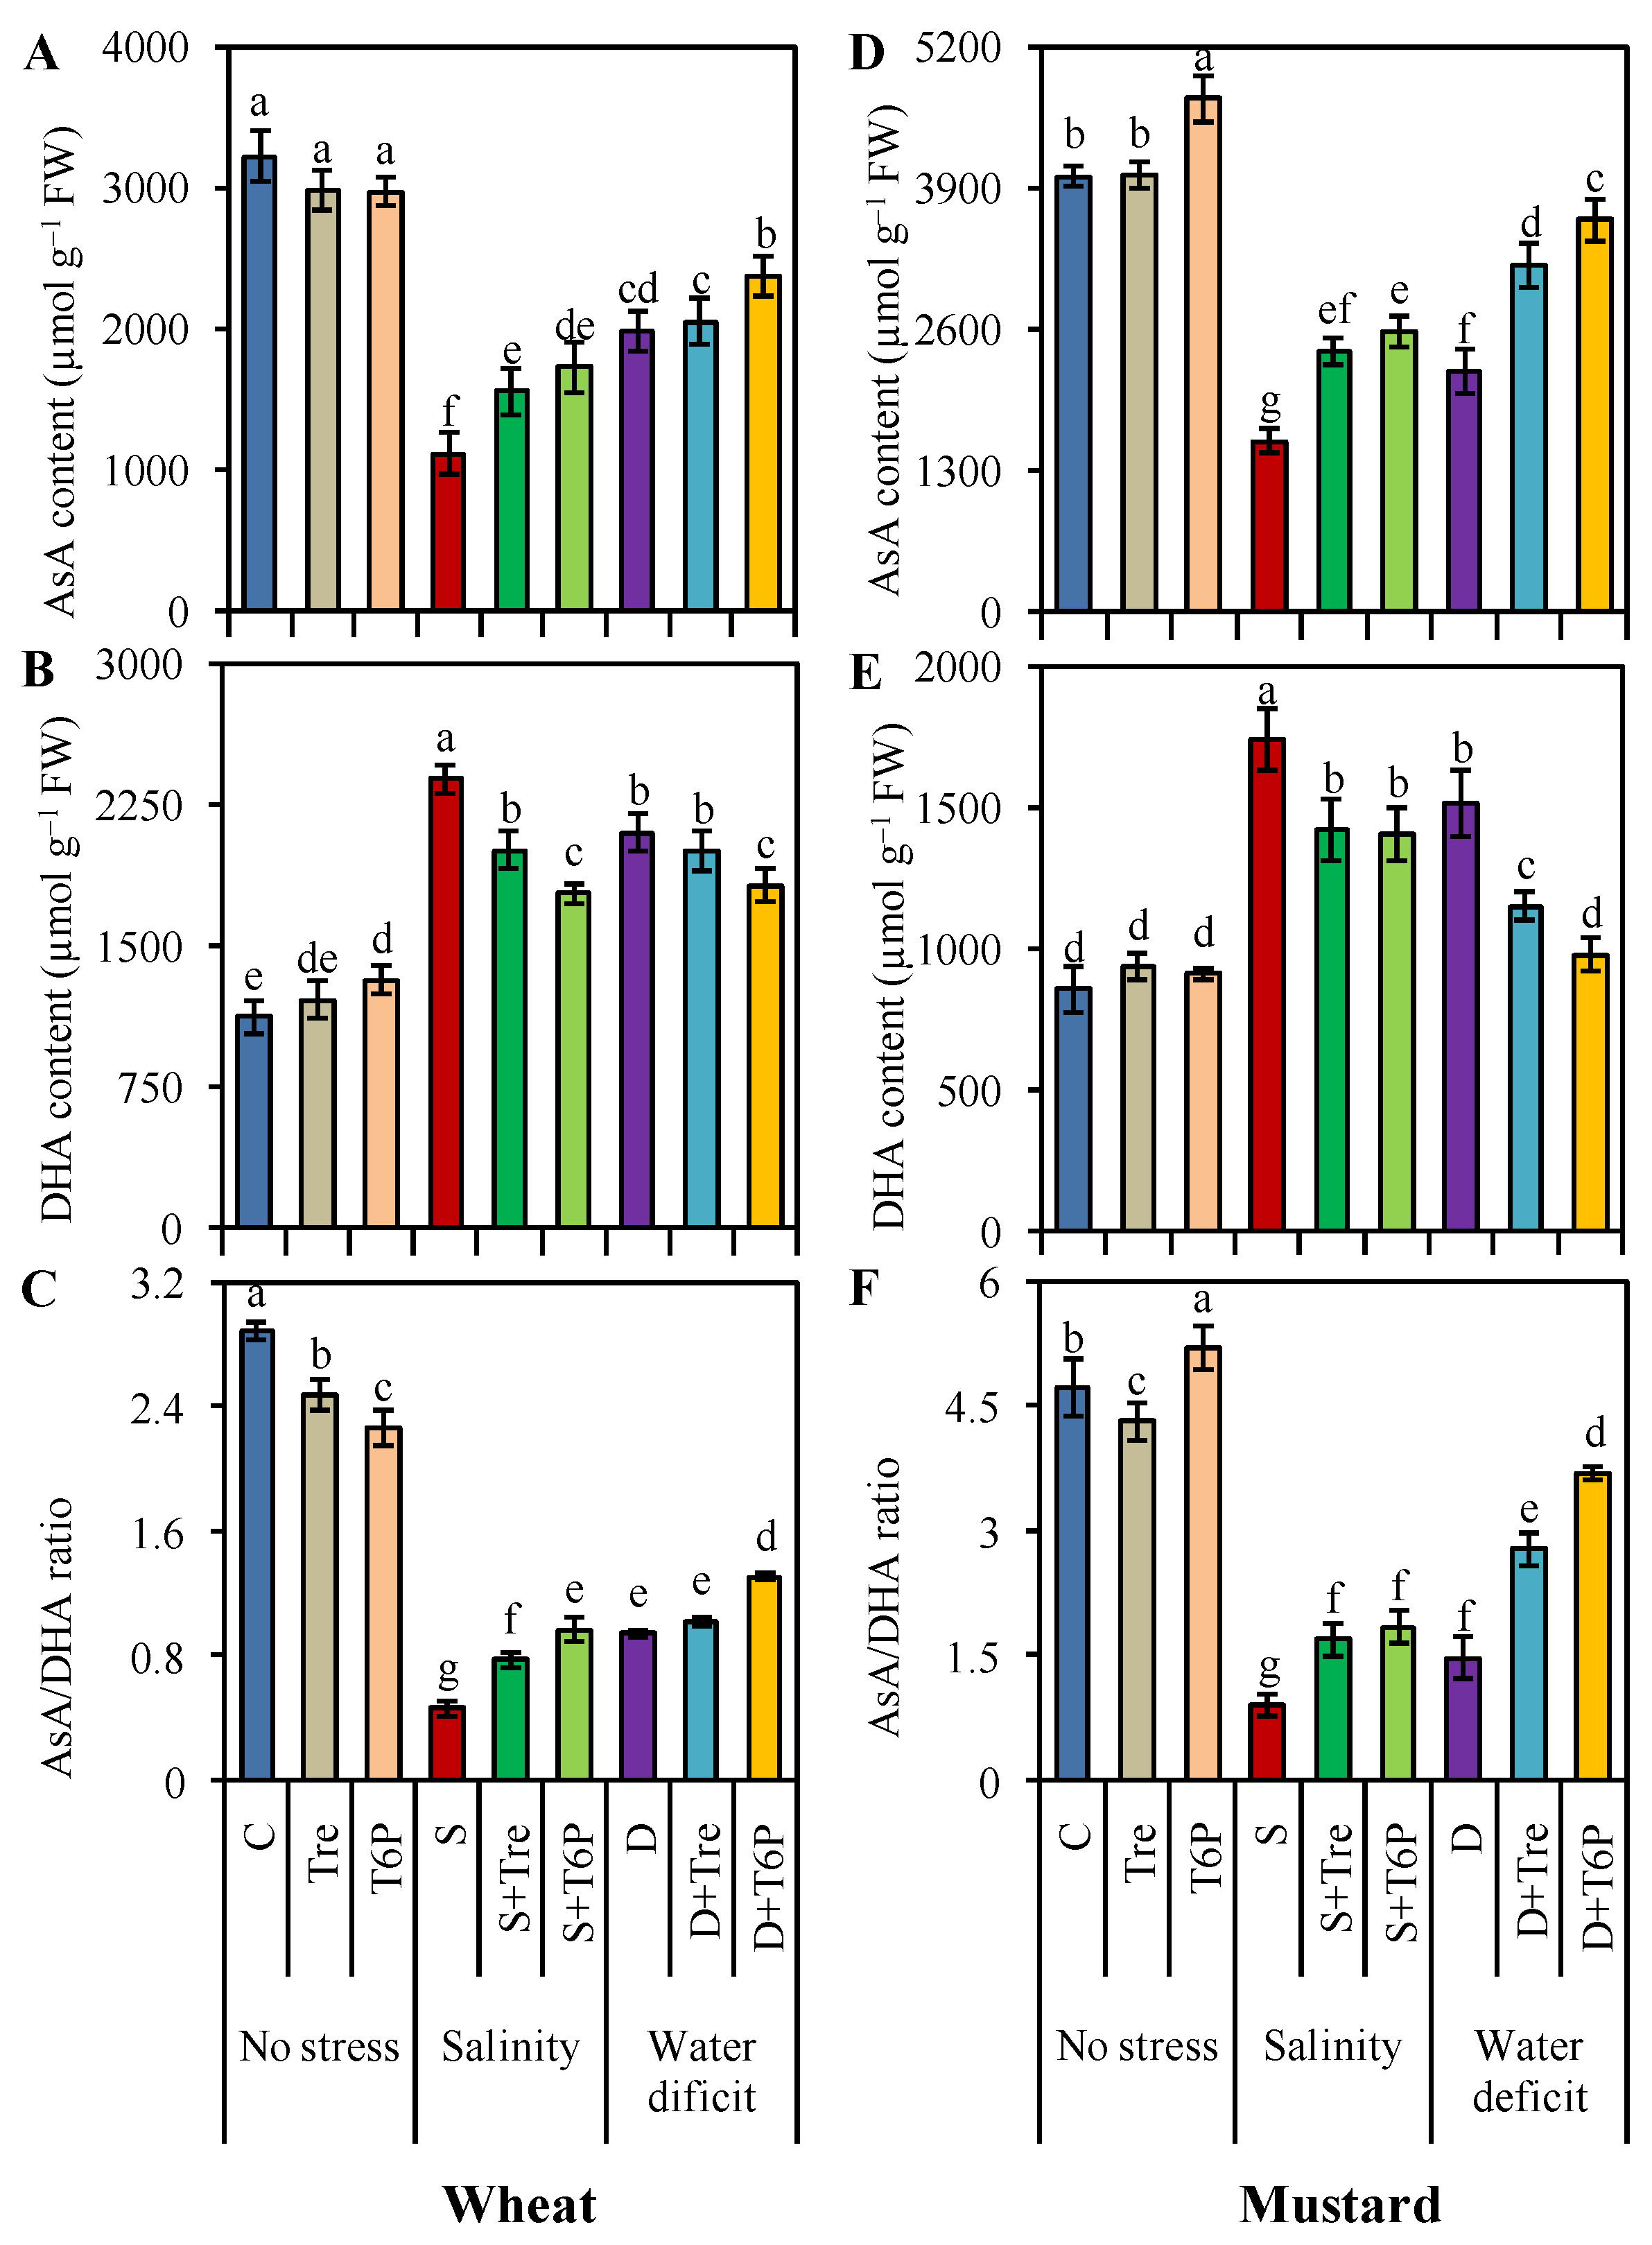
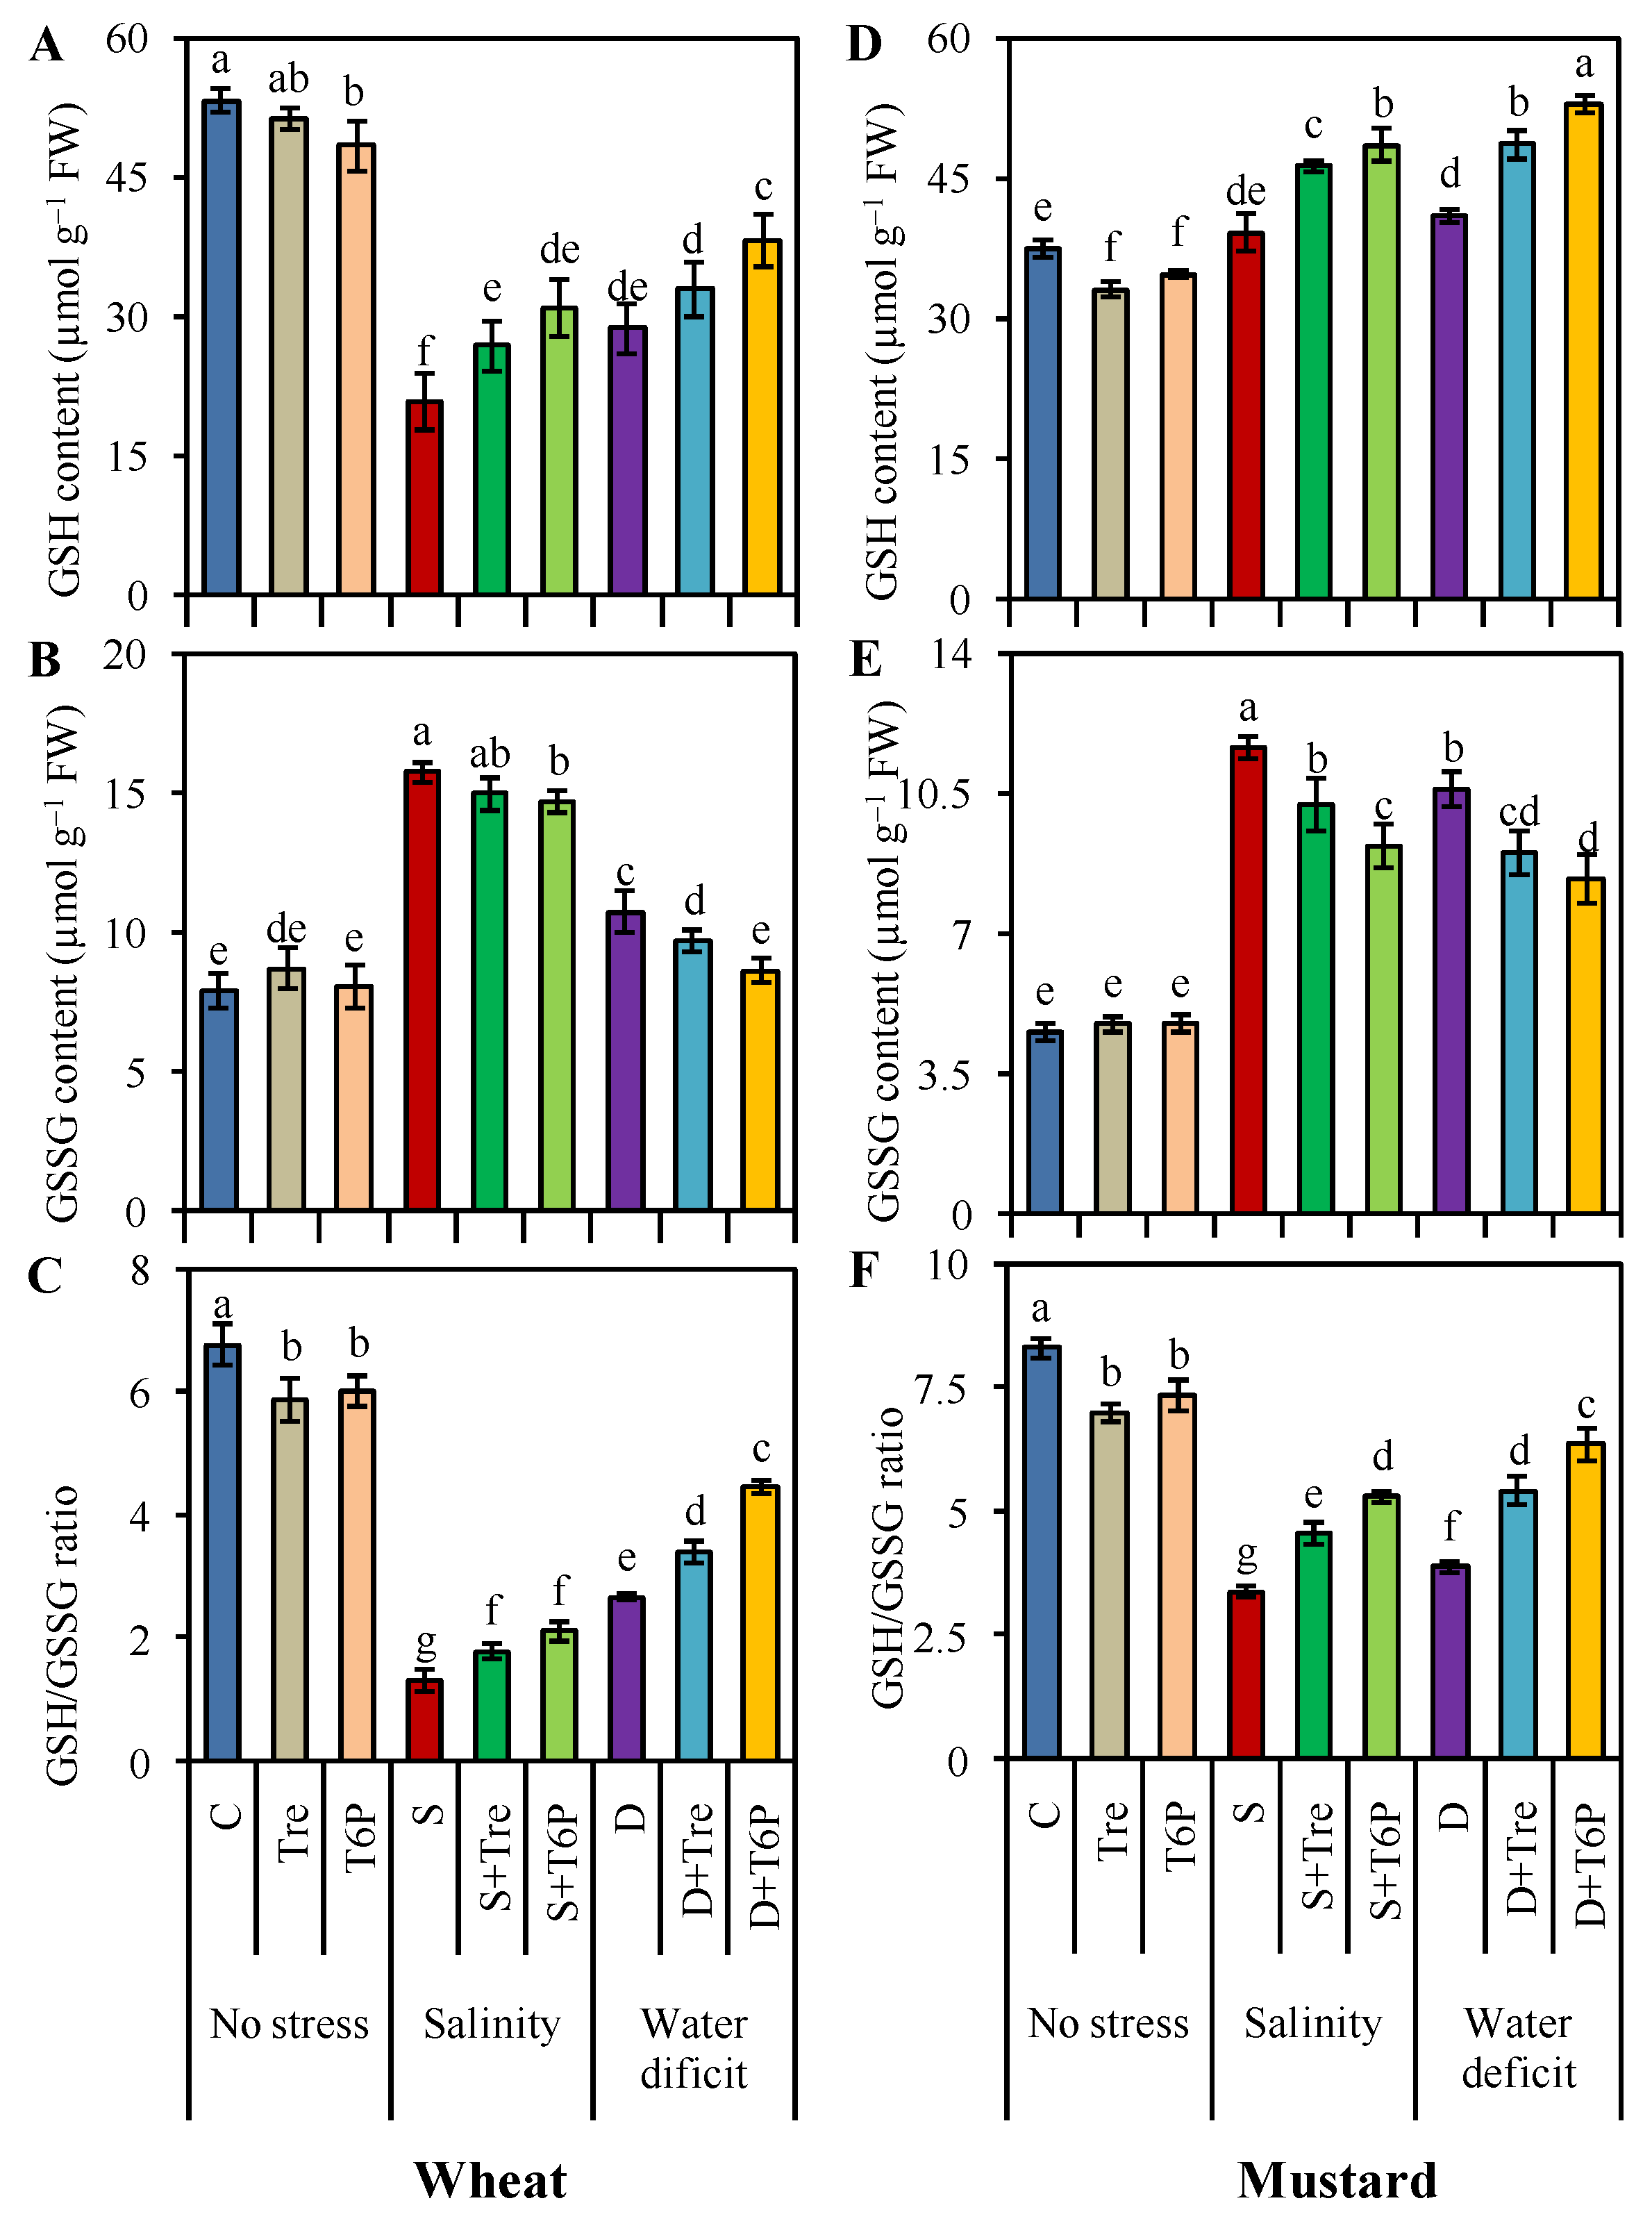
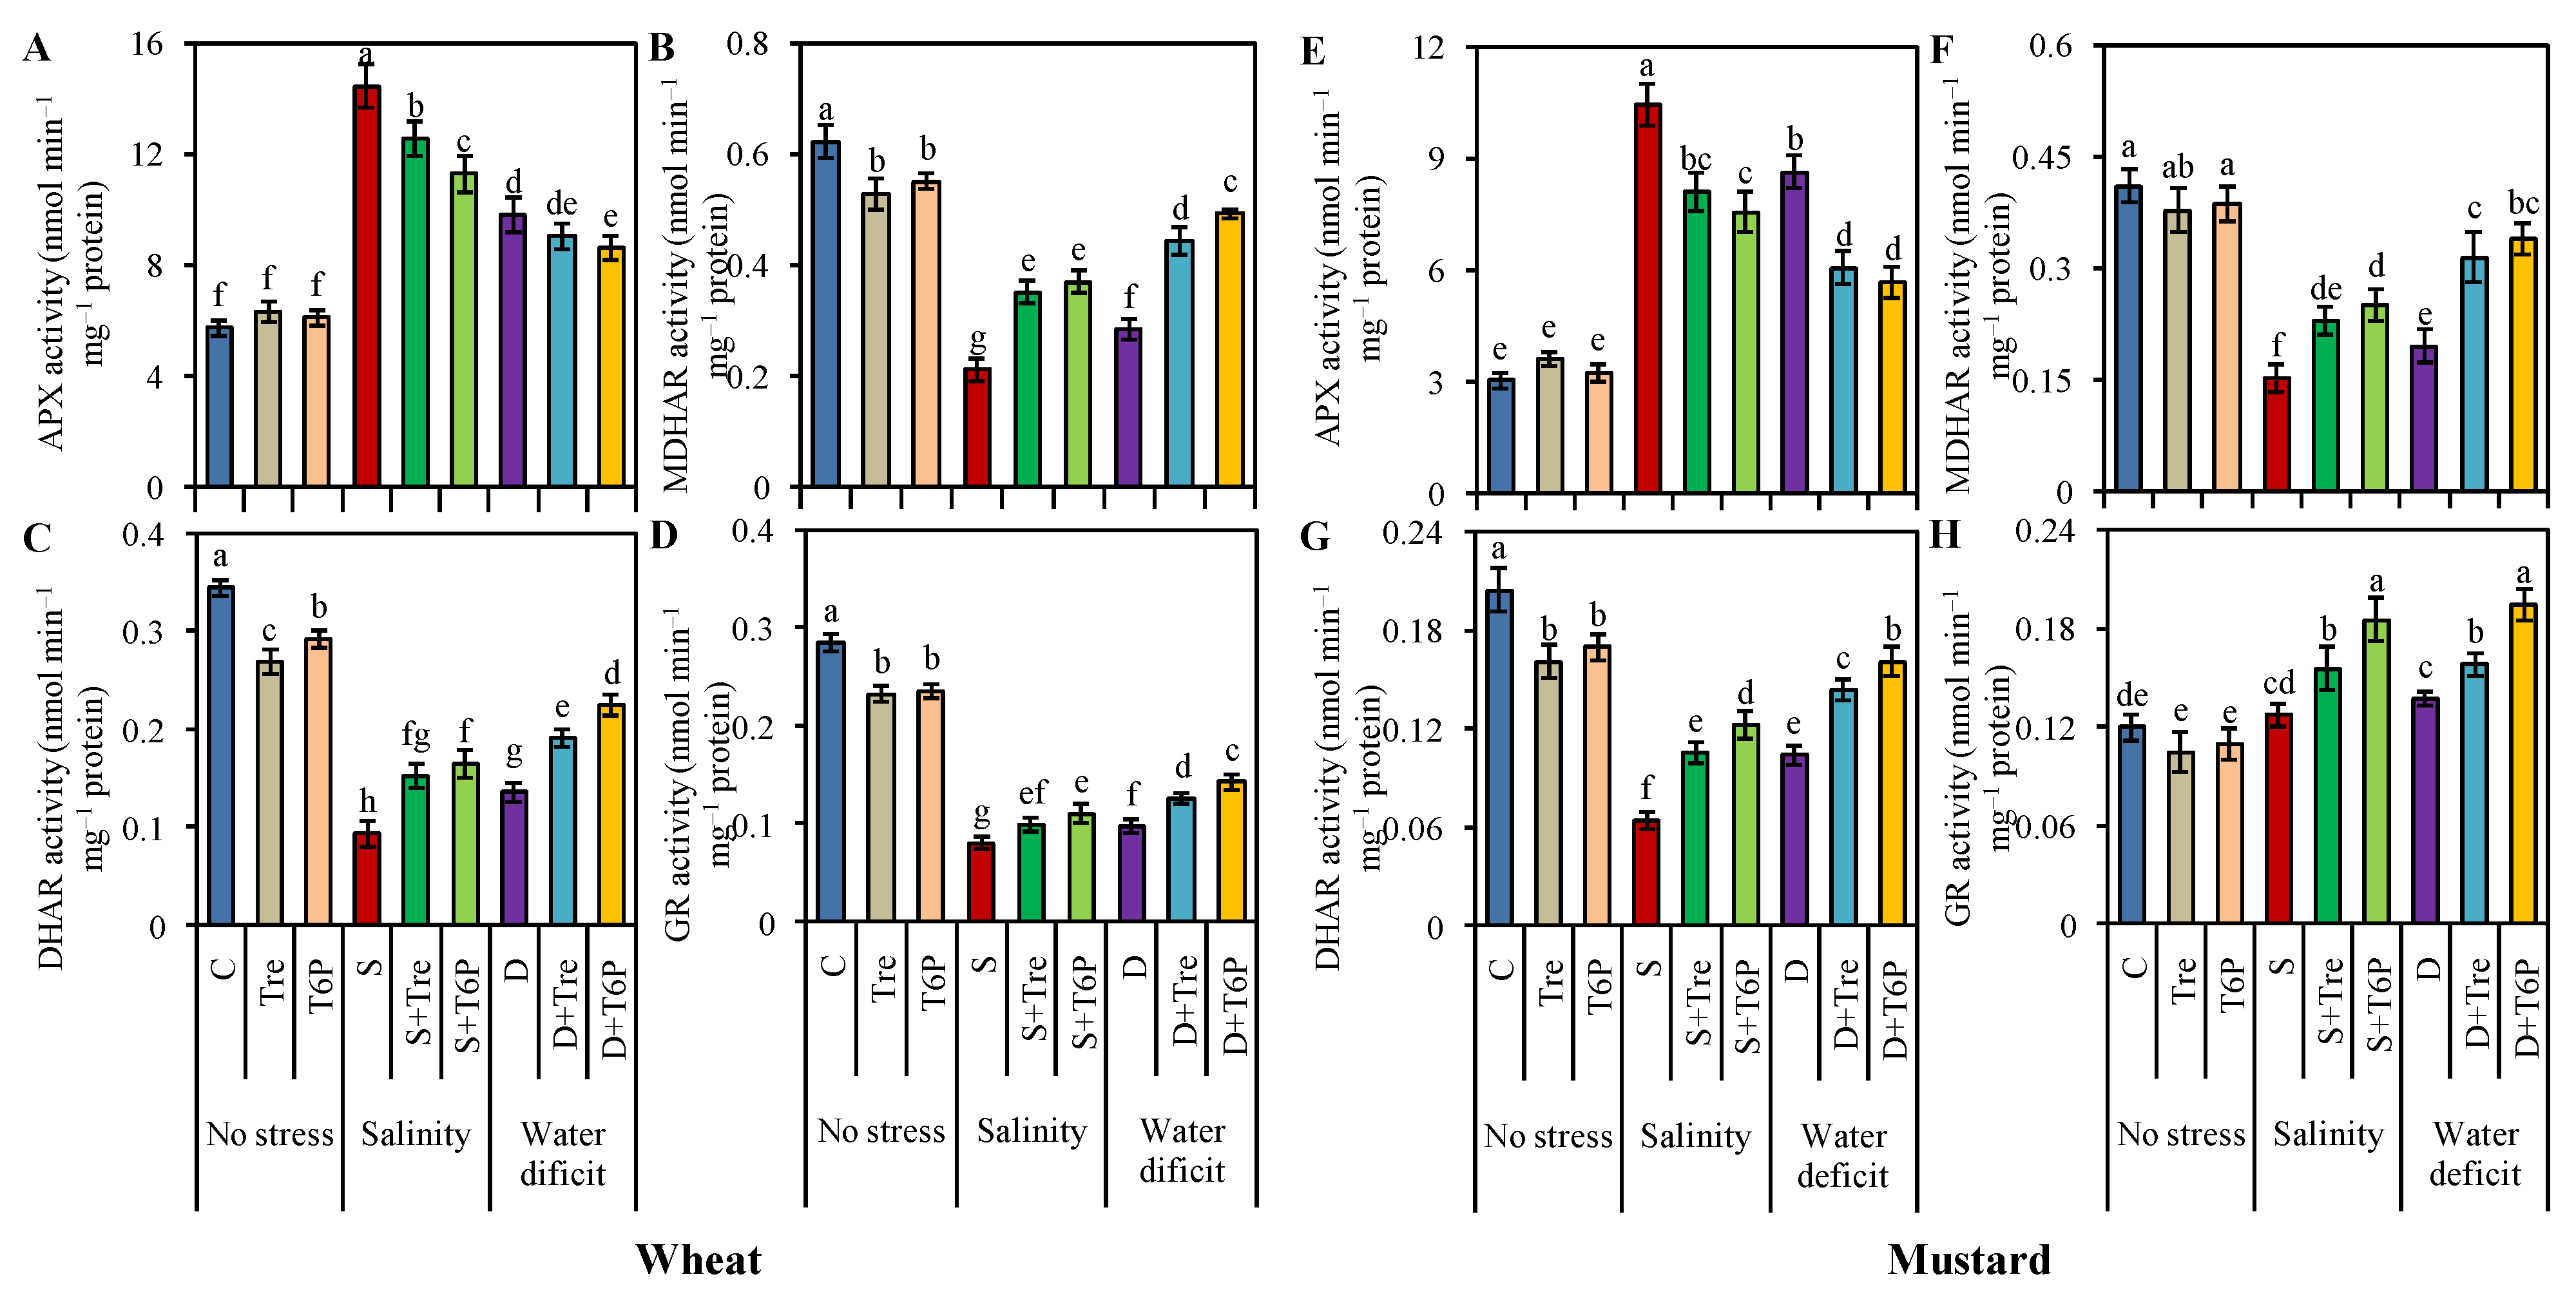
2.5. AsA-GSH Pool Is Enhanced by Trehalose and T6P under Salt and Water Deficit Stress

The content of reduced ascorbate (AsA) was considerably reduced by 65 and 38% in response to salt and water deficit stresses, respectively, in wheat seedlings. In contrast, the dehydroascorbate (DHA) content increased by 113 and 88%, respectively, compared with control plants. Seedlings pretreated with Tre and T6P showed increased AsA contents and decreased DHA contents under both salt and water deficit stress compared to stress seedlings. Therefore, Tre and T6P increased the AsA/DHA ratio by 66 and 108%, respectively, under salt stress and by 8 and 38%, respectively, under water deficit stress compared to stressed seedlings (Figure 3A–C). The oxidized glutathione (GSSG) content increased by 100 and 36% under salt and water deficit stress, respectively, in wheat seedlings compared to the control, whereas reduced glutathione (GSH) content decreased by 61 and 46%, respectively. However, Tre and T6P treatment improved GSH content and reduced GSSG content in seedlings under both salt and water deficit stress. Therefore, the GSH/GSSG ratio increased by 35 and 60% under salt stress and by 28 and 66% under water deficit stress with Tre and T6P, respectively, compared to stressed seedlings (Figure 4A–C).
In mustard seedlings, AsA content was reduced by 61 and 45% under salt and water deficit stresses, respectively, but DHA content increased by 103 and 77%, respectively, compared to control seedlings. Seedlings pretreated with Tre and T6P had improved AsA contents and reduced DHA contents in response to both salt and water deficit stress compared to stress seedlings. Therefore, Tre and T6P increased the AsA/DHA ratio under salinity (by 87 and 103%, respectively) and water deficit stress (by 89 and 150%, respectively) compared to stressed seedlings (Figure 3D–F). The GSSG content increased by 157 and 134% under salt and water deficit stress, respectively, in mustard seedlings compared to the control, and GSH content also increased by 5 and 9%, respectively. Therefore, the GSH/GSSG ratio decreased by 59 and 53% under salt and water deficit stress, respectively, compared to unstressed control plants. By contrast, GSSG content decreased and GSH content further increased in Tre- and T6P-pretreated seedlings compared to stress only. Thus, Tre and T6P improved the GSH/GSSG ratio under salt (by 35 and 57%, respectively) and water deficit stress (by 40 and 64%, respectively) compared to stressed seedlings (Figure 4D–F).

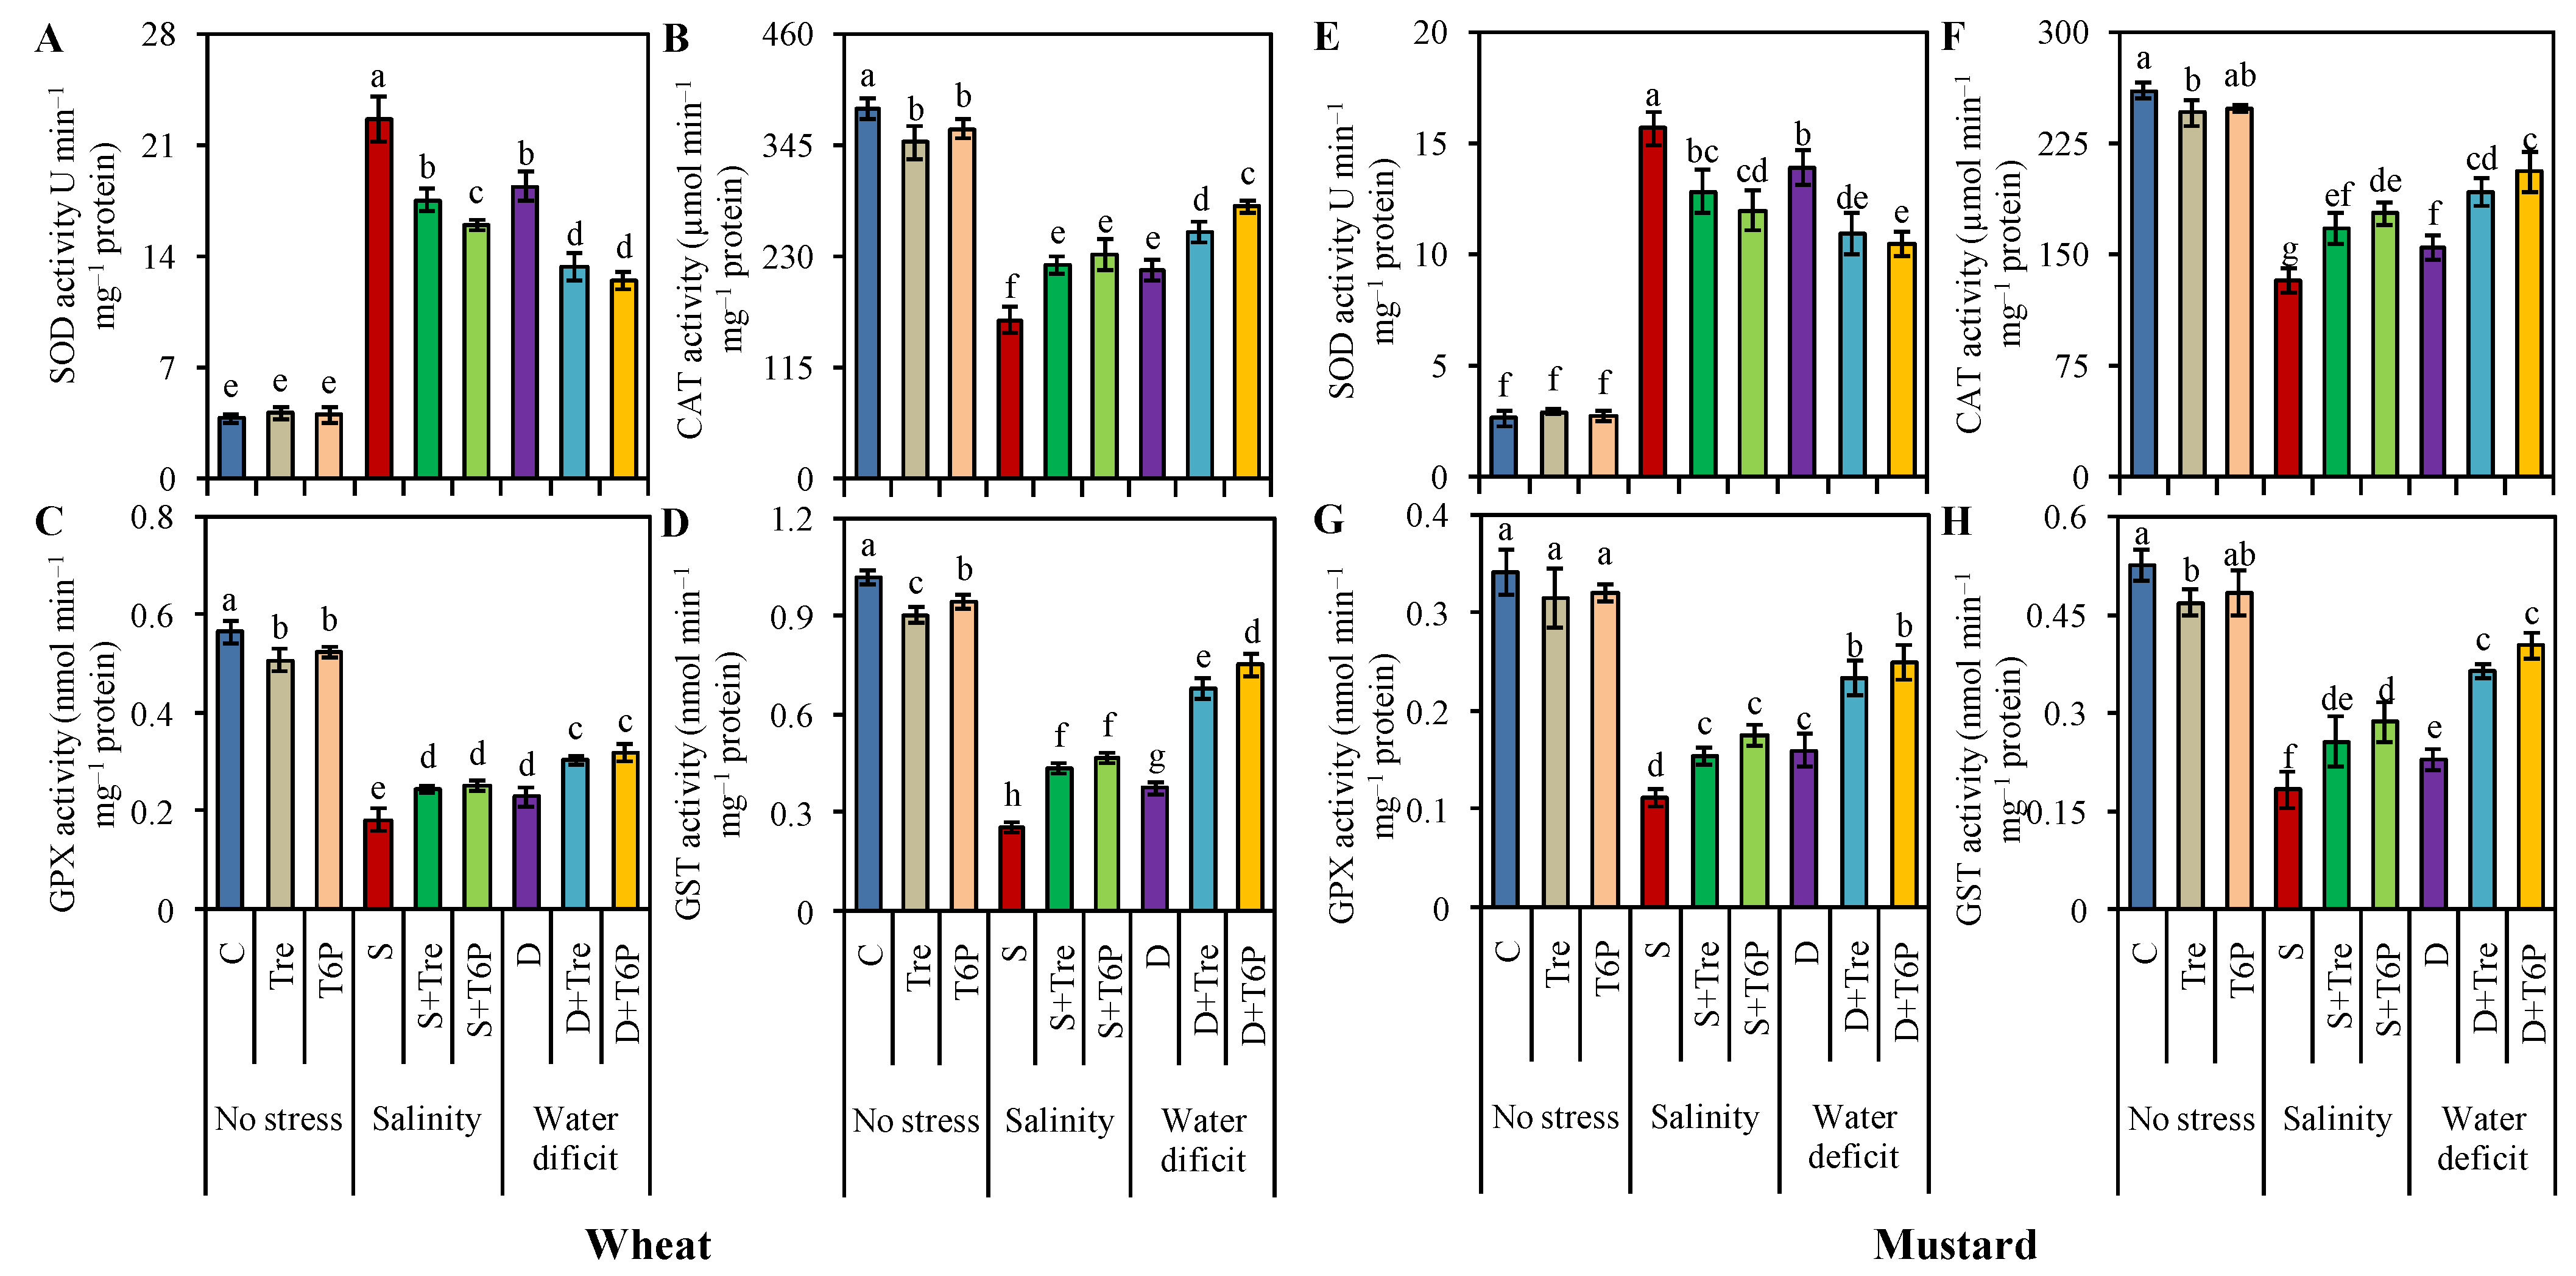
2.6. Up-Regulation of Antioxidant Enzyme Activities Due to Trehalose and T6P Application under Salt and Water Deficit Stress

Salt and water deficit stresses increased superoxide dismutase (SOD) activity (by 501 and 388%, respectively) and reduced the activities of catalase (CAT, by 57 and 44%, respectively), glutathione peroxidase (GPX, by 68 and 60%, respectively), and glutathione S-transferase (GST, by 75 and 63%, respectively) in wheat seedlings compared to the control. However, seedlings pretreated with Tre and T6P and exposed to salt and water deficit stress showed reduced SOD activity and enhanced activities of CAT, GPX, and GST compared to stressed seedlings only (Figure 5A–D). In mustard seedlings, SOD activity also increased (by 500 and 432%, respectively), and the activities of CAT (by 49 and 40%, respectively), GPX (by 67 and 53%, respectively), and GST (by 65 and 56%, respectively) decreased under salinity and water deficit stresses compared to control seedlings. Pretreatment with Tre and T6P reduced SOD activity and increased CAT, GPX, and GST activities under both salt and water deficit stresses compared with stressed seedlings only (Figure 5E–H).
In wheat seedlings, ascorbate peroxidase (APX) activity increased (by 152 and 72%, respectively) and the activities of monodehydroascorbate reductase (MDHAR, by 66 and 55%, respectively), dehydroascorbate reductase (DHAR, by 73 and 61%, respectively), and glutathione reductase (GR, by 72 and 66%, respectively) were reduced in response to salt and water deficit stresses compared to the control. Seedlings pretreated with Tre and T6P had reduced APX activity and increased activities of MDHAR, DHAR, and GR under salt and water deficit stresses compared to the stressed seedlings only (Figure 6A–D). In mustard seedlings, APX (by 245 and 186%, respectively) and GR (by 6 and 14%, respectively) activities increased, but the activities of MDHAR (by 63 and 52%, respectively) and DHAR (by 69 and 49%, respectively) decreased under salinity and water deficit stresses compared to control seedlings. Pretreatment with Tre and T6P reduced APX activity but increased MDHAR, DHAR, and GR activities under both salt and water deficit stresses compared with stressed seedlings only (Figure 6E–H).

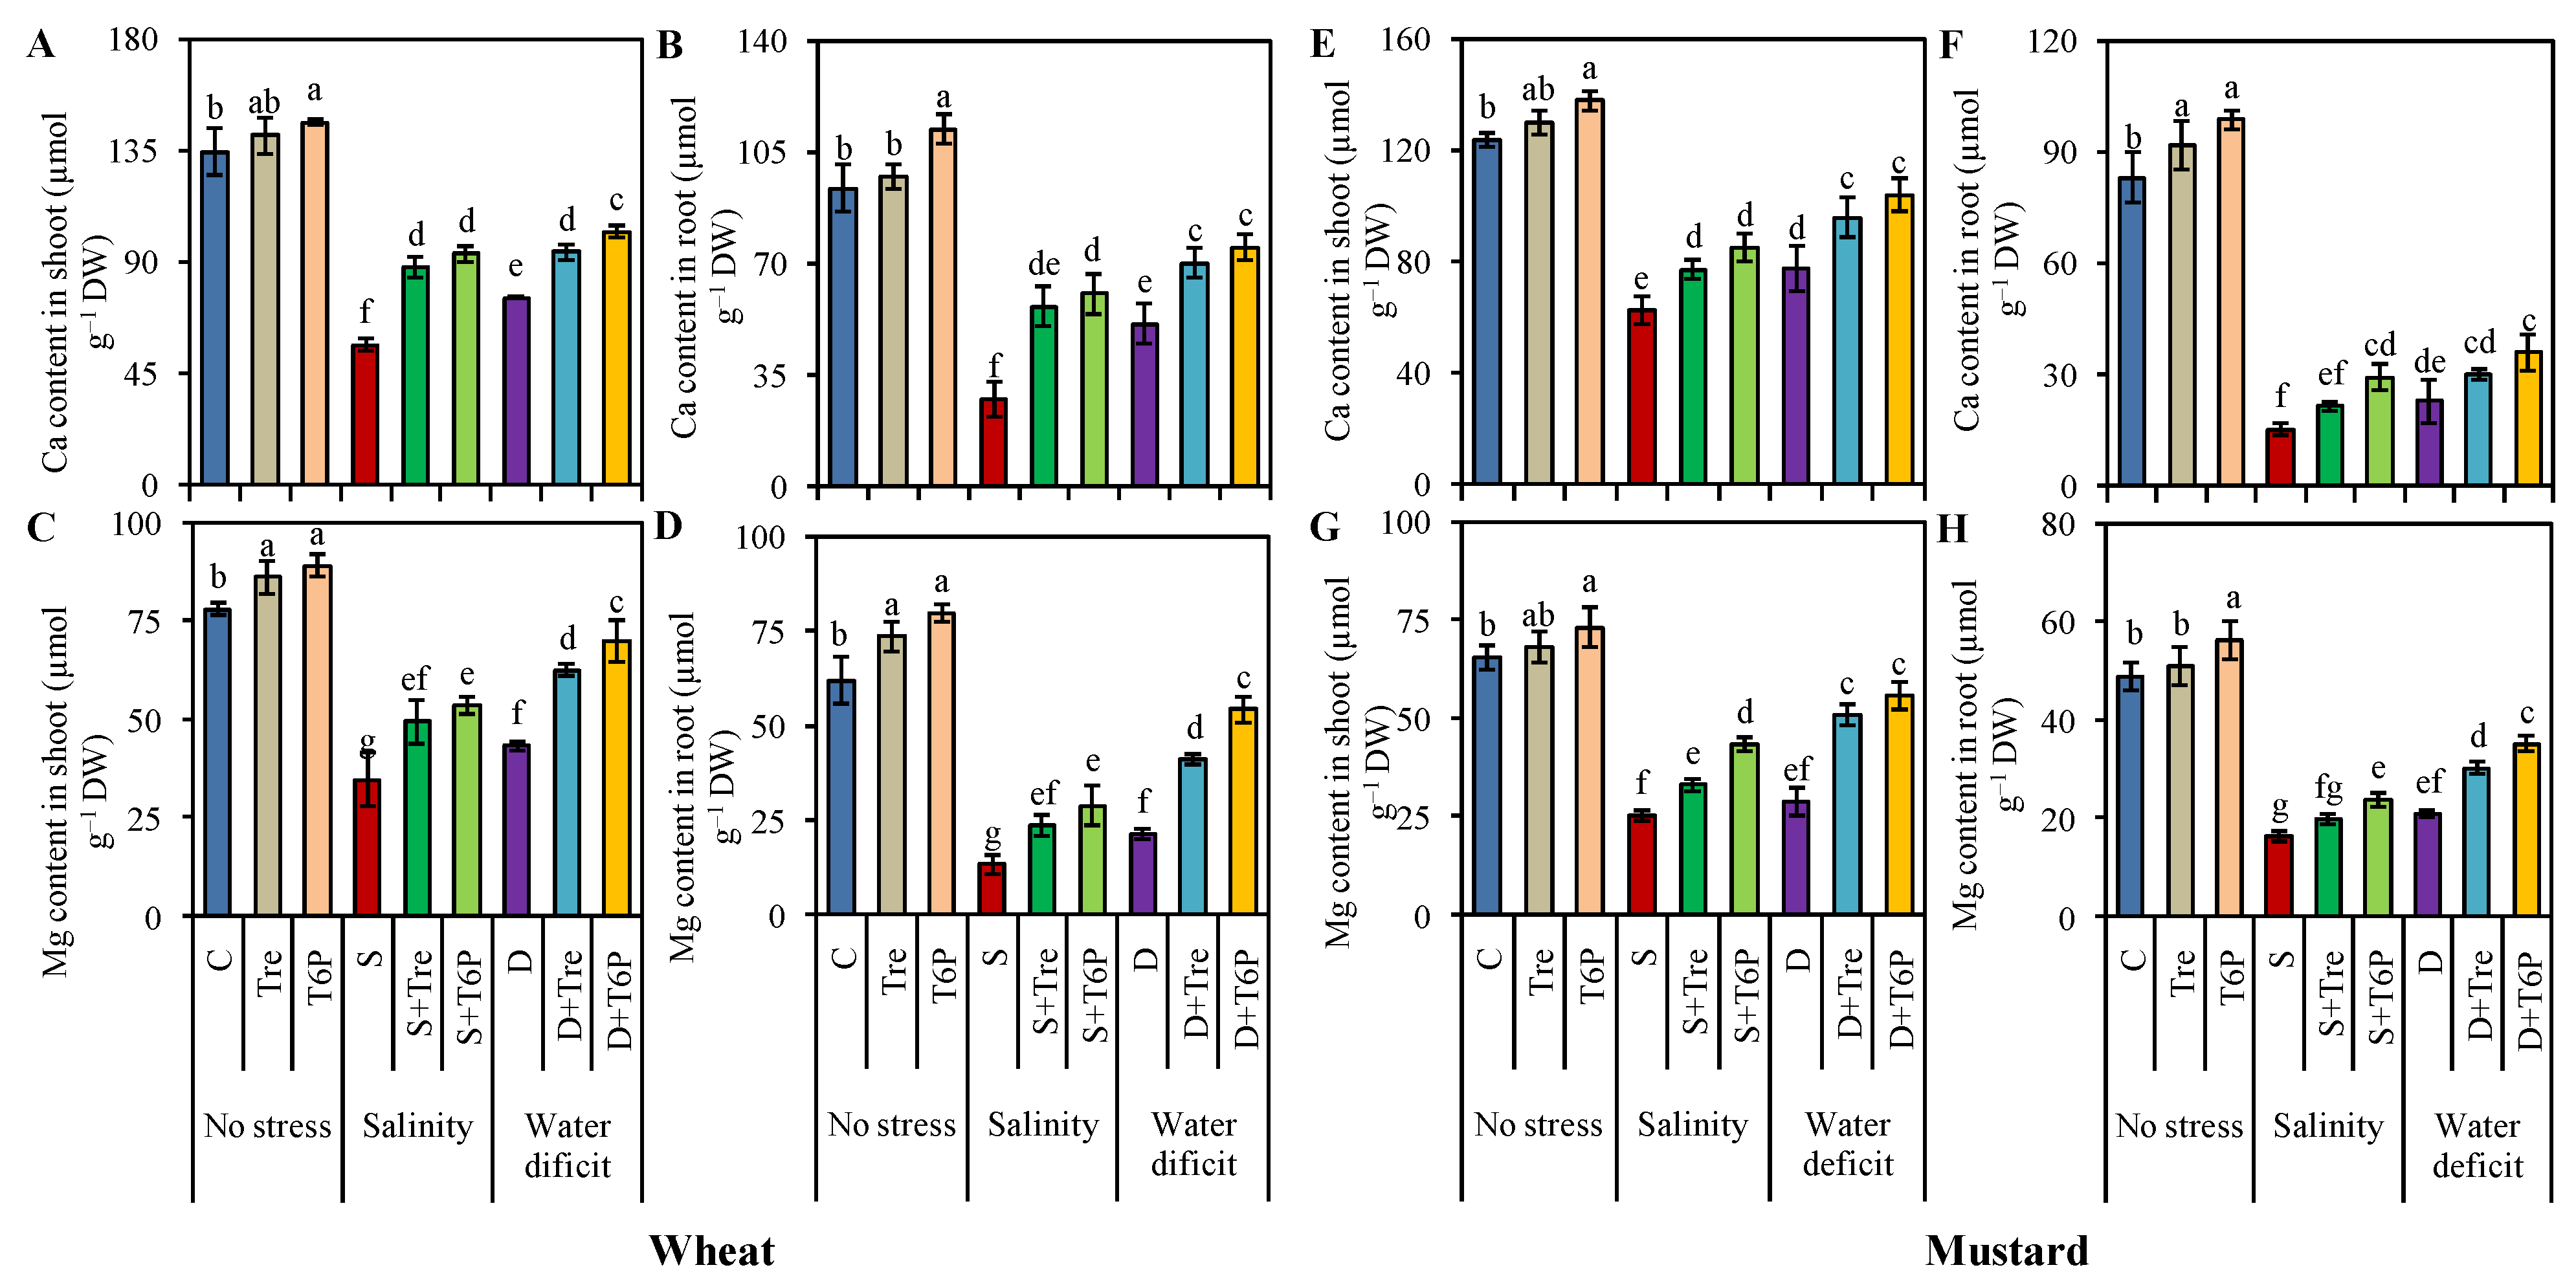
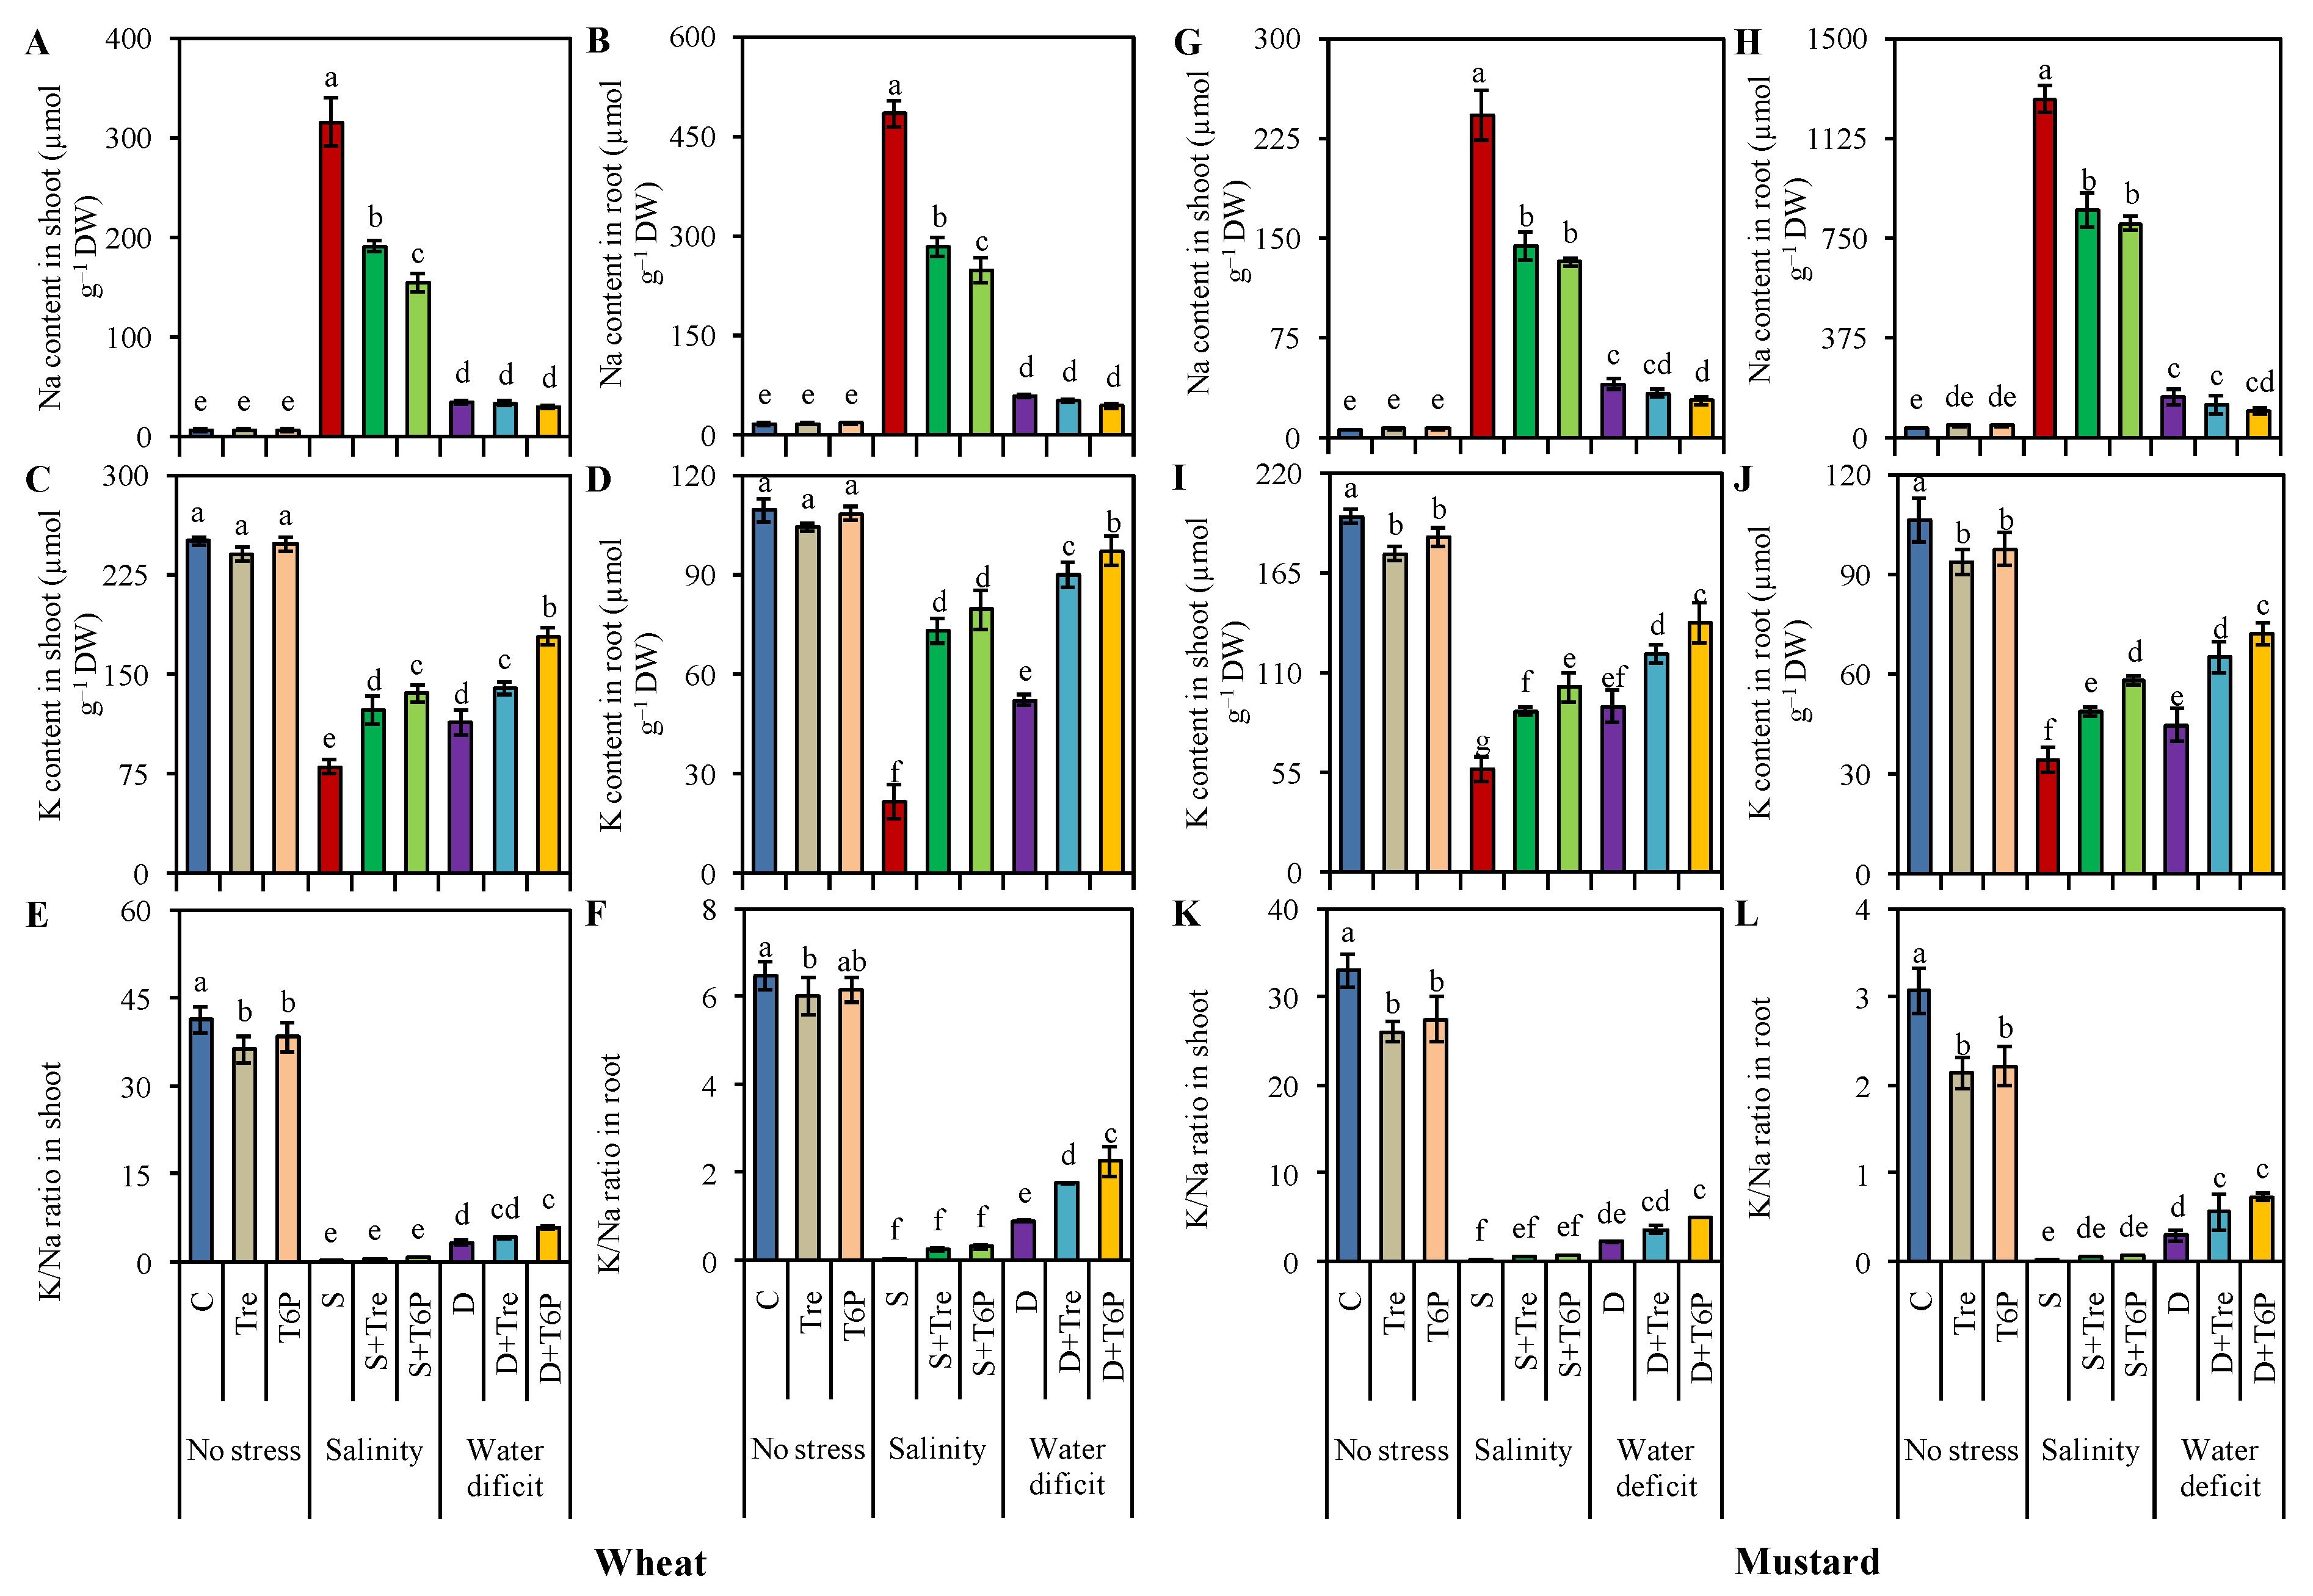
2.7. Trehalose and T6P Reduced Na Accumulation but Increased K, Ca, and Mg Uptake

The Na content increased in the shoots (5107 and 471%, respectively) and roots (2759 and 243%, respectively) of wheat seedlings in response to salinity and water deficit stresses compared to the control. However, in both shoots and roots, the K content was reduced under salt and water deficit stresses; therefore, salt and water deficit stresses reduced the K/Na ratio in the shoots by 99 and 92%, respectively, and in the roots by 99 and 86%, respectively, compared to control seedlings. The application of Tre and T6P reduced shoot and root Na contents but increased the shoot and root K contents and K/Na ratio under both salt and water deficit stresses compared with stressed seedlings only (Figure 7A–F). Salt and water deficit stress reduced the content of Ca in shoots (by 58 and 44%, respectively), Ca in roots (by 71 and 46%, respectively), Mg in shoots (by 56 and 44%, respectively), and Mg in roots (by 79 and 66%, respectively) in wheat seedlings compared to unstressed control seedlings. However, seedlings pretreated with Tre and T6P showed increased Ca and Mg contents in both shoots and roots under stressed conditions compared to water deficit-stressed seedlings only (Figure 8A–D).
In mustard seedlings, Na content increased in the shoots (by 3982 and 578%, respectively) and roots (by 3566 and 338%, respectively) under salinity and water deficit stress compared to control. The content of K in both shoots and roots was reduced under salt and water deficit stresses; therefore, the K/Na ratio was reduced in shoots by 99 and 93%, respectively, and in roots by 99 and 90%, respectively, compared to control seedlings. Seedlings pretreated with Tre and T6P contained reduced shoot and root Na contents but increased the shoot and root K contents and K/Na ratio under both salt and water deficit stresses, compared with stressed seedlings only (Figure 7G–L). Salinity and water deficit stresses decreased the content of Ca in shoots (by 50 and 37%, respectively), Ca in roots (by 82 and 73%, respectively), Mg in shoots (by 61 and 56%, respectively), and Mg in roots (by 67 and 57%, respectively) in mustard seedlings compared to unstressed control seedlings. However, seedlings pretreated with Tre and T6P showed increased Ca and Mg contents in both shoots and roots under stressed conditions compared to water deficit-stressed seedlings only (Figure 8E–H).

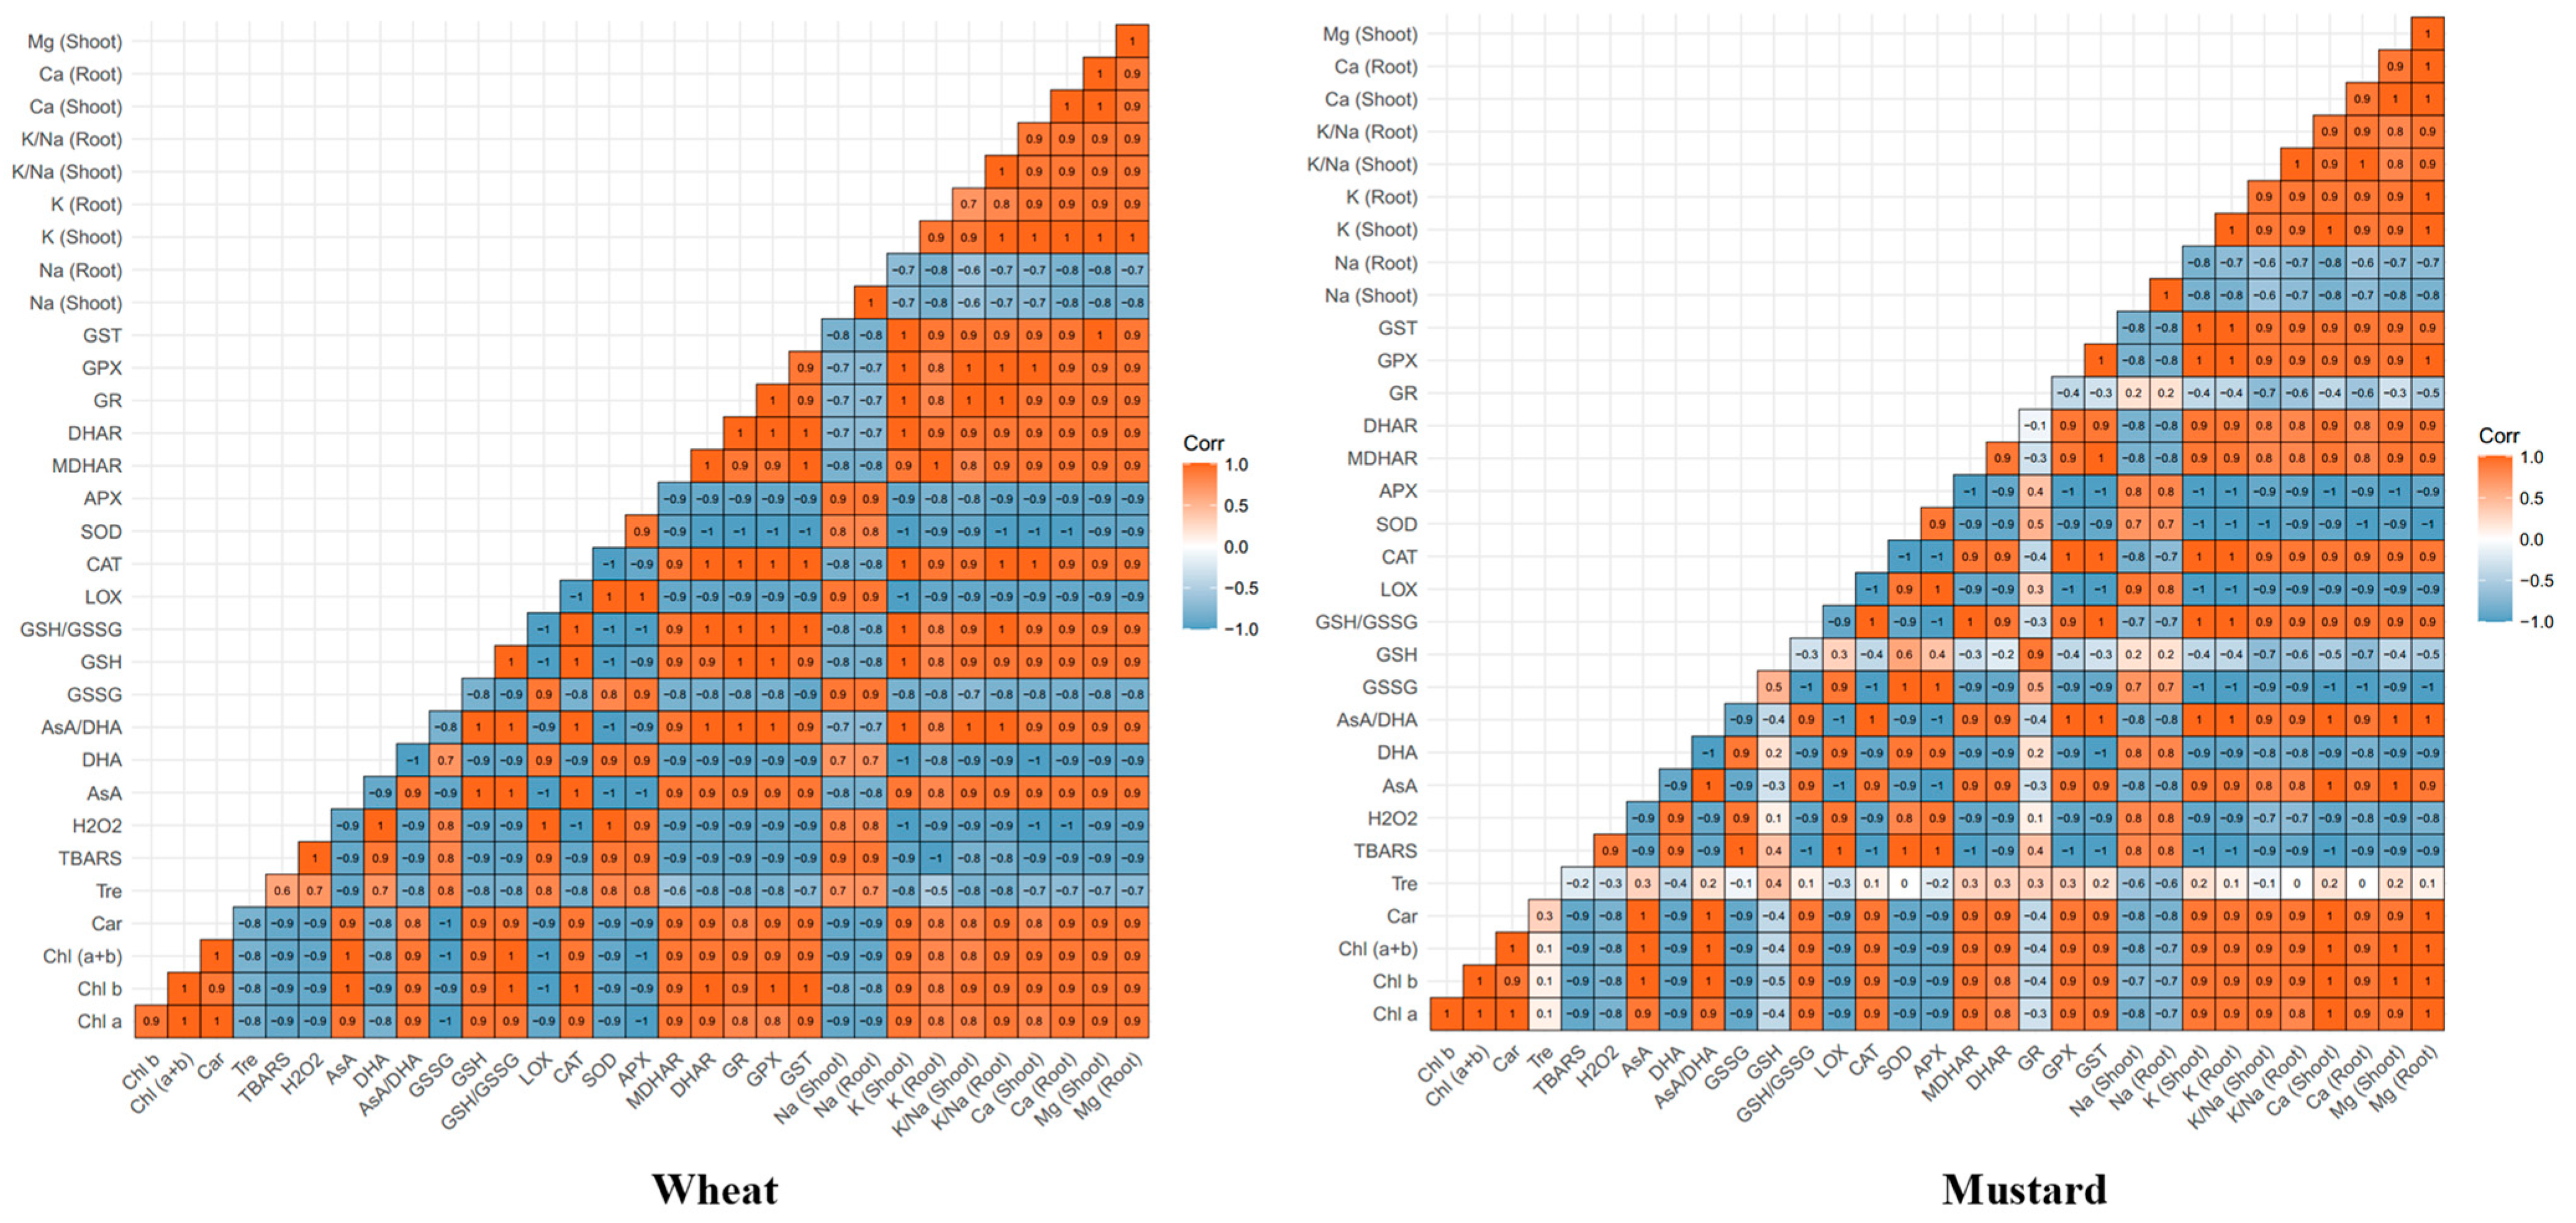
2.8. Relationship between Various Physio-Biochemical Parameters

Pearson’s correlations were computedto represent relationships between various parameters of wheat and mustard grown under salt and water deficit stresses with or without the application of Tre and T6P (Figure 9). The Na concentration in both the shoots and roots of wheat seedlings was positively correlated with Tre, TBARS, H2O2, DHA, GSSG, LOX, SOD, and APX andnegatively correlated with chl a, chl b, chl (a + b), car, AsA, AsA/DHA, GSH, GSH/GSSG, CAT, MDHAR, DHAR, GR, GPX, and GST. In mustard seedlings, the Na concentration in the shoots and roots was positively correlated with TBARS, H2O2, DHA, GSSG, LOX, SOD, and APX and negatively correlated with chl a, chl b, chl (a + b), car, Tre, AsA, AsA/DHA, GSH, GSH/GSSG, CAT, MDHAR, DHAR, GR, GPX, and GST.

3. Discussion

Water deficit is a widespread global environmental problem that induces osmotic stress in plants [21]. In response to salt stress, plants are affected by both osmotic imbalance and ion toxicity [22]. Under osmotic stress, plants generate osmoprotectants, including Tre, to adjust the cellular osmotic potential [23,24]. In our study, salt and water deficit stress reduced the content of chl and car in wheat and mustard seedlings (Table 1 and Table 2), which might be due to the stimulation of chlorophyllase enzyme activity and pigment–protein complex destabilization due to higher ROS generation [25]. Salinity-induced chl and car content reductions were also observed in wheat and mustard by Mohsin et al. [4] and Mahmud et al. [26], respectively. Under drought stress, lower chl and car were also found by Alam et al. [27] in mustard and by Hasanuzzaman et al. [28] in wheat seedlings. However, chl and car were increased by exogenous application of Tre and T6P, while better results were observed with T6P. Enhanced chl and car contents might be due to the regulation of osmotic status with the stabilization of chloroplasts by Tre [29]. It has been proved that T6P is converted into Tre in plant cells by catalyzing TPP, which improves plant tolerance [30]. However, during the conversion of T6P into Tre, T6P might alter chloroplast activity to increase chl and car contents, as observed in our study. Previous studies have also reported that Tre enhanced the photosynthetic pigment content [27,29].
In the present study, we observed that Tre content increased in wheat seedlings under salt and water deficit stress (Table 1), but in mustard seedlings, the content of Tre increased under water deficit stress and decreased in response to salinity (Table 2). The possible reason for higher Tre accumulation might be the regulation of osmotic status under stress conditions, and this result was confirmed by Sadak [29]. Lower Tre content in salinity-exposed maize plants found by Rohman et al. [24] was also observed in mustard seedlings in our study. This might be due to the use of Tre for the regulation of osmotic levels. However, a higher accumulation of Tre was found after the application of Tre and T6P in both wheat and mustard seedlings.
Under stress conditions, the most common response of plant cells is the generation of ROS such as H2O2, singlet oxygen (1O2), superoxide (O2•–), and hydroxyl radicals (OH) [17,31]. The availability of CO2 and carbon fixation are reduced under salt stress due to the induction of stomata closure by high salt concentration. Therefore, energy excitation causes a buildup in chloroplasts and leads tohigher ROS generation [4,32]. Water deficit stress also causes higher ROS generation by inhibiting the activity of RuBisCo and disturbing the energy level during photosynthesis [27]. In our study, higher ROS (H2O2) production was observed in both wheat and mustard seedlings under salt and water deficit stress (Figure 2B,E). Higher ROS generation caused higher TBARS production (Figure 2A,D) and LOX activity (Figure 2C,F). In response to salt stress, higher ROS generation and lipid peroxidation were also observed in wheat [6], maize [24], and mustard [26] seedlings. However, seedlings pretreated with Tre and T6P prior to salt and water deficit exposure showed decreased oxidative stress. These findings are in agreement with Alam et al. [27], Rohman et al. [24], and Sadak [29], who reported that exogenous Tre reduced oxidative damage in different plants under stress conditions. This might be due to Tre-mediated ROS scavenging, stabilization of the cell membrane, and modulation of antioxidant defense mechanisms [29]. Apart from Tre, T6P might stabilize the cell wall separately by regulating the sucrose status and starch metabolism in plants, thus reducing oxidative damage [20]. This might be a possible reason for the significant reduction in oxidative stress markers by T6P compared to Tre in our study.
Under stress conditions, plants activate enzymatic and non-enzymatic antioxidants as defense mechanisms to mitigate stress-induced oxidative damage [16]. The enzyme SOD serves as the first defense system by catalyzing the dismutation of O2•− into H2O2 and also restricting the formation of OH ions [33]. In our study, higher SOD activity was observed under salt and water deficit stresses in both wheat and mustard seedlings, which indicates higher O2•− production. However, the exogenous application of Tre and T6P reduced SOD activity under both salt and water deficit stresses (Figure 5A,E). Salinity and water deficit stress suppressed the activities of CAT, GPX, and GST in our study (Figure 5B–D,F–H), representing higher H2O2 production [27,34]. However, pretreatment with Tre and T6P increased the activities of CAT, GPX, and GST in both wheat and maize seedlings; these enzymes are responsible for the reduction of H2O2 [16]. Our results are in line with the reports published by Alam et al. [27] and Rohman et al. [24]. In the AsA-GSH cycle, antioxidant enzymes APX, MDHAR, DHAR, and GR work together with non-enzymatic antioxidants AsA and GSH as antioxidant defense mechanisms, and the ratios of AsA/DHA and GSH/GSSG regulate the redox status in plant cells under stress [35]. In our study, higher APX activity (Figure 6A,E) and lower MDHAR and DHAR activities were observed under salt and water deficit stresses (Figure 6B,C,F,G). Ascorbate is a non-enzymatic component of the AsA-GSH cycle that is able to scavenge ROS directly or is used in the conversion of H2O2 into DHA by APX [36]. In this study, lower AsA (Figure 3A,D) and higher DHA contents (Figure 3B,E) were observed, which might be due to higher APX activity. Reduced MDHAR and DHAR activities are also responsible for lower AsA content because AsA can be regenerated from MDHA and DHA by the enzymes MDHAR and DHAR, respectively [3]. However, after the application of Tre and T6P, increasing AsA content and MDHAR and DHAR activities with decreasing APX activity indicated the improvement of antioxidant defense mechanisms. These findings are also supported by Alam et al. [27] and Rohman et al. [24]. Glutathione is another non-enzymatic antioxidant that is also able to directly scavenge ROS and helps in the regeneration of AsA [35]. In the present study, under salt and water deficit stresses, the GSH content was reduced in wheat seedlings (Figure 4A) but increased in mustard seedlings (Figure 4D). These results might be due to lower GR activity in wheat and increased GR activity in mustard seedlings under stress (Figure 6D,H). However, exogenous Tre and T6P further increased the GSH content by regulating GR activity. Alam et al. [27] also observed that exogenous application of Tre improved GSH content in mustard seedlings under water deficit stress.
In response to salinity, the accumulation of Na increased in both the shoots and roots of wheat and mustard seedlings, which was reduced by the application of Tre and T6P (Figure 7A,B,G,H). However, K content was reduced in both shoots and roots under salt and water deficit stresses (Figure 7C,D,I,J). Higher Na accumulation inhibited K uptake, which reduced the K/Na ratio (Figure 7E,F,K,L), thereby causing an imbalance of ionic concentration and restricting cellular metabolic activities [4]. In response to PEG, we observed higher Na content in wheat and mustard seedlings compared to the control. Usually, plant tissues contain some sodium for their normal functions, as it has some key roles in plant physiology. We assume that the possible reason for the higher Na content under PEG might be that osmotic stress changes exogenous Na into a more available form. Ahmad et al. [37] also observed that the Na content increased under PEG stress in rice. However, pretreatment with Tre and T6P reduced the Na content and increased K accumulation. One possible mechanism for Na reduction might be cell wall stabilization by Tre and T6P [20]. Rohman et al. [24] also found that the exogenous application of Tre maintained the K/Na ratio by reducing Na uptake in maize plants. A higher concentration of Na can also inhibit Ca and Mg uptake [1], which can be observed in our study (Figure 8A–H) and was improved by Tre and T6P application. The correlation analysisfound that in wheat and mustard, oxidative stress markers (TBARS, H2O2, and LOX) positively correlated with shoot and root Na concentration, indicating that higher Na concentration caused cellular damage, initiating oxidative stress. On the other hand, we observed that shoot and root Na concentration negatively correlated with enzymatic (CAT, MDHAR, DHAR, GR, GPX, and GST) and non-enzymatic (AsA and GSH) antioxidants, which indicates that higher Na concentration disturbed antioxidant defense systems (Figure 9).

4. Materials and Methods

4.1. Chemicals

Trehalose 6-phosphate was produced by Daihachi Chemical Industry Co., Ltd., Osaka, Japan, and trehalose dihydrate was produced by Hayashibara Co., Ltd., Okayama, Japan.

4.2. Plant Material and Growth Conditions

Wheat (T. aestivum L. cv. Norin 61) and mustard (Brassica juncea L. cv. BARI sharisha 13) seeds were sterilized with ethanol (70%) and then washed with distilled water (dH2O). After washing, wheat and mustard seeds were further soaked in dH2O for 4 h and 10 min, respectively. Then, seeds were sown on moist filter paper in glass cups (4 cm dia.) and incubated at 25 °C for 48 h (wheat) and 72 h (mustard). After germination, seeds were transferred to a growth chamber maintaining relative humidity (65–70%), light (350 µmol photon m−2 s−1), and temperature (25 ± 2 °C). Diluted Hyponex was used at 3300-fold and 5000-fold for wheat and mustard, respectively, as the nutrient solution [38]. Three−day−old wheat and four−day−old mustard seedlings were pretreated with 200 µM Tre and T6P for 48 h. Then, wheat and mustard seedlings were exposed to salt (300 and 200 mM NaCl, respectively) and water deficit (20 and 12% PEG 6000, respectively) stress for the next four days. The solution for each treatment was renewed every two days. Morphological and biochemical data were measured from nine-day-old wheat and ten−day−old mustard seedlings. The experiment was conducted following a completely randomized design (CRD) with three replications.

4.3. Measurement of Chlorophyll and Carotenoid Contents

Chlorophyll and car contents were measured from wheat and mustard leaf samples using 100% ethanol following Lichtenthaler [39]. The absorbance was recorded at 664, 648, and 470 nm to estimate chl a, chl b, and car contents, respectively.

4.4. Determination of Trehalose Content

The content of Tre was measured following the method of Li et al. [40], where 80% ethanol was used for leaf extraction. As the reaction mixture, H2SO4 (0.2 N) and NaOH (0.6 N) were used with the extracted supernatant in this method. Anthrone reagent was added to the solution to develop color and then tested to observe the spectrophotometric absorbance at 630 nm.

4.5. Measurement of Thiobarbituric Acid-Reactive Substances Content

Thiobarbituric acid-reactive substances content was measured following the method of Taulavuori et al. [41]. The leaf tissue was homogenized by using 5% (w/v) trichloroacetic acid (TCA), and 0.5% thiobarbituric acid (TBA) was used as the reaction reagent. Thereafter, absorbance was measured spectrophotometrically at 532 nm and corrected at 600 nm.

4.6. Hydrogen Peroxide Content Determination

The content of H2O2 was assayed according to the method described by Yu et al. [42]. Leaf samples were homogenized using 50 mM potassium-phosphate (K-P, pH 6.5) buffer. Titanium tetrachloride (TiCl4, 0.1%) and 20% sulfuric acid (H2SO4) were used as a reaction mixture. Optical absorbance was observed at 410 nm and calculated using an extinction coefficient (Є = 0.28 µM–1 cm–1).

4.7. Measurement of Ascorbate and Glutathione Contents

Leaf tissues (0.5 g) were homogenized by using 5% (w/v) TCA and centrifuged at 11,500× g. The contents of total ascorbate and AsA were determined according to Lechno et al. [43]. Supernatants were neutralized with K-P buffer (pH 7.0, 0.5 M) to determine total ascorbate, and dithiothretitol (DTT, 0.1 M) was used to reduce AsA. To measure AsA, dH2O was used instead of DTT. In the final reaction mixture, ascorbate oxidase (AO) and K-P buffer (pH 6.5, 0.25 M) were used with the neutralized solution and observed at 265 nm. A standard curve was prepared by using known concentrations of AsA. The content of DHA was determined by subtracting the content of AsA from the total ascorbate.
Glutathione content was determined following the method of Law et al. [44]. For total glutathione, supernatants were neutralized with K-P buffer (pH 7.0, 0.5 M) and dH2O, while 2-vinylpyridine was used instead of dH2O for GSSG. In the final reaction mixture, 5,5-dithio-bis(2-nitrobenzoic acid) (DTNB, 6 mM), nicotinamide adenine dinucleotide phosphate (NADPH), and GR were used with the neutralized solution and observed at 412 nm. Standard curves were prepared using known concentrations of GSH and GSSG to calculate total glutathione and GSSG, respectively. The content of GSH was determined by subtracting GSSG from total glutathione.

4.8. Soluble Protein and Antioxidant Enzyme Activity Measurement

Leaf samples were homogenized by using an extraction buffer solution that contained K-P buffer (pH 7.0, 50 mM), β-mercaptoethanol (5 mM), AsA (1 mM), glycerol (10%), and KCl (100 mM). The samples were centrifuged, and extracted solutions were used to determine protein quantification and enzyme activity. Protein concentration was quantified using Coomassie Brilliant Blue dye following the method of Bradford [45]. The absorbance was recorded at 595 nm and calculated using a standard curve prepared with bovine serum albumin.
The activity of LOX [EC: 1.13.11.12] was assayed by using linoleic acid and K-P buffer (pH 6.5) according to Doderer et al. [46], and then absorbance was observed at 234 nm. Superoxide dismutase [EC: 1.15.1.1] activity was determined by using K-P buffer (pH 7, 50 mM), xanthine (2.36 mM), NBT (2.24 mM), and xanthine oxidase according to El-Shabrawi et al. [47]. The absorbance was observed at 560 nm and expressed as U min−1 mg−1 protein. The activity of CAT [EC: 1.11.1.6] was measured by using K-P buffer (pH 7.0, 50 mM) and H2O2 (15 mM) following the method described by Hasanuzzaman et al. [48], and then absorbance was recorded at 240 nm. Ascorbate peroxidase [EC: 1.11.1.11] activity was determined according to Nakano and Asada [49] by using K-P buffer (pH 7.0, 15 mM), ethylenediaminetetraacetic acid (EDTA, 0.1 mM), AsA (0.5 mM), and H2O2 (0.1 mM), and absorbance was recorded at 290 nm. The activity of MDHAR [EC: 1.6.5.4] was assayed by using AO (0.5 units), Tris-HCl buffer (pH 7.5, 50 mM), AsA (2.5 mM), and NADPH (0.2 mM) according to the method described by Mohsin et al. [4], and absorbance was recorded at 340 nm. Dehydroascorbate reductase [EC: 1.8.5.1] activity was determined by using DHA (0.1 mM), K-P buffer (pH 7.0, 50 mM), GSH (2.5 mM), and EDTA (0.1 mM) according to Nakano and Asada [49], and absorbance was measured at 265 nm. The activity of GR (EC: 1.6.4.2) was assayed according to the method described by Mohsin et al. [50] by using GSSG (1 mM), K-P buffer (pH 7.0, 0.5 M), EDTA (1 mM), and NADPH (0.2 mM), and absorbance was observed at 340 nm. The activity of GPX [EC: 1.11.1.9] was measured by using K-P buffer (pH 7.0, 100 mM), GSH (2 mM), EDTA (1 mM), GR (1 unit), NaN3 (1 mM), NADPH (0.12 mM), and H2O2 (0.6 mM) according to the method described by Hasanuzzaman et al. [48], and absorbance was recorded at 340 nm. Glutathione S-transferase [EC: 2.5.1.18] activity was assayed by using 1-chloro-2,4-dinitrobenzene (CDNB, 1 mM), Tris-HCl buffer (pH 6.5, 100 mM), and GSH (1.5 mM) according to the technique described by Hasanuzzaman et al. [48], and absorbance was measured at 340 nm.

4.9. Measurement of Mineral Contents

The concentrations of minerals such as Na+, K+, Ca2+, and Mg2+ were determined according to Zasoski and Barau [51]. Shoot and root samples were digested separately using an HNO3:HClO4 (5:1 v/v) acid mixture, and an atomic absorption spectrophotometer (GFA-7000A; Shimadzu, Japan) was used to determine the mineral concentration.

4.10. Statistical Analysis

All collected data were analyzed by one-way analysis of variance (ANOVA) with R statistical software (version 4.1.3 and package doebioresearch). Fisher’s least significant difference (LSD) test was employed for mean comparisons, where p ≤ 0.05 was considered significant. Pearson’s correlation analysis and graphical presentation were also performed using R statistical software (version 4.1.3, packages ggcorrplot and ggplot2) to quantify the relationships between analyzed variables.

5. Conclusions

Based on the above findings, this study revealed that salinity and water deficitinduced oxidative stress in wheat and mustard seedlings by causing higher ROS generation and lipid peroxidation. However, using Tre and T6P improved plant growth by mitigating ROS-induced negative impacts. Moreover, the results indicated that higher shoot and root Na concentrations accumulated in both wheat and mustard seedlings, which caused higher oxidative damage and lower photosynthetic pigment contents. In addition, the findings revealed that stress conditions restricted the antioxidant defense mechanisms in seedlings by decreasing antioxidant enzyme activities and non-enzymatic antioxidant contents. However, seedlings pretreated with Tre and T6P showed enhanced antioxidant defense systems in both wheat and mustard seedlings. In this study, we observed that, comparatively, T6P showed better performance than Tre, which might be due to the dual role of T6P, directly interfering with plant mechanisms and/or the function of Tre after T6P is changed into Tre by TPP. However, further studies should be executed to identify the genes responsible for improving stress tolerance in plants after the application of T6P.

Author Contributions

S.M.M. designed, conceived, and executed the experiment and drafted the manuscript; J.F. actively participated in the experiment; A.N., N.T. and H.M. edited and reviewed the manuscript; M.F. supervised the experiment and edited and reviewed the manuscript. All authors have read and agreed to the published version of the manuscript.

Funding

This research received no external funding.

Institutional Review Board Statement

Not applicable.

Informed Consent Statement

Not applicable.

Data Availability Statement

All data are presented in this article.

Acknowledgments

We acknowledge Daihachi Chemical Industry Co., Ltd., Japan, for providing trehalose 6-phosphate and Hayashibara Co., Ltd., Japan, for providing trehalose dihydrate.

Conflicts of Interest

The authors declare no conflict of interest.

References

  1. Muchate, N.S.; Rajurkar, N.S.; Suprasanna, P.; Nikam, T.D. NaCl induced salt adaptive changes and enhanced accumulation of 20-hydroxyecdysone in the in vitro shoot cultures of Spinacia oleracea (L.). Sci. Rep. 2019, 9, 12522. [Google Scholar] [CrossRef] [PubMed]
  2. Abbasi, H.; Jamil, M.; Haq, A.; Ali, S.; Ahmad, R.; Malik, Z.; Parveen, Z. Salt stress manifestation on plants, mechanism of salt tolerance and potassium role in alleviating it: A review. Zemdirb. Agric. 2016, 103, 229–238. [Google Scholar] [CrossRef]
  3. Mohsin, S.M.; Hasanuzzaman, M.; Bhuyan, M.H.M.B.; Parvin, K.; Fujita, M. Exogenous tebuconazole and trifloxystrobin regulates reactive oxygen species metabolism toward mitigating salt-induced damages in cucumber seedling. Plants 2019, 8, 428. [Google Scholar] [CrossRef] [PubMed]
  4. Mohsin, S.M.; Hasanuzzaman, M.; Nahar, K.; Hossain, M.S.; Bhuyan, M.H.M.B.; Parvin, K.; Fujita, M. Tebuconazole and trifloxystrobin regulate the physiology, antioxidant defense and methylglyoxal detoxification systems in conferring salt stress tolerance in Triticum aestivum L. Physiol. Mol. Biol. Plants 2020, 26, 1139–1154. [Google Scholar] [CrossRef] [PubMed]
  5. Hasanuzzaman, M.; Oku, H.; Nahar, K.; Bhuyan, M.H.M.B.; Mahmud, J.A.; Baluska, F.; Fujita, M. Nitricoxide-induced salt stress tolerance in plants: ROS metabolism, signaling, and molecular interactions. Plant Biotechnol. Rep. 2018, 12, 77–92. [Google Scholar] [CrossRef]
  6. Mohsin, S.M.; Hasanuzzaman, M.; Parvin, K.; Fujita, M. Pretreatment of wheat(Triticum aestivum L.) seedlings with 2,4-D improves tolerance to salinity-induced oxidative stress and methylglyoxal toxicity by modulating ion homeostasis, antioxidant defenses, and glyoxalase systems. Plant Physiol. Biochem. 2020, 152, 221–231. [Google Scholar] [CrossRef]
  7. Shafiq, S.; Akram, N.A.; Ashraf, M.; Arshad, A. Synergistic effects of drought and ascorbic acid ongrowth, mineral nutrients and oxidative defense system in canola (Brassica napus L.) plants. Acta Physiol. Plant. 2014, 36, 1539–1553. [Google Scholar] [CrossRef]
  8. Samarah, N.; Mullen, R.; Cianzio, S. Size distribution and mineral nutrients of soybean seeds in response to drought stress. J. Plant Nutr. 2004, 27, 815–835. [Google Scholar] [CrossRef]
  9. Mahesh, K.; Balaraju, P.; Ramakrishna, B.; Rao, S.S.R. Effect of brassinosteroids on germination and seedling growth of radish (Raphanus sativus L.) under PEG-6000 induced water stress. Am. J. Plant Sci. 2013, 4, 2305–2313. [Google Scholar] [CrossRef]
  10. Ashraf, M.; Akram, N.A.; Al-Qurainy, F.; Foolad, M.R. Drought tolerance: Roles of organic osmolytes, growth regulators, and mineral nutrients. In Advances in Agronomy; Sparks, D.L., Ed.; Academic Press: Burlington, ON, Canada, 2011; Volume 111, pp. 249–296. [Google Scholar]
  11. Türkan, I.; Demiral, T. Recent developments in understanding salinity tolerance. Environ. Exp. Bot. 2009, 67, 2–9. [Google Scholar] [CrossRef]
  12. Min, C.; Zhen, Y.; Jing, L.; Tingting, Z.; Xiaocen, W.; Hai, F.; Baoshan, W. Adaptation mechanism of salt excluders under saline conditions and its applications. Int. J. Mol. Sci. 2018, 19, 3668. [Google Scholar] [CrossRef]
  13. Liu, Q.Q.; Liu, R.R.; Ma, Y.C.; Song, J. Physiological and molecular evidence for Na+ and Cl exclusion in the roots of two Suaeda salsa populations. Aquat. Bot. 2018, 146, 1–7. [Google Scholar] [CrossRef]
  14. Asaf, S.; Khan, A.L.; Khan, M.A.; Imran, Q.M.; Yun, B.W.; Lee, I.J. Osmoprotective functions conferred to soybean plants via inoculation with Sphingomona sp. LK11 and exogenous trehalose. Microbiol. Res. 2017, 205, 135–145. [Google Scholar] [CrossRef]
  15. Trouvelot, S.; Heloir, M.C.; Poinssot, B.; Gauthier, A.; Paris, F.; Guillier, C.; Combier, M.; Trda, L.; Daire, X.; Adrian, M. Carbohydrates in plant immunity and plant protection: Roles and potential application as foliar sprays. Front. Plant. Sci. 2014, 5, 592. [Google Scholar] [CrossRef] [PubMed]
  16. Hasanuzzaman, M.; Bhuyan, M.H.M.B.; Zulfiqar, F.; Raza, A.; Mohsin, S.M.; Mahmud, J.A.; Fujita, M.; Fotopoulos, V. Reactive oxygen species and antioxidant defense in plants under abiotic stress: Revisiting the crucial role of a universal defense regulator. Antioxidants 2020, 9, 681. [Google Scholar] [CrossRef] [PubMed]
  17. Kosar, F.; Akram, N.A.; Sadiq, M.; Al-Qurainy, F.; Ashraf, M. Trehalose: A key organic osmolyte effectively involved in plant abiotic stress tolerance. J. Plant Growth. Regul. 2019, 38, 606–618. [Google Scholar] [CrossRef]
  18. Fatemeh, K.; Nasrin, M.; Khosro, P. Increment of abiotic stress tolerance by metabolic engineering of compatible solutes. Int. J. Agric. Crop Sci. 2012, 4, 1856–1866. [Google Scholar]
  19. Paul, M. Trehalose 6-phosphate. Curr. Opin. Plant Biol. 2007, 10, 303–309. [Google Scholar] [CrossRef]
  20. Ponnu, J.; Wahl, V.; Schmid, M. Trehalose-6-phosphate: Connecting plant metabolism and development. Front. Plant Sci. 2011, 2, 70. [Google Scholar] [CrossRef]
  21. Nezhadahmadi, A.; Prodhan, Z.; Faruq, G. Drought tolerance in wheat. Sci. World J. 2013, 13, 1–12. [Google Scholar] [CrossRef]
  22. Ashraf, M.; Akram, N.A. Improving salinity tolerance of plants through conventional breeding and genetic engineering: Ananalytical comparison. Biotechnol. Adv. 2009, 27, 744–752. [Google Scholar] [CrossRef] [PubMed]
  23. Shahbaz, M.; Abid, A.; Masood, A.; Waraich, E.A. Foliar-applied trehalose modulates growth, mineral nutrition, photosyntheticability, and oxidative defense system of rice (Oryza sativa L.) under saline stress. J. Plant Nutr. 2017, 40, 584–599. [Google Scholar] [CrossRef]
  24. Rohman, M.; Islam, M.; Monsur, M.B.; Amiruzzaman, M.; Fujita, M.; Hasanuzzaman, M. Trehalose protects maize plants from salt stress and phosphorus deficiency. Plants 2019, 8, 568. [Google Scholar] [CrossRef] [PubMed]
  25. Mittal, S.; Kumari, N.; Sharma, V. Differential response of salt stress on Brassica juncea: Photosynthetic performance, pigment, proline, D1 and antioxidant enzymes. Plant Physiol. Biochem. 2012, 54, 17–26. [Google Scholar] [CrossRef]
  26. Mahmud, J.A.; Hasanuzzaman, M.; Khan, M.I.R.; Nahar, K.; Fujita, M. β-Amino butyric acid pretreatment confers salt stress tolerance in Brassica napus L. by modulating reactive oxygen species metabolism and methylglyoxal detoxification. Plants 2020, 9, 241. [Google Scholar] [CrossRef]
  27. Alam, M.M.; Nahar, K.; Hasanuzzaman, M.; Fujita, M. Trehalose-induced drought stress tolerance: A comparative study among different Brassica species. Plant Omics 2014, 7, 271–283. [Google Scholar]
  28. Hasanuzzaman, M.; Nahar, K.; Rahman, A.; Inafuku, M.; Oku, H.; Fujita, M. Exogenous nitric oxide donor and arginine provide protection against short-term drought stress in wheat seedlings. Physiol. Mol. Biol. Plants 2018, 24, 993–1004. [Google Scholar] [CrossRef]
  29. Sadak, M.S. Physiological role of trehalose on enhancing salinity tolerance of wheat plant. Bull. Natl. Res. Cent. 2019, 43, 53. [Google Scholar] [CrossRef]
  30. Krasensky, J.; Broyart, C.; Rabanal, F.A.; Jonak, C. The redox-sensitive chloroplast trehalose-6-phosphate phosphatase AtTPPD regulates salt stress tolerance. Antioxid. Redox Signal. 2014, 21, 1289–1304. [Google Scholar] [CrossRef]
  31. Ozfidan-Konakci, C.; Yildiztugay, E.; Kucukoduk, M. Upregulation of antioxidant enzymes by exogenous gallic acid contributes to the amelioration in Oryza sativa roots exposed to salt and osmotic stress. Environ. Sci. Poll. Res. 2015, 22, 1487–1498. [Google Scholar] [CrossRef]
  32. Ahmad, P.; Jhon, R.; Sarwat, M.; Umar, S. Responses of proline, lipid peroxidation and antioxidative enzymes in two varieties of Pisum sativum L. under salt stress. Int. J. Plant Prod. 2008, 2, 353–366. [Google Scholar]
  33. Gill, S.S.; Anjum, N.A.; Gill, R.; Yadav, S.; Hasanuzzaman, M.; Fujita, M.; Mishra, P.; Sabat, S.C.; Tuteja, N. Superoxide dismutase—mentor of abiotic stress tolerance in crop plants. Environ. Sci. Pollut. Res. 2015, 22, 10375–10394. [Google Scholar] [CrossRef] [PubMed]
  34. Bhuyan, M.H.M.B.; Parvin, K.; Mohsin, S.M.; Mahmud, J.A.; Hasanuzzaman, M.; Fujita, M. Modulation of cadmium tolerance in rice: Insight into vanillic acid-induced upregulation of antioxidant defense and glyoxalase systems. Plants 2020, 9, 188. [Google Scholar] [CrossRef] [Green Version]
  35. Hasanuzzaman, M.; Bhuyan, M.H.M.B.; Anee, T.I.; Parvin, K.; Nahar, K.; Mahmud, J.A.; Fujita, M. Regulation of ascorbate-glutathione pathway in mitigating oxidative damage in plants under abiotic stress. Antioxidants 2019, 8, 384. [Google Scholar] [CrossRef] [PubMed]
  36. Gill, S.S.; Tuteja, N. Reactive oxygen species and antioxidant machinery in abiotic stress tolerance in crop plants. Plant Physiol. Biochem. 2010, 48, 909–930. [Google Scholar] [CrossRef] [PubMed]
  37. Ahmad, M.S.A.; Javed, F.; Ashraf, M. Iso-osmotic effect of NaCl and PEG on growth, cations and free proline accumulation in callus tissue of two indica rice(Oryza sativa L.) genotypes. Plant Growth Regul. 2007, 53, 53–63. [Google Scholar] [CrossRef]
  38. Mohsin, S.M.; Hasanuzzaman, M.; Parvin, K.; Hossain, M.S.; Fujita, M. Protective role of tebuconazole and trifloxystrobin in wheat (Triticum aestivum L.) under cadmium stress via enhancement of antioxidant defense and glyoxalase systems. Physiol. Mol. Biol. Plants 2021, 27, 1043–1057. [Google Scholar] [CrossRef] [PubMed]
  39. Lichtenthaler, H.K. Chlorophylls and carotenoids: Pigments of photosynthetic biomembranes. In Methods in Enzymology; Packer, L., Douce, R., Eds.; Academic Press: Cambridge, UK, 1987; pp. 350–382. [Google Scholar]
  40. Li, Z.G.; Luo, L.J.; Zhu, L.P. Involvement of trehalose in hydrogen sulfide donor sodium hydrosulfide induced the acquisition of heat tolerance in maize (Zea mays L.) seedlings. Bot. Stud. 2014, 55, 20. [Google Scholar] [CrossRef]
  41. Taulavuori, E.; Hellström, E.K.; Taulavuori, K.; Laine, K. Comparison of two methods used to analyze lipid peroxidation from Vaccinium myrtillus (L.) during snow removal, reacclimation and cold acclimation. J. Exp. Bot. 2001, 52, 2375–2380. [Google Scholar] [CrossRef]
  42. Yu, C.W.; Murphy, T.M.; Lin, C.H. Hydrogen peroxide-induces chilling tolerance in mung beans mediated through ABA-independent glutathione accumulation. Funct. Plant Biol. 2003, 30, 955–963. [Google Scholar] [CrossRef]
  43. Lechno, S.; Zamski, E.; Tel-Or, E. Salt stress-induced responses in cucumber plants. J. Plant Physiol. 1997, 150, 206–211. [Google Scholar] [CrossRef]
  44. Law, M.Y.; Charles, S.A.; Halliwell, B. Glutathione and ascorbic acid in spinach (Spinacia oleracea) chloroplasts. The effect of hydrogen peroxide and of paraquat. Biochem. J. 1983, 210, 899–903. [Google Scholar] [CrossRef] [PubMed]
  45. Bradford, M.M. A rapid and sensitive method for the quantitation of microgram quantities of protein utilizing the principle of protein-dye binding. Anal. Biochem. 1976, 72, 248–254. [Google Scholar] [CrossRef]
  46. Doderer, A.; Kokkelink, I.; VanderVeen, S.; Valk, B.; Schram, A.; Douma, A. Purification and characterization of two lipoygenase isoenzymes from germinating barley. Biochim. Biophys. Acta 1992, 112, 97–104. [Google Scholar] [CrossRef]
  47. El-Shabrawi, H.; Kumar, B.; Kaul, T.; Reddy, M.K.; Singla-Pareek, S.L.; Sopory, S.K. Redox homeostasis, antioxidant defense, and methylglyoxal detoxification as markers for salt tolerance in Pokkali rice. Protoplasma 2010, 245, 85–96. [Google Scholar] [CrossRef] [PubMed]
  48. Hasanuzzaman, M.; Alam, M.M.; Nahar, K.; Mohsin, S.M.; Bhuyan, M.H.M.B.; Parvin, K.; Hawrylak-Nowak, B.; Fujita, M. Silicon-induced antioxidant defense and methylglyoxal detoxification works coordinately in alleviating nickel toxicity in Oryza sativa L. Ecotoxicology 2019, 28, 261–276. [Google Scholar] [CrossRef]
  49. Nakano, Y.; Asada, K. Hydrogen peroxide is scavenged by ascorbate-specific peroxidase in spinach chloroplasts. Plant Cell Physiol. 1981, 22, 867–880. [Google Scholar]
  50. Mohsin, S.M.; Hasanuzzaman, M.; Parvin, K.; Fujita, M. Effect of tebuconazole and trifloxystrobin on Ceratocystis fimbriata to control black rot of sweet potato: Processes of reactive oxygen species generation and antioxidant defense responses. World J. Microbiol. Biotechnol. 2021, 37, 148. [Google Scholar] [CrossRef]
  51. Zasoski, R.J.; Burau, R.G. A rapid nitric-perchloric acid digestion method for multi-element tissue analysis. Commun. Soil. Sci. Plant Anal. 1977, 8, 425–436. [Google Scholar] [CrossRef]
Figure 1. Effect of trehalose and T6P on the appearance of wheat and mustard seedlings. Wheat seedlings were grown in a hydroponic solution containing 300 mM NaCl for 9 days. Mustard seedlings were grown in 200 mM NaCl for 10 days. For water deficit treatment, wheat seedlings were treated with 20% PEG, while mustard was treated with 12% PEG for four days. C, control; Tre, 200 µM trehalose; T6P, 200 µM trehalose 6-phosphate; S, NaCl treatment; D, water deficit treatment with PEG 6000.
Stresses 02 00024 g001
Figure 2. Effect of trehalose and T6P on TBARS, H2O2, and LOX activity in wheat and mustard seedlings. Wheat seedlings were grown in a hydroponic solution containing 300 mM NaCl for 9 days. Mustard seedlings were grown in 200 mM NaCl for 10 days. For water deficit treatment, wheat seedlings were treated with 20% PEG, while mustard was treated with 12% PEG for four days. C, control; (AC) wheat; (DF) mustard; Tre, 200 µM trehalose; T6P, 200 µM trehalose 6-phosphate; S, NaCl treatment; D, water deficit treatment with PEG 6000. Means were calculated from three replicates for each treatment, and the bars represent the standard deviation (±SD). Values with different letters are significantly different at p ≤ 0.05 by Fisher’s LSD test.
Stresses 02 00024 g002
Figure 3. Effect of trehalose and T6P on AsA, DHA, and AsA/DHA ratio in wheat and mustard seedlings. Wheat seedlings were grown in a hydroponic solution containing 300 mM NaCl for 9 days. Mustard seedlings were grown in 200 mM NaCl for 10 days. For water deficit treatment, wheat seedlings were treated with 20% PEG, while mustard was treated with 12% PEG for four days. C, control; (AC) wheat; (DF) mustard; Tre, 200 µM trehalose;T6P, 200 µM trehalose 6-phosphate; S, NaCl treatment; D, water deficit treatment with PEG 6000. Means were calculated from three replicates for each treatment, and the bars represent the standard deviation (±SD). Values with different letters are significantly different at p ≤ 0.05 by Fisher’s LSD test.
Stresses 02 00024 g003
Figure 4. Effect of trehalose and T6P on GSH, GSSG, and GSH/GSSG ratio in wheat and mustard seedlings. Wheat seedlings were grown in a hydroponic solution containing 300 mM NaCl for 9 days. Mustard seedlings were grown in 200 mM NaCl for 10 days. For water deficit treatment, wheat seedlings were treated with 20% PEG, while mustard was treated with 12% PEG for four days. C, control; (AC) wheat; (DF) mustard; Tre, 200 µM trehalose;T6P, 200 µM trehalose 6-phosphate; S, NaCl treatment; D, water deficit treatment with PEG 6000. Means were calculated from three replicates for each treatment, and the bars represent the standard deviation (±SD). Values with different letters are significantly different at p ≤ 0.05 by Fisher’s LSD test.
Stresses 02 00024 g004
Figure 5. Effect of trehalose and T6P on the activities of SOD, CAT, GPX, and GST in wheat and mustard seedlings. Wheat seedlings were grown in a hydroponic solution containing 300 mM NaCl for 9 days. Mustard seedlings were grown in 200 mM NaCl for 10 days. For water deficit treatment, wheat seedlings were treated with 20% PEG, while mustard was treated with 12% PEG for four days. C, control; (AD) wheat; (EH) mustard; Tre, 200 µM trehalose; T6P, 200 µM trehalose 6-phosphate; S, NaCl treatment; D, water deficit treatment with PEG 6000. Means were calculated from three replicates for each treatment, and the bars represent the standard deviation (±SD). Values with different letters are significantly different at p ≤ 0.05 by Fisher’s LSD test.
Stresses 02 00024 g005
Figure 6. Effect of trehalose and T6P on the activities of APX, MDHAR, DHAR, and GR in wheat and mustard seedlings. Wheat seedlings were grown in a hydroponic solution containing 300 mM NaCl for 9 days. Mustard seedlings were grown in 200 mM NaCl for 10 days. For water deficit treatment, wheat seedlings were treated with 20% PEG, while mustard was treated with 12% PEG for four days. C, control; (AD) wheat; (EH) mustard; Tre, 200 µM trehalose; T6P, 200 µM trehalose 6-phosphate; S, NaCl treatment; D, water deficit treatment with PEG 6000. Means were calculated from three replicates for each treatment, and the bars represent the standard deviation (±SD). Values with different letters are significantly different at p ≤ 0.05 by Fisher’s LSD test.
Stresses 02 00024 g006
Figure 7. Effect of trehalose and T6P on the contents of Na and K and the K/Na ratio in shoots and roots of wheat and mustard seedlings. Wheat seedlings were grown in a hydroponic solution containing 300 mM NaCl for 9 days. Mustard seedlings were grown in 200 mM NaCl for 10 days. For water deficit treatment, wheat seedlings were treated with 20% PEG, while mustard was treated with 12% PEG for four days. C, control; (AF) wheat; (GL) mustard; Tre, 200 µM trehalose; T6P, 200 µM trehalose 6-phosphate; S, NaCl treatment; D, water deficit treatment with PEG 6000. Means were calculated from three replicates for each treatment, and the bars represent the standard deviation (±SD). Values with different letters are significantly different at p ≤ 0.05 by Fisher’s LSD test.
Stresses 02 00024 g007
Figure 8. Effect of trehalose and T6P on the contents of Ca and Mg in shoots and roots of wheat and mustard seedlings. Wheat seedlings were grown in a hydroponic solution containing 300 mM NaCl for 9 days. Mustard seedlings were grown in 200 mM NaCl for 10 days. For water deficit treatment, wheat seedlings were treated with 20% PEG, while mustard was treated with 12% PEG for four days. C, control; (AD) wheat; (EH) mustard; Tre, 200 µM trehalose; T6P, 200 µM trehalose 6-phosphate; S, NaCl treatment; D, water deficit treatment with PEG 6000. Means were calculated from three replicates for each treatment, and the bars represent the standard deviation (±SD). Values with different letters are significantly different at p ≤ 0.05 by Fisher’s LSD test.
Stresses 02 00024 g008
Figure 9. Pearson’s correlations between various parameters (n = 32)of hydroponically grown nine−day−old wheat and ten-day-old mustard seedlings under salt (300 and 200 mM NaCl, respectively) and water deficit (20 and 12% PEG, respectively) stresses for four days with or without Tre and T6P. Chl (chlorophyll), Car (carotenoid), Tre (trehalose), TBARS (malondialdehyde), H2O2 (hydrogen peroxide), AsA (ascorbic acid), DHA (dehydroascorbate), GSH (reduced glutathione), GSSG (oxidized glutathione), LOX (lipoxygenase), CAT (catalase), SOD (superoxide dismutase), APX (ascorbate peroxidase), MDHAR (monodehydroascorbate reductase), DHAR (dehydroascorbate reductase), GR (glutathione reductase), GPX (glutathione peroxidase), GST (glutathione S-transferase), Na (sodium), K (potassium), Ca (calcium), and Mg (magnesium).
Stresses 02 00024 g009
Table 1. Effect of trehalose and T6P on leaf chlorophyll a, chlorophyll b, chlorophyll (a + b), and carotenoid contents in wheat seedlings. Seedlings were grown in a hydroponic solution containing 300 mM NaCl for 9 days. For water deficit treatment, wheat seedlings were treated with 20% PEG for four days. Means were calculated from three replicates for each treatment, and the bars represent the standard deviation (±SD). Values with different letters are significantly different at p ≤ 0.05 by Fisher’s LSD test.
TreatmentsChlorophyll a Content
(mg g−1 FW)
Chlorophyll b Content
(mg g−1 FW)
Chlorophyll (a + b) Content
(mg g−1 FW)
Carotenoid Content
(mg g−1 FW)
Trehalose Content (µmol g–1 FW)
No stressC9.21 ± 0.29 a4.99 ± 0.16 a14.20 ± 0.26 a6.07 ± 0.25 a10.99 ± 0.59 e
Tre8.13 ± 0.22 bc4.13 ± 0.43 c12.26 ± 0.23 c5.18 ± 0.22 bc11.82 ± 0.72 de
T6P8.46 ± 0.19 b4.58 ± 0.19 b13.04 ± 0.03 b5.53 ± 0.08 b11.48 ± 0.49 e
SalinityS3.14 ± 0.41 g1.32 ± 0.19 f4.45 ± 0.51 i1.36 ± 0.15 g15.11 ± 0.51 b
S + Tre4.11 ± 0.26 f1.60 ± 0.08 f5.72 ± 0.26 h1.81 ± 0.19 f16.97 ± 0.71 a
S + T6P4.52 ± 0.36 f2.06 ± 0.13 e6.58 ± 0.43 g2.07 ± 0.12 f15.93 ± 0.40 ab
Water deficitD6.34 ± 0.30 e2.32 ± 0.23 e8.67 ± 0.37 f3.38 ± 0.17 e12.97 ± 1.02 cd
D + Tre6.94 ± 0.43 d3.03 ± 0.19 d9.96 ± 0.40 e4.49 ± 0.32 d15.15 ± 0.67 b
D + T6P7.79 ± 0.30 c3.29 ± 0.19 d11.08 ± 0.23 d5.02 ± 0.23 c13.70 ± 0.72 c
Here, C, control; Tre, 200 µM trehalose; T6P, 200 µM trehalose 6-phosphate; S, NaCl treatment; D, water deficit treatment with PEG 6000.
Table 2. Effect of trehalose and T6P on leaf chlorophyll a, chlorophyll b, chlorophyll (a + b), and carotenoid contents in mustard seedlings. Seedlings were grown in a hydroponic solution containing 200 mM NaCl for 10 days. For water deficit treatment, wheat seedlings were treated with 12% PEG for four days. Means were calculated from three replicates for each treatment, and the bars represent the standard deviation (±SD). Values with different letters are significantly different at p ≤ 0.05 by Fisher’s LSD test.
TreatmentsChlorophyll a Content
(mg g−1 FW)
Chlorophyll b Content
(mg g−1FW)
Chlorophyll (a + b) Content
(mg g−1 FW)
Carotenoid Content
(mg g−1 FW)
Trehalose Content (µmol g–1 FW)
No stressC4.89 ± 0.18 b2.06 ± 0.08 b6.99 ± 0.20 b3.46 ± 0.16 b6.04 ± 0.44 de
Tre5.16 ± 0.15 b2.19 ± 0.10 b7.28 ± 0.15 b3.68 ± 0.10 ab6.64 ± 0.67 cd
T6P5.80 ± 0.21 a2.53 ± 0.13 a8.26 ± 0.24 a3.83 ± 0.12 a6.33 ± 0.66 de
SalinityS2.47 ± 0.16 f1.10 ± 0.10 f3.61 ± 0.20 f1.93 ± 0.12 g4.90 ± 0.47 f
S + Tre2.66 ± 0.14 f1.27 ± 0.08 e4.13 ± 0.17 e2.12 ± 0.10 fg5.81 ± 0.34 de
S + T6P3.69 ± 0.19 d1.44 ± 0.05 d5.13 ± 0.16 d2.29 ± 0.10 ef5.55 ± 0.50 ef
Water deficitD3.08 ± 0.15 e1.22 ± 0.11 ef4.23 ± 0.20 e2.47 ± 0.15 e7.41 ± 0.45 bc
D + Tre3.42 ± 0.19 d1.56 ± 0.07 d5.22 ± 0.17 d2.81 ± 0.11 d8.79 ± 0.33 a
D + T6P4.44 ± 0.22 c1.76 ± 0.10 c6.23 ± 0.25 c3.23 ± 0.13 c8.07 ± 0.44 ab
Here, C, control; Tre, 200 µM trehalose; T6P, 200 µM trehalose 6-phosphate; S, NaCl treatment; D, water deficit treatment with PEG 6000.
Publisher’s Note: MDPI stays neutral with regard to jurisdictional claims in published maps and institutional affiliations.

