Abstract
The importance of legume crops in global agricultural systems is inevitable; conversely, less than 4% of European agricultural lands are dedicated for these plants. Besides total loss of biodiversity, agrobiodiversity is also in danger. The production of legumes diversifies arable plant production and supports the nutrient management of the agroecosystem, as well as that of the whole ecosystem. Increasing soybean production area means that other pulses are grown on smaller areas, that means a reduced resiliency of the whole production system. Expanding environmental stresses of climate change and intensive agricultural practices are easier to counteract with help of diversity on species and on genetic level as well. As a consequence of climate change and targeted breeding of the last decade, agricultural lands appropriate for soybean production shows an increase in Europe. The self-sufficiency rates of the European Union concerning single protein sources shows fluctuations. The easier utilization of soy-based products as forage displaces the use of other pulses, which are traditionally produced as protein crops. Besides protein flow, these leguminous plants have an important role in different levels of agricultural systems as well. Several recent initiatives aim to reduce the serious protein exposure of the EU. These programs, beyond the introduction and technological development of soybean production, always mention the strengthening of the role of other pulses. In this study, the last decades of EU pulse utilization were analyzed, using crop yield, crop harvested area, certified seed yield, seed production area, number of registered varieties, and the number of scientific publications as indicators to summarize trends of EU field bean, field pea, lupin, chickpea, lentil, and soybean production in the view of targeted protein initiatives.
1. Introduction
Belonging to the group of leguminous plants, pulses are annual crops that yield 1 to 12 seeds or grains in their pods. The size, color, shape and pattern of seeds shows high variance; they are utilized both for food and feed. Food and Agriculture Organization (FAO) defines “pulses’’ as those harvested exclusively for dry grain [1]. It excludes those crops that are harvested in green stage and used for food, such as green peas and green beans; these belong to the group of vegetable crops. Crops used for oil production, such as soybean and groundnuts, are also excluded; other leguminous crops used for sowing, such as clover and alfalfa, are also not classified here. Lentils, beans, peas, and chickpeas belonging to the group of pulses have a high importance in the general food basket, because they provide plant-based proteins and amino acids both for human and animal consumption worldwide [2]. Additionally, pulses have similar advantages in agricultural production with other leguminous plants. Their nitrogen fixation ability can support soil fertility and nutrient management [3].
The inclusion of legumes in the crop rotation contributes to the reduction in mineral and organic nitrogen sources, which are responsible for 25% of EU agricultural greenhouse gas emissions [4]; this enables up to 60 kg N ha−1 less fertilizer use [5]. Grain legume-based crop rotations are comparable with crop rotations excluding these crops, in terms of cost savings, especially in reduced tillage systems [5]. The long-term application of legumes has an outstanding positive effect on soil parameters [6]. Soil organic carbon (SOC) in the soil has an essential role when carbon exchange, soil conditions, and plant development is concerned, hence it must be taken into account, when global climate models are calculated as far as differences in agricultural production systems have higher impact on SOC than changes in climate [7]. Legumes as pre-crops are capable of increasing the yield of the following crops up to 10%; such positive trends were observed in the case of wheat, maize, and rapeseed, in comparison with rotations where cereals were the pre-crops [8]. Leguminous pre-crops can also contribute to the quality of cereals in terms of increasing protein content and lowering mycotoxin contamination [9].
Besides yield increase and quality enhancement, pulses provide additional advantages for farmers and local communities in an agroecosystem. Having a higher yield security, they can contribute to avoiding total crop losses or territorial underutilization in agricultural systems [10]. Pulses are good raw materials for food processing and promising alternatives to solve several challenges of the food industry [11]; their storability is much better than that of vegetables and fruits, especially when dried. Due to their high attractiveness to bees, and their ability to provide shelter to various wildlife animals, their contribution to the biodiversity of low-input agricultural systems is inevitable [5]. The by-products of pulses can be utilized for animal feeding, thus increasing food security. Their straw and other plant parts left on the field after harvesting can be ideal for ruminants as feedstuffs due to their protein and energy content [12]. When used as high-quality feed or fodder, pulses can contribute to milk and meat production as well. The promotion of pulses in agricultural production supports the efforts to decrease cereal and soybean content of feedstuff in intensive livestock systems [3].
Field bean (Vicia faba L.) is one of the most ancient food crops worldwide [13]. Soybean (Glycine max (L.) Merr.) is considered as the first and peas (Pisum sativum L.) are the second in the importance row of all feed legumes but broad bean follows them as the third one. Broad beans’ feeding value is based on both its protein and energy content, because of the high starch content, which is almost as high as in cereals, i.e., in barley. Among the several varieties, those small-seeded ones are preferred in animal husbandry, as they have limited vicine-convicine, tannin, and trypsin inhibitor substances [13]. Broad bean is a prospective choice to substitute soybean in European protein feeding; however, its amino-acid content is less complete [14,15]. Broad beans are an ideal protein and energy source in a husbandry diet, and it is easily accepted by ruminants because of its tasty features. Though the protein degradation in rumen is considerably rapid and provides sources mainly for microbe populations and the transformation losses are significant, it can be reduced by appropriate actions. Simple heat treatment will change the degradation percentage [16] and using extrusion has better results in an undegradable protein rate than in the case of soybean meal treatments, so it is more valuable than the other alternative pulse crops such as pea or lupin [17]. Broad bean seeds are a perfect protein and energy source for dairy cows and in pig farming during the finishing period. Daily ration for both species can contain up to 30% well treated seeds mixed in, but should be kept at 10% as the maximum limit in sow diet. Glycosides-free varieties of broad beans, especially in processed form, are ideal for any poultry diet. The daily ration must not exceed 20% in laying hen and meat chicken diet [3].
Peas (Pisum sativum L.) are rich (22–24%) in protein therefore they could serve as a substantial component of animal nutrition. Protein content of peas is higher than cereals’ but lower than oil seeds’. Regarding amino acid composition of peas, though it is well-balanced in lysine, it is poor in cysteine and methionine, which could cause problems for the species where sulphur-containing amino acids are essential ones [18]. Peas are high in starch and relatively low in fiber. Decreasing antinutritive compounds in peas such as trypsin inhibitors and tannins is the goal of many plant breeders. New cultivars of “protein peas” are tannin-free and low in trypsin inhibitors, so they could serve even in unprocessed form as a good, digestible protein source for monogastrics as well [19]. Peas can be part of the diet of dairy cattle with a maximum of 25%, 30% for steers for dairy cattle, 50% for dairy calves, and as a 100% source of protein for dairy heifers. Diet of sheep may contain a maximum of 20% and goats’ diet up to 15% of peas. Extrusion of peas improve their digestibility. In a pig starter diet, raw pea seeds should be used at a maximum of 10%, which can be increased up to 20% when it is extruded. With otherwise well-balanced amino-acid composition, ground raw peas could serve as the only source of protein in growing-finishing pigs’ diet. In case of meat chicken and laying hen, peas can give 30% of their diet, provided that it is balanced with synthetic amino acids [3].
Chickpea (Cicer arietinum L.) is an important legume in the Mediterranean Region, Asia, and Australia [3]. Worldwide it is the fourth largest pulse crop [20]. Concerning its production, chickpea needs lower manpower and external inputs than cereals [3]. Around 90% of chickpea is grown worldwide under rainfed conditions. On the basis of drought-induced decrease in yield, chickpea was the seventh from 13 examined legumes [21]. Lysine content of peas is markedly high, together with cysteine and methionine, and the threonine content may be deficient for monogastrics. Chickpea serves as a good source of minerals and vitamins [22,23]. The dietary value of chickpea for poultry and pigs is limited by trypsin and chymotrypsin inhibitors. The amount of these inhibitors depends on the genotype of chickpea. Its byproduct, the chickpea straw, has high nutritive values and can be fed by ruminants. One of the most important values of chickpea is that it can replace soybean meal and maize grain in ruminant diets with a maximum of 50% of the concentrate. In the case of pigs, chickpeas can be used in the diets of growing and finishing pigs with a maximum of 30% when extruded and 10–15% when it is in raw form. For a starter diet of pigs, the maximum amount of raw chickpea is 5–10%. For meat chickens and laying hens, daily dosage of heat processed chickpea shall not exceed 20% [3]. Chickpea could be one of the main alternative species substitute soybeans especially in arid circumstances, because of its better drought tolerance and the protein complexity. [24]
Water stress is one of the main challenges for the future farming. Comparing soybean, chickpea, and field peas it is found that soybean is less adaptive to drought by its root system than the other ones. It is in the upper 23 cm layer, under irrigated or rainfed conditions equally, but chickpea and field peas have deeper root systems. Thirty-four percent of the total root mass was below the upper layer in dry conditions and just 80% was found here under wet conditions [25]. In spite of better drought tolerance of field peas, it cannot compete with soybean on soils with higher salt concentration because pea is more sensitive to it, showed by shorter roots and less yield [26]. Dietary value of species of Lupinus genus is very varied, because several of them can be toxic to humans and animals. Alkaloids make their seed not only lightly toxic but make the taste unpalatable. It was Germany in the 1920′s where the first alkaloid-free varieties were selected and used as “sweet lupine”. These types can be part of humans’ or livestock’s daily diet without previous limitations [27]. Three species of lupins are cultivated for animal feeding worldwide. White lupin (Lupinus albus L.), blue lupin (Lupinus angustifolius L.), and yellow lupin (Lupinus luteus L.) species originated from the Mediterranean area [28]. Australia, Japan, Korea and several other Asian and European countries commonly use blue lupin in intensive animal farms even at an industrial level [29]. Lupin seeds are ideal for feeding to a wide range of animal husbandry because of their rich nutritional content [30]. Lupins are counted as significant protein sources but also have considerable lipid, mineral, and vitamin content. In addition to its nutritional value, they are rich in dietary fibers as well [31]. It is highly important to use non-toxic, alkaloid free cultivars so the current breeding programs are focused on selecting varieties with almost zero alkaloid content. Most modern lupin cultivars are cultivated as alkaloid-free types for feeding and for human consumption [32]. In contrast with soybean, studies proved that white lupin can uptake phosphorus from the soil with a higher rate, which is presumably based on lupin’s better arbuscular mycorrhiza symbiosis [33].
Lentil (Lens culinaris Medik.) is one of the oldest crops. Archeological excavations proved that it was cultivated and used for consumption more than 8500 years ago. Lentil’s edible seeds are mainly used for human diet but as a short annual crop, it has animal feeding value as well [34]. Lentils have high importance in India and all in the Middle East region in human diet; however, it is just at the sixth position in the worldwide ranking of pulses [35]. However, lentil is known as a pulse for higher humidity areas, studies were conducted that found it is worth selecting the current varieties on drought tolerance, and worth starting new plant breeding projects on enhanced drought tolerant ones [36]. Other studies found a strong connection between drought and heat tolerance; therefore, these selected varieties could work even in arid zones as well [37]. Lentil, like most of the other pulses, has anti-nutritional factors in the seeds, but they are traditionally inactivated by heat treatment or nowadays by microwave cooking [38]. During these processes, nutritional value will be increased [39]. Ruminants usually utilize lentil seeds and all the by-products effectively in daily rations. The straw is a valued feeding stuff for small ruminants (for goats and sheep). Lentil seeds are applicable up to 10% in pig diets during the finishing period, but in meat chicken daily rations can be doubled up to 20 %. However, it is not suggested to use it in laying hen rations. Omnivore species need a more balanced amino-acid supply than is found in lentil seeds, so crystalline amino-acid additives are recommended in pig and poultry farming diets [3].
In Europe, the role of grain legume plants was significant in human nutrition until the mid-20th century. The source of protein intake changed strongly with the increase in meat consumption. From the 1980s, soybeans and peas became the two most commonly grown protein crops for animal feed. There was an ongoing decline in legume production in Europe explained by a relative economic uncompetitiveness compared to more profitable crops such as cereals and the cheaper and full protein valued import soybeans and soy flour [40]. The EU’s self-sufficiency rates vary significantly when different protein sources are investigated. The EU depends on the annual import of approximately 17 million tons of crude proteins, which consists mainly of soy-based products—13 million tons, that is equal to 30 million tons soybean equivalent [41]. Soybean is the most expansively cultivated legume on the globe. Soybean meal is one of the most important feed ingredients used for animal feeding. It is widely believed that soybean is a relatively new crop in Europe; since its introduction 150 years ago, it has become the leading protein plant and one of the most ubiquitous crops in Europe. Accordingly, soybean harvest areas in the last two decades show a steep increase. European yields are as high as in the USA or in Brazil [41].
To intensify European soybean production, the Donau Soja Organization was founded in Vienna in 2012 with the aim to contribute to the development of European agricultural and food business through the intensification of soybean production for European utilization. The organization aims to support regional soybean production following a certain set of quality criteria [42]. In 2017, 14 European countries signed a declaration about supporting sustainable soybean and other legumes production in European regions, where profitable production is feasible. The organization encourages the use of locally adapted leguminous species and varieties in a sustainable system [42].
There are large fields in central and eastern Europe, which are suitable for protein crop production; instead, these are utilized very extensively with the production of a very low number of crops. Integrating protein plants, such as soybeans, field peas, or field beans, the biodiversity of agricultural fields can be enhanced, and the product can provide livestock feed as well. This could reduce feed import demands and enhance rural development. In 2017, the European Protein Plan was introduced with the goal to increase the area and yield of protein plants and, at the same time, decrease the protein dependency of the European Union. At EU member states level, breeding programs and developments in production technology were initiated [43].
The aim of the present study is to investigate the success of protein programs on pulse production diversification levels so far, using the number of scientific publications, the number of registered varieties, and the changes of seed production areas as indicators. Numbers and registration year of newly registered pulse varieties were collected based on the European Plant Database [44] and were analyzed for setting conclusions and recommendations.
2. Results
2.1. Scientific Articles Dealing with Leguminous Plants
Except for lupin, there is an exponential increase with a good fit in the number of published articles dealing with the investigated crop species and indexed by ScienceDirect (accessed on 11 November 2021) [45] in the period of 1999–2021 (Figure 1). The incline seems to be more intense in the last decade. The extent of increasing is different in the case of soybean and other pulses; the growth of the latter is less steep. The most actively studied species in this comparison is soybean with over 14,000 papers in 2021, followed by field bean and field pea with two-thirds and three-fourths less papers, respectively.
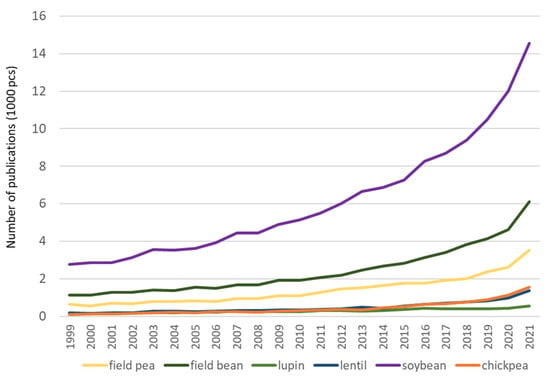
Figure 1.
Number of scientific publications dealing with field peas, field bean, lupin, lentil, and soybean indexed by ScienceDirect [45] (accessed on 11 November 2021).
2.2. Harvested Area and Yield of Pulses
Concerning the data of the last 40 years, harvest areas of field pea show a permanent decrease within the EU, contrary to the production areas of soybean (Figure 2). Other protein crops show only moderate increases.
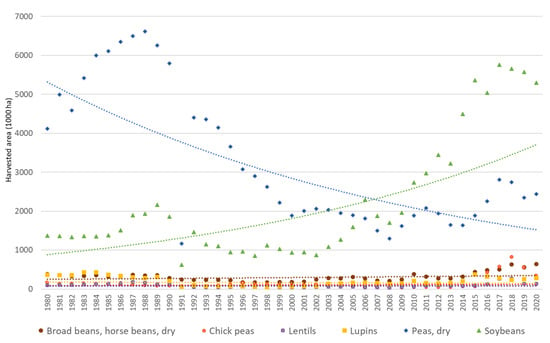
Figure 2.
Harvested area of protein crops and soybean in the EU between 1980–2020 [35].
In contrast to area changes, average yield of the investigated crops shows a constant increase (Figure 3). This could be the result of technological developments and breeding work. The most significant rise is experienced in the case of soybean.
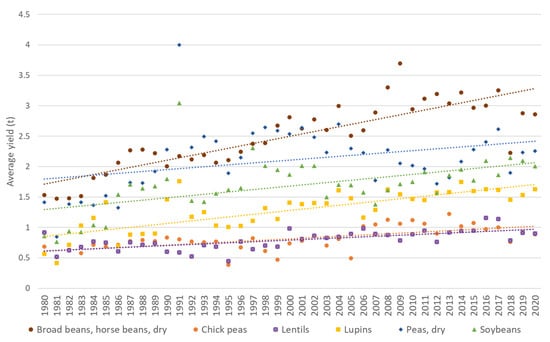
Figure 3.
Average yield of protein crops and soybean in the EU between 1980–2020 [35].
2.3. Number of Registered Leguminous Varieties
On 11 November 2021 there were a total of 579 soybean, 387 field pea, 156 field bean, and 30 white lupin varieties listed in the EU Plant variety database [44] (Figure 4). From the individual national catalogues, we found 72 varieties from chickpea and 14 varieties from lentil. At the country level, Italy has the largest number of varieties of other pulses and soybean together. France also has almost 160 registered varieties. At the EU level, there is a high number of varieties which are registered in more than one country (common).
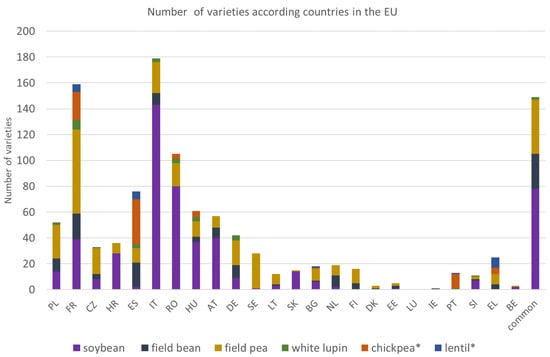
Figure 4.
Number of varieties registered on the national variety lists of EU countries in 2021 [44]. Legend: * data from individual national catalogues; common: varieties registered in the national variety list of more than one country (overlapping).
2.4. Field Pea
In the last twenty years, the sum of harvested area of field peas has not changed significantly in the European Union (Figure 5), but the distribution between countries has [46]. In 2000, the most important field pea producers were France and Germany. Since then, in both countries, the area has halved. Furthermore, Austria has lost a big ratio from field pea production. The new leading countries in the production are Spain, Romania, and Lithuania.
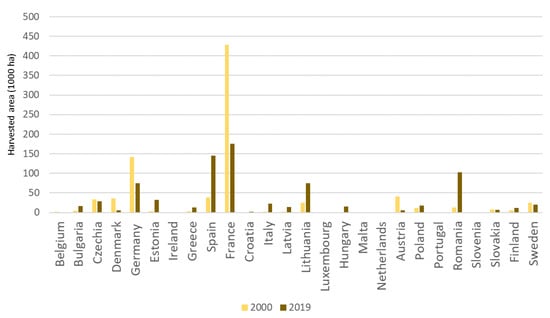
Figure 5.
Harvested area of field pea in EU countries in 2000 and 2019 [46].
Regarding the number of field pea varieties (Figure 6), France still maintains the leading role. By production area, Sweden and Poland are not the most important countries but are leaders by the number of varieties. According to the available data, Lithuania has only eight unique varieties on the list, but has another 14 in common with other countries.
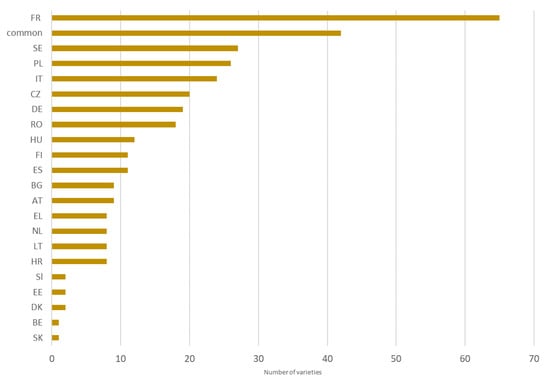
Figure 6.
Number of field pea varieties in EU countries [44].
When the data regarding new varieties registered in consecutive years is explored (Figure 7), it can be observed that there are only two field pea varieties accepted in the 1960s and four varieties in the 70s. Field pea production has long traditions in European countries, so the breeding and variety use shows this continuity. In 2018, the EU introduced the new Protein Plan which could have influenced the high number of new variety registrations in 2019.
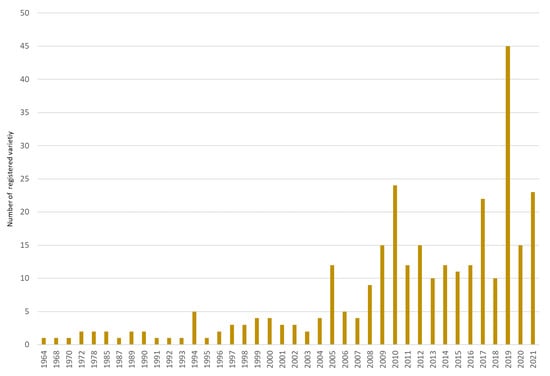
Figure 7.
Number of field pea varieties according to registration year from the national variety lists of the EU member states [47,48,49,50,51,52,53,54,55,56,57,58,59,60,61,62,63,64].
The areas for field pea seed production show high fluctuations over the last 20 years (Figure 8). Between 2005 and 2015, it did not reach 30,000 hectares, then the production started to rise. The amount of certified seeds follows the changes in the production area. The leading seed producers are Czechia, Denmark, France, Germany, Spain, and Romania. Since 2012, two Baltic countries, Estonia and Lithuania are catching up.
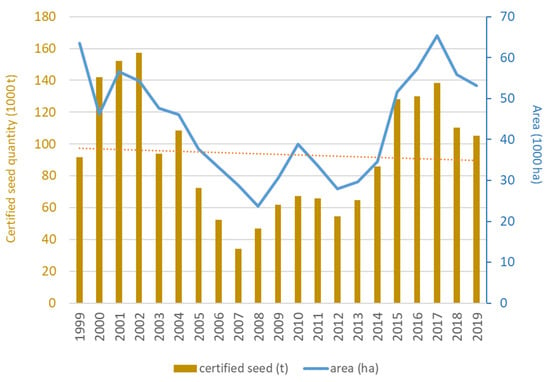
Figure 8.
Area of field pea seed production and amount of certified seeds between 1999–2019 in the EU member states [65].
2.5. Field Bean
The importance of field beans has increased in the last twenty years. Important countries such as France, Italy, Germany, and Poland have managed to increase the production area in this period. New member states, such as Lithuania, Finland, and Sweden, have entered the group of production leaders since 2000. There are three countries where the production has decreased in comparison with the data 20 years before: Portugal, Romania, and Croatia (Figure 9).
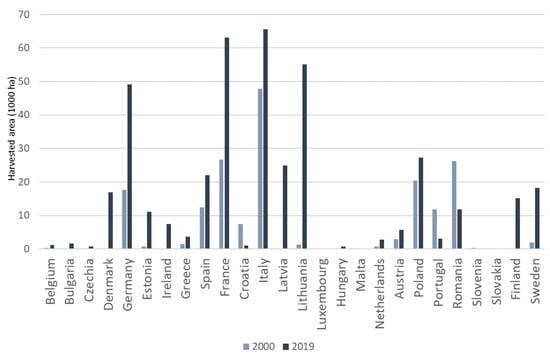
Figure 9.
Harvested area of field bean in EU countries in 2000 and 2019 [46].
Comparing the order in production area and number of varieties, similarities cannot be observed: the highest number of varieties can be found in the French national list. Regarding production area, Italy and Lithuania would be expected to have a higher number of varieties, but Italy is in the midfield, Lithuania is at the end. It should be added that among common varieties registered on more than one national list, there are 14 varieties from Lithuania (Figure 10 and Figure 11).
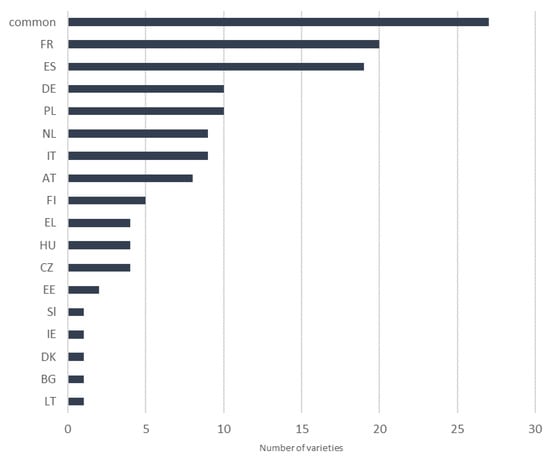
Figure 10.
Number of field bean varieties in EU countries [44]. Tendencies of new variety registrations are similar to those of the field pea (Figure 11). There are some old varieties on the list and the highest number of varieties was found in 2019.
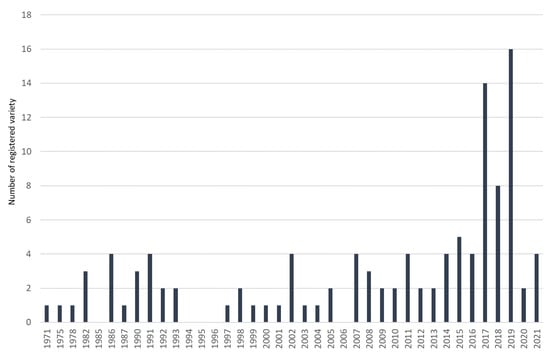
Figure 11.
Number of field bean varieties according to registration year from the national variety lists of the EU member states [47,48,49,50,51,52,53,54,55,56,57,58,59,60,61,62,63,64].
Seed production area of field bean has been constantly increasing in the EU countries since 1999, with the amount of certified seed showing an exponential increase as well (Figure 12). The largest increase was the seed production area in 2016 and 2017, exceeding 20,000 hectares. The most important seed producer countries traditionally are Czechia, France, Italy, Poland, and Sweden. In 2019, more than 3000 hectares were registered in Finland and in Ireland for seed production, in contrast with the previous years, when the registered area was negligible.
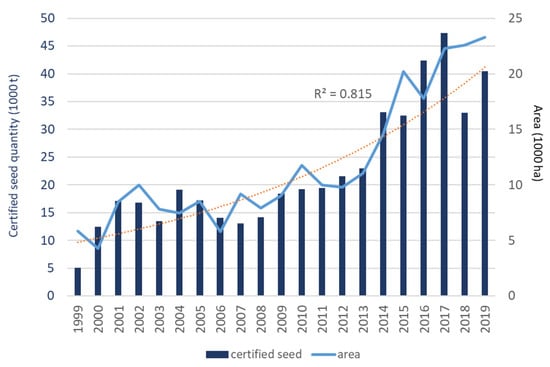
Figure 12.
Area of field bean seed production and amount of certified seed between 1999–2019 in the EU member states [65].
2.6. Lupins
Both FAOSTAT, EUROSTAT, and European Seed Certfication Agencies Association (ESCAA) databases contain data about Lupins as aggregated at genus level, but no separate data were found for individual species. White lupin has the greatest importance as fodder; therefore, variety data collection was limited to this crop.
There are only a few countries in the EU where sweet lupins are produced. In the last twenty years, the production area in France and Spain has decreased, while in Germany, Greece and especially Poland an increase can be observed (Figure 13).
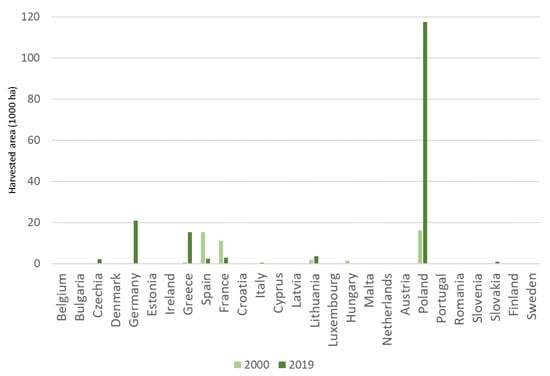
Figure 13.
Harvested area of sweet lupin in EU countries in 2000 and 2019 [46].
Despite the decreasing area, France still has the highest number of varieties of white lupin. Looking at the diversity of variety numbers, there are only a few ones present in the European Union (Figure 14).
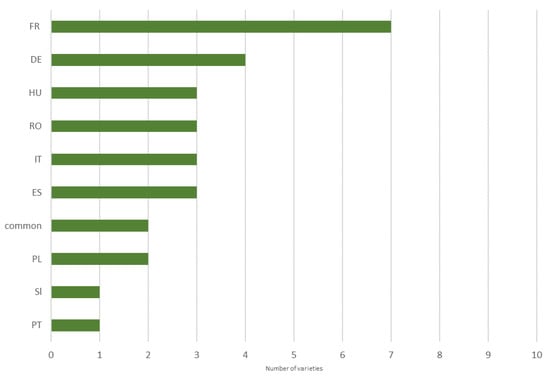
Figure 14.
Number of white lupin varieties in EU countries [44].
The effect of the European Protein Plan can be observed by the registration of new white lupin varieties as well. In 2019 and in 2020, more than two new varieties were registered (Figure 15).
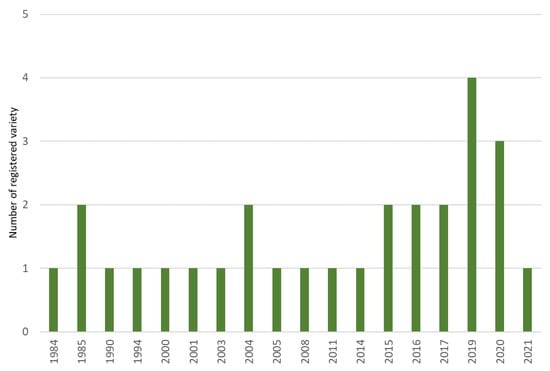
Figure 15.
Number of white lupin varieties according to registration year from the national variety lists of the EU member states [47,48,49,50,51,52,53,54,55,56,57,58,59,60,61,62,63,64].
Eighty-five percent of EU lupin seed production areas are located in Germany and Poland (Figure 16). Gradually, lower areas are used for this purpose in France. Regarding the registered seed production areas, no permanent growth is seen, the yearly data are changeable. The amount of certified seed shows a moderate exponential decrease.
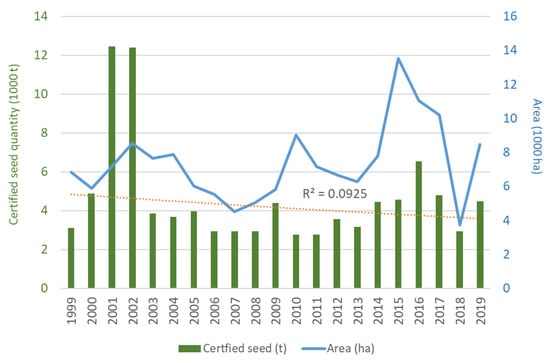
Figure 16.
Area of lupins seed production and amount of certified seed between 1999–2019 in the EU member states [65].
2.7. Chickpea and Lentil
In the Eurostat database, chickpea and lentil are not presented separately, but included in the group ‘other pulses’. Therefore, the data of FAOSTAT from 2000 and 2017 were used for analysis. There are eight countries in the European Union where chickpea was produced, mainly from the southern region. Between the two years an increase can be observed (Figure 17).
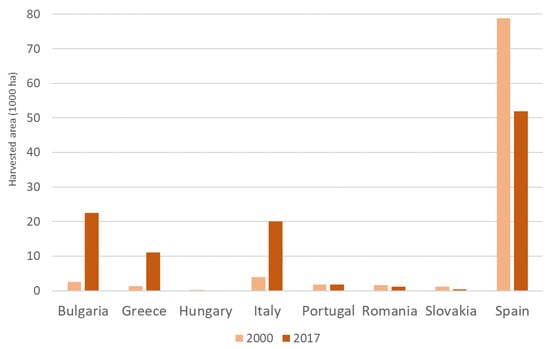
Figure 17.
Harvested area of chickpea in EU countries in 2000 and in 2017 [35].
The harvest area of lentil is the lowest among the investigated crops (Figure 18). Between 2000 and 2017, a growth was experienced even in the case of leading producer countries, such as France and Spain. New countries, such as Greece and Italy, seem to intensify lentil production.
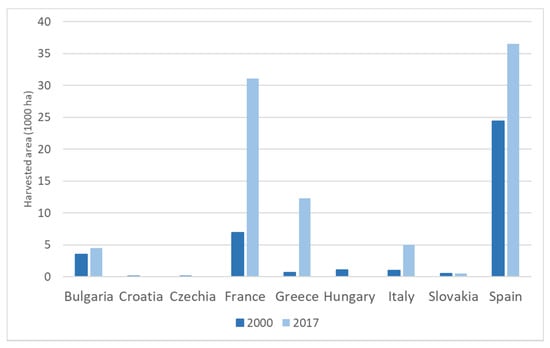
Figure 18.
Harvested area of lentil in EU countries in 2000 and in 2017 [35].
According to available datasets, it can be seen that lentil production is negligible in EU countries. Chickpea production is increasing, and the number of varieties is also higher, even exceeding that of white lupin (Figure 19).
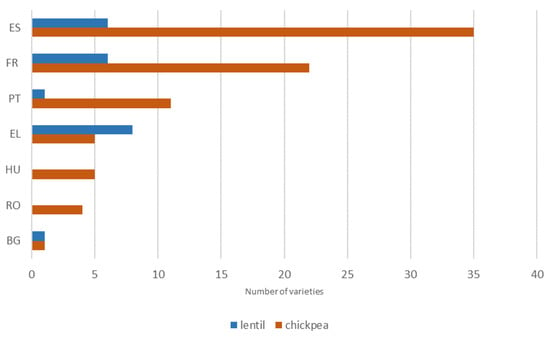
Figure 19.
Number of chickpea varieties in EU countries [47,48,49,50,51,52,53,54,55,56,57,58,59,60,61,62,63,64].
Seed production areas for chickpea in the EU show an eight-fold increase in the last 20 years (Figure 20). Similarly, the amount of certified seed follows a steep increase. The leading chickpea producer countries are traditionally the Mediterranean countries: France, Italy, and Spain. Hungary is a constant, but low volume presence; Greece joined the producers in the last five years.
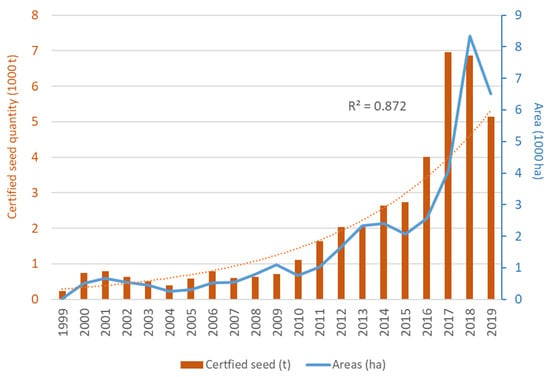
Figure 20.
Area of chickpea seed production and amount of certified seed between 1999–2019 in the EU member states [65].
Similarly to commodity base, seed production of lentils covers a very small area in the EU (Figure 21). The highest seed production areas were reported in 2018, as nearly 3500 hectares. An increase started in 2014, since then, the area has doubled. The most important producer is France, where 85% of total areas are located. Spain has a permanent presence with smaller shares (200–300 ha), which increased to 667 hectares in 2018. The amount of certified seeds shows an exponential increase in the analyzed years.
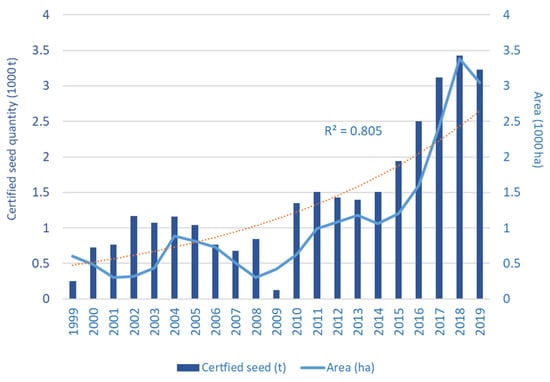
Figure 21.
Area of lentil seed production and amount of certified seed between 1999–2019 in the EU member states [65].
2.8. Soybean
The most important soybean producer was and remains Italy. However, in the last twenty years new counties have entered among the leaders as producers, such as Germany, Czechia, and Poland. In France, the area has doubled. In Austria, it has tripled (Figure 22).
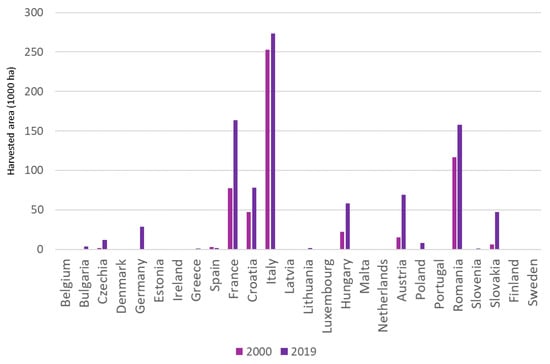
Figure 22.
Harvested area of soybean in EU countries in year 2000 and 2019 [46].
Examining the datasets about soybean varieties, the highest number of varieties is in Italy followed by Romania. There are 78 varieties, which are registered simultaneously in two or more countries (Figure 23).
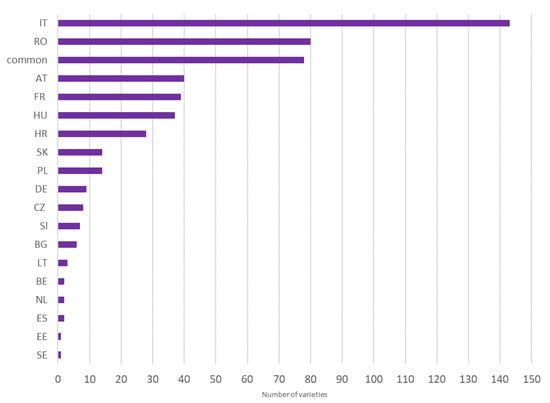
Figure 23.
Number of soybean varieties in EU countries [44].
From the tendency to register new varieties, the development of soybean production in the European Union can be observed. In the 1990s, less than ten new varieties were registered, which increased to over 20 after 2011. However, in 2019–2020, there were more than 60 new varieties registered to the national variety lists (Figure 24).
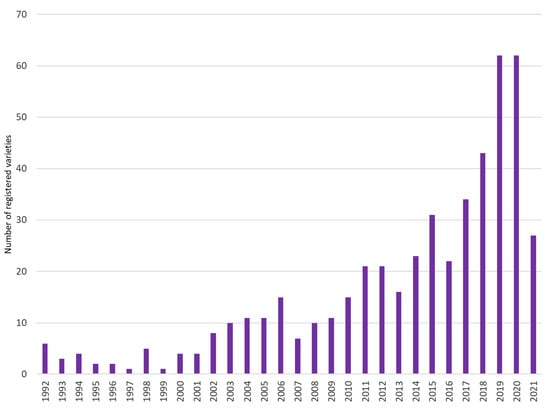
Figure 24.
Number of soybean varieties according to registration year from the national variety lists of the EU member states [47,48,49,50,51,52,53,54,55,56,57,58,59,60,61,62,63,64].
The seed production areas of soybean show a constant increase since 2012 (Figure 25). This upward trend was peaking in 2015 with a three-fold increase in the view of areas in 2012. A drastic decrease was seen in 2018, followed by a rise in 2019. There were four countries between 1999 and 2003 where soybean propagation materials were produced in more than a thousand hectares: France, Hungary, Italy, and Romania. In 2003, Austria joined the group. In 2018, there were nine EU member countries where the seed production areas exceeded 1000 hectares: Austria, Czechia, France, Hungary, Italy, Romania, and Slovakia. The amount of certified seed shows an exponential growth.
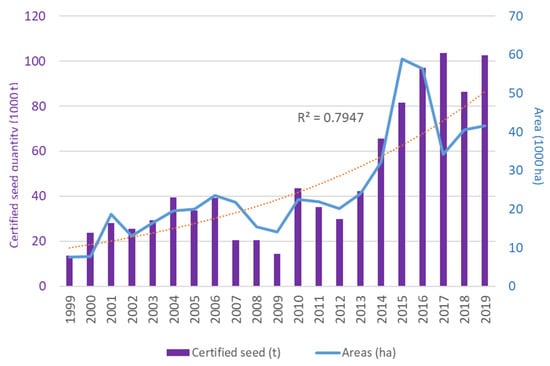
Figure 25.
Area of soybean seed production and amount of certified seed between 1999 and 2019 in the EU member states [65].
3. Discussion
With the analysis of harvest area changes of pulses and soybean of the last two decades in the European Union, it can be observed that the influence of soybean shows a significant increase. The production area of soybean was the highest in France and Austria, while new countries entered the production. Hence, the different protein plans were successful when the goal of reducing the dependence of the EU from external protein sources was discussed. On the other hand, the reduction in production areas of other pulses is experienced, mainly that of field pea. The two countries where the highest declines were seen, were France and Austria, so it seems that soybean displaced the field pea on arable lands.
The other goal of protein plans is to develop the production area and technology of the other pulses; similar tendencies can be observed in the case of field bean and, to a lesser extent, in the case of chickpea.
Comparing the numbers of varieties registered on national lists and the number of new registrations by year, a dynamic development of breeding efforts can be observed in the case of soybean in the last five years. The newly registered soybean varieties in recent years are about 60–70 per year, while this number is only about 40–45 and 10 in the case of field pea and field bean varieties, respectively.
Besides proper variety selection, high-quality, certified seed is the basis for successful and safe production. With the analysis of the seed production areas of the investigated crops, it is visible that seed production areas are constantly increasing in the case of field bean, chickpea, lentils, and soybean. This rise is not that obvious in the case of field pea and lupin; fluctuations are experienced in the trends.
Until the end of the 2010s, the seed production areas of field pea and soybean were almost equal. The same tendencies are true for the amount of certified seed. However, it is interesting that with the exception of lentil, a drastic decrease was experienced in 2018 regarding the amount of registered seeds.
Until the beginning of the 20th century, lentil was traditionally produced both in Hungary and Germany in an intercropping system, generally using cereals as support. Agricultural intensification pushed lentils into the background. With the widespread use of synthetic fertilizers and chemical pesticides, extensive areas utilized with lentils have become suitable for the production of economically more profitable crops. Besides, its weak competition abilities, its susceptibility to diseases in humid environments, and the extra costs of seed selection when produced together with other crops excluded lentil from intensive production [66]. In arid climates, lentils are produced in monoculture. With the increasing focus on protein crops, its production shows an increase again [67].
Areas for the production of soybean show a swift increase worldwide, especially in South America; natural habitats, pastures and other crop fields are sacrificed for this aim. Soybean is the major source of animal feed protein and the second most important oil crop following palm. The global production of this crop shows a double-fold increase in the last two decades, and a four-fold expansion since 1980 [35]. Seventy percent of the increase is explained by area growth, while the remaining was explained by yield enhancement [68].
There are studies about the responsibility of soybean production on deforestation of the rainforest [69,70,71]. The newly explored crop soybean in Europe could have a similar effect on agricultural structure. However, the amount of agricultural land is limited in the European Union, therefore soybean area can be increased only to the harm of other plants.
The higher number of species and varieties included in agricultural production is an advantageous trait for increasing agrobiodiversity and hence biodiversity. With the introduction of soybean in Europe, especially with breeding efforts to develop varieties with short vegetation periods, new countries can be involved in soybean production for internal EU markets. With this, the protein exposure of the European Union can be reduced. Parallel to these tendencies, the harvest areas of pulses are gradually decreasing; breeding efforts to register new commercial pulse varieties also decline in Europe. This means loss for the agrobiodiversity, increasing the internal dependence from a single protein crop and decreases the security of these sources at the EU level. As pulses have several advantages over soybean from an ecosystem point of view, i.e., higher nitrogen fixing ratio, or contribution to nutrient flow by the development of higher plant biomass, these species should not be totally neglected and replaced by soybean. Additionally, production of pulses has traditions in several EU countries, locally adapted landraces are often used in certain areas as part of the agricultural heritage, possessing as ingredients for special local culinary uses. The decline of pulse production can even threaten rural tourism from this perspective. On the other hand, the loss of these genetic materials also narrows down the genetic background for future pulse breeding and reduces the chance of registering new, modern varieties for commercial production.
The loss of biodiversity at the species level could be observed not only among wild species but in agriculture as well [72]. On the other hand, on a genetic level, loss of old varieties or landraces of cultivated plants is again an ongoing process [73]. Stress factors of plant production originating from the highly variable environment, such as rapidly drying agricultural lands, decreasing availability of irrigation water, or appearance of locally new pests and diseases all basically triggered by climate change, emphasize that farmers and plant breeders will need a wider access to plant genetic resources. Plant genetic resources could be the raw materials of providing enough nutritious food sources for the human population during an accelerated climate change that is threatening increasing levels of famine [74]. While ex situ conservation in gene banks is developing in many countries, this is mainly concerning staple crop species and non-staple ones are still generally under-represented in these collections [75]. In situ conservation of crop species and varieties within the agroecosystem is of utmost importance because that is how these genetic resources could change and follow the changing environment [74], showing us their abilities to fight different stress factors [76]. Further research can explore new sources of genetic diversity and subsequently new opportunities for plant breeders [77].
4. Materials and Methods
Using the online available literature database of ScienceDirect, the number of those scientific articles dealing with pulses were collected, which were published between 1999–2021. The common English names of investigated crops (“field bean”, “field pea”, “lentil”, “chickpea”, “lupin”, “soybean”) were separately used as keywords for searching. The total number of studies are inclusive to all article types, publication titles, and subject areas. For the collection of indicators, online and publicly available databases were used. For the harvested area and yield results FAOSTAT and EUROSTAT databases were used (accessed on). Seed production area and certified seed quantity data were collected using the online database of European Seed Certification Agencies Association (ESCAA).
For the analysis of breeding activity regarding the investigated pulses, the EU Common Plant variety database was used. The number of registered pulse varieties were used as indicators in the present study.
The National Variety List is an official list of a country containing agricultural plant varieties. Seed units registered in a European Union Member State or in the common catalogue of varieties of the European Union may be produced (with the marketing purpose) and marketed in the European Union. A new variety must fulfill several conditions to be registered on the national list and will be included in the common catalogue of varieties of the European Union by the European Commission.
Varieties of field crops and vegetables are included in the national variety list for a period of ten years. Without any examination of the variety, this period can be renewed for another 10 years. After expiring the second ten years, the breeder or maintainer can ask for an extension. In this case, the variety should be examined for the basic characters again. Not all arable plant crops produced in the EU are presented in the common and national variety lists. In the case of commercially less important plants, the variety use is optional; chickpea and lentil are only optionally listed plants. This means that if there is only one listed variety name from these plants in the catalogue, only the seeds of that one should be handled as a variety. In other cases, the use of propagation material from these species is not regulated.
The present research used the EU Plant variety database (v.3.4) [44] accessed on 11 November 2021. The variety names of soybean, field bean, field pea, and white lupin was retrieved from the database and numbers of varieties were defined per species. While lentil and chickpeas are only optionally listed species, the names were collected from the national variety catalogues of 25 member states where it contains these data; number of varieties per species were used. By searching the national variety list of the member states separately, the number of varieties registered to the national variety lists were collected by year between 1964 and 2021. In the case of varieties registered in more than one country, the first date of entering was used.
Although freely available, national databases use their native language, therefore when needed, Google Translator was used to support data access and retrieval. Another obstacle is that there is no uniform nomenclature for the names of national variety lists, therefore, general keywords are not applicable. Additional efforts were needed when a country used Cyrillic characters. Due to the non-uniformized surface of each webpage, automatized data harvesting was impossible, therefore manual data collection had to be performed, using Microsoft Office Excel as a means of data aggregation. The format of national lists was also different; PDFs were searchable, but not importable, while in the case of online search interfaces, only page-by-page manual data collection was possible, as data import was generally not an option.
With the collection of variety related data, a database was set up in .xls format (Supplementary File S1), which contained all the registered variety names of field bean, field pea, lentils, chickpea, soybean, and lupin varieties, the time of their registration in relation with the country where it was registered, and the code or name of variety maintainer. Using this code, detailed data about variety maintainers can be retrieved from the EU plant variety database.
5. Conclusions
Based on the investigated indicators (crop yield, crop harvested area, certified seed yield, seed production area, number of registered varieties, and the number of scientific publications), the European protein programs had a positive impact not only on soybean, but also encouraged the production of field, bean, chickpea, lentils, and to a lesser extent, of lupins as well. Where new variety registrations are concerned, this positive effect is true only for soybean.
Publicly available data on land area and variety use of soybean and pulses show that the role of soybean is increasing in the European Union. At the same time, pulses show a decline in the investigated parameters, which means a serious loss on agrobiodiversity, on ecosystem services, on the agricultural heritage and future breeding efforts for locally adapted commercial varieties. Therefore, special attention should be paid to the enhancement of pulse production in the EU.
Supplementary Materials
The dataset containing data regarding investigated pulse crop varieties (names and year of registration on a country basis) can be downloaded at: https://www.mdpi.com/article/10.3390/stresses2010008/s1.
Author Contributions
Conceptualization, A.D.-E. and L.C.; methodology, A.D.-E.; formal analysis, A.D.-E. and P.P.; investigation, K.M., I.G. and P.P.; resources, K.M., I.G., P.P. and A.D.-E.; data curation, A.D.-E. and L.C.; writing—original draft preparation, A.D.-E. and L.C.; writing—review and editing, K.M., I.G., P.P., L.C. and A.D.-E.; visualization, A.D.-E. and K.M.; supervision, I.G. and P.P.; All authors have read and agreed to the published version of the manuscript.
Funding
This research received no external funding.
Institutional Review Board Statement
Not applicable.
Informed Consent Statement
Not applicable.
Data Availability Statement
Not applicable.
Conflicts of Interest
The authors declare no conflict of interest.
References
- FAO. Definition and Classification of Commodities. (Draft) 4. Pulses and Derived Products. 1994. Available online: https://www.fao.org/es/faodef/fdef04e.htm (accessed on 8 December 2021).
- Kumar, S.; Pandey, G. Biofortification of pulses and legumes to enhance nutrition. Heliyon 2020, 6, e03682. [Google Scholar] [CrossRef] [PubMed]
- Sharasia, P.L.; Garg, M.R.; Bhanderi, B.M. Pulses and Their by-Products as Animal Feed; Calles, T., Makkar, H.P.S., Eds.; FAO: Rome, Italy, 2017. [Google Scholar]
- Jensen, E.S.; Carlsson, G.; Hauggaard-Nielsen, H. Intercropping of grain legumes and cereals improves the use of soil N resources and reduces the requirement for synthetic fertilizer N: A global-scale analysis. Agron. Sustain. Dev. 2020, 40, 1–9. [Google Scholar] [CrossRef] [Green Version]
- Preissel, S.; Reckling, M.; Schläfke, N.; Zander, P. Magnitude and farm-economic value of grain legume pre-crop benefits in Europe: A review. Field Crops Res. 2015, 175, 64–79. [Google Scholar] [CrossRef] [Green Version]
- Siddique, K.H.M.; Johansen, C.; Turner, N.C.; Jeuffroy, M.-H.; Hashem, A.; Sakar, D.; Gan, Y.; Alghamdi, S.S. Innovations in agronomy for food legumes. A review. Agron. for Sust.Dev. 2011, 32, 45–64. [Google Scholar] [CrossRef] [Green Version]
- Fantappiè, M.; L’Abate, G.; Costantini, E.A.C. The influence of climate change on the soil organic carbon content in Italy from 1961 to 2008. Geomorphology 2011, 135, 343–352. [Google Scholar] [CrossRef]
- Briggs, S. Organic Cereal and Pulse Production: A Coplete Guide; Crowood Press: Wiltshire, UK, 2005. [Google Scholar]
- Lengwati, D.M.; Mathews, C.; Dakora, F.D. Rotation benefits from N2-fixing grain legumes to cereals: From increases in seed yield and quality to greater household cash-income by a following maize crop. Front. Sustain. Food Syst. 2020, 19, 94. [Google Scholar] [CrossRef]
- Desire, M.F.; Blessing, M.; Elijah, N.; Ronald, M.; Agather, K.; Tapiwa, Z.; George, N. Exploring food fortification potential of neglected legume and oil seed crops for improving food and nutrition security among smallholder farming communities: A systematic review. J. Agric. Food Res. 2021, 3, 100117. [Google Scholar] [CrossRef]
- Cusworth, G.; Garnett, T.; Lorimer, J. Legume dreams: The contested futures of sustainable plant-based food systems in Europe. Global Environ. Change 2021, 69, 102321. [Google Scholar] [CrossRef]
- Zhong, L.; Fang, Z.; Wahlqvist, M.L.; Wu, G.; Hodgson, J.M.; Johnson, S.K. Seed coats of pulses as a food ingredient: Characterization, processing, and applications. Trends in Food Sci. Tech. 2018, 80, 35–42. [Google Scholar] [CrossRef] [Green Version]
- Duc, G.; Aleksić, J.M.; Marget, P.; Mikić, A.; Paull, J.; Redden, R.J.; Sass, O.; Stoddard, F.L.; Vandenberg, A.; Vishnyakova, A.; et al. Grain Legumes; de Ron, A.M., Ed.; Springer: New York, NY, USA, 2016; pp. 141–178. [Google Scholar]
- Jezierny, D.; Mosenthin, R.; Bauer, E. The use of grain legumes as a protein source in pig nutrition: A review. Anim. Feed Sci. Tech. 2010, 157, 111–128. [Google Scholar] [CrossRef]
- Smith, L.A.; Houdijk, J.G.M.; Homer, D.; Kyriazakis, I. Effects of dietary inclusion of pea and faba bean as a replacement for soybean meal on grower and finisher pig performance and carcass quality. J. Anim. Sci. 2013, 91, 3733–3741. [Google Scholar] [CrossRef] [PubMed] [Green Version]
- Yu, P.; Tamminga, S.; Egan, A.R.; Christensen, D.A. Probing equivocal effects of heat processing of legume seeds on performance of ruminants—A Review. Asian-Aust. J. Anim. Sci. 2004, 17, 869–876. [Google Scholar] [CrossRef]
- Masoero, F.; Pulimeno, A.M.; Rossi, F. Effect of extrusion, espansion and toasting on the nutritional value of peas, faba beans and lupins. Ital. J. Anim. Sci. 2005, 4, 177–189. [Google Scholar] [CrossRef]
- Vander Pol, M.; Hristov, A.N.; Zaman, S.; Delano, N.; Schneider, C. Effect of inclusion of peas in dairy cow diets on ruminal fermentation, digestibility, and nitrogen losses. Anim. Feed Sci. Tech. 2009, 150, 95–105. [Google Scholar] [CrossRef]
- Mihailovic, V.; Mikic, A.; Eric, P.; Vasiljevic, S.; Cupina, B.; Katic, S. Protein pea in animal feeding. Biotech. Anim. Husb. 2005, 21, 281–285. [Google Scholar] [CrossRef]
- Dadon Bar-El, S.; Abbo, S.; Reifen, R. Leveraging traditional crops for better nutrition and health—the case of chickpea. Trends Food Sci. Technol. 2017, 64, 39–47. [Google Scholar] [CrossRef]
- Daryanto, S.; Wang, L.; Jacinthe, P.A. Global synthesis of drought effects on food legume production. PLoS ONE 2015, 10, e0127401. [Google Scholar] [CrossRef] [Green Version]
- Wood, J.A.; Grusak, M.A. Nutritional value of chickpea. In Chickpea Breeding and Management; Yadav, S.S., Redden, R., Chen, W., Sharma, B., Eds.; CABI: Wallingford, UK, 2007; pp. 101–142. [Google Scholar]
- Marioli Nobile, C.; Carreras, J.; Grosso, R.; Inga, M.; Silva, M.; Aguilar, R.; Allende, M.; Badini, R.; Martinez, M. Proximate composition and seed lipid components of “kabuli” type chickpea (Cicer arietinum L.) from Argentina. Agric. Sci. 2013, 4, 729–737. [Google Scholar] [CrossRef] [Green Version]
- Levent Yurdaer, A.; Yemenicioğlu, A. Potential of Turkish Kabuli type chickpea and green and red lentil cultivars as source of soy and animal origin functional protein alternatives. LWT-Food Sci. Tech. 2013, 50, 686–694. [Google Scholar]
- Benjamin, J.G.; Nielsen, D.C. Water deficit effects on root distribution of soybean, field pea and chickpea. Field Crops Res. 2006, 97, 248–253. [Google Scholar] [CrossRef]
- Delgado, M.J.; Ligero, F.; Lluch, C. Effects of salt stress on growth and nitrogen fixation by pea, faba-bean, common bean and soybean plants. Soil Biol. Biochem. 1994, 26, 371–376. [Google Scholar] [CrossRef]
- Gladstones, J.S.; Atkins, C.A.; Hamblin, J. Lupins as Crop Plants: Biology, Production and Utilization; CAB International: Wallingford, UK, 1998. [Google Scholar]
- Kim, J.C.; Pluske, J.R.; Mullan, B.P. Lupins as a protein source in pig diets. CAB Rev. Perspect. Agric. Vet. Sci. Nutr. Nat. Resour. 2007, 2, 3. [Google Scholar] [CrossRef]
- Petterson, D.S. The use of lupins in feeding systems—Review. Asian-Aust. J. Anim. Sci. 2000, 13, 861–882. [Google Scholar] [CrossRef]
- Kohajdova, Z.; Karovičova, J.; Schmidt, S. Lpin composition and possible use in bakery—A review. Czech J. Food Sci. 2011, 29, 203–211. [Google Scholar] [CrossRef] [Green Version]
- Martinez-Villaluenga, C.; Zieliňski, H.; Frias, J.; Piskuła, M.K.; Kozłowska, H.; Vidal- Valverde, C. Antioxidant capacity and polyphenolic content of high-protein lupin products. Food Chem. 2009, 112, 84–88. [Google Scholar] [CrossRef]
- Nalle, C.L.; Ravindran, V.; Ravindran, G. Nutritional value of white lupins (Lupinus albus) for broilers: Apparent metabolisable energy, apparent ileal amino acid digestibility and production performance. Animal 2011, 6, 579–585. [Google Scholar] [CrossRef] [Green Version]
- Braum, S.M.; Helmke, P.A. White lupin utilizes soil phosphorus that is unavailable to soybean. Plant Soil 1995, 176, 95–100. [Google Scholar] [CrossRef]
- Ford, R.; Redden, R.J.; Materne, M.; Taylor, P.W.J. Lentil. In Genome Mapping and Molecular Breeding in Plants; Chittarajan, K., Ed.; Springer: Berlin/Heidelberg, Germany, 2007; Volume 3, pp. 91–108. [Google Scholar]
- FAO. FAO Statistical Databases (FAOSTAT). Rome, Italy. 2021. Available online: https://www.fao.org/faostat/en/#home (accessed on 10 December 2021).
- Singh, D.; Singh, C.K.; Taunk, J.; Tomar, R.S.; Chaturvedi, A.K.; Gaikwad, K.; Pal, M. Transcriptome analysis of lentil (Lens culinaris Medikus) in response to seedling drought stress. BMC Genomics 2017, 18, 206. [Google Scholar] [CrossRef] [Green Version]
- Sehgal, A.; Sita, K.; Bhandari, K.; Kumar, S.; Kumar, J.; Vara Prasad, P.V.; Siddique, K.H.M.; Nayyar, H. Influence of drought and heat stress, applied independently or in combination during seed development, on qualitative and quantitative aspects of seeds of lentil (Lens culinaris Medikus) genotypes, differing in drought sensitivity. Plant Cell Environ. 2019, 42, 198–211. [Google Scholar] [CrossRef] [PubMed] [Green Version]
- Castell, A.G.; Cliplef, R.L. Methionine supplementation of barley diets containing lentils (Lens culinaris) or soybean meal: Live performance and carcass responses by gilts fed ad libitum. Can. J. Anim. Sci. 1990, 70, 329–332. [Google Scholar] [CrossRef]
- Hefnawy, T.H. Effect of processing methods on nutritional composition and antinutritional factors in lentil (Lens culinaris). Annals Agric. Sci. 2011, 56, 57–61. [Google Scholar] [CrossRef] [Green Version]
- Watson, C.A.; Reckling, M.; Preissel, S.; Bachinger, J.; Bergkvist, G.; Kuhlman, T. Grain legume production and use in european agricultural systems. Adv. Agron. 2017, 144, 235–303. [Google Scholar] [CrossRef] [Green Version]
- European Commission. Market Developments and Policy Evaluation Aspects of the Plant Protein Sector in the EU; Final report; European Union: Maastricht, The Netherlands, 2018. [Google Scholar]
- Donau Soja Association 2017. Press Release Vienna, 21 July, 2017, EU Agriculture Ministers Agree to Meet UN Sustainable Development Goals with Soya. Donau Soja Association. Available online: https://www.donausoja.org/fileadmin/user_upload/Press/Press_Release/Press_release_2017/PA_Europe_Soya_Declaration_20.07.2017.pdf (accessed on 13 December 2021).
- European Commission 2018a. Report from The Commission to The Council and The European Parliament on the Development of Plant Proteins in the European Union. COM (2018) 757 Final. Brussels. Available online: https://eur-lex.europa.eu/legal-content/EN/TXT/?uri=COM%3A2018%3A757%3AFIN (accessed on 12 December 2021).
- EU Plant Variety Database. Available online: https://ec.europa.eu/food/plant/plant_propagation_material/plant_variety_catalogues_databases/search/public/index.cfm?event=SearchForm&ctl_type=A (accessed on 11 November 2021).
- ScienceDirect Database. Available online: http:\\www.sciencedirect.net (accessed on 11 November 2021).
- EUROSTAT 2021. European Statistical Database. Available online: https://ec.europa.eu/eurostat (accessed on 10 December 2021).
- National Variety List of Austria. Available online: https://www.baes.gv.at/zulassung/pflanzensorten/oesterreichische-sortenliste/#c7236 (accessed on 8 December 2021).
- National Variety List of Belgium. Available online: https://lv.vlaanderen.be/sites/default/files/attachments/cat_be_a_en_h_20210503_nl.pdf (accessed on 8 December 2021).
- National Variety List of Bulgaria. Available online: https://iasas.government.bg/upl/files/Oficialna%20Sortova%20Lista/OSL1_202118022021.pdf (accessed on 15 December 2021).
- National Variety List of Croatia. Available online: https://www.hapih.hr/wp-content/uploads/2021/10/SORTNA-LISTA-REPUBLIKE-HRVATSKE-25.10.2021.pdf (accessed on 8 December 2021).
- National Variety list of Denmark. Available online: https://www.tystofte.dk/sorter-status/officiel-sortsliste/ (accessed on 15 December 2021).
- National Variety List of Finnland. Available online: https://www.ruokavirasto.fi/yritykset/kasviala/Lajikkeet-ja-alkuperaiskasvit/kasvilajikeluettelo/ (accessed on 21 December 2021).
- National Variety List of France. Available online: https://www.geves.fr/catalogue/ (accessed on 8 December 2021).
- National Variety List of Germany. Available online: https://www.bundessortenamt.de/apps6/bsa_sorteninfo/public/de (accessed on 8 December 2021).
- National Variety List of Greece. Available online: http://www.minagric.gr/index.php/el/for-farmer-2/crop-production/polylikomenu/553-nomothesia-polyliko/cat-poik-polyliko/3047-enthnikoi-katalogoi-poikilion (accessed on 21 December 2021).
- National Variety List of Ireland. Available online: https://www.gov.ie/en/publication/5dae8-national-catalogue-of-agricultural-plant-varieties-2021-ireland/ (accessed on 21 December 2021).
- National Variety List of Italy. Available online: http://www.sementi.it/documenti/registri/ITA-agrarie/RegistroAgrarie_19_02_2021.pdf (accessed on 8 December 2021).
- National Variety List of Lithuania. Available online: http://www.vatzum.lt/uploads/documents/navs_leidinys__2020.pdf (accessed on 15 December 2021).
- National Variety List of Portugal. Available online: https://www.dgav.pt/wp-content/uploads/2021/02/CATALOGO-NACIONAL-DE-VARIEDADES_2020.pdf (accessed on 8 December 2021).
- National Variety List of Romania. Available online: https://istis.ro/image/data/download/catalog-oficial/CATALOG%202020.pdf (accessed on 15 December 2021).
- National Variety List of Slovakia. Available online: https://www.uksup.sk/oos-listina-registrovanych-odrod (accessed on 15 December 2021).
- National Variety List of Slovenia. Available online: https://www.gov.si/assets/organi-v-sestavi/UVHVVR/Rastlinski-semenski-material/Publikacija-Sortna-lista/SL_2021_splet.pdf (accessed on 21 December 2021).
- National Variety List of Spain. Available online: https://www.mapa.gob.es/app/regVar/BusRegVar.aspx?id=es (accessed on 8 December 2021).
- National Variety List of Sweden. Available online: https://jordbruksverket.se/download/18.7dc1613e1785d10fcd9ba5b3/1616750588294/V%C3%A4xtsort meddelande-2021-3-sortlistan.pdf (accessed on 15 December 2021).
- European Seed Certification Agencies Association (ESCAA) Online Database. Available online: http://www.escaa.org/index/action/page/id/9/title/certified-seed-quantities. https://www.escaa.org/index/action/page/id/8/title/field-production-area-for-seeds. (accessed on 8 January 2022).
- Láng, G. (Ed.) A Növénytermesztés Kézikönyve I; Mezőgazdasági Kiadó: Budapest, Hungary, 1966. [Google Scholar]
- Reif, T.M.; Zikeli, S.; Rieps, A.-M.; Lang, C.P.; Hartung, J.; Gruber, S. Reviving a neglected crop: A case study on lentil (Lens culinaris Medikus subsp. culinaris) Cultivation in Germany. Sustainability 2021, 13, 133. [Google Scholar] [CrossRef]
- Cassman, K.G.; Grassini, P.A. Global perspective on sustainable intensification research. Nat. Sustain. 2020, 3, 262–268. [Google Scholar] [CrossRef] [Green Version]
- Graesser, J.; Ramankutty, N.; Coomes, O.T. Increasing expansion of large-scale crop production onto deforested land in sub-Andean South America. Environ. Res. Lett. 2018, 13, 084021. [Google Scholar] [CrossRef] [Green Version]
- Foley, J.A.; Asner, G.P.; Heil Costa, M.; Coe, M.T.; DeFries, R.; Gibbs, H.K.; Howard, E.A.; Olson, S.; Patz, J.; Ramankutty, N.; et al. Amazonia revealed: Forest degradation and loss of ecosystem goods and services in the Amazon Basin Front. Ecol. Environ. 2007, 5, 25–32. [Google Scholar] [CrossRef]
- Barona, E.; Ramankutty, N.; Hyman, G.; Coomes, O.T. The role of pasture and soybean in deforestation of the Brazilian Amazon. Environ. Res. Lett. 2010, 5, 024002. [Google Scholar] [CrossRef]
- Ulian, T.; Diazgranados, M.; Pironon, S.; Padulosi, S.; Liu, U.; Davies, L.; Howes, M.-J.R.; Borrell, J.S.; Ondo, I.; Pérez-Escobar, O.A.; et al. Unlocking plant resources to support food security and promote sustainable agriculture. Plants People Planet 2020, 2, 421–445. [Google Scholar] [CrossRef]
- Jacobsen, S.-E.; Sørensen, M.; Pedersen, S.M.; Weiner, J. Feeding the world: Genetically modified crops versus agricultural biodiversity. Agron. Sust. Dev. 2013, 33, 651–662. [Google Scholar] [CrossRef] [Green Version]
- FAO. The Second Report on the State of the World’s Plant Genetic Resources for Food and Agriculture; FAO: Rome, Italy, 2010; ISBN 978-92-5-106534-1. [Google Scholar]
- Hammer, K. A paradigm shift in the discipline of plant genetic resources. Gen. Res. Crop Evol. 2003, 50, 3–10. [Google Scholar] [CrossRef]
- Arif, A.; Parveen, N.; Waheed, M.Q.; Atif, R.M.; Waqar, I.; Shah, T.M. A comparative study for assessing the drought-tolerance of chickpea under varying natural growth environments. Front. Plant Sci. 2021, 11, 2228. [Google Scholar] [CrossRef]
- Getahun, T.; Tesfaye, K.; Fikre, A.; Haileslassie, T.; Chitikineni, A.; Thudi, M.; Varshney, R.K. Molecular genetic diversity and population structure in Ethiopian chickpea germplasm accessions. Diversity (TSI) 2021, 13, 247. [Google Scholar] [CrossRef]
Publisher’s Note: MDPI stays neutral with regard to jurisdictional claims in published maps and institutional affiliations. |
© 2022 by the authors. Licensee MDPI, Basel, Switzerland. This article is an open access article distributed under the terms and conditions of the Creative Commons Attribution (CC BY) license (https://creativecommons.org/licenses/by/4.0/).