Article

Utilization of Tomato Landraces to Improve Seedling Performance under Salt Stress

by
Kalliopi Kadoglidou
,
Aliki Xanthopoulou
,
Apostolos Kalyvas
and
Ifigeneia Mellidou
*
Institute of Plant Breeding and Genetic Resources, Hellenic Agricultural Organization DEMETER (ex NAGREF), GR-57001 Thermi, Greece
*
Author to whom correspondence should be addressed.
Stresses 2021, 1(4), 238-252; https://doi.org/10.3390/stresses1040017
Submission received: 29 September 2021 / Revised: 22 October 2021 / Accepted: 25 October 2021 / Published: 28 October 2021

Abstract

:
Salt stress is considered as one of the most frequent factors limiting plant growth and productivity of crops worldwide. The aim of the study was to evaluate physiological and biochemical responses of nine diverse tomato genotypes exposed to salt stress. In this regard, four-week-old seedlings of one modern variety, five landraces, the salt-sensitive accession of ‘Ailsa Craig’, the salt-tolerant wild accession of S. pimpinellifolium ‘LA1579’, as well as the vitamin C-rich S. pennellii introgression line ‘IL12-4’, were exposed to moderate salt stress (200 mM NaCl) for 10 days. At the end of the stress treatment, agronomical traits and stress indices were evaluated, while gas exchange-related parameters, root electrolyte leakage, malondialdehyde content and ascorbic acid were also determined. All parameters were significantly affected by salt stress, but to a different extent, verifying the diverse degree of tolerance within the selected genotypes, and further highlighting the different stress-induced mechanisms. The landrace originated from ‘Santorini’ island, as well as the modern variety, which originated from traditional cultivars, demonstrated a better performance and adaptivity under moderate salt stress, accompanied by reduced lipid peroxidation and enhanced ascorbic acid content, indicating that they could be potential promising genetic material for breeding programs or as grafting rootstocks/scions.

1. Introduction

Salinity is an important abiotic stress factor threatening agricultural productivity worldwide. There are more than 800 million hectares (434 and 397 million hectares under the categories of sodic soils and saline soils, respectively), including 19.5% of total irrigated lands, affected by salt [1]. In the forthcoming years, changes in soil salinization due to the foreseeable effects of climate change are expected to significantly impact soil properties, rapidly declining cultivable area [2,3], imposing detrimental effects on plant growth and physiological responses [4,5]. Although many technologies have been implicated in the improvement of salt tolerance, the development of salt-tolerant cultivars through breeding represents a key cost-efficient and sustainable strategy to increase field crop production in the era of climate change.
Plants can adapt to high Na+ concentrations by triggering various physiological and biochemical adjustments, including the effective compartmentalization of Na+ in vacuoles by specific transporters, the control of ion uptake by roots and transport into leaves, modifications in leaf or root anatomical structures, alterations in the photosynthetic rate and membrane structure, induction of plant hormones, and adjustment of the osmotic balance of the cells by synthesizing osmoprotectants [4,6,7,8]. At excess NaCl, tolerant plants maintain a high cytosolic K+/Na+ ratio by active transport, mainly operated by Na+/H+ antiporters [9]. In this regard, the salt overly sensitive (SOS) signaling pathway has been proposed to mediate the signaling cascades to achieve ion homeostasis, enabling plants to withstand Na+ toxicity during salt stress [10,11]. High levels of Na+ or Cl alter normal cellular redox homeostasis, leading to an increased production of reactive oxygen species (ROS). As a general consensus, ROS generation, causing oxidative damage, is stimulated at exposure to salt, leading to lipid peroxidation and membrane damage inter alia. Conceptually, their tight regulation by antioxidant mechanism is crucial to reduce oxidative stress-mediated damage in plant cells and membranes. Among viable indicators of the ability of plant cellular membranes to maintain integrity and/or recover from imposed stresses is root electrolyte leakage (REL) [12]. Furthermore, malondialdehyde (MDA) content can be also employed to assess the degree of membrane damage induced by lipid peroxidation at exposure to abiotic stress, as previously highlighted in tobacco [7] or walnut [13].
Tomato is among the most important vegetable crops worldwide, whereas the adverse effects of salinity have been extensively studied on both seed germination, biomass allocation and fruit yield [14,15]. Generally, tomato is a moderately sensitive crop which can withstand a salinity level between 1.5 to 3 dS/m [16]. Based on the electrical conductivity (EC) of the saturation extract, the maximum soil salinity tolerated by tomato is 2.5 dS m−1, with a reduction of approximately 10% in the production for each unit increase in salinity above this limit [17], although the threshold level for salt tolerance is primarily dependent on individual genotypes and on environmental conditions [18]. Tomato plants have developed defense mechanisms either to alleviate salt from their sensitive tissues, or to tolerate salinity through anatomical adjustments (i.e., alterations in root length, shoot length, number of leaves, leaf area, leaf senescence, flower abscission) and modifications in physiological–biochemical processes (i.e., photosynthesis, respiration, synthesis of proteins, lipids, vitamins and carotenoids, energy metabolism, hormone production, water equilibrium and ionic flux from membrane) [19]. In particular, at the seedling stage, tomato is sensitive to high levels of salt, which inhibits plant growth and significantly reduces yield [19,20]. Vegetative biomass allocation has been considered as one of the best indicators to assess the water uptake of tomato plants under saline conditions [21]. According to Raza et al. [19], some salt tolerant tomato genotypes try to mitigate the deleterious effects of salt stress through reducing physiological processes, whereas some others use their root development to avoid salty root zones. Seed-priming, treatments with beneficial microorganisms or salicylic acid, as well as the application of fertilizers at levels marginally above the optimum, have been widely employed to ameliorate the detrimental effects of salinity soils on tomato plants [22,23]. Nevertheless, the most cost-efficient and sustainable strategy to improve plant performance at abiotic stress conditions remains the development of breeding schemes for tolerant cultivars. In this regard, landraces and wild species represent a valuable genetic resource to enhance yield stability and production under adverse growth conditions.
The present study outlines the effect of salt stress on different tomato germplasm, consisted of modern cultivars, landraces and wild accessions. Growth, physiological and biochemical changes, including REL, MDA and ascorbic acid (AsA) content, that are considered as valuable stress indicators to assess the degree of genotypic tolerance [7,12,13], were determined in nine tomato genotypes exposed to 200 mM NaCl for 10 days. Results could provide a useful basis for the selection of suitable tolerant genotypes that can be used to direct breeding programs.

2. Results

2.1. Growth Parameters

The collection of tomato germplasm (Solanum lycopersicum) used to study seedling responses to salt stress included five landraces (cvs ‘Santorini’, ‘Zakynthos’, ‘Paxoi’, ‘HL073’, ‘Agiou Orous’, named V1 to V5, respectively), one modern variety (cv ‘Makedonia’—V6), the salt-sensitive cv ‘Ailsa Craig’ (AC), the salt-tolerant accession LA1579 (a wild species of Solanum pimpinellifolium), as well as the Solanum pennellii introgression line IL12-4 (LA4120), rich in vitamin C content (Table S1). Generally, the statistical analysis of the growth parameters showed significant effects due to genotype (G), salt stress (S) and, in some cases, their interactions (G × S) (Table S2). Based on the results, in several genotypes, significant reductions took place in shoot length (SL), shoot thickness (ST), and leaf number (LN), at exposure to salt stress. In particular, seedlings of AC, V2, V4 and V5, grown under salt stress, were by 17.5 to 24.3% smaller than the corresponding controls (Table 1). ST was reduced about 13.7 to 27.7% in all genotypes except V1, whereas LN was reduced only at V4 and V2 by 14.6 and 15.7%, respectively. Among genotypes, V1 was almost the most resistant, displaying no remarkable differences under salt stress in SL, LN and ST, whereas among the other genotypes, V3, V6, IL12-4 and the wild accession were less affected concerning SL and LN. Furthermore, all tomato genotypes showed a reduction in relative growth rate (RGR) at salt treatments compared to controls. The reduction in RGR due to salt stress ranged from 25.2 to 70.5% compared to control plants. The most remarkable inhibition of RGR was observed at IL12-4 (70.5%), followed by V5 and AC (64%). The obtained RGR values of AC and LA1579 confirmed their salt sensitivity and salt tolerance, respectively.
Excluding RGR, fresh weight of shoot (SFW), and root (RFW), as well as dry matter content (%) of shoot (SDMC) and root (RDMC), were also significantly affected by both salt stress and tomato genotype—in some cases from their interactions too (Table S2). Particularly, SFW was reduced by 30.3 to 34.5% in V2, V3 and V4 seedlings exposed to salt stress, whereas in IL12-4, by 41.2%, compared to unstressed controls (Table 2). The RFW of seedlings declined as a result of salt stress in LA1579, IL12-4, V1, V2 and V6 genotypes (Table 2). However, there were clear differences among genotypes, with reductions ranging from 31.9 to 48.7% due to salt treatments in all genotypes. It is noteworthy that the most pronounced decrease in RFW (48.7%) was recorded in the salt tolerant LA1579, followed by IL12-4 (42.2%). Concerning SDMC and RDMC, no differences were observed at exposure to salt stress, except for LA1579 and V2, in which RDMC was higher by 42% and 28.8% in plants grown under salt stress compared to control plants, respectively (Table 2). This increase in RDMC was observed as a trend in nearly all genotypes but to a lesser and not statistically significant degree.

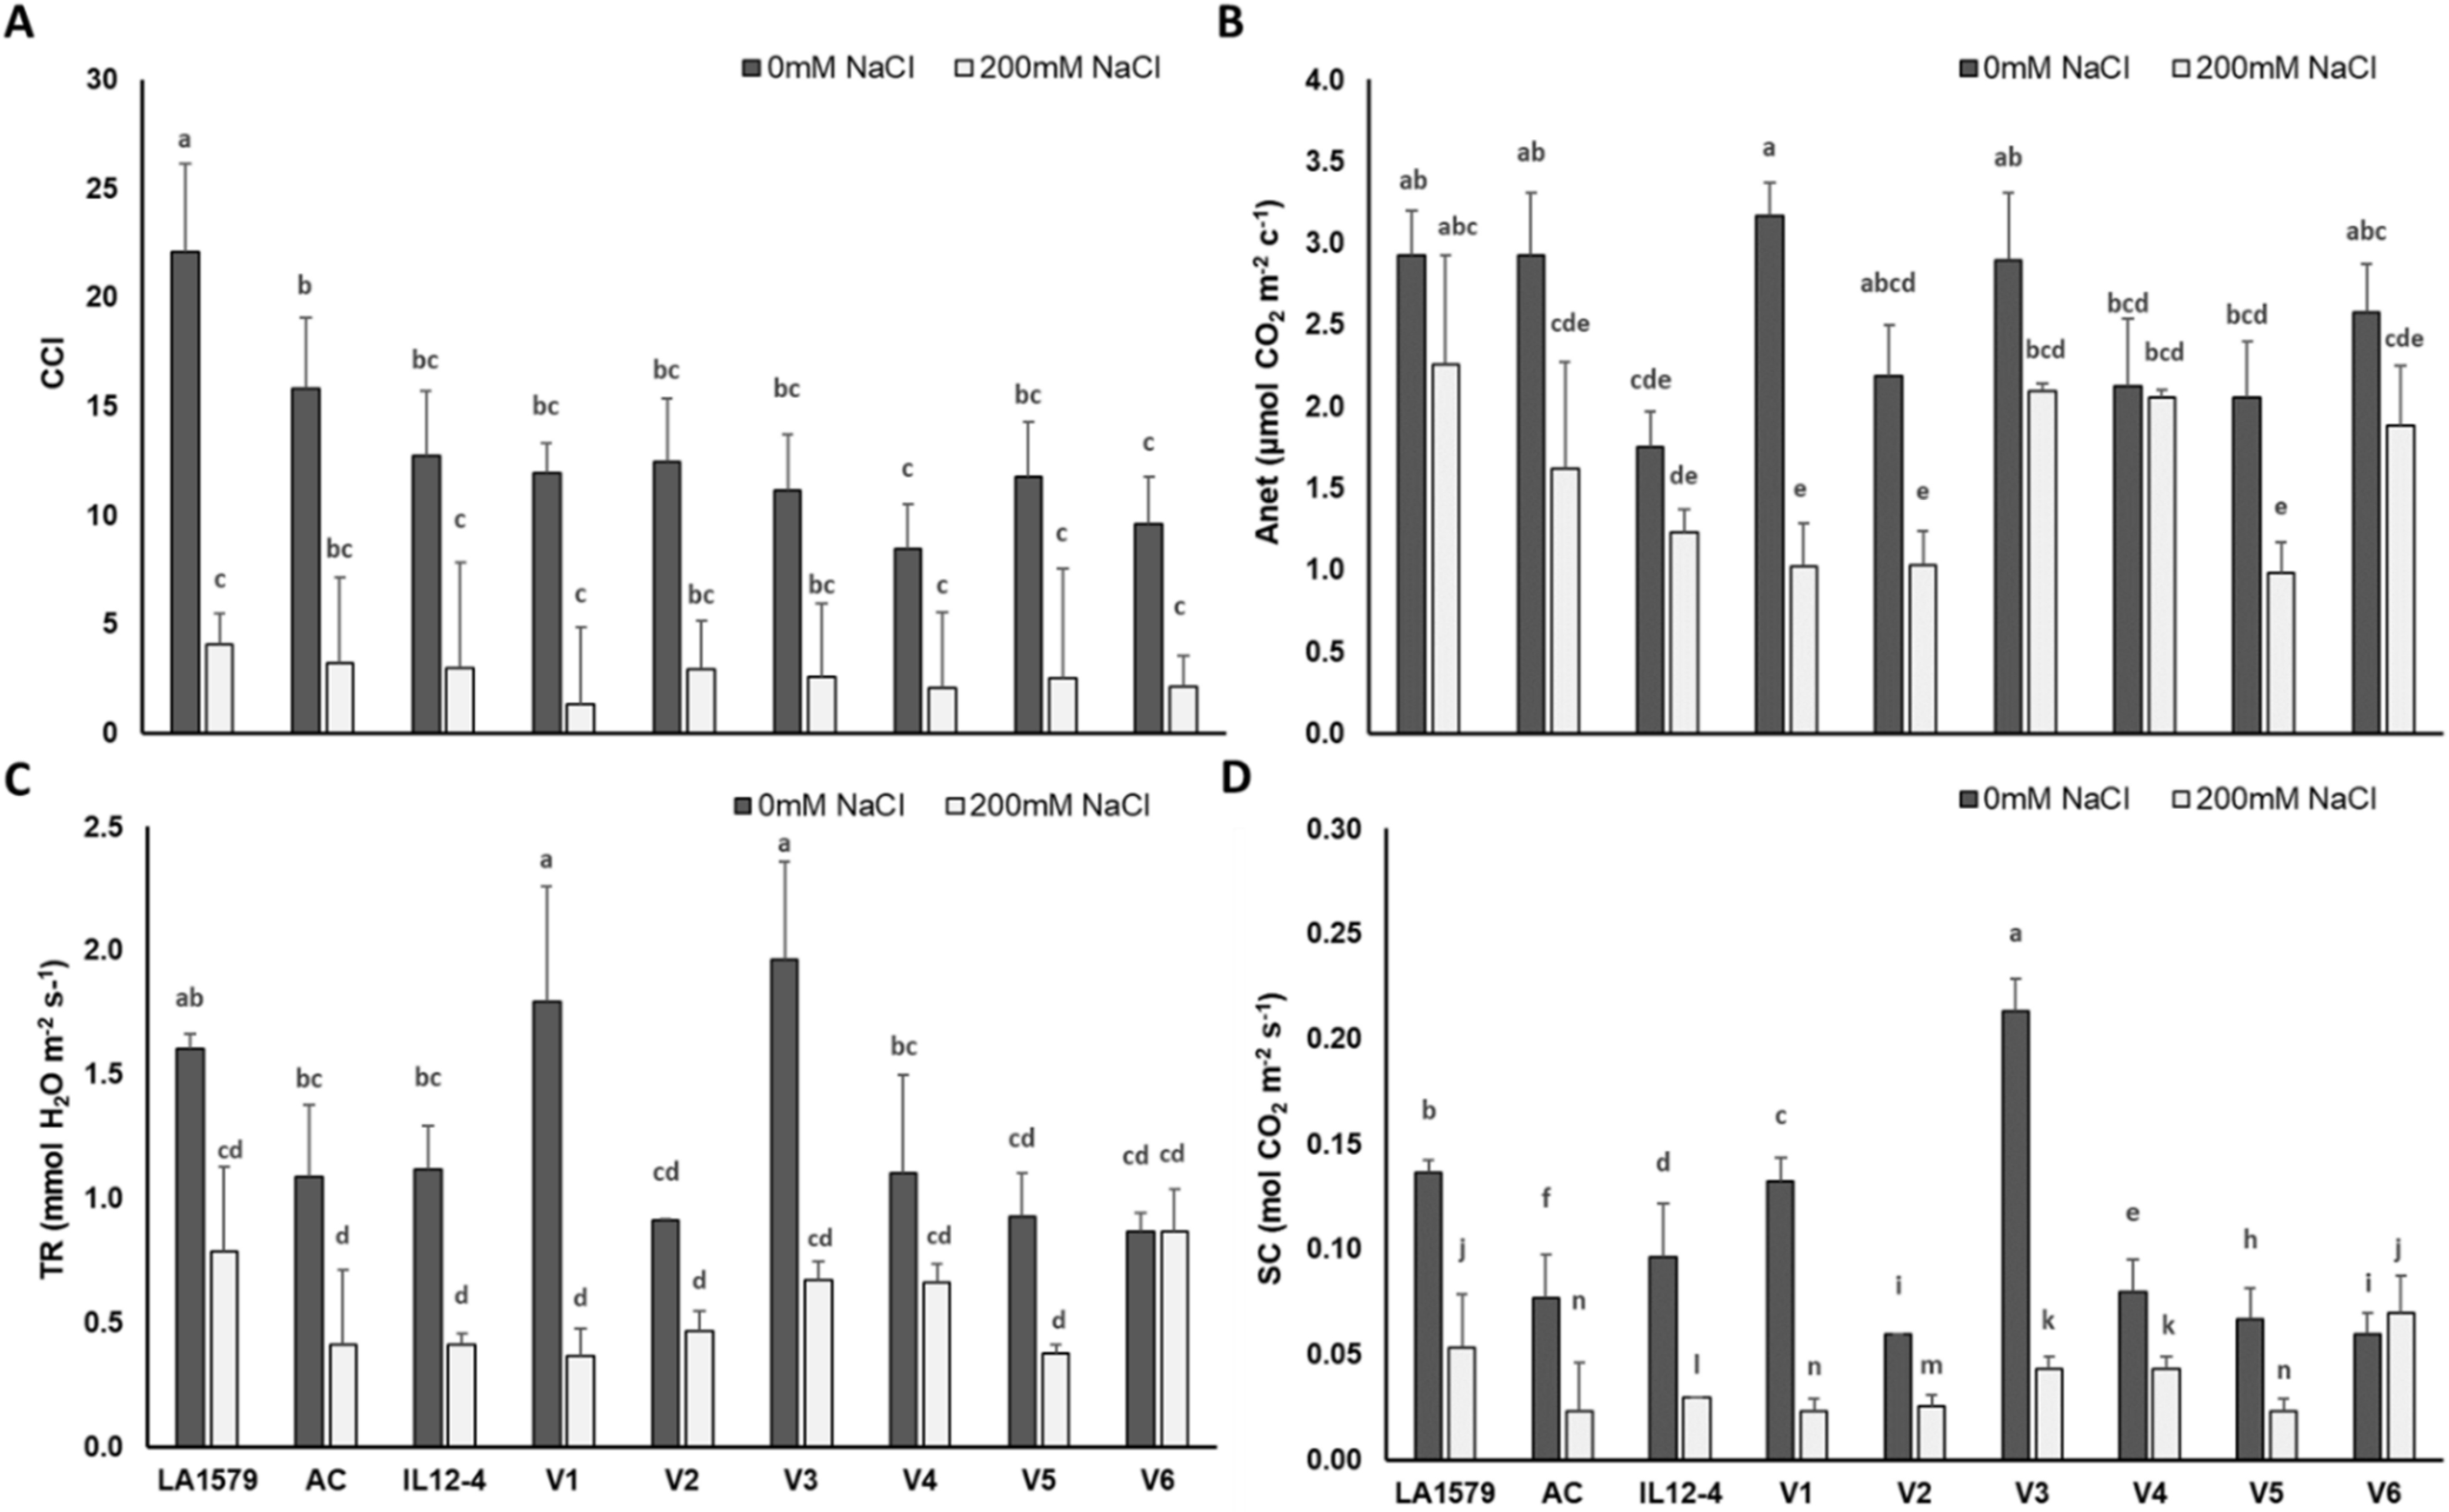
2.2. Physiological Traits

Analysis of variance applied on data obtained from physiological traits of tomato such as chlorophyll content index (CCI), net photosynthetic rate (Anet), transpiration rate (TR) and stomatal conductance (SC) showed significant effect due to genotype (G), salt stress (S) and their interactions (G × S) (Table S2). Specifically, at exposure to salt stress, CCI of tomato plants displayed no significant fluctuations, with the exception of LA1579, where CCI was 55.3% lower compared to controls (Figure 1A). By contrast, the inhibition of Anet, TR and SC induced by salinity was genotype dependent. Particularly, Anet was significantly lower in stressed compared to non-stressed plants, ranging from 44.6% (AC) up to 67.7% (V1) (Figure 1B). It is noteworthy that Anet of LA1579, IL12-4, V3, V4 and V6 tomato seedlings was not significantly affected by salt stress. The TR exhibited a rather comparable tendency to Anet, as tomato seedlings of LA1579, AC, IL 12-4, V1 and V3 genotypes subjected to salt stress had 50.9%–79.6% lower TR than the respective controls (Figure 1C). In accordance to Anet, the most pronounced inhibition of TR compared to non-stressed plants was observed in V1 (79.6%), followed by V3 (65.8%) and AC (62%). Regarding SC, all genotypes, apart from V6, displayed a remarkable reduction at exposure to salt stress compared to non-stressed plants, ranging from 45.8% (V4) to 82.4% (V1) (Figure 1D).

2.3. Salt Tolerance Indices

Stress susceptibility index (SSI) and stress tolerance index (STI) are presented in Table S3. Under salt stress, the highest values of the SSI index for the above-the-ground biomass were observed in genotypes V4 and V5, and the lowest in LA1579 and V1, followed by V6. Results of the SSI index on the basis of total plant biomass were similar. High values of STI for the above-the-ground biomass that are related to stress tolerance, were displayed in genotypes V1, LA1579 and V6, whilst the lowest were in V2 and V5. On the basis of total biomass, genotypes V1, V4, V6 and V3 showed the highest STI values, whilst the genotypes V2 and V5 were the lowest.

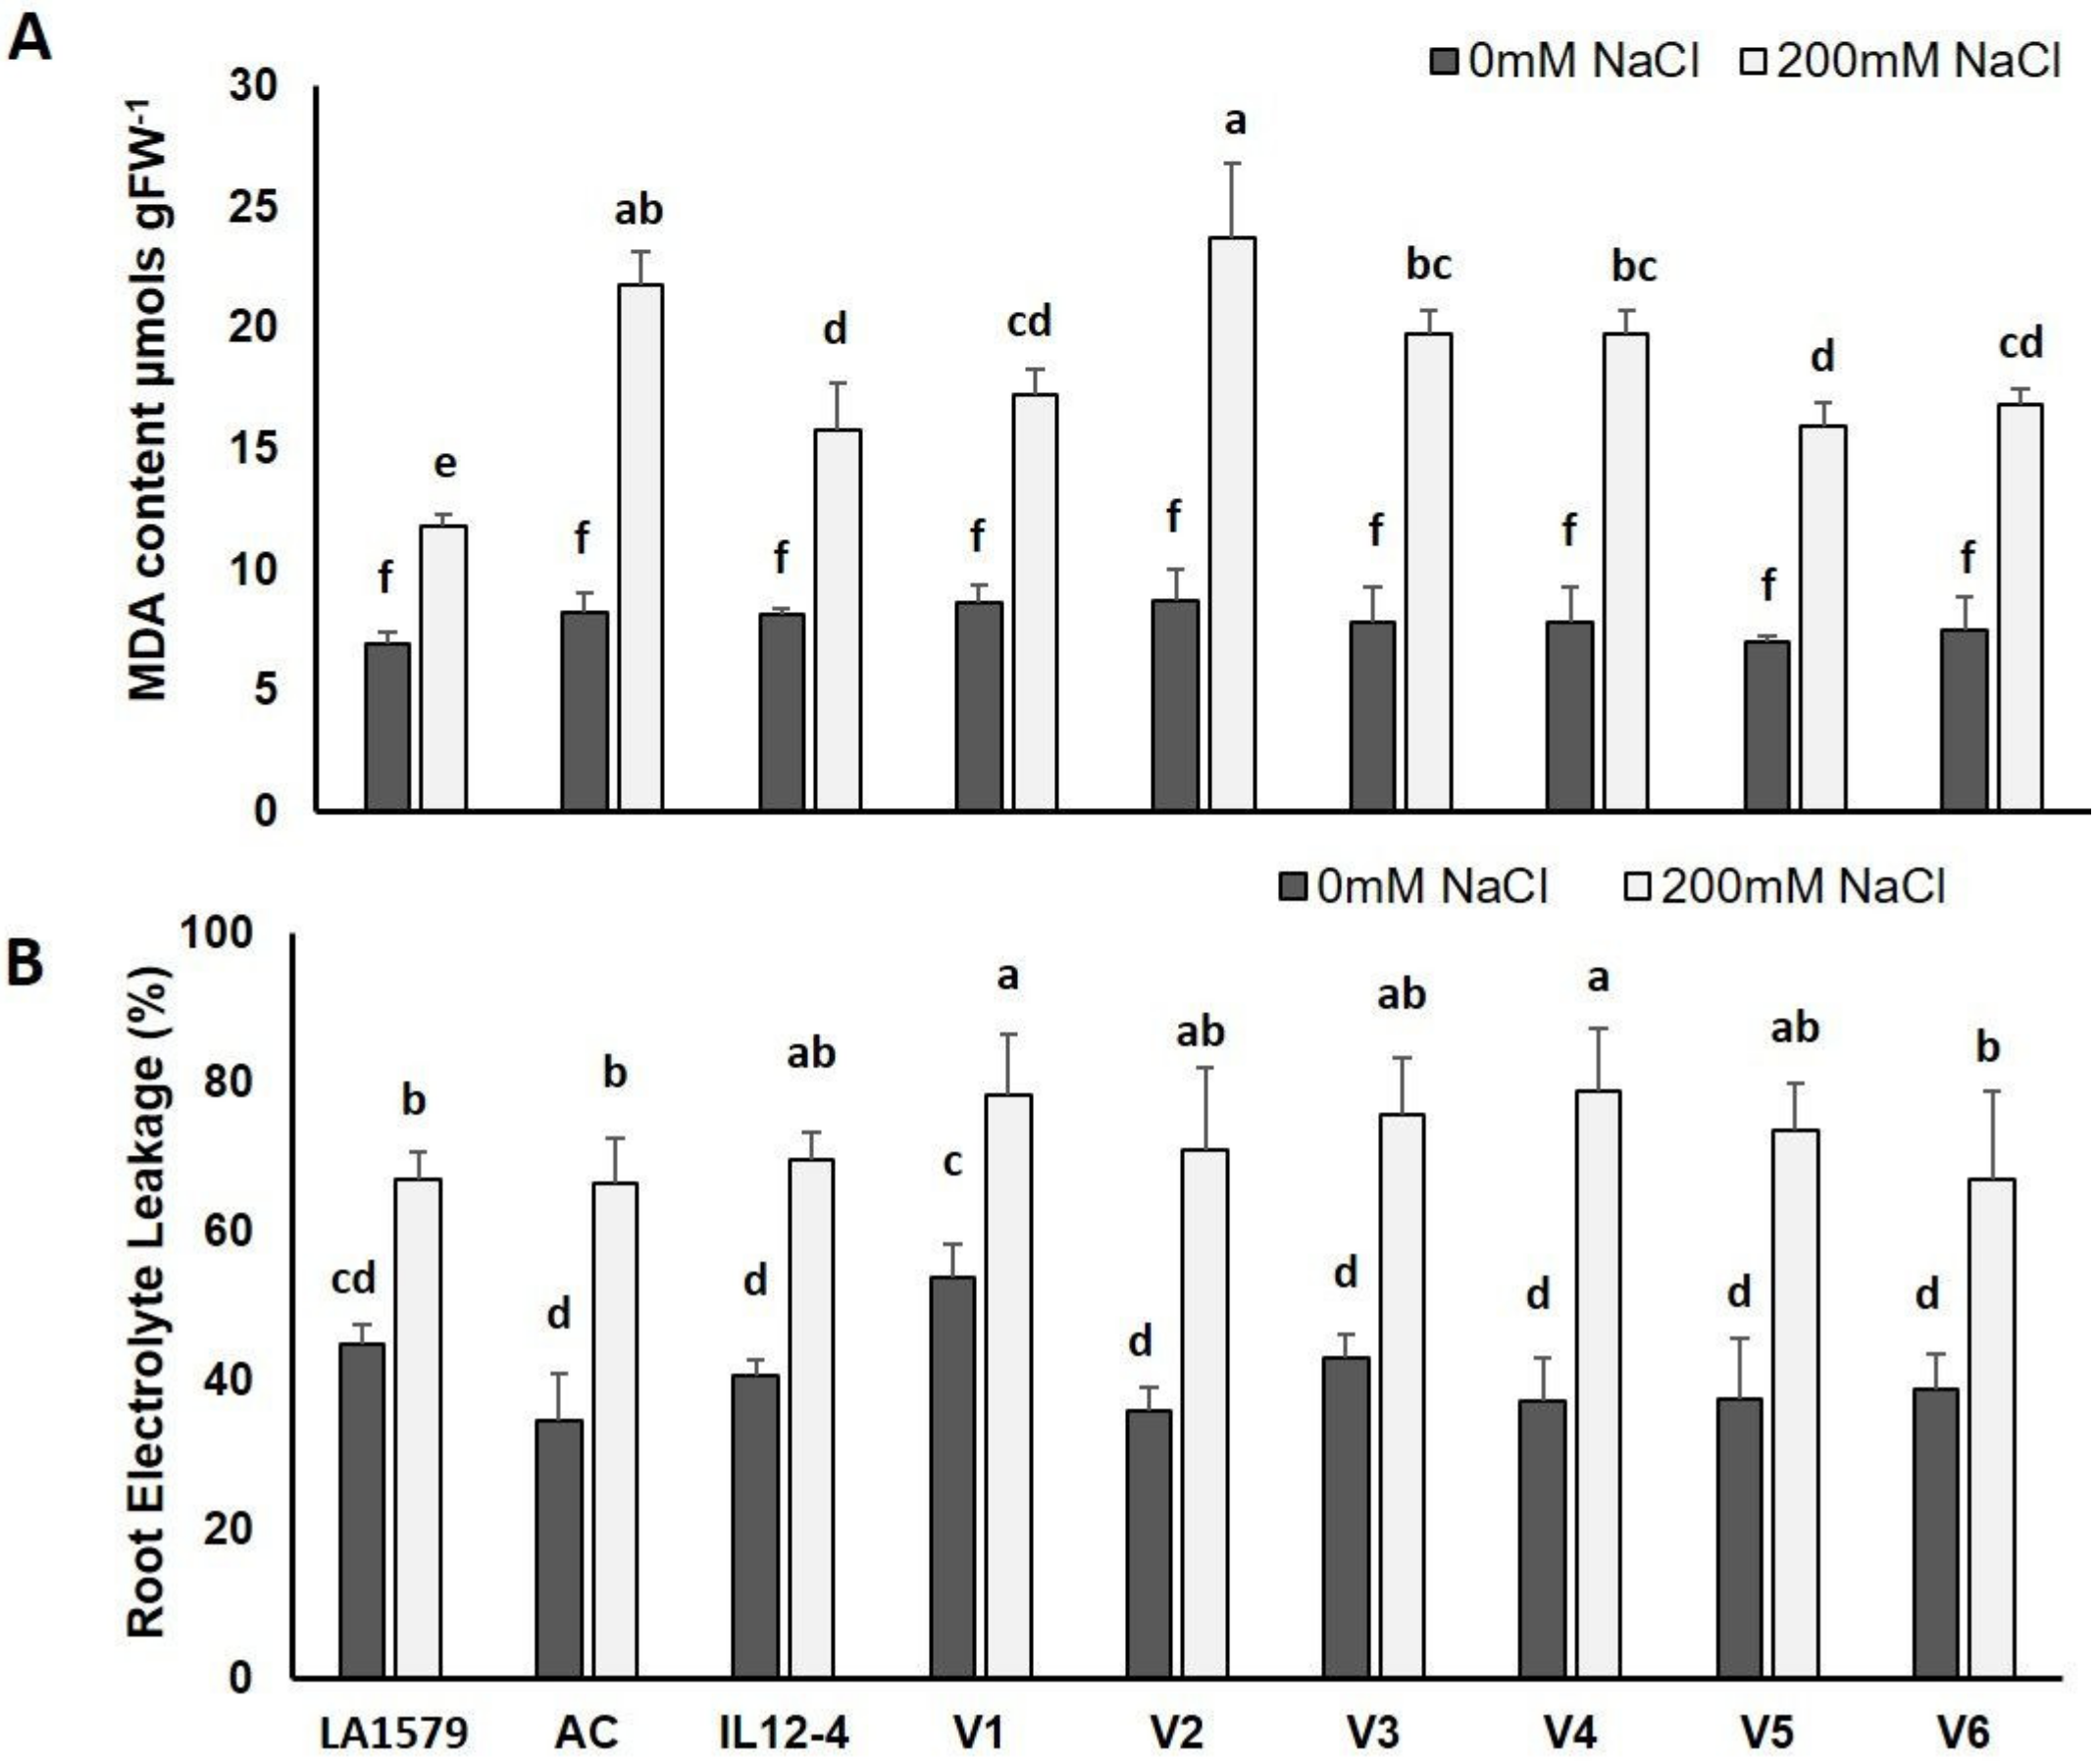
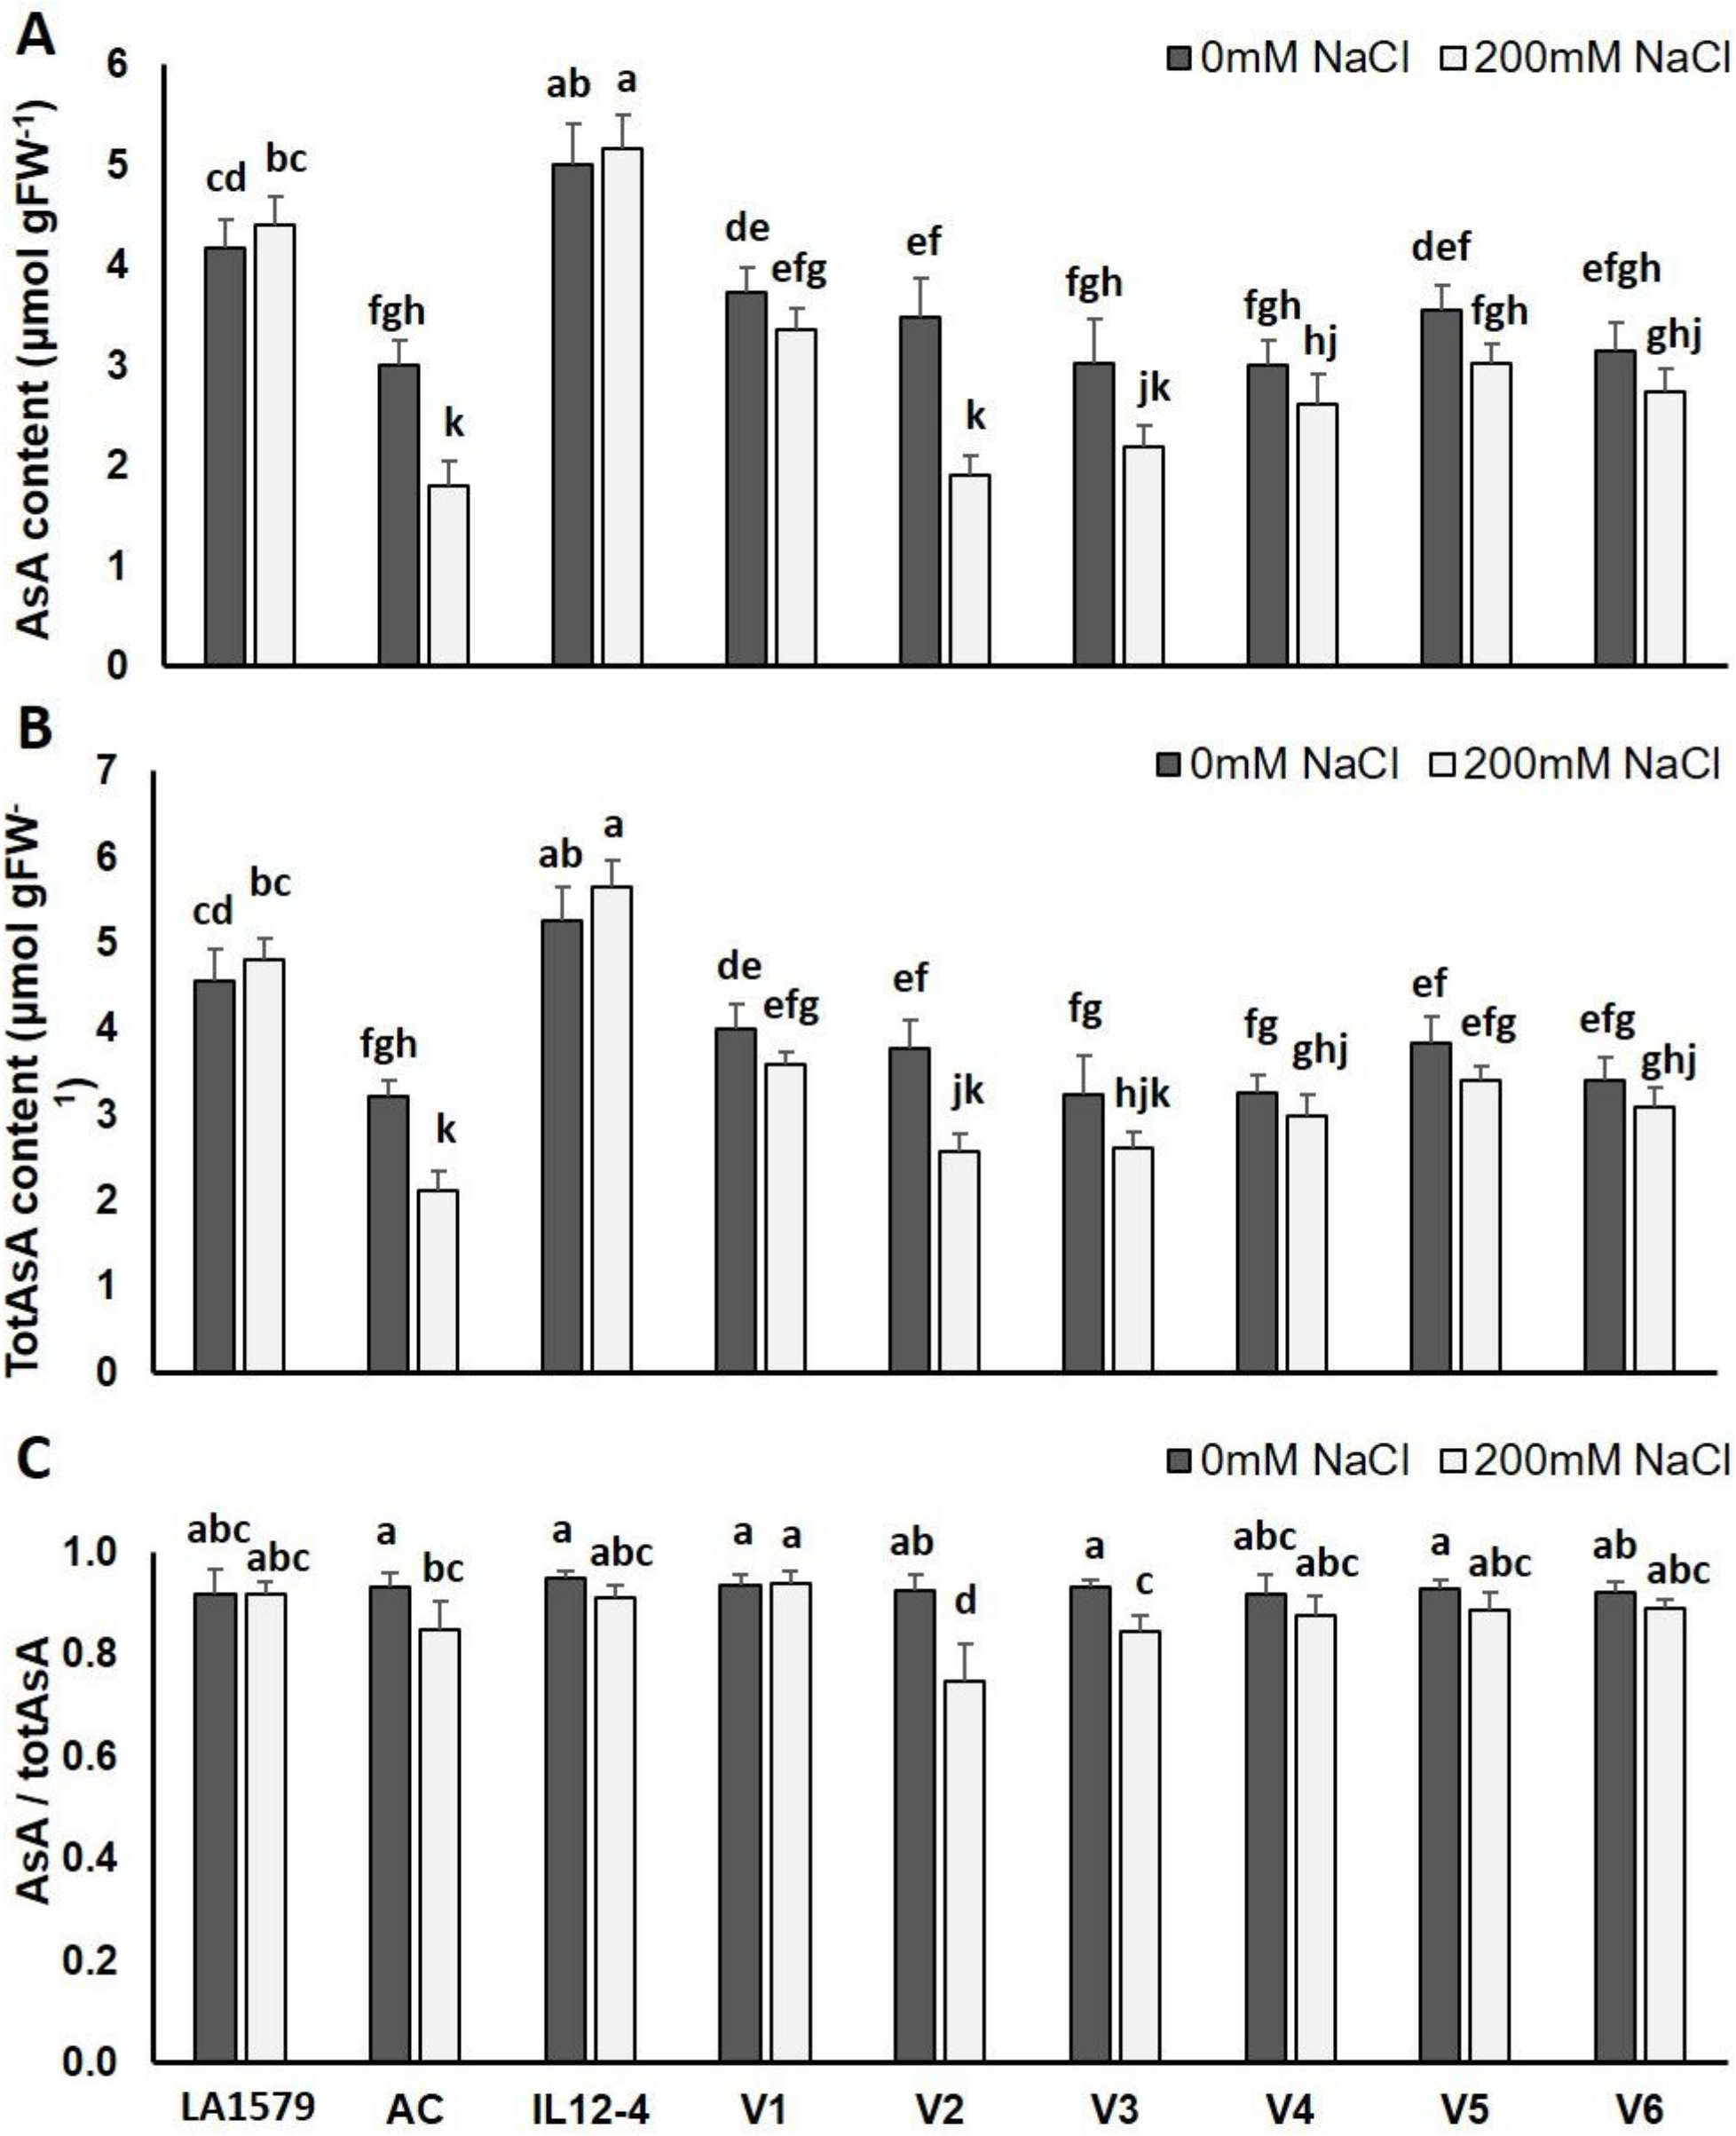
2.4. Oxidative Stress

Analysis of variance applied on data obtained from the relevant biochemical markers of tomato (MDA, REL, ascorbic acid (AsA), total AsA (totAsA) and AsA/totAsA ratio) has a significant effect due to genotype (G) and salt stress (S), which was also observed, in most cases, from their interactions (Table S2). Lipid peroxidation, based on leaf MDA content, was significantly upregulated in all genotypes exposed to 200 mM NaCl, compared to control plants (Figure 2A). The increase ranged from only 71.0% or 93.6% in tolerant genotypes (LA1579 and IL12-4, respectively) to 173.9% and 163.8% in V2 and AC, respectively. Relatively low MDA content was also determined in V1, and to a lesser extent in V5 and V6, compared to V2 and AC, which are considered to be sensitive genotypes, suggesting that these genotypes probably also suffered from a lesser degree of membrane injury.
Furthermore, V1, LA1579 and IL12-4 exhibited lower REL due to the exposure to salt stress, these being 45.3%, 49.4% and 71.1%, respectively, compared to unstressed plants (Figure 2B). By contrast, the highest REL was recorded in V4, V2, V5 and AC, with a decrease of 111%, 97.1%, 95.6% and 92.2%, compared to unstressed plants, respectively, indicating that the roots of these genotypes were more sensitive to salt-mediated injury caused by NaCl.
A significant reduction in AsA content, and a concomitant increase in its oxidized form (dehydroascorbate), were evident in response to salt stress in AC, V2 and V3, compared to control plants, while no change was observed in the rest of the genotypes (Figure 3A). Salt stress reduced totAsA content in a similar manner, with the highest decrease being observed in AC (34.2%) and V2 (31.9%) (Figure 3B). The AsA/totAsA ratio, which serves as an indicator of oxidative stress, revealed that the greater oxidation in the AsA pool occurred in V2, followed by V3 and AC (Figure 3C).

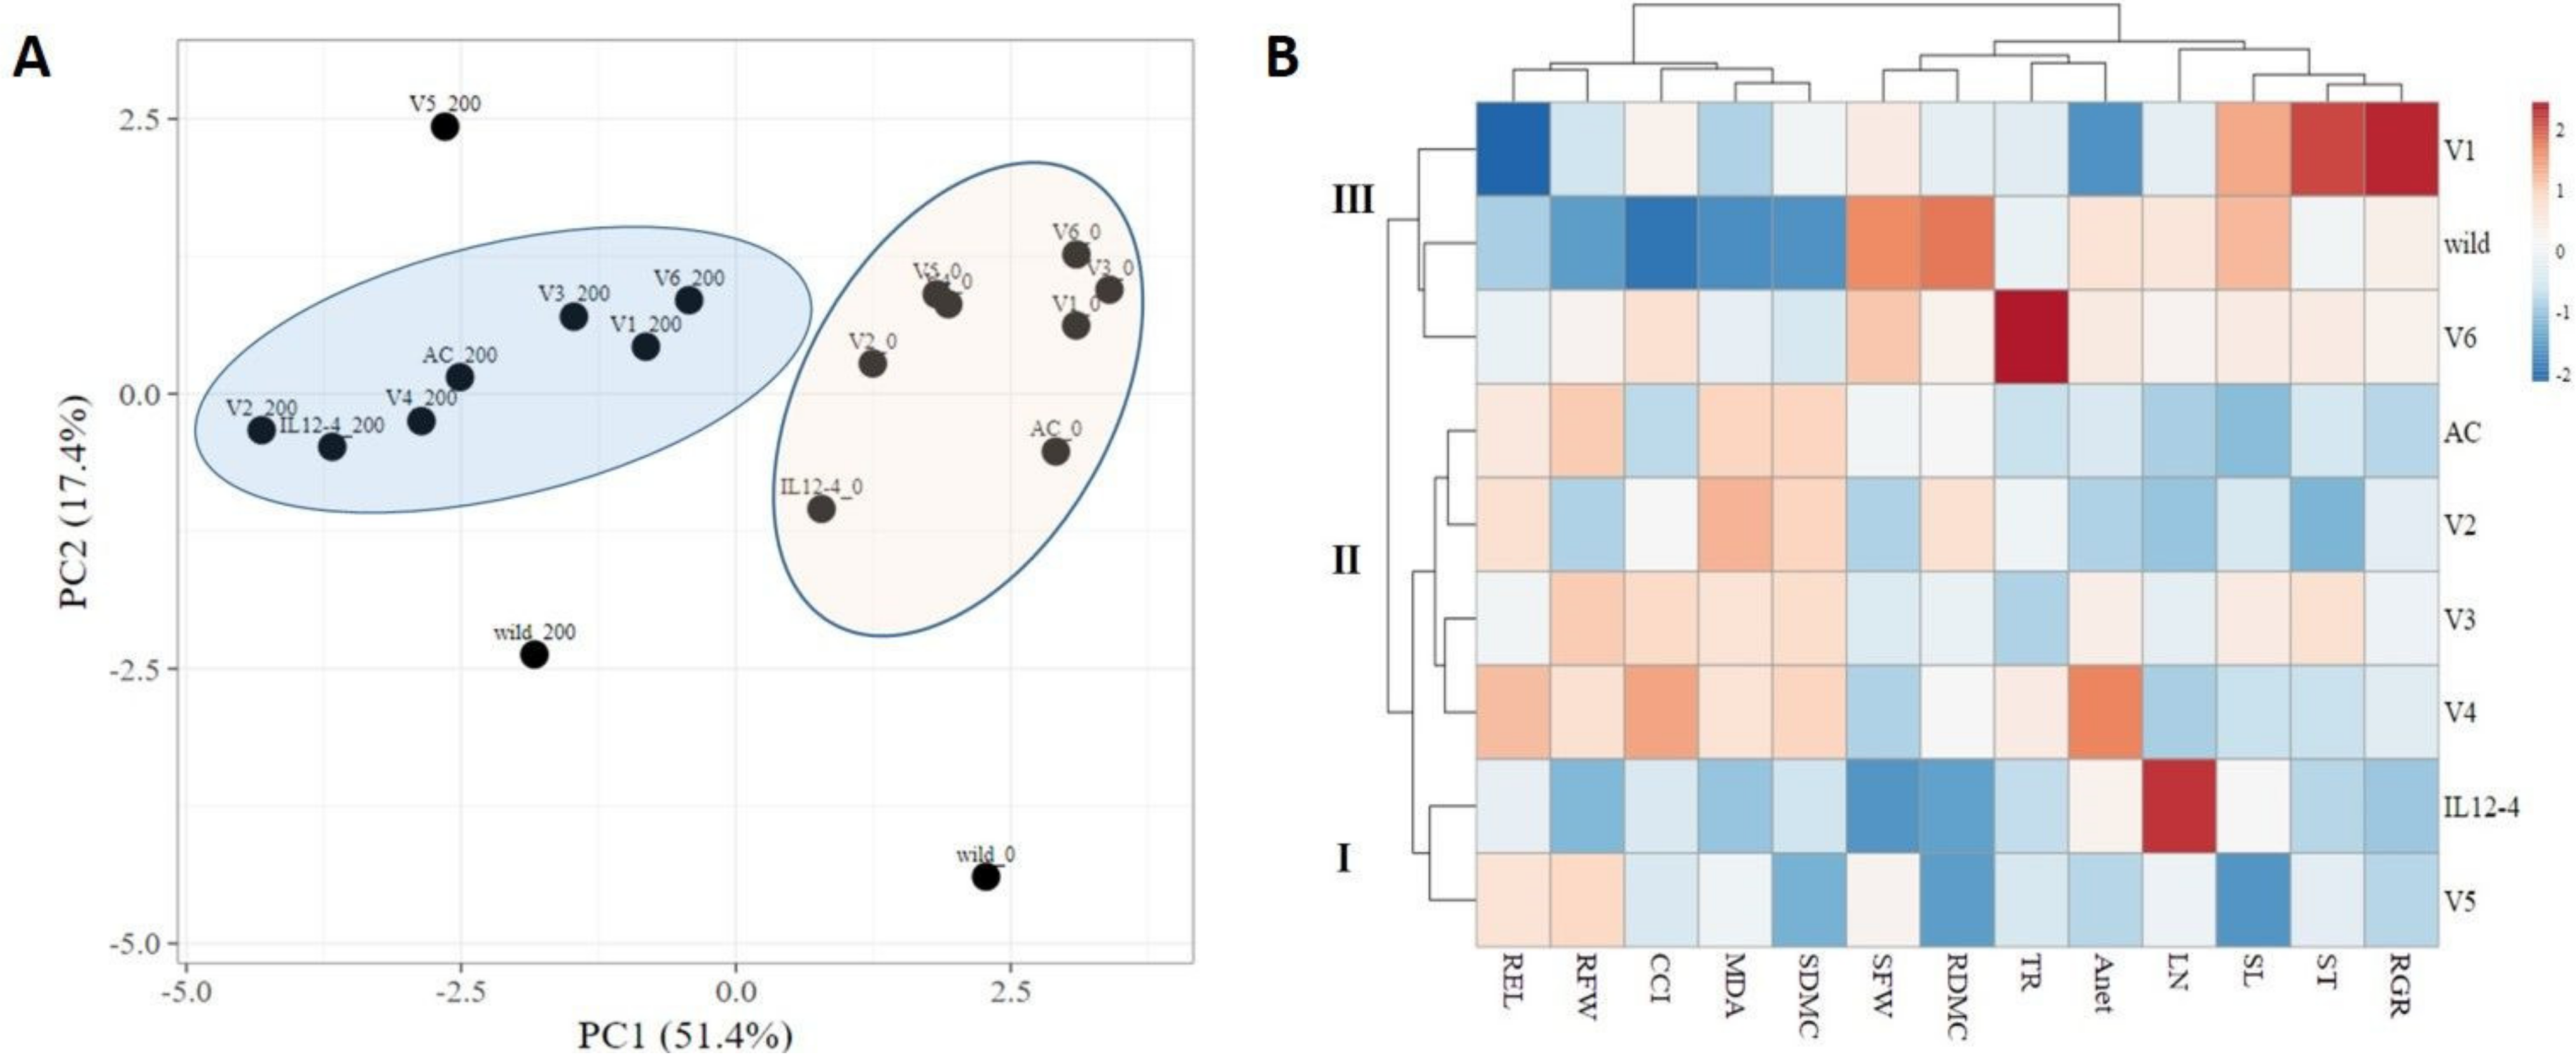
2.5. Principal Component Analysis and Hierarchical Clustering

The principal component analysis (PCA) was carried out for a total of 13 variables in the nine tomato genotypes subjected to 200 mM NaCl. Based on eigenvalue >1, we extracted a total of two principal components (PCs) with a cumulative distribution of 68.8% (Figure 4A). Generally, stressed and unstressed plants formed two distinct groups, although some outliers, including LA1579 and V5 at exposure to 200 mM NaCl, as well as unstressed LA1579, were also identified. Interestingly, V1 and V6 exposed to salt stress were placed close to the cross-section of the axes, and relatively closer to the group of unstressed genotypes, indicating that these genotypes had the lowest influence on total variation within the collection.
As a further step to investigate salt stress responses in the different genotypes, agglomerative hierarchical clustering (AHC) analysis on combined growth, physiological, and oxidative-related traits was employed to enable the grouping of genotypes into clusters of similar stress responses, using the Euclidean distance and Ward’s method for agglomeration (Figure 4B). The resulting dendrogram based on fold change variants between stressed and unstressed plants revealed three distinct groups: Group I is comprised of two genotypes, Group II of four genotypes and Group III of three genotypes. Cluster I contained IL12-4 and V5, demonstrating moderate tolerance to salt stress, whilst Cluster II contained the majority of landraces (V2 to V5), exhibiting salt sensitivity. Notably, Group III contained the salt-tolerant accession of S. pimpinnelifolium, which also included V1 and V6, indicating that these genotypes are also salt-tolerant. These results are in accordance with salt-tolerance indices (Table S3).

3. Discussion

Salinity is a popular and extremely important problem for the majority of plant species due to its effects on plant growth as well as crop yield [24]. Salt stress causes intensive root ion toxicity which can further result in growth reduction in the entire plant [25]. In order to cope with enriched salt conditions, plants implement a plethora of morphological, physiological and biochemical adaptations, with the effect of developmental stage and salt levels being critical in the efficiency of the activated defense mechanism to mitigate stress injury [26]. The adaptability of seedlings under salt stress may also reflect higher salt tolerance at advanced growth stages [27].
Tomato wild species and landraces have been widely employed to improve the salt tolerance of modern cultivars [15,28], but the level of tolerance is different among tomato genotypes and/or within genotypes [27]. In this work, the responses of a collection of nine tomato genotypes exposed to salt stress were evaluated using morphological, physiological and biochemical markers. Based on our results, the tomato genotypes varied remarkably in their response to salt stress. There are several similar studies dealing with genotype selection for salt tolerance at the seedling stage in tomato [27], chicory [29], cotton [30], and rice [31,32]. According Zaki and Yokoi [27], the salt adaptability of seedlings at this stage may reflect higher salinity tolerance at advanced plant stages. All growth parameters examined in this study, including SL, LN, and ST, as well as RGR, were significantly decreased, owing to salt stress, notwithstanding to a different extent between genotypes (Table 1). Based on the above-the-ground morphological collection screening, the salt-tolerant LA1579, V1, V3 and V6 were less affected, as indicated by a lesser reduction in SL, LN, ST and SFW (Table 1 and Table 2), suggesting that these cultivars exerted a similar adaptation response. Previously, SFW and SL have also been identified as efficient agronomical indicators for the evaluation of salt tolerance of different crop species, including tomato [27,33], chicory [29], potato [34], rapeseed [35], barley [36], and sorghum [37]. One of the most critical responses of plants to stress conditions is the inhibition of the growth rate. The observed reductions in RGR (25.2–70.5%) in the selected tomato genotypes exposed to salt stress compared to control plants (Table 1) are in accordance with previous reports [38,39,40]. In agreement with other agronomical traits, the higher the reduction in growth rate was observed in AC, IL12-4, and V5, whilst the smaller reduction in LA1579, V3 and V6, indicate that these genotypes are salt sensitive or salt tolerant, respectively.
When considering the below-the-ground-parts, since the primary response of plants towards salt stress is perceived by roots [27], RFW declined in all genotypes as a result of NaCl treatment (Table 2). The observed reduction in RFW could not only be due to the effect of growth inhibition, but also due to the dehydration of the plants in the presence of high salt concentration, an aspect that is in line with previous reports in rice [32]. It is, however, noteworthy that the effects of salt stress on the roots of some salt-tolerant genotypes (assigned based on shoot-related traits), i.e., LA1579, V1 and V6, were more drastic, displaying the greater decrease in RFW, compared to other, considered as salt-sensitive (AC and V5). This observation suggests the diverse adaptation responses employed by different genotypes to cope with salt stress. In particular, under salt stress, LA1579, V1 and V6 may have inhibited root growth in an attempt to take up less salt quantity [22], in order to support photosynthesis. In other words, the interplay of limitations of different tissue sites is critical for plant survival under harsh environmental conditions. Nevertheless, LA1579 exhibited increased RDMC values, demonstrating its ability to create more efficient RDMC per unit of water absorbed, so they take up less salt [22]. The high values of RDMC in salt-treated plants could be induced by the milder effect of salt stress on dry biomass than that imposed on fresh biomass, which has been previously reported by other researchers [29]. Concerning the differentiation of salt’s impact on roots and shoot, a possible explanation must be accompanied by changes in the allocation of assimilates between roots and shoots.
As a further step, two tolerance indices (SSI and STI) were evaluated to determine salt-tolerant genotypes, based on high yield potential under stress (Table S3), similar to other studies in sorghum [37]. The results support findings on morphological traits, demonstrating that, apart from LA1579, genotypes V1 and V6 had also the highest stability and yield potential under salt stress. Therefore, these genotypes, the landrace originated from ‘Santorini’ island (V1), and one breeding line, obtained from traditional cultivars too (V6), can be considered as relatively salt tolerant.
Photosynthetic response at adverse environmental conditions is an intricate physiological process that is directly connected to plant growth and performance [4,40]. Salt stress provokes photosynthesis reduction by stomatal closure, decreasing CO2 absorption and changes in stress-related genes expression [41]. Modifications in various photosynthesis parameters due to disruptions in water relations and ROS generation leading to cellular damage, have been observed in numerous studies [42,43,44,45]. In this study, several genotypes, such as LA1579, IL12-4, V3, V4 and V6, maintained at control, level their net photosynthetic rates under salt stress (Figure 1). Interestingly, although V1 was designated a salt-tolerant genotype, based on morphological traits, a profound decrease in Anet was evident (Figure 1B), indicating a possible trade-off between growth, physiological and tolerance responses, as previously reported in tobacco plants with reduced polyamine content [4]. In order to save water under salt stress, plants provoke stomata closure, consulting to stomatal conductance and photosynthesis reduction [46]. However, similar to previous reports [4], the remarkable decrease in Anet was not accompanied by ST or TR in a similar pattern (Figure 1), i.e., genotype V3. In addition, the observed decrease in Anet of tomato genotypes under salt stress cannot be attributed to the decrease in chlorophyll content either, as CCI of almost all genotypes was not affected by salt stress, due to the high standard deviation. It is worth noticing that, according to previous studies [4,47], CCI was not a reliable indicator of NaCl tolerance. The observed physiological responses of tomato seedlings to salt stress may be included to the first level of plant responses where the shoot ion-independent response occurs within minutes to days [48], whereas Roy et al. [49] related this situation to Na+ sensing and signaling. In this first phase of responses, the significant inhibitions of SC, TR and Anet, which were observed in this study, are in accordance with previous studies [48,50], which referred that the primary effects of salinity on water relations can cause stomatal closure, the inhibition of transpiration and of leaf expansion. The observed decrease in biomass (expressed as SFW and RFW) under salt stress in the majority of genotypes (Table 2) might be related to reduced stomatal conductance leading to less efficient photosynthesis, and suppression of cell expansion under low turgor pressure due to osmotically induced water loss [51,52].
ROS-mediated oxidative damage is stimulated at exposure to salt, leading to lipid peroxidation and membrane damage inter alia [53]. Oxidative-induced yield penalties, probably owing to the crosstalk between developmental and stress-responsive networks at exposure of plants to excessive salt, have been reported in a broad number of plant species, including maize, wheat, bean, tomato and sugarcane [54]. The product of fatty acid peroxidation, MDA, is widely employed as a sign of oxidative damage under stress [55,56]. As a general consensus, salt acclimated plants have lower MDA content [57,58]. In agreement with these findings, the salt tolerant genotypes, LA1579 and V1, as well as IL12-4, had lower leaf MDA contents compared to some salt sensitive genotypes, such as V2 and AC (Figure 2A), suggesting that these genotypes were better protected against oxidative damage under salt stress. Similarly, our results also support the notion that V5 and V6 probably suffered from less membrane injury, while V3 and V4 cannot efficiently protect membranes from peroxidation.
Electrolyte leakage from plasma membranes in roots has been considered as another critical factor for the identification of salt-tolerant genotypes [58]. Our results highlighted that REL increased progressively with respect to control values with decreasing salt tolerance, in agreement with leaf MDA contents (Figure 2). Combined with physiological measurements, lower leaf MDA and REL, as well as high SC, TR, and Anet, suggested that the salt-tolerant V6 was able to maintain higher water status under salt stress to alleviate cell damage and protect the photosynthetic apparatus. By contrast, in the salt-sensitive V3, the remarkable reduction in TR and SC helped maintain the water status and protected, to a certain extent, photosynthesis at exposure to salt stress, but it was not enough to protect from lipid peroxidation or electrolyte leakage.
Although AsA has been known to improve plant defense antioxidant system against salt enriched conditions, little is known about the physiological and biochemical responses of AsA-mediated alleviation of salt stress in tomatoes. It has been previously reported that AsA is able to reverse the adverse effects of salt stress on plant growth through enhancing stress-responsive proteins [59]; thus, it has been employed as a priming agent to alleviate the deleterious effects of salt in tomatoes [60]. Our results demonstrated that salt tolerant genotypes, such as LA1579, V1 and V6, exposed to salt stress, maintained their leaf AsA content at control levels, while V2 and AC showed a significant decrease (Figure 3). In some other genotypes, such as IL12-4, V4 and V5, AsA content was not affected by salt stress, but this was not enough to protect plants from cellular oxidative damage.

4. Materials and Methods

4.1. Plant Material and Growth Conditions

The collection of tomato germplasm (Solanum lycopersicum) used to study seedling responses to salt stress included five landraces (cvs ‘Santorini’, ‘Zakynthos’, ‘Paxoi’, ‘HL073’, ‘Agiou Orous’, named V1 to V5, respectively), one modern variety (cv ‘Makedonia’—V6), the salt-sensitive cv ‘Ailsa Craig’ (AC), the salt-tolerant accession LA1579 (a wild species of Solanum pimpinellifolium), as well as the Solanum pennellii introgression line IL12-4 (LA4120), rich in vitamin C content (Table S1). More details on the origin and the phenotypic characterization of the selected landraces can be found elsewhere [61]. Seeds were obtained either from the vegetable collection preserved at the Hellenic Agricultural Organization (HAO) Demeter, originated from different districts in Greece (Makedonia, Ionian Sea, Aegean Sea, Crete), or from the Tomato Genetics Resource Center (TGRC). The experiments were conducted in the greenhouse of Institute of Plant Breeding and Genetic Resources (IPGRB) of HAO-Demeter (Thessaloniki, North Greece, 40°32′11.69′′ N and 22°59′58.08′′ E) during September 2020. Seeds were sown in individual 10 cm diameter pots filled with peat and grown under the following conditions: 60–70% relative humidity, 14/10 h light/dark photoperiod, and 26/18 °C day/night temperatures. Three weeks after germination, 200 mM NaCl was applied through irrigation on 20 plants per genotype, while control plants were watered regularly with tap water, essentially as previously described [4]. Salt treatments were applied every second day for a total of 10 days, in pots placed over flat discs. A completely randomized design with twenty replicates per treatment per genotype was used. Soil water content was regularly measured with a ProCheck meter (Decagon Devices, Pullman, WA, USA) equipped with TEROS10 sensor (METER Group AG, München, Germany), to ensure a comparable volumetric soil moisture between control and salt-treated plants.

4.2. Plant Growth and Developmental Characteristics

At the end of stress treatment, several growth, agronomical and physiological parameters were evaluated on 20 plants per treatment. SL was measured using a graduated ruler, ST was evaluated with an electronic caliper at the point just beneath the third expandable leaf, whereas LN per plant was also counted. Afterwards, plants were removed from pots, gently rinsed to eliminate the soil from the roots with deionized water, separated into leaves and roots, blotted carefully with tissue paper, and weighed to determine the corresponding SFW and RFW. Tissues were then dried in an oven at 70 °C for 48 h to determine shoot and root dry weights and calculate the percentage of shoot and root dry matter content (SDMC and RDMC, respectively). Furthermore, in order to examine the shoot growth response to salt stress, RGR of shoot growth were determined destructively over two harvests, the first just prior salinity application (t1), and the second (t2) at the end of salt treatment, according to Stevens et al. [34]. RGR expressed as g g−1 day−1 was based on dry mass and calculated using the following formula [57]:
RGR = (ln Wt2 − ln Wt1)/(t2 − t1),
where Wt1 and Wt2 corresponded to dry weight at first and second harvest, respectively, while t2 and t1 referred to the age of seedlings at initial and second harvest.
Moreover, in order to assess salt tolerance of each genotype, we determined the stress indices, SSI and STI, based on the above-the-ground and total biomass using the following equations [38]:
SSS = [1 − (Ys/Yp)]/[1 − (Ȳsp)]
and
STI = (Yp × Ys)/(Ȳp)2,
where Yp and Ys were the average seedling dry weight of a given genotype under non-stress and NaCl-stress conditions, respectively, whereas Ȳp and Ȳs were the average seedling dry weights of all genotypes under non-stress and stress conditions, respectively.

4.3. Photosynthetic Parameters

Anet (μmol m−2s −1), TR (mmol H2O m2 s−1), and SC (mol CO2 m−2 s−1) were evaluated at the end of stress treatment using the portable photosynthesis system LCi-SD (ADC Bioscientific Ltd., Hoddesdon, UK). The photosynthetically active radiation (PAR) incident on leaf surface was 380 ± 50 µmol (photon) m–2 s–1, the CO2 concentration in the chamber was 410 ± 10 µmol (CO2) mol–1, the chamber temperature was set at 25 ± 1 °C, whereas the water reference as partial pressure was 31.3 ± 2 mbar. CCI was assessed with a portable Chlorophyll Content Meter (CCM-200, Opti-Sciences, Tyngsboro, MA, USA). All the physiological parameters were evaluated on the second developed leaf (counting from the apex) in 10 seedlings per genotype per treatment. To avoid photoinhibition, all physiological measurements were performed in a 2 h time span, approximately two hours after sunrise.

4.4. Root Electrolyte Leakage

REL was essentially determined as previously described [62]. Briefly, at the end of stress treatment, roots were thoroughly rinsed with tap water to remove any soil particles. Then, 100 mg of roots were immersed in glass tubes containing 15 mL of deionized water with known EC and vortexed vigorously. After 24 h in dark, EC was measured before and after boiling at 110 °C for 20 min using the electrical conductivity meter 712 ConductoMeter (Metrohm, Herisau, Switzerland). The injury index was estimated from the formula: REL (%) = [(EC before/EC after boiling) × 100]/initial root weight. Measurements were performed using five replicates per treatment and per genotype.

4.5. Lipid Peroxidation and Ascorbic Acid Contents

The MDA content was determined in leaf samples to estimate the degree of lipid peroxidation using the thiobarbituric acid (TBA) test [63], with a few modifications [39]. Briefly, frozen leaf powder (200 mg) was homogenized in 600 mL 0.1% (w/v) trichloroacetic acid (TCA) solution. The homogenate was centrifuged at 14,000 rpm for 15 min at 4 °C and 0.5 mL of the supernatant was added to 1.5 mL 0.5% (w/v) TBA in 20% TCA. After incubating the mixture in boiling water for 25 min, the reaction was completed by immersing the reaction tubes on ice. The MDA content was calculated by measuring the absorbance of supernatant was read at 532 nm, after subtracting the value for non-specific absorption at 600 nm, using an extinction coefficient of 155 mM−1 cm−1.
Similarly, the AsA content was determined spectrophotometrically in the same leaf samples using the ascorbate oxidase (AO) enzyme as previously described [64]. Calculations were based upon the difference in absorbance at 265 nm before, and 3 min after the addition of AO (1 U/μL) to a 200 μL aliquot of extract in 200 mM sodium phosphate buffer (pH 5.6). Total AsA (totAsA) content was determined by measuring absorbance before and 5 min after adding 10 mM DTT to a separate extract aliquot.
For the determination of both MDA and AsA contents, fully expanded leaves were obtained from five individual seedlings per treatment and per genotype, considered as biological replicates.

4.6. Statistical Analysis

The statistical analysis (ANOVA) was carried out using the computer software MSTAT-C version 1.41 (Michigan State University, East Lansing, MI). All measures and derived data were objected to an analysis of variance by using the Experiment Model Number 1: two factor completely randomized design, with genotype and salt treatment as factors. Tukey’s multiple comparison procedures were used to detect and separate mean treatments differences at p < 0.05. In order to compare means within each genotype, we used the independent samples t-test in SPSS (IBM version 23). The web tool Clustvis [65] was used for the visualization of clustering on multivariate data using PCA and AHC (heatmap). The construction of two-dimensional (2D) plots was based on the first two PCs. The AHC analysis was performed using Euclidean distance and Ward’s method, to systematically analyze and assess salt tolerance, using the fold change variants between stressed and unstressed plants per genotype.

5. Conclusions

In the present study, the different genotypes responded variably for each trait under salt stress. The existence of genotypic variation—prerequisite for genetic improvement—of the observed data of all growth, physiological and oxidative-related traits was evident, and this safeguards the diverse modes of action accounting for salinity tolerance within the selected tomato germplasm. The AHC analysis classified the collection of tomato genotypes in three distinct groups with contrasting salt tolerance. Salt tolerant genotypes, such as the wild accession LA1579, or the landraces originated from Greece with the codes V1 and V6, clearly exhibited better tolerance/adaptivity to moderate salt stress. Furthermore, they were able to maintain leaf AsA content at control levels. On the basis of our findings, these landraces could be potential genetic material for breeding programs and/or grafting strategies. Our study can be the springboard for future research towards unravelling the genetic mechanisms that contribute to salt amelioration in tomato.

Supplementary Materials

The following are available online at https://www.mdpi.com/article/10.3390/stresses1040017/s1, Table S1: Details on the tomato germplasm collection used in the study to evaluate salt responses, Table S2: Results of analysis of variance applied on growth and physiological parameters of tomato seedlings of different genotypes as affected by salinity treatment. F-ratios’ significance is given for the effects exerted by tomato’s genotype and salinity treatment, Table S3: Tolerance indices stress susceptibility index (SSI) and salt tolerance index (STI) of the above-the-ground and total biomass of nine tomato genotypes subjected to 200 mM NaCl for 10 days.

Author Contributions

Conceptualization, K.K. and I.M.; Methodology, K.K., A.X., A.K. and I.M.; software analysis, K.K.; data curation, K.K.; writing, K.K. and I.M.; review and editing, A.X. and A.K.; supervision, I.M. All authors have read and agreed to the published version of the manuscript.

Funding

This research received no external funding.

Institutional Review Board Statement

Not applicable.

Informed Consent Statement

Not applicable.

Acknowledgments

The authors wish to thank the staff of the C. M. Rick Tomato Genetics Resource Center for providing seeds.

Conflicts of Interest

The authors declare no conflict of interest.

References

  1. Food and Agriculture Organization of the United Nations (FAO). 2016. Available online: http://www.fao.org/soils-portal/soil-management/management-of-some-problem-soils/salt-affected-soils/more-information-on-salt-affected-soils/en/ (accessed on 20 March 2021).
  2. Kozminska, A.; Al Hassan, M.; Hanus-Fajerska, E.; Naranjo, M.A.; Boscaiu, M.; Vicente, O. Comparative analysis of water deficit and salt tolerance mechanisms in Silene. S. Afr. J. Bot. 2018, 117, 193–206. [Google Scholar] [CrossRef]
  3. Corwin, D.L. Climate change impacts on soil salinity in agricultural areas. Eur. J. Soil Sci. 2021, 72, 842–862. [Google Scholar] [CrossRef]
  4. Mellidou, I.; Moschou, P.N.; Ioannidis, N.E.; Pankou, C.; Gėmes, K.; Valassakis, C.; Andronis, E.A.; Beris, D.; Haralampidis, K.; Roussis, A.; et al. Silencing S-adenosyl-L-methionine decarboxylase (SAMDC) in Nicotiana tabacum points at a polyamine-dependent trade-off between growth and tolerance responses. Front. Plant Sci. 2016, 7, 379. [Google Scholar] [CrossRef] [PubMed] [Green Version]
  5. Abid, M.; Zhang, Y.J.; Li, Z.; Bai, D.F.; Zhong, Y.P.; Fang, J.B. Effect of salt stress on growth, physiological and biochemical characters of four kiwifruit genotypes. Sci. Hortic. 2020, 271, 109473. [Google Scholar] [CrossRef]
  6. Shabala, S. Learning from halophytes: Physiological basis and strategies to improve abiotic stress tolerance in crops. Ann. Bot. 2013, 112, 1209–1221. [Google Scholar] [CrossRef]
  7. Gémes, K.; Mellidou, Ι.; Karamanoli, K.; Beris, D.; Park, K.Y.; Matsi, T.; Haralampidis, K.; Constantinidou, H.I.; Roubelakis-Angelakis, K.A. Deregulation of apoplastic polyamine oxidase affects development and salt response of tobacco plants. J. Plant Physiol. 2017, 211, 1–12. [Google Scholar] [CrossRef] [Green Version]
  8. Devkar, V.; Thirumalaikumar, V.P.; Xue, G.P.; Vallarino, J.G.; Turečková, V.; Strnad, M.; Fernie, A.R.; Hoefgen, R.; Mueller-Roeber, B.; Balazadeh, S. Multifaceted regulatory function of tomato SlTAF1 in the response to salinity stress. New Phytol. 2020, 225, 1681–1698. [Google Scholar] [CrossRef]
  9. Lotfi, N.; Vahdati, K.; Kholdebarin, B.; Ashrafi, E.N. Germination, mineral composition, and ion uptake in walnut under salinity conditions. HortScience 2009, 44, 1352–1357. [Google Scholar] [CrossRef] [Green Version]
  10. Ji, H.; Pardo, J.M.; Batelli, G.; Van Oosten, M.J.; Bressan, R.A.; Li, X. The salt overly sensitive (SOS) pathway: Established and emerging roles. Mol. Plant 2013, 6, 275–286. [Google Scholar] [CrossRef] [PubMed] [Green Version]
  11. Mellidou, I.; Ainalidou, A.; Papadopoulou, A.; Leontidou, K.; Genitsaris, S.; Karagiannis, E.; Van de Poel, B.; Karamanoli, K. Comparative Transcriptomics and Metabolomics Reveal an Intricate Priming Mechanism Involved in PGPR-Mediated Salt Tolerance in Tomato. Front. Plant Sci. 2021, 12, 1–22. [Google Scholar] [CrossRef]
  12. Radoglou, K.; Cabral, R.T.; Hasanagas, N.; Sutinen, M.-L.; Waisel, Y. Appraisal of root leakage as a method for estimation of root viability. Plant Biosyst. 2007, 141, 443–459. [Google Scholar] [CrossRef] [Green Version]
  13. Lotfi, N.; Soleimani, A.; Vahdati, K.; Çakmakçı, R. Comprehensive biochemical insights into the seed germination of walnut under drought stress. Sci. Hortic. 2019, 250, 329–343. [Google Scholar] [CrossRef]
  14. Singh, J.; Sastry, E.V.D.; Singh, V. Effect of salinity on tomato (Lycopersicon esculentum Mill.) during seed germination stage. Physiol. Mol. Biol. Plants 2012, 18, 45–50. [Google Scholar] [CrossRef] [Green Version]
  15. Massaretto, I.L.; Albaladejo, I.; Purgatto, E.; Flores, F.B.; Plasencia, F.; Egea-Fernández, J.M.; Bolarin, M.C.; Egea, I. Recovering tomato landraces to simultaneously improve fruit yield and nutritional quality against salt stress. Front. Plant Sci. 2018, 9, 1778. [Google Scholar] [CrossRef] [Green Version]
  16. Maksimovic, I.; Ilin, Ž. Effects of salinity on vegetable growth and nutrients uptake. In Irrigation Systems and Practices in Challenging Environments; Lee, T.S., Ed.; InTech: Rijeka, Croatia, 2012; pp. 169–190. [Google Scholar]
  17. Campos, C.A.B.; Fernandes, P.D.; Gheyi, H.R.; Blanco, F.F.; Belem, G.C.; Ferreira, C.S.A. Yield and fruit quality of industrial tomato under saline irrigation. Sci. Agric. 2006, 63, 146–152. [Google Scholar] [CrossRef] [Green Version]
  18. Karlberg, L.; Ben-Gal, A.; Jansson, P.-E.; Shani, U. Modelling transpiration and growth in salinity-stressed tomato under different climatic conditions. Ecol. Modell. 2006, 190, 15–40. [Google Scholar] [CrossRef]
  19. Raza, M.A.; Saeed, A.; Munir, H.; Ziaf, K.; Shakeel, A.; Saeed, N.; Munawar, A.; Rehman, F. Screening of tomato genotypes for salinity tolerance based on early growth attributes and leaf inorganic osmolytes. Arch. Agron. Soil Sci. 2017, 63, 501–512. [Google Scholar] [CrossRef]
  20. Al-Taisan, W.A. Comparative effects of drought and salt stress on germination and seedling growth of Pennisetum divisum (Gmel.) Henr. Am. J. Appl. Sci. 2010, 7, 640–646. [Google Scholar] [CrossRef] [Green Version]
  21. Reina-Sánchez, A.; Romero-Aranda, R.; Cuartero, J. Plant water uptake and water use efficiency of greenhouse tomato cultivars irrigated with saline water. Agric. Water Manag. 2005, 78, 54–66. [Google Scholar] [CrossRef]
  22. Cuartero, J.; Fernández-Muñoz, R. Tomato and salinity. Sci. Hortic. 1998, 78, 83–125. [Google Scholar] [CrossRef]
  23. Leontidou, K.; Genitsaris, S.; Papadopoulou, A.; Kamou, N.; Bosmali, I.; Matsi, T.; Madesis, P.; Vokou, D.; Karamanoli, K.; Mellidou, I. Plant growth promoting rhizobacteria isolated from halophytes and drought-tolerant plants: Genomic characterisation and exploration of phyto-beneficial traits. Sci. Rep. 2020, 10, 1–15. [Google Scholar] [CrossRef] [PubMed]
  24. Van Zelm, E.; Zhang, Y.; Testerink, C. Salt tolerance mechanisms of plants. Annu. Rev. Plant Biol. 2020, 71, 403–433. [Google Scholar] [CrossRef] [Green Version]
  25. Ibrahim, W.; Ahmed, I.M.; Chen, X.; Cao, F.; Zhu, S.; Wu, F. Genotypic differences in photosynthetic performance, antioxidant capacity, ultrastructure and nutrients in response to combined stress of salinity and Cd in cotton. Biometals 2015, 28, 1063–1078. [Google Scholar] [CrossRef]
  26. Acosta-Motos, J.R.; Ortuño, M.F.; Bernal-Vicente, A.; Diaz-Vivancos, P.; Sanchez-Blanco, M.J.; Hernandez, J.A. Plant responses to salt stress: Adaptive mechanisms. Agronomy 2017, 7, 18. [Google Scholar] [CrossRef] [Green Version]
  27. Zaki, H.E.M.; Yokoi, S. A comparative in vitro study of salt tolerance in cultivated tomato and related wild species. Plant Biotechnol. 2016, 33, 361–372. [Google Scholar] [CrossRef] [PubMed] [Green Version]
  28. Razali, R.; Bougouffa, S.; Morton, M.J.L.; Lightfoot, D.J.; Alam, I.; Essack, M.; Arold, S.T.; Kamau, A.; Schmöckel, S.M.; Pailles, Y.; et al. The genome sequence of the wild tomato Solanum pimpinellifolium provides insights into salinity tolerance. Front. Plant Sci. 2018, 9, 1402. [Google Scholar] [CrossRef] [Green Version]
  29. Ntatsi, G.; Aliferis, K.A.; Rouphael, Y.; Napolitano, F.; Makris, K.; Kalala, G.; Katopodis, G.; Savvas, D. Salinity source alters mineral composition and metabolism of Cichorium spinosum. Environ. Exp. Bot. 2017, 141, 113–123. [Google Scholar] [CrossRef]
  30. Sikder, R.K.; Wang, X.; Jin, D.; Zhang, H.; Gui, H.; Dong, Q.; Pang, N.; Zhang, X.; Song, M. Screening and evaluation of reliable traits of upland cotton (Gossypium hirsutum L.) genotypes for salt tolerance at the seedling growth stage. J. Cott. Res. 2020, 3, 11. [Google Scholar] [CrossRef]
  31. Chunthaburee, S.; Dongsansuk, A.; Sanitchon, J.; Pattanagul, W.; Theerakulpisut, P. Physiological and biochemical parameters for evaluation and clustering of rice cultivars differing in salt tolerance at seedling stage, Saudi. J. Biol. Sci. 2016, 23, 467–477. [Google Scholar]
  32. Chang, J.; Cheong, B.E.; Natera, S.; Roessner, U. Morphological and metabolic responses to salt stress of rice (Oryza sativa L.) cultivars which differ in salinity tolerance. Plant Physiol. Biochem. 2019, 144, 427–435. [Google Scholar] [CrossRef] [PubMed]
  33. Akinci, S.; Yilmaz, K.; Akinci, I.E. Response of tomato (Lycopersicon esculentum Mill.) to salinity in the early growth stages for agricultural cultivation in saline environments. J. Environ. Biol. 2004, 25, 351–357. [Google Scholar]
  34. Rashid, M.H.O.; Islam, S.; Bari, M. In vitro screening for salt stress tolerance of native and exotic potato genotypes by morphological and physiological parameters. J. Bio-Sci. 2019, 28, 21–32. [Google Scholar] [CrossRef]
  35. Wu, H.; Guo, J.; Wang, C.; Li, K.; Zhang, X.; Yang, Z.; Li, M.; Wang, B. An effective screening method and a reliable screening trait for salt tolerance of Brassica napus at the germination stage. Front. Plant Sci. 2019, 10, 530. [Google Scholar] [CrossRef] [PubMed]
  36. Doğru, A.; Yılmaz Kaçar, M. A preliminary study on salt tolerance of some barley genotypes. Sak. Univ. J. Sci. 2019, 23, 755–762. [Google Scholar]
  37. Rajabi Dehnavi, A.; Zahedi, M.; Ludwiczak, A.; Cardenas Perez, S.; Piernik, A. Effect of salinity on seed germination and seedling development of Sorghum (Sorghum bicolor (L.) Moench) genotypes. Agronomy 2020, 10, 859. [Google Scholar] [CrossRef]
  38. Stevens, J.; Senaratna, T.; Sivasithamparam, K. Salicylic Acid Induces Salinity Tolerance in Tomato (Lycopersicon esculentum cv. Roma): Associated Changes in Gas Exchange, Water Relations and Membrane Stabilisation. Plant Growth Regul. 2006, 49, 77–83. [Google Scholar]
  39. Mellidou, I.; Karamanoli, K.; Constantinidou, H.-I.A.; Roubelakis-Angelakis, K.A. Antisense-mediated S-adenosyl-L-methionine decarboxylase silencing affects heat stress responses of tobacco plants. Funct. Plant Biol. 2020, 47, 651–658. [Google Scholar] [CrossRef]
  40. De la Torre-González, A.; Navarro-León, E.; Albacete, A.; Blasco, B.; Ruiz, J.M. Study of phytohormone profile and oxidative metabolism as key process to identification of salinity response in tomato commercial genotypes. J. Plant Physiol. 2017, 216, 164–173. [Google Scholar] [CrossRef] [PubMed]
  41. Wungrampha, S.; Joshi, R.; Singla-Pareek, S.L.; Pareek, A. Photosynthesis and salinity: Are these mutually exclusive? Photosynthetica 2018, 56, 366–381. [Google Scholar] [CrossRef]
  42. Haghighi, M.; Pessarakli, M. Influence of silicon and nano-silicon on salinity tolerance of cherry tomatoes (Solanum lycopersicum L.) at early growth stage. Sci. Hortic. 2013, 161, 111–117. [Google Scholar] [CrossRef]
  43. Rivero, R.M.; Mestre, T.C.; Mittler, R.; Rubio, F.; Garcia-Sanchez, F.; Martinez, V. The combined effect of salinity and heat reveals a specific physiological, biochemical and molecular response in tomato plants. Plant Cell Environ. 2014, 37, 1059–1073. [Google Scholar] [CrossRef]
  44. Zhao, Y.Y.; Yan, F.; Hu, L.P.; Zhou, X.T.; Zou, Z.R.; Cui, L.R. Effects of exogenous 5-aminolevulinic acid on photosynthesis, stomatal conductance, transpiration rate, and PIP gene expression of tomato seedlings subject to salinity stress. Genet. Mol. Res. 2015, 14, 6401–6412. [Google Scholar] [CrossRef] [PubMed]
  45. Mellidou, I.; Karamanoli, K.; Beris, D.; Haralampidis, K.; Constantinidou, H.-I.A.; Roubelakis-Angelakis, K. Underexpression of apoplastic polyamine oxidase improves thermotolerance in Nicotiana tabacum. J. Plant Physiol. 2017, 218, 171–174. [Google Scholar] [CrossRef]
  46. Taiz, L.; Zeiger, E.; Møller, I.M.; Murphy, A. Plant Physiology and Development, 6th ed.; Sinauer Associates, Inc., Publishers: Sunderland, MA, USA, 2015; pp. 269–279. [Google Scholar]
  47. Misra, A.N.; Srivastava, A.; Strasser, R.J. Utilization of fast chlorophyll a fluorescence technique in assessing the salt/ion sensitivity of mung bean and Brassica seedlings. J. Plant Physiol. 2001, 158, 1173–1181. [Google Scholar] [CrossRef]
  48. Negrão, S.; Schmöckel, S.M.; Tester, M. Evaluating physiological responses of plants to salinity stress. Ann. Bot. 2017, 119, 1–11. [Google Scholar] [CrossRef] [PubMed] [Green Version]
  49. Roy, S.J.; Negrão, S.; Tester, M. Salt resistant crop plants. Curr. Opin. Biotechnol. 2014, 26, 115–124. [Google Scholar] [CrossRef] [PubMed]
  50. Mahlooji, M.; Seyed Sharifi, R.; Razmjoo, J.; Sabzalian, M.R.; Sedghi, M. Effect of salt stress on photosynthesis and physiological parameters of three contrasting barley genotypes. Photosynthetica 2018, 56, 549–556. [Google Scholar] [CrossRef]
  51. Shao, H.; Chu, L.; Jaleel, C.A.; Zhao, C. Water-deficit stress-induced anatomical changes in higher plants. C. R. Biol. 2008, 331, 215–225. [Google Scholar] [CrossRef] [PubMed]
  52. Aghaie, P.; Hosseini Tafreshi, S.A.; Ebrahimi, M.A.; Haerinasab, M. Tolerance evaluation and clustering of fourteen tomato cultivars grown under mild and severe drought conditions. Sci. Hortic. 2018, 232, 1–12. [Google Scholar] [CrossRef]
  53. Sachdev, S.; Ansari, S.A.; Ansari, M.I.; Fujita, M. Abiotic Stress and Reactive Oxygen Species: Generation. Antioxidants 2021, 10, 277. [Google Scholar] [CrossRef]
  54. Wahid, A.; Gelani, S.; Ashraf, M.; Foolad, M. Heat tolerance in plants: An overview. Environ. Exp. Bot. 2007, 61, 199–223. [Google Scholar] [CrossRef]
  55. Davey, M.W.; Stals, E.; Panis, B.; Keulemans, J.; Swennenet, R.L. High-throughput determination of malondialdehyde in plant tissues. Anal. Biochem. 2005, 347, 201–207. [Google Scholar] [CrossRef]
  56. Zeeshan, M.; Lu, M.; Sehar, S.; Holford, P.; Wu, F. Comparison of biochemical, anatomical, morphological, and physiological responses to salinity stress in wheat and barley genotypes deferring in salinity tolerance. Agronomy 2020, 10, 127. [Google Scholar] [CrossRef] [Green Version]
  57. Katsuhara, M.; Otsuka, T.; Ezaki, B. Salt stress-induced lipid peroxidation is reduced by glutathione S-transferase, but this reduction of lipid peroxides is not enough for a recovery of root growth in Arabidopsis. Plant Sci. 2005, 169, 369–373. [Google Scholar] [CrossRef]
  58. Ashraf, M.; Ali, Q. Relative membrane permeability and activities of some antioxidant enzymes as the key determinants of salt tolerance in canola (Brassica napus L.). Environ. Exp. Bot. 2008, 63, 266–273. [Google Scholar] [CrossRef]
  59. Farooq, M.; Hussain, M.; Wakeel, A.; Siddique, K.H.M. Salt stress in maize: Effects, resistance mechanisms, and management. A review. Agron. Sustain. Dev. 2015, 35, 461–481. [Google Scholar] [CrossRef] [Green Version]
  60. Alves, R.d.C.; Rossatto, D.R.; da Silva, J.S.; Checchio, M.V.; de Oliveira, K.R.; Oliveira, F.A.; de Queiroz, S.F.; da Cruz, M.C.P.; Gratão, P.L. Seed priming with ascorbic acid enhances salt tolerance in micro-tom tomato plants by modifying the antioxidant defense system components. Biocatal. Agric. Biotechnol. 2021, 31, 101927. [Google Scholar] [CrossRef]
  61. Mellidou, I.; Krommydas, K.; Nianiou-Obeidat, I.; Ouzounidou, G.; Kalivas, A.; Ganopoulos, I. Exploring morpho-physiological profiles of a collection of tomato (Solanum lycopersicum) germplasm using multivariate statistics. Plant Genet. Resour. Characterisation Util. 2020, 18, 88–97. [Google Scholar] [CrossRef]
  62. McKay, H. Root electrolyte leakage and root growth potential as indicators of spruce and larch establishment. Silva Fenn. 1998, 32, 241–252. [Google Scholar] [CrossRef] [Green Version]
  63. Heath, R.L.; Packer, L. Photoperoxidation in isolated chloroplasts: I. Kinetics and stoichiometry of fatty acid peroxidation. Arch Biochem. Biophys. 1968, 125, 189–198. [Google Scholar] [CrossRef]
  64. Pateraki, I.; Sanmartin, M.; Kalamaki, M.S.; Gerasopoulos, D.; Kanellis, A. Molecular characterization and expression studies during melon fruit development and ripening of L-galactono-1,4-lactone dehydrogenase. J. Exp. Bot. 2004, 55, 1623–1633. [Google Scholar] [CrossRef] [PubMed]
  65. Metsalu, T.; Vilo, J. ClustVis: A web tool for visualizing clustering of multivariate data using principal component analysis and heatmap. Nucleic Acids Res. 2015, 43, W566–W570. [Google Scholar] [CrossRef] [PubMed]
Figure 1. Effect of salt stress on chlorophyll content index (A), photosynthetic rate ((B); μmol CO2 m−2 s−1), transpiration rate ((C); mmol H2O m−2 s−1) and stomatal conductance ((D); mol CO2 m−2 s−1) of nine tomato genotypes subjected to 200 mM NaCl for 10 days, compared to control plants (0 mM NaCl). Data means (±) were determined from 10 biological replicates. Statistically significant values are indicated by dissimilar letters according to Tukey’s multiple comparison test at significance level 0.05.
Stresses 01 00017 g001
Figure 2. Effect of salt stress on malonyldialdehyde (MDA) content ((A); μmols gFW−1) and root electrolyte leakage (%) (B) of nine tomato genotypes subjected to 200 mM NaCl for 10 days, compared to control plants (0 mM NaCl). Data means (±) were determined from five biological replicates. Statistically significant values are indicated by dissimilar letters, according to Tukey’s multiple comparison test at significance level 0.05.
Stresses 01 00017 g002
Figure 3. Effect of salt stress on ascorbic acid (AsA) content ((A); μmol gFW−1), total ascorbic acid (totAsA) content ((B); μmol gFW−1), and the ratio AsA/totAsA (C) of nine tomato genotypes subjected to 200 mM NaCl for 10 days, compared to control plants (0 mM NaCl). Data means (±) were determined from five biological replicates. Statistically significant values are indicated by dissimilar letters according to Tukey’s multiple comparison test at significance level 0.05.
Stresses 01 00017 g003
Figure 4. (A) 2-D PCA plot of the first two components of the nine tomato genotypes subjected to salt stress (0 mM and 200 mM NaCl) based on 13 agronomical, physiological and stress-related traits; (B) heat map showing fold changes of different agronomical, physiological and stress-related traits of nine tomato genotypes subjected to 200 mM NaCl for 10 days, as compared to control plants (0 mM NaCl).
Stresses 01 00017 g004
Table 1. Effect of salt stress on shoot length (SL), leaf number (LN), shoot thickness (ST), and relative growth rate (RGR) of nine tomato genotypes subjected to 200 mM NaCl for 10 days, compared to control plants (0 mM NaCl). Each value indicates the mean value of 20 biological replicates. Statistically significant values are indicated by dissimilar letters according to Tukey’s multiple comparison test at significance level 0.05. Asterisks indicate significant % changes.
Genotypes
TraitNaCl LevelLA1579ACIL12-4V1V2V3V4V5V6
SL (cm)0 mM28.3 ab28.4 ab23.7 cdefg21.9 fghi23.7 cdefg25.3 bcdef23.1 defgh26.8 abc29.2 a
200 mM26.5 abcd22.3 fghi20.7 ghi20.9 ghi19.6 hi22.6 efgh18.9 i20.3 ghi26.0 abcde
% Change−6.5−21.6 *−10.9−4.6−17.5 *−10.7−18.2 *−24.3 *−11
LN0 mM6.6 abc7.4 a5.1 efg7.0 ab5.1 efg5.3 defg5.9 cdef4.9 fg5.2 efg
200 mM6.2 bcde6.3 abcd5.3 defg6.2 bcde4.3 g4.7 g5.0 fg4.4 g4.8 fg
% Change−5.3−14.42.8−11.4−15.7−11.3−14.6−8.5−7.7
ST (mm)0 mM3.89 fg4.79 b4.67 bc4.70 bc4.78 b4.77 b4.85 ab4.91 ab5.07 a
200 mM3.15 i3.70 gh3.49 h4.49 cd3.46 h4.12 ef3.71 gh3.87 fg4.25 de
% Change−18.9 *−22.7 *−25.3 *−4.5−27.7 *−13.7 *−23.5 *−21.2 *−16.2 *
RGR0 mM0.119 a0.042 h0.087 c0.050 g0.076 e0.082 d0.081 d0.067 f0.091 b
200 mM0.089 bc0.015 k0.026 i0.023 j0.042 h0.050 g0.043 h0.024 ij0.066 f
% Change−25.2 *−63.7 *−70.5 *−52.8 *−45.1 *−39 *−46.1 *−63.7 *−27 *
Table 2. Effect of salt stress on fresh weight of shoot (SFW) and root (RFW), as well as on dry matter content (%) of shoot (SDMC) and root (RDMC) of nine tomato genotypes subjected to 200 mM NaCl for 10 days, compared to control plants (0 mM NaCl). Each value indicates the mean value of 20 biological replicates. Statistically significant values are indicated by dissimilar letters according to Tukey’s multiple comparison test at significance level 0.05. Asterisks indicate significant % changes.
Genotypes
TraitNaCl LevelLA1579ACIL12-4V1V2V3V4V5V6
SFW (g)0 mM4.29 bcde5.58 ab4.77 abcd6.26 a5.16 abc6.11 a5.63 ab5.35 abc6.12 a
200 mM3.82 cde4.14 bcde2.81 e4.89 abcd3.43 de4.26 bcde3.69 cde4.07 bcde5.13 abcd
% Change−10.9−25.8−41.2 *−21.8−33.5 *−30.3 *−34.5 *−24−16.3
% SDMC0 mM14.18 ab11.93 cde14.70 a12.52 bcde12.48 bcde11.68 de13.01 abcd12.22 cde11.96 cde
200 mM12.44 bcde12.88 bcde14.07 ab12.65 bcde13.48 abc12.49 bcde14.07 ab11.13 e11.66 de
% Change−12.38−4.31878.1−9−2.6
RFW (g)0 mM1.18 cdef1.38 bcd1.36 bcd1.96 a1.21 cde1.59 abc1.63 abc1.33 bcd1.72 ab
200 mM0.61 g1.04 defg0.75 efg1.18 cdef0.70 fg1.19 cdef1.18 cdef0.99 defg1.17 cdef
% Change−48.7 *−24.5−44.9 *−39.6 *−42.2 *−25.1−27.6−26−31.9 *
% RDMC0 mM10.38 bcdef8.92 defg10.73 bcdef8.53 efg9.70 cdefg7.89 g9.46 cdefg8.55 efg8.43 fg
200 mM14.75 a10.88 bcde11.01 bcd10.09 cdefg12.50 ab9.35 cdefg11.53 bc8.75 defg10.43 bcdef
% Change42 *222.618.228.8 *18.521.82.323.8
Publisher’s Note: MDPI stays neutral with regard to jurisdictional claims in published maps and institutional affiliations.

