Article

Integrated Brand Analysis and Strategy—Strategic Decision Guidelines for Brand Positioning and Market Strategy


by
Hendrik Godbersen
Study Centre Stuttgart, FOM University of Applied Sciences for Economics and Management, Rotebühlstraße 121, 70178 Stuttgart, Germany
Businesses 2026, 6(2), 17; https://doi.org/10.3390/businesses6020017
Submission received: 24 January 2026 / Revised: 26 February 2026 / Accepted: 26 March 2026 / Published: 8 April 2026

Abstract

A method for integrated brand analysis and strategy is developed in this work. The foundation of this method is market research, through which the relevance of brand attributes, their evaluation for competing brands and the market performance of these brands on the steps of the buying process are determined. On this basis, the overall evaluation of brands and their number of brand attributes with the best evaluation are calculated so that strategic decision guidelines for overall brand positioning can be deduced. These strategic decision guidelines are securing the brand based on the existing identity/image, developing the brand based on the existing identity/image, developing (pivoting to) a new brand identity/image, whilst securing the strengths of the existing identity/image, and developing a new brand identity/image. On the level of brand attributes, the weighted relevance of attributes and their evaluation difference to the best competitor are calculated so that, again, strategic decision guidelines can be deduced. The strategic decision guidelines on brand attribute level are securing the attributes as the core brand identity (first priority), selecting and developing the attributes to the core brand identity (second priority), securing the attributes as the extended brand identity (third priority), and selecting and developing the attributes as the extended brand identity (fourth priority). Based on the market performance of brands across the stages of the buying process, the conversions between these steps are determined. On this basis, strategic decision guidelines for market cultivation are deduced, i.e., awareness, image, sales, and loyalty strategies. To gain first indications of the validity of the method for integrated brand analysis and strategy, it is applied to food retail and chocolate brands in the German market. Future research should focus on further validating the method and enhancing it by integrating segmenting and targeting processes and, potentially, marketing measures on an operational level.

1. Introduction

Brands are regarded as key factors for the success of companies by driving critical outcomes, such as sales and customer loyalty, amongst others (e.g., Aaker, 2012; Beverland et al., 2015; Iyer et al., 2021; W. J. Lee et al., 2016). Accordingly, brand management has a relatively long history of being considered as one of the most important managerial tasks to drive and secure a company’s success (e.g., Aaker, 1992; Iyer et al., 2021; Keller, 2003; Pappu et al., 2005). The arguably most widespread brand management approaches provide general frameworks, which comprehensively outline overall brand management (Aaker, 2010; Burmann et al., 2023; de Chernatony, 2010; Kapferer, 2012; Keller, 2013). These approaches do not, however, provide immediately actionable and specific methods of how to analyse markets, and, on this basis, develop strategies for brand positioning and market cultivation. More actionable approaches, such as importance–performance analysis (Manhas, 2010; Martilla & James, 1977) and marketing funnel analysis (Kotler & Keller, 2016), might fill this gap. However, these more actionable approaches are not fully integrated into brand management frameworks yet and do not explicitly provide decision-making guidelines based on specific market analysis results, i.e., at what specific value, what decision is advised.
Against this backdrop, the objective of this research is to develop an actionable and repeatable method for analysing brands that integrates strategic decision guidelines for brand positioning and market cultivation strategies. More specifically, the developed method should analyse the brand image so that strategic decision guidelines for overall brand positioning and for crafting the brand identity through specific attributes can be deduced. Furthermore, the market performance of brands on the steps of the buying process should be measured so that strategic decision guidelines for market cultivation can be deduced.
To this end, the theoretical foundations of brands and brand management will be laid in Section 2. On this basis, the method for integrated brand analysis and strategy will be developed in Section 3. Section 4 and Section 5 show the application of the developed method, using the examples of food retail and chocolate brands in the German market. Section 6 is dedicated to an overall conclusion.

2. Theoretical Background of Brands and Brand Management

Section 2.1, Section 2.2, Section 2.3 and Section 2.4 will conceptualise brands and brand management. Furthermore, brand image, brand identity, and brand positioning, as well as market strategies, will be explained, as these form core elements of brands and brand management.

2.1. Brand Conceptualisation

In the infancy of brand management, a brand was defined from a formal perspective as “a name, term, symbol, or design, or a combination of them which identifies the goods or services of a seller or group of sellers and distinguishes them from those of competitors” (AMA, 1948, p. 205). This formal conceptualisation of a brand evolved to a more comprehensive understanding during the second half of the twentieth century against the backdrop of societal and economic changes, such as increases in competition, saturation of markets, information overload, and the purchasing power of buyers (Burmann et al., 2023).
Modern definitions of a brand, like the one by Burmann et al. (2023, p. 13), define a brand as “a bundle of functional and non-functional benefits which, from the target groups’ point of view, differentiate the brand from competing offers in a sustainable way.” A similar definition can be found from Veloutsou and Delgado-Ballester (2018, p. 257) who conceptualise a brand on a basic level as “an evolving mental collection of actual (offer-related) and emotional (human-like) characteristics and associations which convey benefits of an offer identified through a symbol, or a collection of symbols, and differentiates this offer from the rest of the marketplace.” Cid et al. (2022) go even a step further and propose, in alignment with de Chernatony and Dall’Olmo Riley (1998), that brands should be conceptualised on multiple dimensions, i.e., legal instrument, logo, company, shorthand, risk reducer, identity system, image, value system, personality, relationship, adding value, and evolving identity.
Such broad conceptualisations of a brand recently faced criticism by Avis and Henderson (2022), as, in this case, the concept of a brand can be seen as “opaque and unwieldy”. Avis and Henderson (2022), however, acknowledge that the brand associations by the target group, which form a key element of the aforementioned wider definitions of a brand, play a central role in understanding and managing brands. This is in line with the arguably most widely spread theorisations of brands and brand management, which consider the associations of the target groups with a branded product, company, or other item as core elements (Aaker, 2010; de Chernatony, 2010; Kapferer, 2012; Keller, 2013).
Moreover, these theories link brands with the behavioural consequences of the target group. For instance, Keller (2013, p. 69) identifies the customer-based brand equity, which is defined as “the differential effect that brand knowledge has on consumer response to the marketing of that brand”, as the goal of brand management. In a similar vein, Aaker (2010) formulates that, apart from brand associations, brand awareness, perceived quality, and brand loyalty form the customer-based brand equity.
To integrate the aforementioned wider definitions of a brand, which focus predominantly on brand associations, and the approaches incorporating customer-based brand equity, the following definition of a brand is assumed here:
A brand is a product, company, or other marketable object that consists of perceived attributes, which provide a target group with value, is distinguishable from competitors, and, therewith, has the potential to lead to behavioural outcomes on the side of the target group, such as brand awareness, purchases, and re-purchases.
This definition should be understood as a narrow conceptualisation of a brand with a focus on the target group and its perceptions. The usefulness of broader definitions (e.g., Cid et al., 2022; de Chernatony & Dall’Olmo Riley, 1998) must, however, be acknowledged when different perspectives on brands are taken, e.g., the legal ownership and legal protection against imitators through brands as registered trademarks. This also implies that legal considerations have to be taken into account when brands are developed in a market based on the definition of a brand assumed in this work.

2.2. Brand Management

Brand management consists of all of the functions and processes within a company or other brand-owning institution that design, develop, and maintain predefined brands. In this context, the creation of brands should be understood as a means to an end. The eventual goal of brand management is to contribute to the financial performance of a company through the creation of strong brands (e.g., Dunes & Pras, 2017; J. Lee et al., 2008; Nguyen et al., 2015).
These understandings of brand and brand management lead to two managerial perspectives: an internal perspective, i.e., the market outcomes desired by the management and the respective measures to achieve these outcomes, and an external perspective, i.e., the actual outcomes and effects on the side of the target group (e.g., Burmann et al., 2023; de Chernatony, 2010; Kapferer, 2012). These two perspectives imply that a brand is not only created and developed by managerial efforts but also co-created by the target group (Boyle, 2007). In fact, it is essentially and eventually the target group that decides the success or failure of a brand through buying and not buying. Thus, the external perspective, i.e., knowing and meeting the customers’ needs and wants, can be seen as the more important perspective and even the core of brand management (e.g., Keller, 2013; Park et al., 1986). Amongst others, Iyer et al. (2021) and J. Lee et al. (2008) support this notion by showing that the market-orientation of a company is the precondition for effective brand management and brand performance. This means that the external perspective serves as the starting point of brand management, i.e., knowing and understanding the target group with its needs and wants, and as the end point of brand management, i.e., achieving effects in the market through brand management strategies and operations.
Consequently, brand management should aim to understand the target group’s preferences for and perception of brand attributes, as well as the market performance of one’s own brand and its competitors, i.e., the behaviour of the target group towards the brands. On this basis, corresponding brand strategies and operations can be derived.

2.3. Brand Image, Identity, and Positioning

The perception of brand attributes by the target group, conceptualised as a central element of a brand and brand management above, is normally referred to as brand image, which represents the external perspective of brand management and can be defined as all of the associations the target group has with a product, company, or other brand-owning institution (e.g., Burmann et al., 2023; Keller, 2013; Veloutsou & Delgado-Ballester, 2018). The impact of the brand image and related or similar constructs on favourable market outcomes, such as purchase intentions, customer satisfaction, brand choice, brand loyalty, market share, and overall brand equity, could be empirically established in several studies (Abin et al., 2022; Song et al., 2019; Tahir et al., 2024; Tong & Hawley, 2009).
The internal perspective of brand management is represented by the brand identity, which consists of all of the brand associations, in other words, brand attributes, that a company or other brand-owning institution aims to establish in the perception of the target group (e.g., Aaker, 2010; Burmann et al., 2023; Veloutsou & Delgado-Ballester, 2018).
Related to the concepts of brand image and brand identity is brand positioning. Brand positioning can be understood as the processes and functions of a company or other brand-owning institution to establish a preferable and distinctive brand image within the target group (e.g., Fuchs & Diamantopoulos, 2010; Kotler & Keller, 2016; Ries & Trout, 1986). However, a mutually agreed and differentiated definition of (brand) positioning does not exist (Saqib, 2021). For instance, Burmann et al. (2023) understand brand positioning as concretising and realising the brand identity towards the target group. Based on Arnott (1992), Kalafatis et al. (2000) understand positioning as the process of analysing, designing, and influencing the target group’s perceptions on a conceptual, strategic, and operational level. Thus, (brand) positioning can be seen on a rather strategic and a rather operational level (Fuchs & Diamantopoulos, 2010). In this work, the strategic perspective on brand positioning is taken. In line with Aaker and Shansby (1982), Blankson and Kalafatis (2007), and Diwan and Bodla (2011), brand positioning is understood as the foundation and guidance of brand management operations. Then, and in conjunction with the conceptualisation of brand image and brand identity above, (strategic) brand positioning is understood in this work as the processes and decisions of measuring and analysing the brand image, and crafting the brand identity.
This conceptualisation of brand positioning implies that the target group’s perception of brand attributes, relative to the perception of competitor brands, should form both the basis and the objective of brand positioning (Gwin & Gwin, 2003; Manhas, 2010). Thus, it needs to be determined which types of brand attributes should be considered in brand positioning. Some scholars conceptualise and operationalise brand image or brand associations one-dimensionally and through generic brand attributes (e.g., Abin et al., 2022; Dwivedi et al., 2015; Pappu et al., 2005; Song et al., 2019; Su & Tong, 2015). This approach makes sense when examining the fundamental or overall effect of brand image on outcome variables, like purchase intentions, customer loyalty, or brand equity. A one-dimensional and/or generic conceptualisation and operationalisation of brand image and identity cannot, however, contribute to the actual positioning of a brand, as brand images normally are complex and multidimensional representations in the minds of the target group. Thus, a multi-dimensional conceptualisation and operationalisation of brand image with product and/or target group specific attributes is advised to allow a deeper understanding of brand images in particular markets (Low & Lamb, 2000; Sonnier & Ainslie, 2011). Accordingly, studies that examine brand images in specific industries are based on individually developed brand attributes, primarily through qualitative interviews with customers or experts (e.g., Cho et al., 2015; Cho & Fiore, 2015; Dirsehan & Kurtuluş, 2018; Mackay, 2001). Such interviews can focus on generating either feature-based brand attributes, which are derived from the offered product in an inside-out approach, or benefit-based brand attributes, which are derived from the needs and wants of the target group in an outside-in approach (Fuchs & Diamantopoulos, 2010).
The decision for product and/or target group-specific brand attributes does not, however, automatically mean that these brand attributes should not be structured through categories or dimensions. Amongst others, Aaker (2010) proposes four perspectives on brand identities, i.e., brand as a product, organisation, person and symbol; Burmann et al. (2023) define brand origin, vision, values, personality, competence and offer as the components of brand identity; de Chernatony (2010) sees the culture, vision, personality and positioning as the core components of brand identities; Kapferer (2012) conceptualises six elements of brand identities, i.e., physique, personality, culture, relationship, reflection and self-image. The aforementioned conceptualisations of multiple brand identity elements have the advantage of potentially developing differentiated brand identities from different perspectives. The disadvantage of these approaches, however, is their potentially high complexity, which might lead to problems in measuring and analysing the brand image. Furthermore, the aforementioned approaches may potentially distract or even deviate from those brand attributes that chiefly affect the behaviour of the target group, i.e., the needs, wants, and benefits of the target group (Park et al., 1986; Urde, 2016). Thus, it is proposed here that positioning should primarily focus on core brand attributes, which have the strongest links to the target group’s needs, wants, and benefits. At the same time, it is acknowledged that concepts like brand personality or culture might contribute to an extended brand image and identity.
When analysing the brand image and crafting the brand identity, two perspectives should be taken: the relevance of brand attributes to the target group and their perceived quality or strength of association with the competing brands (Manhas, 2010; Martilla & James, 1977; Olsen et al., 2022). The relevance of brand attributes can be understood as representing the needs and wants of the target group, in other words, the motives or reasons for buying a brand. The perceived quality of the brand attributes or their association with brands can be understood as the target group’s evaluation of how well the brands can fulfil their needs and wants. This approach is in line with the value–expectancy theories in general (e.g., Atkinson, 1964; Fishbein & Ajzen, 1975; Vroom, 1995) and advancements thereof, like the Means-End Theory of Complex Cognitive Structures, which was used to examine customer expectations and their fulfilment in several industries (Godbersen, 2016, 2019; Godbersen & Barluschke, 2020; Godbersen & Kaupp, 2019; Godbersen et al., 2023).

2.4. Market Performance and Market Strategies

The second core element of the aforeformulated definitions of brand and brand management is the behaviour of the target group toward a brand and its competitors, in other words, the market performance of brands. This understanding is supported by comprehensive brand management approaches. For instance, Burmann et al. (2023) consider external brand strength, which manifests itself in the buying behaviour of the target group, as the most important objective of brand management. Aaker (2010) defines brand awareness, perceived quality, brand associations, and brand loyalty as elements of brand equity. This structure of customer-based brand equity could be empirically confirmed by Buil et al. (2008).
The aforementioned and similarly theorised elements of brand-related buying behaviour form relationships amongst each other, in the sense that one element is the antecedent of another, or one element influences the next. A literature review of Tahir et al. (2024) reveals that brand image influences customer satisfaction, which, in turn, has an impact on customer loyalty. This set of relationships was also empirically confirmed by Song et al. (2019). Abin et al. (2022) empirically found that a positive brand image leads to a positive attitude (overall evaluation) toward a brand, which, in turn, leads to purchase intentions. The research of Bilgili and Ozkul (2015) can be seen as the empirical confirmation that brand awareness is the precondition for these constructs.
Boyle (2007) provides a comprehensive theorisation of how brands are created by customers. Brand awareness leads to brand associations, which lead to purchases, which then lead to re-purchases. This notion finds support in the general buying process, whose subsequent stages can be theorised as offer awareness, familiarity, consideration, purchase, and loyalty (Dierks, 2017) or as awareness set, consideration set, choice set, and decision (Kotler & Keller, 2016).
Accordingly, the theorisation of behavioural outcomes of brand management and, therewith, the market performance of a brand in this work is based on Boyle’s (2007) approach, the general steps of the buying process, the empirically supported notion that the brand image leads to the overall evaluation of a brand (Abin et al., 2022), and the conception that psychological states and process precede overt behaviour toward a brand (Burmann et al., 2023). Then, the market performance of a brand is determined by the following stages of the buying process, which precede each other in the given order: brand awareness, general relevant set, immediate relevant set, and loyalty intentions. Brand awareness refers to the target group being consciously aware of a brand through recall or recognition. The general relevant set consists of those brands that are evaluated well, so that they are generally considered for purchase. The immediate relevant set consists of those brands that are considered if a purchase has to be performed immediately. Loyalty intentions refer to the brand that would be purchased most often. The market performance of brands on the four stages of the buying process can be linked to market strategies, which aim to predominantly achieve brand awareness, a positive brand image, sales, or loyal customers.

3. Method for Integrated Brand Analysis and Strategy

On the basis of Section 2, the method of integrated brand analysis and strategy is explained in Section 3. Section 3.1 sheds light on how to measure and analyse the brand image in a market and, then, deduce strategic decision guidelines for crafting the brand identity. Section 3.2 elaborates on how to measure and analyse the market performance of brands to deduce strategic decision guidelines for market cultivation.

3.1. Analysing the Brand Image and Deducing Strategic Decision Guidelines for Brand Positioning

Brand Positioning was defined as the processes and decisions of measuring and analysing the brand image and crafting the brand identity in Section 2.3. The precondition for measuring and analysing the brand image is to determine the attributes that form this brand image. Accordingly, the proposed processes of determining possible brand attributes are explained in Section 3.1.1. Section 3.1.2 explains how these brand attributes should be measured and analysed, and how strategic decision guidelines for crafting the brand identity can be deduced from the results.

3.1.1. Determining Brand Attributes

Attributes that form the brand image and identity can be developed with two approaches: an inside-out or theory-based approach, or an outside-in or empirical approach.
The inside-out approach can be associated with generating feature-based brand attributes, which are understood as “objectively measurable” product characteristics (Fuchs & Diamantopoulos, 2010). In this case, the underlying product of a brand needs to be determined first. Secondly, the elements of the respective offer should be deduced. These elements must be of relevance to the target group so that they influence the purchase decision. A generic starting point might be the marketing mix, i.e., product, price, place, promotion (McCarthy, 1961), which must, however, be differentiated further through defining subordinated elements. Sources for developing feature-based brand attributes can be experts, such as product or brand managers, or secondary data, such as research articles or industry reports. Examples for developing brand attributes through expertise and secondary data can be found in Mackay (2001) and Myers (2003).
The outside-in approach can be associated with generating benefit-based brand attributes, which are understood as derivatives of the needs, wants, and motives of the target group (Fuchs & Diamantopoulos, 2010). In this case, the brand attributes should be developed through qualitative research, i.e., qualitative interviews or surveys with open questions. The sample should consist of members of the target group. Examples for developing brand attributes for specific industries through qualitative interviews with the target group can be found at Cho et al. (2015), Cho and Fiore (2015), and Dirsehan and Kurtuluş (2018). As with the inside-out or theory-based approach, the starting point should be the product or product category underlying a brand. As products are rarely used in isolation but rather in situational contexts, the context of using the product or product category must also be considered and can serve as an anchor point for the participants. Against this backdrop, information on four levels should be obtained through qualitative interviews or surveys:
  • Context of using product category—Question in the qualitative interview or questionnaire: One can use <product category> in different situations. Please list in keywords the situations in which you use <product category>.
  • Motives for usage—Question in the qualitative interview or questionnaire: You have listed situations in which you use <product category>. Please list in keywords the end or purpose you use <product category> in these situations.
  • Associations with context of using—Question in the qualitative interview or questionnaire: You have listed situations in which you use <product category>. Please list in keywords the emotions and thoughts you associate with these situations.
  • Associations with product category—Question in the qualitative interview or questionnaire: Now, we would like to ask you which emotions and thoughts you associate with <product category>. Please list in keywords the emotions and thoughts you associate with <product category>.
The analysis of the data should follow the basics of qualitative and quantitative content analysis (e.g., Kuckartz & Radiker, 2023; Mayring, 2021) and should consist of three steps. First, the answers of the participants must be inductively categorised, i.e., developing motives for usage, and associations with the context of usage and the product. Second, the frequencies of the mentioned motives and associations with the context of usage and the product should be determined. Third, possible brand attributes should be deduced from the results of the previous steps.

3.1.2. Analysing Brand Attributes and Deducing Strategic Decision Guidelines

After having established the possible brand attributes, their relevance to the target group and evaluation for a brand and its competitors must be measured so that the preferences of the target group and the current brand image in comparison with its competitors are captured. The relevance of brand attributes relates to the needs, wants, and motives of the target group, whilst their evaluation for a brand and its competitors represents the brands’ abilities to fulfil the specific customer needs, wants, and motives, as argued in Section 2.3. It is advised to use continuous rating scales from 0 to 100 for both measuring the relevance and measuring the evaluation. Even though other scale formats are generally possible, continuous rating scales from 0 to 100 bear some advantages for the method developed here, as they can deliver more nuanced data and their results are arguable more intuitively interpretable (in managerial practice) than discrete rating scales, which might range from one to five, six, or seven. Furthermore, calculating the key indicators of the brand and brand attribute analysis, explained below, requires a metric scale of measurement with a zero point, as in related methods like the Means-End Theory of Complex Cognitive Structures (Godbersen, 2016, 2019; Godbersen & Barluschke, 2020; Godbersen & Kaupp, 2019; Godbersen et al., 2023). A more detailed evaluation of the advantages and disadvantages of continuous rating scales can be found at Chyung et al. (2018).
The relevance can be measured by the following question: When using <product category>, different aspects can be important. Please indicate on a scale from 0 “not important” to 100 “very important”, how important the following aspects are for you personally, when you use <product category>.
Two options should be considered for measuring the evaluation of brand attributes, depending on the type of brand attributes: quality ratings for feature-based brand attributes and association strength for benefit-based brand attributes.
Feature-based brand attributes, which are typically developed in an inside-out approach by deducing “objectively measurable” brand attributes from the brand-related product or product category, should be measured through quality ratings. The following question can be used to measure the perceived quality of feature-based brand attributes: In this section, you should indicate how good you personally evaluate different aspects for <product category> brands. Please give your answers on scales from 0 “not good” to 100 “very good”. Please indicate now how good you evaluate the following aspects for <brand>.
Benefit-based brand attributes, which are typically developed in an outside-in approach by a qualitative pre-study with the target group, are evaluative by nature. Thus, a quality rating cannot be applied; e.g., asking “how good is the good quality of brand X?” does not make sense. In the case of benefit-based brand attributes, the strength of association of these already evaluative attributes with brands should be measured through the following question: In this section, you should indicate how strongly you personally associate different aspects with <product category> brands. Please give your answers on scales from 0 “not at all” to 100 “very strong”. Please indicate now how strongly you associate the following aspects with <brand>.
The proposed process of analysing a brand image consists of four steps, which are based on the arithmetic means of the measured relevance of brand attributes and their perceived quality or association with a brand and its competitors. These steps show similarities to the Means-End Theory of Complex Cognitive Structures, which, amongst others, can explain customer expectations and their fulfilment (Godbersen, 2016, 2019; Godbersen & Barluschke, 2020; Godbersen & Kaupp, 2019; Godbersen et al., 2023).
First, the weighted relevance of brand attributes should be calculated by dividing the relevance of a brand attribute by the sum of the relevance of all brand attributes (cf. Equation (1)). The sum of all weighted relevance values equates to 1 or 100%, indicating the relative effect of a brand attribute on the overall evaluation of a brand. The weighted relevance corresponds to the normed value of the Means-End Theory of Complex Cognitive Structures (Godbersen, 2016, 2019; Godbersen & Barluschke, 2020; Godbersen & Kaupp, 2019; Godbersen et al., 2023).
w R j = e R j j = 1 n e R j
  • wRj: weighted relevance of brand attribute j;
  • eRj: empirical relevance of brand attribute j.
Second, the overall evaluation of a brand by the target group should be calculated by the sum of the multiplications of the weighted relevance and the subjective quality of the attributes of one brand (cf. Equation (2)). The overall evaluation of a brand corresponds to the calculated Quality of the Means-End Theory of Complex Cognitive Structures (Godbersen, 2016, 2019; Godbersen & Barluschke, 2020; Godbersen & Kaupp, 2019; Godbersen et al., 2023).
t Q i = j = 1 n e R j j = 1 n e R j × e Q i j
  • tQi: overall evaluation/quality of brand i;
  • eRj: empirical relevance of brand attribute j;
  • eQij: empirical quality of brand i on brand attribute j.
Third, the number of attributes with the best evaluation should be determined for each brand (cf. Equation (3)). This indicates on how many attributes a brand is clearly distinguished from its competitors by the target group.
N i = j = 1 n e Q i j = m a x e Q 1 j , e Q 2 j , , e Q n j
  • Ni: number of brand attributes with the best evaluation for brand i;
  • eQij: empirical quality of brand i on brand attribute j.
Fourth, the difference between the perceived quality of a brand to its best competitor for each attribute should be calculated. This enables the identification of the attributes on which a brand outperforms its competitors and on which the brand underperforms in relation to its competitors (cf. Equation (4)).
q D i j = e Q i j m a x e Q 1 j , e Q 2 j , , e Q n j \ e Q i j
  • qDij: quality difference of brand i to its best competitor on brand attribute j;
  • eQij: empirical quality of brand i on brand attribute j.
Deducing strategic decision guidelines from the afore-described data collection and analysis requires two levels and two objectives of brand positioning. Positioning strategies should be developed for the overall brand and at the level of brand attributes. The objectives of brand positioning should be to meet the needs, wants, and motives of the target group, and to establish a brand image that is distinguished from its competitors by the target group, as outlined in Section 2.1 and Section 2.3.
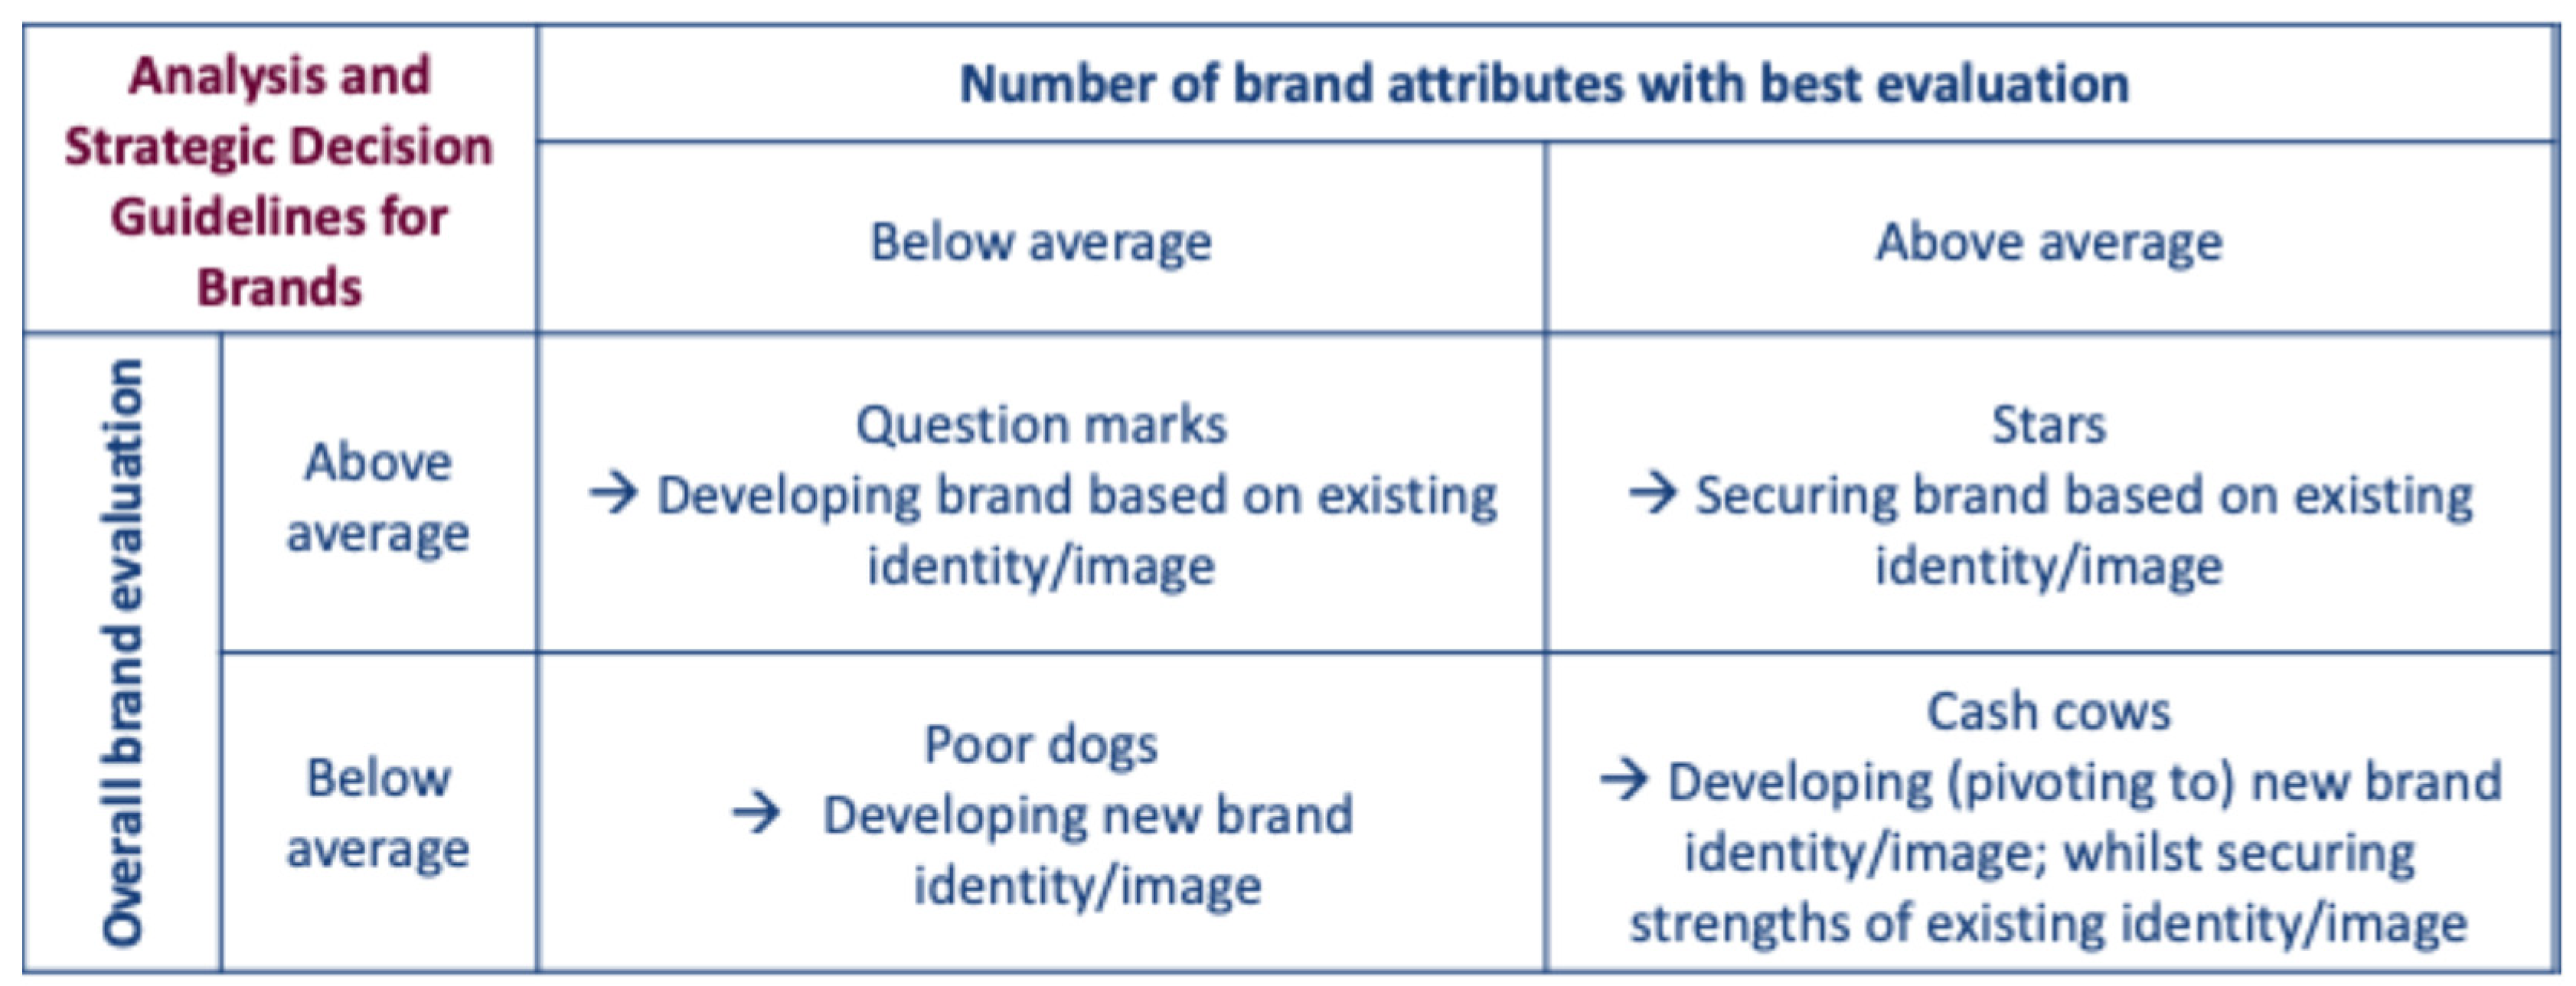
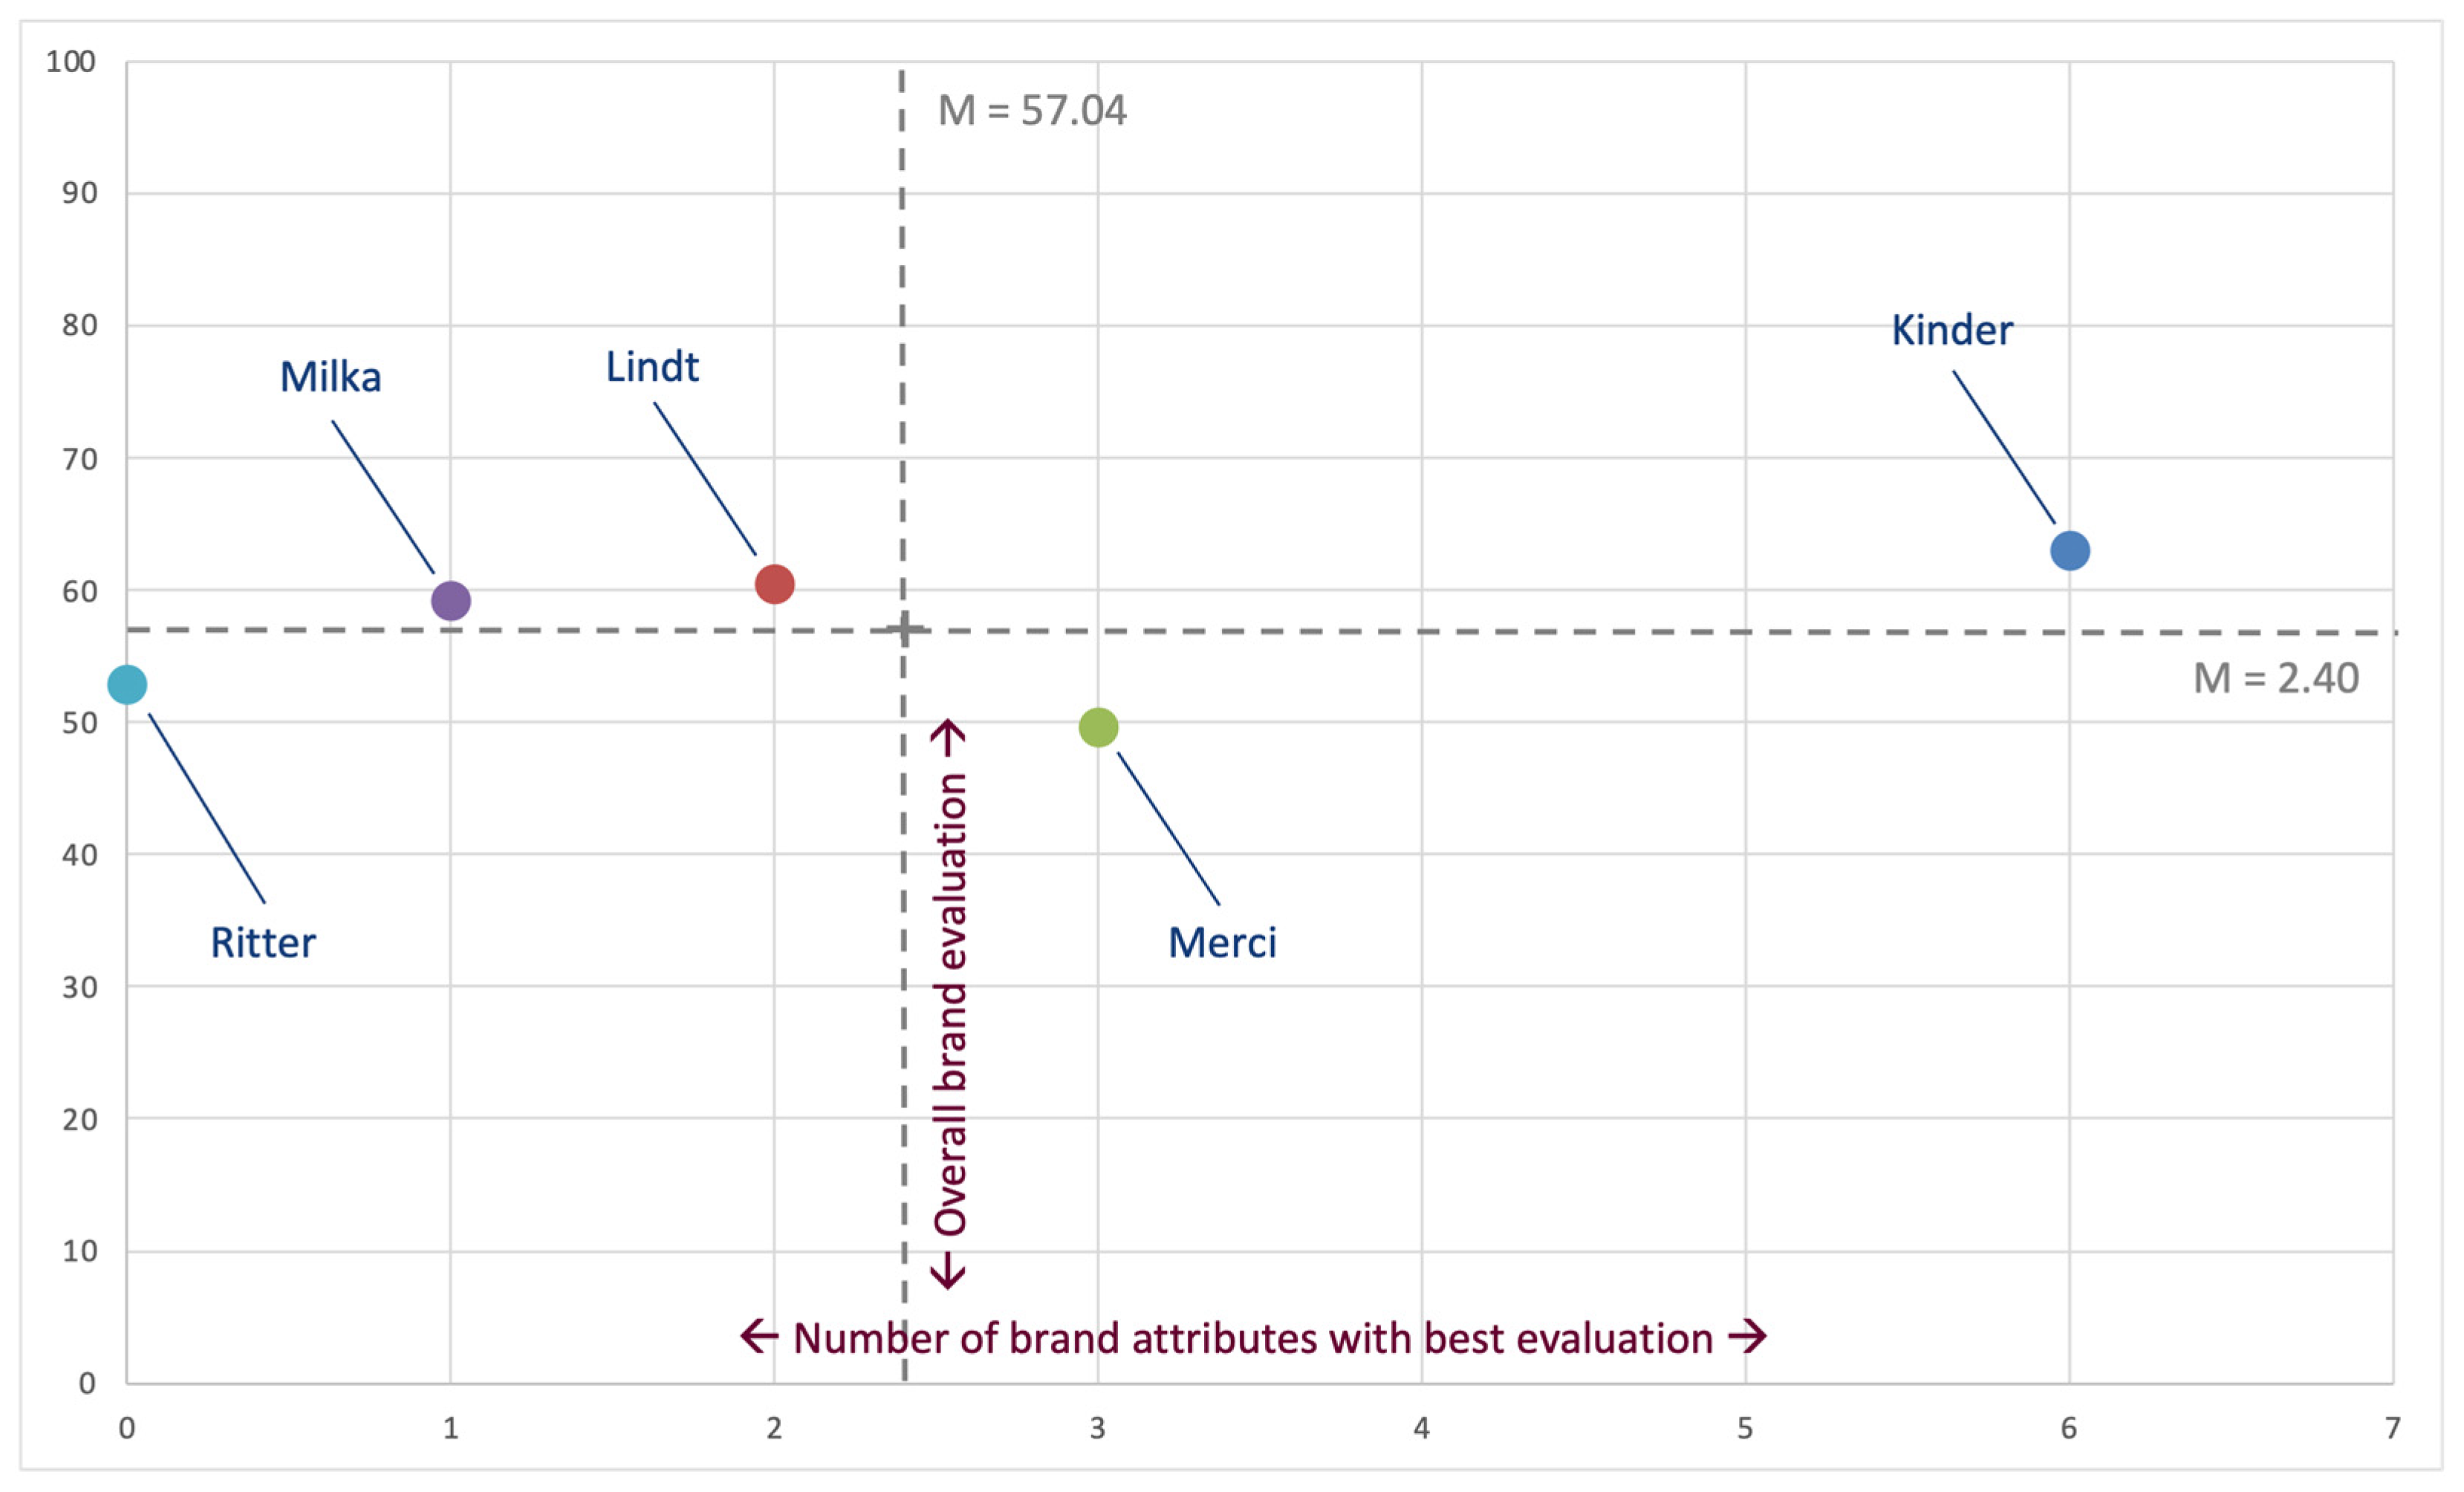
On the level of overall brand positioning, the number of brand attributes with the best evaluation, compared to a brand’s competitors, and the overall brand evaluation should be combined in a matrix, which is represented in Figure 1. The number of brand attributes with the best evaluation represents how well the target group can distinguish a brand from its competitors. The overall brand evaluation represents how well a brand meets the needs, wants, and motives of its target group. These two dimensions represent the two core elements of the definition of a brand, given in Section 2.1; i.e., being distinguishable from competitors and providing a target group with value.
This approach resembles the suggestions of Manhas (2010), Martilla and James (1977), and Olsen et al. (2022) for brand and product management, as indicated in Section 2.3. Moreover, such a matrix also resembles the BCG matrix, from which the designations of the four quadrants of the matrix, developed here, are taken. Depending on the number of brand attributes with the best evaluation and the overall brand evaluation, the following strategic decision guidelines should be deduced:
  • Above average number of brand attributes with the best evaluation and above average overall brand evaluation (stars): Securing the brand based on the existing identity/image;
  • Below average number of brand attributes with the best evaluation and above average overall brand evaluation (question marks): Developing the brand based on the existing identity/image;
  • Above average number of brand attributes with the best evaluation and below average overall brand evaluation (cash cows): Developing (pivoting to) a new brand identity/image, whilst securing the strengths of the existing identity/image;
  • Below number of brand attributes with the best evaluation and below average overall brand evaluation (poor dogs): Developing a new brand identity/image.
The strategic decision guidelines for the cash cow quadrant should be clarified, as it might appear contradictory at first glance to secure the strengths of an existing brand image that leads to a below-average overall evaluation. As described above and in Section 2, a brand image should be distinguished from its competitors by the target group and represent value to this target group. A cash cow brand accomplishes the first task, whilst underperforming in the second task. Thus, it is recommended to secure the strengths or attributes that help the target group to distinguish the brand from its competitors. These brand attributes should, however, only be part of the extended brand identity and should not form the brand identity’s core, as they contribute to the overall brand evaluation on a better level than the competitor brands, but only on a below-average level when compared to other brand attributes.
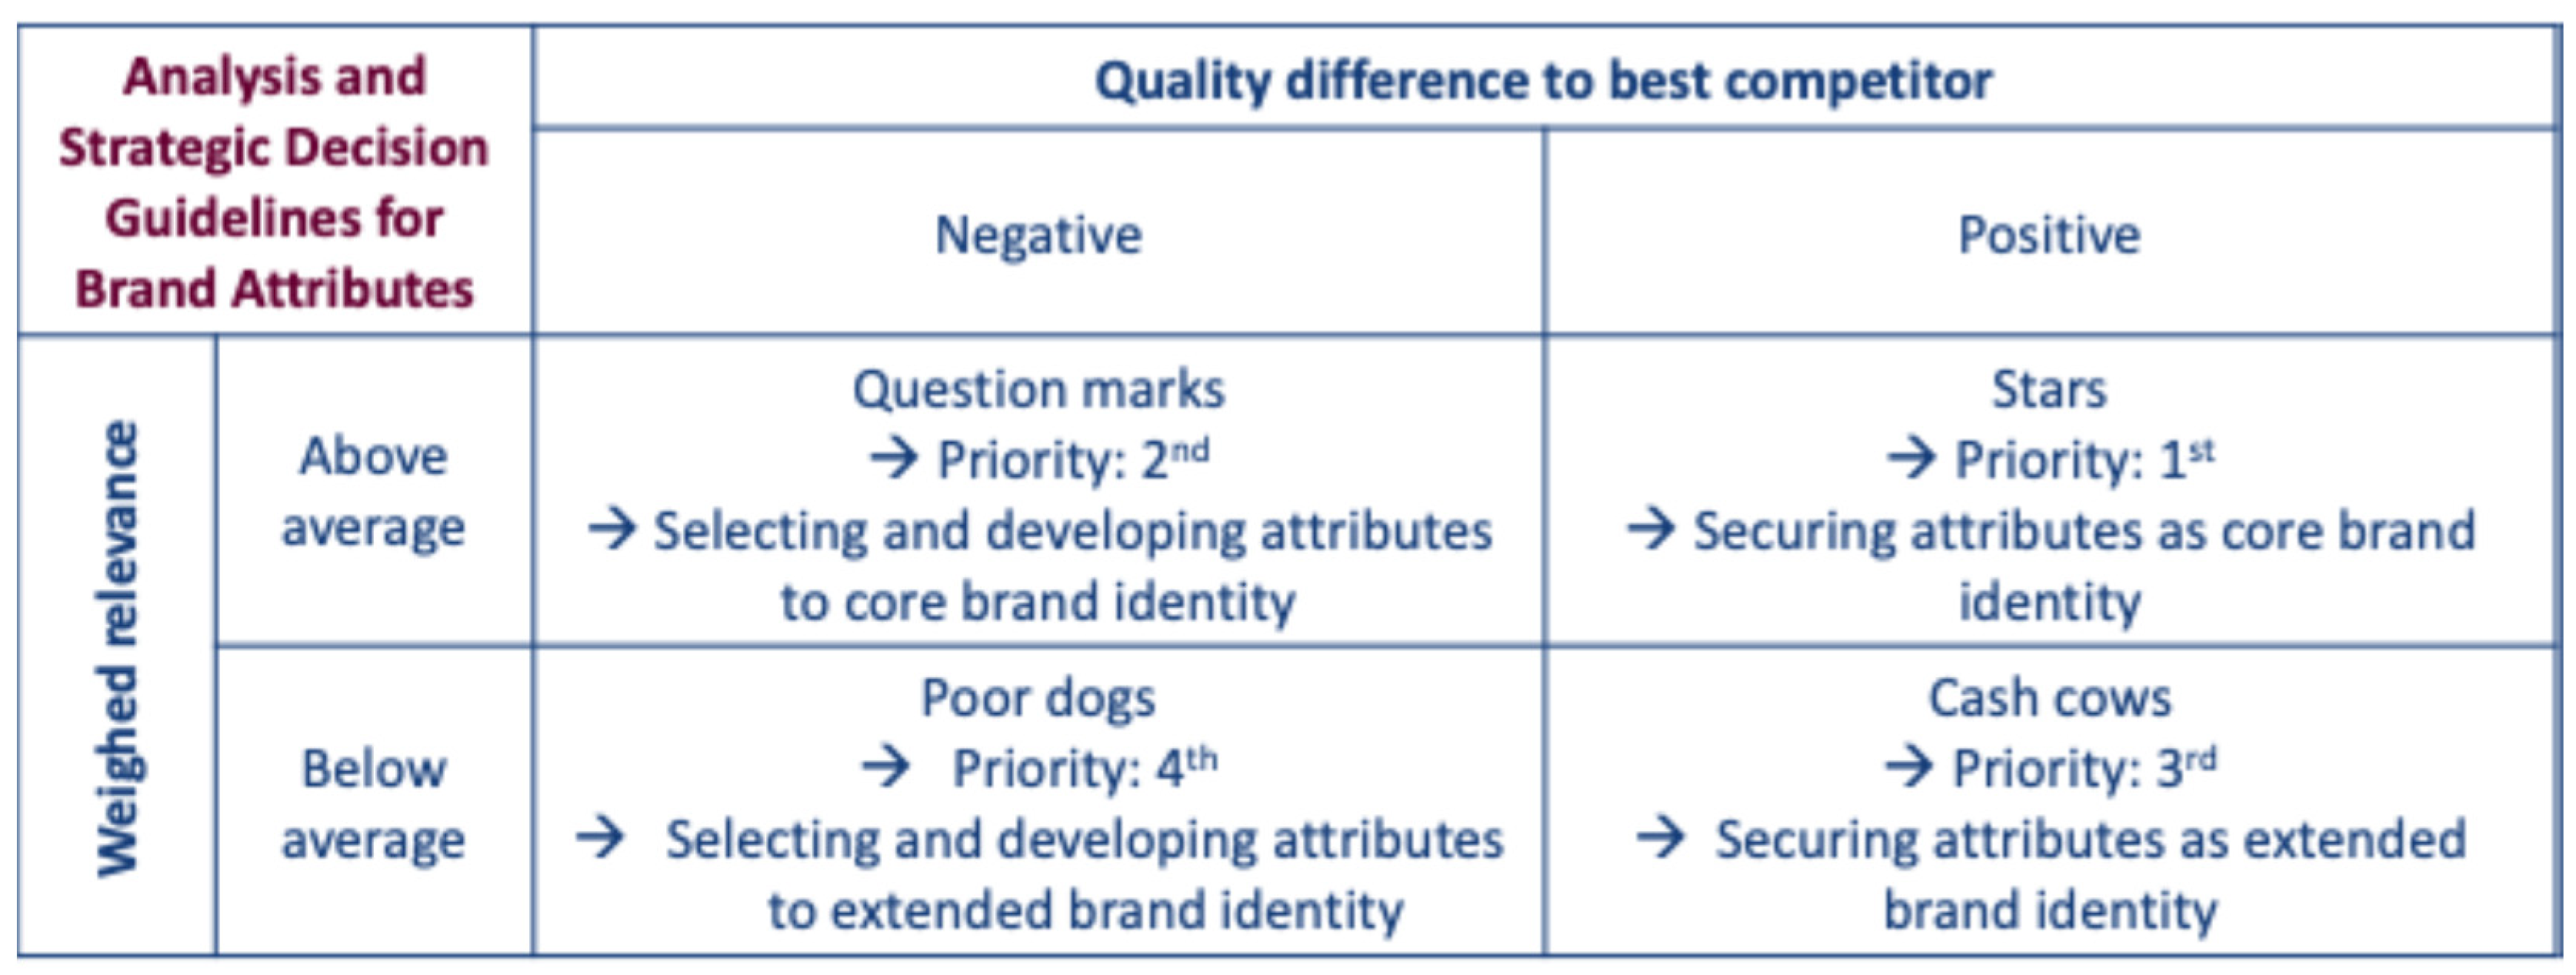
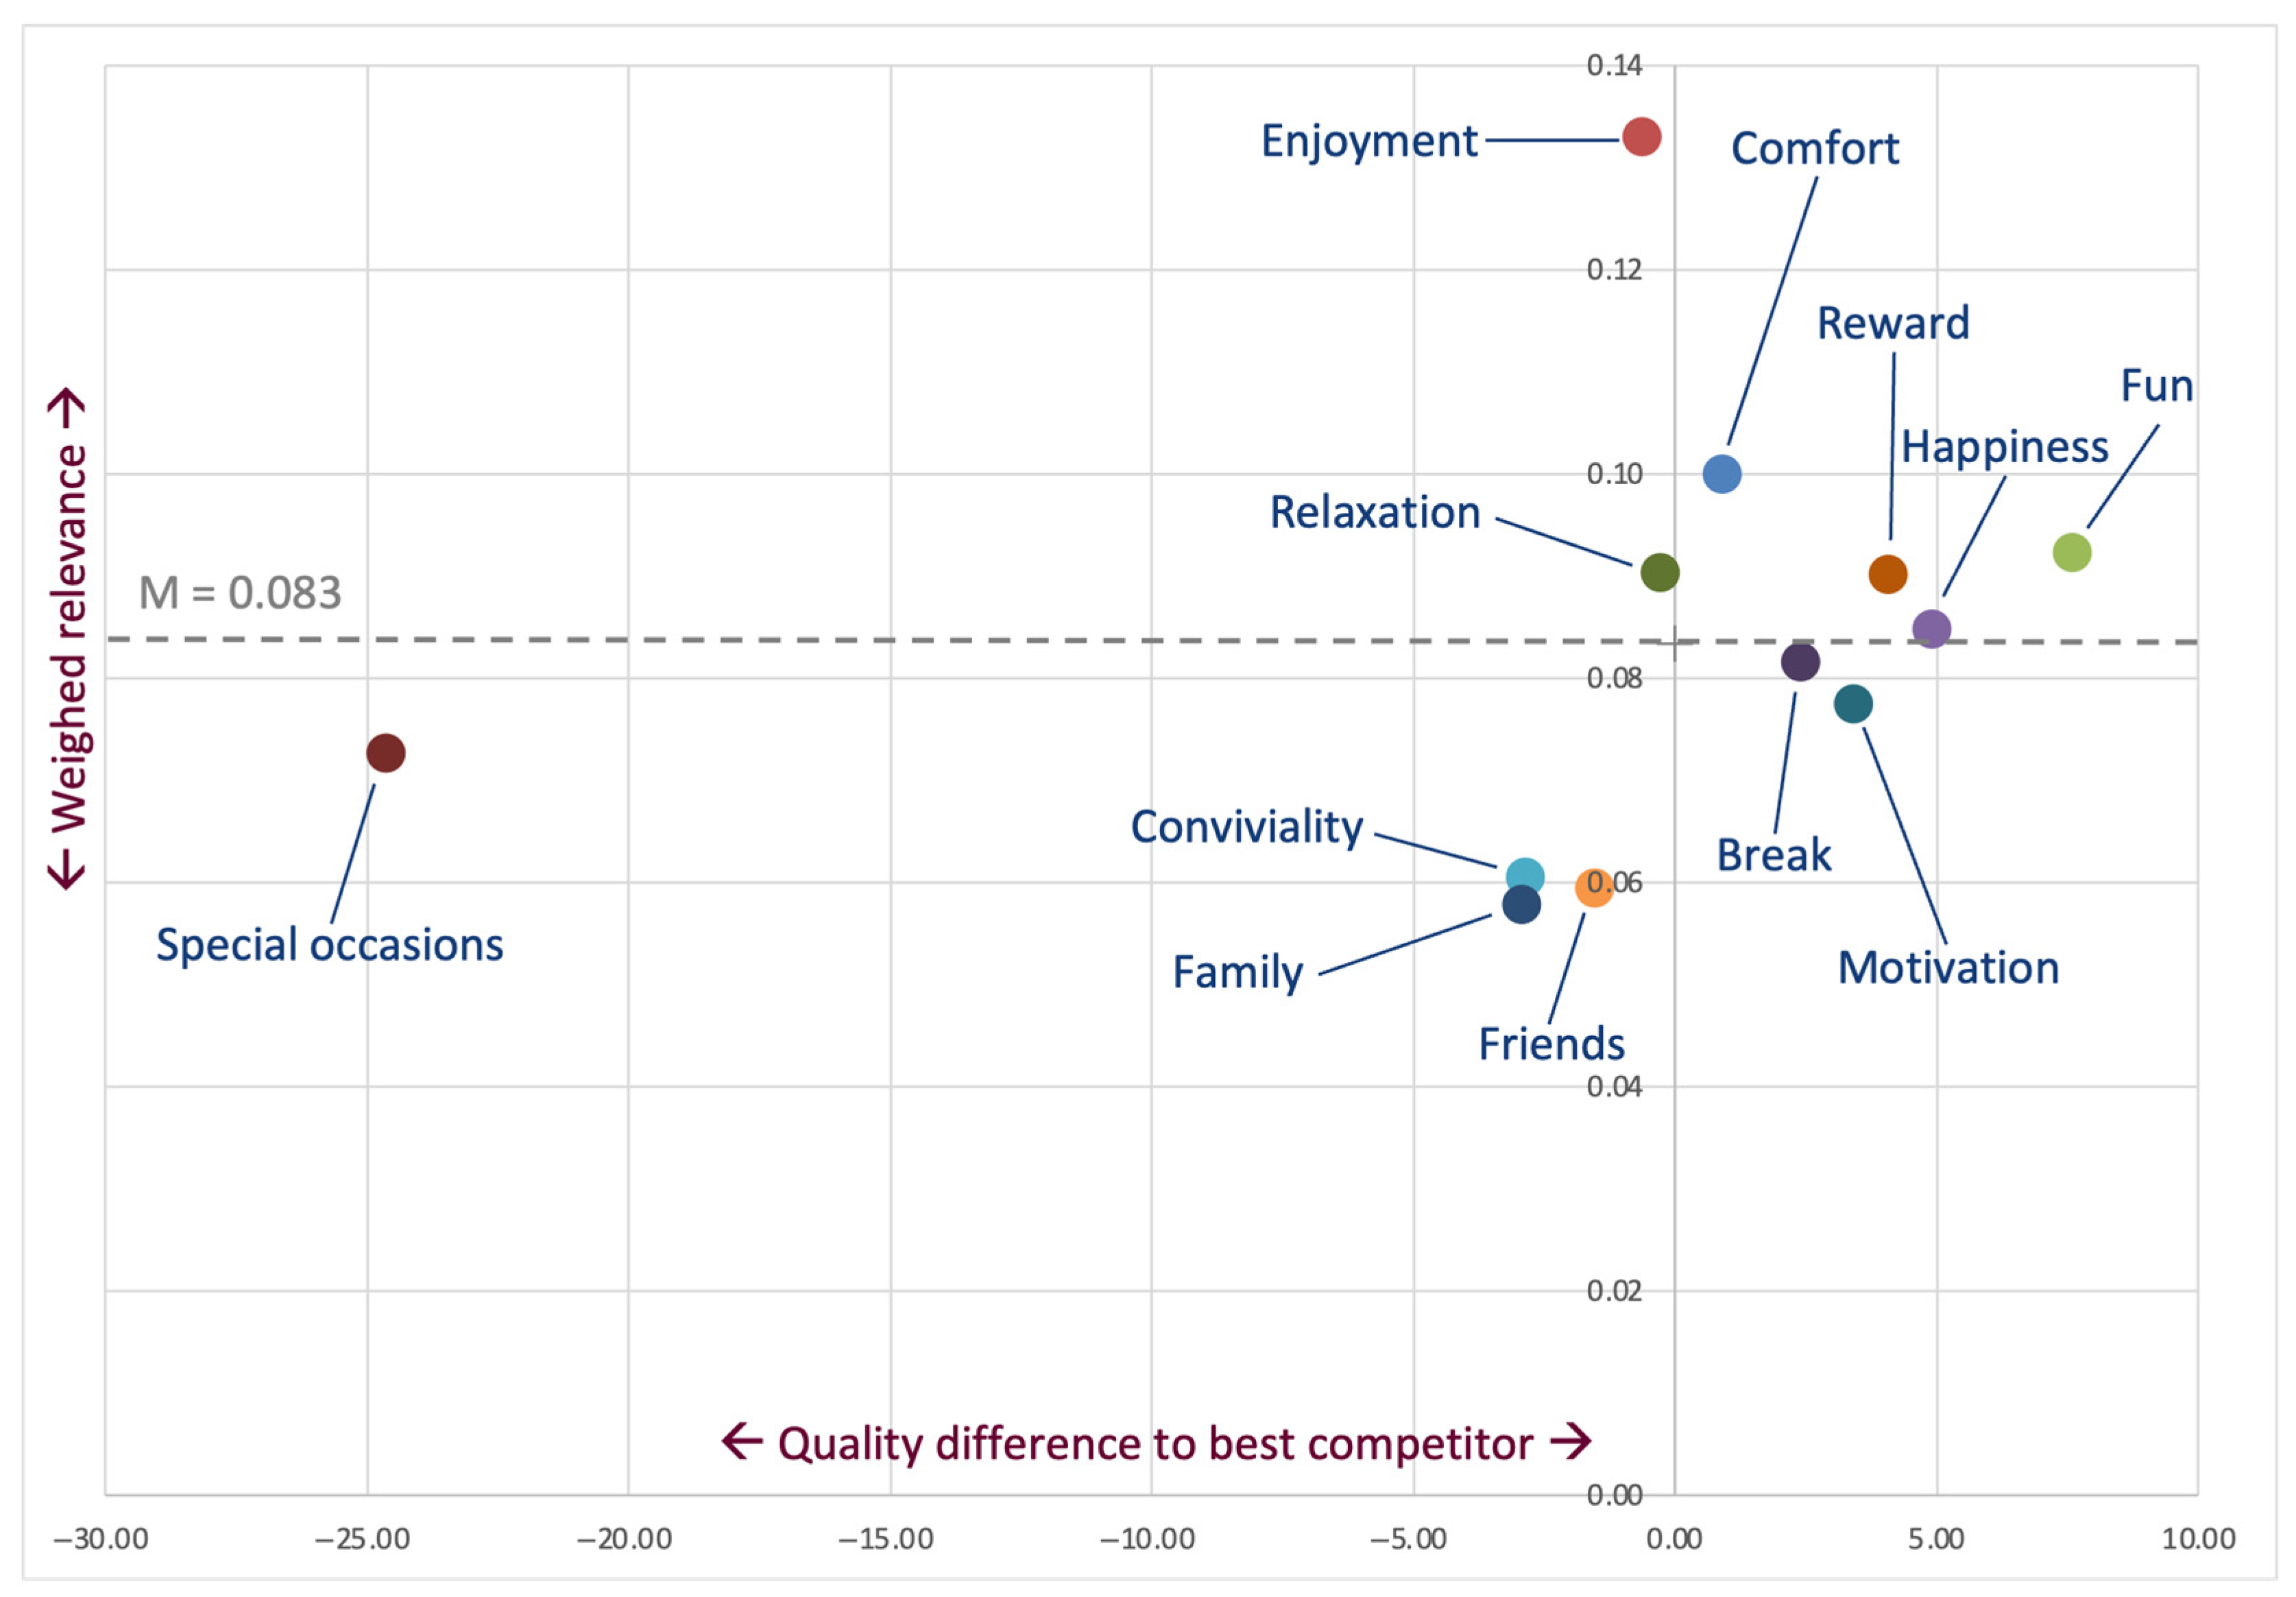
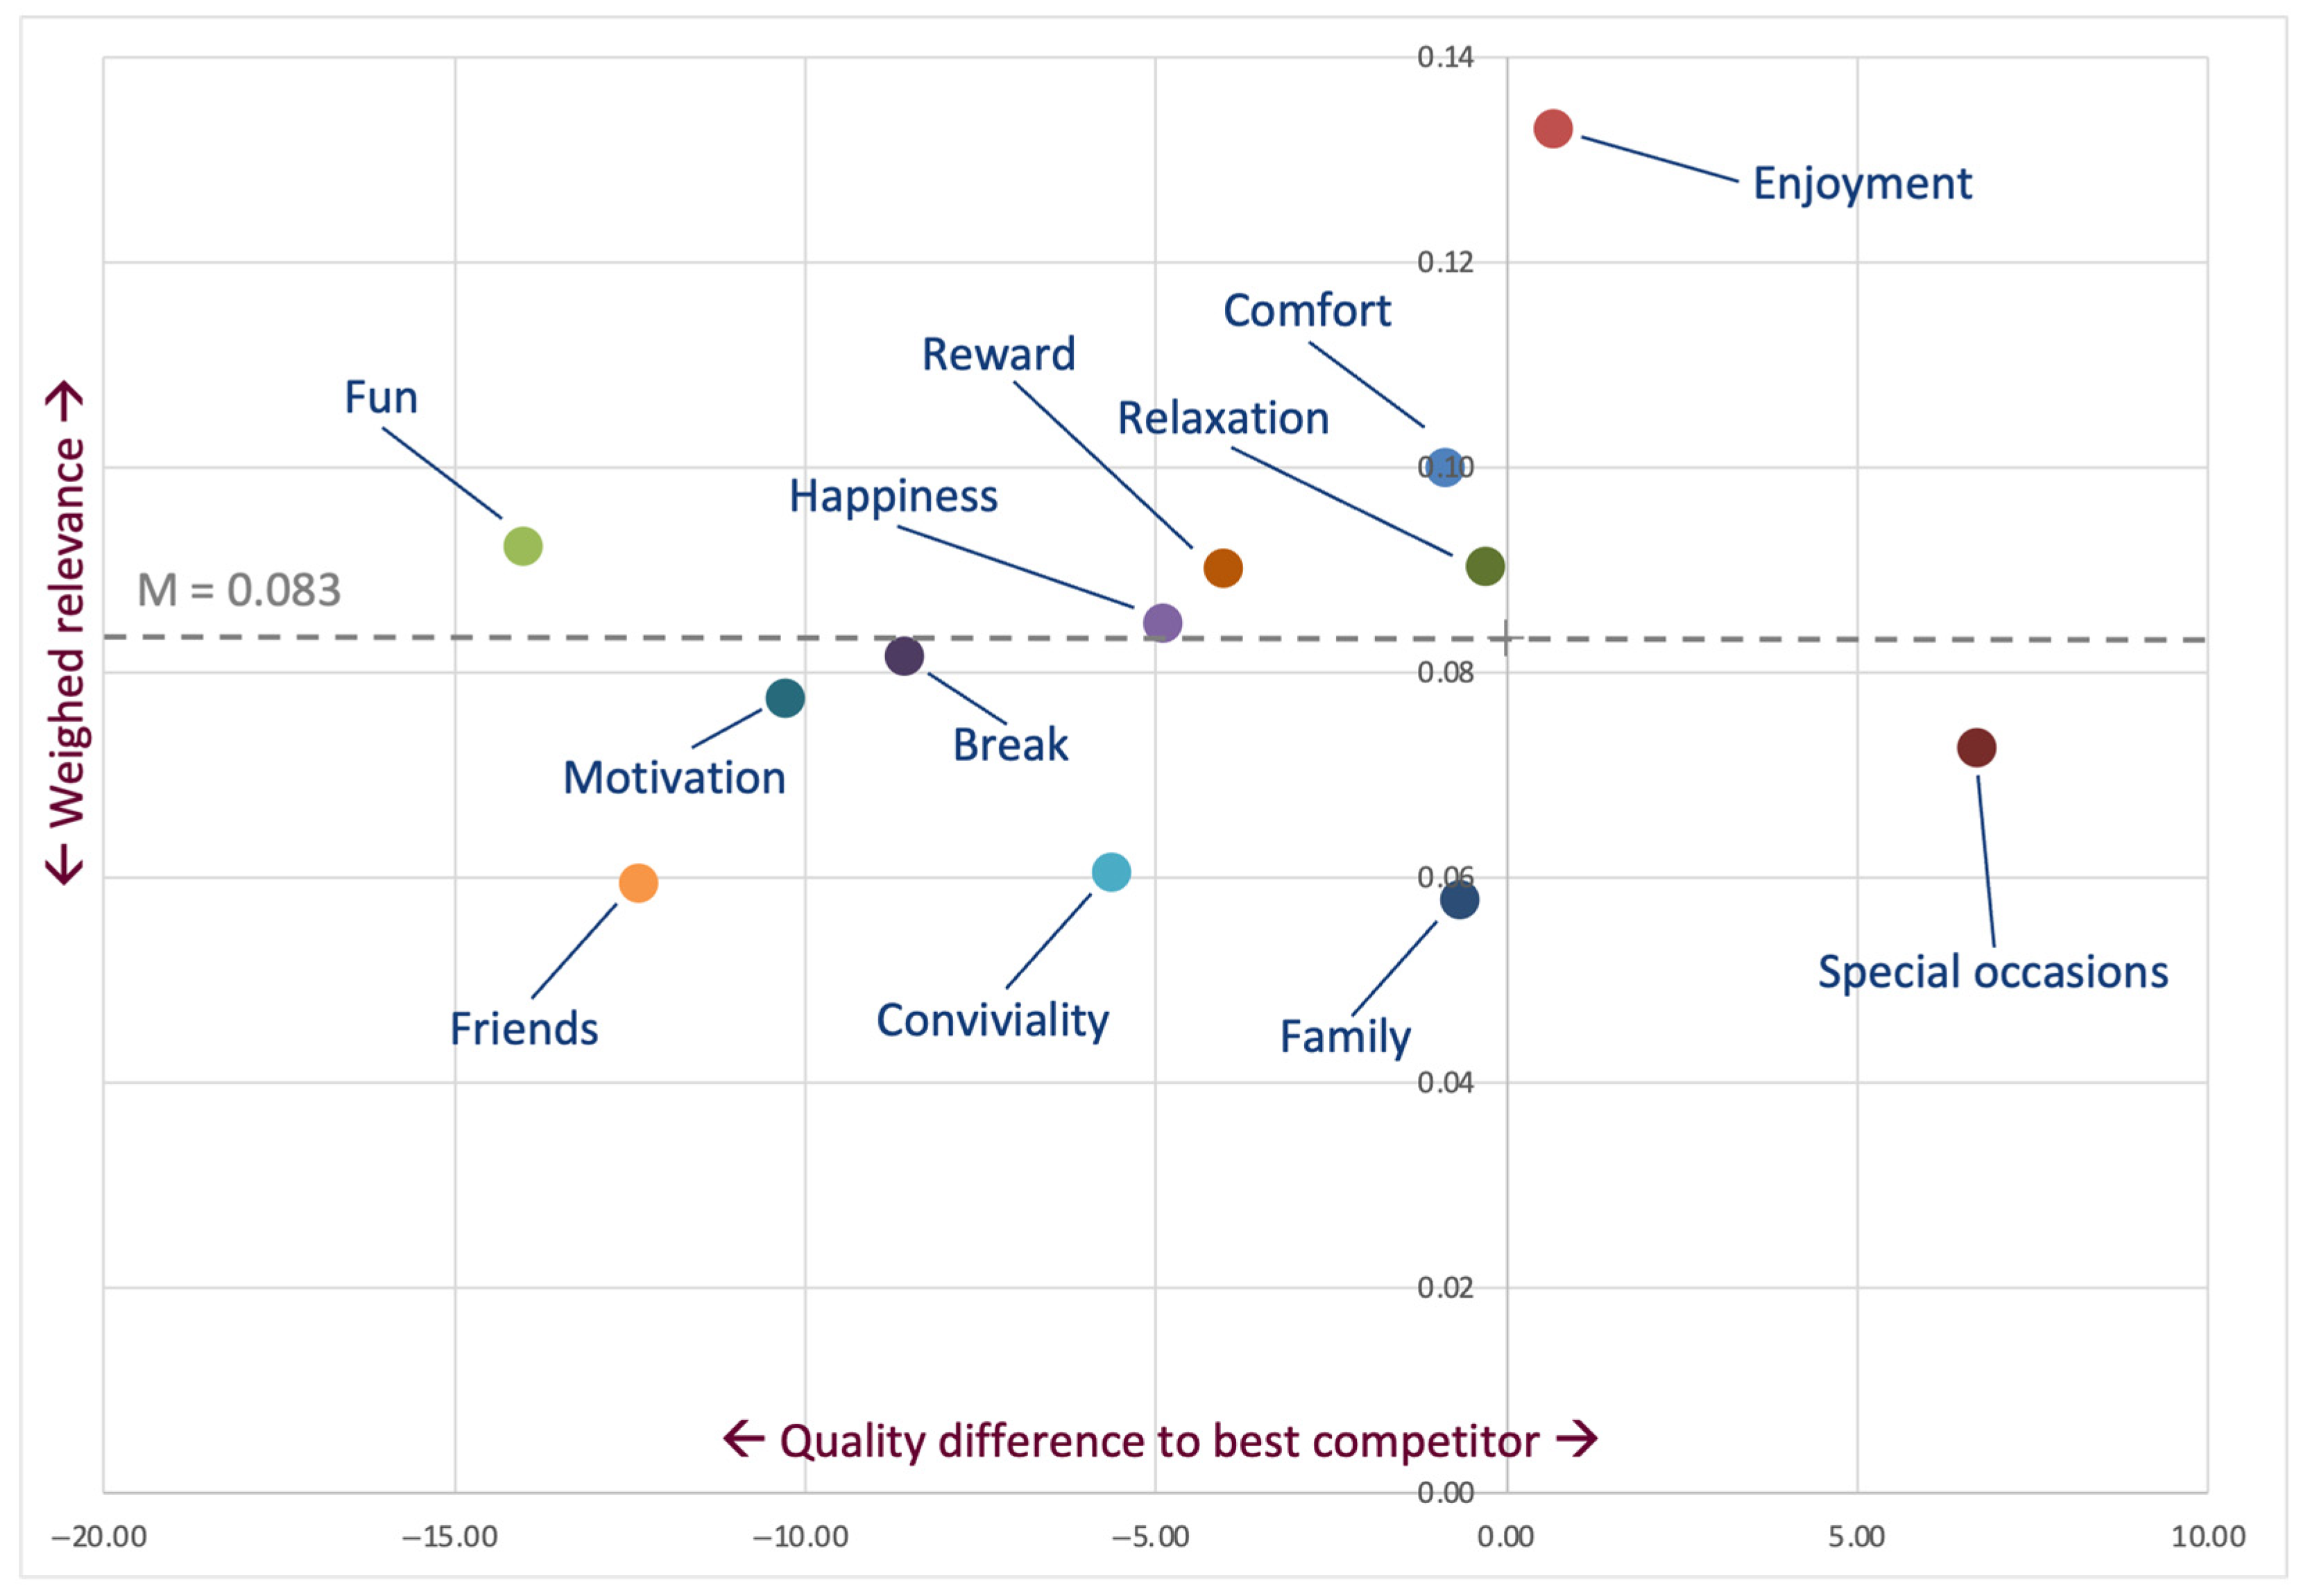
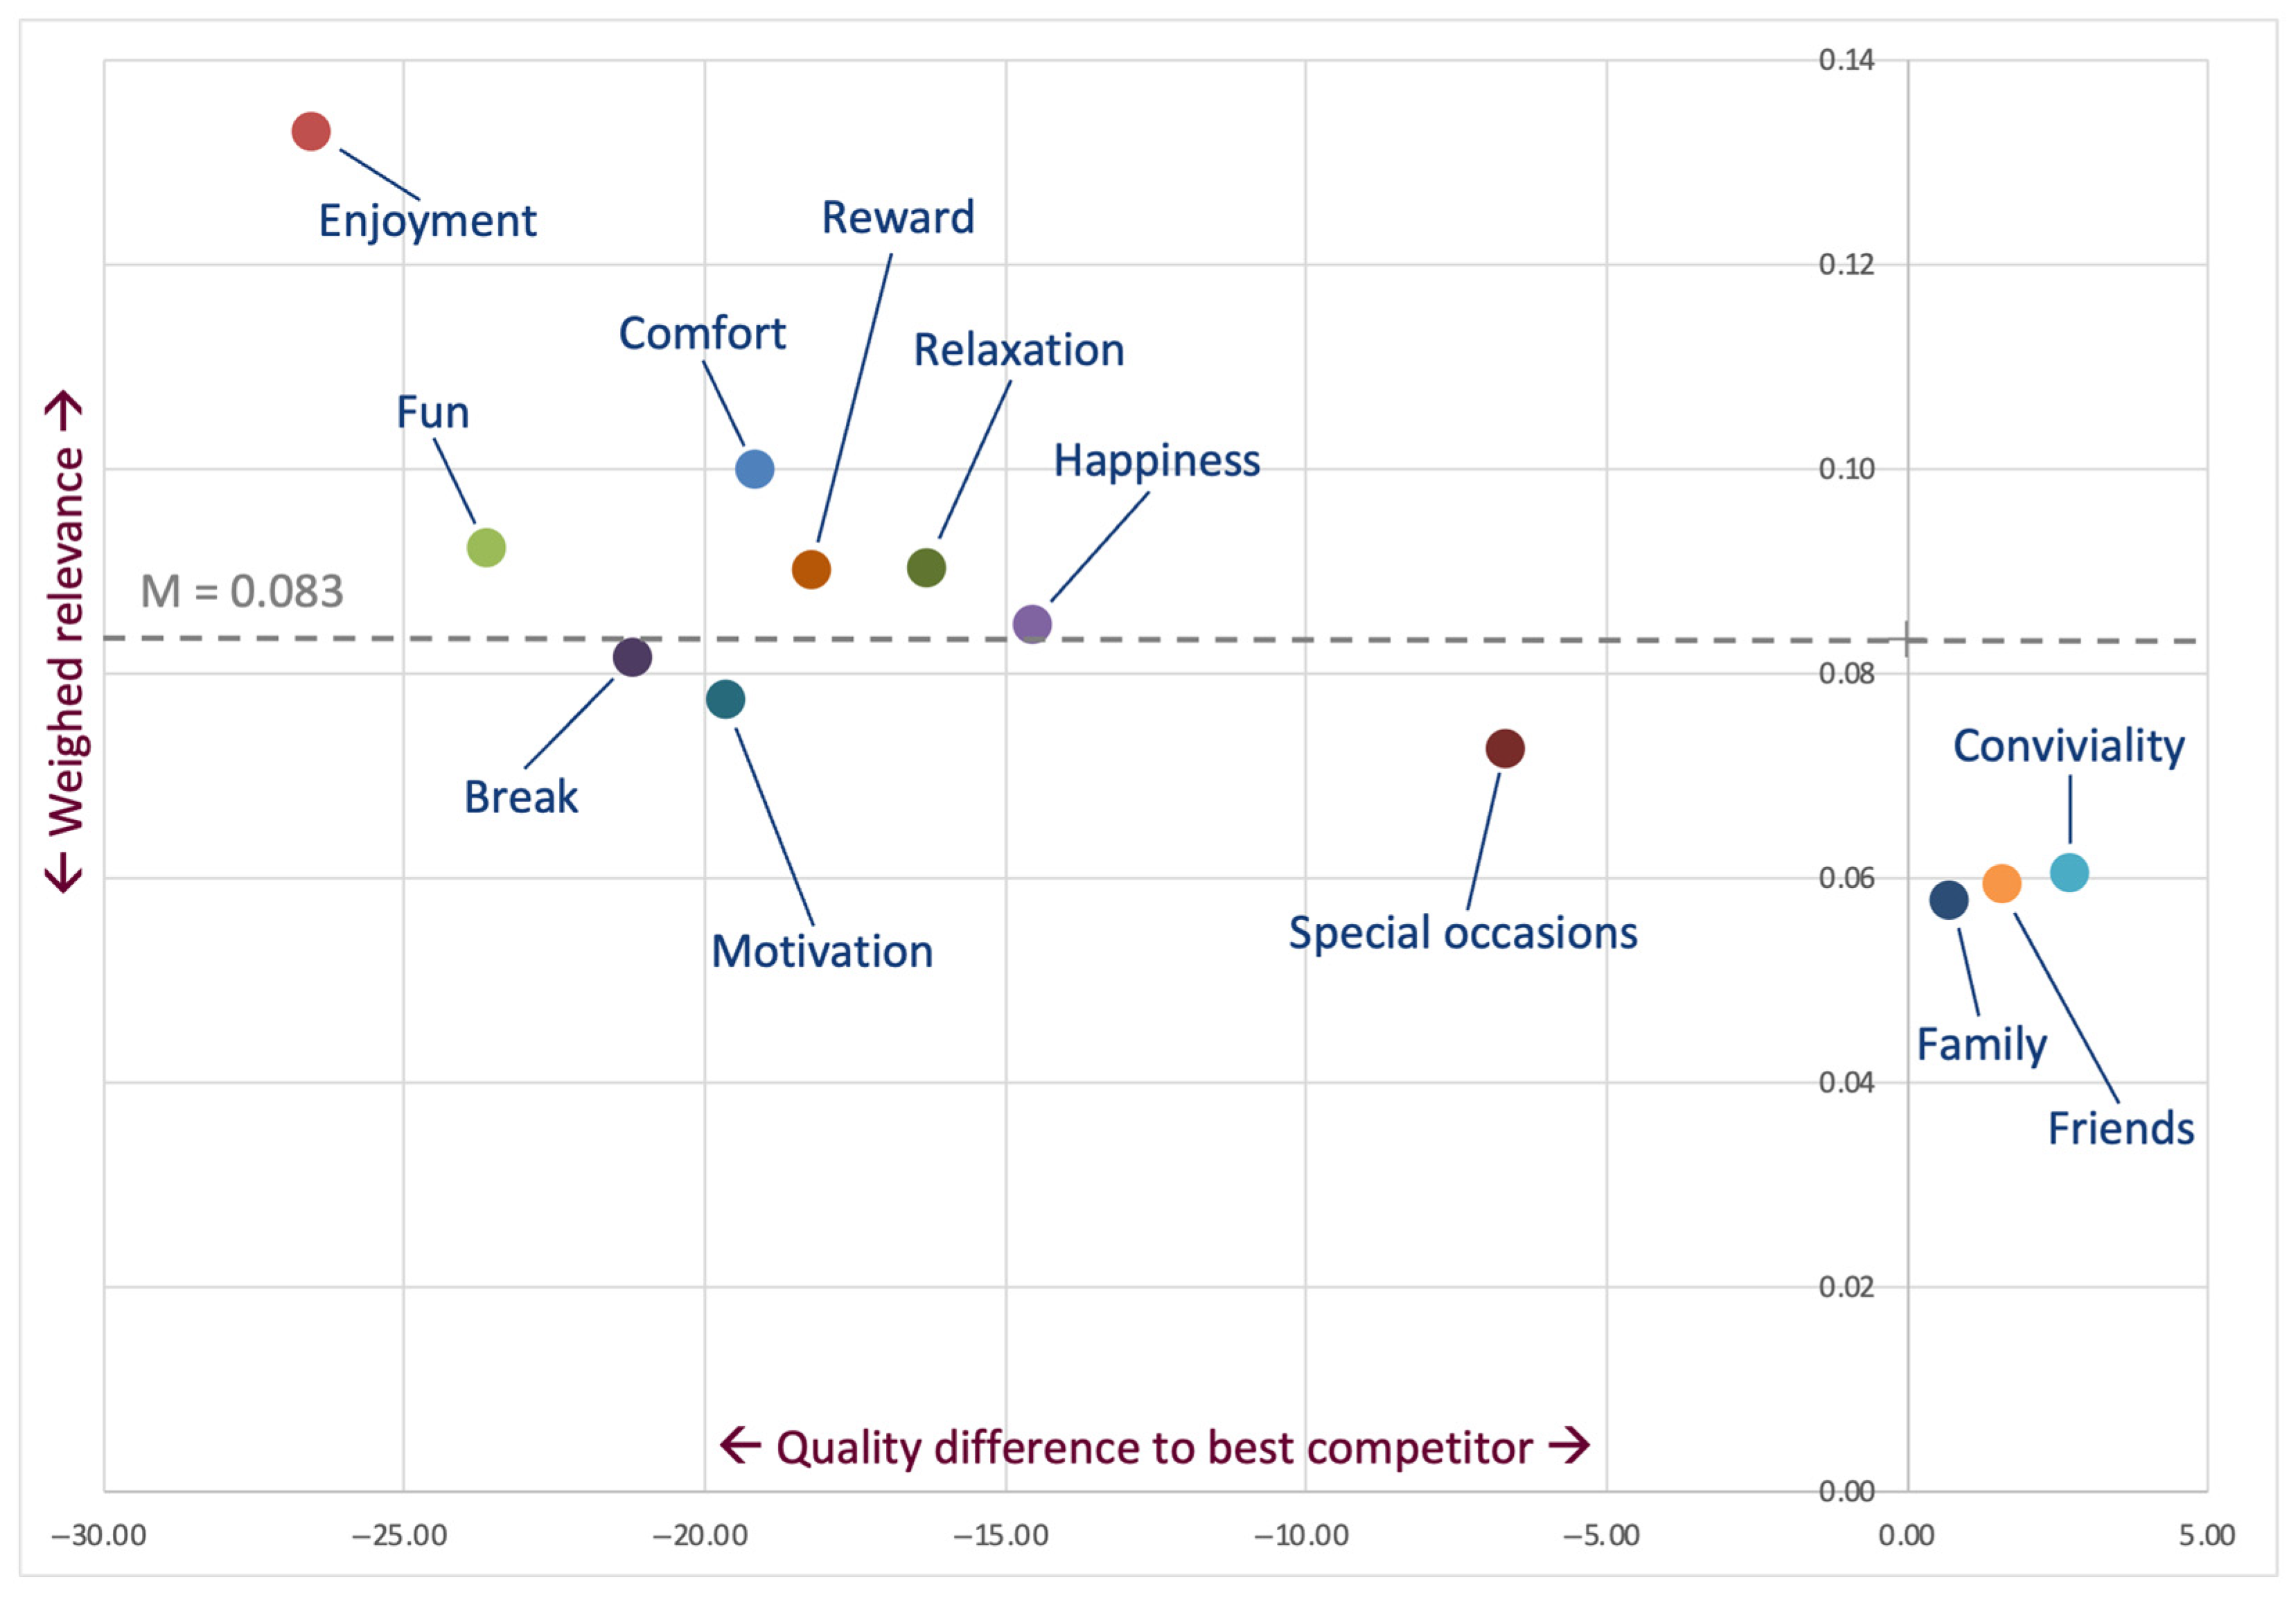
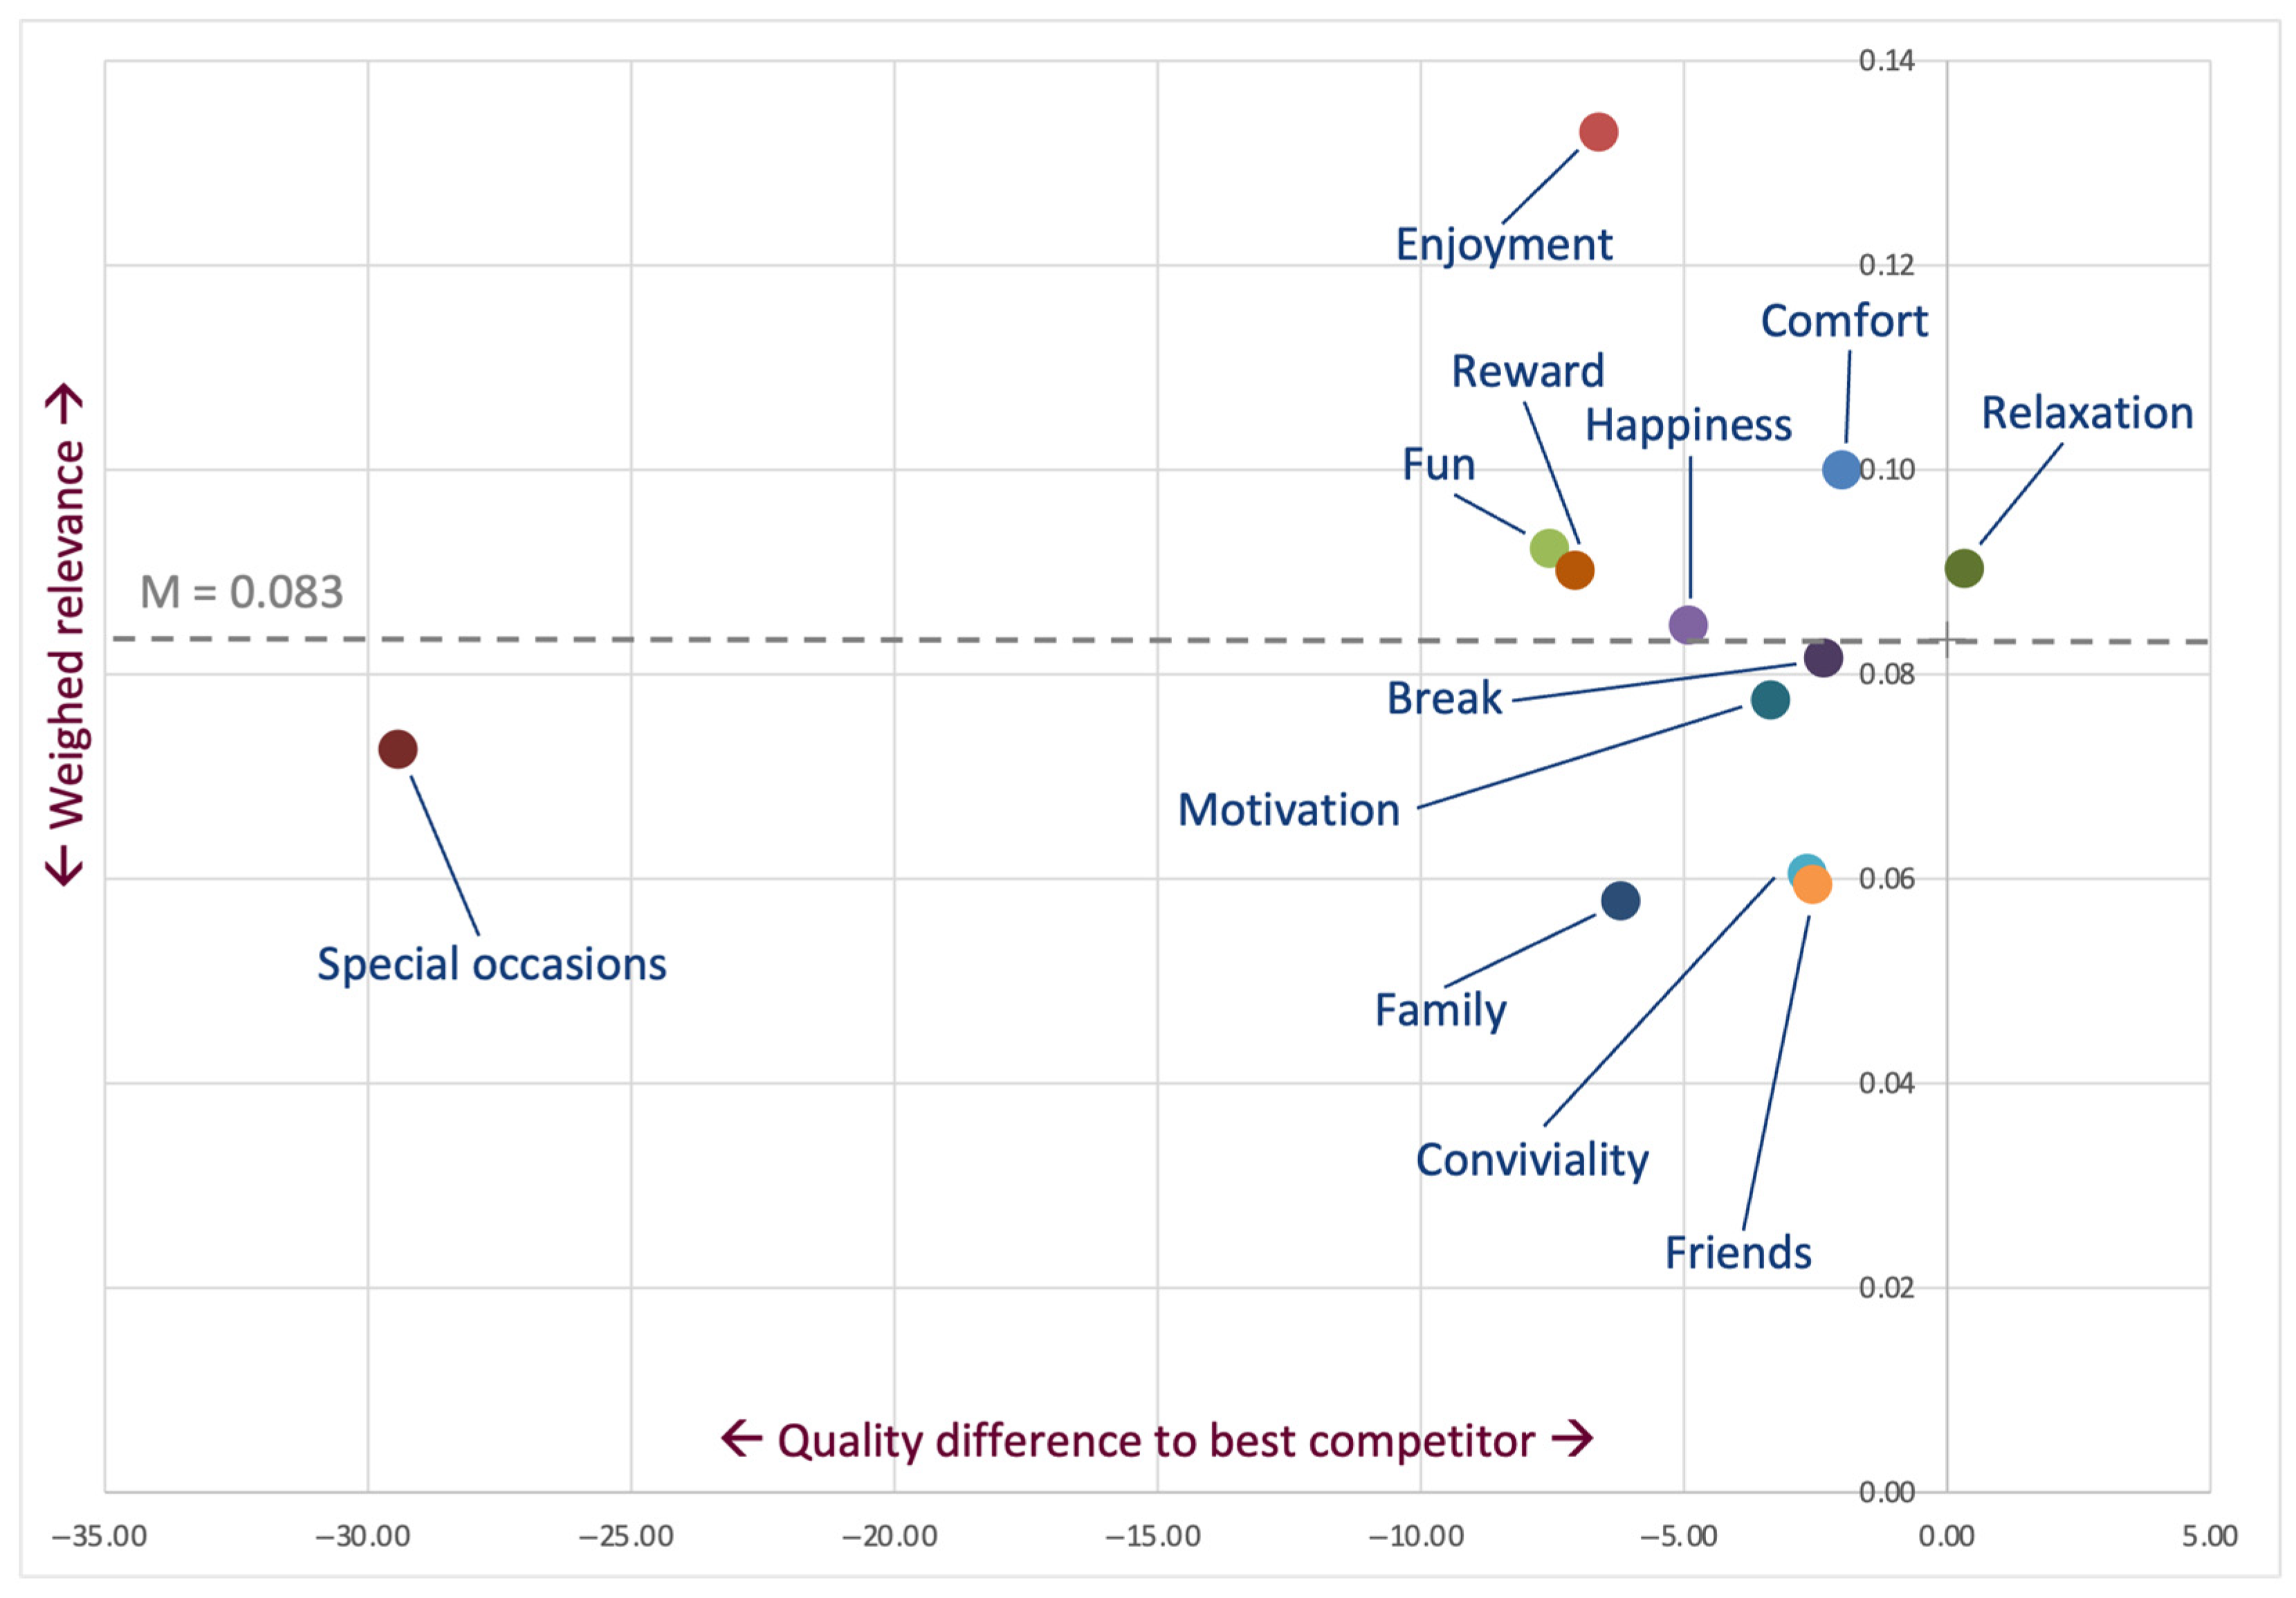
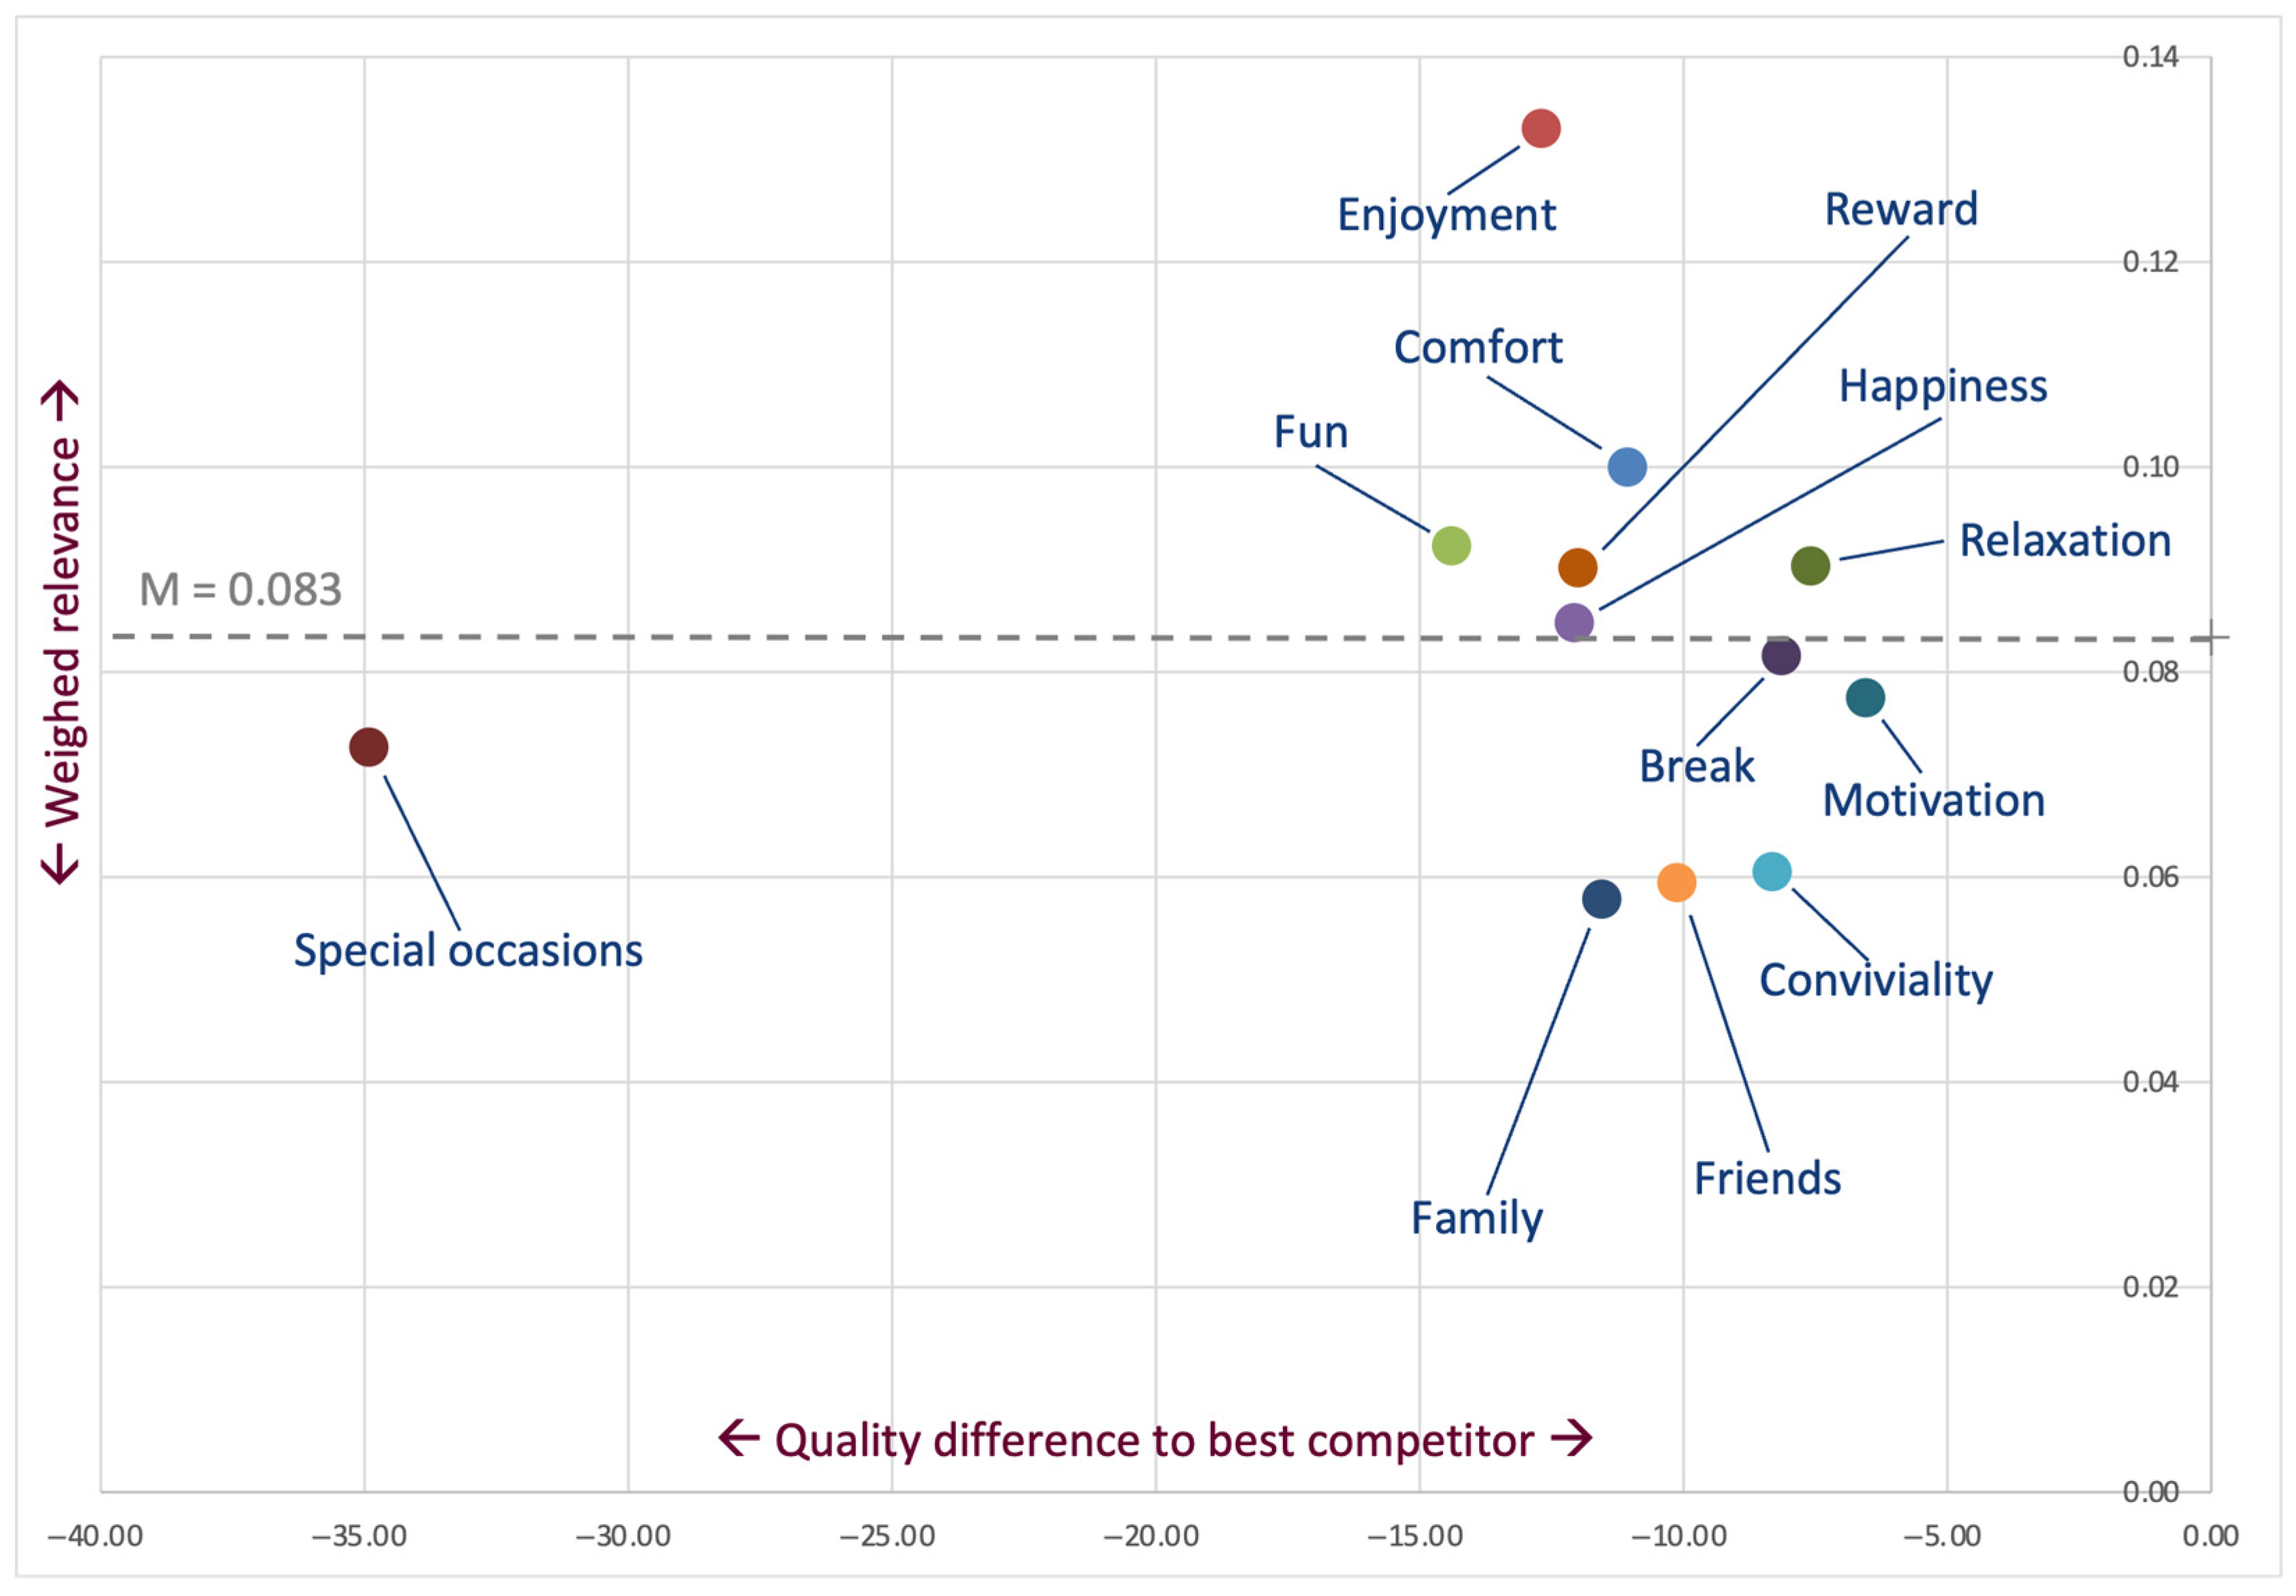
After deducing the positioning strategy for the overall brand, it is essential for a brand manager to know on which brand attributes he or she should position the brand. For this purpose, a matrix with the dimensions quality difference to the best competitor and weighted relevance of brand attributes can be drawn, as represented in Figure 2. Such a matrix follows the same principles as the one for the overall brand image, explained above, and also finds its foundation in the works of Manhas (2010), Martilla and James (1977), and Olsen et al. (2022), as well as the BCG matrix. Depending on whether the quality of a brand attribute is evaluated better for a brand than for its best competitor and if the weighted relevance is above or below average, the following priorities and strategic decision guidelines for positioning should be assigned to the respective brand attributes:
  • Positive quality difference to the best competitor and above average weighted relevance (stars): First priority; securing the attributes as the core brand identity;
  • Negative quality difference to the best competitor and above average weighted relevance (question marks): Second priority; selecting and developing the attributes to the core brand identity;
  • Positive quality difference to best competitor and below average weighted relevance (cash cows): Third priority; securing the attributes as the extended brand identity;
  • Negative quality difference to the best competitor and below average weighted relevance (poor dogs): Fourth priority; selecting and developing the attributes as the extended brand identity (if at all).

3.2. Analysing Market Performance and Deducing Strategic Decision Guidelines for Market Cultivation

It was argued in Section 2.4 that brand awareness, the general relevant set, the immediate relevant set, and loyalty intentions should form the elements of the brand-related buying process and, therewith, the key indicators of market performance.
In a survey, brand awareness can be measured through the following recognition question: Which of the following brands do you know, even if only by name? The general relevant set, which consists of all brands that are evaluated as good and generally considered for purchase, can be measured through the following question: Which of the following brands do you consider good so that you would principally buy them at some stage of your life? As mentioned in Section 2.4, it is assumed that the general relevant set derives from the overall evaluation of brands, which, in turn, derives from the brand image. The immediate relevant set, which entails all brands that are considered if a purchase has to be made right now, can be measured through the following question: Which of the following brands would you consider buying if you had to make a purchase right now? The loyalty intentions, which reflect the brand that would be purchased most often, can be measured through the following question: Which of the following brands would you buy most often?
The analysis of the market performance consists of two steps that lead to the deduction of strategic decision guidelines for market cultivation.
First, the frequency distributions of the aforementioned steps of the buying process (elements of the market performance) are calculated. Second, the conversions between these steps are calculated, i.e., general relevant set divided by brand awareness, immediate relevant set divided by general relevant set, and loyalty intentions divided by general relevant set (cf. Equation (5)). In comparison with its competitors, the conversions indicate a brand’s strengths and weaknesses along the steps of the buying process. This approach is consistent with the conversions utilised in marketing funnels (Kotler & Keller, 2016).
C i = F i F i 1
  • Cj: conversion from buying process step i − 1 to buying process step i;
  • Fj: frequency of buying process step i.
As elaborated in Section 2.4, the steps of the buying process are related to market strategies, i.e., awareness strategy, image strategy, sales strategy, and loyalty strategy. Accordingly, conversions that are higher than those of competitors indicate a current market strategy that is outperforming the competitors, whilst conversions that are lower than those of competitors indicate the need for improvement with regard to the respective market strategies. Thus, it is advised that a brand should emphasise on those market strategies that relate to the steps of the buying process on which the brand is outperformed by its competitors. This means in particular:
  • If a brand is outperformed on brand awareness, an awareness strategy is advised;
  • If a brand is outperformed on the conversion from brand awareness to general relevant set, an image strategy is advised;
  • If a brand is outperformed on the conversion from general relevant set to immediate relevant set, a sales strategy is advised;
  • If a brand is outperformed on the conversion from immediate relevant set to loyalty intention, a loyalty strategy is advised.

4. Application of the Method for Integrated Brand Analysis and Strategy 1: Food Retail Brands

The Method for Integrated Brand Analysis and Strategy was developed and explained in Section 3. To show its applicability in practice, German food retail brands are analysed accordingly, and strategic decision guidelines are deduced in Section 4. Section 4.1 shows the analysis of the images of German food retail brands and the resulting strategic decision guidelines for brand positioning. In Section 4.2, the market performance of these brands is analysed, and the resulting strategic decision guidelines for market cultivation are deduced.

4.1. Brand Image Analysis and Brand Positioning

In the following sub-sections, the attributes of food retail brands are developed from secondary data, the method of the quantitative brand analysis is described, and the brand images of German food retailers are analysed for the overall brands and the brand attributes, including the deduction of strategic decision guidelines for positioning.

4.1.1. Determining Brand Attributes Based on Secondary Data in an Inside-Out Approach

The possible brand attributes of food retailers are developed as feature-based attributes from existing literature in an inside-out approach. Godbersen et al. (2023) develop a comprehensive model of performance categories and elements of food retailers that can be evaluated by customers. Based on the original marketing mix (McCarthy, 1961) and especially several conceptualisations of the retail marketing mix (e.g., McGoldrick, 2002; Walters & White, 1987), Godbersen et al. (2023) define five performance categories of food retailers: product range, service, pricing, location appeal, and communication outside the store. On a more concrete level, 19 performance elements can be assigned to these five performance categories, as follows (items derived for the subsequent quantitative study in brackets):
(1) Product range
  • Width of the product range (Large range of different products; German: Große Auswahl an verschiedenen Produkten);
  • Depth of the product range (Large range of different brands for particular products; German: Große Auswahl an unterschiedlichen Marken bei den einzelnen Produkten);
  • Product quality (Quality of the products; German: Qualität der Produkte);
  • Socially responsible products (Range of socially responsible products, like Fair Trade or regional products; German: Angebot von sozial verantwortlichen Produkten wie Fair Trade und regionale Produkte).
(2) Service
  • Personnel (Sales personnel; German: Verkaufspersonal);
  • Self-service, esp. self-checkout (Self-checkout counters; German: Selbstbedienungskassen);
  • Complaint and replacement (Complaint management and replacement options; German: Beschwerdemanagement und Umtauschmöglichkeiten);
  • Order and delivery service (Order and/or delivery service; German: Bestell- und/oder Lieferservice).
(3) Pricing
  • Price level (Price level; German: Preisniveau);
  • Discounts (Discounts; German: Rabatte und Preisnachlässe);
  • Loyalty cards (Customer or loyalty cards; German: Kunden- oder Treuekarten);
  • Payment options (Variety of payment options; German: Vielfalt der Bezahlmöglichkeiten).
(4) Location appeal
  • Accessibility (Accessibility; German: Erreichbarkeit);
  • Parking facilities (Parking facilities; German: Parkplätze);
  • Shop design (Shop design; German: Ladengestaltung);
  • Opening hours (Opening hours; German: Öffnungszeiten).
(5) Communication outside the store
  • Product information (Display of information about the offers of the food retailer outside the store; German: Darstellung von Informationen über das Angebot des Lebensmitteleinzelhändlers außerhalb des Ladengeschäfts);
  • Company information (Display of information about the food retailer in general outside the store; German: Darstellung des Lebensmitteleinzelhändlers im Allgemeinen außerhalb des Ladengeschäfts);
  • Dialogue (Communication options with the food retailer outside the store; German: Kommunikationsmöglichkeit mit dem Lebensmitteleinzelhändler außerhalb des Ladengeschäfts).
The 19 performance elements, identified by Godbersen et al. (2023), will serve as brand attributes in this study.

4.1.2. Methods of Quantitative Brand Analysis

The data for the quantitative analysis of food retail brands were collected through an online questionnaire between 1 September and 31 October 2025. The participants were students of business psychology at a university with study centres throughout Germany. The participants are part-time students who also have regular jobs. The sample consists of 923 participants, of which 72.16% are female, 27.74% male, and 0.11% non-binary. The youngest participant is 18 years old, whilst the oldest participant is 59 years old. The average age of the sample is 25.72 years (SD = 4.83). The participants visit a food retailer 8.64 times per month on average (SD = 4.76). They spend EUR 61.15 per visit on average (SD = 91.86). Of the participants, 48.97% shop predominantly for themselves, 33.59% shop predominantly for others, and 17.44% shop predominantly for themselves and others. As the participants work in regular jobs and study on the side, the sample does not consist of “typical” students but rather represents “normal” consumers. However, the sample’s characteristics, i.e., relatively young age, early stage of the career, etc., mean that the sample does not represent the German population or the target group of the analysed brands.
Five German food retail brands were selected to analyse their brand images and market performances: Aldi, Edeka, Kaufland, Lidl, and Rewe. These brands have a combined market share of 76.8% (BVE, 2025). Aldi and Lidl are discounters, Edeka and Rewe are supermarkets, and Kaufland is a self-service department store.
The five food retail brands were evaluated by the participants on the brand attributes that were developed in Section 4.1.1.
As described in Section 3.1.2, the relevance of the brand attributes and their perceived quality for each examined brand were measured on continuous rating scales from 0 to 100.
The relevance was measured through the following question: When buying from food retailers, different aspects can be important. Please indicate on a scale from 0 “not important” to 100 “very important”, how important the following features of food retailers are for you personally (German: Wenn man im Lebensmitteleinzelhandel einkauft, können einem verschiedene Eigenschaften eines Lebensmitteleinzelhändlers wichtig sein. Bitte geben Sie im Folgenden auf einer Skala von 0 “nicht wichtig” bis 100 “sehr wichtig” an, wie wichtig Ihnen persönlich die folgenden Eigenschaften von Lebensmitteleinzelhändlern sind.).
The perceived quality was measured through the following question: In this section, you should indicate how good you personally evaluate different features of different food retailers. Please give your answers on scales from 0 “not good” to 100 “very good”. Please indicate now how good you evaluate the following features of <brand> (German: In diesem Abschnitt sollen Sie beurteilen, wie gut Sie persönlich die verschiedenen Eigenschaften bei einzelnen Lebensmitteleinzelhändlern bewerten. Bitte geben Sie Ihre Antwort jeweils auf einer Skala von 0 “nicht gut” bis 100 “sehr gut”. Bitte geben Sie nun an, wie gut Sie persönlich die folgenden Eigenschaften bei <brand> bewerten.).
The analysis was conducted with R (R Development Core Team, 2017) and follows the process described in Section 3.1.2. After calculating the arithmetic means for the relevance and perceived quality, the weighted relevance of each brand attribute (relevance of brand attribute divided by the sum of relevance scores for all brand attributes), the overall evaluation of each brand (sum of the multiplications of weighted relevance and brand attribute quality), the number of attributes with the best evaluation for each brand, and the quality difference to the best competitor for each attribute and brand were determined. On this basis, the matrices for analysing the overall brand image and deriving strategic decision guidelines for overall brand positioning, and for analysing the brand attributes and deriving strategic decision guidelines for creating differentiated brand identities were deduced.
Additionally, the adequacy of the measurement model, which should be understood as a formative measurement, was tested through variance inflation factors for the relevance ratings. All variance inflation factors are lower than 2.20 (highest variance inflation factor = 2.19 for company information) and indicate an appropriate adequacy of the measurement model (all variance inflation factors are reported in Appendix A).

4.1.3. Brand Analysis and Strategic Decision Guidelines for Positioning on Brand Level

The basis for the analysis of the brand image is the relevance of the brand attributes and their perceived quality for the examined brands, as described in Section 3.1.2 and Section 4.1.2. The arithmetic means and standard deviations of these constructs for German food retail brands are represented in Table 1.
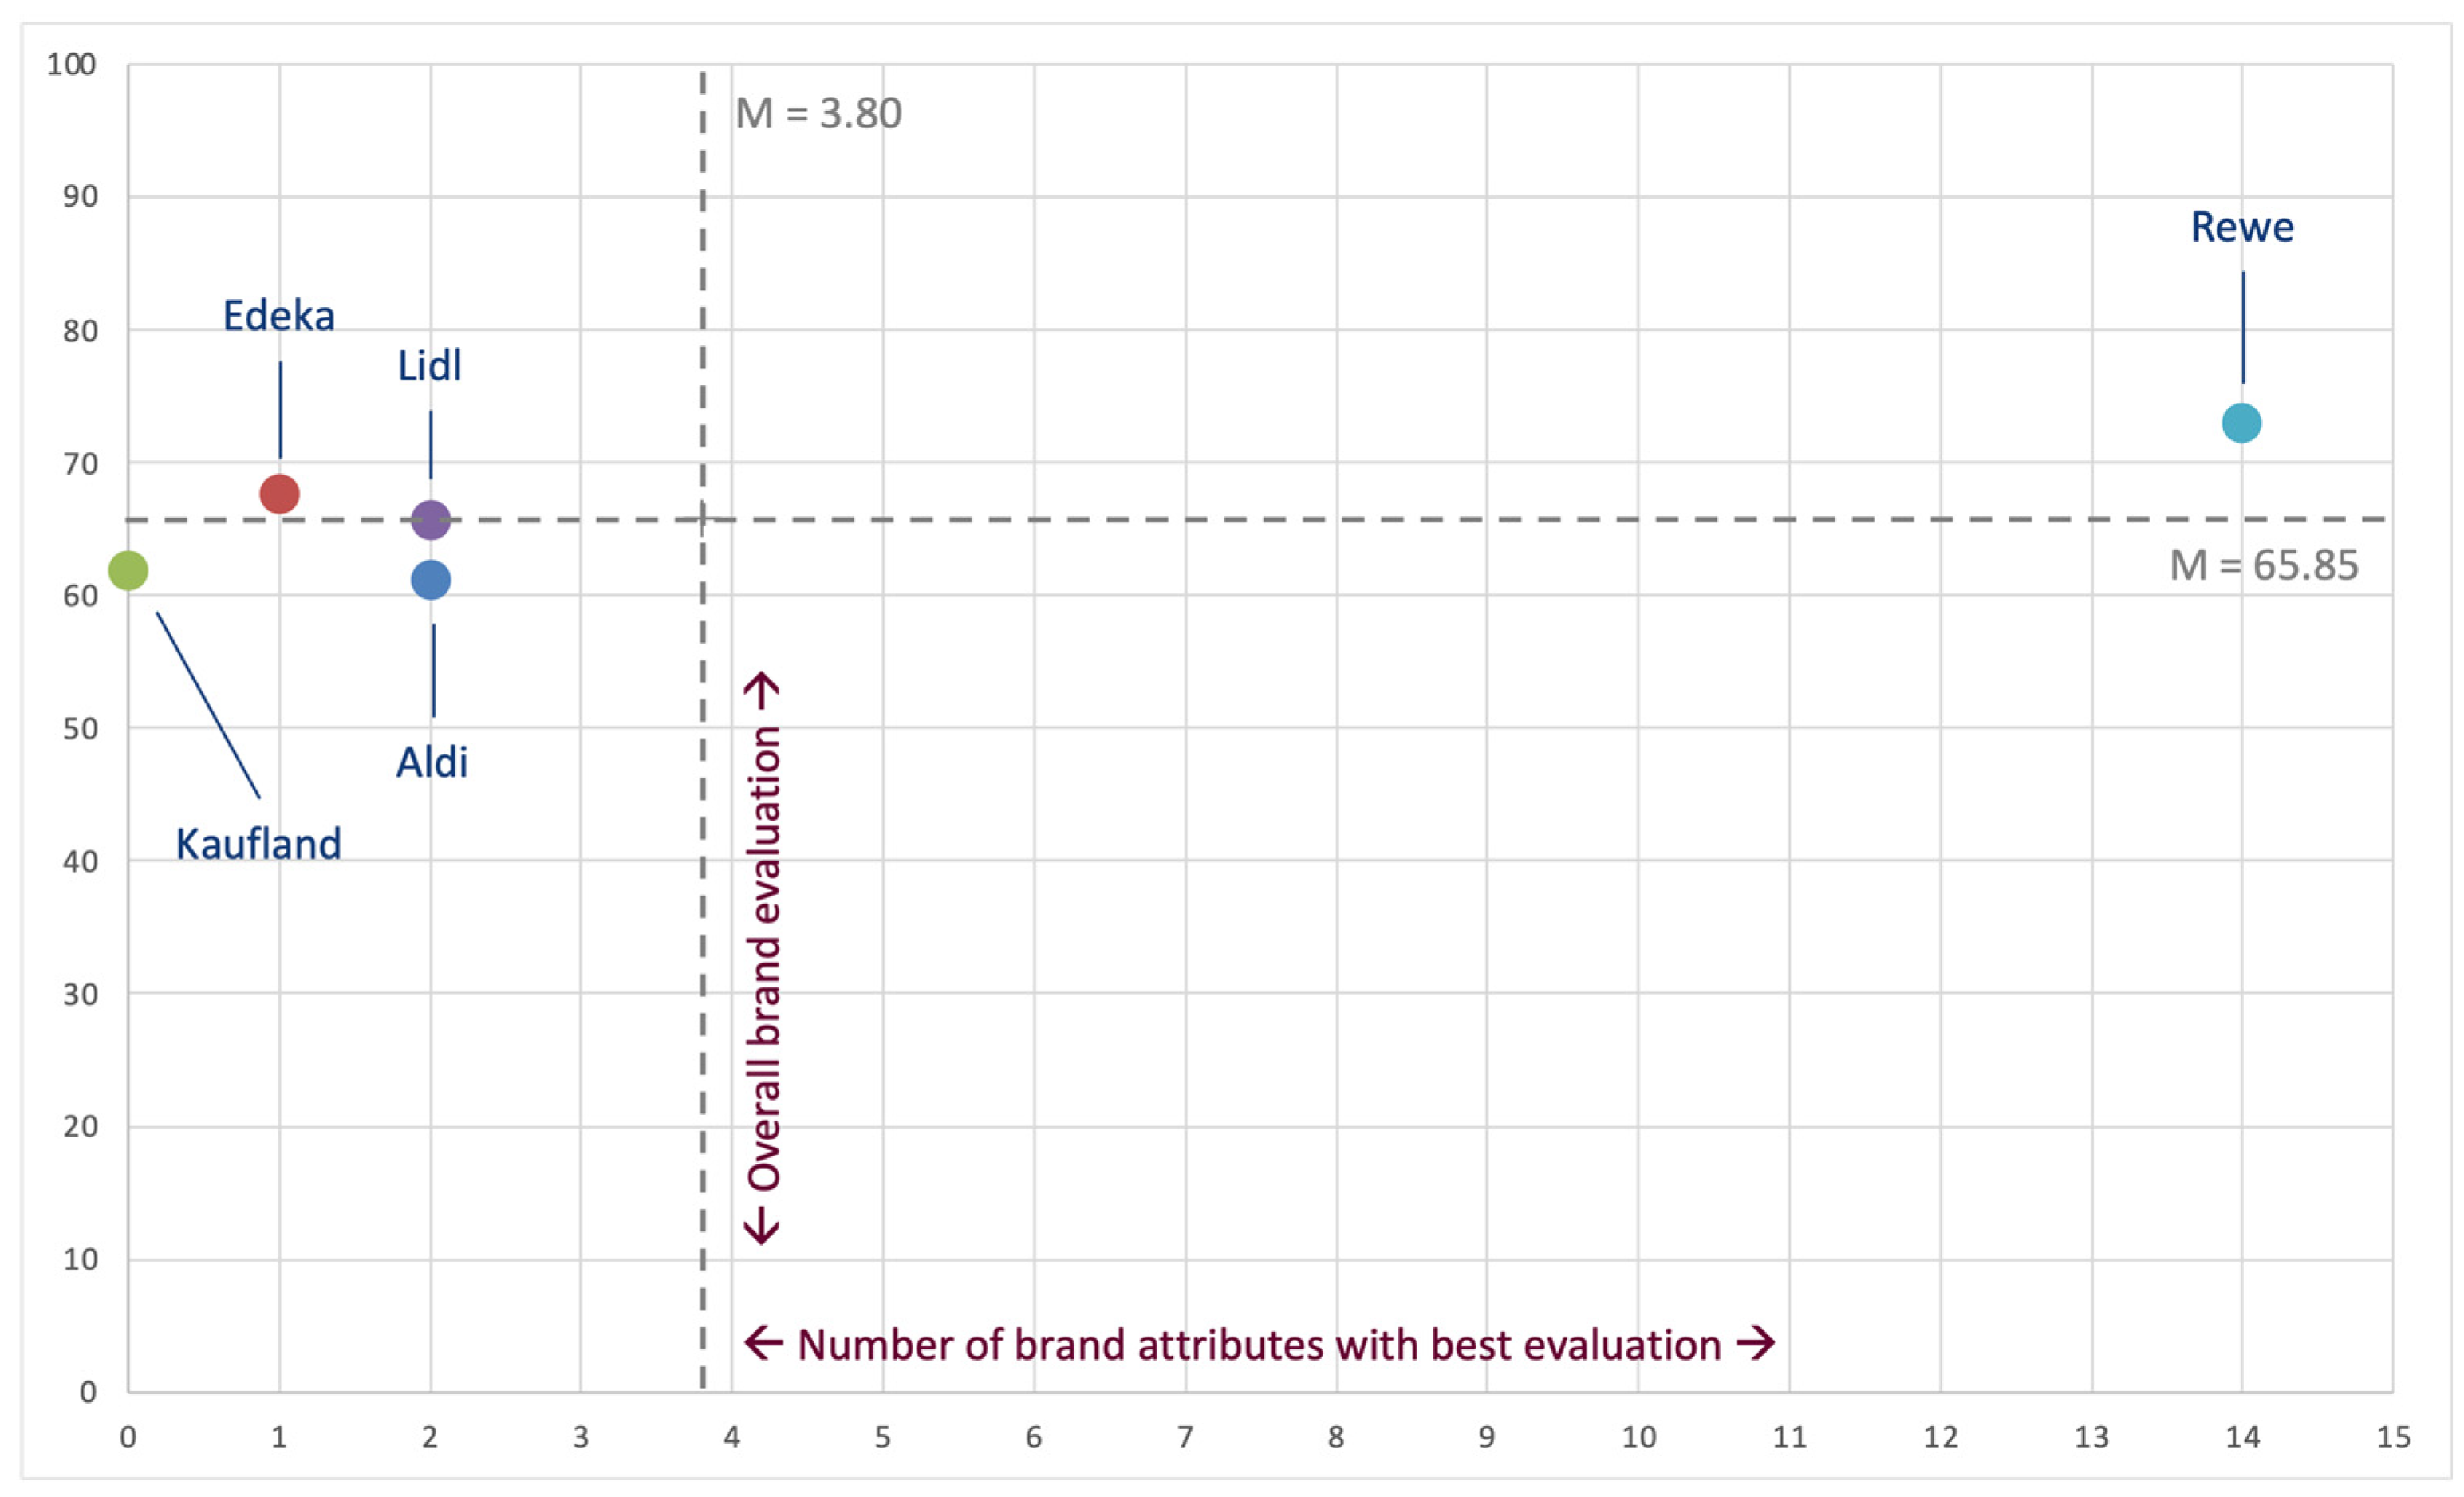
On the basis of the relevance and quality of the brand attributes, the number of brand attributes with the best evaluation and the overall evaluation of the brands, i.e., the sum of the multiplications of weighted relevance and perceived quality, are calculated. Figure 3 represents the resulting matrix. This matrix can be divided into four quadrants by the arithmetic means of the respective dimensions, as described in Section 3.1.2.
Rewe (number of attributes with best evaluation N = 14; overall evaluation tQ = 72.96) is positioned in the upper right quadrant, which means the brand is evaluated best on an above average number of brand attributes (M = 3.80) and shows an above average overall evaluation (M = 65.85). Thus, the brand is considered a Star and the resulting strategic decision guidelines should focus on securing the brand based on the existing brand image.
Edeka (N = 1; tQ = 67.63) is positioned in the upper left quadrant, which means the brand is evaluated best on a below average number of brand attributes (M = 3.80) and shows an above average overall evaluation (M = 65.85). Thus, the brand is considered a Question mark, and the resulting strategic decision guidelines should focus on developing the brand based on the existing brand image.
Aldi (N = 2; tQ = 61.14), Kaufland (N = 0; tQ = 61.93) and Lidl (N = 2; tQ = 65.60) are positioned in the lower left quadrant, which means the brands are evaluated best on a below average number of brand attributes (M = 3.80) and show below average overall evaluations (M = 65.85). Thus, these brands are considered Poor dogs, and the resulting strategic decision guidelines should focus on developing new brand identities and images.
At this point, an important caveat has to be highlighted. The afore-reported analysis and deduction of strategic decision guidelines are only valid for the participants of this survey, who do not necessarily represent the target group of the examined brands.
Comparing the results and respective strategic decision guidelines when utilising the median for dividing the quadrants of the matrix with those of the arithmetic mean, reported above, indicates robustness of the method of integrated brand analysis and strategy. The median of brand attributes with the best evaluation is 2.00, compared to the arithmetic mean of 3.80. However, this difference does not lead to assigning brands to a “better” quadrant. Similarly, the median of 65.60 for overall brand evaluation, which is slightly higher than the arithmetic mean of 65.85, does not change the strategic decision guidelines for the examined brands.

4.1.4. Brand Analysis and Strategic Decision Guidelines for Positioning on Brand Attribute Level

Section 4.1.3 sheds light on how overall brand images are analysed and how subsequent strategic decision guidelines, which the brands should pursue in their overall brand positioning, are deduced. Section 4.1.4 elaborates on how the brands are performing on the level of brand attributes and what attribute-related strategic decision guidelines should be followed to position the brands, assuming the sample would represent the target group. To this end, matrix analyses on the brand attribute level are undertaken, as described in Section 3.1.2. The dimensions of the matrices are the quality difference to the best competitor and weighted relevance of the brand attributes.
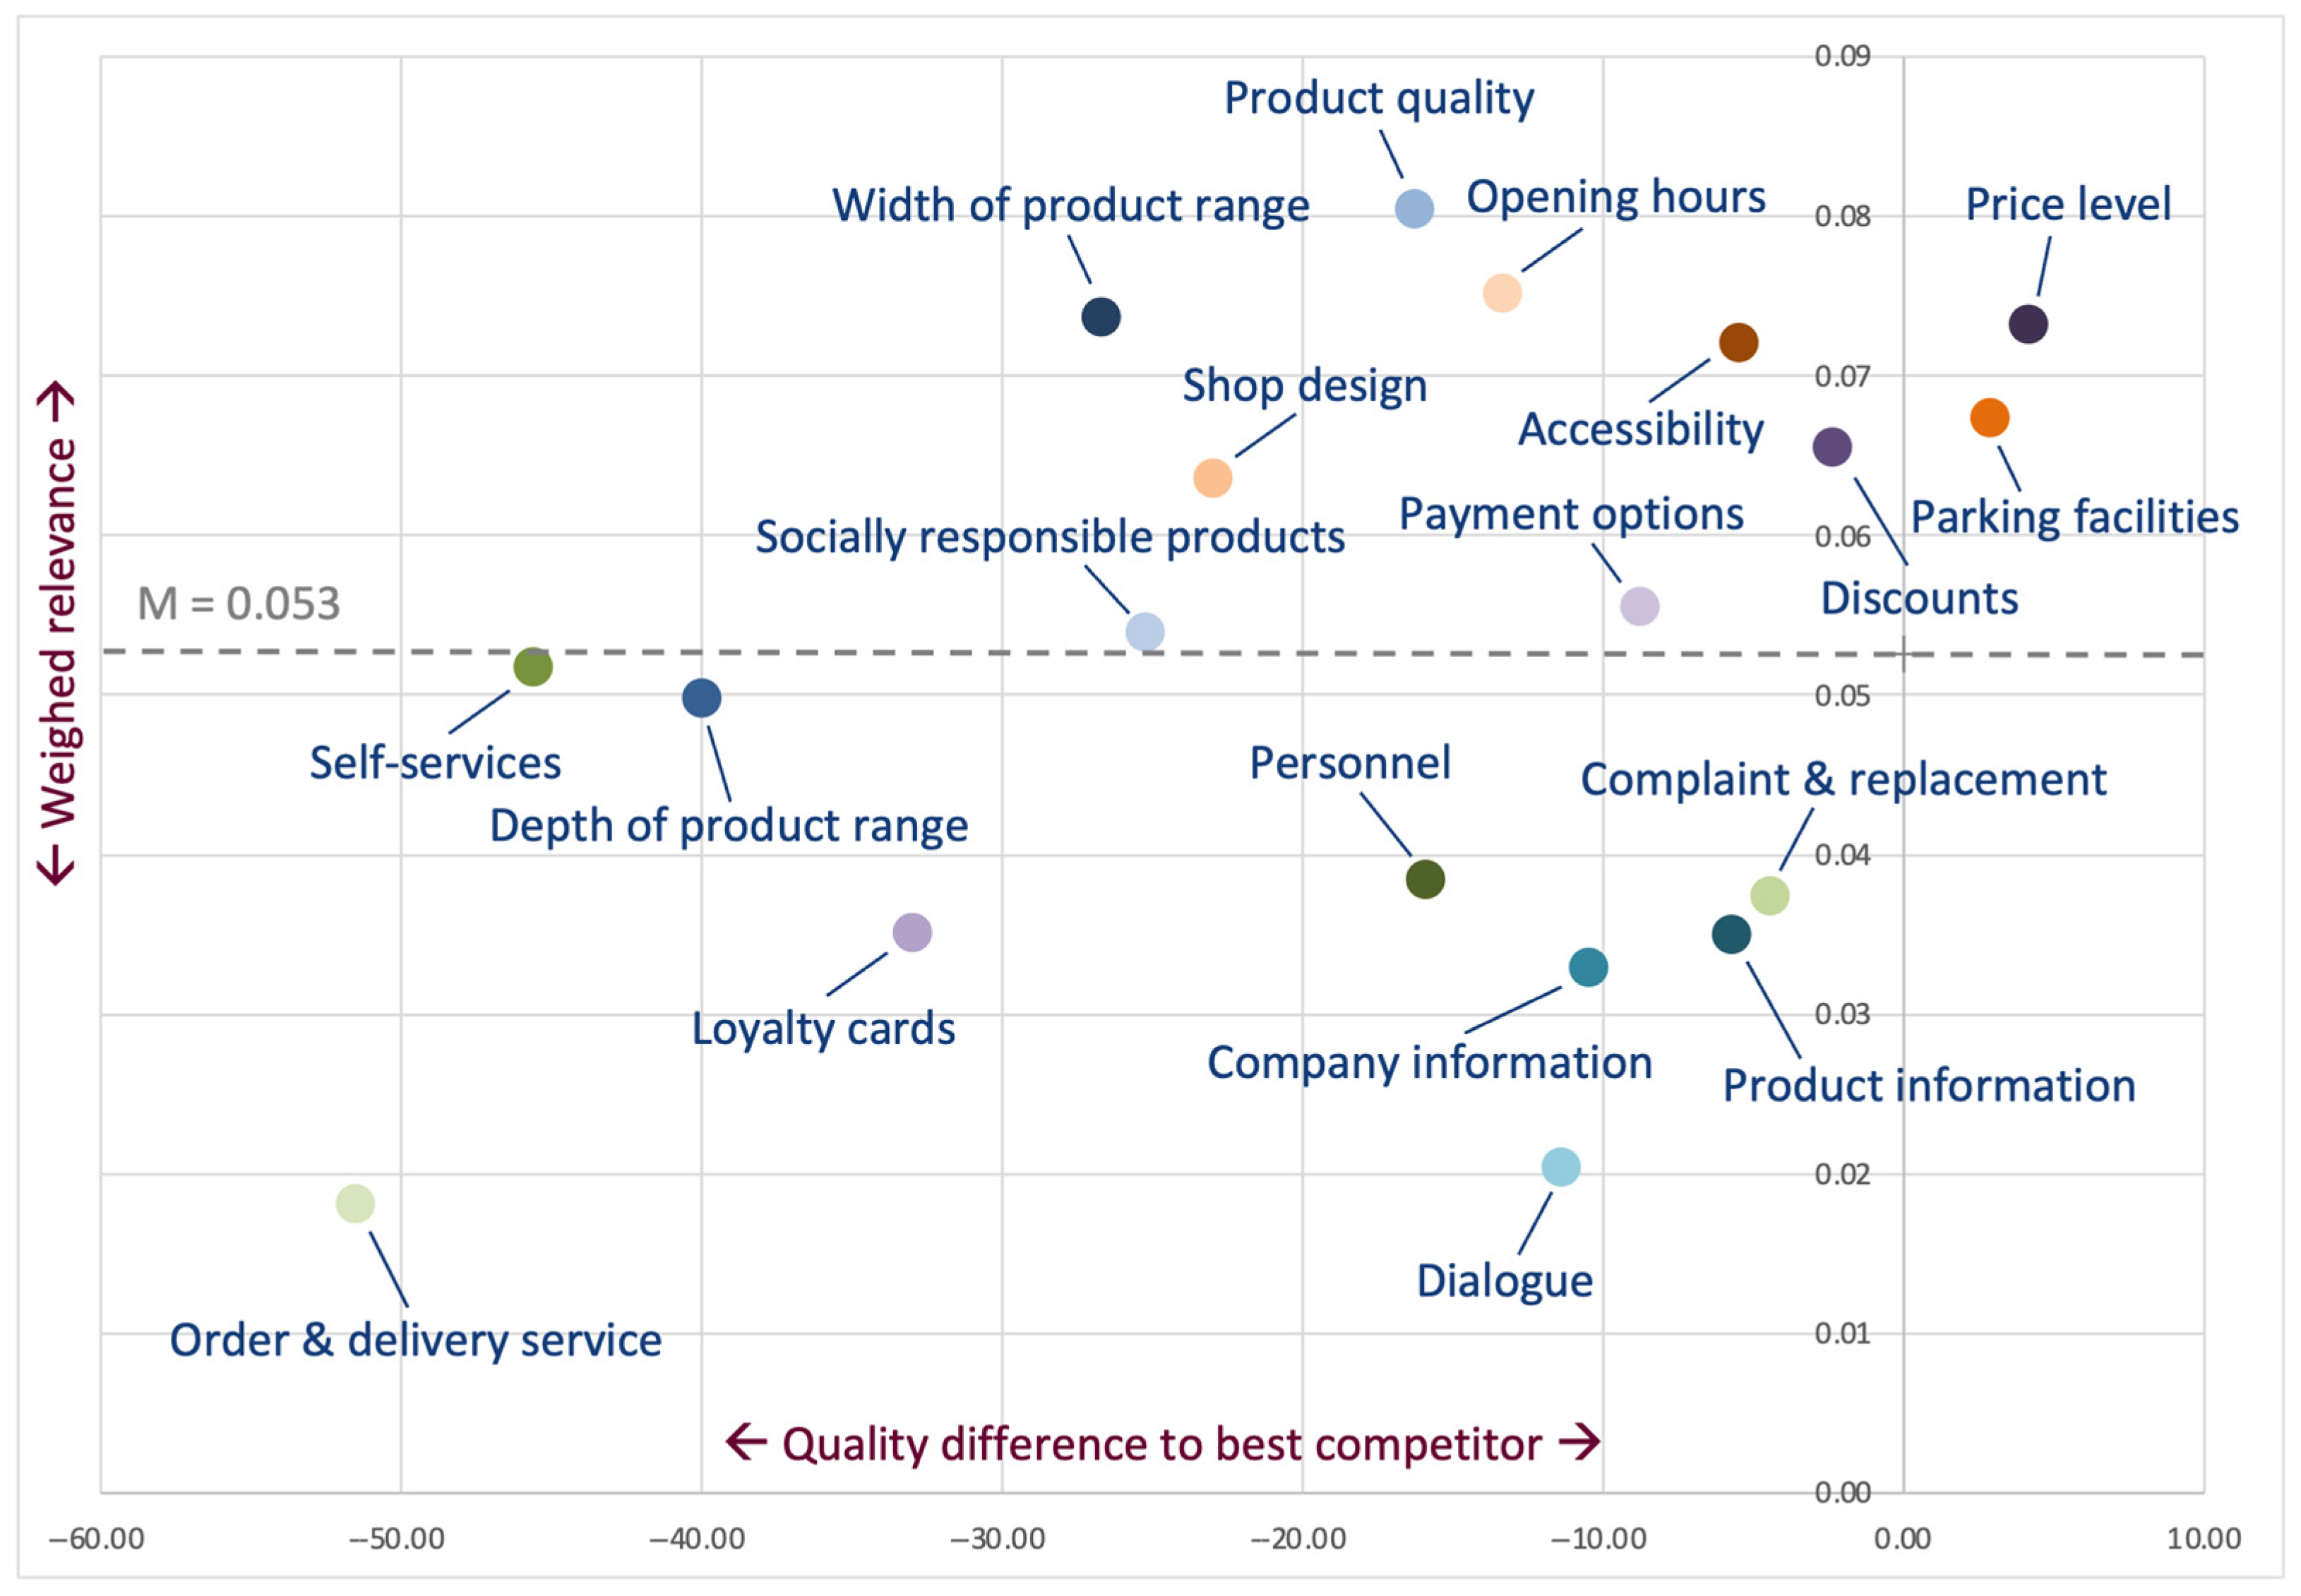
The matrix of quality difference to the best competitor and weighted relevance for Aldi is represented in Figure 4. The following paragraphs describe the respective results.
The following Star brand attributes (upper right quadrant), which show a positive quality difference to the best competitor and an above average relevance (M = 0.053), should be given first overall priority in brand positioning, and should be secured as the core brand identity (superordinated performance categories, quality difference to best competitor qD and weighted relevance wR in brackets):
  • Price level (pricing; qD = +4.14; wR = 0.073);
  • Parking facilities (location appeal; qD = +2.87; wR = 0.067).
The following Question mark brand attributes (upper left quadrant), which show a negative quality difference to the best competitor and an above average relevance (M = 0.053), should be given second overall priority in brand positioning, and should be selected and developed into the core brand identity (superordinated performance categories, quality difference to best competitor qD and weighted relevance wR in brackets):
  • Width of the product range (product range; qD = −26.71; wR = 0.074);
  • Product quality (product range; qD = −16.27; wR = 0.080);
  • Socially responsible products (product range; qD = −25.25; wR = 0.054);
  • Discounts (pricing; qD = −2.38; wR = 0.066);
  • Payment options (pricing; qD = −8.77; wR = 0.056);
  • Accessibility (location appeal; qD = −5.47; wR = 0.072);
  • Shop design (location appeal; qD = −23.02; wR = 0.064);
  • Opening hours (location appeal; qD = −13.34; wR = 0.075).
Aldi has no Cash cow brand attributes (lower right quadrant), which show a positive quality difference to the best competitor and a below-average relevance (M = 0.053).
The following Poor dog brand attributes (lower left quadrant), which show a negative quality difference to the best competitor and a below-average relevance (M = 0.053), should be given the lowest overall priority in brand positioning, and might be selected and developed into the extended brand identity (superordinated performance categories, quality difference to best competitor qD and weighted relevance wR in brackets):
  • Depth of the product range (product range; qD = −39.98; wR = 0.050);
  • Personnel (service; qD = −15.95; wR = 0.038);
  • Self-Service (service; qD = −45.64; wR = 0.052);
  • Complaint and replacement (service; qD = −4.46; wR = 0.037);
  • Order and delivery service (service; qD = −51.55; wR = 0.018);
  • Loyalty cards (pricing; qD = −32.97; wR = 0.035);
  • Product information (communication outside the store; qD = −5.76; wR = 0.035);
  • Company information (communication outside the store; qD = −10.52; wR = 0.033);
  • Dialogue (communication outside the store; qD = −11.41; wR = 0.020).
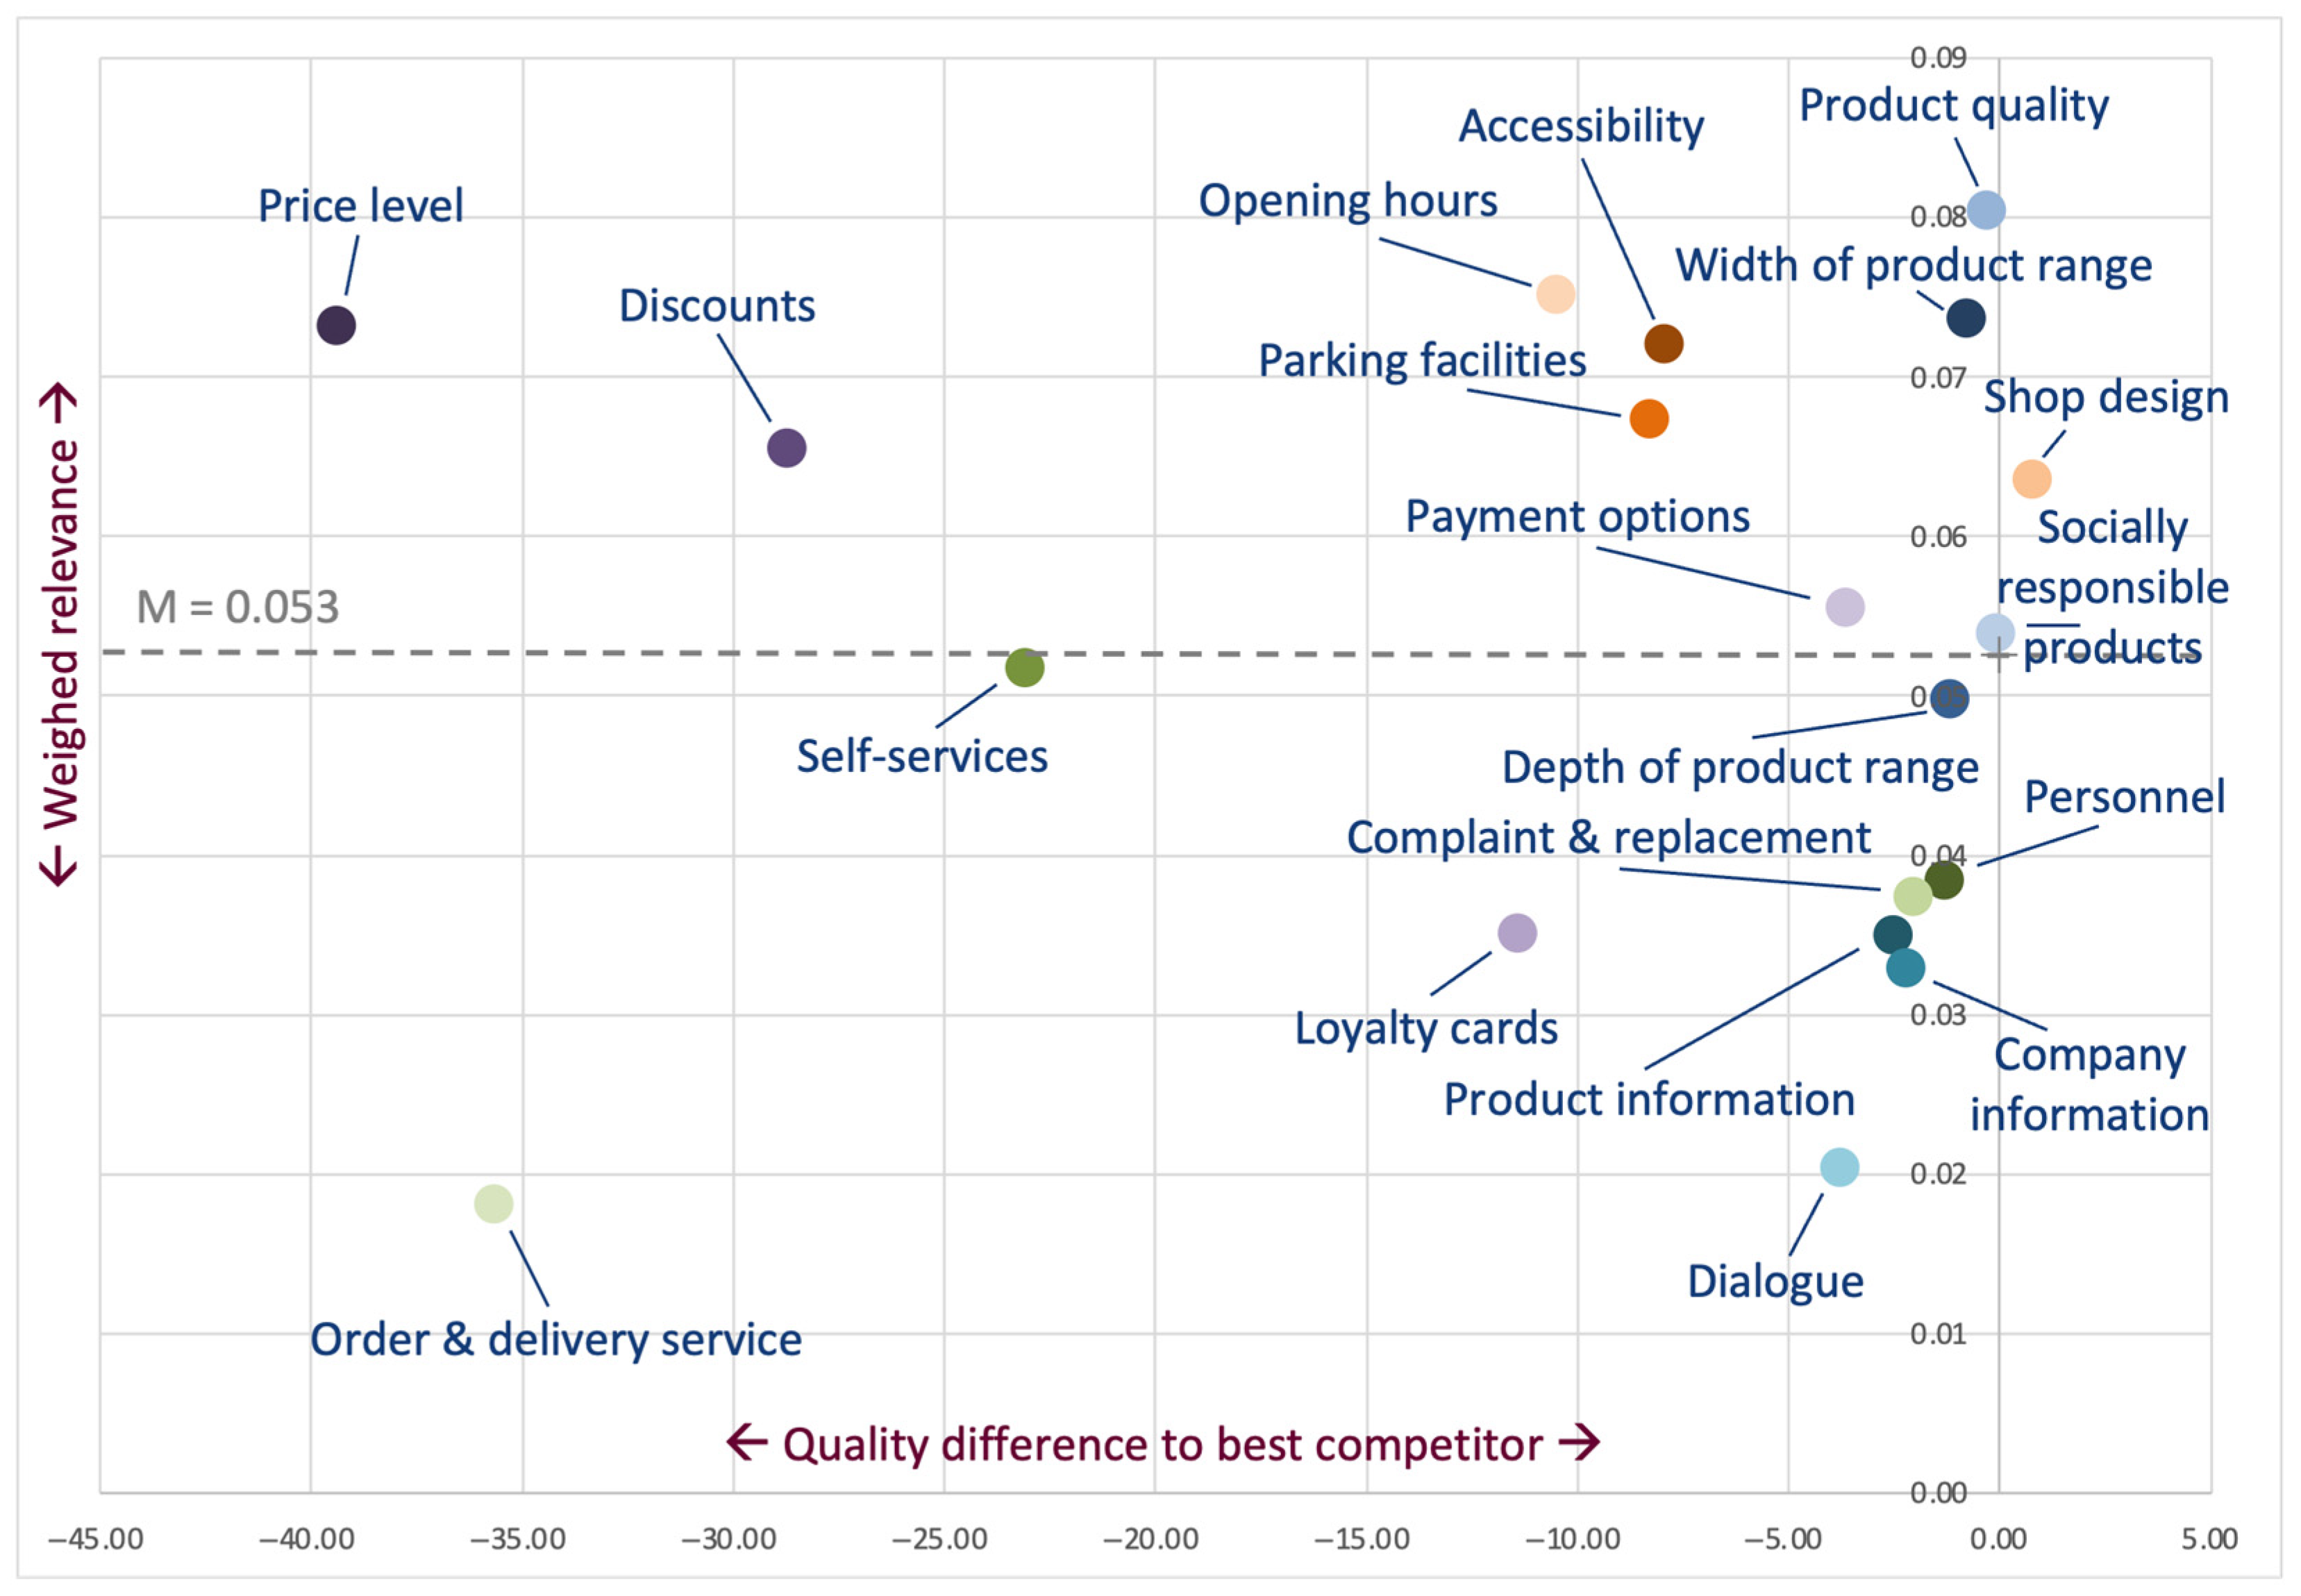
The matrix of quality difference to the best competitor and weighted relevance for Edeka is represented in Figure 5. The following paragraphs describe the respective results.
The following Star brand attribute (upper right quadrant), which shows a positive quality difference to the best competitor and an above-average relevance (M = 0.053), should be given first overall priority in brand positioning, and should be secured as the core brand identity (superordinated performance category, quality difference to best competitor qD and weighted relevance wR in brackets):
  • Shop design (location appeal; qD = +0.75; wR = 0.064).
The following Question mark brand attributes (upper left quadrant), which show a negative quality difference to the best competitor and an above-average relevance (M = 0.053), should be given second overall priority in brand positioning, and should be selected and developed into the core brand identity (superordinated performance categories, quality difference to best competitor qD and weighted relevance wR in brackets):
  • Width of the product range (product range; qD = −0.80; wR = 0.074);
  • Product quality (product range; qD = −0.33; wR = 0.080);
  • Socially responsible products (product range; qD = −0.10; wR = 0.054);
  • Price level (pricing; qD = −39.42; wR = 0.073);
  • Discounts (pricing; qD = −28.74; wR = 0.066);
  • Payment options (pricing; qD = −3.68; wR = 0.056);
  • Accessibility (location appeal; qD = −7.96; wR = 0.072);
  • Parking facilities (location appeal; qD = −8.30; wR = 0.067);
  • Opening hours (location appeal; qD = −10.50; wR = 0.075).
Edeka has no Cash cow brand attributes (lower right quadrant), which show a positive quality difference to the best competitor and a below average relevance (M = 0.053).
The following Poor dog brand attributes (lower left quadrant), which show a negative quality difference to the best competitor and a below average relevance (M = 0.053), should be given the lowest overall priority in brand positioning, and might be selected and developed into the extended brand identity (superordinated performance categories, quality difference to best competitor qD and weighted relevance wR in brackets):
  • Depth of the product range (product range; qD = −1.18; wR = 0.050);
  • Personnel (service; qD = −1.31; wR = 0.038);
  • Self-Service (service; qD = −23.12; wR = 0.052);
  • Complaint and replacement (service; qD = −2.04; wR = 0.037);
  • Order and delivery service (service; qD = −35.70; wR = 0.018);
  • Loyalty cards (pricing; qD = −11.42; wR = 0.035);
  • Product information (communication outside the store; qD = −2.54; wR = 0.035);
  • Company information (communication outside the store; qD = −2.24; wR = 0.033);
  • Dialogue (communication outside the store; qD = −3.79; wR = 0.020).
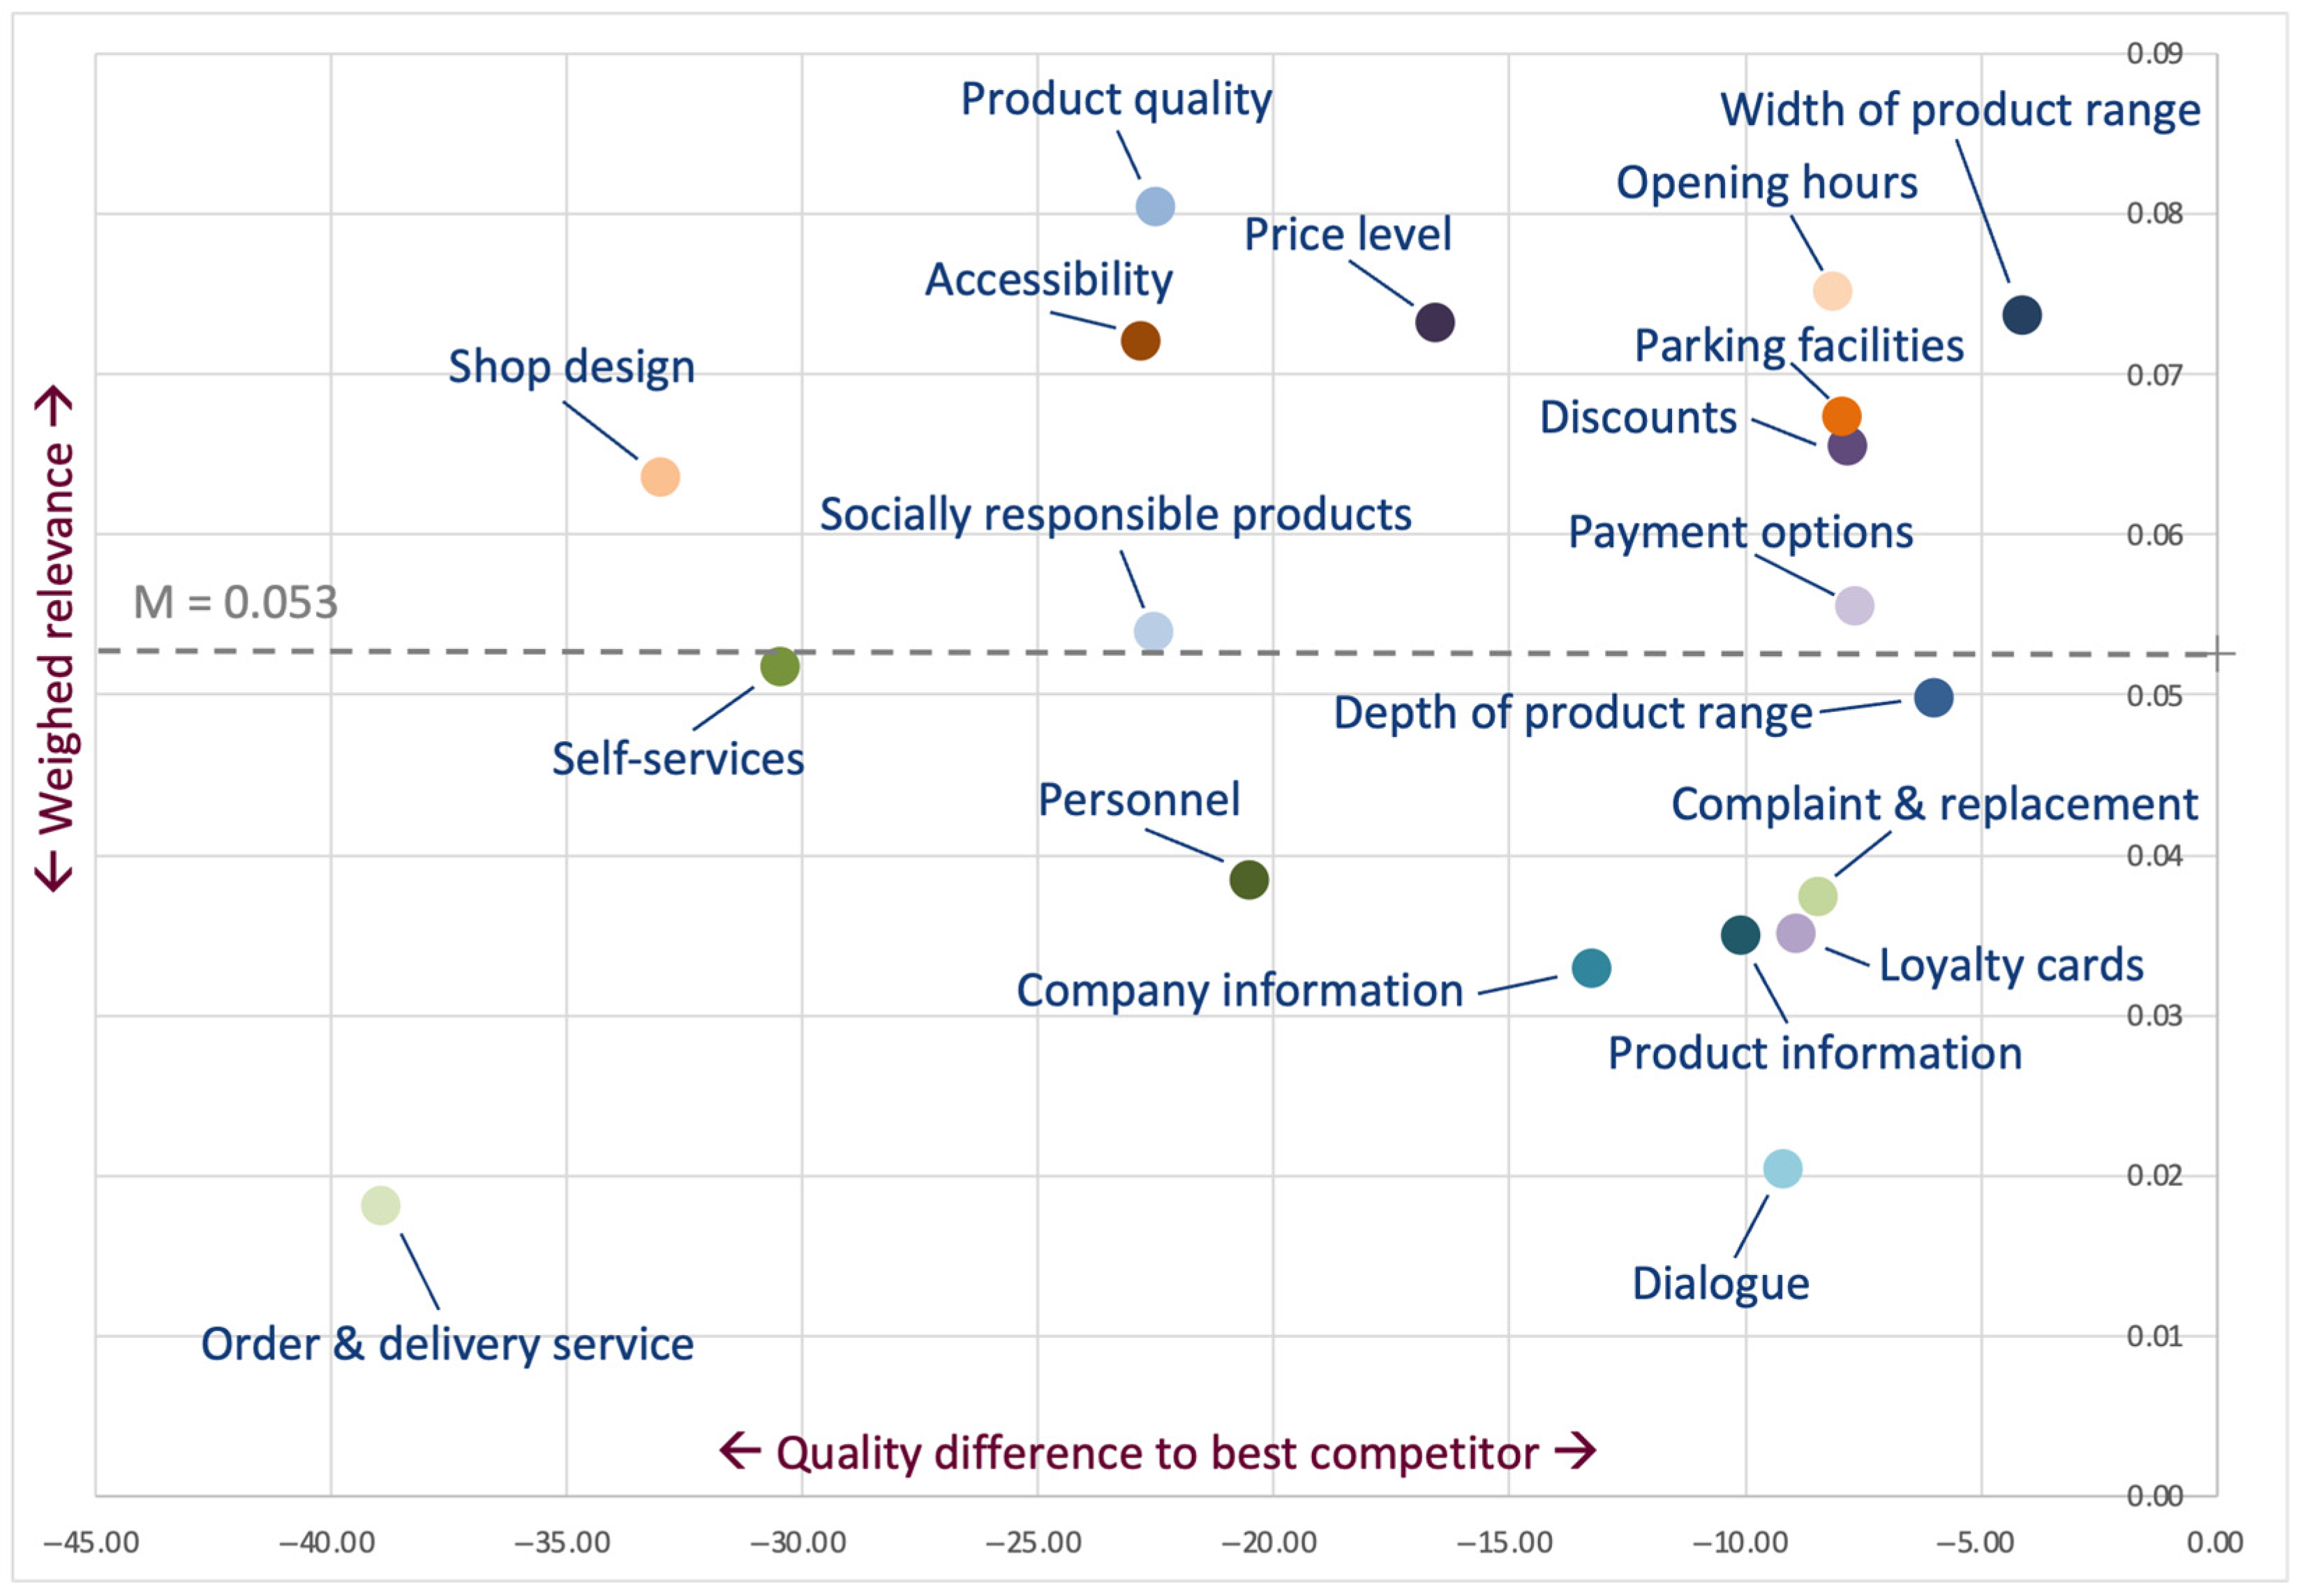
The matrix of quality difference to the best competitor and weighted relevance for Kaufland is represented in Figure 6. The following paragraphs describe the respective results.
Kaufland has no Star brand attributes (upper right quadrant), which show a positive quality difference to the best competitor and an above-average relevance (M = 0.053).
The following Question mark brand attributes (upper left quadrant), which show a negative quality difference to the best competitor and an above-average relevance (M = 0.053), should be given second overall priority in brand positioning (in this case first priority, as Kaufland has no Star brand attributes), and should be selected and developed into the core brand identity (superordinated performance categories, quality difference to best competitor qD and weighted relevance wR in brackets):
  • Width of the product range (product range; qD = −4.13; wR = 0.074);
  • Product quality (product range; qD = −22.50; wR = 0.080);
  • Socially responsible products (product range; qD = −22.57; wR = 0.054);
  • Price level (pricing; qD = −16.58; wR = 0.073);
  • Discounts (pricing; qD = −7.82; wR = 0.066);
  • Payment options (pricing; qD = −7.66; wR = 0.056);
  • Accessibility (location appeal; qD = −22.83; wR = 0.072);
  • Parking facilities (location appeal; qD = −7.95; wR = 0.067);
  • Shop design (location appeal; qD = −33.03; wR = 0.064);
  • Opening hours (location appeal; qD = −8.14; wR = 0.075).
Kauland has no Cash cow brand attributes (lower right quadrant), which show a positive quality difference to the best competitor and a below-average relevance (M = 0.053).
The following Poor dog brand attributes (lower left quadrant), which show a negative quality difference to the best competitor and a below-average relevance (M = 0.053), should be given the lowest overall priority in brand positioning, and might be selected and developed into the extended brand identity (superordinated performance categories, quality difference to best competitor qD and weighted relevance wR in brackets):
  • Depth of the product range (product range; qD = −6.01; wR = 0.050);
  • Personnel (service; qD = −20.51; wR = 0.038);
  • Self-Service (service; qD = −30.48; wR = 0.052);
  • Complaint and replacement (service; qD = −8.44; wR = 0.037);
  • Order and delivery service (service; qD = −38.94; wR = 0.018);
  • Loyalty cards (pricing; qD = −8.92; wR = 0.035);
  • Product information (communication outside the store; qD = −10.10; wR = 0.035);
  • Company information (communication outside the store; qD = −13.27; wR = 0.033);
  • Dialogue (communication outside the store; qD = −9.20; wR = 0.020).
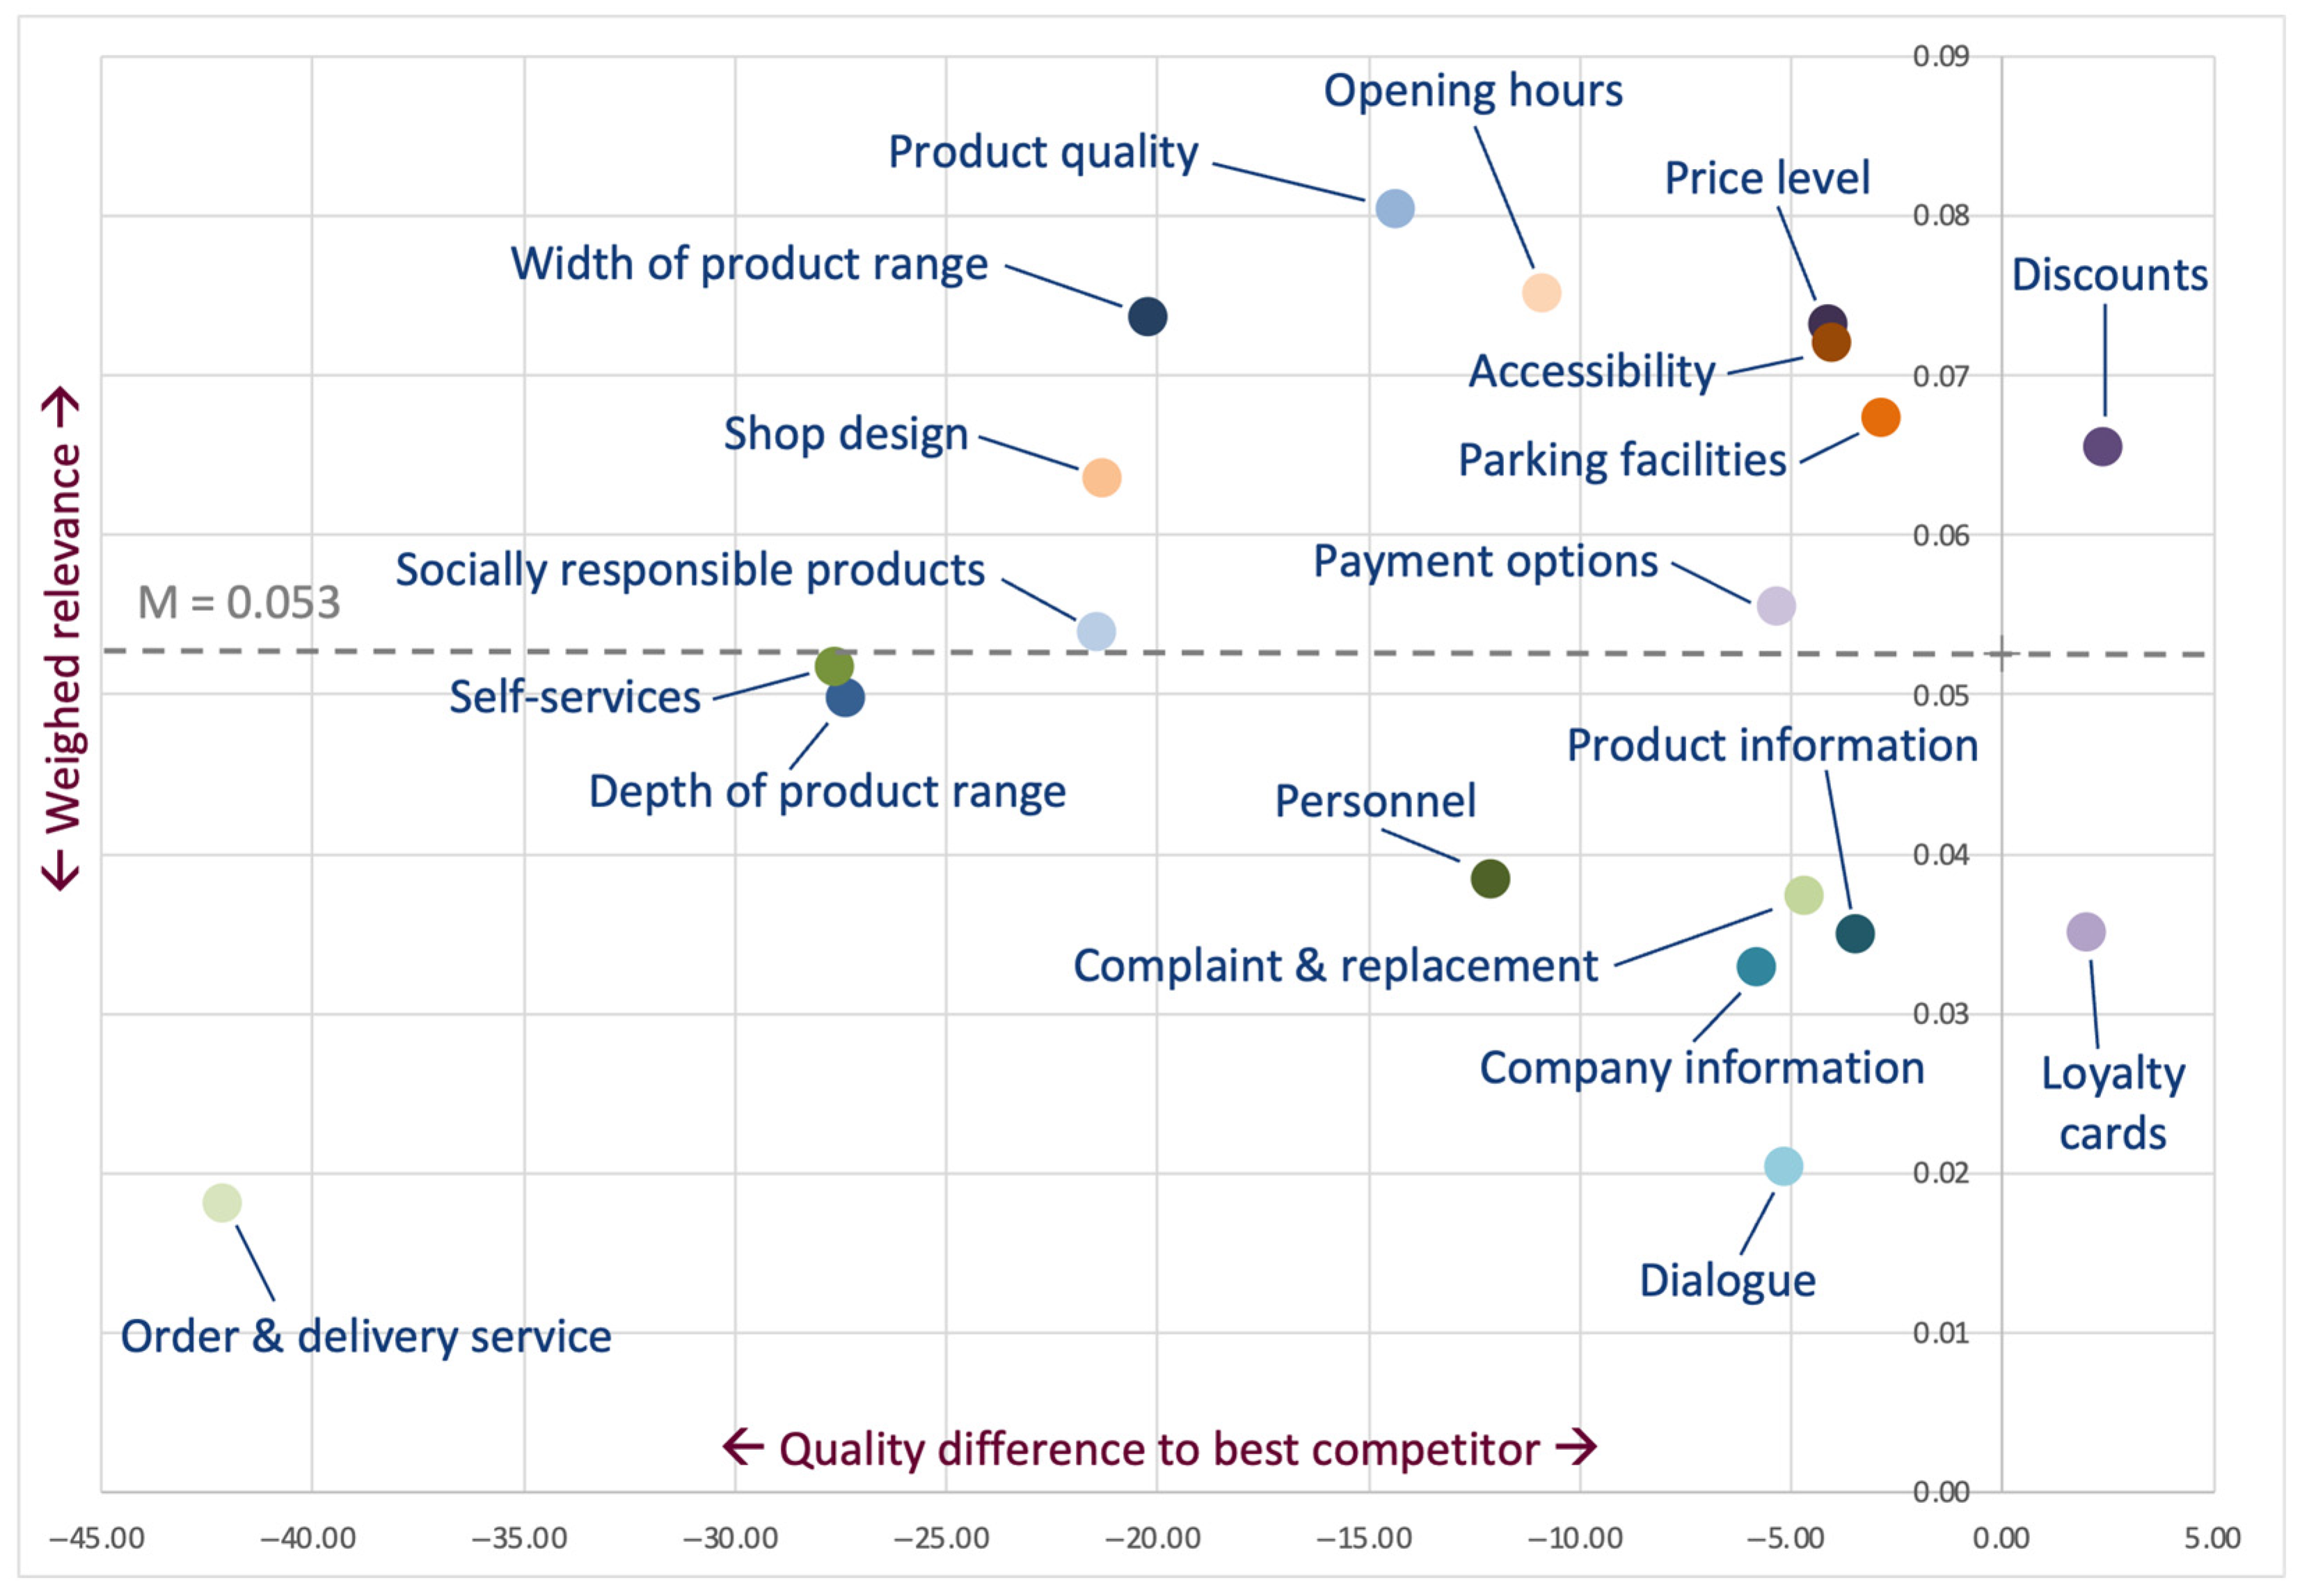
The matrix of quality difference to the best competitor and weighted relevance for Lidl is represented in Figure 7. The following paragraphs describe the respective results.
The following Star brand attribute (upper right quadrant), which shows a positive quality difference to the best competitor and an above-average relevance (M = 0.053), should be given first overall priority in brand positioning, and should be secured as the core brand identity (superordinated performance category, quality difference to best competitor qD and weighted relevance wR in brackets):
  • Discounts (pricing; qD = +2.38; wR = 0.066).
The following Question mark brand attributes (upper left quadrant), which show a negative quality difference to the best competitor and an above-average relevance (M = 0.053), should be given second overall priority in brand positioning, and should be selected and developed into the core brand identity (superordinated performance categories, quality difference to best competitor qD and weighted relevance wR in brackets):
  • Width of the product range (product range; qD = −20.24; wR = 0.074);
  • Product quality (product range; qD = −14.36; wR = 0.080);
  • Socially responsible products (product range; qD = −21.43; wR = 0.054);
  • Price level (pricing; qD = −4.14; wR = 0.073);
  • Payment options (pricing; qD = −5.36; wR = 0.056);
  • Accessibility (location appeal; qD = −4.07; wR = 0.072);
  • Parking facilities (location appeal; qD = −2.87; wR = 0.067);
  • Shop design (location appeal; qD = −21.33; wR = 0.064);
  • Opening hours (location appeal; qD = −10.92; wR = 0.075).
The following Cash cow brand attribute (lower right quadrant), which shows a positive quality difference to the best competitor and a below-average relevance (M = 0.053), should be given third overall priority in brand positioning, and should be secured as part of the extended brand identity (superordinated performance category, quality difference to best competitor qD and weighted relevance wR in brackets):
  • Loyalty cards (pricing; qD = +1.97; wR = 0.035).
The following Poor dog brand attributes (lower left quadrant), which show a negative quality difference to the best competitor and a below-average relevance (M = 0.053), should be given fourth overall priority in brand positioning, and might be selected and developed into the extended brand identity (superordinated performance categories, quality difference to best competitor qD and weighted relevance wR in brackets):
  • Depth of the product range (product range; qD = −27.39; wR = 0.050);
  • Personnel (service; qD = −12.10; wR = 0.038);
  • Self-Service (service; qD = −27.67; wR = 0.052);
  • Complaint and replacement (service; qD = −4.69; wR = 0.037);
  • Order and delivery service (service; qD = −42.13; wR = 0.018);
  • Product information (communication outside the store; qD = −3.49; wR = 0.035);
  • Company information (communication outside the store; qD = −5.83; wR = 0.033);
  • Dialogue (communication outside the store; qD = −5.17; wR = 0.020).
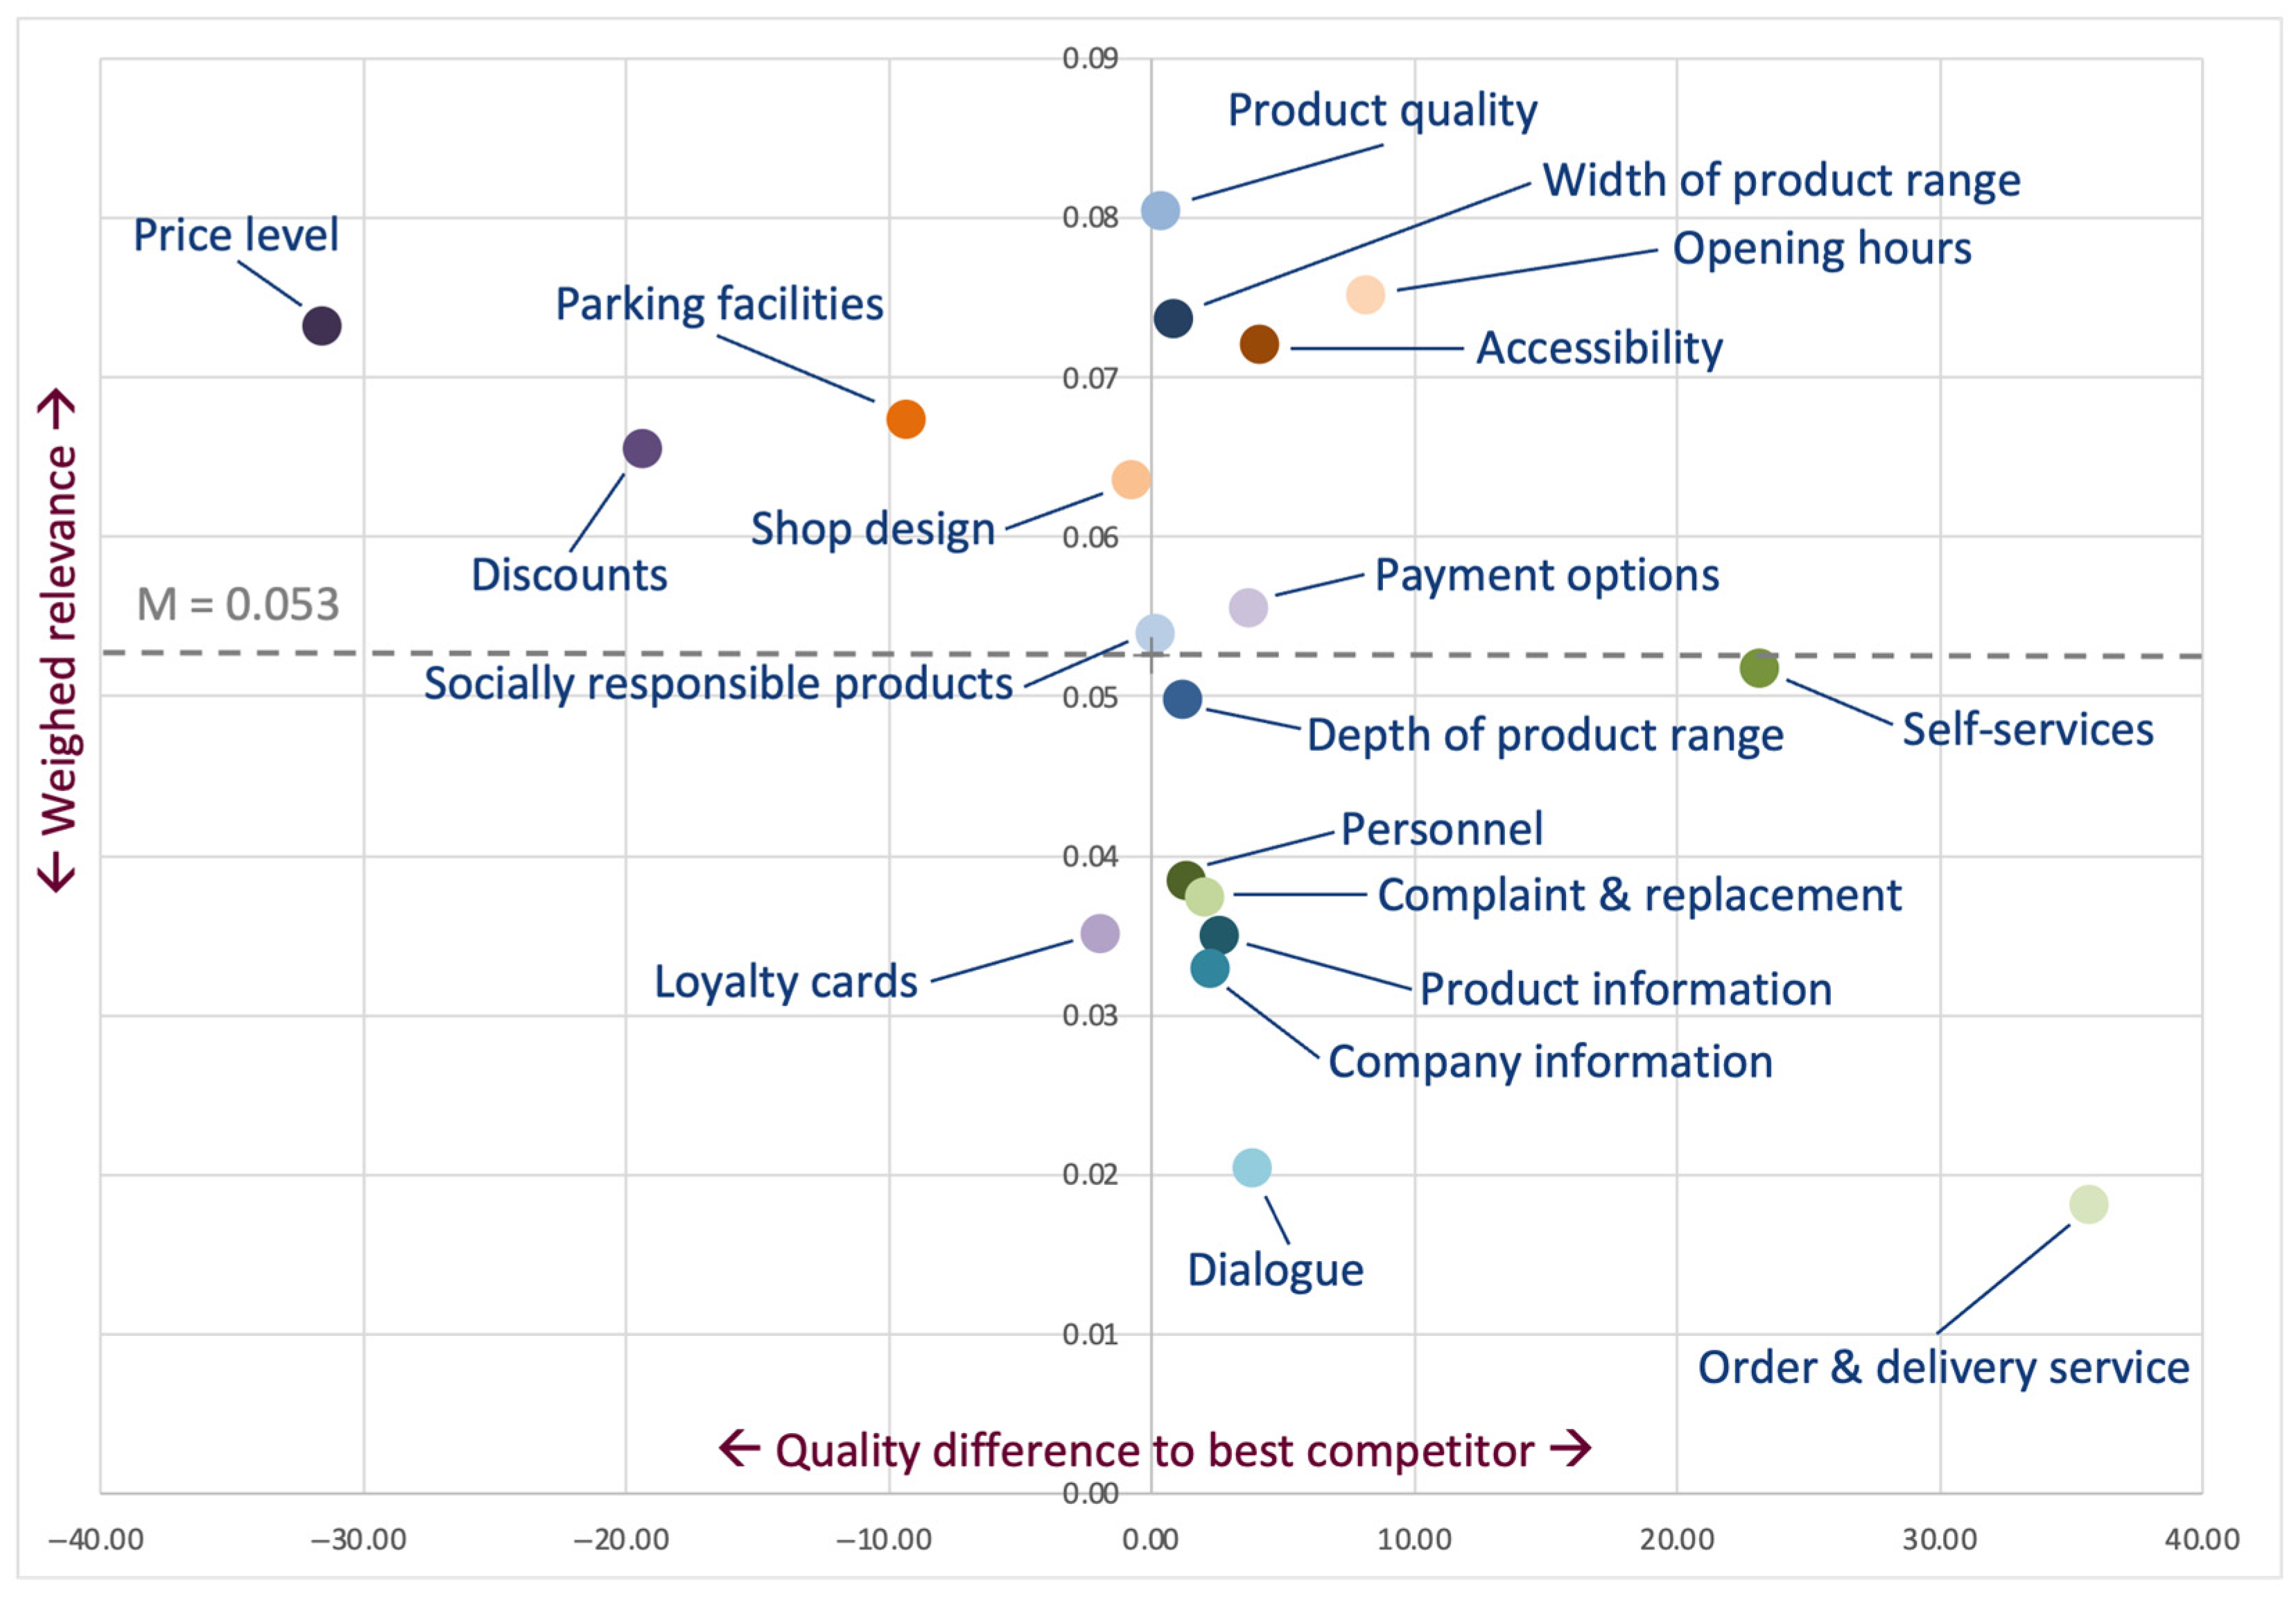
The matrix of quality difference to the best competitor and weighted relevance for Rewe is represented in Figure 8. The following paragraphs describe the respective results.
The following Star brand attributes (upper right quadrant), which show a positive quality difference to the best competitor and an above-average relevance (M = 0.053), should be given first overall priority in brand positioning, and should be secured as the core brand identity (superordinated performance categories, quality difference to best competitor qD and weighted relevance wR in brackets):
  • Width of the product range (product range; qD = +0.80; wR = 0.074);
  • Product quality (product range; qD = +0.33; wR = 0.080);
  • Socially responsible products (product range; qD = +0.10; wR = 0.054);
  • Payment options (pricing; qD = +3.68; wR = 0.056);
  • Accessibility (location appeal; qD = +4.07; wR = 0.072);
  • Opening hours (location appeal; qD = +8.14; wR = 0.075).
The following Question mark brand attributes (upper left quadrant), which show a negative quality difference to the best competitor and an above-average relevance (M = 0.053), should be given second overall priority in brand positioning, and should be selected and developed into the core brand identity (superordinated performance categories, quality difference to best competitor qD and weighted relevance wR in brackets):
  • Price level (pricing; qD = −31.60; wR = 0.073);
  • Discounts (pricing; qD = −19.40; wR = 0.066);
  • Parking facilities (location appeal; qD = −9.38; wR = 0.067);
  • Shop design (location appeal; qD = −0.75; wR = 0.064).
The following Cash cow brand attributes (lower right quadrant), which show a positive quality difference to the best competitor and a below-average relevance (M = 0.053), should be given third overall priority in brand positioning, and should be secured as part of the extended brand identity (superordinated performance categories, quality difference to best competitor qD and weighted relevance wR in brackets):
  • Depth of the product range (product range; qD = +1.18; wR = 0.050);
  • Personnel (service; qD = +1.31; wR = 0.038);
  • Self-Service (service; qD = +23.12; wR = 0.052);
  • Complaint and replacement (service; qD = +2.04; wR = 0.037);
  • Order and delivery service (service; qD = +35.70; wR = 0.018);
  • Product information (communication outside the store; qD = +2.54; wR = 0.035);
  • Company information (communication outside the store; qD = +2.24; wR = 0.033);
  • Dialogue (communication outside the store; qD = +3.79; wR = 0.020).
The following Poor dog brand attribute (lower left quadrant), which shows a negative quality difference to the best competitor and a below-average relevance (M = 0.053), should be given fourth overall priority in brand positioning, and might be selected and developed into the extended brand identity (superordinated performance category, quality difference to best competitor qD and weighted relevance wR in brackets):
  • Loyalty cards (pricing; qD = −1.97; wR = 0.035).
To test the robustness of the method for integrated brand analysis and strategy on the brand attribute level, the results reported above are compared with the respective results when utilising the median of the weighted relevance instead of the arithmetic mean for dividing the quadrants of the matrix. The median of the weighted relevance is 0.0539, compared to the arithmetic mean of 0.0526. Because of the small difference between the median and the arithmetic mean, the resulting strategic decision guidelines do not differ between the two analyses.

4.2. Market Performance Analysis and Strategic Decision Guidelines for Market Cultivation

The data collection and the sample for analysing the market performance of food retail brands are the same as described in Section 4.1.2, as the data for both were collected in one survey.
The measurement, applied in this survey, followed the respective description in Section 3.2. Accordingly, the brand awareness, general relevant set, immediate relevant set, and loyalty intentions were measured. Brand awareness was measured with the following question: Which of the following food retailers do you know, even if only by name (German: Welche der folgenden Lebensmitteleinzelhändler kennen Sie, wenn auch nur dem Namen nach)? General relevant set was measured with the following question: Which of the following food retailers do you consider good so that you would buy from them at some stage of your life (German: Welche der folgenden Lebensmitteleinzelhändler erachten Sie als gut, so dass bei diesen Lebensmitteleinzelhändlern zu irgendeinem Zeitpunkt in Ihrem Leben einkaufen würden)? Immediate relevant set was measured with the following question: Which of the following food retailers would you consider if you had to make a purchase right now (German: Welche der folgenden Lebensmitteleinzelhändler würden Sie in Betracht ziehen, wenn Sie jetzt einen Kauf tätigen müssten)? Loyalty intentions were measured with the following question: From which of the following food retailers would you buy from most often in the future (German: Bei welchem der folgenden Lebensmitteleinzelhändler würden Sie in der Zukunft am häufigsten einkaufen)?
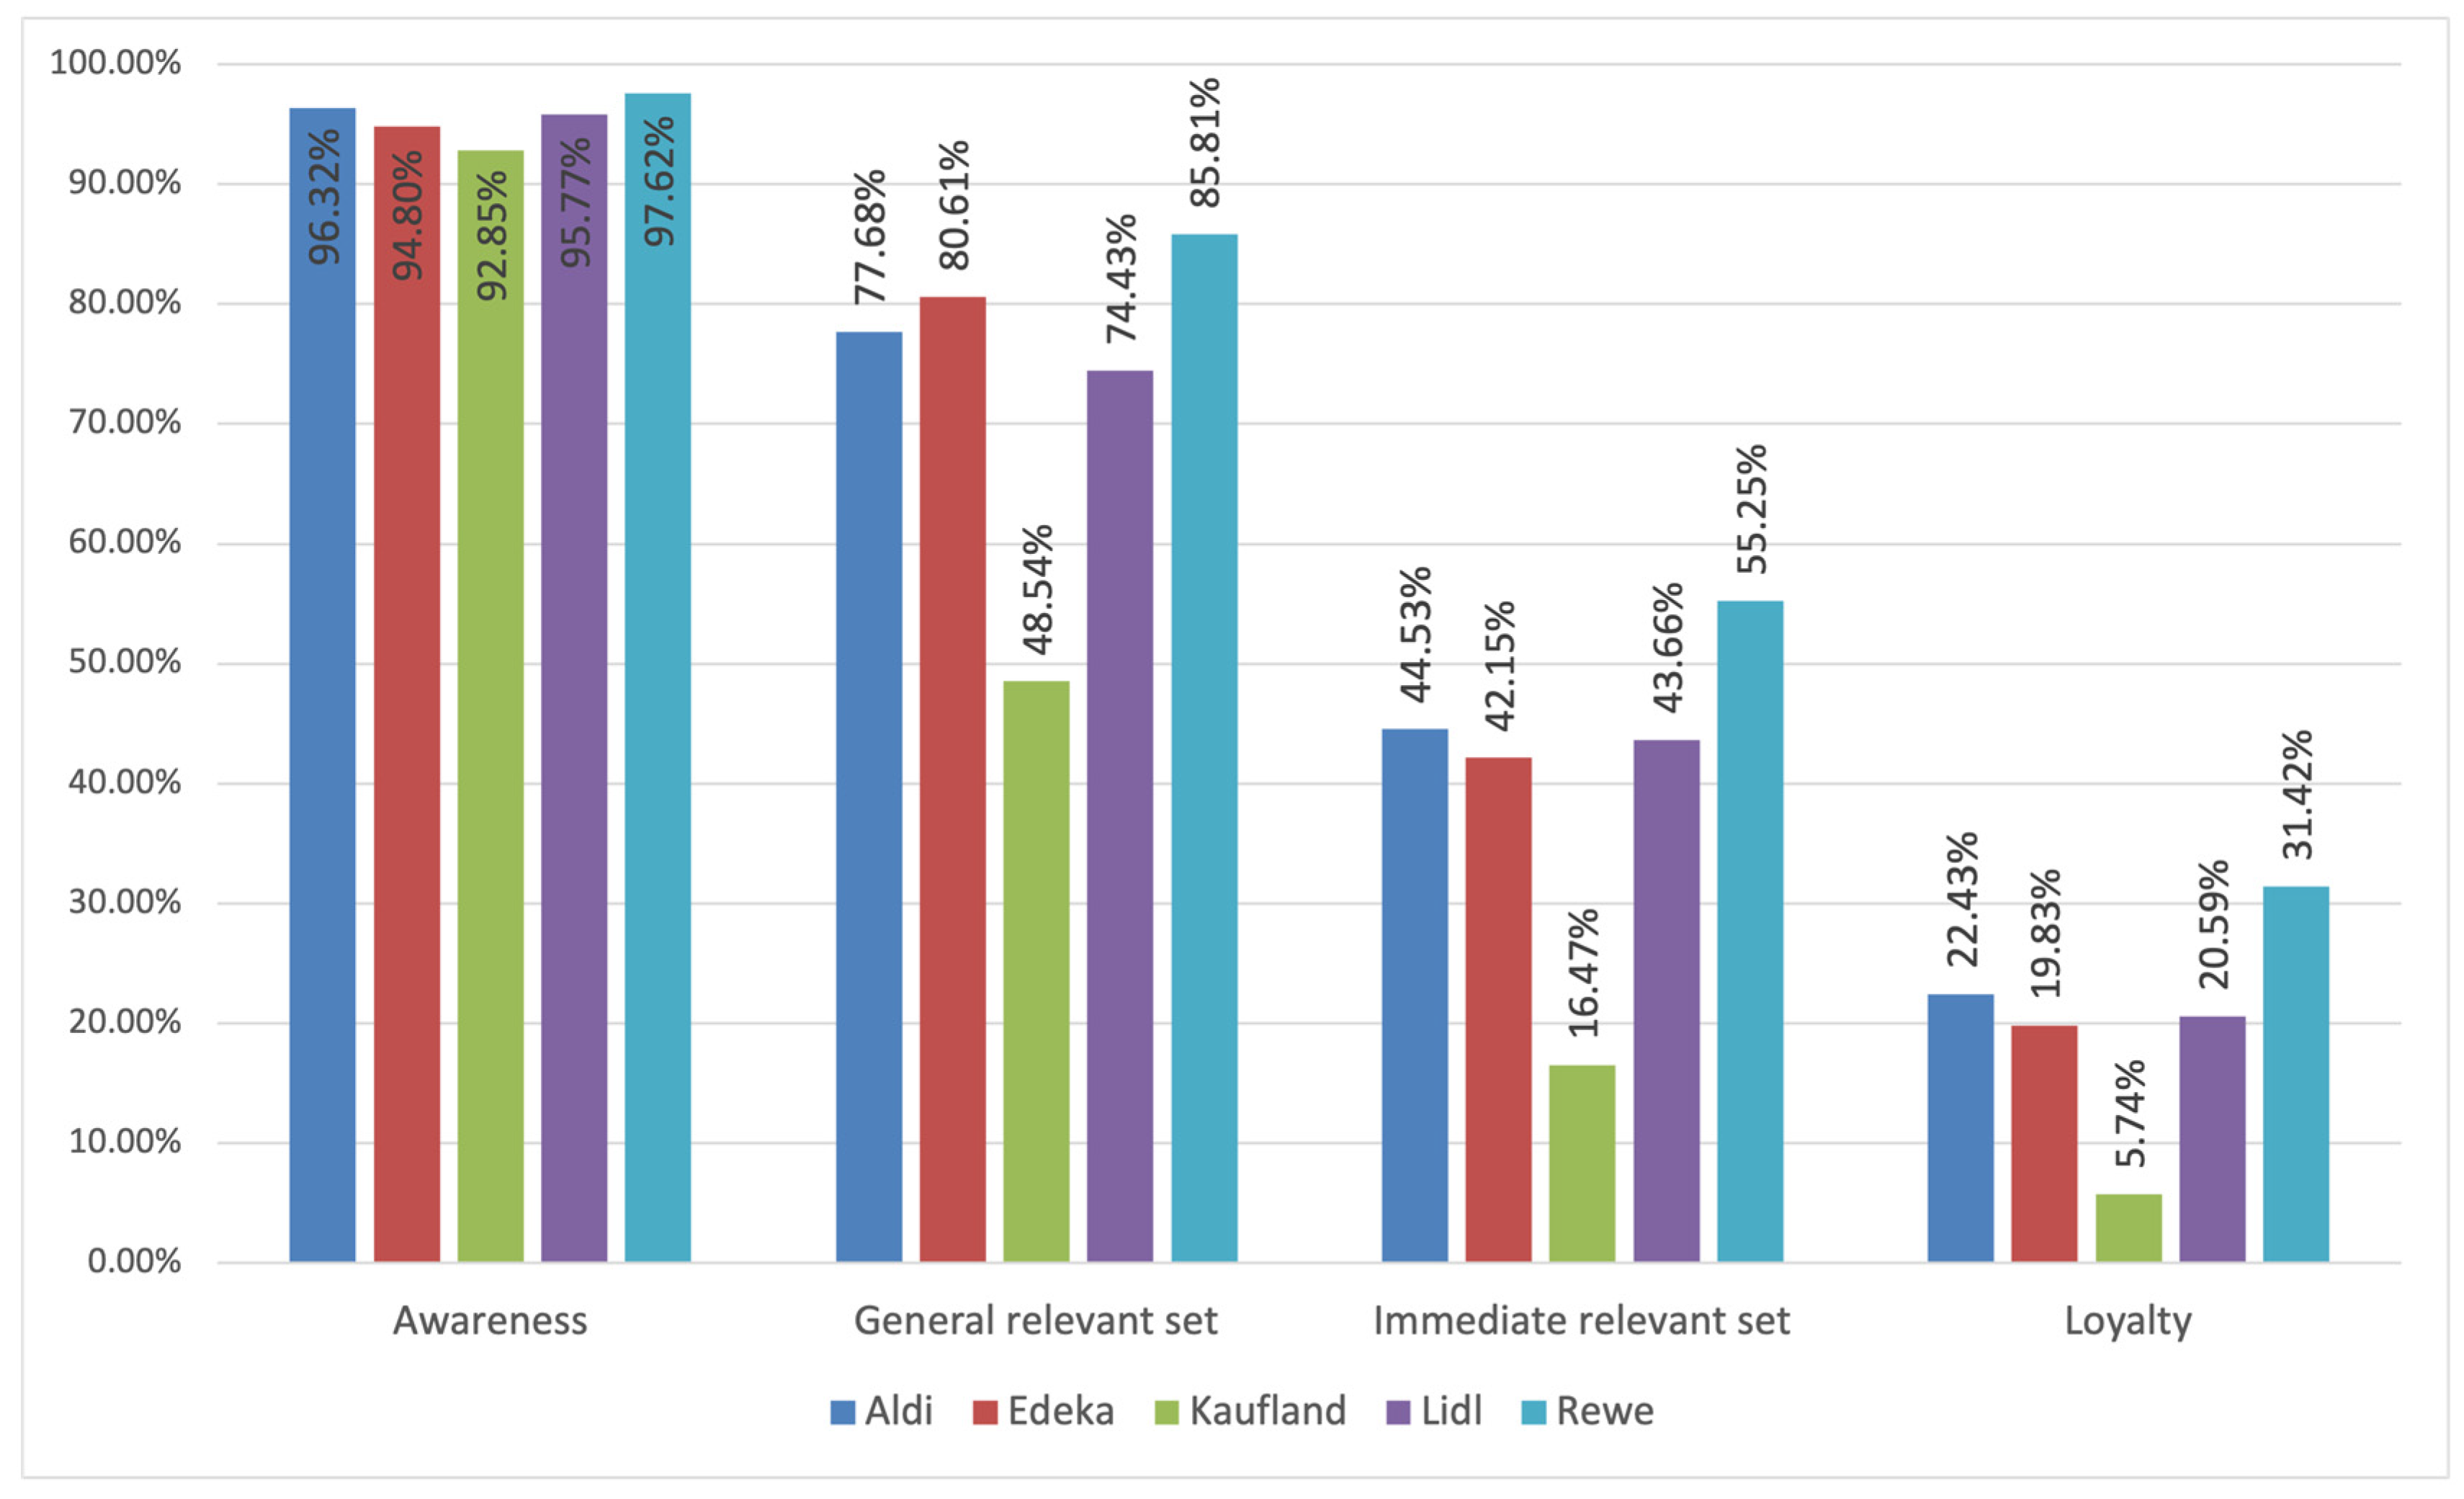
To analyse the afore-described data, the frequency distributions of and the conversion between the steps of the buying process were calculated, as described in Section 3.2. The frequency distributions of the steps of the buying process in relation to the sample are represented in Figure 9.
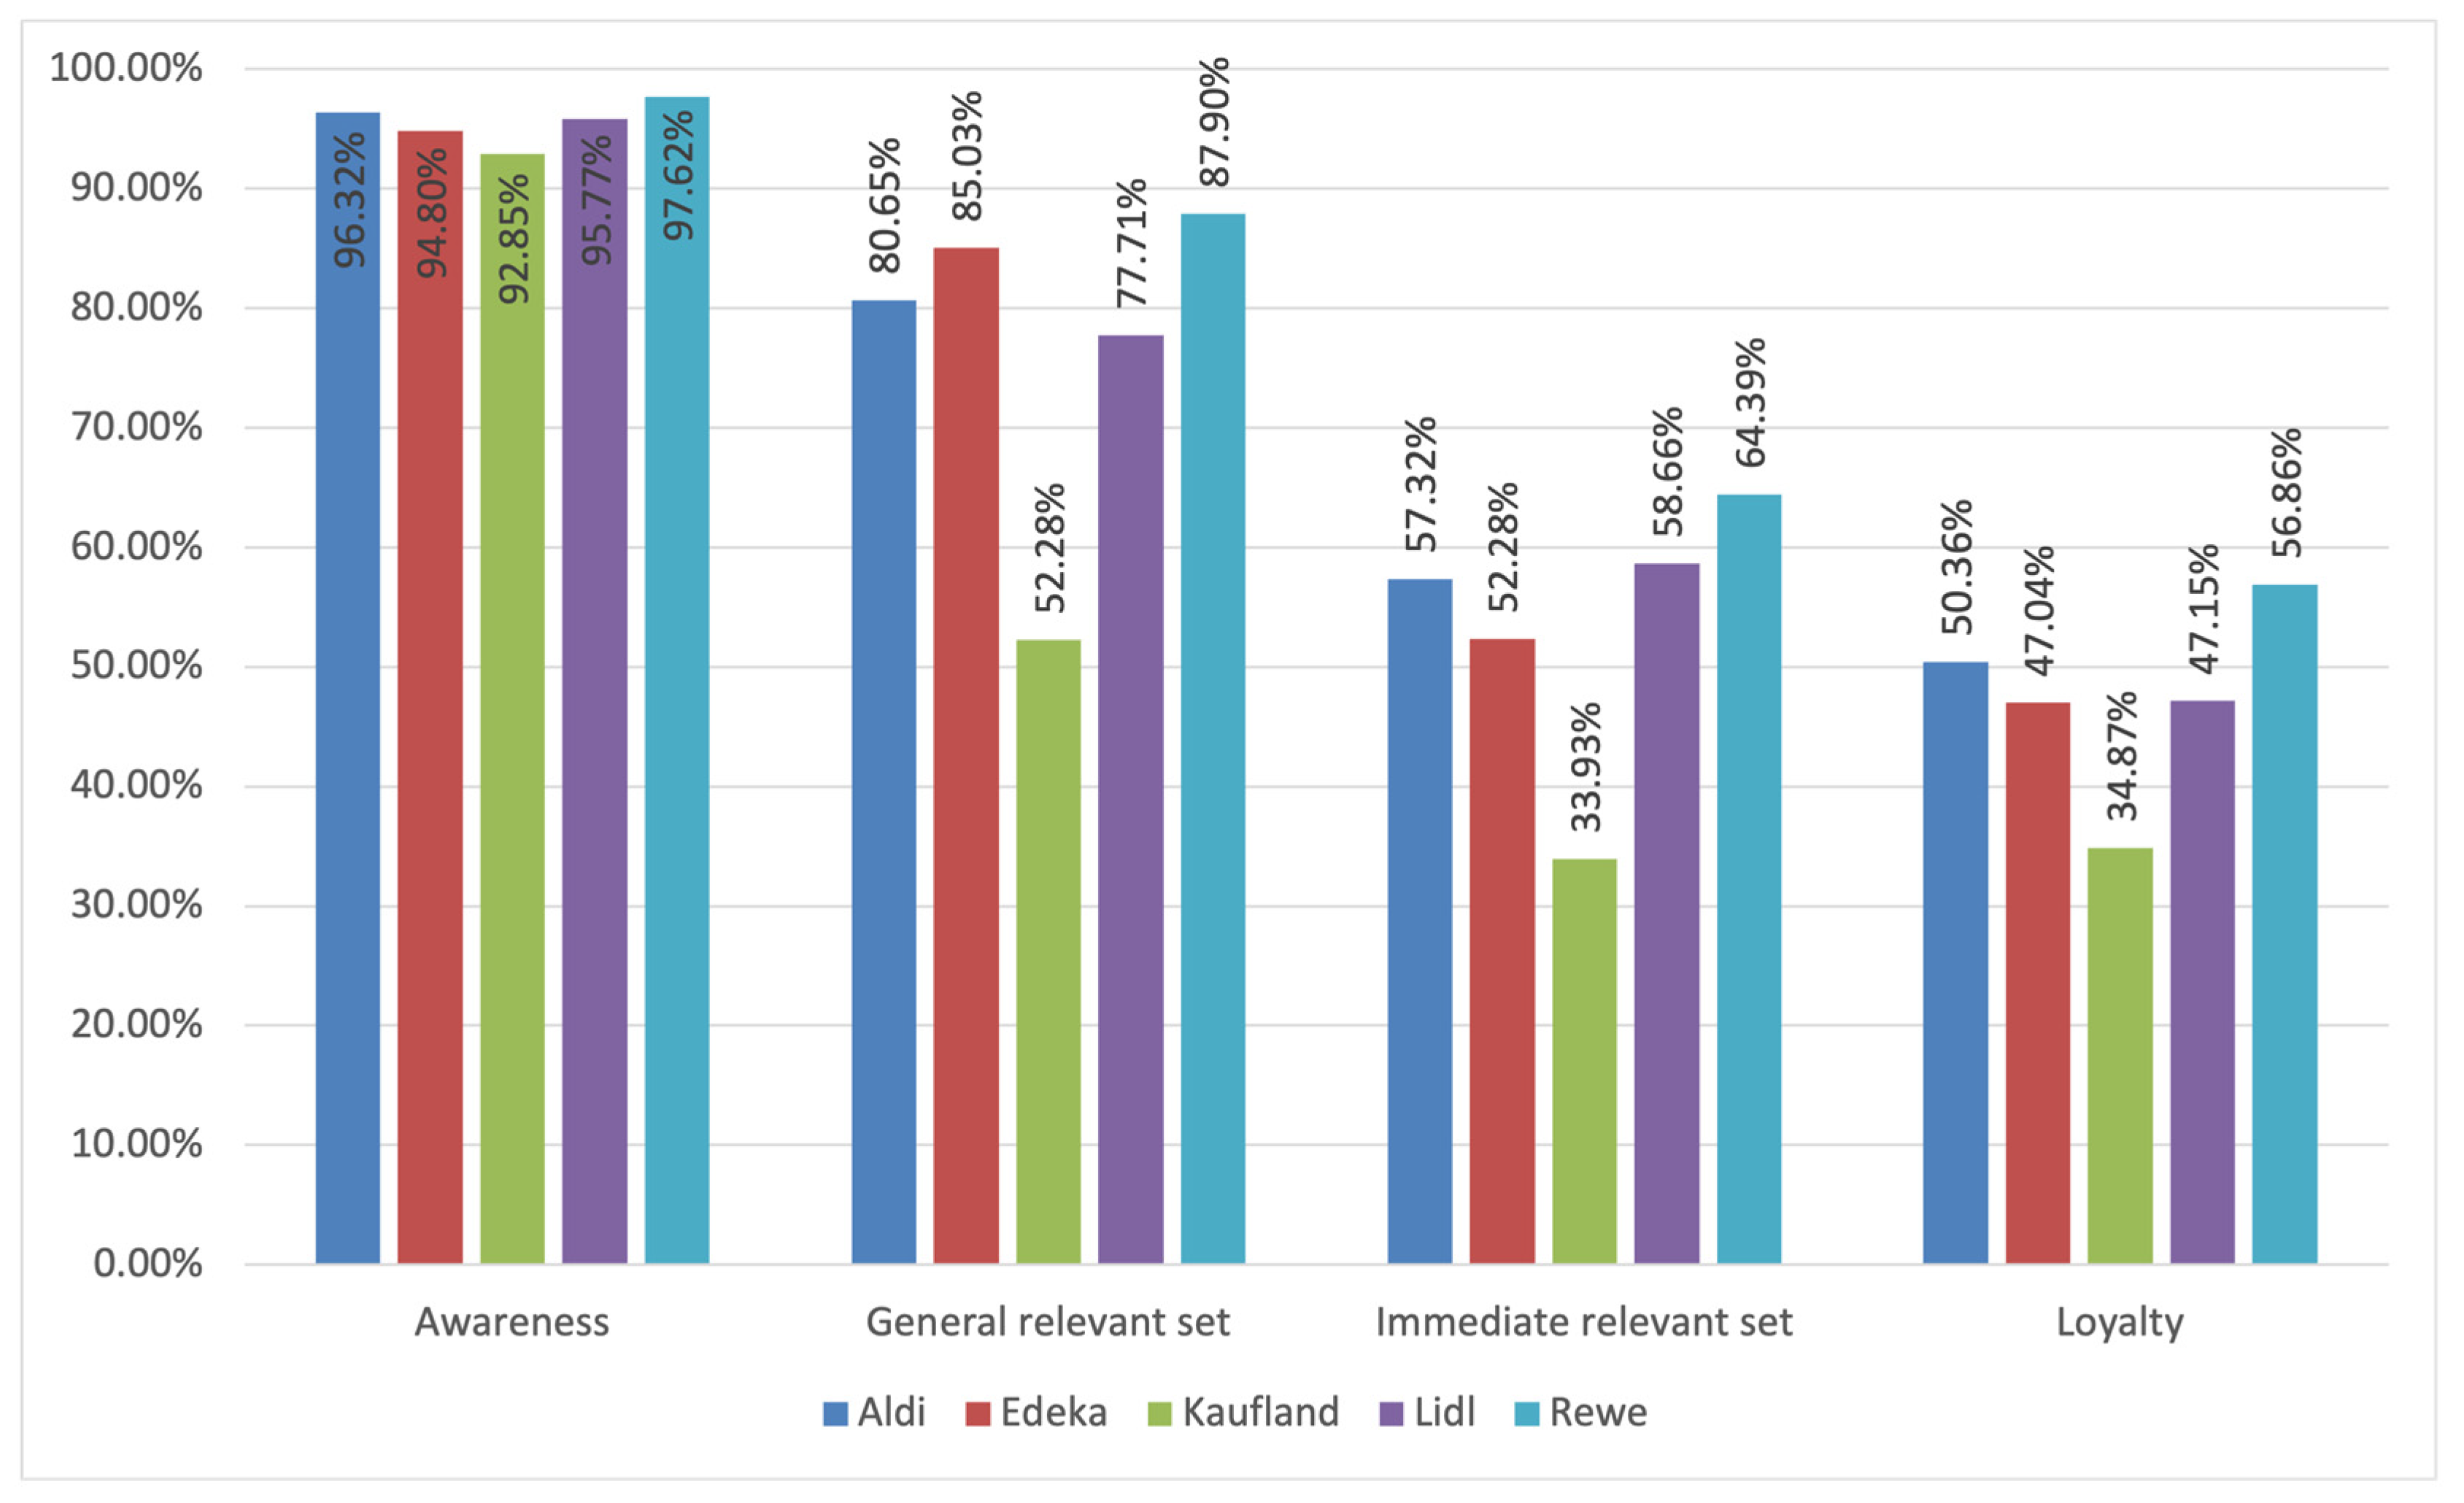
The conversions from one step of the buying process to the next are represented in Figure 10. As described in Section 3.2, strategic decision guidelines for market cultivation can be derived from these conversions: A relatively low conversion to brand awareness indicates an awareness strategy, a relatively low conversion to general relevant set indicates an image strategy, a relatively low conversion to immediate relevant set indicates a sales strategy and a relatively low conversion to loyalty intentions indicates a loyalty strategy.
Under the assumption that the sample would represent the target group of the brands, the market awareness of all brands is on a high level, with a lowest value of 92.85% for Kaufland, which indicates that a market strategy with a strong emphasis on brand awareness is not required for any of the food retail brands. More substantial differences can, however, be found in the other steps of the buying process. Here, Rewe shows the best conversions over all steps of the buying process and should, therefore, serve as a benchmark for the other food retail brands.
Aldi shows relative gaps to Rewe in its conversions on a comparable level. Thus, Aldi should place an equal emphasis on image, sales, and loyalty strategies.
Edeka’s relative gaps to Rewe are larger for the conversions to immediate relevant set and loyalty intentions than for the conversion to general relevant set. Thus, Edeka should primarily focus on sales and loyalty strategies and secondarily focus on image strategies.
Compared with the other brands, Kaufland shows the largest gaps to Rewe in all conversions and substantially lags behind its competitors. Thus, Kaufland is advised to build the foundations in the market along the sequential steps of the buying process. This means Kaufland should place the strongest strategy emphasis on image, followed by sales and loyalty.
Lidl shows relative gaps to Rewe in its conversions on a comparable level. Thus, Lidl should place an equal emphasis on image, sales, and loyalty strategies.
Rewe shows the highest conversions on all steps of the buying process, as mentioned above. Thus, Rewe should place an equal emphasis on image, sales, and loyalty strategies to secure its leading market position.

5. Application of the Method for Integrated Brand Analysis and Strategy 2: Chocolate Brands

As in Section 4, Section 5 aims to show the applicability of the developed method for integrated brand analysis and strategy. In Section 5, the method is applied to chocolate brands in the German market. Section 5.1 shows the analysis of the images of chocolate brands and the resulting strategic decision guidelines for brand positioning. In Section 5.2, the market performance of these brands is analysed, and the resulting strategic decision guidelines for market cultivation are deduced.

5.1. Brand Image Analysis and Brand Positioning

In the following sub-sections, the attributes of chocolate brands are developed from a qualitative pre-study, the method of the quantitative brand analysis is described, and the images of chocolate brands are analysed for the overall brands and the brand attributes, including the deduction of strategic decision guidelines for positioning.

5.1.1. Determining Brand Attributes Based on Primary Data in an Outside-In Approach

The data for the qualitative analysis to determine the brand attributes of chocolate brands in an outside-in approach were collected through an online questionnaire between 10 July and 17 August 2025. The participants were students of business psychology at a university with study centres throughout Germany. The participants are part-time students who also have regular jobs. The sample consists of 509 participants, of which 73.87% are female and 26.13% male. The youngest participant is 18 years old, whilst the oldest participant has an age of 58 years. The average age of the sample is 26.58 years (SD = 5.72). The frequency of the sample’s chocolate consumption is represented in Table 2. As the participants work in regular jobs and study on the side, the sample does not consist of “typical” students but rather represents “normal” consumers. However, the sample’s characteristics, i.e., relatively young age, early stage of the career, etc., mean that the sample does not represent the German population or the target groups of the analysed brands.
As described in Section 3.1.1, the main section of the questionnaire consisted of four open questions to determine the context of consuming chocolate, the motives for this consumption, the associations with the contexts of consumption, and the associations with chocolate.
The contexts of consuming chocolate were determined through the following question: One can consume chocolate in different situations. Please list in keywords in which situations you consume chocolate (German: Man kann Schokolade in verschiedenen Situationen konsumieren. Geben Sie bitte in Stichworten an, in welchen Situationen Sie Schokolade konsumieren).
The motives for consuming chocolate were determined through the following question: You have listed situations in which you consume chocolate. Please list in keywords to what end or purpose you consume chocolate in these situations (German: Sie haben Situationen angegeben, in denen Sie Schokolade konsumieren. Geben Sie bitte in Stichworten an, mit welchen Zielen oder zu welchem Zweck Sie Schokolade in diesen Situationen konsumieren).
The associations with the consumption contexts were determined through the following question: You have listed situations in which you consume chocolate. Please list in keywords which emotions and thoughts you associate with these situations (German: Sie haben Situationen angegeben, in denen Sie Schokolade konsumieren. Geben Sie bitte in Stichworten an, welche Gefühle und Gedanken Sie mit diesen Situationen verbinden).
The associations with chocolate were determined through the following question: Now, we would like to ask you which emotions and thoughts you associate with chocolate. Please list in keywords the emotions and thoughts you associate with chocolate (German: Nun geht es um Gefühle und Gedanken, die Sie mit Schokolade verbinden. Bitte geben Sie in Stichworten an, welche Gefühle und Gedanken Sie mit Schokolade verbinden).
As described in Section 3.1.1, the data were analysed in three phases. In the first phase, the answers were categorised for all of the four questions, which can be considered the main phase of the analysis. Categorising the answers was based on the principles of the Guideline for Qualitative Analysis and Model Development by Godbersen (2023), which shows similarities to the Structuring Qualitative Content Analysis by Kuckartz and Radiker (2023) and also draws from the Grounded Theory Methodology by Strauss and Corbin (1998). After a general familiarisation with the data, the answers were inductively coded, i.e., codes were developed from the answers. These codes were regularly re-evaluated with regard to their distinctiveness during the coding process. Furthermore, it was regularly evaluated if and how the codes can be categorised on a more abstract level. These two steps resemble open coding within the Grounded Theory Methodology (Strauss & Corbin, 1998). Additionally, a rather deductive perspective was taken, and it was assessed if the more abstract categories incorporate the more specific codes, which resembles axial coding within the Grounded Theory Methodology (Strauss & Corbin, 1998). Finally, the codes and categories between the four questions were compared and assessed with regard to their consistency, which roughly resembles selective coding of the Grounded Theory Methodology (Strauss & Corbin, 1998). In the second phase, the frequencies of the occurrence of mentions were established, following the approach of quantitative content analysis. In the third phase, possible attributes for chocolate brands were selected based on their frequencies.
The results for the context of consuming chocolate are represented in Table 3. In total, 16 situations in which chocolate is consumed could be identified. These situations can be subordinated to five major categories: Positive contexts, such as leisure activities or media consumption; social contexts, such as family events or special occasions; escape- and motivation-related contexts, such as breaks or self-rewarding situations; negative contexts, such as boredom or stressful situations; and chocolate-related contexts with a hankering or craving for chocolate.
The results for the motives to consume chocolate are represented in Table 4. In total, 14 motives for consuming chocolate could be identified. These motives can be subordinated to four major categories: mood-related motives, such as being happy or feeling comfortable and content; social motives, in the sense of sharing good times with others; escape- and motivation-related motives, such as boosting motivation and energy or distracting from the current situation; and chocolate-related motives, such as availability of chocolate or giving into cravings.
The results for the associations with the contexts of consumption and chocolate itself are represented in Table 5. In total, ten positive and seven negative associations could be identified. The positive associations can be subordinated to three major categories, which roughly resemble the major categories of chocolate consumption motives: mood-related associations, such as comfort and contentment or joy and fun; social associations, such as conviviality, family, and friends; escape- and motivation-related associations, such as break from daily life or reward.
On the basis of the associations with the context of consuming chocolate and chocolate itself, 12 brand attributes, which can be structured by three categories, are derived (German items of the subsequent quantitative study in brackets):
(1) Mood-related brand attributes
  • Comfort and contentment (Zufriedenheit und Behaglichkeit);
  • Enjoyment and deliciousness (Genuss und guter Geschmack);
  • Joy and fun (Freude und Spaß);
  • Happiness (Glück).
(2) Social brand attributes
  • Conviviality (Geselligkeit);
  • Friends (Freunde);
  • Family (Familie);
  • Special occasions and festivities (Besondere Anlässe und Feiern).
(3) Escape- and motivation-related brand attributes
  • Relaxation and serenity (Entspannung und Gelassenheit);
  • Break from daily life (Pause vom Alltag);
  • Motivation and energy boost (Motivations- und Energieschub);
  • Reward (Belohnung).

5.1.2. Methods of Quantitative Brand Analysis

The data for the quantitative analysis of chocolate brands were collected through an online questionnaire between 01 September and 31 October 2025. The participants were students of business psychology at a university with study centres throughout Germany. The participants are part-time students who also have regular jobs. The sample consists of 907 participants, of which 72.88% are female, 26.90% male, and 0.22% non-binary. The youngest participant is 18 years old, whilst the oldest participant has an age of 58 years. The average age of the sample is 25.74 years (SD = 4.89). The frequency of the sample’s chocolate consumption is represented in Table 6. As the participants work in regular jobs and study on the side, the sample does not consist of “typical” students but rather represents “normal” consumers. However, the sample’s characteristics, i.e., relatively young age, early stage of the career, etc., mean that the sample does not represent the German population or the target group of the analysed brands.
Five chocolate brands, which are well known in Germany, were selected for analysing the current brand images and market performances:
  • Kinder with the current slogan “a little, a lot” for the German market (Kinder, 2025);
  • Lindt with the current slogan “Swiss Maitre Chocolatier” (German: “Schweizer Maitre Chocolatier”) for the German market (Lindt, 2025);
  • Merci with the current slogan “A thank you that comes from the heart” (German: “Danke, das vom Herzen kommt”) for the German market (Merci, 2025);
  • Milka with the vision “Makes life more tender” (German: “Macht das Leben zarter”) for the German market (Milka, 2025);
  • Ritter Sport with the slogan “Squared. Practical. Good.” (German: “Quadratisch. Praktisch. Gut”) for the German market (Ritter, 2025).
The five chocolate brands were evaluated by the participants on the brand attributes that were developed in Section 5.1.1.
As described in Section 3.1.2, the relevance of the brand attributes and the strengths of their association with each brand were measured on continuous rating scales from 0 to 100.
The relevance was measured through the following question: When consuming chocolate, different aspects can be important. Please indicate on a scale from 0 “not important” to 100 “very important”, how important the following aspects are for you personally, when you consume chocolate (German: Wenn man Schokolade konsumiert, können einem verschiedene Aspekte wichtig sein. Bitte geben Sie im Folgenden auf einer Skala von 0 “nicht wichtig” bis 100 “sehr wichtig” an, wie wichtig Ihnen persönlich die folgenden Aspekte sind, wenn Sie Schokolade konsumieren.).
The strength of association of an attribute with a brand was measured through the following question: In this section, you should indicate how strongly you personally associate different aspects with chocolate brands. Please give your answers on scales from 0 “not at all” to 100 “very strong”. Please indicate now how strongly you personally associate the following aspects with <brand> (German: In diesem Abschnitt sollen Sie beurteilen, wie stark Sie persönlich die verschiedenen Aspekte beim Schokoladenkonsum mit einzelnen Schokoladenmarken verbinden. Bitte geben Sie Ihre Antwort jeweils auf einer Skala von 0 “überhaupt nicht” bis 100 “sehr stark”. Bitte geben Sie nun an, wie stark Sie persönlich die folgenden Aspekte mit <brand> verbinden.).
The analysis was conducted with R (R Development Core Team, 2017) and follows the process described in Section 3.1.2. After calculating the arithmetic means for the relevance and perceived quality, the weighted relevance of each brand attribute (relevance of brand attribute divided by the sum of relevance scores for all brand attributes), the overall evaluation of each brand (sum of the multiplications of weighted relevance and brand attribute evaluation), the number of attributes with the best evaluation for each brand, and the evaluation difference to the best competitor for each attribute and brand were determined. On this basis, the matrices for analysing the overall brand image and deriving strategic decision guidelines for overall brand positioning, and for analysing the brand attributes and deriving strategic decision guidelines for creating differentiated brand identities were deduced.
Additionally, the adequacy of the measurement model, which should be understood as a formative measurement, was tested through variance inflation factors for the relevance ratings. All variance inflation factors are lower than 3.87 (highest variance inflation factor = 3.86 for the brand attribute family) and indicate an appropriate adequacy of the measurement model (all variance inflation factors are reported in Appendix A).

5.1.3. Brand Analysis and Strategic Decision Guidelines for Positioning on Brand Level

The basis for the analysis of the brand image is the relevance of the brand attributes and their perceived association with the examined brands, as described in Section 3.1.2 and Section 5.1.2. The arithmetic means and standard deviations of these constructs for chocolate brands are represented in Table 7.
On the basis of the relevance and perceived quality of the brand attributes, the number of brand attributes with the best evaluation and the overall evaluation of the brands, i.e., the sum of the multiplications of weighted relevance and perceived quality, are calculated. Figure 11 represents the resulting matrix. This matrix can be divided into four quadrants by the arithmetic means of the respective dimensions, as described in Section 3.1.2.
Kinder (number of attributes with best evaluation N = 6; overall evaluation tQ = 62.98) is positioned in the upper right quadrant, which means the brand is evaluated best on an above-average number of brand attributes (M = 2.40) and shows an above-average overall evaluation (M = 57.04). Thus, the brand is considered a Star and the resulting strategic decision guidelines should focus on securing the brand based on the existing brand image.
Lindt (N = 2; tQ = 60.51) and Milka (N = 1; tQ = 59.21) are positioned in the upper left quadrant, which means the brands are evaluated best on a below-average number of brand attributes (M = 2.40) and show above-average overall evaluations (M = 57.04). Thus, the brands are considered Question marks, and the resulting strategic decision guidelines should focus on developing the brands based on the existing brand images.
Merci (N = 3; tQ = 49.59) is positioned in the lower right quadrant, which means the brand is evaluated best on an above-average number of brand attributes (M = 2.40) and shows a below-average overall evaluation (M = 57.04). Thus, the brand is considered a Cash cow, and the resulting strategic decision guidelines should focus on developing (pivoting) to a new brand identity and image, whilst securing the strength of the existing brand image.
Ritter (N = 0; tQ = 52.90) is positioned in the lower left quadrant, which means the brand is evaluated best on a below-average number of brand attributes (M = 2.40) and shows a below-average overall evaluation (M = 57.04). Thus, the brand is considered a Poor dog, and the resulting strategic decision guidelines should focus on developing a new brand identity and image.
As in Section 4.1.3 with regard to food retail brands, an important caveat has to be highlighted. The afore-reported analysis and deduction of strategic decision guidelines are only valid for the participants of this survey, who do not necessarily represent the target group of the examined brands.
Comparing the results and respective strategic decision guidelines when utilising the median for dividing the quadrants of the matrix with those of the arithmetic mean reported above indicates robustness of the method of integrated brand analysis and strategy. The median of brand attributes with the best evaluation is 2.00, compared to the arithmetic mean of 2.40. However, this difference does not lead to assigning brands to a “better” quadrant. Similarly, the median of 59.21 for overall brand evaluation, which is slightly higher than the arithmetic mean of 57.04, does not change the strategic decision guidelines for the examined brands.

5.1.4. Brand Analysis and Strategic Decision Guidelines for Positioning on Brand Attribute Level

Section 5.1.3 sheds light on how the overall brand images are analysed and how the subsequent strategic decision guidelines, which the brands should follow in overall brand positioning, are deduced. Section 5.1.4 elaborates on how the brands are performing on the level of brand attributes and what attribute-related strategic decision guidelines should be followed to position the brands, assuming the sample would represent the target group. To this end, matrix analyses on the brand attribute level are undertaken, as described in Section 3.1.2. The dimensions of the matrices are the quality difference to the best competitor and weighted relevance of the brand attributes.
The matrix of quality difference to the best competitor and weighted relevance for Kinder is represented in Figure 12. The following paragraphs describe the respective results.
The following Star brand attributes (upper right quadrant), which show a positive quality difference to the best competitor and an above-average relevance (M = 0.083), should be given first overall priority in brand positioning, and should be secured as the core brand identity (superordinated attribute categories, quality difference to best competitor qD and weighted relevance wR in brackets):
  • Comfort and contentment (mood-related brand attributes; qD = +0.89; wR = 0.100);
  • Joy and fun (mood-related brand attributes; qD = +7.57; wR = 0.092);
  • Happiness (mood-related brand attributes; qD = +4.90; wR = 0.085);
  • Reward (escape- and motivation-related brand attributes; qD = +4.05; wR = 0.090).
The following Question mark brand attributes (upper left quadrant), which show a negative quality difference to the best competitor and an above-average relevance (M = 0.083), should be given second overall priority in brand positioning, and should be selected and developed into the core brand identity (superordinated attribute categories, quality difference to best competitor qD and weighted relevance wR in brackets):
  • Enjoyment and deliciousness (mood-related brand attributes; qD = −0.65; wR = 0.133);
  • Relaxation and serenity (escape- and motivation-related brand attributes; qD = −0.30; wR = 0.090).
The following Cash cow brand attributes (lower right quadrant), which show a positive quality difference to the best competitor and a below-average relevance (M = 0.083), should be given third overall priority in brand positioning, and should be secured as part of the extended brand identity (superordinated attribute categories, quality difference to best competitor qD and weighted relevance wR in brackets):
  • Break from daily life (escape- and motivation-related brand attributes; qD = +2.38; wR = 0.081);
  • Motivation and energy boost (escape- and motivation-related brand attributes; qD = +3.38; wR = 0.078).
The following Poor dog brand attributes (lower left quadrant), which show a negative quality difference to the best competitor and a below-average relevance (M = 0.083), should be given fourth overall priority in brand positioning, and might be selected and developed into the extended brand identity (superordinated attribute categories, quality difference to best competitor qD and weighted relevance wR in brackets):
  • Conviviality (social brand attributes; qD = −2.86; wR = 0.060);
  • Friends (social brand attributes; qD = −1.56; wR = 0.059);
  • Family (social brand attributes; qD = −2.95; wR = 0.058);
  • Special occasions and festivities (social brand attributes; qD = −24.63; wR = 0.073).
The matrix of quality difference to the best competitor and weighted relevance for Lindt is represented in Figure 13. The following paragraphs describe the respective results.
The following Star brand attribute (upper right quadrant), which shows a positive quality difference to the best competitor and an above-average relevance (M = 0.083), should be given first overall priority in brand positioning, and should be secured as the core brand identity (superordinated attribute category, quality difference to best competitor qD and weighted relevance wR in brackets):
  • Enjoyment and deliciousness (mood-related brand attributes; qD = +0.65; wR = 0.133).
The following Question mark brand attributes (upper left quadrant), which show a negative quality difference to the best competitor and an above-average relevance (M = 0.083), should be given second overall priority in brand positioning, and should be selected and developed into the core brand identity (superordinated attribute categories, quality difference to best competitor qD and weighted relevance wR in brackets):
  • Comfort and contentment (mood-related brand attributes; qD = −0.89; wR = 0.100);
  • Joy and fun (mood-related brand attributes; qD = −14.03; wR = 0.092);
  • Happiness (mood-related brand attributes; qD = −4.90; wR = 0.085);
  • Relaxation and serenity (escape- and motivation-related brand attributes; qD = −0.30; wR = 0.090);
  • Reward (escape- and motivation-related brand attributes; qD = −4.05; wR = 0.090).
The following Cash cow brand attribute (lower right quadrant), which shows a positive quality difference to the best competitor and a below-average relevance (M = 0.083), should be given third overall priority in brand positioning, and should be secured as part of the extended brand identity (superordinated attribute category, quality difference to best competitor qD and weighted relevance wR in brackets):
  • Special occasions and festivities (social brand attributes; qD = +6.71; wR = 0.073).
The following Poor dog brand attributes (lower left quadrant), which show a negative quality difference to the best competitor and a below-average relevance (M = 0.083), should be given fourth overall priority in brand positioning, and might be selected and developed into the extended brand identity (superordinated attribute categories, quality difference to best competitor qD and weighted relevance wR in brackets):
  • Conviviality (social brand attributes; qD = −5.65; wR = 0.060);
  • Friends (social brand attributes; qD = −12.38; wR = 0.059);
  • Family (social brand attributes; qD = −0.68; wR = 0.058);
  • Break from daily life (escape- and motivation-related brand attributes; qD = −8.58; wR = 0.081);
  • Motivation and energy boost (escape- and motivation-related brand attributes; qD = −10.29; wR = 0.078).
The matrix of quality difference to the best competitor and weighted relevance for Merci is represented in Figure 14. The following paragraphs describe the respective results.
Merci has no Star brand attributes (upper right quadrant), which shows a positive quality difference to the best competitor and an above-average relevance (M = 0.083).
The following Question mark brand attributes (upper left quadrant), which show a negative quality difference to the best competitor and an above-average relevance (M = 0.083), should be given second overall priority in brand positioning (in this case first priority, as Merci has no Star brand attributes), and should be selected and developed into the core brand identity (superordinated attribute categories, quality difference to best competitor qD and weighted relevance wR in brackets):
  • Comfort and contentment (mood-related brand attributes; qD = −19.19; wR = 0.100);
  • Enjoyment and deliciousness (mood-related brand attributes; qD = −26.56; wR = 0.133);
  • Joy and fun (mood-related brand attributes; qD = −23.63; wR = 0.092);
  • Happiness (mood-related brand attributes; qD = −14.55; wR = 0.085);
  • Relaxation and serenity (escape- and motivation-related brand attributes; qD = −16.31; wR = 0.090);
  • Reward (escape- and motivation-related brand attributes; qD = −18.24; wR = 0.090).
The following Cash cow brand attributes (lower right quadrant), which show a positive quality difference to the best competitor and a below-average relevance (M = 0.083), should be given third overall priority in brand positioning (in this case second priority, as Merci has no Star brand attributes), and should be secured as part of the extended brand identity (superordinated attribute categories, quality difference to best competitor qD and weighted relevance wR in brackets):
  • Conviviality (social brand attributes; qD = +2.68; wR = 0.060);
  • Friends (social brand attributes; qD = +1.56; wR = 0.059);
  • Family (social brand attributes; qD = +0.68; wR = 0.058).
The following Poor dog brand attributes (lower left quadrant), which show a negative quality difference to the best competitor and a below-average relevance (M = 0.083), should be given the lowest overall priority in brand positioning, and might be selected and developed into the extended brand identity (superordinated attribute categories, quality difference to best competitor qD and weighted relevance wR in brackets):
  • Special occasions and festivities (social brand attributes; qD = −6.71; wR = 0.073);
  • Break from daily life (escape- and motivation-related brand attributes; qD = −21.22; wR = 0.081);
  • Motivation and energy boost (escape- and motivation-related brand attributes; qD = −19.68; wR = 0.078).
The matrix of quality difference to the best competitor and weighted relevance for Milka is represented in Figure 15. The following paragraphs describe the respective results.
The following Star brand attribute (upper right quadrant), which shows a positive quality difference to the best competitor and an above-average relevance (M = 0.083), should be given first overall priority in brand positioning, and should be secured as the core brand identity (superordinated attribute category, quality difference to best competitor qD and weighted relevance wR in brackets):
  • Relaxation and serenity (escape- and motivation-related brand attributes; qD = + 0.30; wR = 0.090).
The following Question mark brand attributes (upper left quadrant), which show a negative quality difference to the best competitor and an above-average relevance (M = 0.083), should be given second overall priority in brand positioning, and should be selected and developed into the core brand identity (superordinated attribute categories, quality difference to best competitor qD and weighted relevance wR in brackets):
  • Comfort and contentment (mood-related brand attributes; qD = −2.02; wR = 0.100);
  • Enjoyment and deliciousness (mood-related brand attributes; qD = −6.62; wR = 0.133);
  • Joy and fun (mood-related brand attributes; qD = −7.57; wR = 0.092);
  • Happiness (mood-related brand attributes; qD = −4.95; wR = 0.085);
  • Reward (escape- and motivation-related brand attributes; qD = −7.09; wR = 0.090).
Milka has no Cash cow brand attributes (lower right quadrant), which show a positive quality difference to the best competitor and a below-average relevance (M = 0.083), should be given third overall priority in brand positioning, and should be secured as part of the extended brand identity.
The following Poor dog brand attributes (lower left quadrant), which show a negative quality difference to the best competitor and a below-average relevance (M = 0.083), should be given the lowest overall priority in brand positioning, and might be selected and developed into the extended brand identity (superordinated attribute categories, quality difference to best competitor qD and weighted relevance wR in brackets):
  • Conviviality (social brand attributes; qD = −2.68; wR = 0.060);
  • Friends (social brand attributes; qD = −2.58; wR = 0.059);
  • Family (social brand attributes; qD = −6.22; wR = 0.058);
  • Special occasions and festivities (social brand attributes; qD = −29.42; wR = 0.073);
  • Break from daily life (escape- and motivation-related brand attributes; qD = −2.38; wR = 0.081);
  • Motivation and energy boost (escape- and motivation-related brand attributes; qD = −3.38; wR = 0.078).
The matrix of quality difference to the best competitor and weighted relevance for Ritter is represented in Figure 16. The following paragraphs describe the respective results.
Ritter has no Star brand attributes (upper right quadrant), which show a positive quality difference to the best competitor and an above-average relevance (M = 0.083).
The following Question mark brand attributes (upper left quadrant), which show a negative quality difference to the best competitor and an above-average relevance (M = 0.083), should be given second overall priority in brand positioning (in this case first priority, as Merci has no Star brand attributes), and should be selected and developed into the core brand identity (superordinated attribute categories, quality difference to best competitor qD and weighted relevance wR in brackets):
  • Comfort and contentment (mood-related brand attributes; qD = −11.09; wR = 0.100);
  • Enjoyment and deliciousness (mood-related brand attributes; qD = −12.72; wR = 0.133);
  • Joy and fun (mood-related brand attributes; qD = −14.43; wR = 0.092);
  • Happiness (mood-related brand attributes; qD = −12.08; wR = 0.085);
  • Relaxation and serenity (escape- and motivation-related brand attributes; qD = −7.61; wR = 0.090);
  • Reward (escape- and motivation-related brand attributes; qD = −12.00; wR = 0.090).
Ritter has no Cash cow brand attributes (lower right quadrant), which show a positive quality difference to the best competitor and a below-average relevance (M = 0.083).
The following Poor dog brand attributes (lower left quadrant), which show a negative quality difference to the best competitor and a below-average relevance (M = 0.083), should be given the lowest overall priority in brand positioning, and might be selected and developed into the extended brand identity (superordinated attribute categories, quality difference to best competitor qD and weighted relevance wR in brackets):
  • Conviviality (social brand attributes; qD = −8.32; wR = 0.060);
  • Friends (social brand attributes; qD = −10.14; wR = 0.059);
  • Family (social brand attributes; qD = −11.58; wR = 0.058);
  • Special occasions and festivities (social brand attributes; qD = −34.91; wR = 0.073);
  • Break from daily life (escape- and motivation-related brand attributes; qD = −8.18; wR = 0.081);
  • Motivation and energy boost (escape- and motivation-related brand attributes; qD = −6.58; wR = 0.078).
To test the robustness of the method for integrated brand analysis and strategy on the brand attribute level, the results reported above are compared with the respective results when utilising the median of the weighted relevance instead of the arithmetic mean for dividing the quadrants of the matrix. The median of the weighted relevance is 0.0833, compared to the arithmetic mean of 0.0832. Because of the small difference between the median and the arithmetic mean, the resulting strategic decision guidelines do not differ between the two analyses.

5.2. Market Performance Analysis and Strategic Decision Guidelines for Market Cultivation

The data collection and the sample for analysing the market performance of chocolate brands are the same as described in Section 5.1.2, as the data for both were collected in one survey.
The measurement, applied in this survey, followed the respective description in Section 3.2. Accordingly, the brand awareness, general relevant set, immediate relevant set, and loyalty intentions were measured. Brand awareness was measured with the following question: Which of the following chocolate brands do you know, even if only by name (German: Welche der folgenden Schokoladenmarken kennen Sie, wenn auch nur dem Namen nach)? General relevant set was measured with the following question: Which of the following chocolate brands do you consider good so that you would principally buy them at some stage of your life (German: Welche der folgenden Schokoladenmarken erachten Sie als gut, so dass Sie diese zu irgendeinem Zeitpunkt in Ihrem Leben kaufen würden)? Immediate relevant set was measured with the following question: Which of the following chocolate brands would you consider buying if you had to make a purchase right now (German: Welche der folgenden Schokoladenmarken würden Sie in Betracht ziehen, wenn Sie jetzt einen Kauf tätigen müssten)? Loyalty intentions were measured with the following question: Which of the following chocolate brands would you buy most often in the future (German: Welche der folgenden Schokoladenmarken würden Sie in der Zukunft am häufigsten kaufen)?
To analyse the afore-described data, the frequency distributions of and the conversion between the steps of the buying process were calculated, as described in Section 3.2. The frequency distributions of the steps of the buying process in relation to the sample are represented in Figure 17.
The conversions from one step of the buying process to the next are represented in Figure 18. As described in Section 3.2, strategic decision guidelines for market cultivation can be derived from these conversions: A relatively low conversion to brand awareness indicates an awareness strategy, a relatively low conversion to general relevant set indicates an image strategy, a relatively low conversion to immediate relevant set indicates a sales strategy and a relatively low conversion to loyalty intentions indicates a loyalty strategy.
Under the assumption that the sample would represent the target group of the brands, the market awareness of all brands is at a high level, with a lowest value of 93.94% for Merci, which indicates that a market strategy with a strong emphasis on brand awareness is not required for any of the chocolate brands. More substantial differences can, however, be found in the other steps of the buying process. Here, Kinder shows the best conversions over all remaining steps of the buying process and should, therefore, serve as a benchmark for the other chocolate brands.
Because of the best performance on all steps of the buying process, Kinder is advised to equally emphasise on image, sales, and loyalty strategies to defend its leading position in the market.
In comparison with Kinder, Lindt shows a larger relative gap in its conversion to immediate relevant set than in its conversion to loyalty, which, in turn, shows a larger relative gap than the conversion to general relevant set. Thus, Lindt should give sales strategies the first priority, loyalty strategies the second priority, and image strategies the third priority.
Compared with the other brands, Merci shows the largest gaps to Kinder in its conversions and substantially lags behind its competitors. Thus, Merci is advised to build the foundations in the market along the sequential steps of the buying process. This means Merci should place the strongest strategy emphasis on image, followed by sales and loyalty.
In comparison with Kinder, Milka shows a larger relative gap in its conversion to loyalty intentions than in its conversion to immediate relevant set, which, in turn, shows a larger relative gap than the conversion to general relevant set. Thus, Milka should give loyalty strategies the first priority, sales strategies the second priority, and image strategies the third priority.
The conversions of Ritter show a similar pattern to the ones of Milka, but on a lower level. The relative gap to Kinder is larger for the conversion to loyalty intentions than for the conversion to immediate relevant set, which, in turn, shows a larger relative gap than the conversion to general relevant set. Thus, Ritter should give loyalty strategies the first priority, sales strategies the second priority, and image strategies the third priority.

6. Conclusions

The method for integrated brand analysis and strategy, developed in this work, analyses market research data to give brand managers an understanding of current images and market performances of competing brands. On this basis, strategic decision guidelines for brand positioning, i.e., crafting the brand identity, and market cultivation, i.e., emphasising on awareness, image, sales, or loyalty strategies, can be deduced.
The method of integrated brand analysis and strategy was applied to major German food retail and chocolate brands. The results give first and tentative indications of the validity of the method.
In the case of the German food retail brands, Rewe’s brand image is characterised by the best overall brand evaluation and by the most brand attributes with the best evaluation, with a relatively large gap to its competitors on both dimensions (Figure 3, Section 4.1.3). This finding is consistent with the analysis of the brands’ market performances on the steps of the buying process (Figure 10, Section 4.2). Rewe outperforms all of its competitors with higher conversions on all steps of the buying process.
Similarly, the overall brand evaluation of chocolate brands (Figure 11, Section 5.1.3) corresponds with the market performance of these brands on the steps of the buying process (Figure 18, Section 5.2). In both analyses, the chocolate brands can be ordered from best performance to worst, as follows: Kinder, Lindt, Milka, Ritter, and Merci.
More indications for the validity of the method for integrated brand analysis and strategy can be found in the results of the brand analyses on attribute level.
In Section 4.1.4, two supermarkets (Edeka and Rewe), two discounters (Aldi and Lidl), and a self-service department store (Kaufland) were examined. Rewe performs best on all brand attributes that deliver value to customers through product range, service, and location appeal, with the exception of shop design and parking facilities. Edeka, as the second examined supermarket, relatively narrowly trails Rewe on these attributes, with the exception of self-services and order and delivery services, and narrowly outperforms Rewe on the brand attribute shop design. The discounters Aldi and Lidl are outperforming their competitors on brand attributes related to pricing, i.e., price level, discounts, and loyalty cards. Kaufland, as a relatively low-price department store, is outperformed on all brand attributes by the other brands that have a stronger, virtually sole focus on food. Thus, the results of the brand attribute analysis of food retailers are consistent with the general perception of supermarkets, discounters, and low-price department stores.
The analysis of attributes of chocolate brands was reported in Section 5.1.4. The performance of the chocolate brands on the brand attributes is consistent with their current positioning. Kinder, which translates into children and uses the slogan “a little, a lot” (Kinder, 2025), performs either best or second best on all mood-related brand attributes and escape- and motivation-related brand attributes. Lindt, which is positioned as a relatively upmarket chocolate through its slogan “Swiss Maitre Chocolatier” (Lindt, 2025), outperforms the other brands on the attributes of enjoyment and deliciousness, and special occasions. Merci, with a slogan that translates into “A thank you that comes from the heart” (Merci, 2025), is evaluated best on the social brand attributes conviviality, family, and friends. From the sample’s perspective, Milka, whose vision translates into “Makes life more tender” (Milka, 2025), represents a solid chocolate without a unique appeal, as it is trailing its competitors relatively narrowly on all brand attributes, with the exception of relaxation (best performance) and special occasions (second worst performance). Ritter uses a slogan that translates into “Squared. Practical. Good.” (Ritter, 2025). This slogan does not (directly) relate to any of the examined brand attributes. Consequently, Ritter is outperformed on every examined brand attribute by its competitors.
In the previous paragraphs, first indications of the validity of the method for integrated brand analysis and strategy are discussed. However, these discussions primarily indicate face validity. Criterion validity could not be sufficiently demonstrated. Thus, follow-up studies, which test the method for criterion validity, are advised. The arguably best approach to test criterion validity would be to apply the deduced strategic decision guidelines to the management of a brand and examine if the market outcomes (external criterion), i.e., the brand’s performance on the steps of the buying process, improve over time in a longitudinal study.
When validating the method for integrated brand analysis and strategy further or applying it in academic or managerial projects, more attention should be paid to the target group. More precisely, the samples of future research should represent the target group of the examined brands. The samples of the method’s applications in this work consist of students of business psychology who study part-time and work in regular jobs. This indicates that the participants represent “normal” consumers rather than “typical” students, so that the participants can be considered relevant customers of food retail and chocolate brands. They do not, however, represent the German population or the entire and precisely defined target group of the examined brands. Thus, the results of the empirical studies and the derived strategic decision guidelines must be taken with caution and cannot be understood as definitive recommendations for the examined brands.
A stronger focus on the target group might also lead to further advancements of the method of integrated brand analysis and strategy itself. As pointed out in Section 2, the success of a brand, and one can argue also its co-creation, depends on the target group. Thus, integrating a segmenting and targeting method into the method for brand analysis and strategy, developed here, can lead to a more comprehensive and more effective brand management approach. In a similar vein, establishing ways and techniques to translate the brand identity and market strategy into operational measures, e.g., the marketing mix, could further complement the method for integrated brand analysis and strategy developed in this work.

Funding

This research received no external funding.

Institutional Review Board Statement

Ethics reviews and approvals are not required for studies, which can be characterised as low-risk research and comply with good research practice, according to the ethical guidelines of FOM University of Applied Sciences. The Rules of Procedure of the Ethics Committee (Geschäftsordnung der Ethikkommission der FOM Hochschule für Oekonomie & Management) and the Checklist Characteristics of Low-Risk Research (Checkliste Merkmale von Low Risk Forschung) of FOM University of Applied Sciences indicate that an ethics review and approval by an ethics committee is not required for studies that can be characterised as low-risk research.

Informed Consent Statement

Informed consent was obtained from all subjects involved in the study.

Data Availability Statement

The raw data supporting the conclusions of this article will be made available by the authors on request.

Conflicts of Interest

The author declares no conflict of interst.

Appendix A

Variance inflation factors for relevance items of food retail brands:
(1) Product range
  • Width of the product range: 1.35
  • Depth of the product range: 1.34
  • Product quality: 1.22
  • Socially responsible products: 1.21
(2) Service
  • Personnel: 1.45
  • Self-service, esp. self-checkout: 1.15
  • Complaint and replacement: 1.51
  • Order and delivery service: 1.27
(3) Pricing
  • Price level: 1.49
  • Discounts: 1.75
  • Loyalty cards: 1.36
  • Payment options: 1.31
(4) Location appeal
  • Accessibility: 1.08
  • Parking facilities: 1.15
  • Shop design: 1.43
  • Opening hours: 1.25
(5) Communication outside the store
  • Product information: 2.06
  • Company information: 2.19
  • Dialogue: 1.80
Variance inflation factors for relevance items of chocolate brands:
(1) Mood-related brand attributes
  • Comfort and contentment: 1.34
  • Enjoyment and deliciousness: 1.09
  • Joy and fun: 1.70
  • Happiness: 1.83
(2) Social brand attributes
  • Conviviality: 2.69
  • Friends: 3.67
  • Family: 3.86
  • Special occasions and festivities: 1.73
(3) Escape- and motivation-related brand attributes
  • Relaxation and serenity: 1.66
  • Break from daily life: 1.95
  • Motivation and energy boost: 1.61
  • Reward: 1.73

References

  1. Aaker, D. A. (1992). The value of brand equity. Journal of Business Strategy, 13(4), 27–32. [Google Scholar] [CrossRef]
  2. Aaker, D. A. (2010). Building strong brands. Pocket Books. [Google Scholar]
  3. Aaker, D. A. (2012). Win the brand relevance battle and then build competitor barriers. California Management Review, 54(2), 43–57. [Google Scholar] [CrossRef]
  4. Aaker, D. A., & Shansby, J. (1982). Positioning your product. Business Horizons, 25(3), 56–62. [Google Scholar] [CrossRef]
  5. Abin, D. G., Mandagi, D. W., & Pasuhuk, L. S. (2022). Influence of brand image on customer attitude, intention to purchase and satisfaction: The case of start-up brand Pomie Bakery. Enrichment: Journal of Management, 12(5), 3907–3917. [Google Scholar]
  6. AMA. (1948). Report of the definitions committee. Journal of Marketing, 13(2), 202–217. [Google Scholar] [CrossRef]
  7. Arnott, D. C. (1992). Bases of financial services positioning in the personal pension, life assurance and personal equity plan sectors [Doctoral dissertation, University of Manchester]. Available online: https://www.proquest.com/openview/fc6275a01417ebe6ceb54fcfdcb2be62/1?pq-origsite=gscholar&cbl=2026366&diss=y (accessed on 10 December 2025).
  8. Atkinson, J. W. (1964). An introduction to motivation. Van Nostrand. [Google Scholar]
  9. Avis, M., & Henderson, I. L. (2022). A solution to the problem of brand definition. European Journal of Marketing, 56(2), 351–374. [Google Scholar] [CrossRef]
  10. Beverland, M. B., Wilner, S. J., & Micheli, P. (2015). Reconciling the tension between consistency and relevance: Design thinking as a mechanism for brand ambidexterity. Journal of the Academy of Marketing Science, 43(5), 589–609. [Google Scholar] [CrossRef]
  11. Bilgili, B., & Ozkul, E. (2015). Brand awareness, brand personality, brand loyalty and consumer satisfaction relations in brand positioning strategies (A Torku brand sample). Journal of Global Strategic Management, 9(2), 89–106. [Google Scholar] [CrossRef]
  12. Blankson, C., & Kalafatis, S. P. (2007). Positioning strategies of international and multicultural-oriented service brands. Journal of Services Marketing, 21(6), 435–450. [Google Scholar] [CrossRef]
  13. Boyle, E. (2007). A process model of brand cocreation: Brand management and research implications. Journal of Product & Brand Management, 16(2), 122–131. [Google Scholar] [CrossRef]
  14. Buil, I., De Chernatony, L., & Martinez, E. (2008). A cross-national validation of the consumer-based brand equity scale. Journal of Product & Brand Management, 17(6), 384–392. [Google Scholar] [CrossRef]
  15. Burmann, C., Riley, N. M., Halaszovich, T., Schade, M., Klein, K., & Piehler, R. (2023). Identity-based brand management: Fundamentals-strategy-implementation-controlling. Springer Nature. [Google Scholar]
  16. BVE—Bundesvereinigung der Deutschen Ernährungsindustrie. (2025). Jahresbericht 24/25. Available online: https://www.ernaehrungsindustrie.de/publikation/bve-jahresbericht-ernaehrungsindustrie-2025/ (accessed on 8 December 2025).
  17. Cho, E., & Fiore, A. M. (2015). Conceptualization of a holistic brand image measure for fashion-related brands. Journal of Consumer Marketing, 32(4), 255–265. [Google Scholar] [CrossRef]
  18. Cho, E., Fiore, A. M., & Russell, D. W. (2015). Validation of a fashion brand image scale capturing cognitive, sensory, and affective associations: Testing its role in an extended brand equity model. Psychology & Marketing, 32(1), 28–48. [Google Scholar] [CrossRef]
  19. Chyung, S. Y., Swanson, I., Roberts, K., & Hankinson, A. (2018). Evidence-based survey design: The use of continuous rating scales in surveys. Performance Improvement, 57(5), 38–48. [Google Scholar] [CrossRef]
  20. Cid, A., Blanchet, P., Robichaud, F., & Kinuani, N. (2022). A conceptual framework for creating brand management strategies. Businesses, 2(4), 546–561. [Google Scholar] [CrossRef]
  21. de Chernatony, L. (2010). From brand vision to brand evaluation: The strategic process of growing and strengthening brands (3rd ed.). Routledge. [Google Scholar] [CrossRef]
  22. de Chernatony, L., & Dall’Olmo Riley, F. (1998). Defining a” brand”: Beyond the literature with experts’ interpretations. Journal of Marketing Management, 14(5), 417–443. [Google Scholar] [CrossRef]
  23. Dierks, A. (2017). Re-modeling the brand purchase funnel: Conceptualization and empirical application. Springer Gabler. [Google Scholar]
  24. Dirsehan, T., & Kurtuluş, S. (2018). Measuring brand image using a cognitive approach: Representing brands as a network in the Turkish airline industry. Journal of Air Transport Management, 67, 85–93. [Google Scholar] [CrossRef]
  25. Diwan, S. P., & Bodla, B. (2011). Development of empirically based customer-derive positioning typology in the automobile industry. Journal of Strategic Marketing, 19(6), 531–550. [Google Scholar] [CrossRef]
  26. Dunes, M., & Pras, B. (2017). The impact of the brand management system on performance across service and product-oriented activities. Journal of Product & Brand Management, 26(3), 294–311. [Google Scholar] [CrossRef]
  27. Dwivedi, A., Johnson, L. W., & McDonald, R. E. (2015). Celebrity endorsement, self-brand connection and consumer-based brand equity. Journal of Product & Brand Management, 24(5), 449–461. [Google Scholar] [CrossRef]
  28. Fishbein, M., & Ajzen, I. (1975). Belief, attitude, intention and behavior. An introduction to theory and research. Addison-Wesley. [Google Scholar]
  29. Fuchs, C., & Diamantopoulos, A. (2010). Evaluating the effectiveness of brand-positioning strategies from a consumer perspective. European Journal of Marketing, 44(11/12), 1763–1786. [Google Scholar] [CrossRef]
  30. Godbersen, H. (2016). Die means-end theory of complex cognitive structures—Entwicklung eines Modells zur Repräsentation von verhaltensrelevanten und komplexen kognitionsstrukturen für die wirtschafts- und Sozialwissenschaften. In B. Krol (Ed.), Ifes schriftenreihe. Akademie Verlags- und Druck-Gesellschaft. [Google Scholar]
  31. Godbersen, H. (2019). Hörererwartungen, Programmqualität und Optimierungspotenzial von musikbasierten Formatradios–eine empirische Analyse mit der Means-End Theory of Complex Cognitive Structures. Zeitschrift Kommunikation Markenmanagement, 65(3), 12–21. [Google Scholar]
  32. Godbersen, H. (2023). Qualitative forschung für dummies. Wiley-VCH. [Google Scholar]
  33. Godbersen, H., & Barluschke, D. (2020). Aktives Schadenmanagement bei Automobilflotten aus Kundensicht–Kundenerwartungen, deren Erfüllung und Optimierungsansätze für Dienstleister und Versicherungen. In J. Naskrent, M. Stumpf, & J. Westphal (Eds.), KCMS-schriftenreihe. MA Verlag. Available online: https://hdl.handle.net/10419/222581 (accessed on 10 December 2025).
  34. Godbersen, H., & Kaupp, F. (2019). Optimierungsansätze für stationäre Apotheken vor dem Hintergrund der Kundenerwartungen und deren Erfüllung–Eine empirische Analyse mit der Means-End Theory of Complex Cognitive Structures. Gesundheitsökonomie & Qualitätsmanagement, 24(5), 12–21. [Google Scholar] [CrossRef]
  35. Godbersen, H., Szabo, T., & Ruiz Fernández, S. (2023). Customer expectations and their fulfilment in the german food retail market before and during the COVID-19 pandemic: A Longitudinal Study with the Means-End Theory of Complex Cognitive Structures. In L. Rothe, J. Naskrent, M. Stumpf, & J. Westphal (Eds.), Marketing & innovation 2023: Future shopping–der Handel in der (nach-) coronazeit (pp. 173–198). Springer Fachmedien Wiesbaden. [Google Scholar] [CrossRef]
  36. Gwin, C. F., & Gwin, C. R. (2003). Product attributes model: A tool for evaluating brand positioning. Journal of Marketing Theory and Practice, 11(2), 30–42. [Google Scholar] [CrossRef]
  37. Iyer, P., Davari, A., Srivastava, S., & Paswan, A. K. (2021). Market orientation, brand management processes and brand performance. Journal of Product & Brand Management, 30(2), 197–214. [Google Scholar] [CrossRef]
  38. Kalafatis, S. P., Tsogas, M. H., & Blankson, C. (2000). Positioning strategies in business markets. Journal of Business & Industrial Marketing, 15(6), 416–437. [Google Scholar] [CrossRef]
  39. Kapferer, J. N. (2012). The new strategic brand management: Advanced insights & strategic thinking. Kogan Page Publishers. [Google Scholar]
  40. Keller, K. L. (2003). Understanding brands, branding and brand equity. Interactive Marketing, 5(1), 7–20. [Google Scholar] [CrossRef]
  41. Keller, K. L. (2013). Strategic brand management: Building, measuring, and managing brand equity. Pearson. [Google Scholar]
  42. Kinder. (2025). Available online: https://www.kinder.com/de/de/alittlealot (accessed on 8 December 2025).
  43. Kotler, P., & Keller, K. L. (2016). Marketing management. Global edition (15th ed.). Pearson. [Google Scholar]
  44. Kuckartz, U., & Radiker, S. (2023). Qualitative content analysis: Methods, practice and software. Sage Publications. [Google Scholar]
  45. Lee, J., Park, S. Y., Baek, I., & Lee, C. S. (2008). The impact of the brand management system on brand performance in B–B and B–C environments. Industrial Marketing Management, 37(7), 848–855. [Google Scholar] [CrossRef]
  46. Lee, W. J., O’Cass, A., & Sok, P. (2016). Why doesn’t our branding payoff: Optimizing the effects of branding through innovation. European Journal of Marketing, 50(3/4), 509–529. [Google Scholar] [CrossRef]
  47. Lindt. (2025). Available online: https://www.lindt.de (accessed on 8 December 2025).
  48. Low, G. S., & Lamb, C. W., Jr. (2000). The measurement and dimensionality of brand associations. Journal of Product & Brand Management, 9(6), 350–370. [Google Scholar] [CrossRef]
  49. Mackay, M. M. (2001). Evaluation of brand equity measures: Further empirical results. Journal of Product & Brand Management, 10(1), 38–51. [Google Scholar] [CrossRef]
  50. Manhas, P. S. (2010). Strategic brand positioning analysis through comparison of cognitive and conative perceptions. Journal of Economics, Finance and Administrative Science, 15(29), 15–34. [Google Scholar] [CrossRef]
  51. Martilla, J. A., & James, J. C. (1977). Importance-performance analysis. Journal of Marketing, 41(1), 77–79. [Google Scholar] [CrossRef]
  52. Mayring, P. (2021). Qualitative content analysis: A step-by-step guide. Sage Publications. [Google Scholar]
  53. McCarthy, J. E. (1961). Basic marketing. A managerial approach. Irwin. [Google Scholar]
  54. McGoldrick, P. J. (2002). Retails marketing. McGraw-Hill. [Google Scholar]
  55. Merci. (2025). Available online: https://www.merci.de/de/produkte/merci-finest-selection (accessed on 8 December 2025).
  56. Milka. (2025). Available online: https://www.milka.com/de/ueber-milka/ (accessed on 8 December 2025).
  57. Myers, C. A. (2003). Managing brand equity: A look at the impact of attributes. Journal of Product & Brand Management, 12(1), 39–51. [Google Scholar] [CrossRef]
  58. Nguyen, T. D., Dadzie, C., Davari, A., & Guzman, F. (2015). Intellectual capital through the eyes of the consumer. Journal of Product & Brand Management, 24(6), 554–566. [Google Scholar] [CrossRef] [PubMed]
  59. Olsen, L. E., Meling Samuelsen, B., Pappas, I., & Warlop, L. (2022). Broad vs narrow brand positioning: Effects on competitive brand performance. European Journal of Marketing, 56(3), 799–816. [Google Scholar] [CrossRef]
  60. Pappu, R., Quester, P. G., & Cooksey, R. W. (2005). Consumer-based brand equity: Improving the measurement–empirical evidence. Journal of Product & Brand Management, 14(3), 143–154. [Google Scholar] [CrossRef]
  61. Park, C. W., Jaworski, B. J., & MacInnis, D. J. (1986). Strategic brand concept-image management. Journal of Marketing, 50(4), 135–145. [Google Scholar] [CrossRef]
  62. R Development Core Team. (2017). R: A language and environment for statistical computing. R Foundation for Statistical Computing. Available online: https://www.R-project.org/ (accessed on 8 December 2025).
  63. Ries, A., & Trout, J. (1986). Positioning: The battle for your mind (1st ed.). McGraw-Hill. [Google Scholar]
  64. Ritter. (2025). Available online: https://www.ritter-sport.com/de/entdeckedasgut (accessed on 8 December 2025).
  65. Saqib, N. (2021). Positioning—A literature review. PSU Research Review, 5(2), 141–169. [Google Scholar] [CrossRef]
  66. Song, H., Wang, J., & Han, H. (2019). Effect of image, satisfaction, trust, love, and respect on loyalty formation for name-brand coffee shops. International Journal of Hospitality Management, 79, 50–59. [Google Scholar] [CrossRef]
  67. Sonnier, G., & Ainslie, A. (2011). Estimating the value of brand-image associations: The role of general and specific brand image. Journal of Marketing Research, 48(3), 518–531. [Google Scholar] [CrossRef]
  68. Strauss, A., & Corbin, J. (1998). Basics of qualitative research: Techniques and procedures for developing grounded theory. Sage Publications. [Google Scholar]
  69. Su, J., & Tong, X. (2015). Brand personality and brand equity: Evidence from the sportswear industry. Journal of Product & Brand Management, 24(2), 124–133. [Google Scholar] [CrossRef]
  70. Tahir, A. H., Adnan, M., & Saeed, Z. (2024). The impact of brand image on customer satisfaction and brand loyalty: A systematic literature review. Heliyon, 10(16), e36254. [Google Scholar] [CrossRef]
  71. Tong, X., & Hawley, J. M. (2009). Measuring customer-based brand equity: Empirical evidence from the sportswear market in China. Journal of Product & Brand Management, 18(4), 262–271. [Google Scholar] [CrossRef]
  72. Urde, M. (2016). The brand core and its management over time. Journal of Product & Brand Management, 25(1), 26–42. [Google Scholar] [CrossRef]
  73. Veloutsou, C., & Delgado-Ballester, E. (2018). New challenges in brand management. Spanish Journal of Marketing-ESIC, 22(3), 254–271. [Google Scholar] [CrossRef]
  74. Vroom, V. H. (1995). Work and motivation. Jossey-Bass. [Google Scholar]
  75. Walters, D., & White, D. (1987). Retail marketing management. Macmillan. [Google Scholar]
Figure 1. Analysis of brand images and strategic decision guidelines for overall brand positioning.
Businesses 06 00017 g001
Figure 2. Analysis of brand attributes and strategic decision guidelines for creating differentiated brand identities.
Businesses 06 00017 g002
Figure 3. Overall brand evaluation and number of brand attributes with the best evaluation (n = 923).
Businesses 06 00017 g003
Figure 4. Quality difference to the best competitor and weighted relevance of brand attributes for Aldi (n = 923).
Businesses 06 00017 g004
Figure 5. Quality difference to the best competitor and weighted relevance of brand attributes for Edeka (n = 923).
Businesses 06 00017 g005
Figure 6. Quality difference to the best competitor and weighted relevance of brand attributes for Kaufland (n = 923).
Businesses 06 00017 g006
Figure 7. Quality difference to the best competitor and weighted relevance of brand attributes for Lidl (n = 923).
Businesses 06 00017 g007
Figure 8. Quality difference to the best competitor and weighted relevance of brand attributes for Rewe (n = 923).
Businesses 06 00017 g008
Figure 9. Frequencies of food retail brands over the steps of the buying process (n = 923).
Businesses 06 00017 g009
Figure 10. Conversions of food retail brands over the steps of the buying process (n = 923).
Businesses 06 00017 g010
Figure 11. Overall brand evaluation and number of brand attributes with the best evaluation (n = 907).
Businesses 06 00017 g011
Figure 12. Quality difference to the best competitor and weighted relevance of brand attributes for Kinder (n = 907).
Businesses 06 00017 g012
Figure 13. Quality difference to the best competitor and weighted relevance of brand attributes for Lindt (n = 907).
Businesses 06 00017 g013
Figure 14. Quality difference to the best competitor and weighted relevance of brand attributes for Merci (n = 907).
Businesses 06 00017 g014
Figure 15. Quality difference to the best competitor and weighted relevance of brand attributes for Milka (n = 907).
Businesses 06 00017 g015
Figure 16. Quality difference to the best competitor and weighted relevance of brand attributes for Ritter (n = 907).
Businesses 06 00017 g016
Figure 17. Frequencies of chocolate brands over the steps of the buying process (n = 907).
Businesses 06 00017 g017
Figure 18. Conversions of chocolate brands over the steps of the buying process (n = 907).
Businesses 06 00017 g018
Table 1. Relevance (scale: 0 “not important” to 100 “very important”) and quality (scale: 0 “not good” to 100 “very good”) of brand attributes for food retail brands (n = 907).
AttributesArithmetic Mean (SD in Brackets)
RelevanceAldiEdekaKauf-LandLidlRewe
Product range
Width of the product range80.91
(15.78)
62.17
(21.07)
88.08
(13.30)
84.75
(18.35)
68.64
(20.18)
88.88
(11.85)
Depth of the product range54.66
(26.36)
47.28
(23.01)
86.09
(15.24)
81.25
(19.70)
59.87
(21.90)
87.26
(13.33)
Product quality88.32
(12.79)
68.97
(18.98)
84.91
(14.05)
62.74
(22.31)
70.88
(20.23)
85.24
(12.88)
Socially responsible products59.21
(27.01)
52.13
(21.80)
77.28
(17.74)
54.81
(23.15)
55.95
(22.43)
77.38
(17.67)
Service
Personnel42.17
(25.95)
51.23
(24.26)
65.86
(21.30)
46.66
(23.32)
55.07
(25.12)
67.17
(21.06)
Self-services56.77
(31.11)
26.41
(32.44)
48.93
(34.96)
41.57
(32.32)
44.38
(36.22)
72.05
(30.58)
Complaint and replacement41.14
(30.17)
53.11
(26.00)
55.54
(23.91)
49.14
(24.42)
52.89
(25.36)
57.58
(24.00)
Order and delivery service19.97
(25.79)
16.98
(23.29)
32.83
(28.29)
29.59
(26.69)
26.40
(27.32)
68.53
(28.15)
Pricing
Price level80.35
(17.44)
84.44
(13.44)
45.02
(22.89)
67.86
(20.85)
80.30
(15.84)
52.84
(22.40)
Discounts72.01
(23.81)
72.14
(21.63)
45.79
(23.14)
66.71
(21.87)
74.53
(20.92)
55.12
(22.97)
Loyalty cards38.58
(31.21)
27.26
(27.30)
48.81
(28.51)
51.32
(27.31)
60.24
(30.58)
58.27
(27.91)
Payment options61.02
(31.65)
71.06
(25.28)
76.15
(23.09)
72.16
(23.89)
74.47
(23.76)
79.83
(20.68)
Location appeal
Accessibility79.18
(26.03)
72.13
(25.66)
69.65
(26.12)
54.77
(28.98)
73.53
(23.10)
77.60
(22.53)
Parking facilities73.95
(32.17)
84.45
(19.13)
76.15
(25.51)
76.50
(25.43)
81.58
(20.99)
75.07
(25.53)
Shop design69.81
(22.90)
56.37
(27.14)
79.40
(20.56)
46.37
(27.89)
58.07
(27.08)
78.64
(20.00)
Opening hours82.54
(17.54)
73.37
(20.14)
76.21
(20.05)
78.57
(19.67)
75.79
(19.33)
86.71
(15.33)
Communication
Product information38.46
(28.88)
56.00
(24.92)
59.22
(24.21)
51.66
(24.50)
58.27
(23.84)
61.76
(23.50)
Company information36.11
(26.36)
49.96
(24.42)
58.24
(25.52)
47.21
(24.12)
54.65
(23.55)
60.48
(24.17)
Dialogue22.43
(24.30)
37.97
(24.23)
45.59
(25.23)
40.19
(24.03)
44.21
(24.34)
49.38
(25.85)
Table 2. Pretest—Chocolate consumption frequency (n = 509).
Chocolate ConsumptionPercentage
Less than once per year0.39
Once per year0.39
Several times per year but less than once per month5.30
Once per month8.64
Several times per month but less than once per week23.77
Once per week14.93
Several times per week but less than daily36.94
Daily9.63
Table 3. Context of consuming chocolate (n = 509).
Context of ConsumptionFrequencyPercentage
Positive contexts
During and after sport221.01%
During and after work27312.57%
During leisure activities, esp. travels, holidays, and evenings1185.44%
During media consumption, esp. television or streaming24011.05%
In conjunction with a meal or coffee34615.94%
Social contexts
In social contexts, esp. with family and friends1346.17%
On special occasions and festivities1245.71%
Escape- and motivation-related contexts
During breaks1275.85%
During times of relaxation693.18%
In self-rewarding situations703.22%
In situations when a boost of motivation and energy is needed512.35%
Negative contexts
In situations of boredom592.72%
In situations of feeling unwell, esp. during the period542.49%
In situations with negative emotions, esp. frustration and sadness874.01%
In stressful situations1657.60%
Chocolate-related contexts
In situations with a hankering or craving for chocolate1426.54%
Other
Other or not applicable904.15%
Sum2171100.00%
Table 4. Motives for consuming chocolate (n = 509).
MotivesFrequencyPercentage
Mood-related motives
Being happy583.55%
Being joyful and having fun794.83%
Completing a meal or coffee513.12%
Enjoying the taste of chocolate32619.93%
Feeling better1046.36%
Feeling comfortable and content1046.36%
Social motives
Sharing good times with others704.28%
Escape- and motivation-related motives
Boosting motivation and energy1297.89%
Distracting from the current situation or escaping boredom845.13%
Reducing stress1277.76%
Relaxing and calming down965.87%
Rewarding oneself1428.68%
Chocolate-related motives
Out of availability or habit482.93%
Satisfying cravings or hunger17310.57%
Other
Other or not applicable452.75%
Sum1636100.00%
Table 5. Associations with context of consumption and chocolate (n = 509).
AssociationsContextProduct
FrequencyPercentageFrequencyPercentage
Mood-related associations
Comfort and contentment30417.82%26715.26%
Enjoyment and deliciousness1508.79%32618.63%
Happiness20311.90%1739.89%
Joy and fun20411.96%19511.14%
Social associations
Conviviality, family and friends553.22%472.69%
Positive memories and childhood130.76%683.89%
Escape- and motivation-related associations
Break from daily life613.58%211.20%
Motivation and energy boost402.34%231.31%
Relaxation and serenity18710.96%1216.91%
Reward915.33%1106.29%
Negative associations
Bad conscience or regret774.51%774.40%
Boredom281.64%----
Cravings or hunger372.17%170.97%
Negative emotions, esp. frustration, sadness613.58%221.26%
Stress905.28%----
Unhealthiness50.29%1226.97%
Negative other392.29%160.91%
Other
Other or not applicable613.58%1458.29%
Sum1706100.00%1750100.00%
Table 6. Main study: Chocolate consumption frequency (n = 907).
Chocolate ConsumptionPercentage
Less than once per year0.88
Once per year0.66
Several times per year but less than once per month8.82
Once per month9.15
Several times per month but less than once per week22.93
Once per week17.97
Several times per week but less than daily32.64
Daily6.95
Table 7. Relevance of brand attributes (scale: 0 “not important” to 100 “very important”) and association of brand attributes with chocolate brands (scale: 0 “not at all” to 100 “very strong”) (n = 907).
AttributesArithmetic Mean (SD in Brackets)
RelevanceKinderLindtMerciMilkaRitter
Mood-related associations
Comfort and contentment70.31
(24.15)
71.85
(25.25)
70.96
(25.81)
52.66
(29.05)
69.83
(25.81)
60.76
(27.73)
Enjoyment and deliciousness93.54
(11.98)
80.97
(22.25)
81.62
(23.83)
55.07
(27.97)
75.00
(24.47)
68.90
(26.13)
Joy and fun64.92
(25.29)
71.74
(24.73)
57.72
(27.89)
48.12
(28.88)
64.17
(27.63)
57.32
(28.39)
Happiness59.67
(27.86)
62.58
(27.93)
57.68
(28.71)
48.03
(29.09)
57.63
(28.92)
50.50
(28.28)
Social associations
Conviviality42.53
(30.72)
56.37
(29.51)
53.58
(30.12)
59.23
(30.34)
56.55
(28.62)
50.91
(28.42)
Friends41.75
(30.21)
56.60
(30.01)
45.78
(29.80)
58.16
(31.37)
55.58
(29.24)
48.02
(29.52)
Family40.61
(30.28)
56.18
(30.49)
58.45
(30.88)
59.13
(31.47)
52.91
(30.18)
47.55
(30.07)
Special occasions and festivities51.12
(31.75)
49.52
(31.42)
74.15
(27.89)
67.44
(30.42)
44.73
(29.33)
39.24
(28.66)
Escape- and motivation-related associations
Relaxation and serenity63.47
(27.01)
53.85
(29.25)
53.85
(29.75)
37.84
(26.98)
54.15
(28.41)
46.54
(28.75)
Break from daily life57.30
(30.37)
56.71
(29.91)
48.13
(30.65)
35.49
(28.27)
54.33
(29.80)
48.53
(30.26)
Motivation and energy boost54.49
(31.64)
53.61
(31.76)
43.32
(30.58)
33.93
(28.35)
50.23
(31.20)
47.03
(31.11)
Reward63.40
(30.73)
64.67
(30.32)
60.61
(32.27)
46.43
(32.58)
57.58
(30.95)
52.66
(31.75)
Disclaimer/Publisher’s Note: The statements, opinions and data contained in all publications are solely those of the individual author(s) and contributor(s) and not of MDPI and/or the editor(s). MDPI and/or the editor(s) disclaim responsibility for any injury to people or property resulting from any ideas, methods, instructions or products referred to in the content.