Article

Hydraulic Conductivity of Cracked Concrete Linings


by
Jean-Pierre Giroud
34 Avenue Montaigne, 75008 Paris, France
Constr. Mater. 2026, 6(3), 25; https://doi.org/10.3390/constrmater6030025
Submission received: 11 November 2025 / Revised: 14 January 2026 / Accepted: 9 February 2026 / Published: 23 April 2026

Abstract

Concrete linings are used for water containment, in particular in reservoirs and canals. When the soil underlying a concrete lining has a high permeability, seepage into the ground of water from concrete-lined reservoirs and canals is essentially governed by leakage of water through the concrete linings. Therefore, it is essential to properly evaluate the hydraulic conductivity of concrete linings. It is known that cracks generally develop in concrete linings. This article provides material data and a method for the evaluation of the hydraulic conductivity of concrete linings, in particular cracked concrete linings, through two approaches. The first approach consists of a review of selected published values of the measured hydraulic conductivity of intact and cracked concrete. The second approach consists in developing an original analytical method to determine the hydraulic conductivity of cracked concrete using the results of an experimental evaluation of the influence, on water flow, of the tortuosity and rugosity of concrete cracks. The results obtained with the two approaches are compared and numerical examples are presented. Based on these results, practical guidance is provided to design engineers for a safe evaluation of the hydraulic conductivity of concrete linings, cracked or not cracked.

1. Introduction

A fraction of the water stored in reservoirs or transported in canals is lost by migration into the ground, resulting in a waste of water and significant economic consequences. Concrete linings are extensively used to control water migration. However, concrete linings, typically 0.1 to 0.2 m thick, are not totally impermeable. A certain amount of water can migrate through a concrete lining, a mechanism called ‘leakage’. Thus, migration of water into the ground results from leakage through the concrete lining followed by seepage through the ground material, typically soil.
If the ground material is significantly more permeable than the lining material, which is the case with a concrete lining in good condition resting on many types of soils, the rate of water migration is essentially the rate of leakage through the concrete lining.
The purpose of this article is to provide experimental data on concrete hydraulic conductivity and an original methodology for the evaluation of the hydraulic conductivity of cracked concrete. It is known that cracks generally develop in concrete linings after construction. Therefore, this article addresses not only concrete linings as constructed but also concrete linings that eventually exhibit cracks. The results are used to provide guidance to design engineers for a safe evaluation of the hydraulic conductivity of concrete linings.

2. Materials and Methods

2.1. Overview of Materials and Methods

2.1.1. The Concept of Permeability

Fluid flow through a porous material depends on the viscosity of the fluid and the structure of the porous material, which is characterized by its intrinsic permeability. The flow of fluid through a porous material, such as concrete, is governed by the following equation, which quantifies the volume of fluid that flows under the effect of pressure through a layer of this material per unit of time:
Q = Δ V Δ t = K μ A   Δ p h c ,
where Q is the volumetric flow rate, ΔV is the volume of fluid flowing through the considered material layer during time Δt, K is the intrinsic permeability of the material, µ is the dynamic viscosity of the fluid, A is the material area through which flow takes place, Δp is the pressure difference between the two faces of the material layer, and hc is the thickness of the layer of porous material (concrete in this article, hence the subscript). The basic SI units are: Q (m3/s), V (m3), t (s), K (m2), µ (Pa·s), A (m2), p (Pa), and hc (m).
When the fluid is water and the flow is laminar, the porous material is characterized by its hydraulic conductivity, k, in accordance with Darcy’s equation:
Q = Δ V Δ t = k   A i   ,
where i is the hydraulic gradient (dimensionless) defined by the following equation:
i = h w + h c h c = Δ p ρ w   g   h c   .
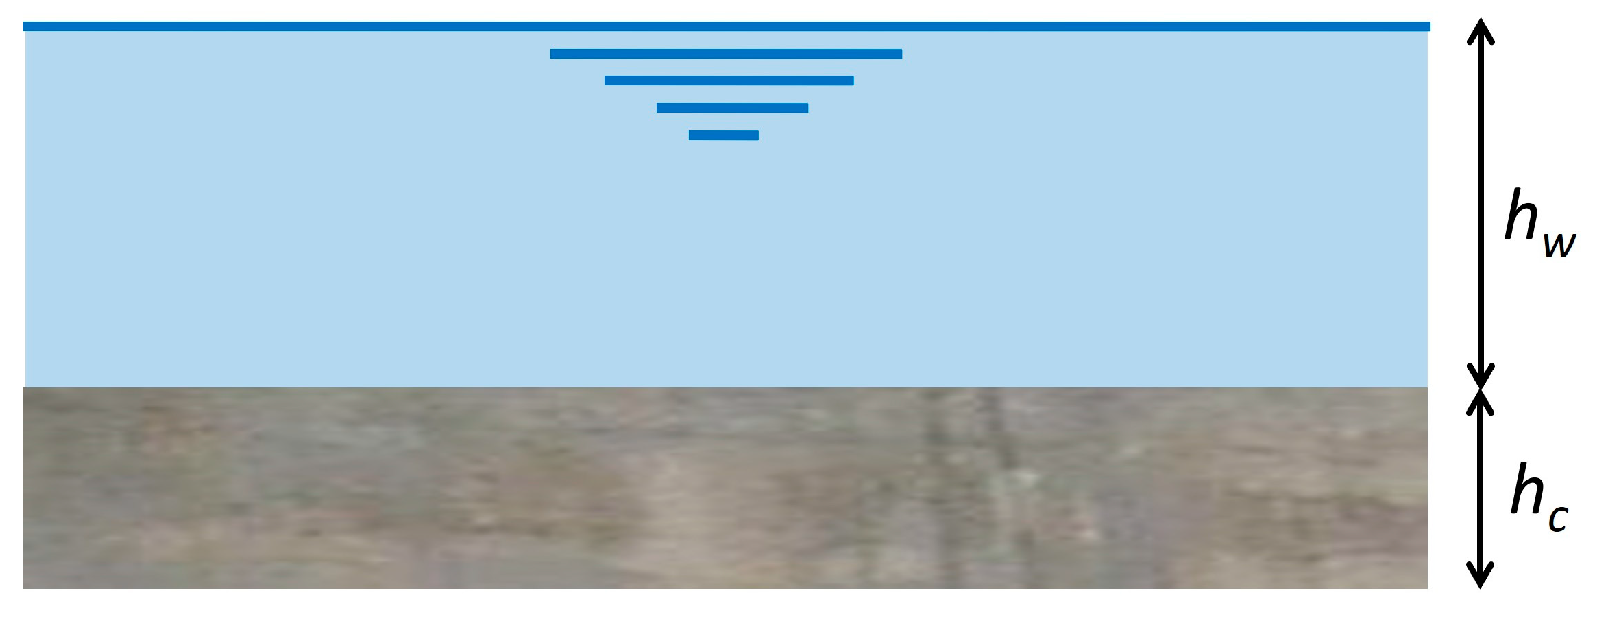
where hw is the depth of water (Figure 1), ρw is the density of water, and g is the gravitational acceleration. The basic SI units are: hw (m), hc (m), p (Pa), ρw (kg/m3), and g (m/s2).
The following relationship is derived from Equations (1)–(3):
k = K   ρ w   g μ w   ,
where µw is the dynamic viscosity of water. For water at 20 ºC, ρw = 1000 kg/m3 and µw = 0.001 Pa·s, hence the following relationship:
k 9.81 × 10 6   K   10 7   K with   k   ( m / s )   and   K   ( m 2 ) .
The intrinsic permeability, K, depends only on the porous material, whereas the hydraulic conductivity, k, depends on both the porous material and the fluid, water. Equation (5) makes it possible to derive the hydraulic conductivity from the intrinsic permeability measured using any fluid.

2.1.2. Time for Percolation and Saturation

The average water velocity, vavg, in a porous material is given by the following classical equation:
v a v g = k   i n ,
where n (dimensionless) is the porosity of the porous material.
The time, tsat, necessary to saturate a concrete specimen of thickness, hc, is equal to the time necessary for water to percolate through the specimen, tpercol, which is given by the following straightforward equation:
t s a t = t p e r c o l = h c v a v g = n   h c k   i .
Combining Equations (3) and (7) gives:
t s a t = t p e r c o l = n   ρ w   g   h c 2 k   Δ p .
The type of concrete used in reservoirs and canals has a dry density of 2400 kg/m3 and a particle density of 2700 kg/m3, hence a porosity of 0.11 (=1−2400/2700). With a 0.11 porosity, a 50 mm thick concrete specimen, and a water pressure of 105 Pa (i.e., the pressure applied by 10 m of water), Equation (8) gives a saturation time of 312 days for a concrete hydraulic conductivity of 10−12 m/s and 31 days for 10−11 m/s. This shows that saturation of a concrete specimen in a laboratory may require a significant amount of time.
More on percolation time can be found in Appendix A.

2.1.3. Extension of the Concept of Permeability to Cracked Concrete

Flow through a porous material takes place in interconnected pores. Cracks, which are frequently present in concrete, act as conduits for fluid flow, such as interconnected pores. Therefore, the properties of intrinsic permeability and hydraulic conductivity, which were defined for porous materials, can be applied to cracked concrete provided that the crack opening widths are sufficiently small to ensure laminar flow.
Concrete cracking is caused by excessive tensile stresses, which may be due to concrete shrinkage after setting and/or mechanical actions such as bending. An example of a linear stress-strain curve of unreinforced concrete is provided by Charron and Desmettre [1] (p. 11). Typical tensile characteristics of unreinforced concrete of the type used in reservoirs and canals are: tensile strength, 3 MPa; tensile strain at rupture, 0.01%; and tensile modulus, 30,000 MPa.
The concrete coefficient of thermal expansion is of the order of 1 × 10⁻⁵ K−1. Concrete setting (which follows concrete mixing) is an exothermic reaction that generates a temperature difference of the order of 30 to 50 °C (i.e., 30 to 50 K) with respect to the ambient temperature, hence a concrete expansion of 0.03 to 0.05%. Concrete shrinkage of the same amount can be expected when the concrete eventually cools down. Since 0.03 to 0.05% shrinkage exceeds the above-mentioned 0.01% strain at rupture, concrete cracking can be expected if precautions are not taken. These calculated values are consistent with experimental values of 0.025% concrete shrinkage after 40 days and 0.045% after 150 days reported by Prévost [2] (p. 11).
With time, there is a tendency of self-healing of cracks (mostly narrow cracks) which results in reduced water permeability over time due to several mechanisms, as pointed out by Desmettre and Charron [3] (p. 945): hydration by the flowing water of cement that was not hydrated during the setting period, deposition of calcite (CaCO3) in the cracks, deposition of impurities or small concrete particles in the cracks, and deposition of rust particles from reinforcing bars, if any. Based on experimental data from Desmettre [4] (p. 177), self-healing may reduce hydraulic conductivity by a factor of 2 to 5, which is significant but not sufficient to offset the effect of cracks, which may increase hydraulic conductivity by several orders of magnitude, as indicated in Section 2.2.3.

2.1.4. Measurement of Hydraulic Conductivity

Hydraulic conductivity can be measured directly in tests where water flows through a specimen of porous material or can be derived, using Equation (5), from the intrinsic permeability measured in tests where gas flows through a specimen of porous material. These two methods are discussed below.
To accurately measure the hydraulic conductivity of concrete using water flow, the concrete specimen must be saturated with water because the presence of air in the pores of unsaturated specimens hampers the flow of water. However, it may take time to achieve complete saturation of a concrete specimen in the case of concrete with low hydraulic conductivity. For example, Villar et al. [5] (p. 24) report that up to 100 days were necessary to saturate some specimens (that were previously air-dried). This is consistent with the calculation presented in Section 2.1.2. In the case of special concrete with very low hydraulic conductivity used in nuclear power plants, it is practically impossible to saturate the specimens, and a method that consists in deriving hydraulic conductivity from unsaturated flow or absorption-drying tests has been developed as indicated in publications by Coussy et al. [6], Olchitzky [7], Sanhuja and Lion [8], and Schneider et al. [9]. However, this method (which is referred to as ‘reverse modeling’) is based on assumptions that lead to very low calculated hydraulic conductivities, which can be considered questionable. This method is not appropriate in the case of the type of concrete used for water containment in reservoirs and canals, which is the type of concrete discussed in this article, and it is not used in this article.
Gases, such as nitrogen, oxygen, argon and methane, are used to measure the intrinsic permeability of concrete. According to Picandet et al. [10] (p. 2), using gas flow to measure concrete permeability is faster and easier than using water flow. However, it is difficult to obtain a reliable value of intrinsic permeability using gas flow for two main reasons, which are discussed below.
The first reason is that the flow of gas is affected by the presence of water in the concrete, which is quantified by the degree of saturation of the concrete specimen being tested. The presence of water in the pores of the concrete hampers the flow of gas to a degree that depends on the degree of saturation of the concrete. As pointed out by Chen [11] (p. 31) and Desmettre [4] (p. 21), the higher the degree of saturation of the concrete, the lower the permeability measured using gas flow. This effect has been quantified by Chen [11] (p. 96): for a 50% degree of saturation, the measured permeability was 10 times lower than the intrinsic permeability obtained with dry concrete, and, for a 70% degree of saturation, the measured permeability was 100 times lower than the intrinsic permeability. A similar result was obtained by Abbas et al. [12]: for a 60% degree of saturation, the measured permeability was 10 times lower than the intrinsic permeability. In addition, water present in the pores of the concrete may generate vapor, which hampers the flow of gas and may, therefore, lead to a measured permeability lower than the intrinsic permeability. Clearly, for an accurate measure of the intrinsic permeability using gas flow, the concrete should be dry (i.e., a zero degree of saturation). However, zero degree of saturation is practically impossible to reach, in particular because the presence of humidity in concrete depends on the presence of humidity in the atmosphere. For example, Villar et al. [5] (p. 13) mention that, even after 300 days, it was not possible to completely dry concrete specimens, and Picandet et al. [10] used several cycles of drying for a total of more than six months. In fact, it may not be appropriate to reach a zero degree of saturation, which could alter the specimen to be tested. Therefore, permeability measurements must be made at different degrees of saturation, as low as possible, and the intrinsic permeability is obtained by extrapolation to a zero degree of saturation.
The second reason is that the flow of gas is purely viscous only if the pressure is infinite. This is known as the Klinkenberg effect [13]: the measured permeability is higher than the intrinsic permeability, and it is a linear function of the inverse of gas pressure. Therefore, intrinsic permeability is the extrapolated value of the measured permeabilities for infinite gas pressure. Thus, if the permeability of concrete specimens is measured with gas, it should be measured with different gas pressures. The measured permeabilities plotted as a function of the inverse of gas pressure form a straight line, and the intrinsic permeability is obtained by extrapolating the measured permeabilities to zero inverse gas pressure, as indicated by Picandet et al. [10] (p. 8) and Picandet [14] (p. 35).
In conclusion: (1) when the permeability of concrete is measured using gas flow, there is a risk of overestimating the intrinsic permeability if the inverse gas-pressure extrapolation described above is not done and a risk of underestimating the intrinsic permeability if the concrete contains humidity; and (2) when the permeability of concrete is measured using water flow, there is a risk of underestimation of the hydraulic conductivity if the concrete is not saturated with water. Clearly, significant errors are possible. Therefore, testing to evaluate concrete permeability requires great precautions and careful interpretation.

2.1.5. Organization of Section 2

In accordance with the scope of Section 2, Materials and Methods, Section 2.2 is devoted to materials as it provides data on concrete hydraulic conductivity, whereas Section 2.3 is devoted to methods as it presents an analysis to quantify the influence of cracking on concrete hydraulic conductivity.

2.2. Data on Concrete Hydraulic Conductivity

2.2.1. Collection of Data and Limitations

The data on hydraulic conductivity presented in Section 2.2 were selected from an extensive review of published data on tests performed in accordance with the methods described in Section 2.1.4. Most of the data reported are related to unreinforced concrete. However, some results concerning steel-fiber reinforced concrete are presented, but concrete reinforced with steel bars is not considered. Some results for ‘high-performance concretes’, such as those used in nuclear power plants, may be mentioned for the sake of comparison, but they are not relevant to the type of concrete used in reservoirs and canals, as indicated in Section 2.1.4. The results are presented in Section 2.2.2 for concrete without cracks (or with cracks that were too thin to be detected) and Section 2.2.3 for concrete with cracks.

2.2.2. Data on the Hydraulic Conductivity of Concrete Without Cracks

Published data on the hydraulic conductivity measured using water flow through concrete specimens without detected cracks include the following:
  • Picandet [14] (p. 215) gives the following values, for the hydraulic conductivity of concrete without detected cracks, measured with water flow on specimens with a diameter of 110 mm: k = 9 × 10⁻¹¹ m/s for typical concrete; k = 2 × 10⁻¹¹ m/s for ‘high performance concrete’ without fibers; and k = 1.5 × 10⁻¹¹ m/s for ‘high-performance concrete’ with 1% steel fibers, 30 mm long and 0.38 mm diameter (1% steel fibers = 79 kg/m3). Porosities indicated by Picandet [14] (p. 77) are 12% for typical concrete and 10% for ‘high-performance concrete’, with or without fibers.
  • Carmichael and Arulraj [15] (p. 135) tested 115 mm diameter specimens of four different grades of concrete, and the hydraulic conductivity measured with water flow ranged between 3.4 and 8.7 × 10⁻¹¹ m/s. Carmichael and Arulraj [15] also tested concrete containing nano-cement, which is cement with extremely small particles, of the order of 1 to 100 nanometers (i.e., 100 to 1000 times smaller than typical cement particles). Nano-cement is currently not used in concrete linings for reservoirs and canals.
  • Villar et al. [5] (p. 24) summarize the results of numerous tests using water flow as follows: range of intrinsic permeability 5 × 10⁻¹⁹ to 2 × 10⁻¹⁷ m2, with an average value of 3.6 × 10⁻¹⁸ m2 for typical concrete (no fiber included). These values correspond to hydraulic conductivities ranging from 5 × 10⁻¹² to 2 × 10⁻¹⁰ m/s with an average value of 3.6 × 10⁻¹¹ m/s.
  • Desmettre [4] (p. 163) cites a hydraulic conductivity of 3.5 × 10⁻¹¹ m/s measured on 100 mm diameter specimens of “non-cracked concrete” published by Aldea et al. [16].
  • Desmettre [4] (p. 179) reports the following results of hydraulic conductivity tests for unreinforced concrete, fiber-reinforced concrete, and ‘ultra-high performance’ fiber-reinforced concrete under zero tensile stress: 2 × 10⁻¹⁰ m/s for concrete with no fiber; 1 × 10⁻¹⁰ m/s for concrete with 1% steel fibers (i.e., 79 kg/m3 of fibers); and 8 × 10⁻¹¹ m/s for concrete with 4% steel fibers (i.e., 316 kg/m3 of fibers). The effect of fibers is significant when concrete is under tension because, then, fibers reduce crack size thereby reducing the hydraulic conductivity of the concrete under tension.
Published data on hydraulic conductivity, derived using Equation (5) from intrinsic permeability measured using gas flow on concrete specimens without detected cracks, include the following:
  • Chen [11] (p. 96) measured an intrinsic permeability of K= 4.1 × 10⁻¹⁸ m2 (i.e., a hydraulic conductivity of 4.1 × 10⁻¹¹ m/s) for a dry concrete with a porosity of 8.3%.
  • Abbas et al. [12], cited by Chen [11] (p. 32), obtained an intrinsic permeability of 2.3 × 10⁻¹⁷ m2 for dry concrete, which is equivalent to a hydraulic conductivity of 2.3 × 10⁻¹⁰ m/s.
  • Villar et al. [5] (p. 14) plotted the results of numerous tests using gas flow as a function of the water content of the specimen, for water contents between 0.5 and 4.5%, and, by extrapolation to a zero water content, they obtained an intrinsic permeability equivalent to a hydraulic conductivity of 3 × 10⁻¹⁰ m/s.
In conclusion, the hydraulic conductivities for concrete with no cracks measured with water flow and gas flow are somewhat consistent. A summary of the above values of hydraulic conductivities of concrete with no cracks is presented in Section 3.2.

2.2.3. Data on the Hydraulic Conductivity of Cracked Concrete

Published data on the hydraulic conductivity of concrete specimens with cracks are summarized below. In some cases, the crack opening width is reported and, in other cases, the concrete strain is reported. It is important to note that the reported strain is only an apparent strain, as discussed in Section 2.3.3. The relevant published data are:
  • Picandet et al. [10] used gas flow on concrete specimens with a 110 mm diameter. The measured permeabilities for five different gas pressures (from 125 to 250 kPa) were plotted as a function of the inverse of gas pressure, as indicated in Section 2.1.4, and the intrinsic permeability was obtained by extrapolation to zero inverse gas pressure [10] (p. 8) and converted into hydraulic conductivity using Equation (5). It was thus found [10] (p. 12) that, for typical concrete, the hydraulic conductivity varied slightly (i.e., by a factor 2) between zero strain (5 × 10⁻¹⁰ m/s) and 0.16% strain (1 × 10⁻⁹ m/s), and varied greatly (i.e., by a factor 5) from 1 × 10⁻⁹ m/s to 5 × 10⁻⁹ m/s for strains ranging from 0.16% to 0.2%. In the case of fiber-reinforced concrete, a similar trend was observed, but the threshold strain, below which the hydraulic conductivity increase is slight, was 0.27% rather than 0.16%.
  • Gérard [17], cited by Desmettre [4] (p. 35), measured the hydraulic conductivity of unreinforced concrete subjected to tensile force using 110-mm diameter specimens and obtained: k = 10−12 m/s for 0% strain; k = 10−10 m/s for 0.015% strain; k = 10−9 m/s for 0.023% strain; k = 10−8 m/s for 0.041% strain; k = 10−7 m/s for 0.08% strain; and k = 10−6 m/s for 0.14% strain.
  • Hubert et al. [18] (pp. 2800–2801) report the following: hydraulic conductivity lower than 10−10 m/s for unreinforced and fiber-reinforced concrete with no cracks; hydraulic conductivity with a maximum crack opening width, wmax, of 0.15 mm, k = 3.6 × 10⁻⁶ m/s for concrete with no fiber, k = 2.5 × 10⁻⁶ m/s for concrete with 0.75% fiber, and k = 1.0 × 10⁻⁶ m/s for concrete with 1.5% fiber. Hubert et al. [18] (p. 2802), also noted that the hydraulic conductivity increases as a function of the third power of crack opening width, in accordance with Poiseuille’s equation (see Section 2.3.4). In addition, Hubert et al. [18] noted that more fibers result in more cracks having narrower openings, hence a generally lower hydraulic conductivity.
  • Tests reported by Prévost [2] (p. 105) are particularly interesting because the specimen is 630 mm long, which allows for a representative measurement of the permeability of concrete with several cracks. For concrete with no fiber, no tension, and no visible crack, the measured hydraulic conductivity was k = 1.2 × 10⁻¹⁰ m/s. For increasing tensile force on the same specimen, the measured hydraulic conductivities (as a function of the maximum crack opening width in parentheses) were: 4.1 × 10⁻⁷ m/s (0.09 mm); 3.4 × 10⁻⁶ m/s (0.19 mm); 6.7 × 10⁻⁶ m/s (0.25 mm); and 9.7 × 10⁻⁶ m/s (0.34 mm). Similar tests on fiber-reinforced concrete (with 59 kg/m3 of steel fibers, which is equivalent to 0.75% per volume) showed, under the same applied tensile forces, a maximum crack width 5 times narrower and a hydraulic conductivity 200 to 300 times lower. Fiber reinforcement in concrete results in reduced crack opening width, reduced spacing between cracks, and reduced hydraulic conductivity.
A summary of the above hydraulic conductivities for cracked concrete is provided in Section 3.2.

2.3. Analysis of Water Flow Through Cracked Concrete

2.3.1. Theoretical Analysis of Permeability

In the analysis presented hereafter, Poiseuille’s equation is used to quantify the flow of water in a crack. Similar to Darcy’s equation, Poiseuille’s equation is derived from the Navier–Stokes equations, which are the partial differential equations that quantify the flow of viscous fluids that obey Newton’s law of viscosity. The only difference between Darcy’s equation and Poiseuille’s equation is that they were developed for different boundary conditions: the tortuous paths that a fluid follows when it flows through a porous medium for Darcy’s equation and the straight path that a fluid follows when it flows between two parallel planes. It is, therefore, appropriate in the study presented in this article to use Darcy’s equation to quantify the flow rate through the interconnected pores of a concrete lining and to use Poiseuille’s equation to quantify the flow rate through the cracks of a concrete lining.
It should be noted that Darcy’s equation was historically designated as Darcy’s law because it was discovered experimentally. Since it has eventually been demonstrated, it should be designated as Darcy’s equation.
Both Darcy’s equation and Poiseuille’s equation were developed with the assumption that the flow is laminar. Therefore, in the case of a concrete lining area sufficiently large to include a large number of cracks sufficiently narrow to ensure laminar flow, using Poiseuille’s equation for every crack is equivalent to using Darcy’s equation all at once for the entire concrete lining. In other words, a cracked concrete lining can be characterized by an equivalent hydraulic conductivity, simply called ‘hydraulic conductivity’.

2.3.2. Considered Pattern of Cracks

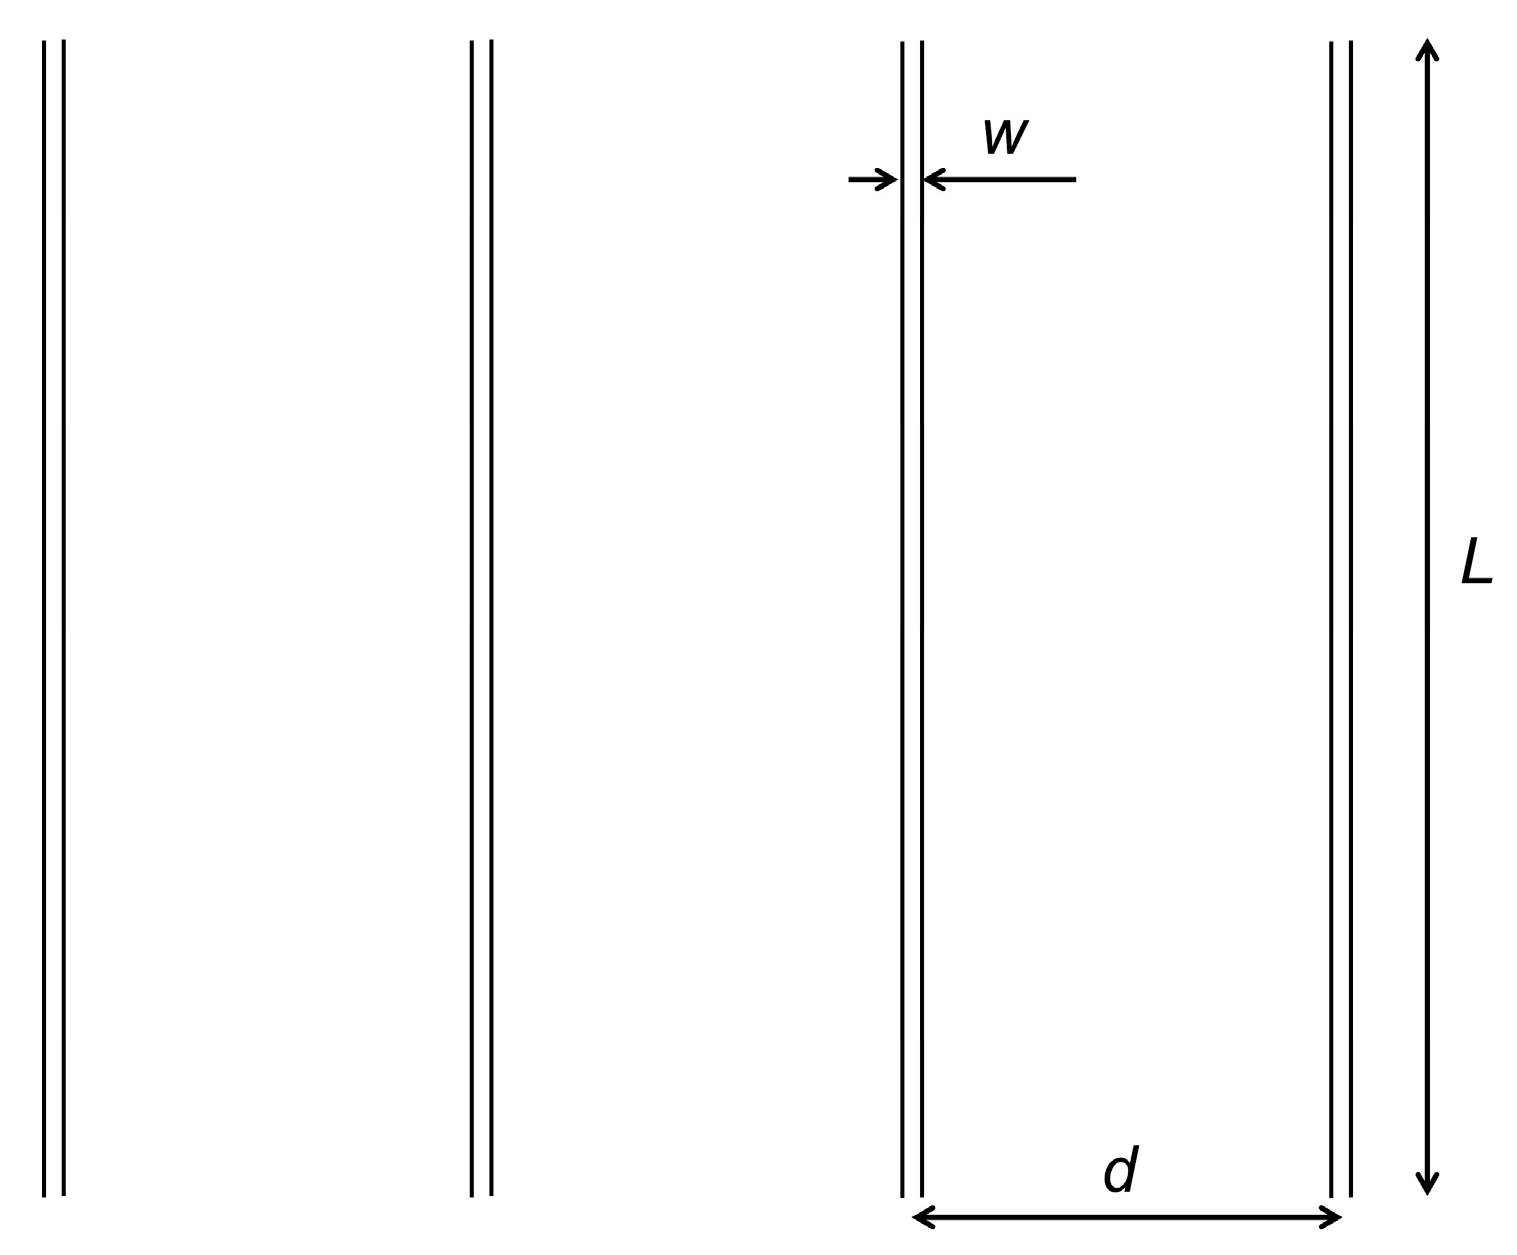
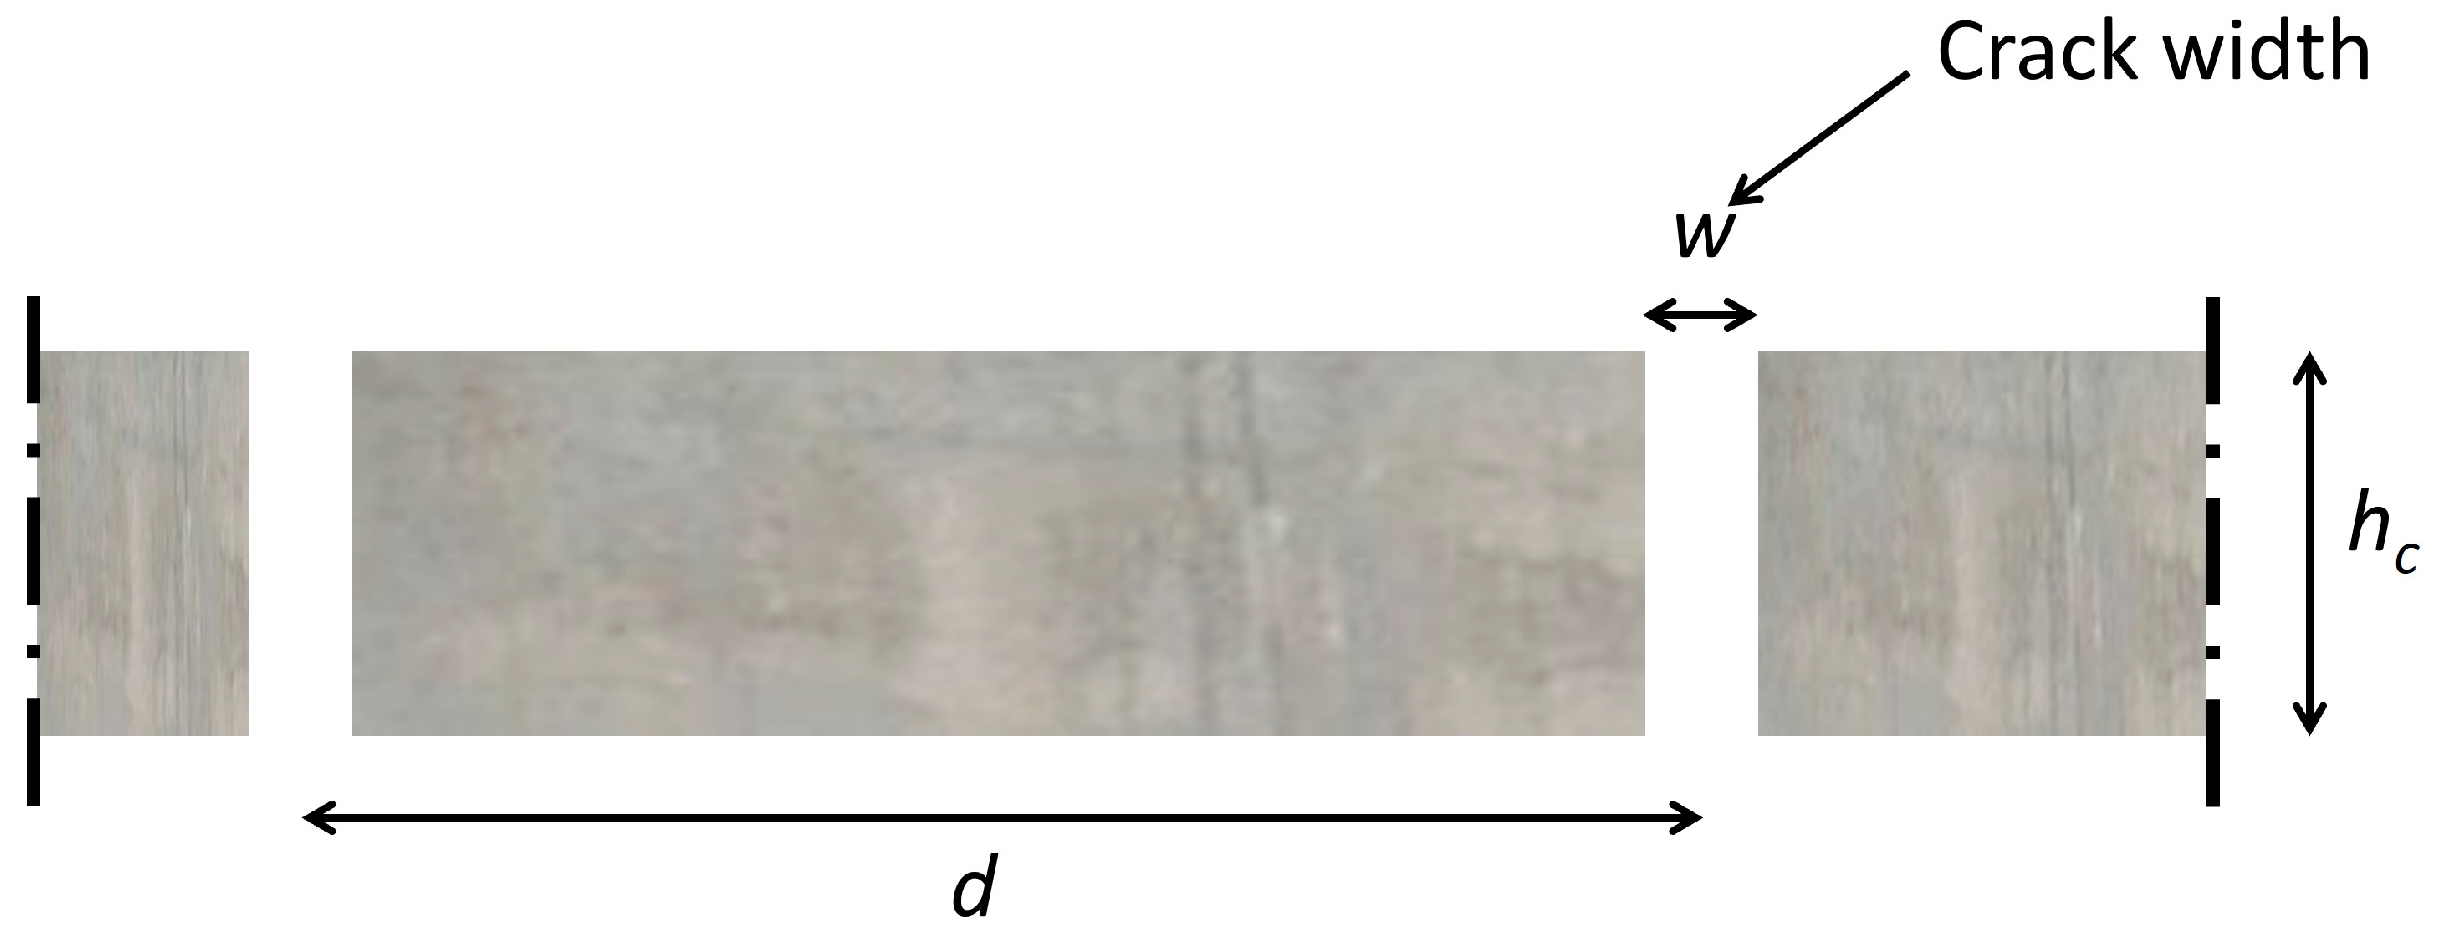
The typical pattern of parallel cracks defined in Figure 2 and Figure 3 is considered. All cracks are assumed to have the same opening width, w, and the same length, L. The cracks are assumed to be equally spaced, with a center-to-center spacing, d.

2.3.3. Geometrical Relationships

The length of cracks per unit area of lining is given by the following equation:
L A = 1 d   ,
where A is the considered area of the concrete layer.
The development of cracks in a concrete specimen results in an increase in the length of the specimen. Hence the concept of apparent strain, ε, which is the ratio of the increase in length of a specimen due to cracking and the length of the specimen. The apparent strain of a specimen of cracked concrete is expressed by the following equation since it is assumed in the model that all cracks have the same opening width and are equally spaced:
ε = w d   .
For example, the apparent strain is 0.0001 (i.e., 0.01%) in the case of 0.05 mm wide cracks located every 0.5 m. This is a small apparent strain. However, the resulting increase in flow rate can be significant, as shown in subsequent sections of this article.

2.3.4. Water Flow in a Crack

The water flow rate per unit length of crack can be expressed using the classical Poiseuille’s equation for laminar flow, which can be written as follows:
Q C R A C K L = ξ   ρ w   g   w 3   h w + h c 12   μ w   h c ,
where QCRACK is the flow rate in one crack, ξ is a factor that quantifies the effect on flow of the tortuosity and rugosity of the crack, ρw is the density of water, g is the gravitational acceleration, hc is the thickness of the concrete lining, and μw is the dynamic viscosity of water. The basic SI units are: QCRACK (m3/s), L (m), ρw (kg/m3), g (m/s2), w (m), hw (m), hc (m), and μw (Pa·s); ξ is dimensionless
Combining Equations (9) and (11) gives the rate of leakage per unit area of lining due to cracks, qcc, as follows:
q c c = Q C R A C K A = Q C R A C K L L A = ξ   ρ w   g   w 3 12   d   μ w h w + h c h c   ,
This leakage rate due to cracks can be expressed as follows by combining Equations (10) and (12):
q c c = ξ   ρ w   g   w 2   ε 12   μ w h w + h c h c .
It should be noted that, for leakage calculations, the cracks must be characterized by three parameters: the crack tortuosity and rugosity factor, ξ; the crack opening width, w; and a parameter that represents the amount of cracking, either the distance between cracks, d, or the apparent strain, ε.

2.3.5. Hydraulic Conductivity of Cracked Concrete

Assuming that Darcy’s equation is applicable, as discussed above in Section 2.3.1, the hydraulic conductivity of cracked concrete is given by the following equation:
k c c = q c c i ,
where the hydraulic gradient, i, is given by Equation (3).
Combining Equations (3) and (12)–(14) gives the following hydraulic conductivity for cracked concrete:
k c c = ξ 12 ρ w   g μ w w 3 d = ξ 12 ρ w   g μ w ε   w 2   .
With ρw = 1000 kg/m3, μw = 1 × 10⁻³ Pa·s, and g = 9.81 m/s2, Equation (15) becomes:
k c c = 817,500   ξ w 3 d = 817,500   ξ   ε   w 2 with   k   in   m / s ,   and   w   and   d   in   m   .

2.3.6. Tortuosity and Rugosity Factor

A thorough experimental study of concrete cracks has been performed by Rastiello in 2013 [19] and published by Rastiello et al. in 2014 [20]. However, the published values of the dimensionless factor for tortuosity and rugosity of the cracks, ξ, were questioned by the author of this article in 2017. The following revised values of the factor for tortuosity and rugosity of the cracks were published in 2018 by Rastiello et al. [21]:
ξ = 1 / 3 × 10 5   w 1.19   with   w ( m ) ,   for   the   case   w 0.158   mm   ,
ξ = 1   for   the   case   w 0.158   mm   .
A few numerical values of the dimensionless factor for tortuosity and rugosity of the cracks, ξ, as a function of the opening width of the cracks, w, calculated using Equation (17) are: ξ = 0.037 for w = 0.01 mm; 0.111 for w = 0.025 mm; 0.254 for w = 0.05 mm; 0.579 for w = 0.1 mm; and 1.000 for w = 0.158 mm. These numerical values show that, for cracks narrower than 0.158 mm, the calculated hydraulic conductivity of cracked concrete, kcc, is significantly reduced if tortuosity and rugosity are taken into account.

3. Results

3.1. Overview of the Results of the Study

This study provides two types of information in Section 2 on materials and methods: information on materials in the form of experimental values of concrete hydraulic conductivity in Section 2.2 and information on methods in the form of original equations for evaluating the hydraulic conductivity of cracked concrete in Section 2.3. In this Section 3 on results, data on concrete hydraulic conductivity are summarized in Section 3.2, practical equations, derived from the theoretical analysis developed in Section 2.3, are presented in Section 3.3 and used in Section 3.4 where calculated and experimental values of hydraulic conductivity of cracked concrete are compared.

3.2. Summary of Data on Concrete Hydraulic Conductivity

The data on the hydraulic conductivity of concrete typically used in water containment structures such as reservoirs and canals, reviewed in Section 2.2, are summarized below.
The measured hydraulic conductivities for concrete typically used in reservoirs and canals with no cracks are generally between 5 × 10⁻¹² and 5 × 10⁻¹⁰ m/s, mostly between 1 × 10⁻¹¹ and 1 × 10⁻¹⁰ m/s. In simple terms, it is possible to consider that the concrete typically used in reservoirs and canals has a hydraulic conductivity of the order of 10−11 m/s if it is used in correctly constructed linings and has no cracks. It should be noted that concrete reported as non-cracked may have microcracks, not visible at the naked eye, that may increase its hydraulic conductivity.
The data on concrete hydraulic conductivity for concrete with cracks can be summarized as follows:
  • Concrete with 0.1 mm cracks: 1 × 10⁻⁷ to 1 × 10⁻⁶ m/s.
  • Concrete with 0.2 mm cracks: 1 × 10⁻⁶ to 1 × 10⁻⁵ m/s.
  • Concrete with 0.3 mm cracks: 1 × 10⁻⁵ m/s.
In addition, it is important to note that hydraulic conductivities of cracked concrete reported as a function of strain are potentially misleading because the same strain can correspond to different crack opening widths and, therefore, significantly different hydraulic conductivities, as discussed hereafter in Section 3.4.

3.3. Practical Equations for the Hydraulic Conductivity of Cracked Concrete

Combining Equations (16)–(18) gives the following equations for the hydraulic conductivity of cracked concrete, kcc, in m/s:
k c c = 2.725 × 10 10 w 4.19 d   with   w   and   d   in   m   if   w 0.158   mm .
k c c = 817,500 w 3 d   with   w   and   d   in   m   if   w 0.158   mm   .
Combining Equations (10), (19), and (20) gives the following equations for the hydraulic conductivity of cracked concrete, kcc, in m/s:
k c c = 2.725 × 10 10   ε   w 3.19       with   w   in   m   if   w 0.158   mm .
k c c = 817,500   ε   w 2       with   w   in   m   if   w 0.158   mm   .
As it may be convenient to use mm rather than m, the preceding equations for the hydraulic conductivity of cracked concrete, kcc, in m/s become:
k c c = 7.3345 w 4.19 d with   w   and   d   in   mm   if   w 0.158   mm .
k c c = 0.8175 w 3 d with   w   and   d   in   mm   if   w 0.158   mm   .
k c c = 7.3345   ε   w 3.19       with   w   in   mm   if   w 0.158   mm   .
k c c = 0.8175   ε   w 2       with   w in   mm   if   w 0.158   mm   .

3.4. Comparison of Calculated and Measured Concrete Hydraulic Conductivities

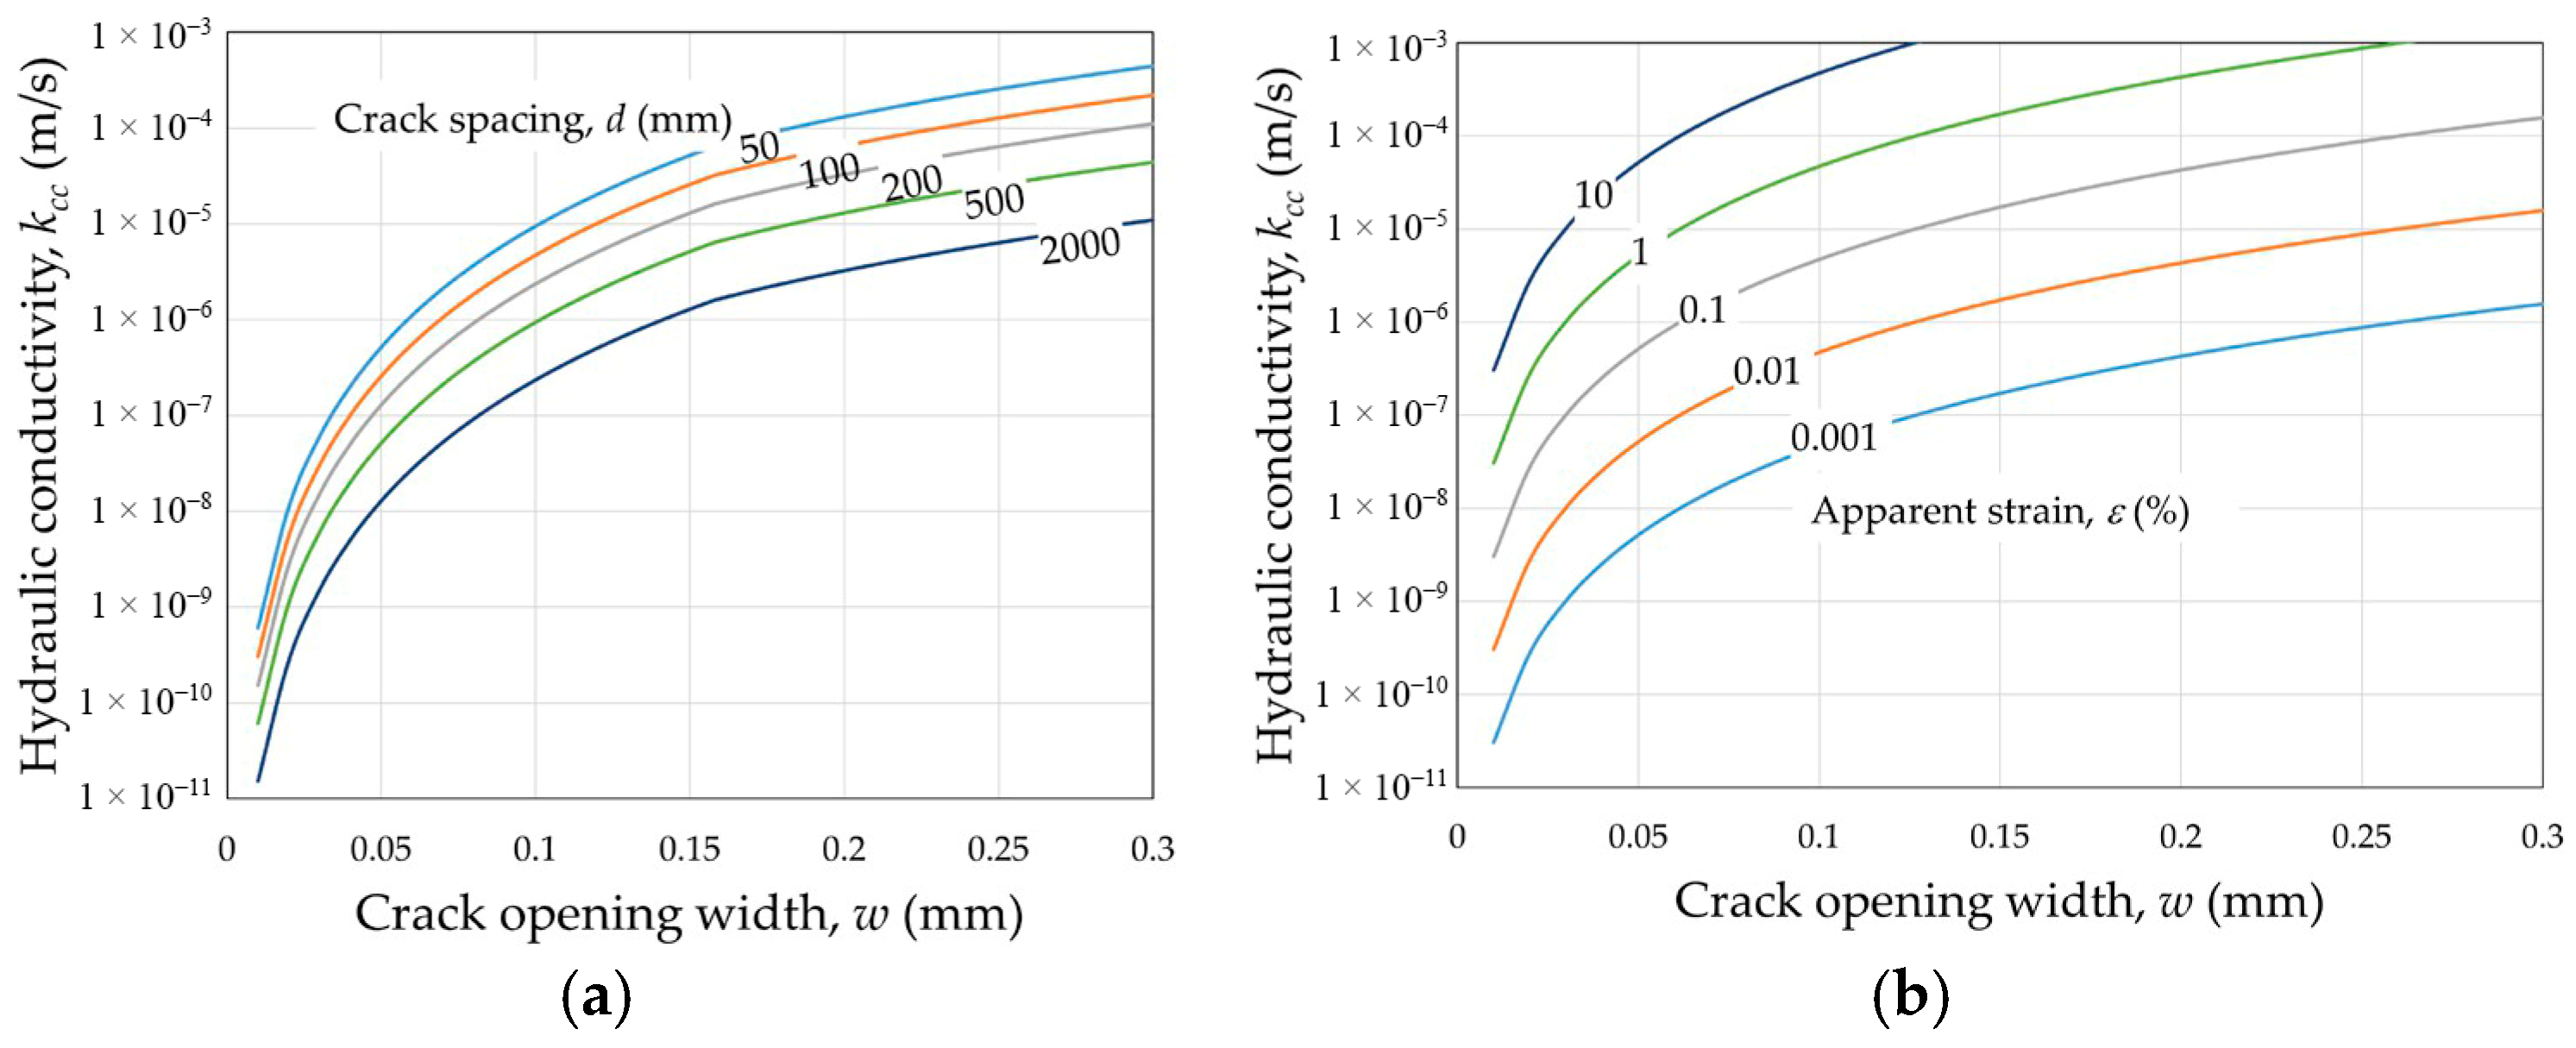
Values of hydraulic conductivity of cracked concrete as a function of crack opening width, calculated with Equation (23) for w ≤ 0.158 mm and Equation (24) for w ≥ 0.158 mm, are presented in Figure 4. The curves of Figure 4a quantify the influence of crack spacing and the curves of Figure 4b quantify the influence of the apparent strain defined by Equation (10) as the ratio of crack opening width and crack spacing.
The calculated values presented in Figure 4 are in agreement with the measured values summarized in Section 3.2 for cracked concrete.
In Figure 4a, it can be seen that the hydraulic conductivity values for crack opening widths of 0.1, 0.2 and 0.3 mm mentioned in Section 3.2 correspond to the curve for a crack spacing of 2000 mm. This may be explained by the fact that the measured values were obtained on relatively small specimens with possibly only one crack.
Figure 4b shows that, for a given apparent strain, the hydraulic conductivity of a cracked concrete may vary by several orders of magnitude depending on the crack opening width. Clearly, tests that provide the hydraulic conductivity of cracked concrete, without providing a measure of crack opening width, give incomplete information. Figure 4b also shows that strains of 0.03 to 0.05%, which may be caused by cooling after setting of concrete (as indicated in Section 2.1.3), may increase the concrete hydraulic conductivity to 10−9 m/s for crack opening widths as low as 0.01 mm (i.e., 10 μm).

4. Discussion

The agreement between experimental and calculated values of concrete hydraulic conductivity shows that the equations presented in this article are reliable. Furthermore, the use of equations is efficient. In comparison, measurements are time-consuming and require specialized equipment. Equations make it possible to easily evaluate the effect of the two main parameters, the crack opening width and the crack spacing. This is particularly true for the effect of crack spacing because the size of specimens often used (approximately 100 mm diameter) is not sufficient to evaluate this important parameter.
Even though experimental data are essential, it should be remembered that testing errors are possible, in particular with the use of gas flow to determine intrinsic permeability, as discussed in Section 2.1.4. In addition, users of the experimental data and equations provided in this article should remember that self-healing of cracks may decrease leakage rates through cracked concrete, as discussed in Section 2.1.3.
This article has also pointed out that very low values of hydraulic conductivity reported for ‘high-performance concrete’ typically used in nuclear power plants are not relevant to the type of concrete used in water containment structures such as reservoirs and canals because such ‘high-performance concrete’ is not used in reservoirs and canals and because the reverse modeling analysis used to generate these very low hydraulic conductivity values is based on assumptions that lead to hydraulic conductivities that can be considered questionable, as pointed out in Section 2.1.4.
This article provides the following orders of magnitude of hydraulic conductivities that can be used by engineers designing concrete linings for reservoirs and canals:
  • Concrete with no cracks: 10−11 m/s.
  • Concrete with invisible cracks due to uncontrolled cooling after setting: 10−9 m/s.
  • Concrete with cracks due to typical mechanical stresses: 10−7 to 10−5 m/s.
The hydraulic conductivity of concrete, with the cracks often present in the field, even shortly after construction, is significantly higher than the low hydraulic conductivity usually considered.
Soils having a hydraulic conductivity of the order of 10−6 m/s are erodible. Therefore, there is a risk of progressive deterioration of the soil supporting a concrete lining if crack opening widths exceed approximately 0.2 mm, based on Figure 4a, which shows a hydraulic conductivity higher than 1×10⁻⁶ m/s for a crack opening width of 0.2mm. Thus, in concrete-lined irrigation canals constructed with inadequate quality control due to low budget, water leakage through concrete cracks has led to extensive erosion of the supporting soil and, consequently, deformation of the concrete lining causing more cracking and progressive disintegration of the lining, resulting in considerable water and economic losses. Clearly, it is important to understand and quantify the mechanism of concrete cracking.

Funding

This research received no external funding.

Data Availability Statement

The original contributions presented in this study are included in the article. Further inquiries can be directed to the corresponding author.

Acknowledgments

The author is grateful to E. Blond for a thorough review and numerous valuable comments, and to G. Rastiello and H. Plusquellec for their review of this article.

Conflicts of Interest

The author declares no conflicts of interest in the design of the study; in the collection, analyses and interpretation of data; and in the writing and publication of this article.

Appendix A. Water Percolation Time in a Crack

The velocity of water in a crack, vCRACK, is expressed by the flow rate in a crack, QCRACK, divided by the cross-sectional area of the crack, wL (Figure 2). Hence, from Equation (11):
v C R A C K = Q C R A C K w   L = ξ   ρ w   g   w 2 12   μ w i   .
With the hydraulic gradient, i, from Equation (3), Equation (A1) becomes:
v C R A C K = ξ   ρ w   g   w 2 12   μ w Δ p ρ w   g   h c = ξ   w 2 12   μ w Δ p h c   .
The percolation time in a crack, tpercol, is the time needed by water to flow in the crack from the top to the bottom of a cracked concrete lining or a laboratory specimen, hence:
t p e r c o l = h c v C R A C K = 12   μ w ξ   Δ p h c w 2 .
With the dynamic viscosity of water, μw = 10−3 Pa·s, and the tortuosity and rugosity factor, ξ, for cracks narrower than 0.158 mm given by Equation (17), Equation (A3) gives the percolation time as follows:
t p e r c o l = 3.6 × 10 7   h c 2 w 3.19   Δ p   with   t p e r c o l ( s ) ,   w ( m ) , h c ( m )   and   Δ p ( Pa ) .
For a pressure Δp = 100 kPa applied to a 50 mm thick laboratory concrete specimen, Equation (A4) becomes:
t p e r c o l = 9 × 10 15 w 3.19 with   t p e r c o l ( s )   and   w ( m ) .
For example, a percolation time of 80 s is calculated using Equation (A5) in the case of a 50 mm thick laboratory concrete specimen with 10 μm wide cracks subjected to a water pressure of 100 kPa. This percolation time is four orders of magnitude lower than the 31 days calculated in Section 2.1.2 for a 50 mm thick laboratory concrete specimen without cracks and a typical hydraulic conductivity of 10−11 m/s.
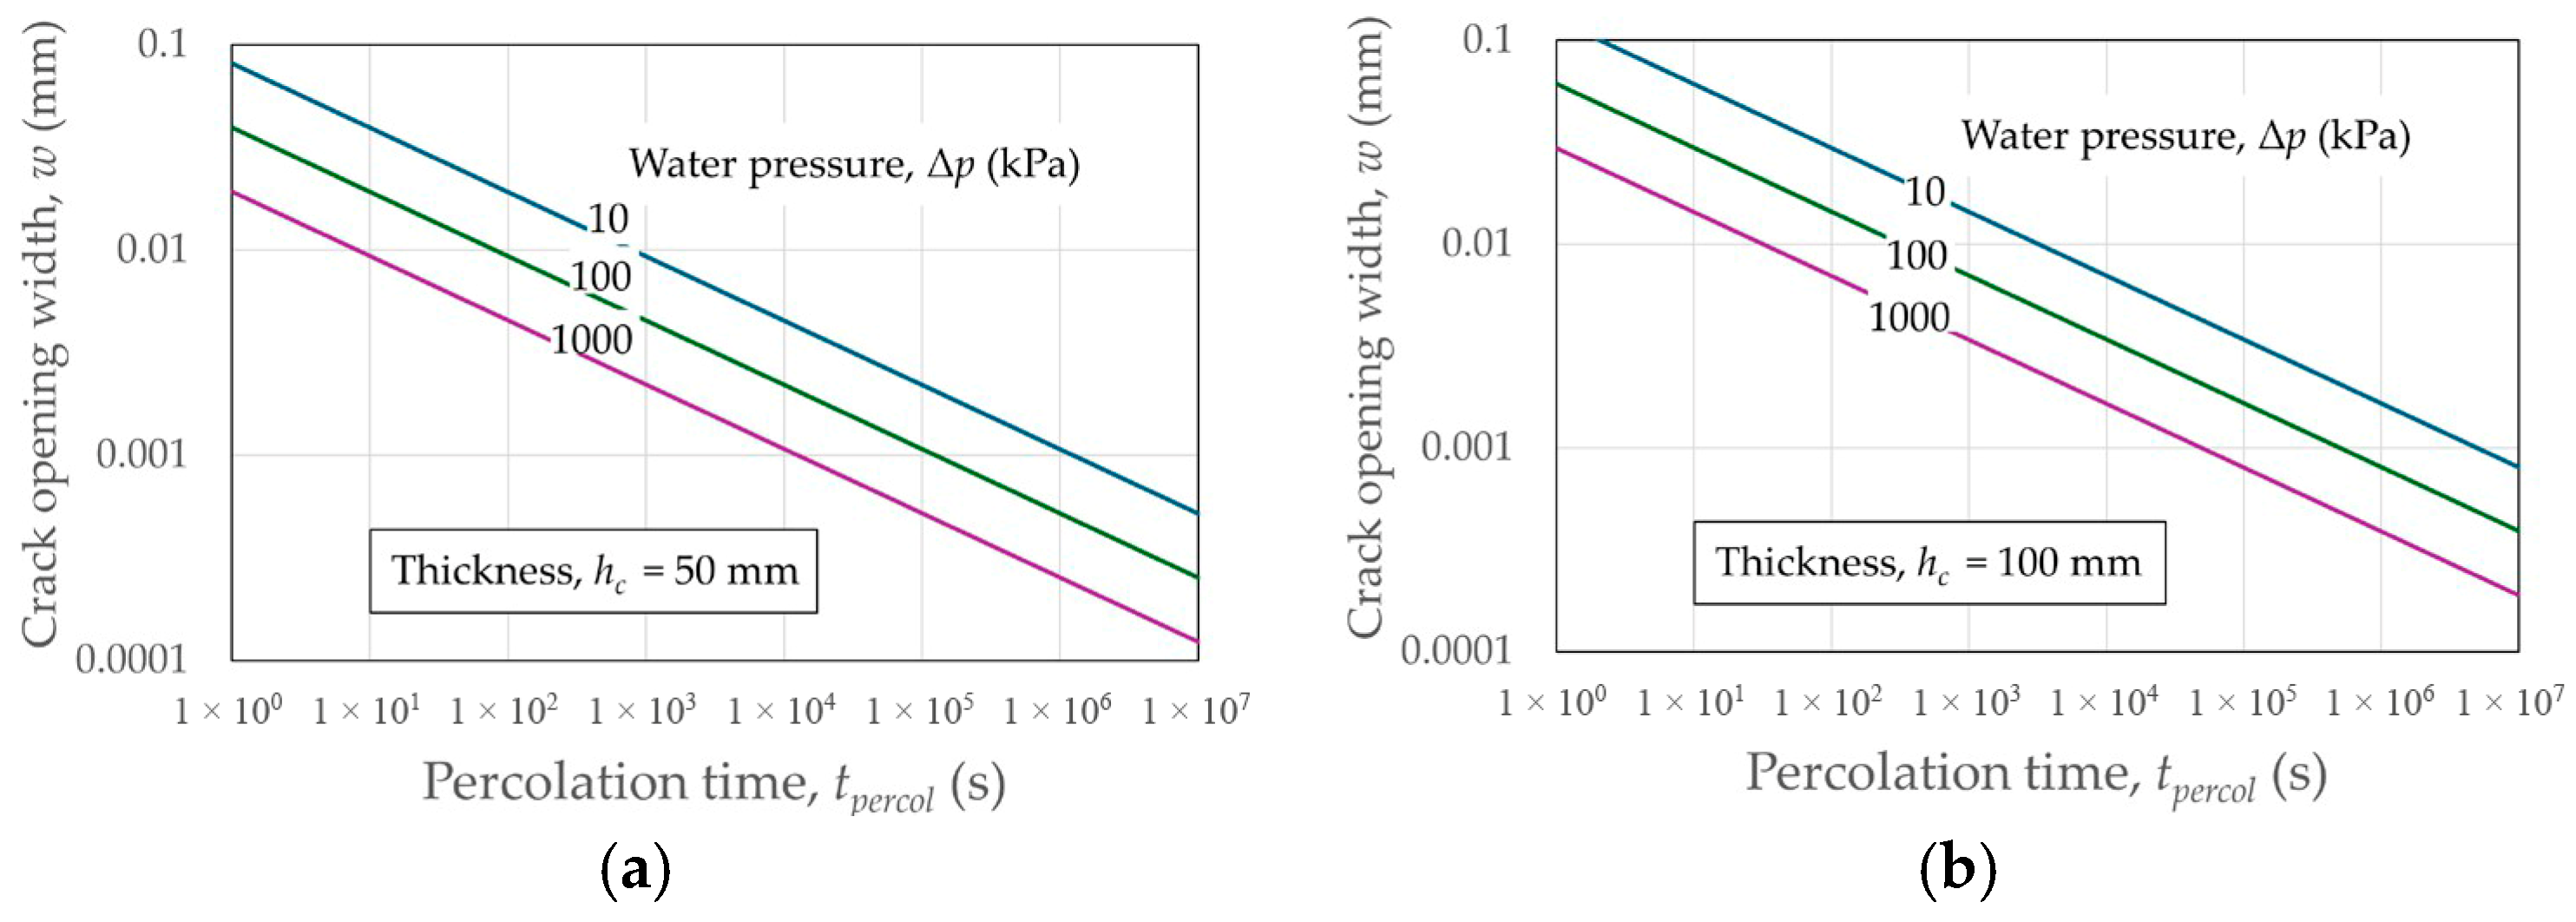
Equation (A4) can be written as follows to derive the opening width of a crack from a measurement of water percolation time, a derivation that complements direct measurements of opening widths of cracks, which may be difficult:
w = 9.55 h c 2 t p e r c o l Δ p 1 / 3.19 with   w ( mm ) , h c ( m ) ,   t p e r c o l ( s )   and   Δ p ( Pa ) .
For example, if a 100 mm thick concrete lining is exposed to 1 m of water, that is a pressure of 10 kPa, and if percolation is observed on the other face of the lining after 30 min (1800 s), the above equation gives a crack opening width of 0.012 mm (12 μm). This crack is not visible to the naked eye and would, therefore, be difficult to measure. Other cracks in the same lining, with higher percolation times, would be narrower.
Numerical values calculated using Equation (A6) are presented in Figure A1.
Figure A1. Crack opening width, w (mm) as a function of percolation time, tpercol (s) for different water pressures, Δp (kPa), calculated using Equation (A6): (a) for a 50 mm thick laboratory concrete specimen; (b) for a 100 mm thick concrete lining.
Constrmater 06 00025 g0a1

References

  1. Charron, J.P.; Desmettre, C. Intérêt de l’Utilisation des Bétons Renforcés de Fibres Pour la Construction d’Ouvrages d’Art Durables; Rapport de Recherche SR13-01; Polytechnique Montréal: Montreal, QC, Canada, 2013; p. 40. [Google Scholar]
  2. Prévost, M.O. Étude de la Pénétration de l’eau Dans le Béton Armé Sous Sollicitations Mécaniques et Environnementales. Master’s Thesis, Département des Génies Civil, Géologique et des Mines, École Polytechnique de Montréal, Montreal, QC, Canada, 2018; p. 138. [Google Scholar]
  3. Desmettre, C.; Charron, J.P. Water permeability of reinforced concrete with and without fiber subjected to static and constant tensile loading. Cem. Concr. Res. 2012, 42, 945–952. [Google Scholar] [CrossRef] [Scilit]
  4. Desmettre, C. Contribution à L’étude de la Perméabilité du Béton Armé Sous Sollicitations Statiques et Cycliques. Ph.D. Thesis, École Polytechnique de Montréal, Université de Montréal, Montreal, QC, Canada, 2012; p. 217. [Google Scholar]
  5. Villar, M.V.; Martín, P.L.; Romero, F.J.; Gutiérrez-Rodrigo, V.; Barcala, J.M. Gas and Water Permeability of Concrete; Informes Técnicos Ciemat 1261; Ministerio de Economía y Competitividad: Madrid, Spain, 2012; p. 45. [Google Scholar]
  6. Coussy, O.; Baroghel-Bouny, V.; Dangla, P.; Mainguy, M. Evaluation de la perméabilité à l’eau liquide des bétons à partir de leur perte de masse durant le séchage. Rev. Française Génie Civ. 2001, 5, 269–284. [Google Scholar] [CrossRef]
  7. Olchitzky, E. Couplage Hydromécanique et Perméabilité d’une Argile Gonflante non Saturée Sous Sollicitations Hydriques et Thermiques; Courbe de Sorption et Perméabilité à l’eau. Ph.D. Thesis, École des Ponts Paris Tech, Paris, France, 2002; p. 183. [Google Scholar]
  8. Sanahuja, J.; Lion, M. Modélisation à partir d’essais sur éprouvettes de la teneur en eau résiduelle d’une structure béton exposée à plusieurs ambiances environnementales. In Proceedings of the 23rd Congrès de Mécanique, Lille, France, 1 September 2017; p. 12. [Google Scholar]
  9. Schneider, S.; Mallants, D.; Jacques, D. Determining hydraulic properties of concrete and mortar by inverse modelling. MRS Online Proc. Libr. 2012, 1475, 367–372. [Google Scholar] [CrossRef] [Scilit]
  10. Picandet, V.; Khelidj, A.; Bastian, G. Perméabilité au gaz de bétons endommagés: Interprétation de résultats expérimentaux. Rev. Française Génie Civ. 2002, 6, 525–544. [Google Scholar] [CrossRef] [Scilit]
  11. Chen, W. Étude Expérimentale de la Perméabilité du Béton Sous Conditions Thermiques et Hydriques Variables. Master’s Thesis, École Centrale de Lille, Lille, France, 2011; p. 169. [Google Scholar]
  12. Abbas, A.; Carcassès, M.; Ollivier, J.P. Gas permeability of concrete in relation to its degree of saturation. Mater. Struct. 1999, 32, 3–8. [Google Scholar] [CrossRef] [Scilit]
  13. Klinkenberg, L.J. The permeability of porous media to liquid and gases. Drill. Prod. Pract. 1941, 200–213. [Google Scholar] [CrossRef] [Scilit]
  14. Picandet, V. Influence d’un Endommagement Mécanique sur la Perméabilité et sur la Diffusivité Hydrique des Bétons. Ph.D. Thesis, École Doctorale de Mécanique, Thermique et Génie Civil, Université de Nantes, Nantes, France, 2001; p. 229. [Google Scholar]
  15. CarmichaeL, M.J.; Arulraj, G.P. Strength and permeability studies on concrete with nano-cement. Int. J. Civ. Eng. Technol. 2017, 8, 132–139, ISSN Print: 0976-6308, ISSN Online: 0976-6316. Available online: http://www.iaeme.com/IJCIET/issues.asp?JType=IJCIET&VType=8&IType=1 (accessed on 11 November 2025).
  16. Aldea, C.M.; Ghandehari, M.; Shah, S.P.; Karr, A. Estimation of water flow through cracked concrete under load. ACI Mater. J. 2000, 97, 567–575. [Google Scholar] [CrossRef] [Scilit] [PubMed]
  17. Gérard, B. Contribution des Couplages Mécaniques-Chimie-Transfert Dans la Tenue à Long Terme des Ouvrages de Stockage de Déchets Radioactifs. Ph.D. Thesis, École Normale Supérieure de Cachan, Paris, France, 1996. [Google Scholar]
  18. Hubert, M.; Desmettre, C.; Charron, J.P. Influence of fiber content and reinforcement ratio on the water permeability of rein-forced concrete. Mater. Struct. 2015, 48, 2795–2807. [Google Scholar] [CrossRef] [Scilit]
  19. Rastiello, G. Influence de la Fissuration sur le Transfert de Fluides dans les Structures en Béton: Stratégies de Modélisation Probabiliste et Étude Expérimentale. Ph.D. Thesis, IFSTTAR Université Paris-Est, Paris, France, 2013; p. 169. [Google Scholar]
  20. Rastiello, G.; Boulay, C.; Dal Pont, S.; Tailhan, J.L.; Rossi, P. Real-time water permeability evolution of a localized crack in concrete under loading. Cem. Concr. Res. 2014, 56, 20–28. [Google Scholar] [CrossRef] [Scilit]
  21. Rastiello, G.; Dal Pont, S.; Tailhan, J.L.; Rossi, P. On the threshold crack opening effect on the intrinsic permeability of localized macro-cracks in concrete samples under Brazilian test conditions. Mech. Res. Commun. 2018, 90, 52–58. [Google Scholar] [CrossRef] [Scilit]
Figure 1. Depth of water, hw, and concrete lining thickness, hc.
Constrmater 06 00025 g001
Figure 2. Plan view of the considered pattern of parallel cracks.
Constrmater 06 00025 g002
Figure 3. Cross-section of the considered concrete lining having a thickness hc.
Constrmater 06 00025 g003
Figure 4. Hydraulic conductivity of cracked concrete, kcc (m/s), calculated using Equation (23) for w ≤ 0.158 mm and Equation (24) for w ≥ 0.158 mm as a function of the crack opening width, w: (a) for different crack spacings; (b) for different apparent strains.
Constrmater 06 00025 g004
Disclaimer/Publisher’s Note: The statements, opinions and data contained in all publications are solely those of the individual author(s) and contributor(s) and not of MDPI and/or the editor(s). MDPI and/or the editor(s) disclaim responsibility for any injury to people or property resulting from any ideas, methods, instructions or products referred to in the content.