Article

Experimental Study on Shear Lag Effect of Long-Span Wide Prestressed Concrete Cable-Stayed Bridge Box Girder under Eccentric Load

1
School of Transportation and Geomatics Engineering, Shenyang Jianzhu University, Shenyang 110168, China
2
School of Resources and Civil Engineering, Northeastern University, Shenyang 110819, China
*
Author to whom correspondence should be addressed.
Constr. Mater. 2024, 4(2), 425-443; https://doi.org/10.3390/constrmater4020023
Submission received: 25 March 2024 / Revised: 30 April 2024 / Accepted: 16 May 2024 / Published: 20 May 2024

Abstract

:
Based on the engineering background of the wide-width single cable-stayed bridge, the shear lag effects of the cross-section of these bridge box girders under the action of the eccentric load were experimentally studied. The behavior of shear lag effects in the horizontal and longitudinal bridge directions under eccentric load in the operational stage of a single cable-stayed bridge was analyzed by a model testing method and a finite element (FE) analytical method. The results showed that the plane stress calculation under unidirectional live load was similar to the results from spatial FE analysis and structural calculations performed according to the effective flange width described in the design specification. At the position of the main beam near the cable force point of action, the positive stress at its upper wing edge was greatest. At a distance from the cable tension point, the maximum positive stress position trend showed that from the center of the top flange to the junction of the top flange and the middle web to the junction of the top flange and the middle web and the side web. Under eccentric load, the positive and negative shear lag effects on the end fulcrum existed at the same time, and the shear lag coefficient on the web plate was larger than the shear lag coefficient on the unforced side. Due to the influence of constraint at the middle fulcrum near the middle pivot point, positive and negative shear lag effects were significant, and the coefficient variation range was large, resulting in large tensile stress on the roof plate in this area. According to FE analytical results, stress and shear forces of a single box three-chamber box girder under eccentric load were theoretically analyzed, the bending load decomposed into the accumulation of bending moment and axial force, using the bar simulation method, and the overall shear lag effect coefficient λ was obtained and verified.

1. Introduction

Due to the need for structurally minimizing weight, many civil components use a “Plate-belly” structure. In this type of structure, stress distribution in the cross-section of the member differs from the initial beam theory, presenting a “shear lag effect” [1,2,3], which is a special mechanical phenomenon of this type of structure. At present, many large-span, light, combination-type bridges and towering buildings have appeared in construction projects, and the shear lag effect of such structures is particularly clear [4,5]. After theoretical research and analysis of academic achievements and norms related to shear lag in both China and overseas, there remains a gap in the study of the stress distribution of large-span, broad-width cable-stayed bridge with a single cable plane under the action of live load, especially when the unidirectional live load loading of the main beam stress distribution is uneven [6,7]. If shear lag effects under live load are ignored in the design process, safety accidents are easily caused [8,9,10]. The research on safety control of bridge-reinforced concrete structures is progressively advancing today, with topics such as PPP-GNSS measurement technology and Structural Control Systems for the Cables being explored [11,12]. However, the influence of shear hysteresis effects remains significant and cannot be overlooked. After a detailed discussion of the research content, the research methods and existing research results have been considered regarding the shear lag effect of cable-stayed bridges at home and abroad. In this study, combined with an actual engineering background, the shear lag effects of large-span cable-stayed bridges were discussed in depth [13,14].
Our research has made significant contributions to the Journal of Construction Materials. This paper integrates model experiments, finite element software analysis, and numerical calculations rationally, mutually validating each other. We conducted a systematic analysis and study of the shear lag effect on the main beams of single-cable-stayed PC bridges and proposed a new box girder shear flow strength function based on the existing bar simulation method. Our work not only expands the existing research scope of shear lag in the journal but also reveals the distribution law of shear lag in wide box girders under eccentric loading through a comparison of model experiments and numerical analysis results.

2. Research Methods and Content

The shear lag of the box-girder fender was solved by the bar simulation method based on the distribution law of shear flow, and the solution equations of the shear lag effect of the thin-walled box girder main beam were derived. According to the sectional characteristics of thin-walled box girders, the stress values of the tower root, mid-span, and control sections of the main girder were calculated using the bar simulation method commonly used at home and abroad. The differential equations of the shear flow function were used to derive the differential equations of each plate of the simple support thin-walled box girder under the action of an eccentric load and then used in calculations [15,16,17]. According to the sectional parameters of the established project, the shear lag coefficient of the bottom slab at the tower root base of the actual project on which it is based was calculated using the derived differential equation. This was verified using the FE overall refinement model.
Taking Fumin Bridge as the engineering background, the lateral distribution regularities and diffusion angle of the cable horizontal force in the main girder were examined by establishing a fine FE solid model. Combined with axial force propagation characteristics and the principle of Saint-Venant [18], the overall fine model was constructed, and the positive stress distribution of the main beam control section under the action of an eccentric load was examined. The FE model test results were compared with the theoretical analysis and scale model test results. The calculation results of each key part of the overall model were tested.
Through the establishment of the overall solid FE model, changes in positive stress and shear lag of the main girder section under the action of live load were examined in depth [19,20]. According to the force characteristics of the prestressed box girder under the action of eccentric load, the distribution of shear lag coefficients of such bridge structures under different eccentric load conditions was scomprehensively and specifically analyzed from different angles [21,22,23].

3. Background

The full name of Fumin Bridge is the “Double-tower Three-span Single-cable-plane Polygonal-shaped Prestressed Concrete Cable-stayed Bridge”. The main bridge of Fumin Cable-stayed Bridge is a polygonal-shaped double-tower single-cable-plane PC cable-stayed bridge, with a total length of 600 m. The main bridge length is 420 m, with a span distribution of 89 m + 242 m + 89 m, and the main span is 242 m, while the side spans on both sides are each 89 m. The height of the two towers is 67.5 m, and the inclination angle at the lower part of 31 m is 7° for both. Each tower requires 15 pairs totaling 120 15 cm-diameter inclined steel cables, arranged in a fan shape. On each tower, 15 pairs of 120 15 cm-diameter inclined cables are arranged separately. The stay cables were made of galvanized high-strength steel wires, with four specifications of 151-Φ7, 211-Φ7, 241-Φ7, and 301-Φ7. The main girder adopts a single-box, three-chamber section, made of C50 concrete, with a top width of 32.5 m and a bottom width of 4 m. Details are shown in Figure 1.

4. Model Design and Production
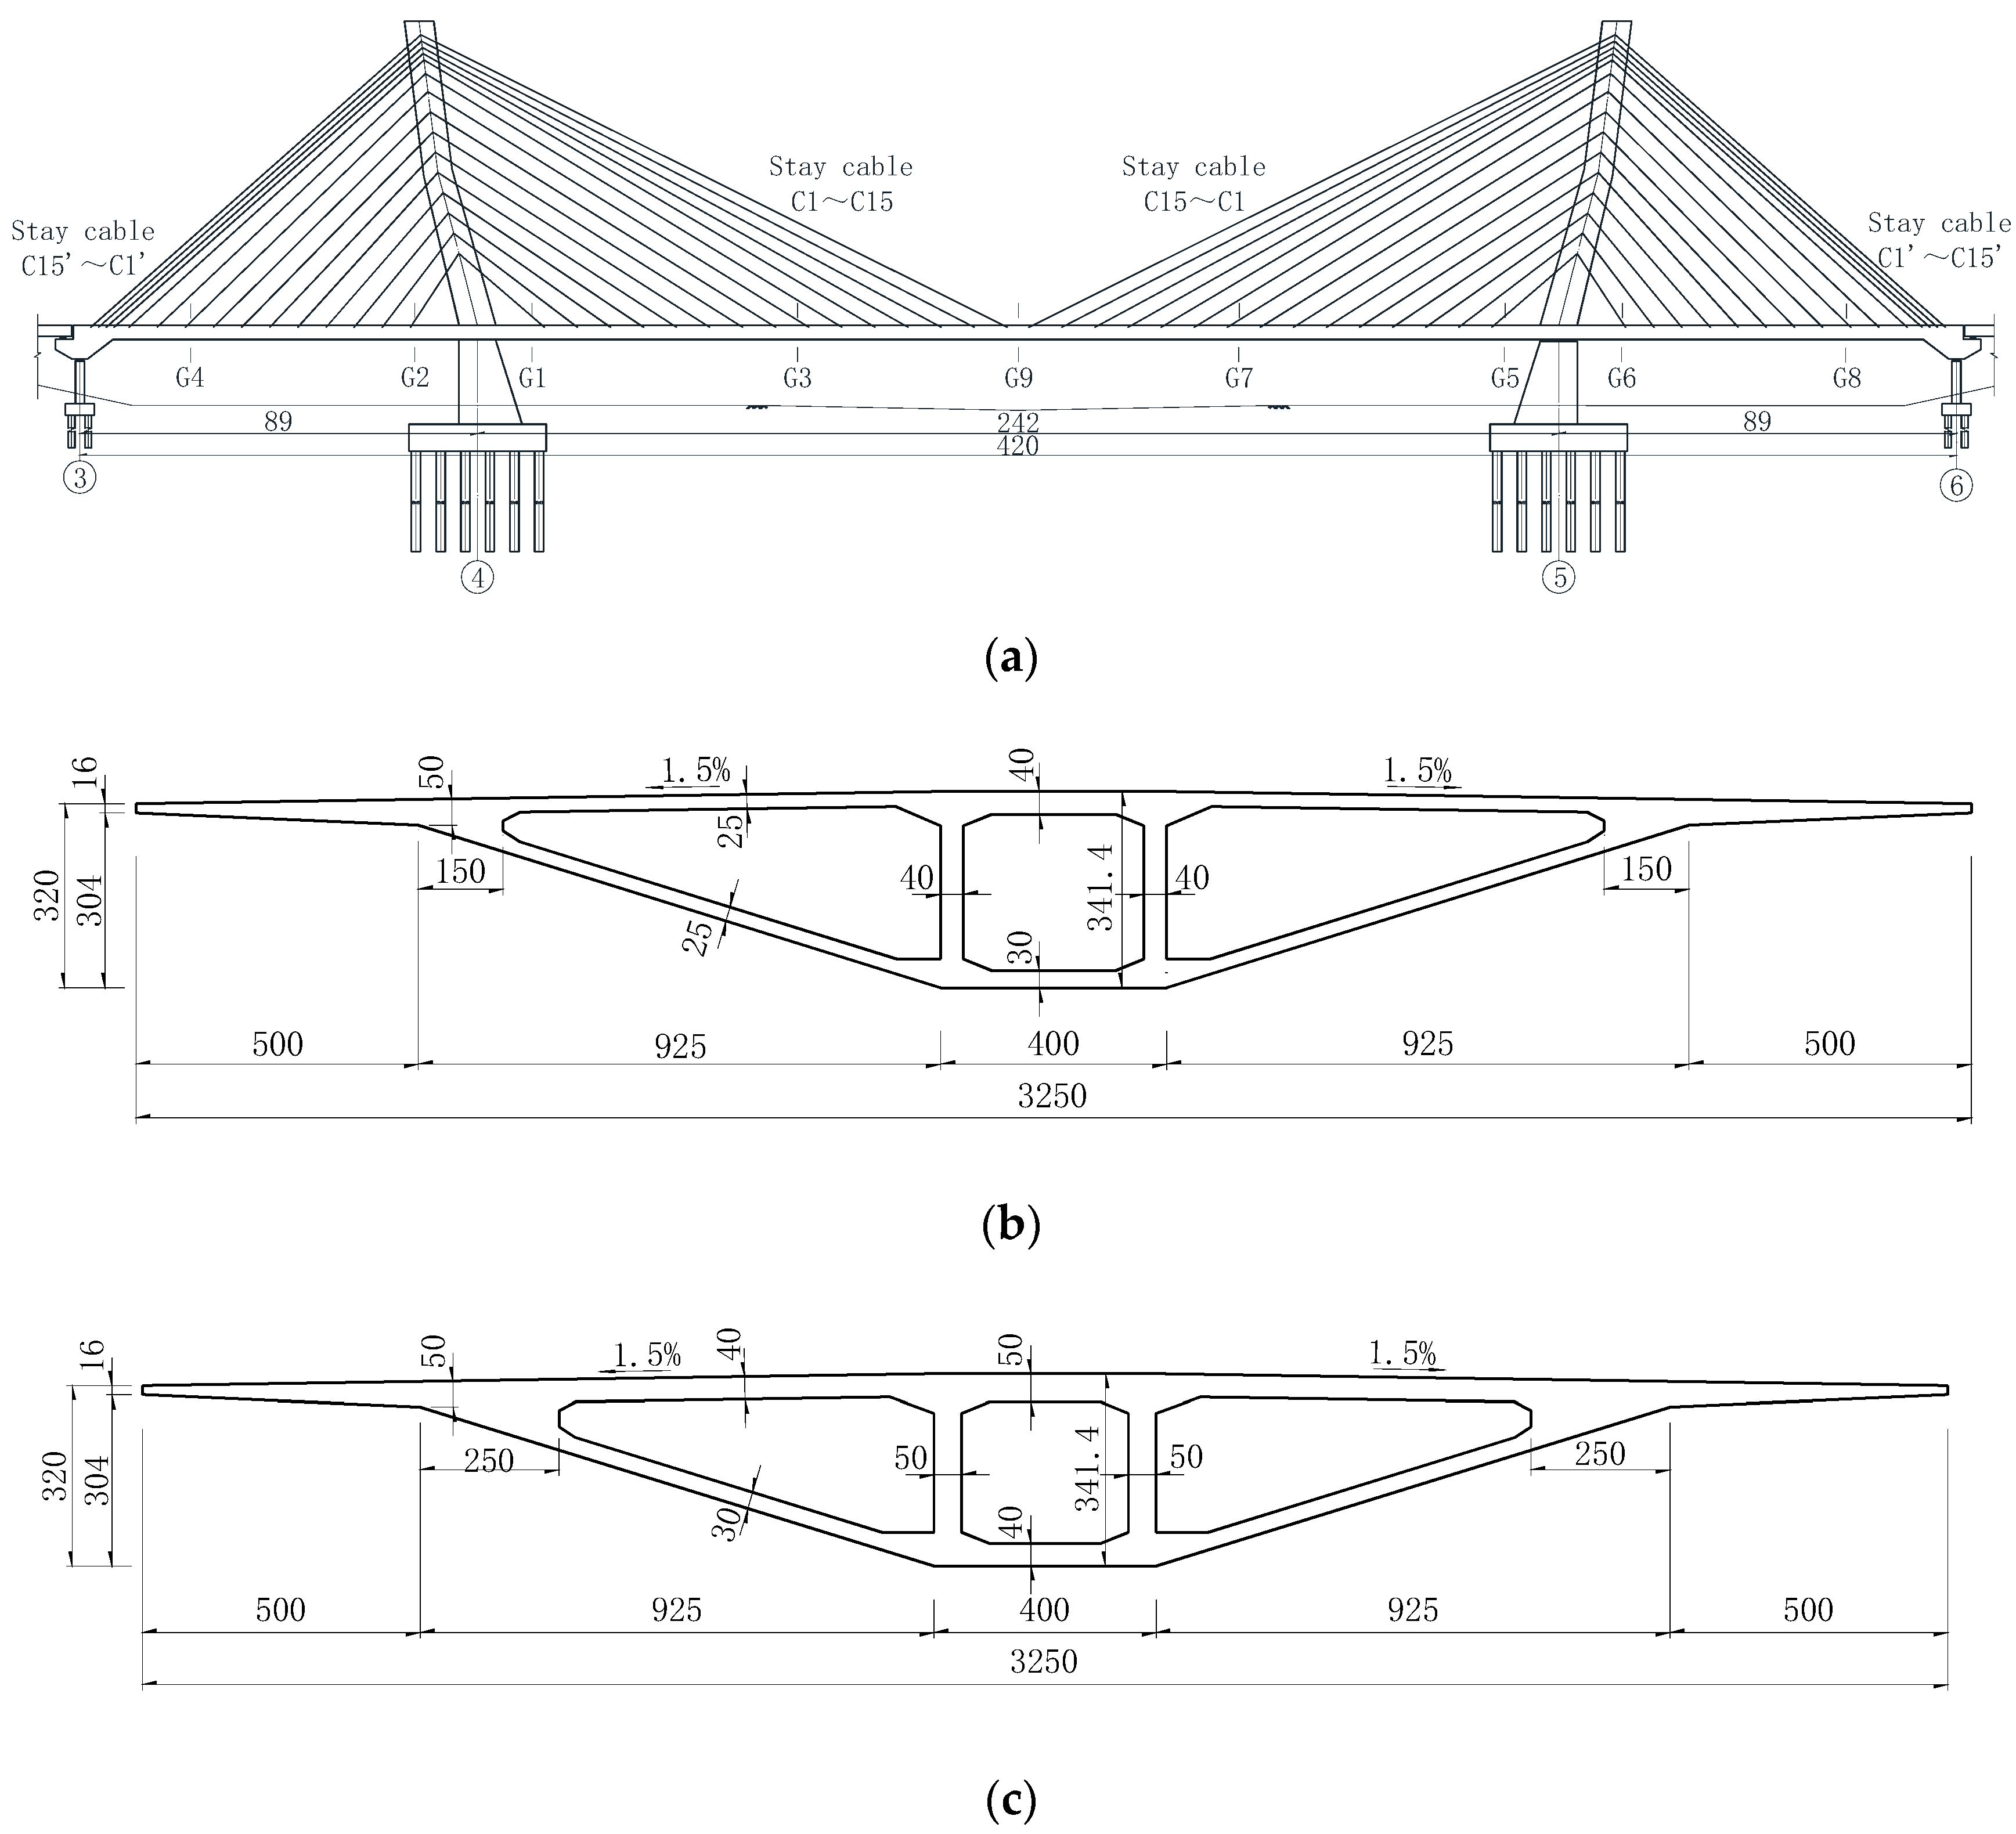
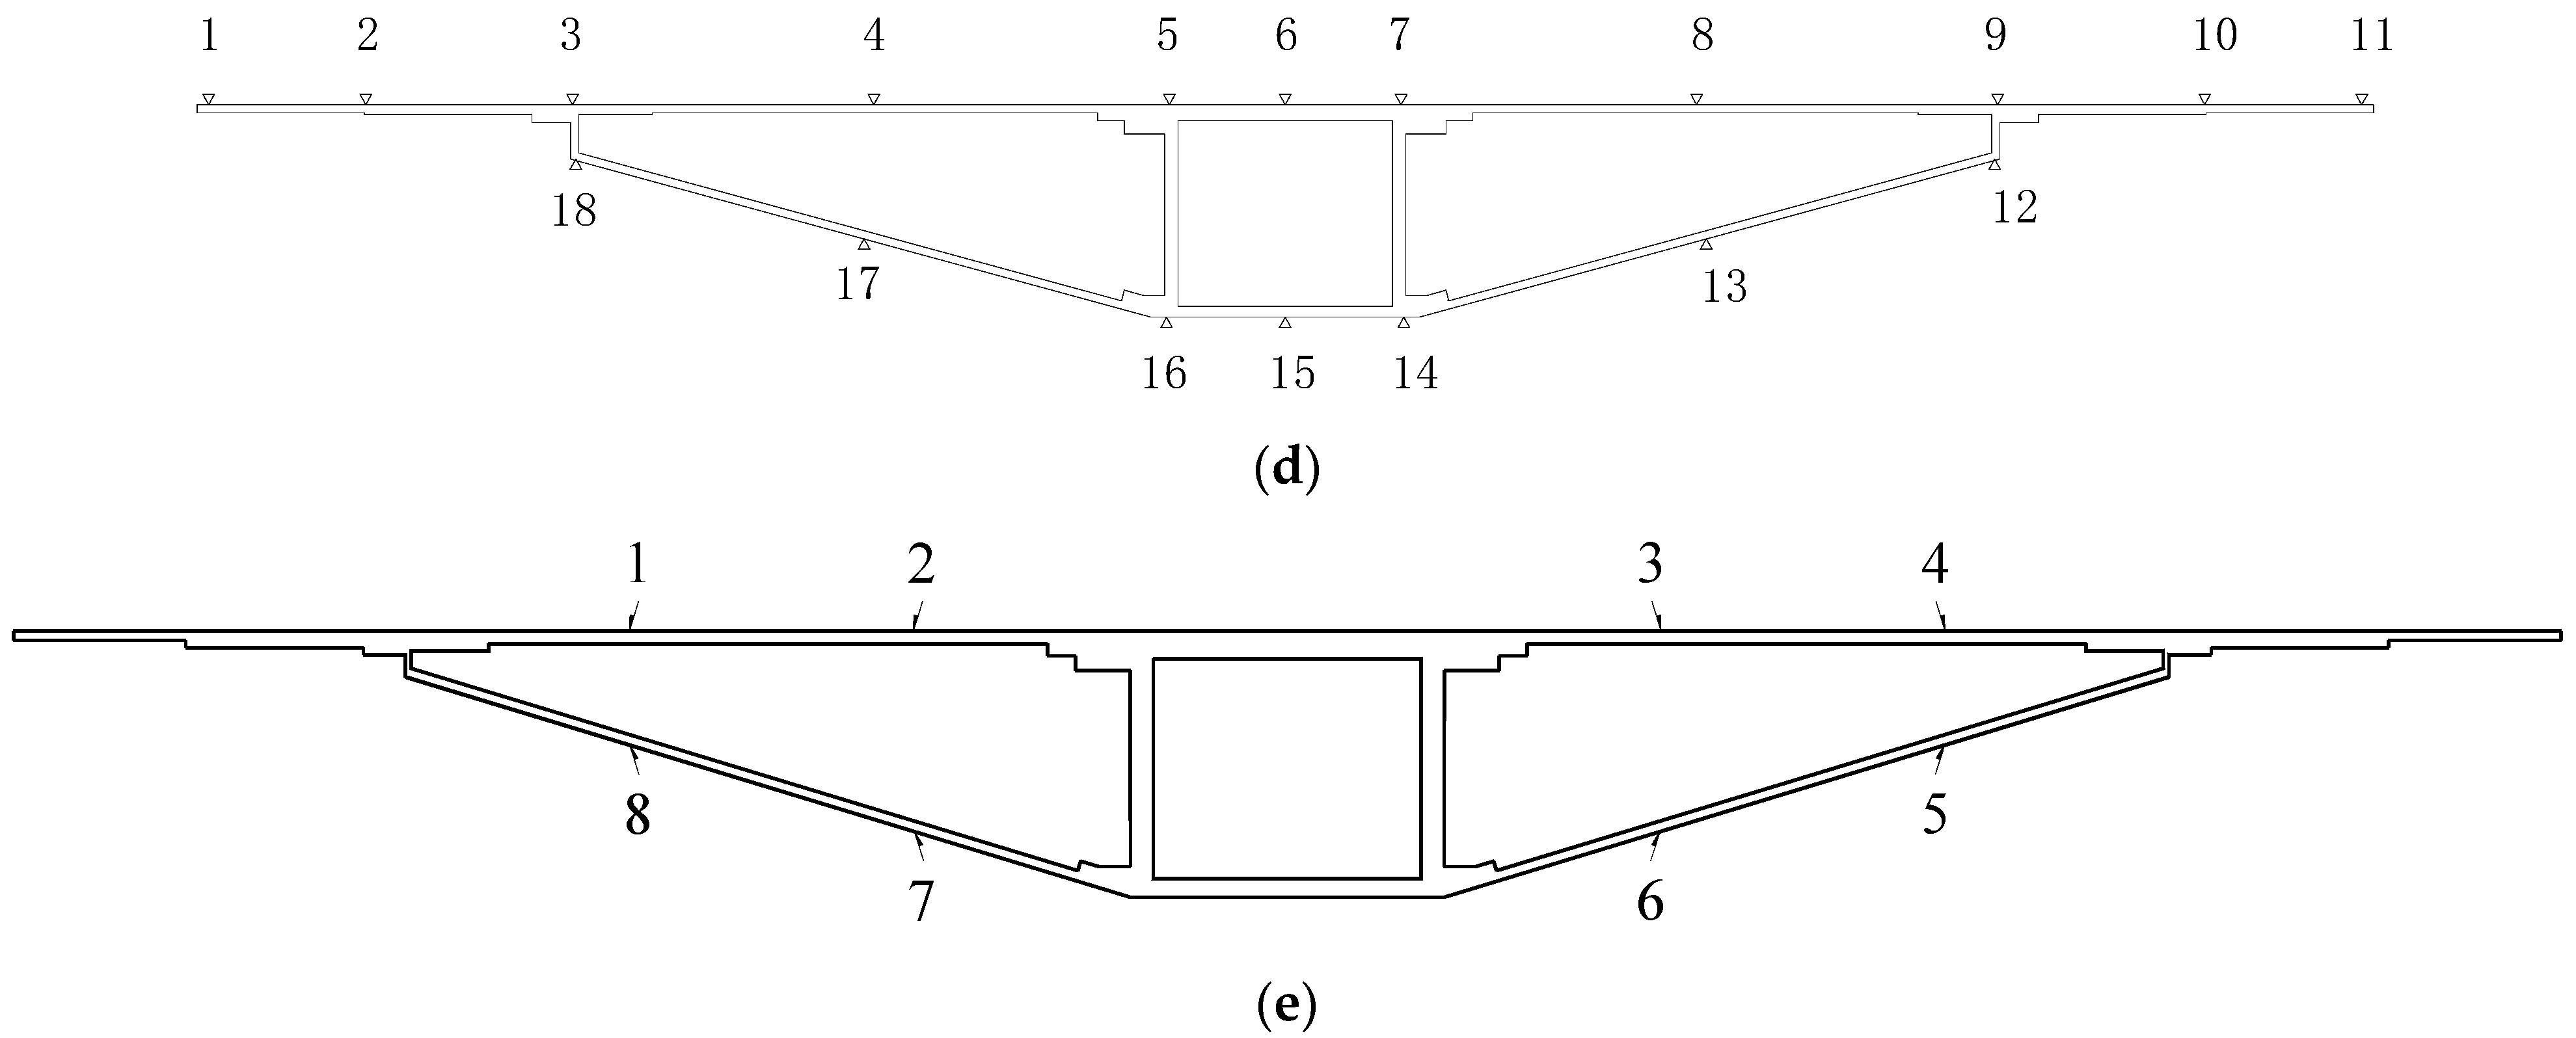
4.1. Model Design

Based on the three similarity theorems of similarity theory, a structural model can be constructed such that results close to objective reality can be obtained. Here, the section stiffness of the Fumin Bridge test model and bridge prototype should be similar. The test model should be geometrically similar to the bridge prototype, and the scale should be as large as possible. The load of the test model was reduced proportionally to the scale and actual load. The materials of the test model and bridge prototype were similar and the test model and real bridge boundary conditions were the same. Combined with the characteristics of Fumin Bridge, the geometric scale factor was n = 40.
(1)
Box girder design
The cross-sectional area and moment of inertia for the model box girder were calculated under the principle of similarity, expressed as
Am = Ap·(1/402)
and
Im = Ip·(1/404)
According to geometric similarity, the size of the box girder section model remained basically unchanged, and the wall thickness of the box girder was halved to ensure that the section area and moment of inertia were similar. In addition, the section similarity deviation was controlled within an allowable range. The modulus error only affected section stress, such that the accurate similarity ratio of the strain and stress in the model and prototype were calculated under corresponding working conditions.
The testing model had 19 sections in the box girder, spliced section-by-section according to the construction process. The construction and live loads were measured by adding heavy loads to the bridge deck. The general section type of the main girder and layout of the full bridge model are shown in Figure 2.
(2)
Stay cable design
The stay cable of the model was made of high-strength steel wires and composed of the same material as the prototype. This meant that the elastic modulus ratio was equal to 1.
The box girder and stay cable were connected by screw threads, allowing easy stay cable adjustment. A vibrating wire-type load cell was installed at the joint to measure the cable force of the stay cable.
(3)
Main tower design
The external contour dimensions of the main tower section remained basically unchanged, thus maintaining a similar relationship between the moment of inertia and cross-sectional area. For ease of production, the tower is welded from Q235B carbon steel. The elastic modulus ratio of C50 concrete and carbon fiber is 1:6.
The main tower of the bridge was a polygonal shape, and the dead load of the main tower not only produced stress on the tower body but also produced the bending moment of the tower body. This affected the entire structural system of the cable-stayed bridge’s internal force state, making it necessary to carry out dead load compensation for the main tower.
(4)
Design of bridge pier and bearing
The main and side piers were manufactured by steel welding. The box girder and pier 4# were connected by screw threads, the bearings were set for piers 3#, 5#, and 6#, a load sensor set in each bearing, and a device to apply tension used to simulate the dead load of the corbel section.

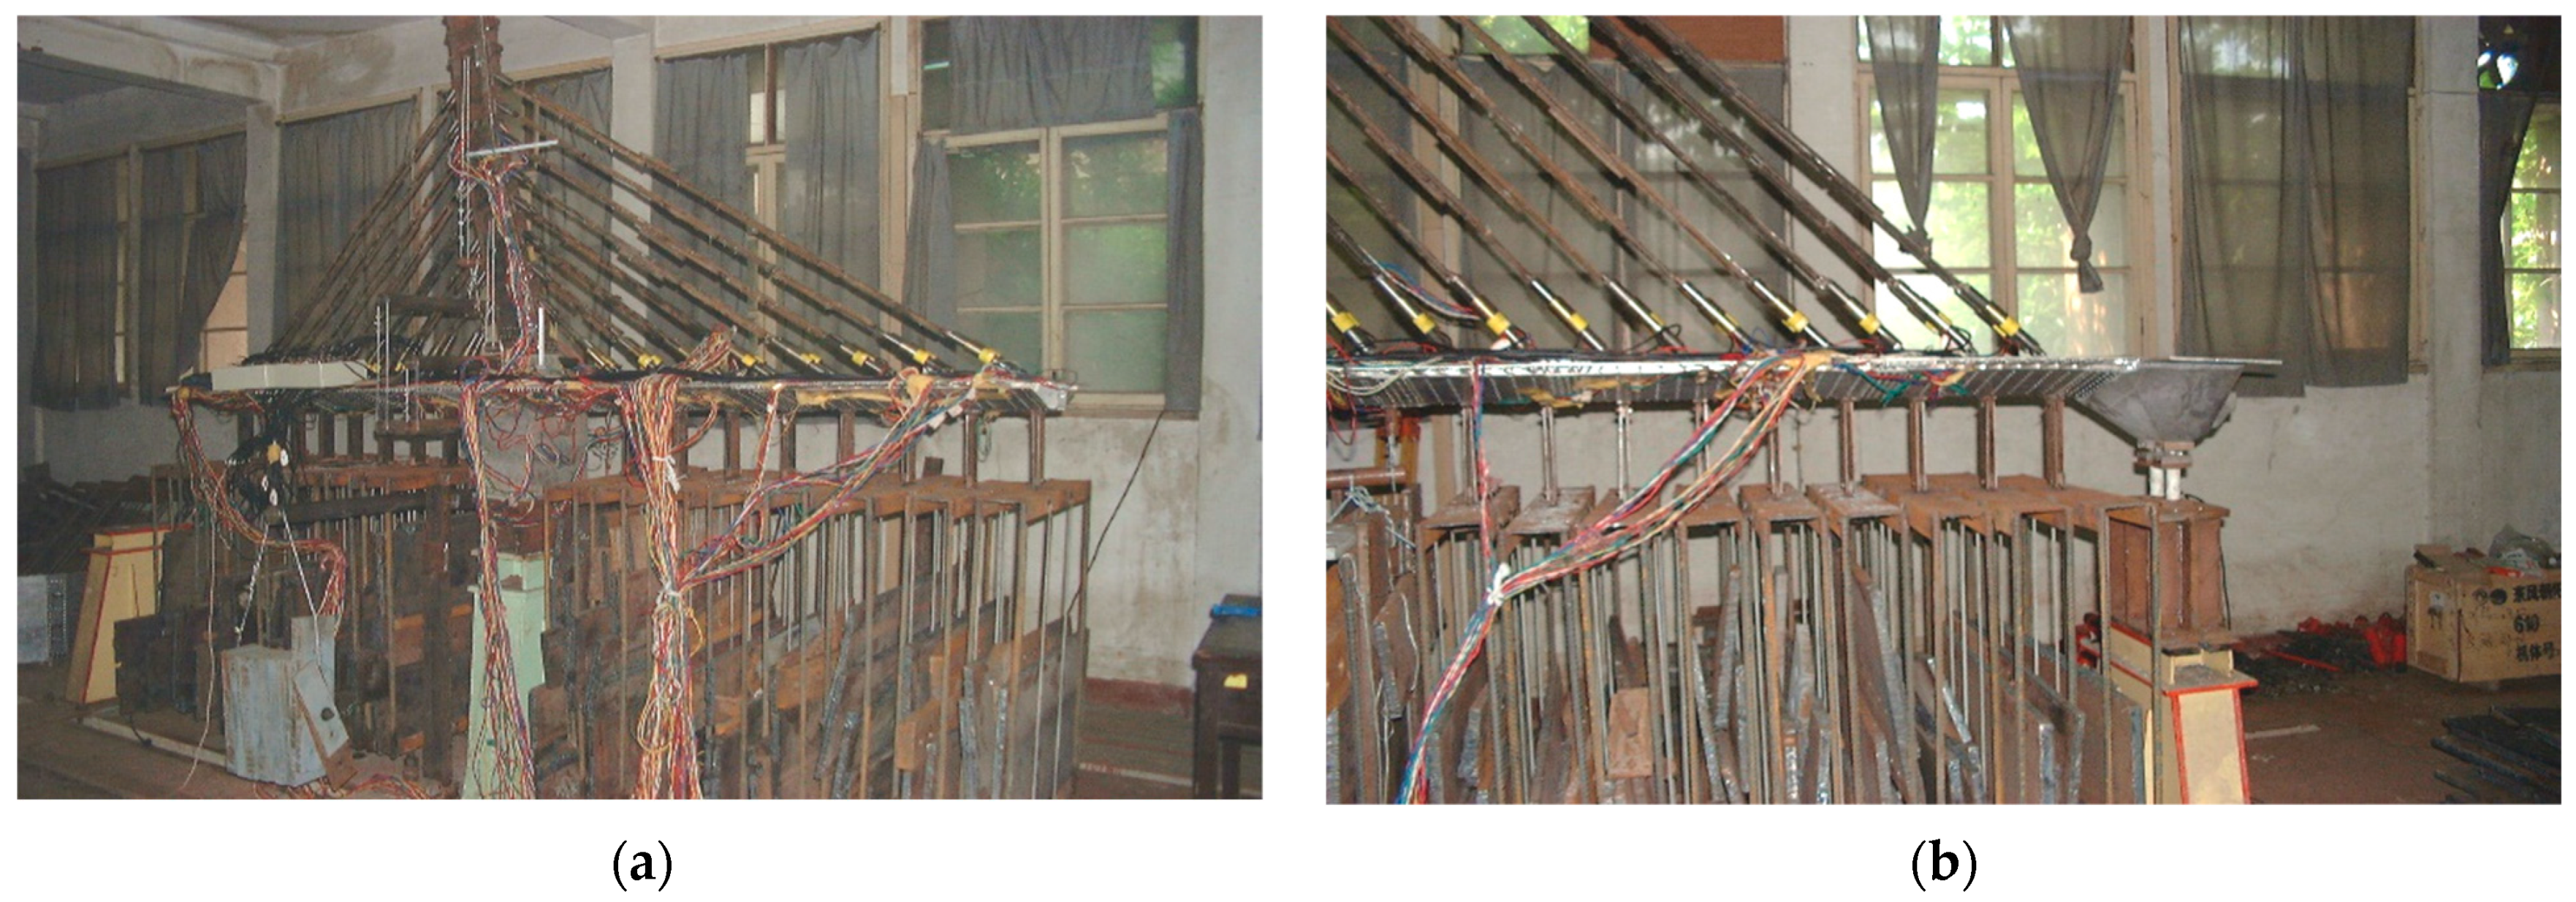
4.2. Model Construction and Installation

A special vibrating wire sensor was used to simulate the stay cable sensor, and to ensure long-term stability, accuracy, and reliability, it was necessary to calibrate them one by one before installation.
To simulate the construction process, the box girder was installed in subsections according to construction requirements. Once pier 5# was set as a temporary pier, the load sensor was installed to measure the counterforce of the temporary support under the action of the construction load. The model installation is shown in Figure 3.

4.3. Loading System and Dead Load Compensation

(1)
Dead load compensation of the main tower
The dead load compensation of the main tower was carried out in two sections as concentrated loads that were applied by the lever system. The load of the main tower was applied at the center of gravity on the main tower’s upper segment, and the load of the lower segment was compensated according to the similar bending moment of the tower root. This guaranteed that the tower root section and main tower bending-corner section loads were similar. The upper segment was compensated by 837.1 kg and the lower segment by 620 kg.
(2)
Load compensation of the main girder
A 1/40 scale model was adopted and the crossbeam not set, such that the form of concentrated load was applied to the position of the transverse diaphragm of the main beam to load compensation. The mid-span standard segment, mid-span tower root segment, side-span standard segment, and side-span tower root segment were 260.3, 385.3, 277.2, and 335.8 kg, respectively. The second stage load compensation for the hoisting points was 65.0 kg for the side span and 76.3 kg for the mid-span.

4.4. Loading Conditions

The live load test was carried out when the bridge was in a dead load state. In the eccentric load test, the eccentric load effect was the largest when the test load was applied to 3 lanes, with the lane reduction factor at 0.80 and the unilateral crowd load added. In the model test, weights were placed directly on the bridge deck. The weights are weighed, and the torque of the bridge axis equivalent to the torque of the bridge axis when the bridge deck is arranged horizontally. The weight is placed directly above the adjacent diaphragm plate to reduce the impact on the strain measurement at each measuring point of the test section. The eccentric loading conditions were as follows:
(1)
The eccentric load condition LCP1 was to load the G1 section of the mid-span main girder with a positive bending moment.
(2)
The eccentric load condition LCP2 was to load the G9 section of the mid-span main girder with a positive bending moment.
(3)
The eccentric load condition LCP3 was to load the G5 section with a negative bending moment.

4.5. Results of Model Tests under Eccentric Loading

The testing system for the model experiment primarily includes support reaction, stress, cable force, constant load, and displacement testing systems. The support reaction testing system comprises strain gauges and load sensors installed at various support points, which were calibrated before the test. Control sections were chosen at the complex-stressed pier base section and mid-span section. In Figure 2b,d, diagrams depicting stress test section layout and measurement point placement can be observed.
Model testing was used to carry out loading tests on different control sections of the main beam. With LCP1, LCP2, and LCP3 set to three eccentric load conditions, the main beam stresses and shear forces under these three working conditions were tested. The normal stresses and shearing stresses of G1, G9, and G5 sections under eccentric load are shown in Table 1 and Table 2.

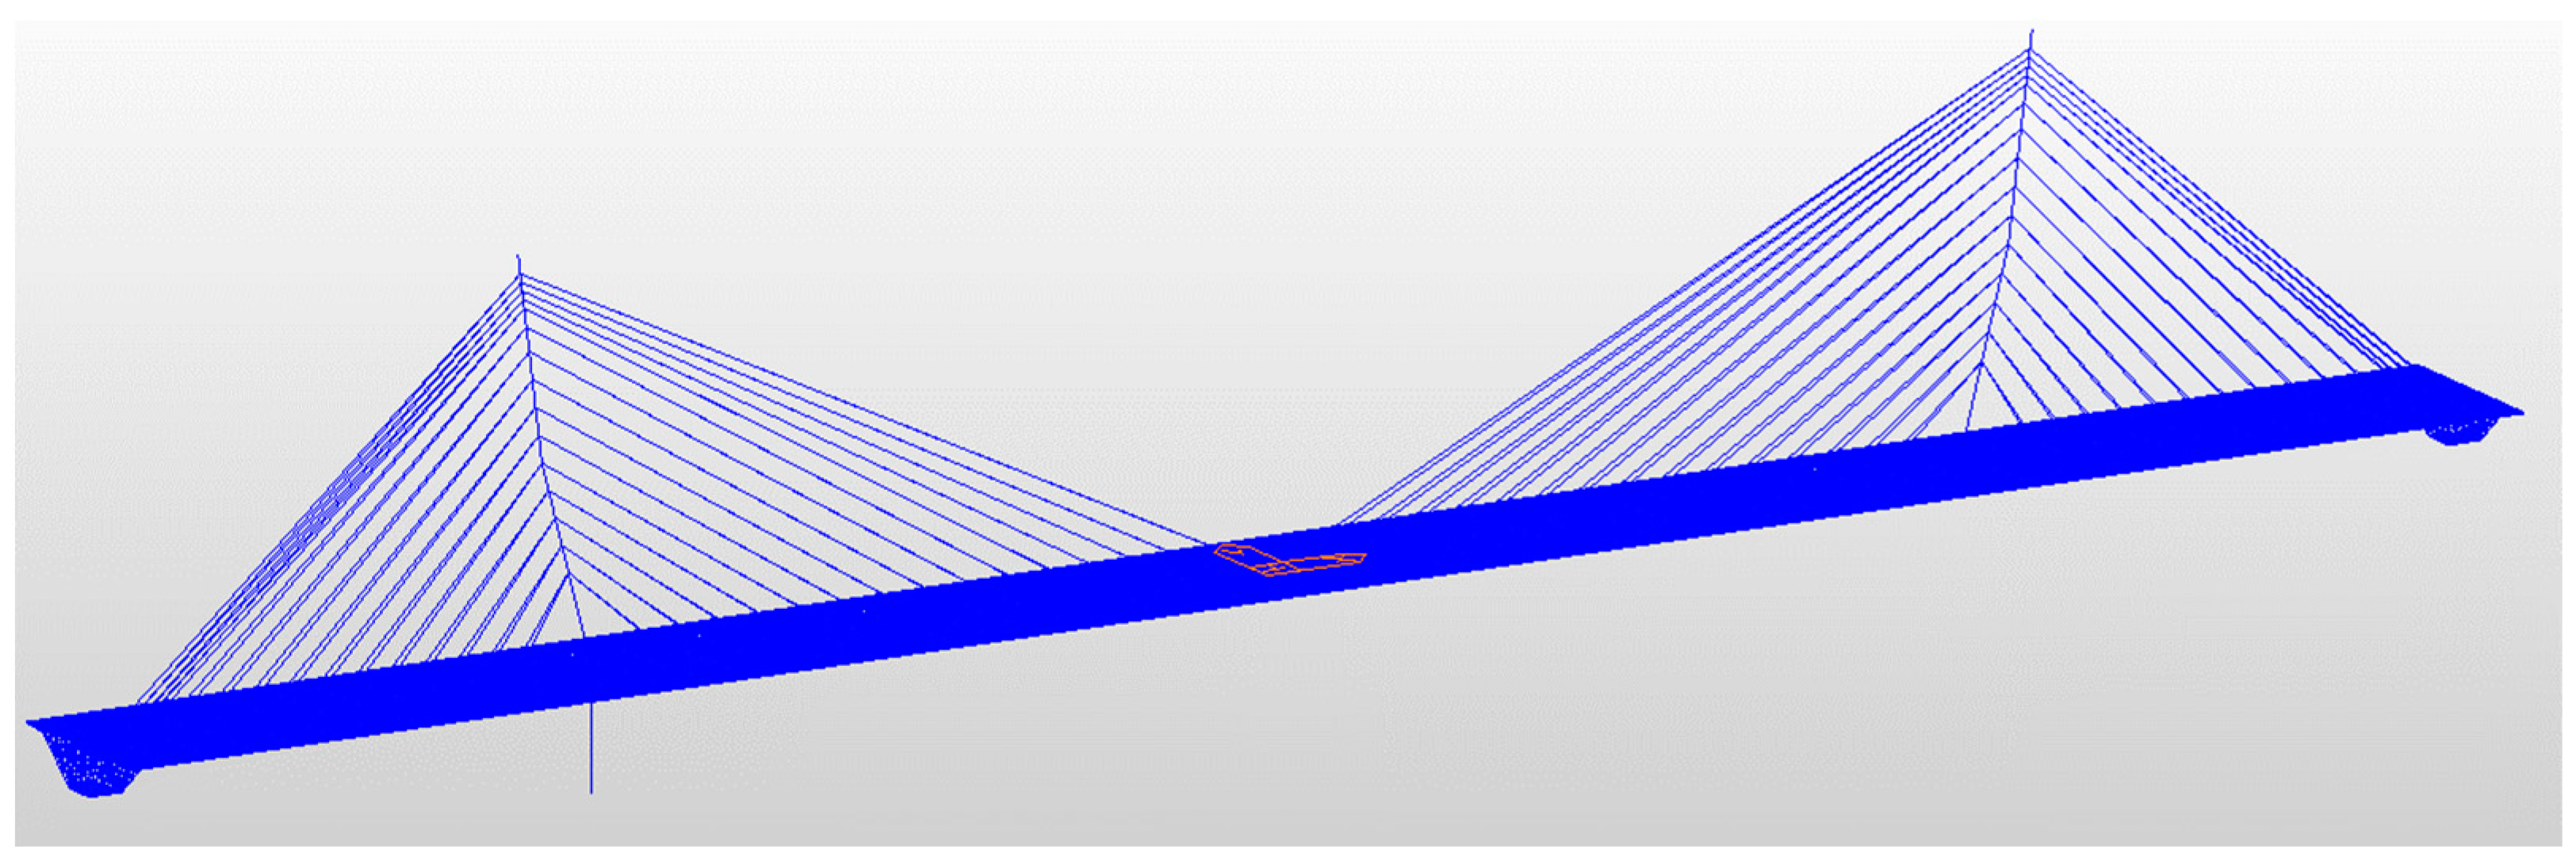
5. Spatial FE Model of Cable-Stayed Bridge with Single Cable Plane

The structural composition of cable-stayed bridges is relatively complex and has significant spatial mechanical effects, such that the results of plane analysis cannot reflect their real stress conditions. Only in three-dimensional (3D) analysis can the multiple factors affecting the force of the cable-stayed bridge be comprehensively considered. The shear lag effects of the box-type main girder of the cable-stayed bridge under vehicle load during the operational stage of the completed bridge were a very complex spatial mechanical behavior. Under the action of a one-way load, the distortion and torsion effects make the structural force analysis process more complicated and difficult to analyze using the conventional box girder calculation method [26,27,28]. In this section, the 3D solid element model of the Fumin Bridge was established using the spatial FE method, based on the 3D solid model analysis software Midas/Civil 2021. The section stress and shear lag effects of a single-cable plane large-span prestressed concrete (PC) cable-stayed bridge under eccentric loading were analyzed [29].
The FE software Midas/Civil 2021 was used here to establish the spatial FE model of the large-span, broad-width, cable-stayed bridge with a single cable plane. The main girder was simulated by a solid element, the main tower by a beam element, and the cables by truss elements [30,31]. The main girder of the single-box, three-chamber cable-stayed bridge was discretized into 29,787 solid elements and 52,631 nodes. The FE model of the entire bridge is shown in Figure 4.

5.1. Loading Condition of Cable-Stayed Bridge with a Single Cable Plane

This section focused on the shear lag effect in different force intervals, such as near the tower root, ¼-main span, and ½-main span under eccentric loading. In FE calculations, the origin of the x-axis coordinate was at the mid-span position of the main bridge and the section numbers taken in sequence along the bridge direction as G4 (x = −180 m), G2 (−130), G1 (−110), G3 (−50), G9 (0), G7 (50), G5 (110), G6 (130), and G8 (180). Under eccentric load conditions, live loads were applied according to the one-way three-lane moving load, with the reduction coefficient of the lane taken as 0.78, according to the specification, and a one-sided crowd load added.
The eccentric loading conditions analyzed in this section were as follows: (1) working condition 1, LCP1, in which G1 section was eccentrically loaded with a negative bending moment; (2) working condition 2, LCP2, in which eccentric loading of a positive bending moment was placed on G9 section; and (3) working condition 3, LCP3, in which a negative bending moment eccentric loading was placed on G5 section.

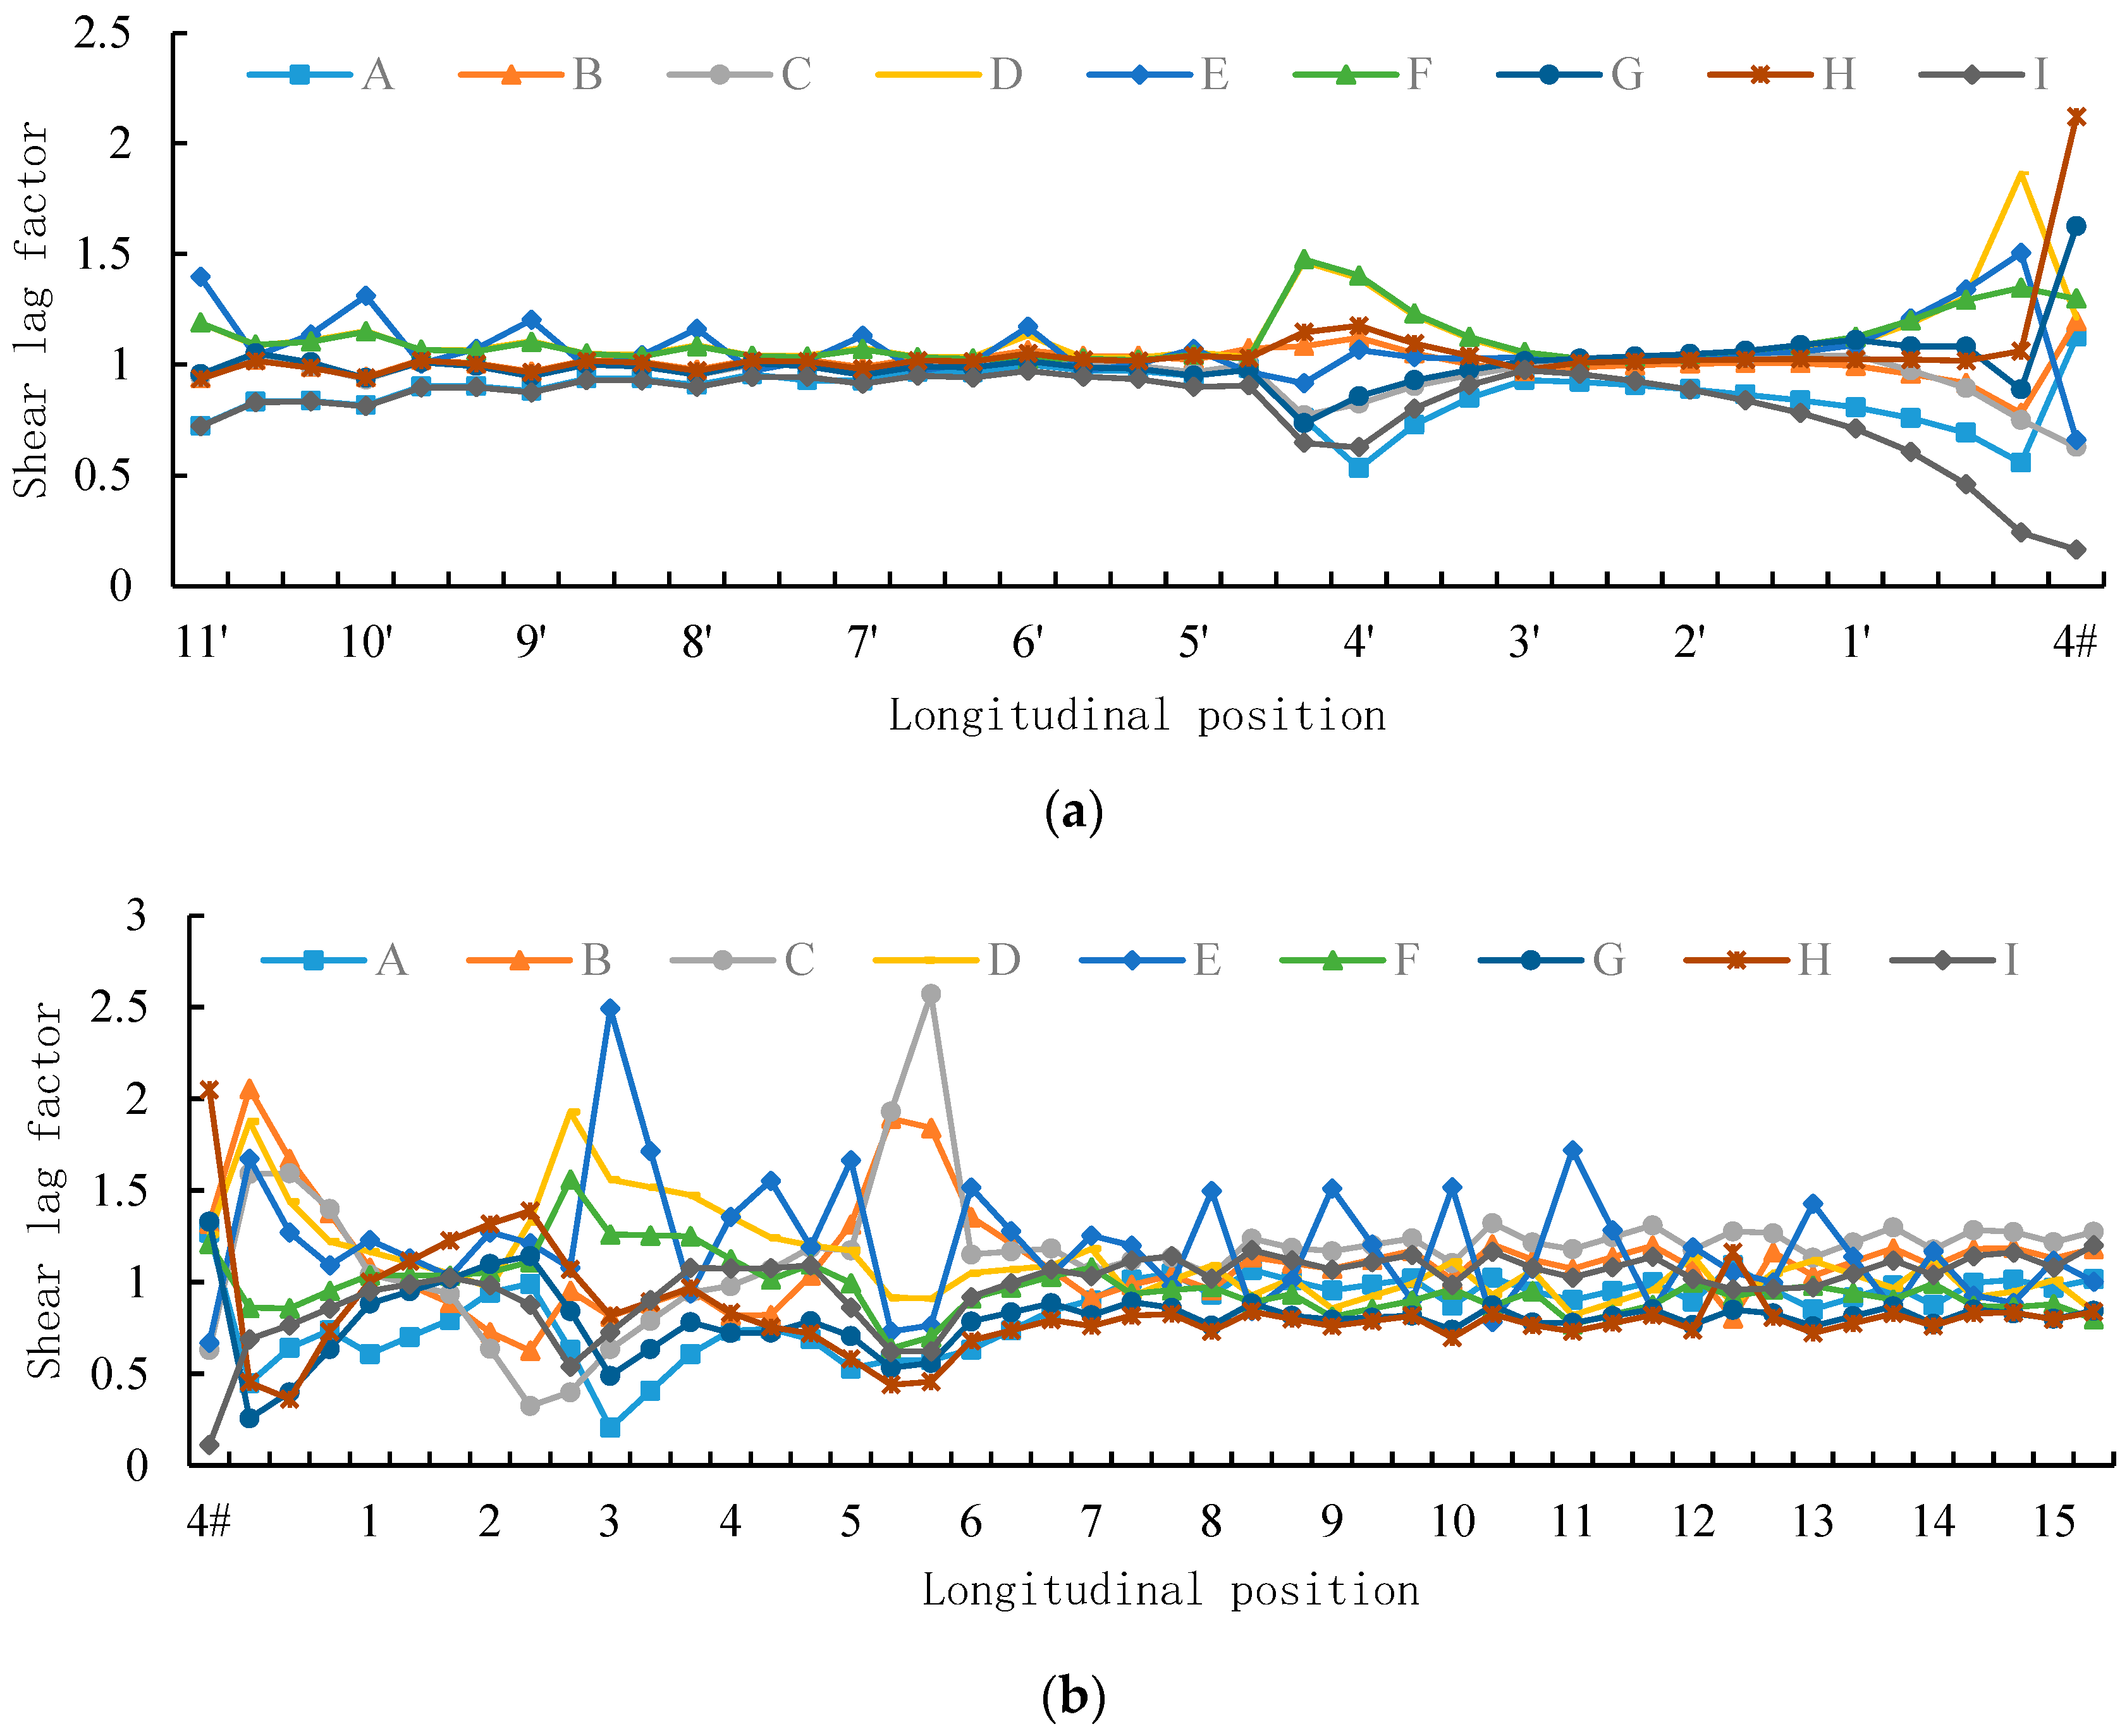
5.2. The Results of FE Calculations along the Longitudinal Direction of the Bridge under Eccentric Loading during the Bridge Completion Stage

The change in the shear lag effect of the whole bridge was analyzed more accurately by examining the shear lag coefficient of some representative. specific nodes of the longitudinal bridge under eccentric load. Due to limited space, only the FE calculation of the main girder of pier 4# along the longitudinal bridge direction under LCP1 was examined here (Figure 5).
LCP1 is a working condition in which the negative bending moment of the control section G1 was eccentrically loaded (Figure 6). After eccentric loading of the main girder G1 section with a negative moment, the shear lag coefficient of the loaded side was significantly higher than that of the unloaded side, and the shear lag coefficient of cable force was significantly higher than that of other positions. Among them, the shear lag coefficient at the 4′ cable on the left side of pier 4# was the largest, and the shear lag effect was particularly clear at the loading action and bridge pier. The shear lag coefficient gradually decreased away from the loading and tended to 1 in general.
Except for the beam section near the tower root and in the vicinity of the side-span bearing, pier 4# side-span stay cables C11′–C1′ were located within the beam section, as were mid-span stay cables C1–C15 (Figure 6). Within the range of the beam section, the shear lag coefficients of anchorage points D, E, and F of the stay cable were particularly prominent. The value of the shear lag coefficient λ of point D at the anchor point of the stay cable varied within the range of 0.82–1.92. The value of the shear lag coefficient λ at point E at the anchorage point of the stay cable was in the range of 0.76–2.49. The value of the shear lag coefficient λ at the anchorage point of the stay cable at point F along the longitudinal direction of the bridge varied within the range of 0.64–1.56. The shear lag coefficient was relatively uniform in beam segments between stay cable anchorage points. The shear lag coefficient λ at points D, E, and F fluctuated between 0.91–1.46, 0.84–1.2, and 0.86–0.53, respectively.
According to the above data analysis, when the load was eccentrically loaded according to the most unfavorable bending moment influence line of the G1 section, the measuring points A, B, C, and D on the loading side were much larger than points F, H, I, and J on the unloaded side. Due to the limited torsional effect of the bearing, the shear lag effects at the tower root were clear, and the shear lag coefficient gradually became less away from the tower root. Furthermore, as the cable force acted on the center point E of the section, the shear lag coefficient was more prominent at point E at the center position of the section of pier 4# at the point where the cable force acted. Under the action of live load, the shear lag of each measuring point at the mid-span position on the left side of pier 4# increased significantly, which was caused by the secondary torsion effect of the large-span box girder.

5.3. Comparison of Shear Lag Coefficient Results of Cross-Sections under Eccentric Loading in the Bridge Formation Stage

Shear lag coefficient changes were extracted, diagrammed, and analyzed at the upper edge of the main girder G1, G9, and G5 sections in the model test and space FEs under eccentric loading. The change trends of the shear lag coefficient at the upper edge of each section were basically the same, except for the sudden change in individual points on the G9 section of the main girder (Figure 7). The distributions of shear lag coefficient values at the upper edge of the main girder G1 and G5 sections near the tower root were not uniform. The main reason for this was that the section positions were closer to the tower root. The shear lag coefficient of the upper edge of the G9 section of the mid-span main girder was relatively smooth, mainly because the section position was far from the tower root. The test results were observed to be basically consistent with the FE calculation results.

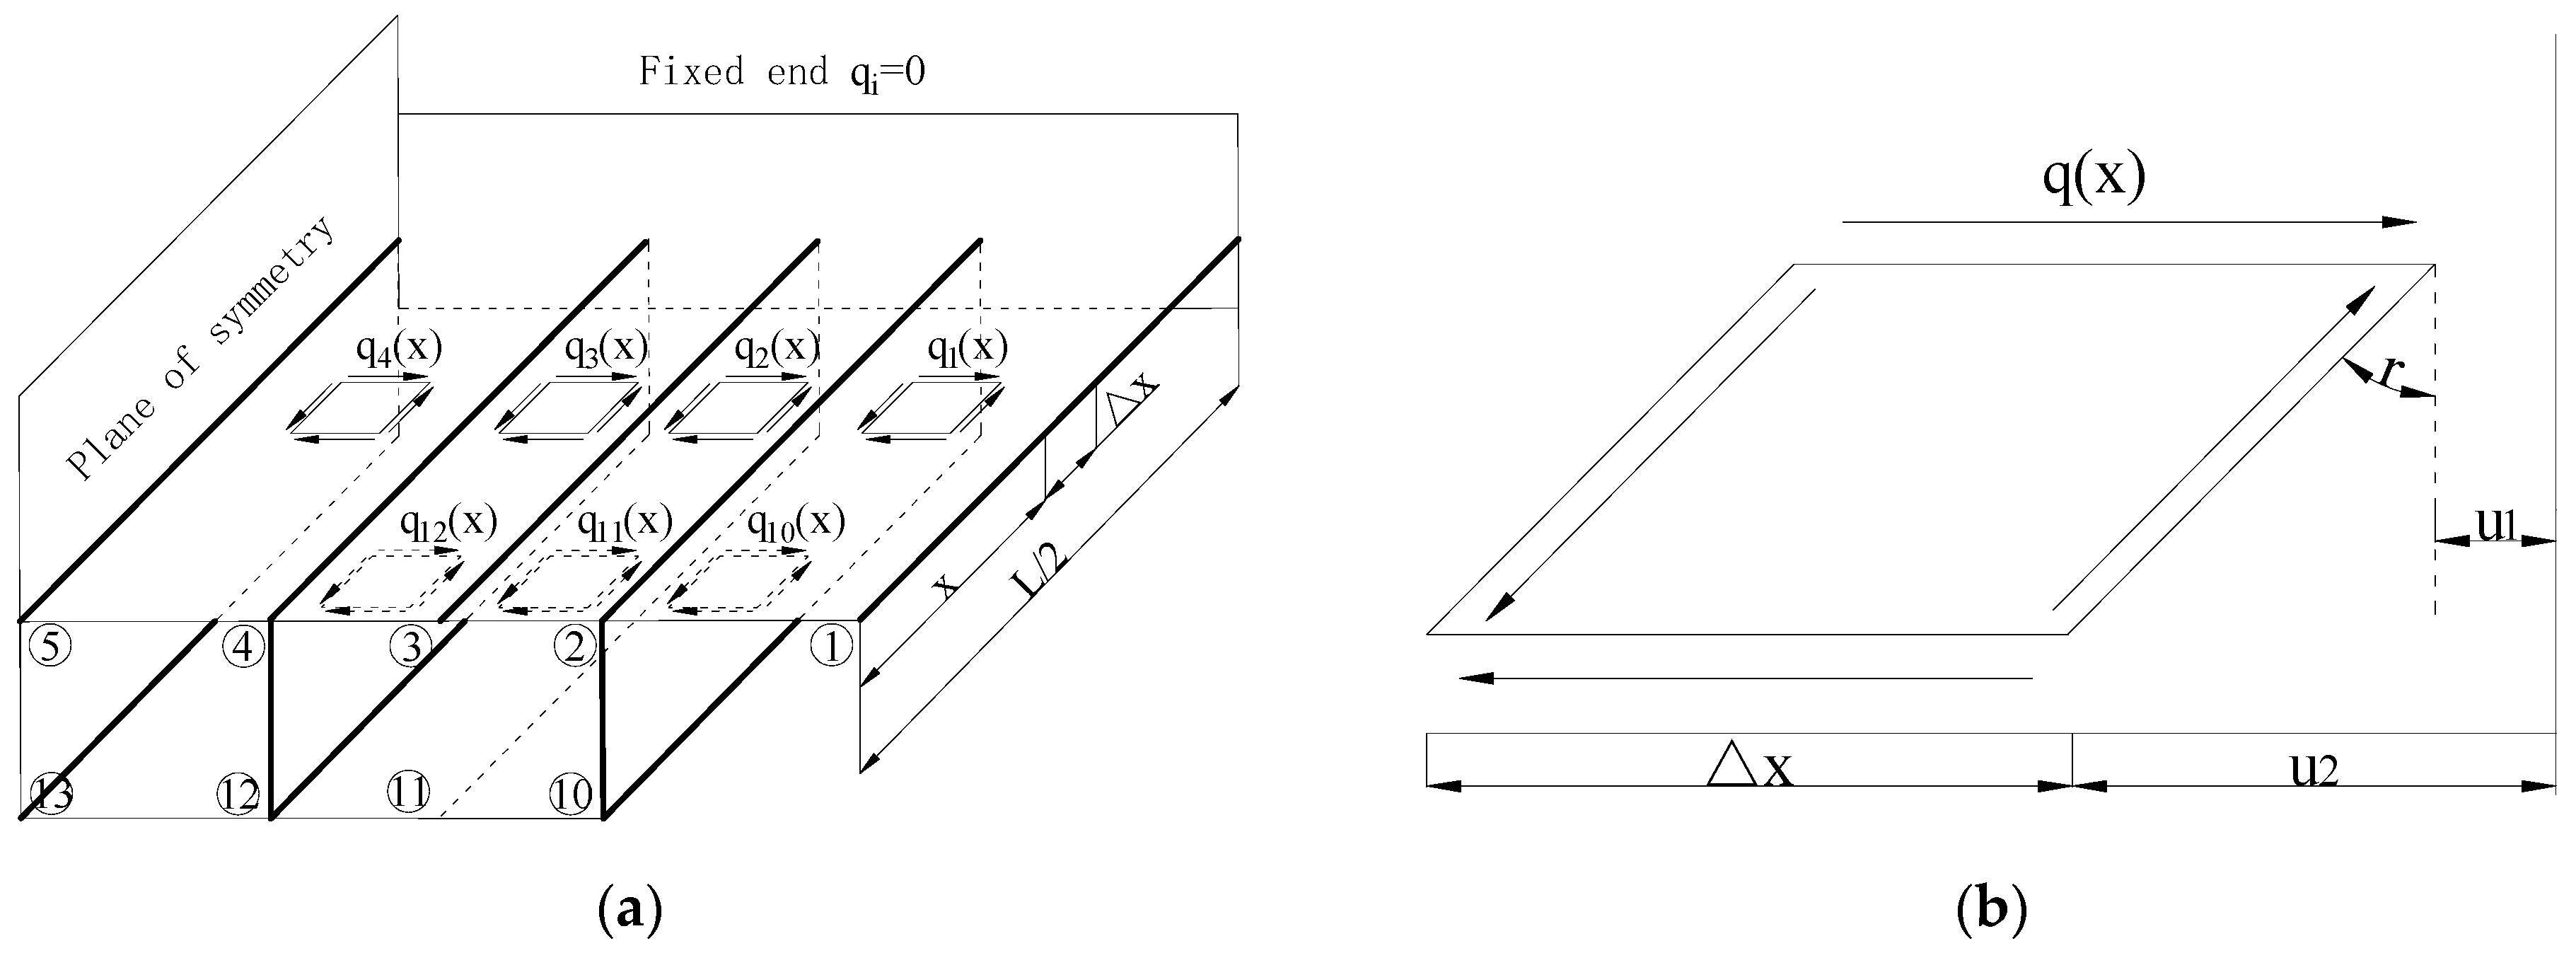
6. Theoretical Study on Bar Simulation Method of Cross-Section Stress of Single-Box Three-Chamber Box Girder under Eccentric Load

6.1. Basic Assumption

In the analysis of the shear lag effect of the box girder by the bar simulation method, the main girder section is generally regarded as an ideal joint stress system of stiffeners only subjected to axial forces and thin plates only subjected to horizontal shear forces [32]. For a single-box three-chamber box girder bridge (Figure 8), the cross-section of the bar simulation method is shown in Figure 9.

6.2. Wing Plate Equivalent Area and Thickness Formula Derivation

In this section, the elementary beam theory was used for the single-box three-chamber box girder (Figure 9). When vertically loaded, the bending stress of the upper and lower wing plates was
σ u ( b ) = M ( y ) × h 1 ( 2 ) I
and
σ u ( b ) = M ( y ) × h 1 ( 2 ) I M ( y ) H A e u ( b ) ,
where h 1 ( 2 ) is the distance from neutral axis to centerline of upper and lower wing plates and A e u ( b ) is the equivalent flap area of the upper and lower flaps.
As the contribution of the wing plate to the moment of inertia of the entire section was very small and negligible, the moment of inertia of the single-box three-chamber box girder section (Figure 8) was expressed as
I = t w × H 3 3 + 4 H t w ( H 2 h 1 ) 2 + 2 t 1 ( 2 b 3 + 3 b 2 ) h 1 2 + 6 b 2 t 2 h 2 2
The equivalent wing plate areas of the top and bottom plates obtained by substituting Equation (5) into Equation (8) were, respectively,
A e u = 4 1 H t w + 2 β 1 ( 2 b 3 + 3 b 2 ) × t 1
and
A e u = 4 2 H t w + 6 β 2 b 2 × t 2 ,
where 1 and β 1 are the equivalent coefficient of the top plate area and 2 and β 2 the equivalent coefficient of the bottom plate area.
Taking the equivalent stresses of the top and bottom plates of the box girder as the criteria, it was known from Equation (4) that
A e u = I H h 1 ( 2 ) .
It can be seen from this, that the equivalent coefficients of the top and bottom areas were
1 = H 12 h 1 + 1 H h 1 ( H 2 h 1 ) 1 ,
2 = H 12 h 2 + 1 H h 2 ( H 2 h 2 ) 2 ,
β 1 = h 1 H + 6 b 2 t 2 h 2 2 2 H h 1 t 1 ( 2 b 3 + 3 b 2 ) ,
and
β 2 = h 2 H + 2 t 1 ( 2 b 3 + 3 b 2 ) h 1 2 6 b 2 t 2 H h 2 .
Therefore, the thickness of the equivalent wing plate was obtained as
t e u = β 1 t 1
and
t e b = β 2 t 2 .
In the derivation process, the top plate was compared with nine stiffeners and the bottom plate with seven stiffeners (Figure 7). The area of the stiffener in a section was idealized as the sum of the area of the actual stiffener and the area of the adjacent thin plates. The area formulas of each comparison rod are shown in Table 3.

6.3. Establishment of Controlling Differential Equations

In summary, for the single-box three-chamber box girder (Figure 10a), one end was consolidated and the other end was free. The micro-element was taken at the position of the section with a distance x from the restrained end. The thin-plate micro-segment in (Figure 10b) only endures the horizontal shear force, and the stiffeners on the top and bottom of the wing plate only endure axial forces. The equilibrium equation for the rod was taken as the target, and the static equilibrium equation for the top plate stiffener wasthus obtained. The force balance equations of the top plate stiffener were expressed as (Figure 10c).
d N 1 d x = q 1 ( x ) ,
d N 2 d x = q 2 ( x ) q 1 ( x ) q E 1 ( x ) ,
d N 3 d x = q 3 ( x ) q 2 ( x ) ,
d N 4 d x = q 4 ( x ) q 3 ( x ) q E 2 ( x ) ,
and
d N 5 d x = q 4 ( x ) .
It was concluded that the force balance equation of the bottom plate stiffener was (Figure 10d).
d N 10 d x = q 10 ( x ) + q E 1 ( x ) ,
d N 11 d x = q 11 ( x ) q 10 ( x ) ,
d N 12 d x = q 12 ( x ) q 11 ( x ) + q E 2 ( x ) ,
and
d N 13 d x = q 12 ( x ) .
The microblocks between the two adjacent stiffeners of the box girder had shear deformation (Figure 10a). Taking between 1 and 2 stiffeners as an example, the shear angle change rate was expressed as
d r d x = 1 d ( u 1 x u 2 x ) = 1 d ( ε 1 ε 2 ) .
This can also be expressed as
d r d x = σ 1 σ 2 E d = 1 E d ( N 1 A 1 N 2 A 2 ) .
From the point of view of material mechanics, the equation for the expression of shear flow was obtained as
q = r t e u G .
After the derivation of both sides of Equation (26) were inserted into Equation (27), the force equation between the first and second rods was obtained as
d q 1 ( x ) d x = G t e u E d ( N 1 A 1 N 2 A 2 ) .
The general expression of the force formula of the macroblock between other members was expressed as
d q i ( x ) d x = G t e u E d ( N i A i N j A j ) .
Differentiating both sides of Equation (28) yielded
d 2 q i ( x ) d x 2 = G t e u E d ( d N i d x × 1 A i d N j d x × 1 A j ) .
Substituting the force balance equation of each stiffener for the top and bottom plates (Figure 10b) into Equation (29), the system of differential equations governing the shear lag effects of the top and bottom plates was derived.
Roof Shear Lag Effect Differential Equations were expressed as
d 2 q 1 ( x ) d x 2 μ 11 2 q 1 ( x ) + μ 12 2 q 2 ( x ) = k q E 1 ( x ) A 2 ,
d 2 q 2 ( x ) d x 2 μ 22 2 q 2 ( x ) + μ 21 2 q 1 ( x ) + μ 23 2 q 3 ( x ) = k q E 1 ( x ) A 2 ,
d 2 q 3 ( x ) d x 2 μ 33 2 q 3 ( x ) + μ 32 2 q 2 ( x ) + μ 34 2 q 4 ( x ) = k q E 2 ( x ) A 4 ,
and
d 2 q 4 ( x ) d x 2 μ 44 2 q 4 ( x ) + μ 43 2 q 3 ( x ) = k q E 2 ( x ) A 4 ,
where k = G t e u E d , μ i i 2 = k ( 1 A i 1 A j ) , and μ j i 2 = k A j (j > i).
Differential Equation of Shear Lag Effect of Bottom Plate were expressed as
d 2 q 10 ( x ) d x 2 μ 1010 2 q 10 ( x ) + μ 1011 2 q 11 ( x ) = k q E 1 ( x ) A 10 ,
d 2 q 11 ( x ) d x 2 μ 1111 2 q 11 ( x ) + μ 1110 2 q 10 ( x ) + μ 1112 2 q 12 ( x ) = k q E 2 ( x ) A 12 ,
and
d 2 q 12 ( x ) d x 2 μ 1212 2 q 12 ( x ) + μ 1211 2 q 11 ( x ) = k q E 2 ( x ) A 12 ,
where k = G t e u E d ; q i ( x ) is the unknown shear flow function acting on the ith-stiffener, with i = 1, 2, 3, …, n; q E i ( x ) the known shear flow function on the stiffener at the web box junction; E/G the flexural and shear elastic modulus of the section; Ai the area of each stiffener; d the distance between each stiffener; and σi/εi the ratio of the normal stress and strain of the ith stiffener.

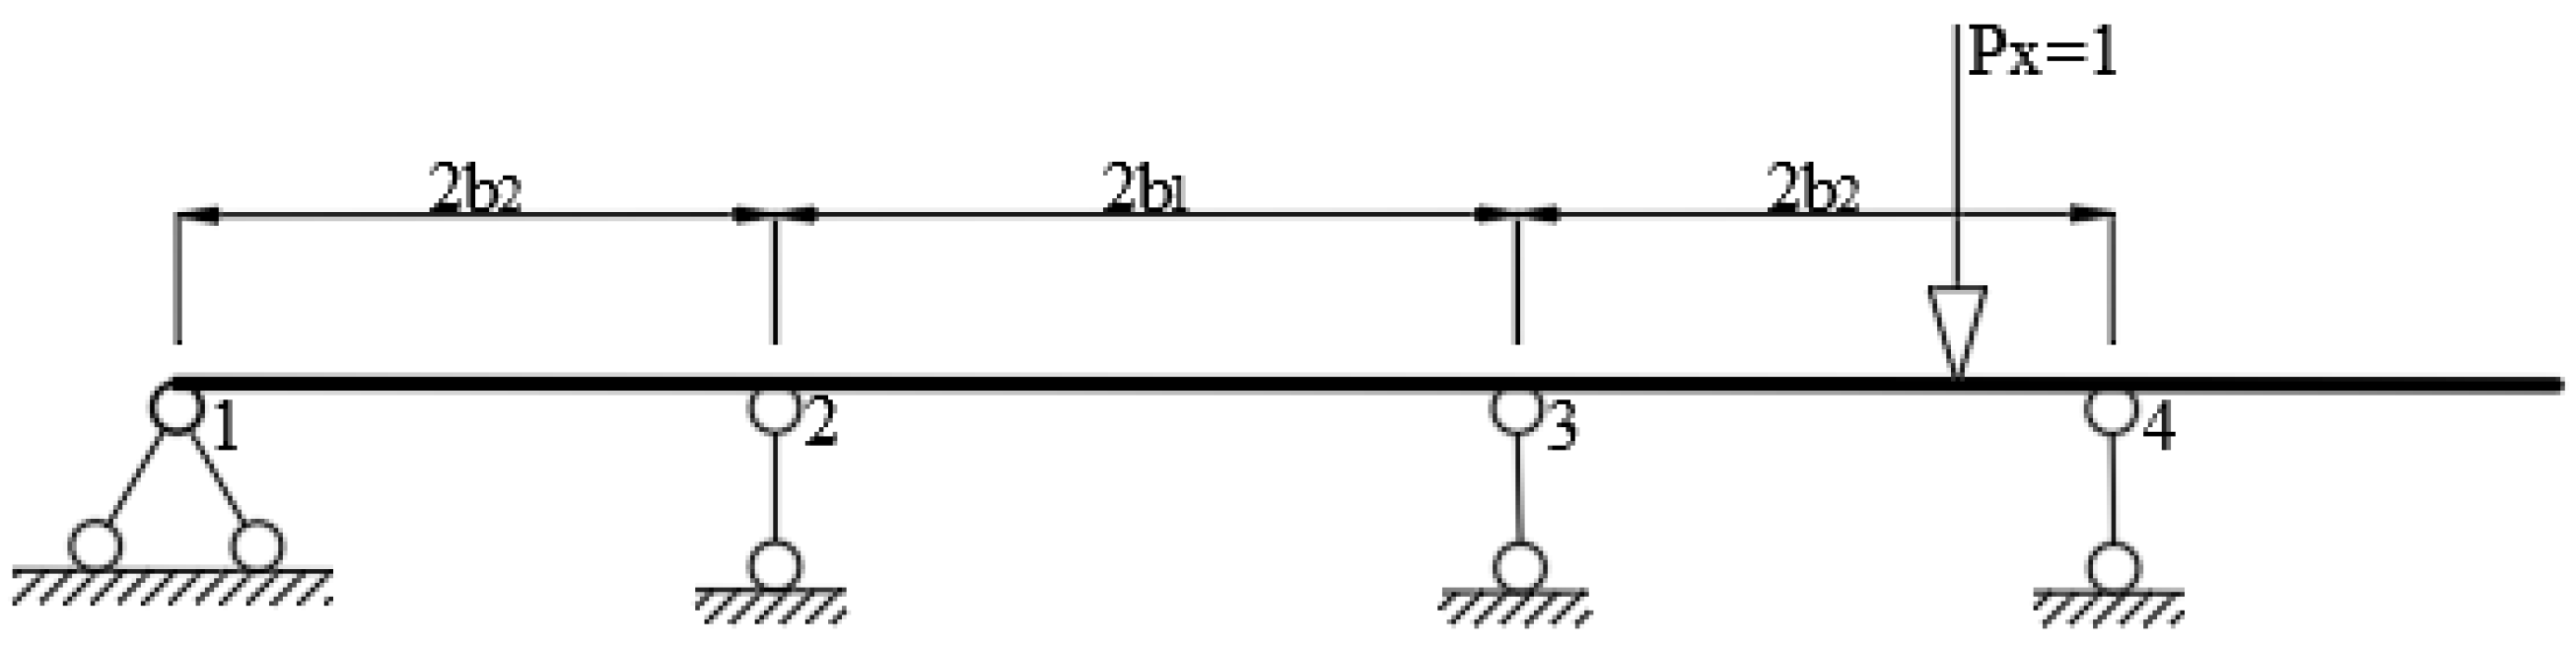
6.4. Shear Flow Distribution under Eccentric Loading

When only the vertical downward load acted on the cantilever beam, the free end boundary condition of the beam was d q i ( x ) d x = 0 . For embedded ends it was q i ( x ) = 0 .
According to the similarity principle of the moment of inertia of a section, the section was simplified (Figure 11). The shear flow function was solved by the force method of the material mechanics.
By adding element forces to points 2 and 3 by the force method of material mechanics, δ11, δ12, δ21, δ22, ∆1P, and ∆2P were obtained, expressed as
δ 11 = 2 3 E I b 2 ( b 1 + b 2 b 1 + 2 b 2 × 2 b 2 ) 2 + 2 3 E I ( b 1 + b 2 ) ( b 1 + b 2 b 1 + 2 b 2 × 2 b 2 ) 2
δ 12 = 2 3 E I b 2 2 b 1 + b 2 ( b 1 + b 2 b 1 + 2 b 2 × 2 b 2 ) 2 + 1 3 E I b 1 ( b 1 b 1 + b 2 ) 2 ( b 1 + b 2 b 1 + 2 b 2 × 2 b 2 ) 2       + 2 E I b 1 ( b 2 b 1 + b 2 ) 2 ( b 1 + b 2 b 1 + 2 b 2 × 2 b 2 ) 2 + 2 3 E I b 2 2 b 1 + b 2 ( b 1 + b 2 b 1 + 2 b 2 × 2 b 2 ) 2 ,
δ 21 = 2 3 E I b 2 2 b 1 + b 2 ( b 1 + b 2 b 1 + 2 b 2 × 2 b 2 ) 2 + 1 3 E I b 1 ( b 1 b 1 + b 2 ) 2 ( b 1 + b 2 b 1 + 2 b 2 × 2 b 2 ) 2 + 2 E I b 1 ( b 2 b 1 + b 2 ) 2 ( b 1 + b 2 b 1 + 2 b 2 × 2 b 2 ) 2 + 2 3 E I b 2 2 b 1 + b 2 ( b 1 + b 2 b 1 + 2 b 2 × 2 b 2 ) 2 ,
δ 22 = 2 3 E I ( b 1 + b 2 ) ( b 1 + b 2 b 1 + 2 b 2 × 2 b 2 ) 2 + 2 3 E I b 2 ( b 1 + b 2 b 1 + 2 b 2 × 2 b 2 ) 2 ,
Δ 1 P = 1 E I × 4 b 2 2 3 x × [ x ( 2 b 1 + 4 b 2 ) ] ( b 1 + b 2 b 1 + 2 b 2 × 2 b 2 ) + 1 E I × b 2 x × ( x 2 b 2 ) 2 2 b 1 + 2 b 2 × [ x ( 2 b 1 + 4 b 2 ) ] ( b 1 + b 2 b 1 + 2 b 2 × 2 b 2 )     + 1 E I × ( x 2 b 2 ) 2 2 x × [ x ( 2 b 1 + 4 b 2 ) ] 2 2 b 1 + 2 b 2 ( b 1 + b 2 b 1 + 2 b 2 × 2 b 2 ) + 1 3 E I × [ x ( 2 b 1 + 4 b 2 ) ] 3 2 b 1 + 2 b 2 × ( b 1 + b 2 b 1 + 2 b 2 × 2 b 2 )
and
Δ 2 P = 4 3 E I × ( b 1 + b 2 ) 2 x × [ x ( 2 b 1 + 4 b 2 ) ] ( b 1 + b 2 b 1 + 2 b 2 × 2 b 2 ) 1 E I × b 1 x × [ x ( 2 b 1 + 2 b 2 ) ] × [ x ( 2 b 1 + 4 b 2 ) ]   × ( b 1 + b 2 b 1 + 2 b 2 × 2 b 2 ) 1 E I × [ x ( 2 b 1 + 2 b 2 ) ] 2 ( 2 b 1 + 4 b 2 x ) 4 b x × [ x ( 2 b 1 + 4 b 2 ) ] ( b 1 + b 2 b 1 + 2 b 2 × 2 b 2 )   + 1 E I × [ x ( 2 b 1 + 4 b 2 ) ] 3 6 b 2 × ( b 1 + b 2 b 1 + 2 b 2 × 2 b 2 ) .
Due to { δ 11 X 1 + δ 12 X 2 + Δ 1 P = 0 δ 21 X 1 + δ 22 X 2 + Δ 2 P = 0 , Equations (39)–(42) were used to calculate the known shear flows q E 1 and q E 2 , expressed as
{ F y 2 = q E 1 = δ 12 δ 22 Δ 2 P Δ 1 P δ 21 × δ 12 δ 22 δ 11 F y 3 = q E 2 = Δ 2 P δ 21 δ 11 Δ 1 P δ 12 × δ 21 δ 11 δ 22 .

6.5. Solving Differential Equations

From Equations (30)–(36), it was known that the differential equation of the top plate shear flow function could be written in matrix form, as
[ D 2 μ 11 2 μ 21 2 0 0 μ 12 2 D 2 μ 22 2 μ 32 2 0 0 μ 23 2 D 2 μ 33 2 q 3 ( x ) μ 43 2 0 0 μ 34 2 D 2 μ 44 2 ] { q 1 ( x ) q 2 ( x ) q 3 ( x ) q 4 ( x ) } = ( k q E 1 ( x ) A 2 k q E 1 ( x ) A 2 k q E 2 ( x ) A 4 k q E 2 ( x ) A 4 ) .
The differential equation of the bottom plate shear flow function was then written in matrix form, as
[ D 2 μ 1010 2 μ 1110 2 0 μ 1011 2 D 2 μ 1111 2 μ 1211 2 0 μ 1112 2 D 2 μ 1212 2 ] { q 10 ( x ) q 11 ( x ) q 12 ( x ) } = ( k q E 1 ( x ) A 10 k q E 2 ( x ) A 12 k q E 2 ( x ) A 12 ) .
Through the matrix solution, the shear flow inside the stiffener was obtained, and the stress on each stiffener was calculated according to Equation (43), expressed as
σ i = F i A i
The shear lag effect of the main girder control section of the cable-stayed bridge was analyzed using the bar simulation method and then compared with the experimental results from the same scale model. The error of the comparative analytical results of the two approaches was within the tolerance range, which demonstrated that the theoretical derivation method described here was feasible (Table 4).

7. Conclusions

In this study, model tests, FE software analyses, and numerical calculations were combined and mutually verified. The shear lag effects of the main girder of a PC cable-stayed bridge with a single cable plane under eccentric load were analyzed, and the main research results were summarized as follows:
(1)
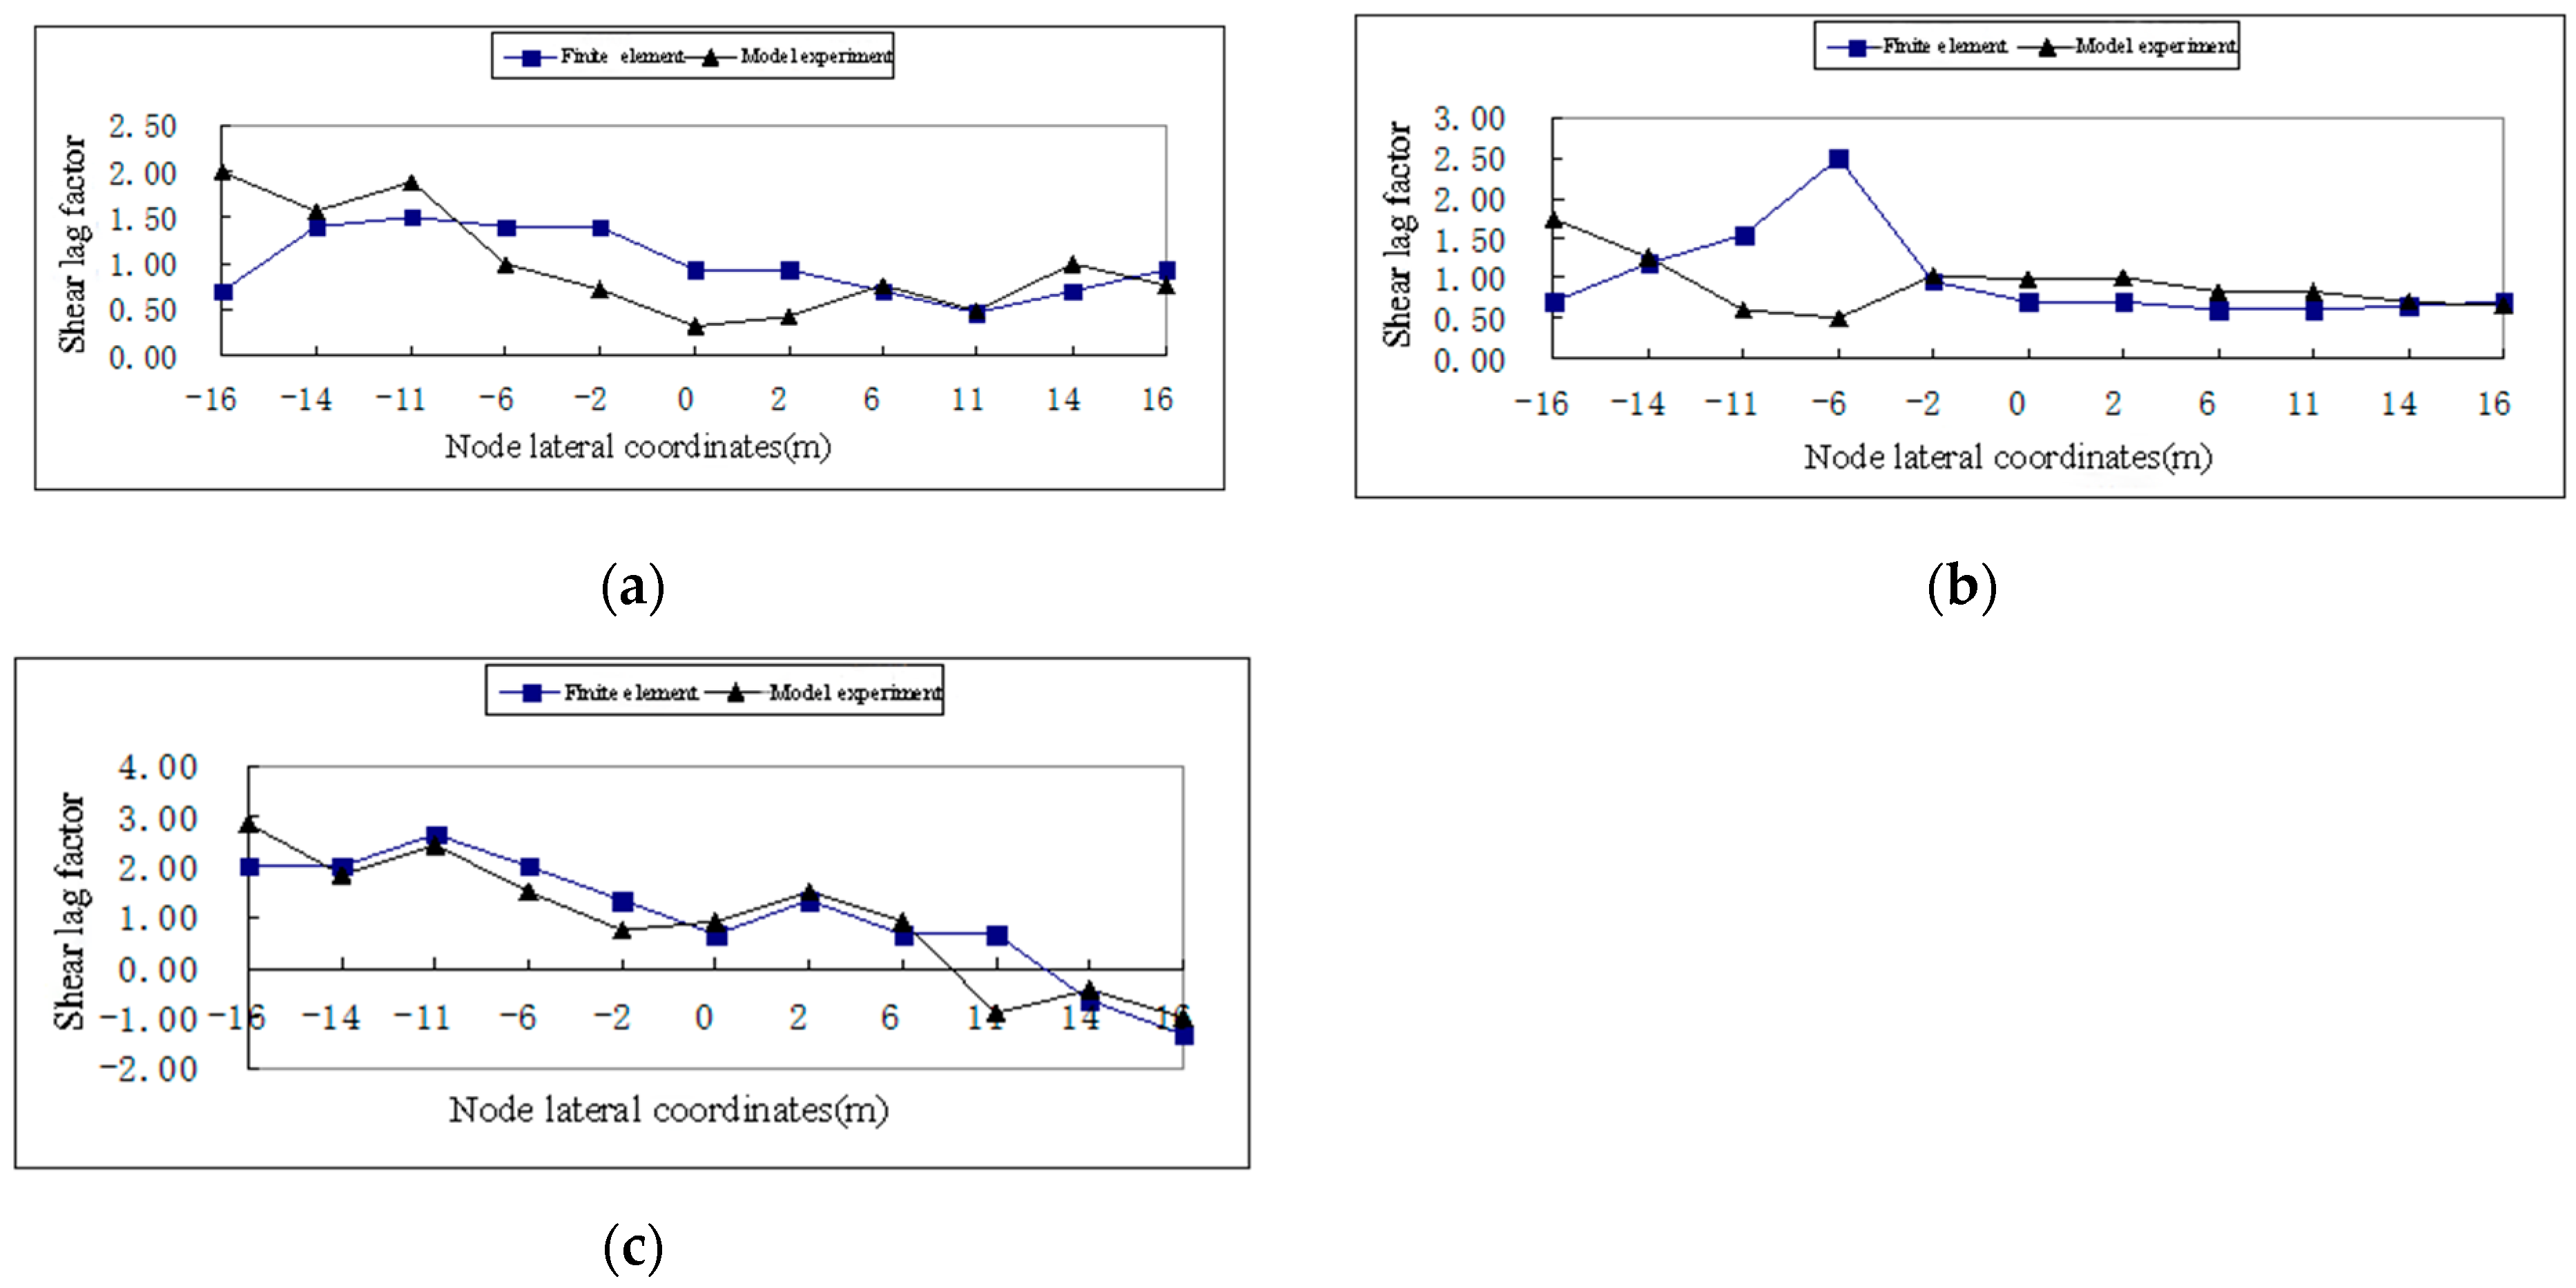
The results of the model test showed that the distribution of the shear lag coefficient at the upper edge of the G1 and G5 sections of the main girder near the tower root was clearly misdistributed under the action of an eccentric load. The shear lag coefficient at the upper edge of the G9 section of the middle span main girder was relatively smooth, which indicated that the strong condition of the fix-jointed bridge tower and girder limited the torsion deformation of the section under the action of the eccentric load, such that stress near the loading position was more prominent.
(2)
The shear lag factor λ was related to the ratio of the bending moment to the axial force. When the bending moment axial force ratio increased, the total shear lag coefficient λ tended to the bending moment shear lag coefficient λM, while the bending moment axial force ratio decreased, and the total shear lag coefficient gradually tended to the axial force shear lag coefficient λN.
(3)
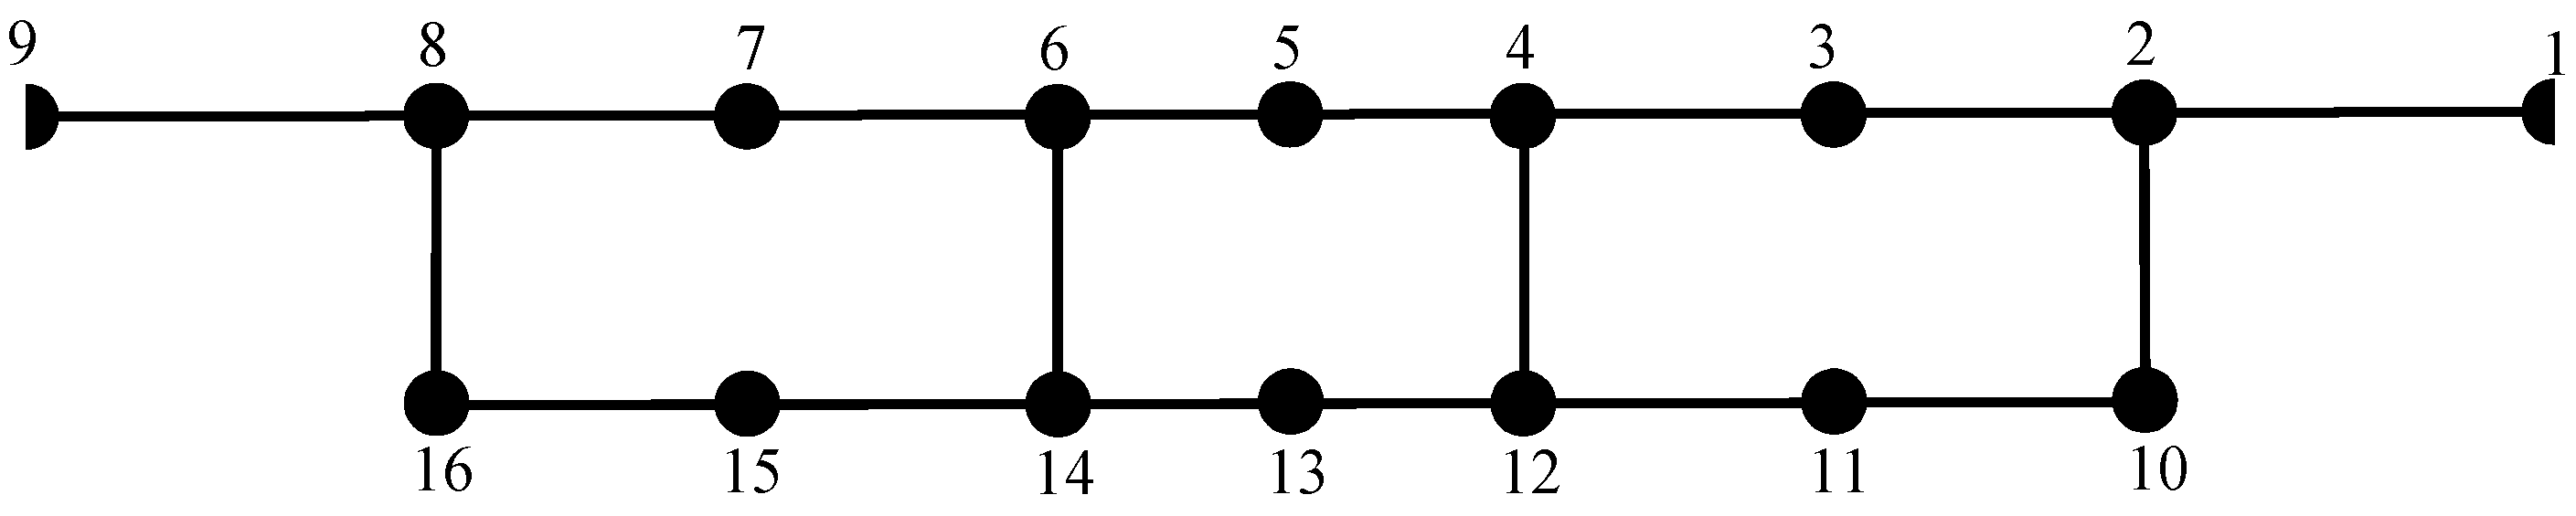
Using the bar simulation method, the calculation formula for the section normal stress of a single-box three-chamber box girder was derived. Under eccentric load, the shear flow was distributed in each web, and the related differential equations of the shear flow function of the top and bottom plates were obtained. By solving the matrix, the shear flow inside the stiffener and the stress on each stiffener were obtained. The theoretical analytical results were compared and verified with model test results.
(4)
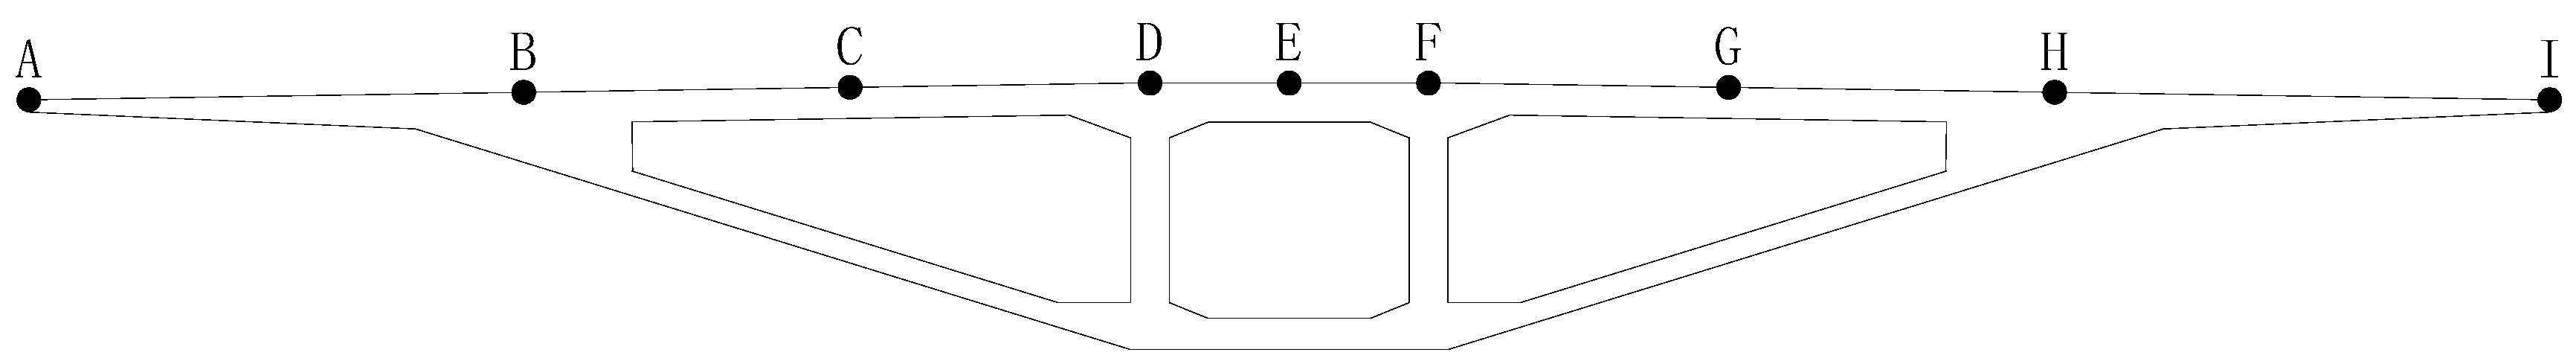
The results of spatial FE analysis showed that, when the PC cable-stayed bridge with a single-cable plane was close to the cable force point, the normal stress of the main girder section reached its maximum at the center of the upper wing plate. As the section analyzed moved away from the cable force point, the maximum normal stress trend was as follows: the center of the upper wing plate, the junction of the upper wing plate and mid-web, and the junction of the upper wing plate and mid-web and side-web.
(5)
Under eccentric load, positive and negative shear lag effects coexisted at the position of the side fulcrum. Near the middle fulcrum, due to the influence of constraints at the middle fulcrum, positive and negative shear lag effects were significant and their variation range large, with the top plate in this area generating large tensile stress.
In this paper, the shear lag effect of long-span single-cable-plane cable-stayed bridges under partial load is studied and analyzed. However, due to the complex stress situation of long-span thin-walled box beams, the stress situation of cable-stayed bridges of different structural types is not the same, so there are still many contents to be further studied, which are as follows:
(1)
The force and shear lag of the main beam of a PC cable-stayed bridge are more complicated, so it is necessary to carry out in-depth analysis in order to improve them.
(2)
The influence of the shear lag effect on different section forms of long-span cable-stayed bridges remains to be further discussed.
(3)
The research on the shear lag effect of cable-stayed bridges mostly exists in the stage of theoretical research and rule summary and analysis, and the optimization scheme of each component still needs further research.

Author Contributions

Conceptualization, methodology, software, and validation, formal analysis, investigation, resources, data curation, Y.L. (Yanfeng Li) and J.X.; writing—original draft preparation, writing—review and editing, visualization, Y.L. (Yanfeng Li) and F.W.; supervision, project administration, funding acquisition, F.W., D.W., J.W. and Y.L. (Yanao Liu). All authors have read and agreed to the published version of the manuscript.

Funding

This work was supported by the Natural Science Foundation of Liaoning Province (No. 2019-MS-265), and Project of Science and Technology Research, Education Department of Liaoning Province (No. 2021-LJKZ0589).

Data Availability Statement

Data used to support the findings of this study are available from the corresponding author upon request.

Conflicts of Interest

The authors declare that there are no conflicts of interests regarding the publication of this paper.

References

  1. Yang, L.F.; Leung, A.Y.T.; Li, Q.S. The stochastic finite segment in the analysis of the shear-lag effect on box-girders. Eng. Struct. 2001, 23, 1461–1468. [Google Scholar] [CrossRef]
  2. Chen, Y.Y.; Dong, J.C.; Xu, T.H.; Xiao, Y.F.; Jiang, R.J.; Nie, X.M. The shear-lag effect of composite box girder bridges with corrugated steel webs and trusses. Eng. Struct. 2019, 181, 617–628. [Google Scholar] [CrossRef]
  3. Zanuy, C.; Martínez, E.P.; Merino, R.; Jose, M.; Carlos, B. Experimental analysis of shear-lag effect in reinforced concrete T-beams. Eng. Struct. 2022, 256, 114009. [Google Scholar] [CrossRef]
  4. Lin, P.Z.; Liu, F.K.; Ji, W. Analysis on shear lag effect of concrete box beam by variational principle. J. China Railw. Soc. 2013, 35, 93–98. [Google Scholar]
  5. Zhang, Y.Y.; Zhang, H.; Li, W.; Yang, J. Analysis on shear-lag effect of box girders based on different shear-lag generalized displacement. J. Railw. Sci. Eng. 2011, 13, 1083–1090. [Google Scholar]
  6. Zhu, L.; Nie, J.G.; Ji, W.Y. Positive and negative shear lag behaviors of composite twin-girder decks with varying cross-section. Sci. China Technol. Sci. 2017, 60, 116–132. [Google Scholar] [CrossRef]
  7. Zhou, S.J. Finite beam element considering shear-lag effect in box girder. J. Eng. Mech. 2010, 136, 1115–1122. [Google Scholar] [CrossRef]
  8. Li, H.; Ou, J. The state of the art in structural health monitoring of cable-stayed bridges. J. Civ. Struct. Health Monit. 2016, 6, 43–67. [Google Scholar] [CrossRef]
  9. Martins, A.M.; Simões, L.M.; Negrão, J.H. Optimization of cable-stayed bridges: A literature survey. Adv. Eng. Softw. 2020, 149, 102829. [Google Scholar] [CrossRef]
  10. Zhang, L.; Qiu, G.; Chen, Z. Structural health monitoring methods of cables in cable-stayed bridge: A review. Measurement 2021, 168, 108343. [Google Scholar] [CrossRef]
  11. Vazquez-Ontiveros, J.R.; Vazquez-Becerra, G.E.; Quintana, J.A.; Carrion, F.J.; Guzman-Acevedo, G.M.; Gaxiola-Camacho, J.R. Implementation of PPP-GNSS measurement technology in the probabilistic SHM of bridge structures. Measurement 2021, 173, 108677. [Google Scholar] [CrossRef]
  12. Javanmardi, A.; Ghaedi, K.; Huang, F.; Hanif, M.U.; Tabrizikahou, A. Application of structural control systems for the cables of cable-stayed bridges: State-of-the-art and state-of-the-practice. Arch. Comput. Methods Eng. 2022, 29, 1611–1641. [Google Scholar] [CrossRef]
  13. Wu, G.; Hong, X. Theoretical and experimental study on shear lag effect of partially cable-stayed bridge. J. Zhejiang Univ.-Sci. A 2005, 6, 875–877. [Google Scholar] [CrossRef]
  14. Sheng, X.B. Analysis of shear lag effect in the main girder of wide low-pylon cable stayed bridge. Constr. Technol. 2020, 44, 76–79. [Google Scholar]
  15. Burgan, B.A.; Dowling, P.J. The treatment of shear lag in design. Thin-Walled Struct. 1990, 9, 121–134. [Google Scholar] [CrossRef]
  16. Li, X.; Wan, S.; Zhang, Y.; Zhou, M.D.; Mo, Y.L. Beam finite element for thin-walled box girders considering shear lag and shear deformation effects. Eng. Struct. 2021, 233, 111867. [Google Scholar] [CrossRef]
  17. He, X.; Xiang, Y.; Chen, Z. Improved method for shear lag analysis of thin-walled box girders considering axial equilibrium and shear deformation. Thin-Walled Struct. 2020, 151, 106732. [Google Scholar] [CrossRef]
  18. Marin, M.; Agarwal, R.P.; Baleanu, D. On a generalized relaxed Saint–Venant principle. Bound. Value Probl. 2018, 2018, 112. [Google Scholar] [CrossRef]
  19. Zhu, L.; Su, R.K.L. Analytical solutions for composite beams with slip, shear-lag and time-dependent effects. Eng. Struct. 2017, 152, 559–578. [Google Scholar] [CrossRef]
  20. Luo, Q.Z.; Wu, Y.M.; Li, Q.S.; Tang, J.; Liu, G.D. A finite segment model for shear lag analysis. Eng. Struct. 2004, 26, 2113–2124. [Google Scholar] [CrossRef]
  21. Yang, Y.B.; Yang, J.P. State-of-the-art review on modal identification and damage detection of bridges by moving test vehicles. Int. J. Struct. Stab. Dyn. 2018, 18, 1850025. [Google Scholar] [CrossRef]
  22. Kordestani, H.; Xiang, Y.Q.; Ye, X.W.; Jia, Y.K. Application of the random decrement technique in damage detection under moving load. Appl. Sci. 2018, 8, 753. [Google Scholar] [CrossRef]
  23. Zhang, J.Y.; Aoki, T. Damage detection of multi-story shear buildings due to earthquakes by model updating method. Struct. Control Health Monit. 2017, 24, e1895. [Google Scholar] [CrossRef]
  24. Chen, Y.; Zhang, J.H.; Li, Y.F.; Li, J.L. Analysis of Bridge Health Detection Based on Data Fusion. Adv. Civ. Eng. 2022, 2022, 6893160. [Google Scholar] [CrossRef]
  25. Li, Y.; Sun, X.; Bao, L. PC cable-stayed bridge main girder shear lag effects: Assessment of single cable plane in construction stage. Adv. Mater. Sci. Eng. 2020, 2020, 2646513. [Google Scholar] [CrossRef]
  26. Zhang, Y.G.; Li, Y.N. Analysis on Shear Lag Effect of Box Girder subject to dynamic load. Appl. Mech. Mater. 2014, 501, 811–814. [Google Scholar] [CrossRef]
  27. Zhang, Y.H.; Yang, Z.J.; Liu, S.Z. Shear Lag in Thin-Walled Box Girder with Variable Section. Adv. Mater. Res. 2011, 194, 1165–1169. [Google Scholar] [CrossRef]
  28. Křístek, V.; Bažant, Z.P. Shear lag effect and uncertainty in concrete box girder creep. J. Struct. Eng. 1987, 113, 557–574. [Google Scholar] [CrossRef]
  29. Shi, J.X.; Ran, Z.H. Calculation of creep effect of extradosed cable-stayed bridge based on Midas Civil. IOP Conf. Ser. Mater. Sci. Eng. 2018, 423, 012113. [Google Scholar] [CrossRef]
  30. Wu, F.W.; Xue, C.F. Construction Control and Simulation Analysis of Long-Span Cable-Stayed Bridge. Adv. Mater. Res. 2011, 255, 816–820. [Google Scholar] [CrossRef]
  31. Wu, J.; Frangopol, D.M.; Soliman, M. Geometry control simulation for long-span steel cable-stayed bridges based on geometrically nonlinear analysis. Eng. Struct. 2015, 90, 71–82. [Google Scholar] [CrossRef]
  32. Sun, Y.; Xu, Y.; Lozano-Galant, J.A.; Wang, X.M.; Turmo, J. Analytical observability method for the structural system identification of wide-flange box girder bridges with the effect of shear lag. Autom. Constr. 2021, 131, 103879. [Google Scholar] [CrossRef]
Figure 1. Bridge structure diagram (mm) [24]. (a) Arrangement of the main bridge (m). (b) Cross-section of midspan girder (cm). (c) Cross-section of side-span girder (cm).
Constrmater 04 00023 g001
Figure 2. General arrangement drawing of model (mm). (a) Midspan section diagram [25]. (b) Schematic diagram of subsection diagram [25]. (c) Temporary support and loading diagram [25]. (d) Normal stress measuring point arrangement of box girder test section diagram [25]. (e) Shear stress measuring point arrangement of box girder test section diagram.
Constrmater 04 00023 g002aConstrmater 04 00023 g002b
Figure 3. Installing of the model. (a) Second stage dead load applied by model. (b) Model exerts live load [25].
Constrmater 04 00023 g003
Figure 4. FE model of the full bridge solid element.
Constrmater 04 00023 g004
Figure 5. Main girder cross-section feature point arrangement diagram.
Constrmater 04 00023 g005
Figure 6. Distribution of longitudinal bridge shear lag coefficient under LCP1 working conditions. (a) Left side of pier 4#. (b) Right side of pier 4#.
Constrmater 04 00023 g006
Figure 7. Variation diagram of shear lag coefficient in G1, G9 and G5 (under uniform live load). (a) G1 section. (b) G9 section. (c) G5 section.
Constrmater 04 00023 g007
Figure 8. Cross-section of a single-box three-chamber beam.
Constrmater 04 00023 g008
Figure 9. Equivalent system of stiffener and thin plate.
Constrmater 04 00023 g009
Figure 10. Schematic diagram of the stiffener force. (a) Box girder with single box and three chambers. (b) Micro-segment of thin plate. (c) Balance force of top plate stiffener. (d) Balance force of bottom plate stiffener.
Constrmater 04 00023 g010aConstrmater 04 00023 g010b
Figure 11. Simplified cross-section diagram.
Constrmater 04 00023 g011
Table 1. Normal stress of each test of stiffening beam under eccentric load unit, MPa.
SectionPoint
Number
LCP1LCP2LCP3
G1G9G5
Top plate11.34−0.951.08
21.05−1.020.70
31.27−1.210.92
40.67−1.210.57
50.48−1.460.29
60.22−1.400.54
70.29−1.560.57
80.51−0.730.35
90.32−0.86−0.35
100.67−1.81−0.16
110.51−2.51−0.38
Average value0.67−1.340.38
Theoretical value0.85−1.270.52
Inclined web12−0.030.25−0.32
13−0.761.27−0.54
Bottom plate14−1.622.55
15−2.102.55−1.34
16−1.722.86−1.27
Average value−1.812.65−1.30
Table 2. Shear stress of test section of stiffened beam under eccentric load, MPa.
SectionPoint NumberLCP1LCP2LCP3
G1G9G5
Top Plate10.950.881.00
21.050.981.01
31.110.941.05
41.140.880.88
inclined soleplate51.080.840.87
61.000.900.97
70.880.901.01
80.970.951.00
Table 3. Equations for the area of the stiffener.
Stiffener DesignationStiffener Area Equation
A1/A9 b 3 β 1 × t 1
A2/A8 1 H t w + β 1 × t 1 4 ( 4 b 3 + 2 b 2 )
A3/A5/A7 b 1 β 1 × t 1
A4/A6 1 H t w + b 2 β 1 × t 1
A10/A16 2 H t w + b 2 β 2 × t 2 2
A11/A13/A15 b 2 β 2 × t 2
A12/A14 2 H t w + b 2 β 2 × t 2
Table 4. Stress comparison table under various eccentric load conditions.
Measuring Point NumberLCP1LCP2LCP3
G1G9G5
Actual ValueTheoretical ValueError ValueActual ValueTheoretical ValueError ValueActual ValueTheoretical ValueError Value
11.341.321.49%−0.95−0.972.11%1.081.090.93%
21.051.060.95%−1.02−1.010.98%0.700.722.86%
31.271.242.36%−1.21−1.191.65%0.920.911.09%
40.670.661.49%−1.21−1.200.83%0.570.581.75%
50.480.472.08%−1.46−1.450.68%0.290.283.45%
60.220.234.55%−1.40−1.390.71%0.540.531.85%
70.290.276.90%−1.56−1.541.28%0.570.581.75%
80.510.545.88%−0.73−0.721.37%0.350.342.86%
90.320.306.25%−0.86−0.882.33%−0.35−0.342.86%
100.670.627.46%−1.81−1.820.55%−0.16−0.176.25%
110.510.477.84%−2.51−2.490.80%−0.38−0.392.63%
12−0.03−0.040.00%0.250.244.00%−0.32−0.313.13%
13−0.76−0.742.63%1.271.260.79%−0.54−0.551.85%
14−1.62−1.641.23%2.552.570.78%−1.24−1.240.00%
15−2.10−1.909.52%2.552.570.78%−1.34−1.350.75%
16−1.72−1.741.16%2.862.880.70%−1.27−1.260.79%
17−0.89−0.901.12%0.640.663.13%−0.73−0.741.37%
18−0.29−0.303.45%0.320.313.13%−0.03−0.030.00%
Disclaimer/Publisher’s Note: The statements, opinions and data contained in all publications are solely those of the individual author(s) and contributor(s) and not of MDPI and/or the editor(s). MDPI and/or the editor(s) disclaim responsibility for any injury to people or property resulting from any ideas, methods, instructions or products referred to in the content.

