Abstract
This paper presents results from numerical simulations validated by experimental results related to the effects of dynamic soil-structure interaction (DSSI) on the dynamic response of bridges. An in-service overpass was shaken using the T-Rex, a large-amplitude mobile shaker from the National Hazards Engineering Research Infrastructure (NHERI) facilities. Studies implementing Finite Element Modeling (FEM) to develop time histories, response spectra, and eigenmodes were conducted in a forward-modeling problem setup. Two models were created to assess the DSSI effects on the dynamic response of the bridge. One model included elements that incorporate DSSI effects, while the other had fixed-base boundary conditions. The response from the DSSI FEM model matched the field results better than the fixed-base model in terms of the peak response amplitudes and identified natural frequencies and modes. The influence of a series of factors, such as the soil shear wave velocity, bridge height, bridge foundation embedment depth, and the corresponding rigidity, slenderness, and embedment ratios, on the bridge response is presented.
1. Introduction
A fixed base, typically at the grade level, is assumed in the design or dynamic response analyses of bridges. However, the soil–foundation flexibility, energy absorption, and radiation by the soil system can alter the response of bridges to dynamic loads [1,2]. This interaction between the structure, foundation, and soil, which in some cases may even change the dynamic load transmitted through the ground which is, in general, referred to as the dynamic soil–structure interaction (DSSI). To quantify the effects of DSSI on structural response, it is customary practice to compare the analysis results of a structure incorporating DSSI effects with one that has a fixed base. According to the commentary section of FEMA P-2082-1 NEHRP Recommended Seismic Provisions For New Buildings And Other Structures [3], DSSI effects are inertial, kinematic, and foundation deformation effects.
While the actual structure–soil–foundation vibration is a 3D problem, it has been established that in a simplified form, the dynamics of a bridge-foundations-soil system is analogous to a single degree-of-freedom (DOF) oscillator [4]. A spring-dashpot-mass system would oscillate about its equilibrium position in a translational motion. To establish the analogy of 1-DOF oscillators to bridges, it is essential to identify the different elements involved. Figure 1 shows a typical cross-section at the pier of notional bridges, describing the load transfer mechanism from the superstructure onto the soil in a structure-foundation-soil system. However, in forced vibration experiments of buildings, it is common to shake the structure on the roof or a certain floor. In the case of bridges, the shaking takes place on the deck. The girders in Figure 1 can be either structural steel or reinforced concrete beams. Pier caps can be single-pier or multi-pier caps, and the piers typically rest on a single connected spread footing. A lumped mass system can represent this section as depicted in Figure 2, with translation and rotation of the foundation introduced to the system. Those lead to swaying and rocking responses of the system. Due to the additional compliance at the footing compared to the fixed-base oscillator, it is always the case that the inclusion of DSSI effects would soften the structure [5].
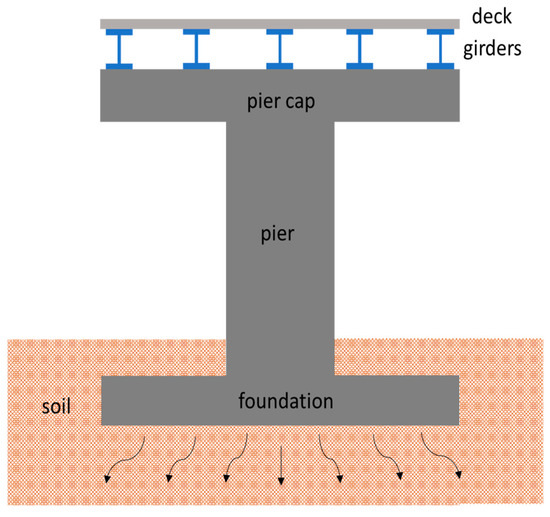
Figure 1.
Typical cross-section at notional bridge piers, showing different components of a structure-foundation soil system.
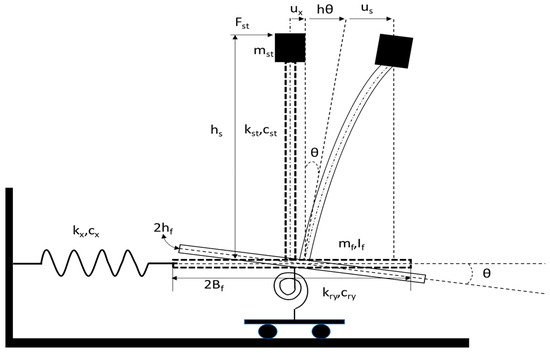
Figure 2.
Description of soil–structure–foundation system in notional bridges at the pier section.
There are several research efforts that studied DSSI effects on bridges utilizing ambient vibrations or historic earthquake records [6,7,8,9]. However, the experimental validation of DSSI effects through field measurements still needs to be extensively studied. Large-amplitude shaking is promising since it can excite the entire structure–soil–foundation system (SFS) in a nondestructive manner. Nevertheless, there are some research efforts implementing various forced/controlled vibrations on serviceable structures for dynamic characterization of super- and substructures [10,11,12,13].
The purpose of this paper is to examine the effects of DSSI on the dynamic behavior of in-service bridges, by conducting experimental and numerical evaluations. DSSI effects are related to the response under typical heavy traffic load levels, while providing adequate loading to discern DSSI effects. Other methods presented in the literature suffer from low-level loads, substantially lower coherence, and they cannot excite the entire bridge-foundation-soil system [14]. The influence of stiffness and embedment ratios through the altering of structural height, embedment depth, and shear wave velocity was examined. To excite the bridge, T-Rex, a large mobile shaker from the NHERI facilities, was used in this research effort. Three-dimensional FEM simulations of the tested bridges were established to assess the DSSI effects, and the results of a fixed-base model were compared to those from a model incorporating DSSI effects. Output in time and frequency domains, and the eigenmodes, were compared to the experimental results to assess the accuracy of both models. The paper presents a first-of-its-kind experimental program that involves using large-amplitude mobile shakers to examine dynamic characteristics of in-service bridges.
2. Factors Controlling DSSI
When addressing the effects the inclusion of DSSI introduces to a structure, it is imperative to understand that those imply the extent to which DSSI alters the dynamic response when compared to the response of the same structure with a fixed base. Such factors that control this extent are discussed in this subsection. In general, these factors affect the structural response, resonant frequencies, damping, and in some cases the overall dynamic behavior of a structure-foundation-soil system. In addition, to standardize the comparison between various geometric and material aspects, sub- and superstructural configurations, and different dynamic behavior structures can exhibit at different frequencies, the dimensionless frequency a0 is introduced as where ω is the excitation frequency, B is the half-width of a footing (or radius if circular), and Vs is the effective shear wave velocity of the underlying soil. The effect of the following factors will be examined in the follow-up sections.
- Structure-to-Soil Stiffness Ratio (Rigidity Ratio):
This ratio is defined as , where h is the total structural height, and T is the period of the 1st mode. Increasing (a taller bridge or resting on softer soils) leads to an immediate drastic reduction in resonant frequencies when compared to a fixed base. At = 1, a reduction in natural frequency of up to 35% is expected compared to = 0 [14]. On the other hand, increasing significantly increases effective or equivalent damping.
The effect of increasing on the maximum structural response (displacement or forces) can either increase or decrease as a function of when compared to a fixed base. Overall, increasing leads to increasing DSSI effects to varying extents depending on whether vertical, rocking, or swaying motions are the predominant mode of vibration [14,15,16]. This parameter is the most influential in controlling the extent of DSSI effects. In general, a foundation can be considered rigid if is > 10 [17].
- Structure-to-Soil Slenderness Ratio:
This ratio is defined as where a is the characteristic dimension of the footing (radius if circular, or half-width if rectangular). Maximum displacements at the roof displacements significantly increase as the slenderness ratio increases. The amplification of roof motions due to DSSI effects relative to a fixed-base structure is caused by the dynamic behavior becoming governed by rocking motion. However, taller structures at the same rigidity ratio become less prone to period elongation (structural softening) effects from the DSSI. This means that taller structures do not necessarily experience more DSSI effects, especially since they typically possess low rigidity ratios. Moreover, the overall damping significantly decreases with a decreasing slenderness ratio at the same rigidity ratio. These effects are reversed between tall and short structures. The extent to which (whether amplification or reduction) DSSI effects alter the structural response (forces and displacements) of the structure–soil–foundation system depends on how far the resonant frequencies are changed relative to the fixed-base structure [14,18,19,20].
- Structure-to-Soil Mass Ratio:
This ratio is defined as where m is the effective modal mass supported by the foundation, ρ is the mass density of the underlying soil, and V is the volume of soil excited around the foundation equivalent to the volume of the foundation. Smaller values of the mass ratio lead to a lesser extent of DSSI effects on a structure relative to one with a fixed base. Increasing the mass ratio significantly reduces the structural peak dynamic response relative to a fixed-base response. This effect is even more pronounced in embedded foundations, especially at higher frequencies (a0 > 1.5) [21]. In general, increasing the mass ratio leads to an increase in impedance, owing to a more meaningful increase in the real part (stiffness) than the imaginary part (damping) [22,23]. This is expected since hysteretic (material) damping is frequency-independent at low strains since it is controlled by the frictional forces between the soil and foundation at the interface. The dependence of the imaginary part of impedance on frequency would be driven by radiation damping, which can vary in complexity. It can be neglected in some sites, while other sites may exhibit significant viscous damping [14].
- Embedment Ratio:
This ratio is defined as where D is the foundation embedment depth. The current discussion is for perfect contact between the sidewall of the soil and the foundation throughout dynamic loading. Increasing the embedment ratio leads to a significant increase in the impedance in all vibration modes. This can affect the softening of a structure, hence the extent of DSSI effects, relative to a fixed-base scenario. The imaginary part of the impedance (damping) significantly increases when compared to a surface foundation, across all vibration modes. On the other hand, the increase in dynamic stiffness is more pronounced for rocking than vertical or horizontal modes. In addition, the trench height (the height of the sidewall embedded) shows a similar trend, the impedance increases with increasing embedment ratio. In other words, this increase is 0 for a surface foundation and increases gradually as the foundation is more embedded and passes by the minimum embedment ratio, where the foundation is just embedded below the ground surface [4]. This effect is true for various types of foundations, including strip footings and piles [24]. As a result, a higher embedment typically leads to an increase in resonant frequencies relative to a surface foundation, while peak response is reduced primarily due to damping. Furthermore, the kinematic interaction is altered depending on the location of the foundation relative to the free field. Therefore, appropriate estimation of foundation input motions should be considered when conducting a complete DSSI analysis, since they can alter the response. In general, increasing the embedment can lead to lower structural demands [3].
- Other Factors:
Apart from the aforementioned factors, other parameters can alter the response of a structure-foundation-soil system, one of which is the configuration of the underlying soil.
The above factors are discussed presuming the foundation lies on a homogeneous half-space, which can vary by site. Some sites may have layered stratum over half-space or bedrock. In this case, the extent to which the dynamic properties would be altered depends on the thickness of the layers and the distance to the bedrock/half-space [4,25]. Furthermore, factors affecting the soil rigidity can affect the response amplitudes, due to an altering of the static stiffness. These include the angle of internal friction, Poisson’s ratio, void ratio, degree of saturation, confining pressure, and grain characteristics [26,27]. The extent to which these factors influence the response depends on the strain level the soil is undergoing under a given load scenario. In addition, the implicit inclusion of DSSI effects and derivation of closed-form solutions for rocking and sliding foundations were studied in the literature [1,28,29,30,31,32,33].
3. Experimental Program
The experimental program was designed to conduct large-amplitude shaking of an in-service bridge to assess the extent of DSSI effects on its dynamic response. Hobson Avenue Bridge, a bridge over Interstate 195 in Hamilton Township, New Jersey, was selected for the study. It is a 67.4 m two-span continuous steel multi-girder bridge with rocker end bearings supported by a three-column bent on a shallow continuous reinforced concrete (RC) footing. Figure 3 shows a side view of one of the bridge spans, while Figure 4 shows the dimensions of the super- and substructure.
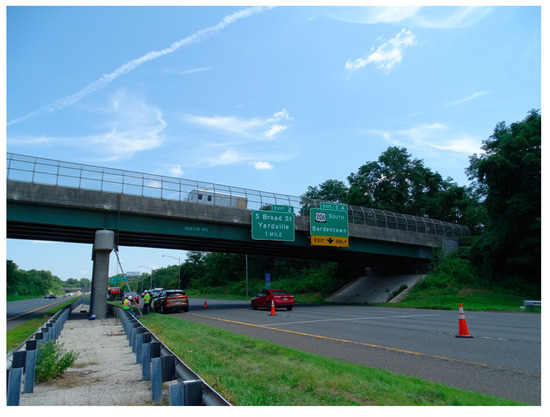
Figure 3.
In-service bridge tested in this study.
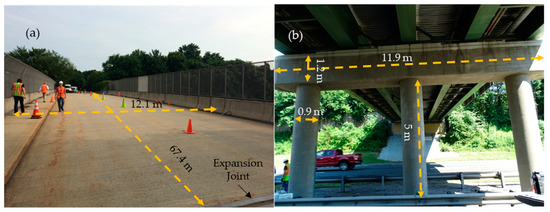
Figure 4.
(a) Deck dimensions, and (b) substructure dimensions of the tested bridge.
T-Rex was used to shake the bridge as shown in Figure 5a. It can induce large-amplitude vibrations of the bridge which can be monitored in real-time in a control room, as shown in Figure 5b. The control room is moved off the bridge before testing. The maximum force output is limited by the hold-down weight of the T-Rex truck. To measure the force, T-Rex uses accelerometers mounted on the reaction mass and base plate of the shaker from which the force output can be calculated. The excitation amplitude was capped at 94 kN transversely and 48 kN vertically to limit the bridge response to about 2.54 cm/s.
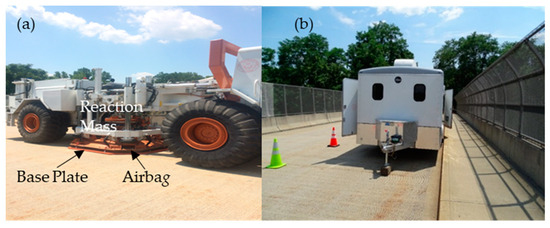
Figure 5.
(a) T-Rex, and (b) control room to monitor response in real-time on Hobson Avenue Bridge.
A linear chirp function, shown in Figure 6 was used to conduct the T-Rex shaking on the bridge. The frequency of the load decreased linearly from the start to end frequency during a given time. This function minimizes the number of loading cycles required. A linear chirp from 15 Hz to 1 with a total duration of 32 was implemented.
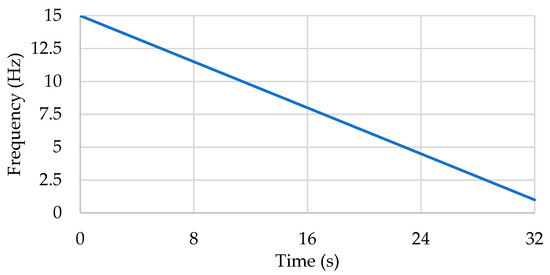
Figure 6.
A reverse linear chirp signal used to excite the bridge from 15 Hz to 1 Hz.
A sampling rate of 200 Hz (or time increments of 0.005 s) was selected for the driving force, which satisfies the Nyquist frequency condition. The shaking was conducted the three directions (vertical, transverse, and longitudinal) and at varying magnitude levels. The driving force was incrementally increased until the maximum response reached 2.54 cm/s. Except for one run, all runs were repeated to ensure data quality and to estimate the coherence function. Geophones were used to measure the response of the bridge at multiple locations on the bridge and the ground response up to 23 m away from the bridge. The overall sensor layout of geophones used to measure the bridge response is shown in Figure 7. A total of 45 geophones were employed (1 for each sensing direction), and the bridge was shaken in the directions indicated by black arrows in Figure 7. Results from the ground geophones were used to evaluate which vibrations were measurable above ambient vibrations. In addition, four single stations for horizontal-to-vertical (H/V) spectral ratio noise measurements in the free field were placed on the bridge perimeter to evaluate site effects and identify the fundamental resonant frequency of the soil deposit. Each single station measurement location is denoted relative to the Hobson Avenue Bridge (i.e., NW, NE, SW, and SE).
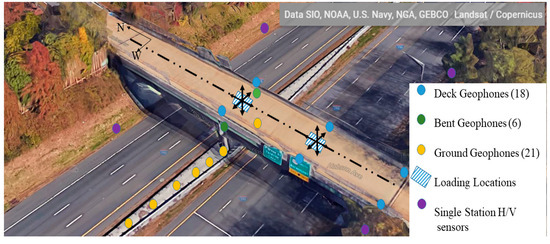
Figure 7.
Overall sensor layout and T-rex loading positions. Reprinted with permission from Ref. [34].
The site’s shear wave velocity (Vs) profile was obtained through Multichannel Analysis of Surface Waves (MASW) testing before bridge testing. Various inversion parameterizations for the theoretical fundamental mode Rayleigh wave dispersion, considering several layering ratios, were evaluated to match the experimental data and to obtain the Vs profile of the site. An average shear wave velocity of 200 m/s was deemed appropriate for the depth down to about 15 m.
4. Description of Numerical Model
COMSOL Multiphysics software (Version 6.1) was used in this research to produce 3D FEM simulations of the Hobson Avenue Bridge and the response to the dynamic excitation. To investigate the effect of DSSI on the actual bridge response, two 3D models were established. The first incorporates DSSI effects, while the other has a fixed base. In both the fixed-base and DSSI-incorporating FEM models, 3D solid elements were utilized to model all components of the bridge. Results from an auxiliary (not presented herein) model showed that maximum strain values are in the order of 5 × 10⁻⁵. Therefore, linear elastic material properties were assigned in both models to all domains, since the response was in the elastic range due to the controlled vibration levels. Hence, soil properties remain constant and they represent low-strain moduli and damping conditions.
Impedance functions of a sub-structured (SFS) were modeled as a system of frequency-dependent translational and rotational springs and viscous dampers to incorporate the DSSI effects in the model. The boundary conditions at abutments did not incorporate DSSI effects in the model, and the bridge had rocker bearings at its ends. This is to reflect the actual experimental setup conducted in the study in which loading was applied directly above the pier and at mid-span. Hence, the response was primarily controlled by the pier footing boundary conditions. The formulae and parameters for embedded rectangular foundations in a homogenous half-space were used to describe the impedance of the foundation. Details about obtaining the impedance functions are found in [35].
Figure 8 depicts an overview of the 3D model developed in COMSOL, which matches the geometry and dimensions of the actual bridge. Rayleigh damping was used to describe the damping characteristics of the bridge superstructure. Rayleigh damping is defined as viscous damping and is proportional to a linear combination of mass (M) and stiffness (K). It is expressed in terms of mass and stiffness as ξ = MαdM + Kβdk, where αdkM is the mass damping parameter, and βdk is the stiffness damping parameter. A value of βdk = 0.0065 was selected to represent the structural damping. αdM = 0 was set in the study since inertial effects are low in low-frequency ranges, and the behavior is more stiffness controlled. In addition, βdk was fixed in both time and frequency domains to maintain compatibility and modeling simplicity. It is a theoretical limitation that the damping loss factor cannot be set as a function of frequency in time domain studies. However, multiple Rayleigh damping ratios at multiple frequencies can lead to more accurate results in the frequency domain. Free tetrahedral elements with adaptive sizing were used to mesh the entire domain. Figure 9 illustrates the overall meshed model, in which concrete elements had coarser meshes, while steel elements (girders and bracing) were fine-meshed. This meshing resulted in 1,007,262 degrees of freedom (DoFs).
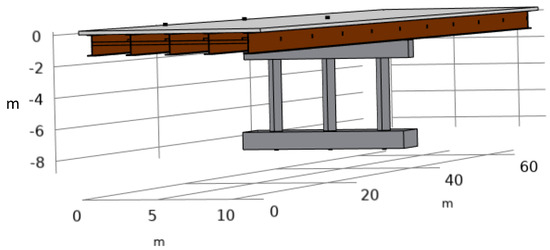
Figure 8.
3D view of the Hobson Avenue Bridge FE model in COMSOL.

Figure 9.
Side and bottom views of the bridge model mesh.
5. Experimental Results
The primary goal of shaking the Hobson Avenue Bridge was to perform structural identification (St-Id) to obtain resonant frequencies and modal damping. Experimental Modal Analysis (EMA) was performed from signals measured in the time domain and processed to produce various outputs. Figure 10 shows a typical time history obtained for bridge response from various signals, with the caption providing information about the loading direction and response measured. The response from one side of the bridge is shown as an example to avoid a cluttered representation. Power spectra are helpful to show at which frequencies the energy of a time-varying signal is concentrated. The variation of the response was examined under vertical and transverse highest loading scenarios when T-Rex was placed above the bent and at the mid-span to determine resonant frequencies of the soil–foundation–bridge system. The geophones above the bent were critical for identifying the transverse and rocking mode shapes since the bent of the bridge can capture the rocking motion. To obtain natural frequencies from the results, peak picking was used. Seven distinct natural frequencies of the bridge were identified. The modes were easily identified from the far-apart peaks, as presented in [36]. However, a complex motion of the bridge occurs in the 4–5 Hz range due to closely spaced modes. The first mode encountered occurs at 4.37 Hz. A peak in the vertical response occurs at 4.49 Hz, which is driven by the high energy vertical vibration of one of the bridge modes even though the shaking is horizontal, indicating the existence of a vertical mode of vibration. Two modes with dominant horizontal motion occur at 4.37 Hz and 4.61 Hz.
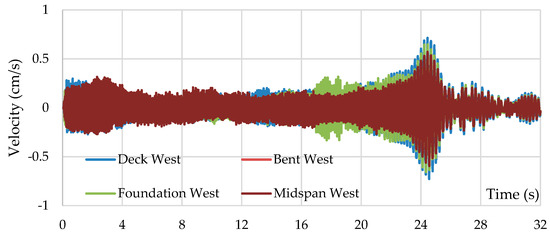
Figure 10.
Transverse response time histories from sensor locations mentioned in the legend to transverse shaking at 18 kN with T-Rex centered above the pier.
Eigenmodes are a function of intrinsic properties of the structure (mass, stiffness, and damping), and force amplitude or location should not affect their determination. In addition, there are three closely spaced modes (nominally 4.35 Hz, 4.51 Hz, and 4.61 Hz) that inevitably influence each other, so peak picking can be inaccurate. For sparse modes, peak picking and damping estimation using the half-power method can be used to determine resonant frequencies and damping, respectively. Therefore, an additional step was conducted to provide a better determination of the resonant frequencies and damping. The Rational Fraction Polynomial (RFP) Method was utilized to extract the mode shapes. This was conducted by curve-fitting the Frequency Response Functions (FRFs) of the time histories. A dynamic model is fit through the data within a given order, and the order is increased until an adequate fit is achieved [37]. However, increasing the model order can introduce noise modes since bridges are continuous systems that have infinite mode shapes; those could be identified and eliminated since they are trivial modes. In addition, a Modal Complexity Factor (MCF) given by (1) was estimated for the three closely spaced mode shapes. The MCF values are between 0–1, with values closer to 1 indicating a real-valued eigenmode, while values closer to 0 indicate a complex mode, which can suggest the presence of nonclassical damping [38].
where Lxx = Re(φ)T × Re(φ), Lyy = Im(φ)T × Im(φ), and Lxy = Re(φ)T × Im(φ) are scalar products from the mode shape φ.
The estimation of damping is a subsequent step after determining the resonant frequencies in EMA. Table 1 summarizes the findings from the EMA performed on Hobson Avenue Bridge. The resonant frequencies obtained experimentally will be the basis for comparison with eigenmodes from the numerical simulations. The complexity of modes 3–5 is a result of them being closely spaced and an indication of non-proportional damping in the soil-foundation-structure system. In addition, the obtained damping in Table 1 represents the structural damping of the deck. It is noteworthy to mention that the bridge exhibited higher vertical rigidity than lateral rigidity, as observed from the non-proportionally lower vertical responses relative to the load levels applied. The MCFs of modes 1, 2, 6, and 7 were neglected since those modes are of lesser importance.

Table 1.
Summary of the EMA and modal parameters obtained from shaking the Hobson Avenue Bridge.
6. Results from Numerical Simulation and Model Validation
Two FEM models were established to assess the effects of DSSI on bridge response in this study. The first model incorporated DSSI through the inclusion of impedance functions on the foundation level, while the second was a fixed base bridge model. An eigenfrequency analysis was conducted to identify the eigenvalues (natural frequencies) and eigenvectors (mode shapes) of the bridge from the DSSI-incorporating model and to compare those with the modes at frequencies in Table 1. Figure 11 shows the same mode shapes extracted from both numerical models, which were normalized with respect to the mass matrix. Table 2 illustrates the comparison of the eigenfrequencies obtained from bridge testing with those from both models. Dashpot damping assigned to the footings resulted in complex-valued eigenmodes, which shows that the mode shapes exhibit some complexity. This is the case because whenever damping is included in a FEM model, eigenmodes become complex. The fixed-base model exhibited real mode shapes.
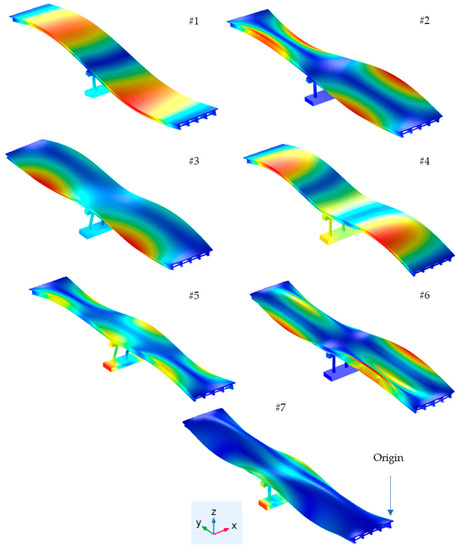
Figure 11.
Modes shapes obtained from FE models for fixed-base and DSSI inclusion scenarios.

Table 2.
Eigenfrequencies obtained from numerical simulations of DSSI-incorporating and fixed-base models.
The imaginary part is indicative of energy loss at the foundation level due to damping and energy decay rate for each cycle. As expected, the resonant frequencies for each eigenmode are higher for the fixed base model compared to the DSSI-incorporating model. It was also observed that higher energy losses are incurred as frequency increases in both models when isotropic damping is considered. Both models achieved adequate accuracy, with a slight accuracy advantage over the DSSI-incorporating model.
To assess the contribution of each mode (or mobilization of effective dynamic mass) to the total response, the Modal Participation Factors (MPF) were determined for each eigenmode from the DSSI-incorporating model. This was performed for translational and rotational DOFs. For a certain mode shape, the participation factor (γi) can be defined through (2).
where {ϕi} is the ith mode shape vector, [M] is the mass matrix, and {D} is a unit displacement/rotation vector in the direction of excitation for global Cartesian coordinates and rotations about their axes. The effective mass Meff,i is defined as . Subsequently, the ratio of effective mass to total mass indicates the contribution of the ith mode to the dynamic response of the bridge (MPF). The estimated total mass of the bridge is 1,029,400 kg, including the weight of the T-Rex. The mass moment of inertia was used instead of the mass to calculate MPFs for rotational DOFs. This is not as straightforward as determining translational MPFs, since this calculation requires knowledge of the center of mass of individual components of the SFS system. However, as an approximation, (3) provides an estimate for the rotational MPF of typical/notional bridges.
where Ji,r is the mass moment of inertia about the rth axis for the ith (e.g., J1,x = m[Y2 + Z2]), (X, Y, Z) is the center of mass of the SFS system, and n is the modifier between 3–5 to account for the overall off-center estimation in lieu of individual bridge components estimation. An average value of n = 4 was used, and the center of mass of the SFS system was found to be at (6.05, 33.7, −1.19) m from the origin indicated in Figure 11. Table 3 summarizes the estimated MPFs for each DOF. It can be observed that the presented modes capture most of the responses fairly, with the lowest MPF of ~0.65 for the significant motions. As expected, MPFy and MPFz-z, which correspond to translation along Y (longitudinal swaying) and rotation about Z (global torsion), are approximately 0. This confirms a proper assignment of boundary conditions. Furthermore, Mode#5 contributes as high as ~0.72 of MPFy-y (rocking), while Mode#3 contributes ~0.18 (both modes represent 0.9 of this motion). This indicates that rocking is primarily the vibration mode of Mode#5, while also exhibiting some swaying. On the other hand, Mode#3 has predominantly translation motion (swaying) compared to Mode#5. Nevertheless, swaying–rocking is coupled to some extent in both modes.

Table 3.
Summary of MPFs of each mode for translational and rotational DOFs.
After conducting the eigenfrequency study, numerical analysis and simulation of the experimental shaking were conducted in the time domain. This was also used to validate the FE model results against the experimental results. Since the boundary conditions of the footing are changing with frequency throughout the chirp, thus with time, (4) was used to define frequency (f(t)) in the time domain.
where fini = 15 Hz, t is time, and δf is the frequency gradient (0.4375 Hz/s). Figure 12 shows response time histories caused by the lateral shaking for both the experimental and numerical results. The DSSI-incorporating model was more accurate than the fixed-base model when compared to the experimental results. Around resonance, the DSSI model showed a better match with the experimental results, supplemented by a lower mean absolute error (MAE). Table 4 shows a comparison of measured response and corresponding frequencies as obtained from the experimental results and both FE models. The maximum response from the experiment, 2.62 cm/s, occurred at a frequency of 4.16 Hz, as shown in Table 4. The maximum amplitude at the same frequency of the DSSI model was 2.53 cm/s, with a relative amplitude error of −3.5%. Meanwhile, the response at the same frequency from the fixed-base model was 2.41 cm/s with a relative error of −8.1%. Therefore, the fixed-base assumption led to a higher error in the response amplitude at resonance. The decrease in resonant frequencies due to DSSI, compared to a fixed base model, is in agreement with experimental results from other studies [39,40]. This is important since, despite the error in estimating the peak response being lower, the fixed-base assumption may lead to the omission of a vibration mode. This lateral mode is caused by soil flexibility, and its omission could lead to analysis and design errors [41,42,43]. The validated models were used to calculate displacements. Figure 13 shows a comparison of the deck’s response to horizontal excitation at a magnitude of 93.4 kN between the fixed-base and model the model including DSSI effects. It can be observed that the fixed-base model does not exhibit the multiple modes determined from the experimental study, hence skipping some modes, although they exist from the eigenfrequency analysis. Therefore, DSSI incorporation overall leads to a better match with amplitude and dynamic behavior when compared to experimental results. For the tested bridge, the incorporation of DSSI effects led to an increase in lateral displacement relative to the fixed-base model. For the mode exhibited by both models (~4.2 Hz), this increase is approximately 14%.
f(t) = fini − δf × t
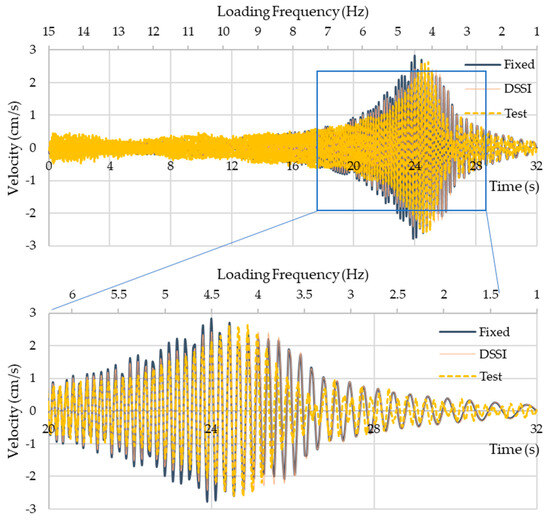
Figure 12.
Lateral velocity from west geophone at the deck from the test, fixed-base model, and DSSI model due to shaking at a 93.4 kN lateral load magnitude.

Table 4.
Lateral response due to lateral shaking at the temporal trace of frequency of select frequencies.
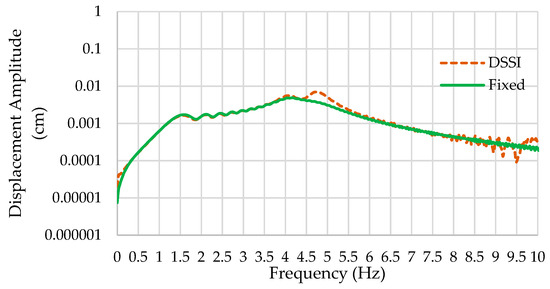
Figure 13.
Transverse displacement (Fourier spectrum) due to transverse shaking at 93.4 kN.
After matching the model in the time domain, frequency domain studies were established to accelerate modeling and preparation for parametric sweeps. Figure 14 shows results from both models compared to the experimental results for a lateral deck response to lateral shaking. It can be observed that the DSSI-incorporating model better matches the amplitude at the first resonant peak than the fixed-base model. Nevertheless, both models underestimated the resonant frequency of the first peak. As for the second peak, which is of higher importance, the DSSI-incorporating model was more accurate at estimating the resonant frequency and amplitude when compared to the test results. Away from resonance, both models captured the damping correctly until ~5.5 Hz, after which the damping was higher than what was exhibited by the bridge. Nevertheless, properly estimating damping at higher frequencies is not of foremost importance in this research. Figure 15 shows another comparison of models against test results at midspan, showing a vertical response to lateral shaking. The DSSI-incorporating model was better at describing the dynamic behavior of the deck.
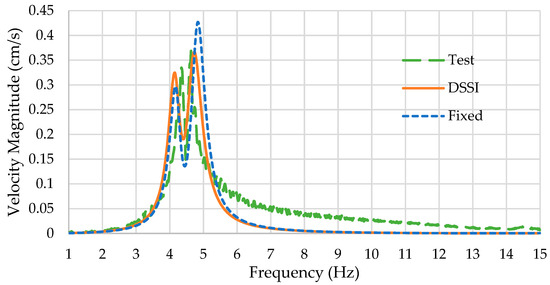
Figure 14.
Results from frequency-domain models compared to experimental results for the lateral response of the deck to lateral shaking at 93.4 kN.
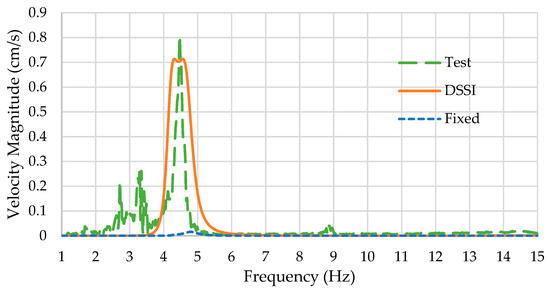
Figure 15.
Results from frequency-domain models compared to experimental results for the vertical response of the midspan to lateral shaking at 93.4 kN.
7. Parametric Study of Factors Influencing Dynamic Response
The objective of this section is to highlight the effects of different super- and sub-structural parameters on the overall dynamic response and behavior of the bridge. A parametric study was conducted to assess the extent to which the incorporation of DSSI would affect the response of the bridge. The analyses were conducted in the frequency domain. In addition to the soil properties, the study included several sub- and superstructural bridge elements that can alter the response. Furthermore, the parametric study can facilitate the identification of several responses/outputs from bridge shaking that would serve as differentiators when comparing different parameters of hypothetical bridges to the actual bridge. The parameters considered were soil shear wave velocity (Vs), structural height (Htot), foundation half width (B), and foundation depth (Df). Specific combinations are shown herein rather than all possible combinations while holding other parameters constant.
Figure 16 shows the effect of varying the structural height on the overall lateral response of the bridge to a 93.4 kN lateral load centered above the pier at the deck level. The increase in structural height led to the softening of the structure as expected and reduced the resonant frequency of both peaks. In addition, the 1st peak becomes stronger than the second when the height is increased beyond 5 m. This suggests that the coupling between swaying and rocking for this mode becomes stronger. Furthermore, while the first peak becomes stronger, the second peak becomes smaller with increasing height.
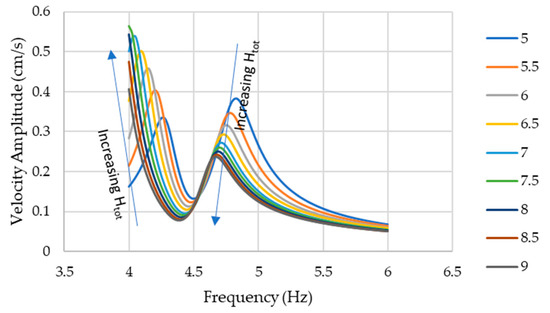
Figure 16.
Effect of varying Htot on lateral deck response to lateral shaking (Shown for Vs = 200 m/s, B = 5.7 m, Df = 2 m).
Figure 17 shows the effect of varying the shear wave velocity of soil on the response of the bridge. The first peak amplitude and frequency show negligible changes, while both the amplitude and resonant frequency of the second peak increased with increasing the shear wave velocity. The response starts to saturate beyond 250 m/s, suggesting that increasing the velocity further leads to approaching the fixed-base condition. Increasing the shear wave velocity increases the shear modulus, which in turn increases the static stiffness. Figure 18 shows the effect of varying the foundation depth on the lateral response of the deck. The amplitude and frequency of the first peak exhibited no difference in varying the foundation depth. However, the second peak exhibited a slight increase in both amplitude and frequency.
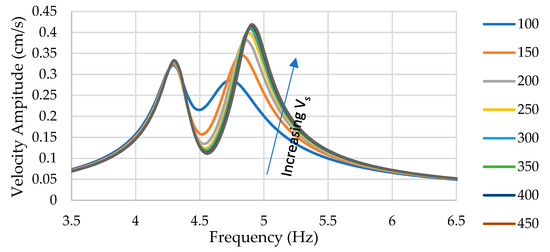
Figure 17.
Effect of varying Vs (m/s) on lateral deck response to lateral shaking (Shown for Htot = 5 m, B = 5.7 m, Df = 2 m).
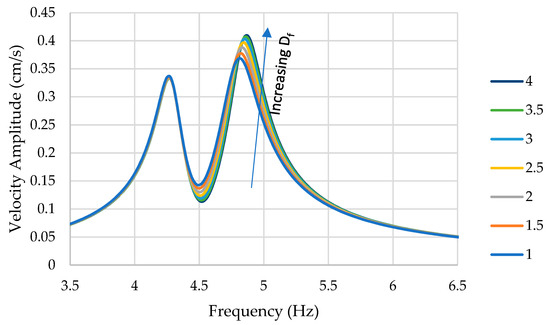
Figure 18.
Effect of varying Df (m) on the lateral deck response to lateral shaking (Shown for Htot = 5 m, B = 5.7 m, Vs = 200 m/s).
Figure 19 shows the effect of varying the foundation depth on the lateral response of the footing. The effect of increasing the depth mainly led to high damping of the response by lowering the peak amplitudes. Through the figure, it is possible to infer a more intuitive and discernible difference in response to lateral shaking. In addition, the behavior of the footing is in agreement with the behaviors described by Wolf [14]. This is the case since damping is expected to decrease the peak response and slightly increase the frequency due to increased mechanical impedance (not to be confused with a lower damped frequency of SDOF systems). This result highlights the importance of having ground geophones either attached to the pier or the foundation itself if possible.
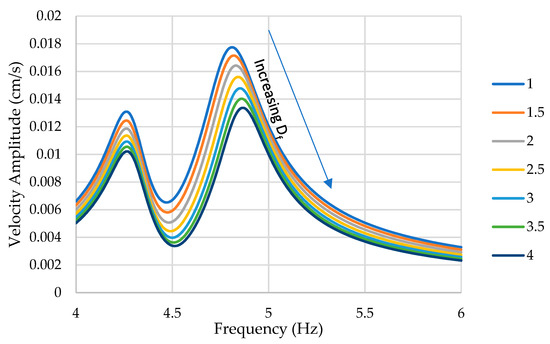
Figure 19.
Effect of varying Df (m) on lateral footing response to lateral shaking (Shown for Htot = 5 m, B = 5.7 m, Vs = 200 m/s).
Similar to footing depth, varying footing by a half-width did not lead to discernible differences at the deck level; hence, the response of the footing was considered. Figure 20 shows the lateral response of the footing to lateral shaking. While there is no clear trend deducible from the results, they still show that varying the footing half-width leads to a varying response, and that helps discern the correct foundation width through an iterative process.
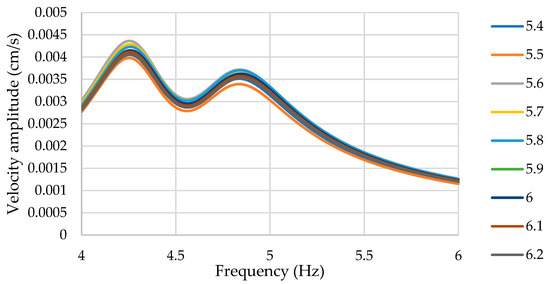
Figure 20.
Effect of varying B (m) on lateral footing response to lateral shaking (Shown for Htot = 5 m, Df = 2 m, Vs = 200 m/s).
To assess the extent to which DSSI effects alter the response, the results from the parametric study were used to further examine the effect of the following variables on the response:
- Embedment ratio
- Structure-to-Soil Stiffness Ratio (Rigidity Ratio)
- Structure-to-Foundation Slenderness Ratio
The two main criteria selected to assess such effects are peak amplitude(s) modification and their respective frequencies. The change in peak frequency relative to a fixed-base case is commonly and interchangeably referred to as period lengthening/shortening or stiffness softening/hardening. This is referred to as structural hardening/softening herein. Naturally, varying parameters such as Vs or B will lead to altering multiple ratios at the same time. While damping is another key factor to examine when assessing DSSI effects, it was not considered in the current study. Figure 21a shows the effect of the embedment ratio (D/B) on the peak amplitude ratio of DSSI/Fixed lateral deck response, while Figure 21b shows the same for peak frequency. Those results are shown for the second peak illustrated in Figure 18. It can be observed that increasing the embedment ratio led to diminishing DSSI effects, which is manifested in Figure 21b as the DSSI/Fixed peak frequency ratio increasing and approaching unity. Furthermore, Figure 21a suggests that the increase in total mechanical impedance leads to structural hardening rather than a reduction in the response due to increased damping. This is the case since both dynamic stiffness and radiation damping increased with increasing embedment depth. The extent of DSSI response alteration relative to a fixed-base scenario based on the embedment ratio can also be varied by varying the footing half-width. This may lead to a different relationship for various depths. Therefore, a combination of varying both the footing depth and half-width is of importance. However, the results presented provide adequate insights into the effect of the embedment ratio on the response.
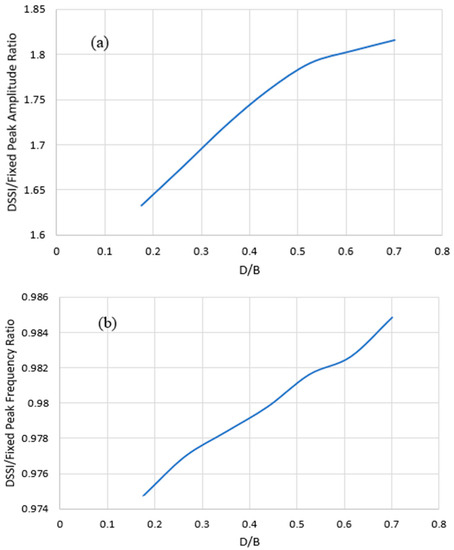
Figure 21.
The effect of the D/B ratio on altering the DSSI based on (a) peak amplitude and (b) peak frequency, with other parameters held constant.
Figure 22 illustrates the effect of varying the Structure-to-Soil Slenderness Ratio, , the extent of DSSI response alteration relative to the fixed base. The results are presented as a function of the dimensionless frequency (a0 = ωB/Vs). For the second peak which describes rocking, it is evident that increasing led to a reduction in DSSI alteration of response relative to fixed-base. This means that this effect diminishes for more slender structures. Rotations dictate the response, and they become more controlled by the moment arm rather than the boundary condition, i.e., fixed vs DSSI. This effect also depends on the stiffness ratio, which is discussed next. For flexible structures, the rocking of the foundation is less important than for rigid structures. As for the first peak, increasing led to increasing the DSSI alteration of response. The bridge experiences stronger coupling between lateral, rocking, and vertical modes. Therefore, further investigation is required to determine this effect on rotations independently. However, overall softening was observed from the first peak relative to a fixed base, where the resonant frequency was reduced further than the computational frequency domain considered (around detected resonant frequencies from the experimental program). Away from the lateral resonant frequencies, the ratio approaches 1 as increases in the interval a0 > 0.9. On the other hand, the response is reduced relative to a fixed base at the anti-resonance down to a ratio of 0.75. The valley between the two peaks corresponds to a vertical mode shape as determined in experimental results, which again suggests some coupling in the bridge dynamic response that counteracts the rocking behavior. Figure 23 shows the effect of the on the peak-amplitude frequency. As discussed, the effect of DSSI decreased with increasing which also means structural softening due to DSSI effects diminishes as slenderness increases when examined at the same rigidity ratio.
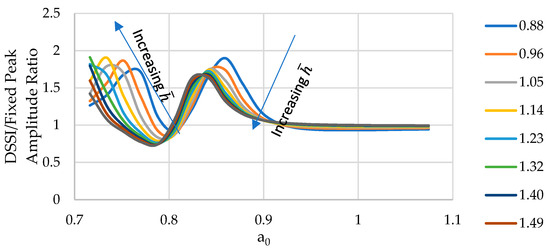
Figure 22.
Effect of varying on altering DSSI effects relative to a fixed base based on the peak lateral amplitude ratio of the deck due to lateral shaking. Shown for Vs =200 m/s, B = 5.7 m, and Df = 2 m.
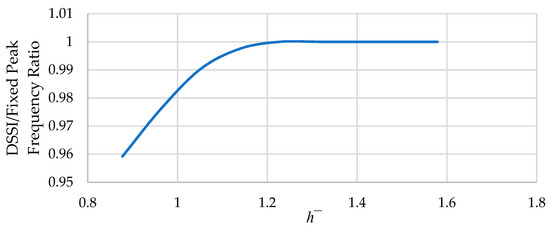
Figure 23.
Extent of on structural softening due to DSSI effects relative to a fixed base. Shown for Vs =200 m/s, B = 5.7 m, and Df = 2 m.
The rigidity ratio was estimated assuming f to be the frequency of the second peak obtained from the fixed-base model (4.8 Hz). This ratio was estimated by sweeping both Vs and htot. Figure 24 shows the effect of the rigidity ratio on the peak amplitude ratio of DSSI/fixed lateral deck response. Increasing led to a decrease in the maximum amplitude since the rigidity of the SFS is increasing. This is in agreement with the literature, since the system becomes closer to the fixed-base assumption [14]. Figure 25 shows the reduction of the second peak amplitude ratio and the frequency of the peak as a function of dimensionless frequency with increasing . This follows the expected behavior that increasing would eventually lead to a fixed-base condition.
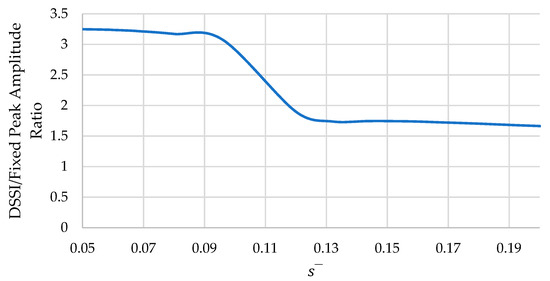
Figure 24.
Extent of the alteration of lateral peak amplitude caused by lateral shaking due to DSSI effects relative to a fixed base. Shown for B = 5.7 m, Df = 2m, and varying htot and Vs.
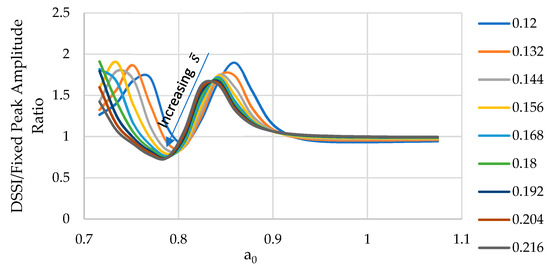
Figure 25.
Effect of varying on altering DSSI effects relative to a fixed base based on the peak lateral amplitude ratio of the deck due to lateral shaking. Shown for B = 5.7 m, Df = 2 m, and varying Vs and htot.
Table 5 summarizes the main findings from the parametric sweep conducted in the current research. It shows that the extent of DSSI effects on typical bridges similar to the one evaluated in the current study follows the behavior of 1 DoF oscillators. The effects of the rocking motion are emphasized, which shows that is the most important parameter to dictate the response since it combines the soil properties and structural aspects. Additional work can be conducted to isolate the effect of damping on the overall response of the bridges in future studies. The results reported herein are extendible to typical overpass bridges with similar super- and substructural features and site conditions.

Table 5.
Summary of factors affecting the extent of DSSI effects on altering rocking motion in typical overpass bridges.
8. Conclusions
The primary goal of this research was to use large-amplitude mobile shakers in tandem with highly refined numerical simulations for the dynamic characterization of bridges while informing DSSI effects. In addition, a parametric study was conducted to assess the effect of varying super-and substructural features of the SFS system after validating the FE models against the experimental results. From this research, the specific findings are:
- Large-amplitude mobile shakers are effective in exciting the entire bridge-foundation-soil system and they facilitate the accurate determination of global dynamic characteristics in a non-destructive manner. This was proven through the experimental program reported in this study. Therefore, this study opens the possibility for the use of such shakers in future testing of in-service bridges.
- Shaking in multiple directions using linear chirp functions enabled the identification of natural frequencies (modes) of the tested bridge. It was demonstrated that shaking the bridge at multiple locations can facilitate the detection of more natural modes/frequencies. Furthermore, ignoring DSSI effects in bridge models can lead to inaccurate dynamic response and omission of some modes of vibration.
- The rocking behavior of the foundation was captured from the experimental program, which served as a basis for the comparison of different numerical models established in this study. Coupling between vibration modes or the presence of closely spaced modes can pose a challenge to the intuitive understanding of the dynamic behavior of an excited bridge. Therefore, examining pure motion modes (e.g., rocking, vertical, etc.) assists in understanding dynamic characteristics more easily.
- Peak amplitude, resonant frequency, and the overall time history were shown to be unique for each combination, and this allows for discerning which set of parameters fits the experimental results.
- The results obtained from evaluating the rigidity, embedment, and slenderness ratios in this study agreed with the typical dynamic behavior reported in the literature. The rigidity and slenderness ratios are the most influential parameters in controlling the extent of DSSI effects on the rocking response of bridges, which is similar to the one evaluated in the current study.
Author Contributions
Conceptualization, S.F. and N.G.; methodology, S.F. and N.G.; validation, S.F., formal analysis, S.F.; investigation, S.F.; resources, N.G.; data curation, S.F.; writing—original draft preparation, S.F.; writing—review and editing, S.F. and N.G.; visualization, S.F.; supervision, N.G.; project administration, N.G.; funding acquisition, N.G. All authors have read and agreed to the published version of the manuscript.
Funding
This research was supported by the National Science Foundation under Grant No. 1650170. Large mobile shakers from NHERI@UTexas, a shared-use equipment facility supported by U.S. National Science Foundation grant CMMI-1520808 under the Natural Hazards Engineering Research Infrastructure (NHERI) program, were used in this research.
Data Availability Statement
All the data, models, or codes that support the findings of this study are available from the corresponding author upon reasonable request.
Acknowledgments
Many thanks go to New Jersey DOT for facilitating the execution of the experimental program. The authors would also like to thank the team from UTexas, Austin for their contribution to the data collection during the experimental program.
Conflicts of Interest
The authors declare no conflict of interest. The funders had no role in the design of the study; in the collection, analyses, or interpretation of data; in the writing of the manuscript; or in the decision to publish the results. Any opinions, findings, conclusions, or recommendations expressed in this research are those of the author and do not necessarily reflect the views of NSF or NJDOT.
References
- Antonellis, G.; Panagiotou, M. Seismic response of bridges with rocking foundations compared to fixed-base bridges at a near-fault site. J. Bridge Eng. 2014, 19, 04014007. [Google Scholar] [CrossRef]
- Nikolaos, L.S.; Anastasios, L.; Oh-Sung, K. Influence of frequency-dependent soil–structure interaction on the fragility of R/C bridges. Earthq. Eng. Struct. Dyn. 2017, 46, 139–158. [Google Scholar]
- FEMA P-2082-1; NEHRP Recommended Seismic Provisions for New Buildings and Other Structures. Federal Emergency Management Agency: Washington, DC, USA, 2020.
- Gazetas, G. Analysis of machine foundation vibrations: State of the art. Int. J. Soil Dyn. Earthq. Eng. 1983, 2, 2–42. [Google Scholar] [CrossRef]
- Veletsos, A.S.; Meek, J.W. Dynamic behaviour of building-foundation systems. Earthq. Eng. Struct. Dyn. 1974, 3, 121–138. [Google Scholar] [CrossRef]
- Doménech, A.; Martínez-Rodrigo, M.D.; Romero, A.; Galvín, P. On the basic phenomenon of soil-structure interaction on the free vibration response of beams: Application to railway bridges. Eng. Struct. 2016, 125, 254–265. [Google Scholar] [CrossRef]
- Anastasopoulos, I.; Sakellariadis, L.; Agalianos, A. Seismic analysis of motorway bridges accounting for key structural components and nonlinear soil–structure interaction. Soil Dyn. Earthq. Eng. 2015, 78, 127–141. [Google Scholar] [CrossRef][Green Version]
- Mallick, M.; Raychowdhury, P. Seismic analysis of highway skew bridges with nonlinear soil–pile interaction. Transp. Geotech. 2015, 3, 36–47. [Google Scholar] [CrossRef]
- Davis, N.T.; Sanayei, M. Foundation identification using dynamic strain and acceleration measurements. Eng. Struct. 2020, 208, 109811. [Google Scholar] [CrossRef]
- Star, L.M.; Tileylioglu, S.; Givens, M.J.; Mylonakis, G.; Stewart, J.P. Evaluation of soil-structure interaction effects from system identification of structures subject to forced vibration tests. Soil Dyn. Earthq. Eng. 2019, 116, 747–760. [Google Scholar] [CrossRef]
- Zangeneh, A.; Svedholm, C.; Andersson, A.; Pacoste, C.; Karoumi, R. Identification of soil-structure interaction effect in a portal frame railway bridge through full-scale dynamic testing. Eng. Struct. 2018, 159, 299–309. [Google Scholar] [CrossRef]
- Olson, L. Dynamic Bridge Substructure Evaluation and Monitoring; Office of Infrastructure Research and Development, FHWA: Mclean, VA, USA, 2005. [Google Scholar]
- Ma, M.; Liu, J.; Zhang, Z. Evaluating vertical conditions of bridge substructures of heavy-haul railway lines based on dynamic stiffness and pier vibration response. Eng. Struct. 2021, 235, 112037. [Google Scholar] [CrossRef]
- Wolf, J.P. Dynamic Soil-Structure Interaction; John Wiley & Sons, Inc.: New York, NY, USA, 1985. [Google Scholar]
- Kakhki, S.A.E.; Kheyroddin, A.; Mortezaei, A. Evaluation of the progressive collapse of the reinforced concrete frames considering the soil–structure interaction: Parametric study based on the sensitivity index. Int. J. Conc. Struct. Mater. 2022, 16, 38. [Google Scholar] [CrossRef]
- Sextos, A.G.; Kappos, A.J.; Pitilakis, K.D. Inelastic dynamic analysis of RC bridges accounting for spatial variability of ground motion, site effects and soil–structure interaction phenomena. Part 2: Parametric study. Earthq. Eng. Struct. Dyn. 2003, 32, 629–652. [Google Scholar] [CrossRef]
- Gucunski, N. Rocking response of flexible circular foundations on layered media. Soil Dyn. Earthq. Eng. 1996, 15, 485–497. [Google Scholar] [CrossRef]
- Bazaios, K.; Gerolymos, N.; Bouckovalas, G.; Chaloulos, Y.K. SSI effects on seismic settlements of shallow foundations on sand. Soil Dyn. Earthq. Eng. 2022, 155, 107025. [Google Scholar] [CrossRef]
- NIST GCR 12-917-21; Soil-Structure Interaction for Building Structures. National Institute of Standards and Technolog: Gaithersburg, MD, USA, 2012.
- Ganjavi, B.; Hao, H. A parametric study on the evaluation of ductility demand distribution in multi-degree-of-freedom systems considering soil–structure interaction effects. Eng. Struct. 2012, 43, 88–104. [Google Scholar] [CrossRef]
- Chen, Y.; Zhao, W.; Jia, P.; Han, J.; Guan, Y. Dynamic behavior of an embedded foundation under horizontal vibration in a poroelastic half-space. Appl. Sci. 2019, 9, 740. [Google Scholar] [CrossRef]
- Gucunski, N.; Peek, R. Parametric study of vertical vibrations of circular flexible foundations on layered media. Earthq. Eng. Struct. Dyn. 1993, 22, 685–694. [Google Scholar] [CrossRef]
- Chen, S.-S.; Hou, J.-G. Modal analysis of circular flexible foundations under vertical vibration. Soil Dyn. Earthq. Eng. 2009, 29, 898–908. [Google Scholar] [CrossRef]
- Jahankhah, H.; Farashahi, P.F. The effect of foundation embedment on net horizontal foundation input motion: The case of strip foundation with incomplete contact to nearby medium. Soil Dyn. Earthq. Eng. 2017, 96, 35–48. [Google Scholar] [CrossRef]
- Cai, Y.Q.; Hu, X.Q.; Xu, C.J.; Hong, Z.S. Vertical dynamic response of a rigid foundation embedded in a poroelastic soil layer. Int. J. Numer. Anal. Methods Geomech. 2009, 33, 1363–1388. [Google Scholar] [CrossRef]
- Richart, F.E.J.; Hall, J.R.J.; Woods, R.D. Vibrations of Soils and Foundations; Prentice-Hall, Inc.: Hoboken, NJ, USA, 1970. [Google Scholar]
- Gucunski, N. Response of embedded circular flexible foundations. In Proceedings of the Third International Conference on Recent Advances in Geotechnical Earthquake Engineering and Soil Dynamics, St. Loius, MO, USA, 2–7 April 1995. [Google Scholar]
- Ülker-Kaustell, M.R.; Karoumi, M.; Pacoste, C. Simplified analysis of the dynamic soil–structure interaction of a portal frame railway bridge. Eng. Struct. 2010, 32, 3692–3698. [Google Scholar] [CrossRef]
- Anastasopoulos, I.; Kourkoulis, R.; Gelagoti, F.; Papadopoulos, E. Rocking response of SDOF systems on shallow improved sand: An experimental study. Soil Dyn. Earthq. Eng. 2012, 40, 15–33. [Google Scholar] [CrossRef]
- Karatzetzou, A.; Pitilakis, D. Reduction factors to evaluate acceleration demand of soil-foundation-structure systems. Soil Dyn. Earthq. Eng. 2018, 109, 199–208. [Google Scholar] [CrossRef]
- Santisi d’Avila, M.P.; Lopez-Caballero, F. Analysis of nonlinear soil-structure interaction effects: 3D frame structure and 1-Directional propagation of a 3-Component seismic wave. Comp. Struct. 2018, 207, 83–94. [Google Scholar] [CrossRef]
- Carbonari, S.; Morici, M.; Dezi, F.; Leoni, G. A lumped parameter model for time-domain inertial soil-structure interaction analysis of structures on pile foundations. Earthq. Eng. Struct. Dyn. 2018, 47, 2147–2171. [Google Scholar] [CrossRef]
- Jian, Z.; Nicos, M. Seismic response analysis of highway overcrossings including soil–structure interaction. Earthq. Eng. Struct. Dyn. 2002, 31, 1967–1991. [Google Scholar]
- Google Earth. Available online: https://www.google.com/earth/ (accessed on 1 July 2017).
- Farrag, S. Assessment of Bridge Dynamic Characteristics and Unknown Foundations through Large-Amplitude Shaking. Ph.D. Thesis, Rutgers, The State University of New Jersey, New Brunswick, NJ, USA, 2023. [Google Scholar]
- Farrag, S.; Gucunski, N.; Cox, B.; Menq, F.; Moon, F.; DeVitis, J. Investigation of DSSI effects on the dynamic response of an overpass bridge through the use of mobile shakers and numerical simulations. J. Bridge Eng. 2022, 27, 04022025. [Google Scholar] [CrossRef]
- Omar, O.; Tounsi, N.; Ng, E.-G.; Elbestawi, M.A. An optimized rational fraction polynomial approach for modal parameters estimation from FRF measurements. J. Mech. Sci. Technol. 2010, 24, 831–842. [Google Scholar] [CrossRef]
- Greś, S.; Döhler, M.; Andersen, P.; Mevel, L. Uncertainty quantification for the modal phase collinearity of complex mode shapes. Mech. Syst. Signal Process. 2020, 152, 107436. [Google Scholar] [CrossRef]
- Sextos, A.; Faraonis, P.; Zabel, V.; Wuttke, F.; Arndt, T.; Panetsos, P. Soil–bridge system stiffness identification through field and laboratory measurements. J. Bridge Eng. 2016, 21, 04016062. [Google Scholar] [CrossRef]
- Chaudhary, M.T.A.; Abé, M.; Fujino, Y. Identification of soil–structure interaction effect in base-isolated bridges from earthquake records. Soil Dyn. Earthq. Eng. 2001, 21, 713–725. [Google Scholar] [CrossRef]
- Tongaonkar, N.P.; Jangid, R.S. Seismic response of isolated bridges with soil–structure interaction. Soil Dyn. Earthq. Eng. 2003, 23, 287–302. [Google Scholar] [CrossRef]
- Chaudhary, M.T.A. Seismic response of bridges supported on shallow rock foundations considering SSI and pier column inelasticity. KSCE J. Civ. Eng. 2017, 21, 285–295. [Google Scholar] [CrossRef]
- Wang, Z.; Dueñas-Osorio, L.; Padgett, J.E. Influence of soil-structure interaction and liquefaction on the isolation efficiency of a typical multispan continuous steel girder bridge. J. Bridge Eng. 2014, 19, A4014001. [Google Scholar] [CrossRef]
Disclaimer/Publisher’s Note: The statements, opinions and data contained in all publications are solely those of the individual author(s) and contributor(s) and not of MDPI and/or the editor(s). MDPI and/or the editor(s) disclaim responsibility for any injury to people or property resulting from any ideas, methods, instructions or products referred to in the content. |
© 2023 by the authors. Licensee MDPI, Basel, Switzerland. This article is an open access article distributed under the terms and conditions of the Creative Commons Attribution (CC BY) license (https://creativecommons.org/licenses/by/4.0/).