Abstract
The fresh and mechanical properties of concrete made with brick aggregates of eight different maximum aggregate sizes (MAS), i.e., 10 mm, 12.5 mm, 19 mm, 25 mm, 37.5 mm, 50 mm, 63 mm, and 75 mm, were investigated. The other parameters studied were sand-to-aggregate volume ratio (s/a) (0.40 and 0.45), W/C (0.45, 0.50, and 0.55), and cement content (375 kg/m3 and 400 kg/m3). In total, 80 different concrete mixes were studied; the perimeter of the interfacial transition zone (ITZ) along the brick aggregates was quantified with an image-analysis software and the microstructure along the ITZ was investigated using a scanning-electron microscope (SEM) to corroborate the hardened properties of the concrete. Although larger MAS leads to greater slump in concrete, its effect on hardened properties is linked to other design parameters. For a cement content of 375 kg/m3 and W/C of 0.45 and 0.50, the compressive strength of concrete increases (by up to 5%–15%) with increases in MAS of up to 37.5 mm irrespective of s/a (0.40 and 0.45) and then reduces gradually. For all other cases, the compressive strength of concrete is reduced with increases in MAS. The SEM imaging confirmed the presence of weak and porous ITZ and the deposition of ettringite in the voids left by entrapped bleed water under large aggregates. The compressive strength also increased with increases in s/a from 0.40 to 0.45, predominantly for smaller MAS. Correlations between mechanical properties of concrete and stress–strain curves are proposed for different MAS.
1. Introduction
As the largest-volume contributor, coarse aggregate strongly influences fresh- and hardened-concrete properties. The continuing research on concrete aggregates has demonstrated that the chemical composition, particle-size distribution, sulphate resistance, water absorption, surface texture, etc., influence manufactured concrete properties [1,2,3,4]. In addition, researchers in the early 1960s reported progressive decreases in the compressive strength of concrete with increases in MAS [5,6]. Decades later, Aitcin [7] explained the role of the large interfacial transition zone (ITZ) in reducing concrete strength with larger aggregate sizes. In general, relatively high compressive and flexural strengths of concrete have been observed in most studies of smaller aggregates [8,9], while the heterogeneity induced in larger aggregates leads to reduced strength [10,11]. By contrast, Vu et al. [12] reported a slight increase in concrete strength with an increase in MAS; a few years later, Vilane et al. [13] also reported a similar trend in results when studying MAS of 9.5 mm, 13.2 mm, and 19 mm. Furthermore, several studies reported no significant influence of MAS on the properties of normal-strength concrete [14,15], leaving scope for further investigations to address the diversity in outcomes. The inconsistencies in the reported results may be due to differences in the type of aggregate used as most studies (and the construction industry in general) utilise locally available aggregate sources for concrete manufacture. For instance, Bangladesh relies strongly on manufactured aggregates, especially crushed bricks, for making concrete, and the impact of these aggregates on concrete properties is of relevance. In addition, other mix parameters, like the sand-to-aggregate volume ratio and the cement content, may affect the extent of the changes in the mechanical properties of concrete when using coarse aggregates of different sizes, and the influence of these parameters, along with MAS, needs to be explored.
The literature provides technical evidence of the performance of concrete utilising brick aggregates. A general trend in the findings is the reduction in concrete strength when natural stones or basalts are substituted with crushed bricks as coarse aggregates [16,17,18,19,20]; this also holds for substituting induction-furnace slag with brick aggregate [21]. A brick aggregate replacement of up to 20% was reported to provide comparable strength to stone aggregate concrete [17]. Despite the loss of strength, countries like Bangladesh rely on crushed brick aggregates due to the unavailability of natural aggregate quarries, except the for the rounded, smooth stones in the northeastern region of the country, and to avoid the high cost of importing stone aggregates from overseas. It is worth mentioning that brick aggregate-concrete mixes can be designed to conform to design specifications, while they may offer some benefits in terms of engineering properties. For instance, brick aggregates lower the thermal conductivity of concrete and provide superior resistance to high-temperature degradations [22,23] making them suitable materials for subtropical regions like Bangladesh. Some recent studies reported the pozzolanic reactivity of finely ground clay-brick dust [24,25]. The use of virgin brick and recycled brick as aggregates for structural beams has been explored, and the ultimate moment capacity was safely measured following ACI 318-14 [26]. The greatest advantage of brick aggregates is that their grading can be controlled while crushing clay-burnt brick blocks. Unfortunately, the full range of MAS of brick aggregates has not been explored, and there is an opportunity to holistically review a broad range of MAS that captures aggregate sizes used to make commercial concrete—from pavement bases and subbases to structural applications. In this regard, a preliminary study was conducted with varying MAS values of 12.5 mm, 19 mm, 25 mm, 37.5 mm, and 50 mm. The results were summarised in a separate report by Mohammed et al. [27]. To broaden the scope of the study, further investigations were carried out including MAS of 10 mm, and larger MAS of 63 mm and 75 mm, which are generally used in concrete paving and landscaping. Therefore, this comprehensive report covers the full practical range of MAS from 10 mm to 75 mm, and it can contribute to the current understanding of the effect of the MAS of brick aggregate on the properties of fresh and hardened concrete.
For the investigation, cylindrical concrete specimens measuring 100 mm by 200 mm were made with varying s/a (0.40 and 0.45) and cement contents (375 kg/m3 and 400 kg/m3) and W/C (0.45, 0.50, and 0.55) for MAS of 10.0 mm, 12.5 mm, 19.0 mm, 25.0 mm, and 37.5 mm. For larger MAS of 50.0 mm, cylindrical concrete specimens measuring 150 mm by 300 mm were fabricated with varying s/a (0.40 and 0.45) and cement contents (375 kg/m3 and 400 kg/m3) and a W/C of 0.45. For MAS of 63 mm, cylindrical concrete specimens measuring 200 mm by 400 mm were made with varying s/a (0.40 and 0.45) and cement contents (375 kg/m3 and 400 kg/m3) and W/C (0.45 and 0.50). For MAS of 75 mm, cylindrical concrete specimens measuring 250 mm by 500 mm were made with s/a of 0.45, cement contents of 400 kg/m3, and W/C of 0.45 and 0.50. The variables considered in mixture proportions of concrete are expected to offer insights into the effect of MAS on the fresh and hardened properties of brick aggregate concrete. The development of the compressive strength and elastic modulus were monitored, and the characteristic splitting tensile strength was measured. A scanning electron microscope (SEM) was employed to closely investigate the ITZ around the top and bottom of large aggregates and identify reaction products. The variations in the stress–strain curves for different MAS were analysed and correlations are proposed based on mechanical test results.
2. Research Significance
Due to difficulties associated with sourcing large aggregates and testing large-sized specimens, the understanding of the effects of maximum aggregate size (MAS) in manufactured concrete is based on research covering a short range of MAS. Bangladesh is a land of delta and, therefore, due to the lack of natural stone sources, constructions in Bangladesh rely on brick aggregate that can be crushed into preferred sizes, drawing opportunities for a detailed study to understand the effect of MAS on concrete properties. Thus, MAS from 10–75 mm with variations in other mix design parameters, such as cement content, sand to total aggregate volume ratio, and W/C, have been studied. The results of this study can add to the available knowledge in the literature and provide technical data on how concrete behaviour changes as the nominal size of brick aggregate changes from as small as 10 mm to as big as 75 mm.
3. Experimental Methods
3.1. Materials
First-class bricks (as per BDS 208) were collected from a local market (Dhaka, Bangladesh), and crushed into pieces manually to prepare coarse aggregates of the desired MAS of 10 mm, 12.5 mm, 19 mm, 25 mm, 37.5 mm, 50 mm, 63 mm, and 75 mm. The compressive strength of the manufactured first-class brick was 10 N/mm2. The crushed aggregates were sorted into different sizes to control the gradation as per the requirements of ASTM C33 [28] as illustrated in Figure 1a. Washed river sand was used as fine aggregate; the natural particle size distribution of fine aggregate satisfies ASTM C33 [28] requirements as shown in Figure 1b. The physical properties of the coarse and fine aggregates, such as specific gravity, absorption capacity, and saturated surface-dry (SSD) unit weight were determined as per relevant ASTM specifications as summarised in Table 1. Following ASTM C33 grading requirements led to the absence of smaller-sized coarse aggregates for large-sized MAS, leading to a reduced unit weight due to the voids formed in between the large aggregate particles. The water absorption of brick aggregate is relatively higher than natural stone due to its porous texture. For making concrete specimens, saturated surface-dry (SSD) aggregates (both fine and coarse aggregates) were used. To ensure the aggregates are at SSD condition, the aggregates were submerged in water for 24 h. After removing from the water, the extra water from the surface was wiped carefully.
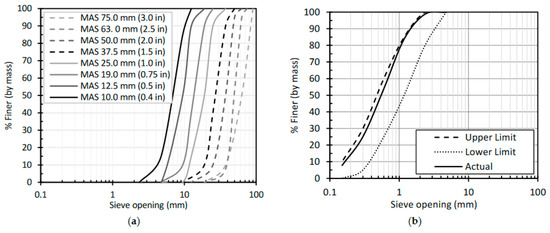
Figure 1.
Gradation curves of (a) brick coarse aggregates; (b) gradation curve of fine aggregate.
The binder used in this study is CEM Type II/A-M (Grade 42.5 N/mm2) cement (as per BDS EN 197-1:2000 [29]). The cement is composed of approximately 80% clinker and 20% mineral admixture including fly ash, blast furnace slag, and limestone. Some minor ingredients, such as gypsum, are also added to the cement to regulate flash set. Tap water was used for batching and curing cylindrical concrete specimens until the day of testing (7, 28, and 90 days). No chemical admixture was used in concrete mixing to capture the sole effect of MAS on the workability of fresh concrete.
3.2. Mixture Proportion, Specimen Preparation, and Testing
For investigation, a total of 696 cylindrical specimens from 80 different mix proportions were made as per ASTM C39 [30]. The mixture proportions are summarised in Table 2. The variables considered in the experimental plan are the maximum aggregate size (MAS), sand to aggregate volume ratio (s/a), cement content, and W/C. The size of the cylindrical specimens for different MAS varied to maintain the specimen diameter at least three times the MAS as per ASTM C31 [31] recommendations and ACI 318-14 [26] provisions. Thus, for MAS of 10 mm, 12.5 mm, 19.0 mm, 25.0 mm, and 37.5 mm, 100 mm × 200 mm cylindrical concrete specimens were made with varying s/a (0.40 and 0.45); cement content (375 kg/m3 and 400 kg/m3), and W/C (0.45, 0.50, and 0.55). For larger MAS of 50.0 mm, 63 mm, and 75 mm, the cylindrical concrete specimens were 150 mm × 300 mm, 200 mm × 400 mm, and 250 mm × 500 mm, respectively.

Table 2.
Mixture proportions of brick aggregate concrete.
Table 1.
Physical properties of coarse and fine aggregates.
Table 1.
Physical properties of coarse and fine aggregates.
| Aggregate Type | Specific Gravity [32,33] | Absorption Capacity [32,33] (%) | Abrasion [34] (%) | SSD Unit Weight [32,33] (kg/m3) | Fineness Modulus | ||||
|---|---|---|---|---|---|---|---|---|---|
| 50.0 mm | 37.5 mm | 25.0 mm | 19.0 mm | 12.5 mm | |||||
| Brick Coarse Aggregate | 2.30 | 15.10 | 38.3 | 1230 | 1232 | 1235 | 1236 | 1238 | Controlled as per ASTM C 33 [28] |
| River sand | 2.45 | 3.30 | - | 1520 | 2.52 | ||||
A portable tilting-drum concrete mixer was used in concrete batching. The cement was sandwiched between two layers of SSD sand and mixed for 30 s for a homogeneous dry mix before carefully pouring the mix water into the rotating drum of the mixer. The wet mixing was continued for at least one and a half minutes before adding the SSD brick coarse aggregate to the drum and the mixing was continued for three more minutes. For each case, at least five minutes of mixing duration was employed to ensure a uniform and homogeneous mix. Prior to batching, all aggregates were brought to SSD condition to avoid absorption of mixing water by the brick aggregate, which has a higher absorption capacity of 15.1% as compared to natural stones (1.0–2.0%).
Immediately after mixing, the slump of the fresh concrete was measured as per ASTM C143 [35] guidelines. Following slump measurement, cylindrical specimens were cast in clean steel moulds as per ASTM C31 [31] specifications and covered for the first 24 h with wet burlaps and polythene sheets to prevent moisture loss. After 24 h of casting, the specimens were demoulded, followed by curing in a temperature-controlled (23 °C) water bath according to ASTM C31 [31] till the age of testing.
The compressive strength of concrete was measured at 7 days, 28 days, and 90 days following the ASTM C39 [30] procedure to monitor the strength development, and at least three specimens of a particular case were tested to represent the mean compressive strength on a specific age. Different strength conversion factors (ks) were calculated to correlate the compressive strength of 100 mm × 200 mm cylindrical specimens to 150 mm × 300 mm, 200 mm × 400 mm, and 250 mm × 500 mm cylindrical specimens. The strength conversion factors for different sizes of cylinders are defined in Equations (1)–(3) as follows:
where f′c,100mm, f′c,150mm, f′c,200mm, and f′c,250mm are the compressive strengths of concrete obtained from 100 mm × 200 mm, 150 mm × 300 mm, 200 mm × 400 mm, and 250 mm × 500 mm cylindrical specimens, respectively. The ks-150 was found to be 1.03, which is in line with the findings in the literature [36,37]. The ratios were fixed as 1.06 and 1.08 for ks-200 and ks-250, respectively, based on the recommendations of Benjamin and Cornell [38]. This ensured that the compressive strength results were comparable even though the specimens had different sizes for larger MAS.
ks-150 = f′c,100mm/f′c,150mm
ks-200 = f′c,100mm/f′c,200mm
ks-250 = f′c,100mm/f′c,250mm
A strain-measuring device with a gauge length of 100 mm with two analogue dials (smallest division = 0.01 mm) was employed to measure the strain of concrete specimens under compression. The modulus of elasticity was measured as per ASTM C 469 [39]. Specimens were split under longitudinal loading to measure the splitting tensile strength of concrete as per ASTM C 496 [40]. The split surfaces of broken specimens were inspected carefully for further analysis including measurement of ITZ with ImageJ software v1.0.0.x (https://imagej.nih.gov/ij/download.html, accessed on 28 March 2021). The software enabled the measurement of selected regions (perimeter of ITZ in this study) to correlate ITZ perimeter with MAS.
3.3. Microstructural Imaging
A TESCAN (Brno, Czech Republic) VEGA3 scanning electron microscope (SEM) was employed to observe the microstructural features along the ITZ of large aggregates (e.g., 63 mm). The SEM specimens were collected from one-year-old concrete cylinders and the freshly fractured surface was investigated around the large-sized aggregate, particularly the ITZ around the aggregate (at the top and bottom of the aggregate with respect to casting direction). Before SEM investigation, the surface was sputtered with gold to avoid charging accumulation while imaging was performed in secondary electron mode running under a voltage of 20.0 kV.
4. Experimental Results and Discussion
4.1. Variations in Fresh Properties of Concrete with MAS
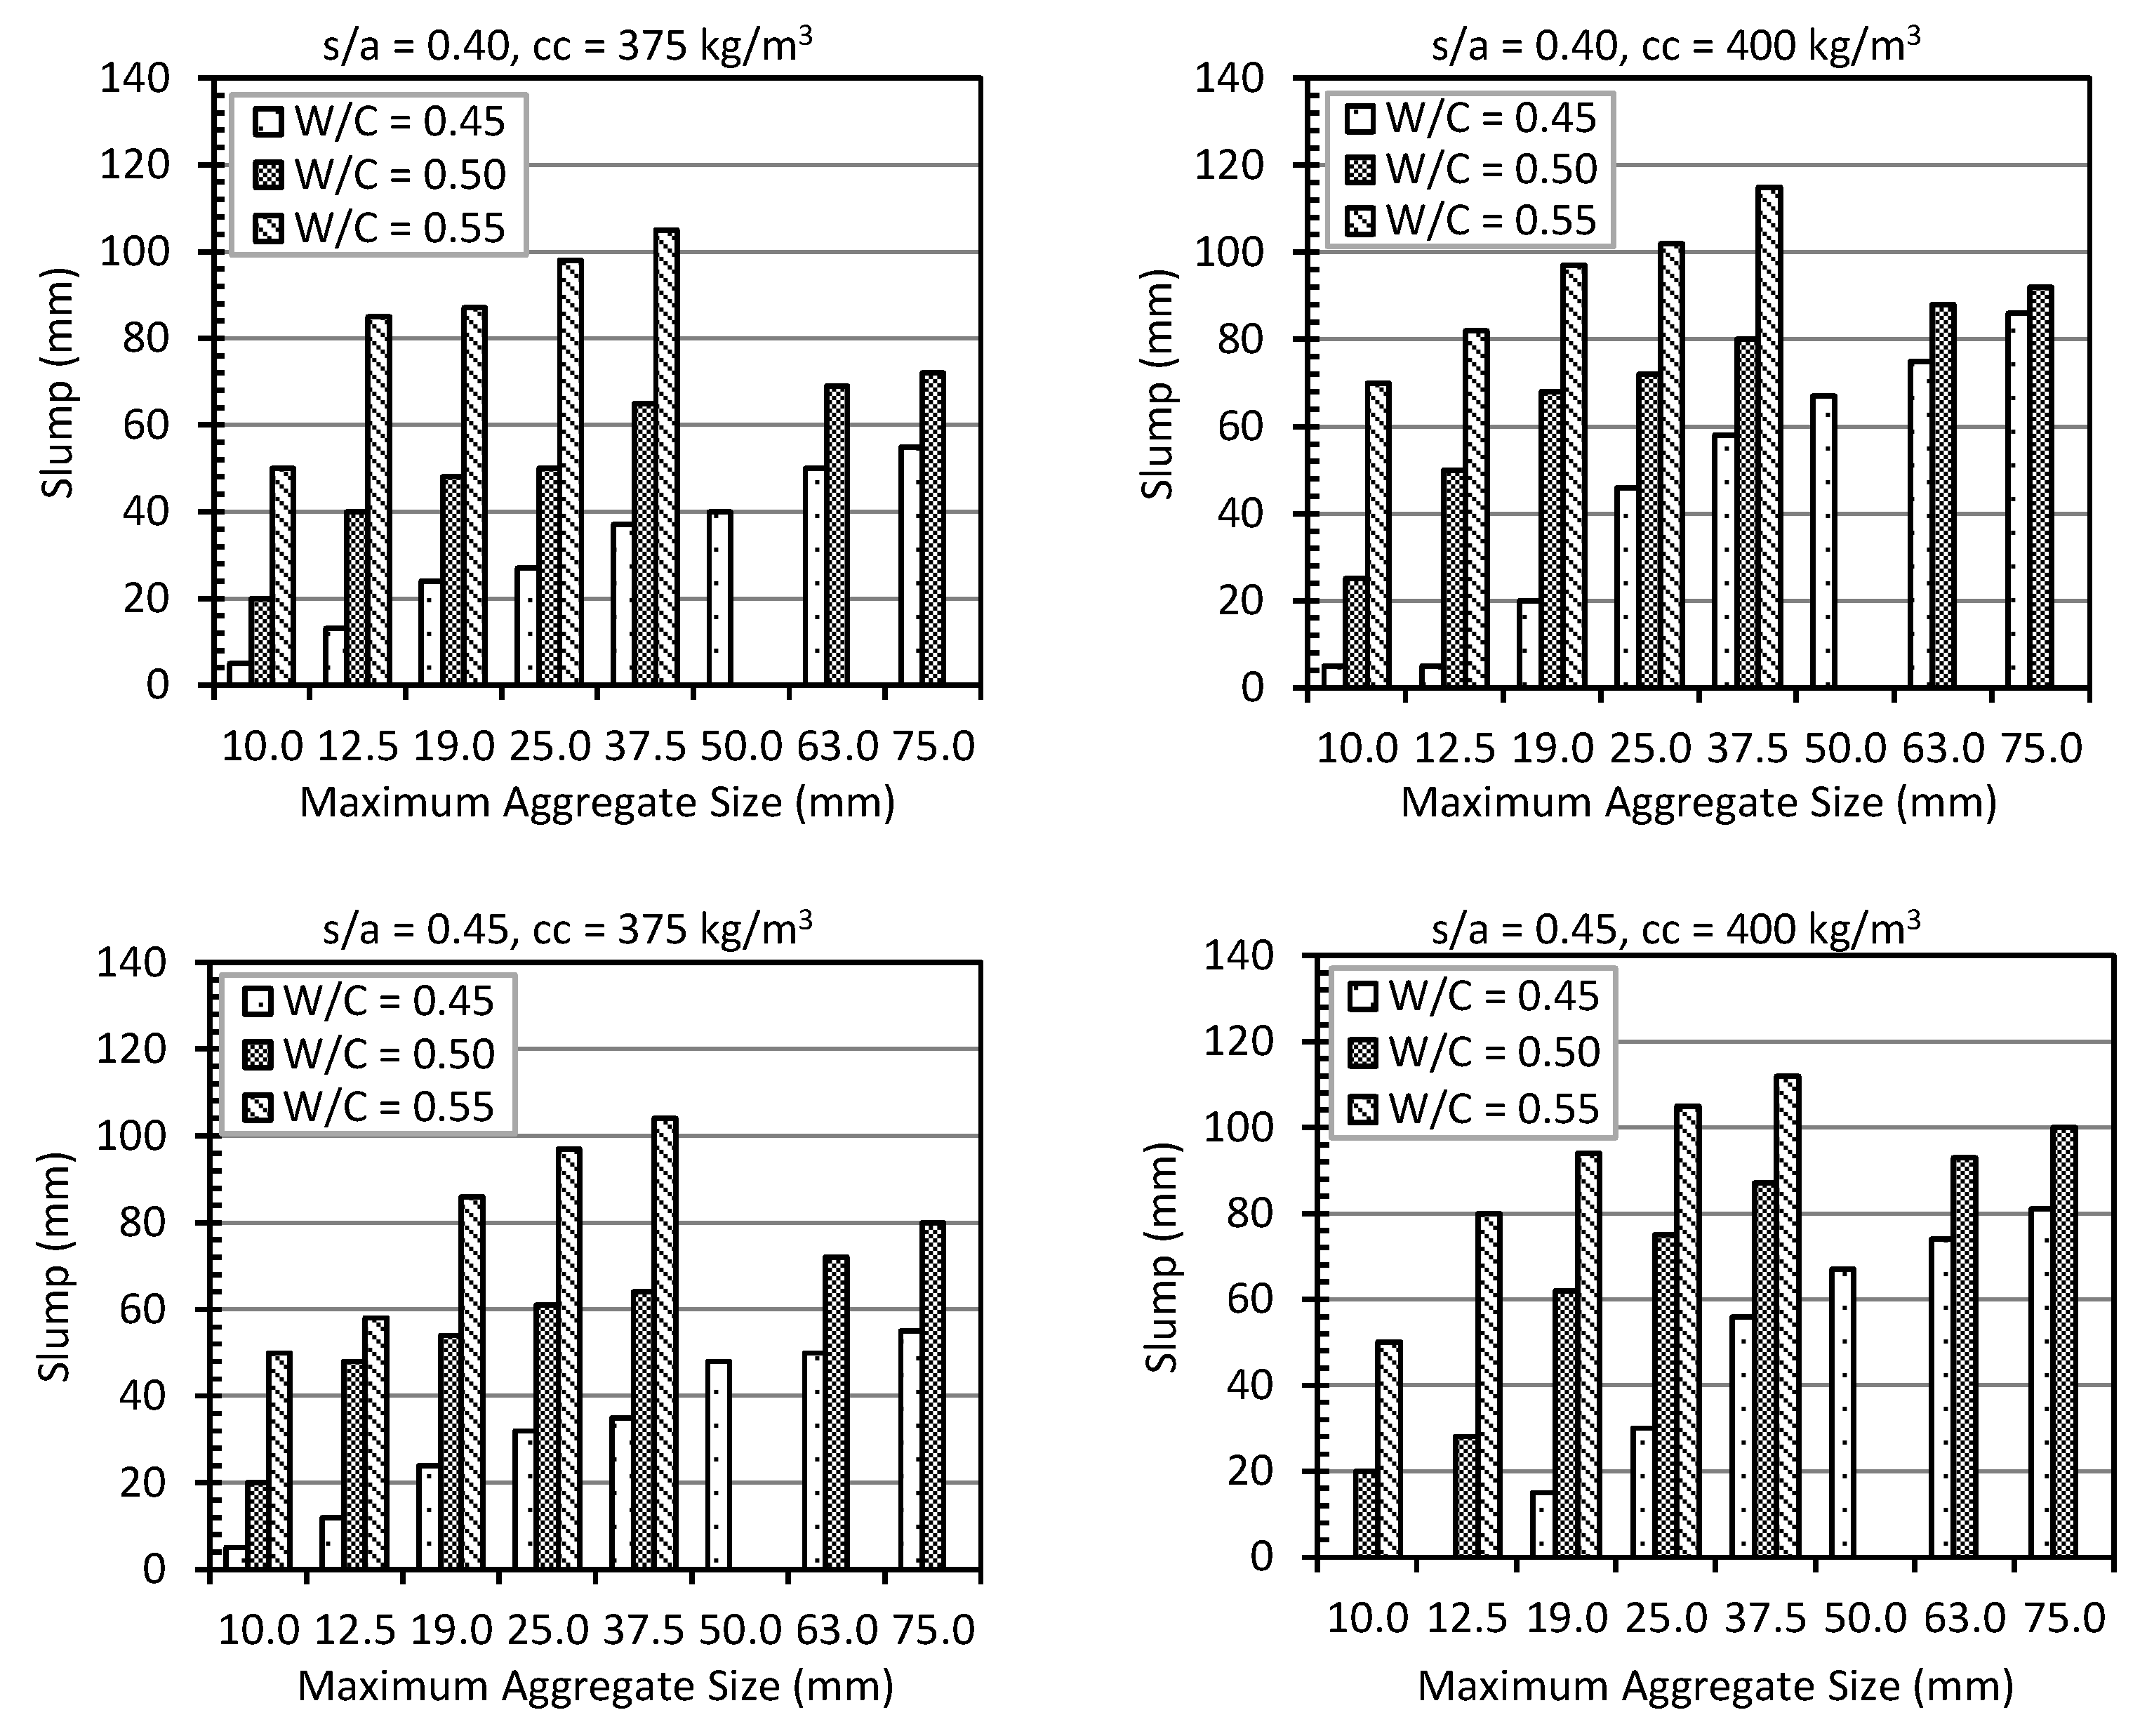
Figure 2 illustrates the effects of MAS on the workability of concrete for different s/a, cement content, and W/C. In general, there is an increasing trend in the workability of concrete with increasing MAS and W/C. Aïtcin [11] reported improved workability while increasing MAS from 12 mm to 25 mm, similar to the findings of this study. However, Figure 2 considers a larger range of MAS of up to 75 mm and confirms the gradual improvement in the concrete slump with increasing MAS. The gradation of the aggregate influences the workability significantly as it determines particle packing, and how they roll and flow together in the fresh state. The quantity of smaller-sized aggregates in case of larger MAS reduces in the mix resulting in a reduced total surface area of the aggregates. These combinations contribute to an increase in the slump of concrete made with larger aggregates [27]. Slump is not reduced for very large-sized MAS (such as 63 mm and 75 mm) due to the direct influence of the size of aggregate in the subsidence of concrete.
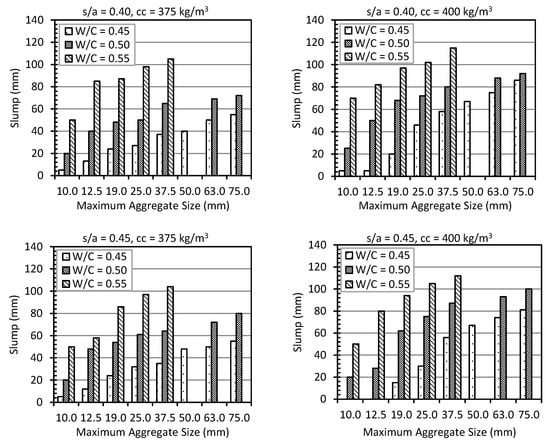
Figure 2.
Effects of MAS on the workability of concrete.
4.2. Variation in ITZ Perimeter with MAS
The perimeters of the ITZ around the coarse aggregates were quantified using images of longitudinally split specimens. The images were later explored using ImageJ software to calculate the perimeter of ITZ. Figure 3 shows the perimeter of the ITZ with the variation of maximum aggregate size. As different sizes of specimens (100 mm × 200 mm, 150 mm × 300 mm, 200 mm × 400 mm, and 250 mm × 500 mm) were cast due to the variation of MAS (from 10 mm to 75 mm), for larger specimens (150 mm × 300 mm, 200 mm × 400 mm, and 250 mm × 500 mm), the equivalent perimeter corresponding to an area of 100 mm × 200 mm specimens were calculated for logical data interpretation. From Figure 3, it is evident that larger MAS results in a significant reduction in the perimeter of ITZ around coarse aggregate, and smaller MAS has a notably higher perimeter of ITZ.
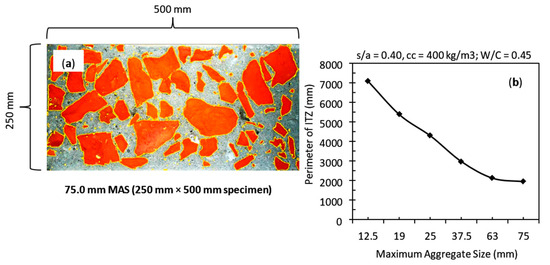
Figure 3.
(a) Measuring the perimeter of ITZ using ImageJ software; (b) variation of the perimeter of ITZ around coarse aggregate for different MAS.
4.3. Variations in Hardened Properties of Concrete with MAS
4.3.1. Compressive Strength
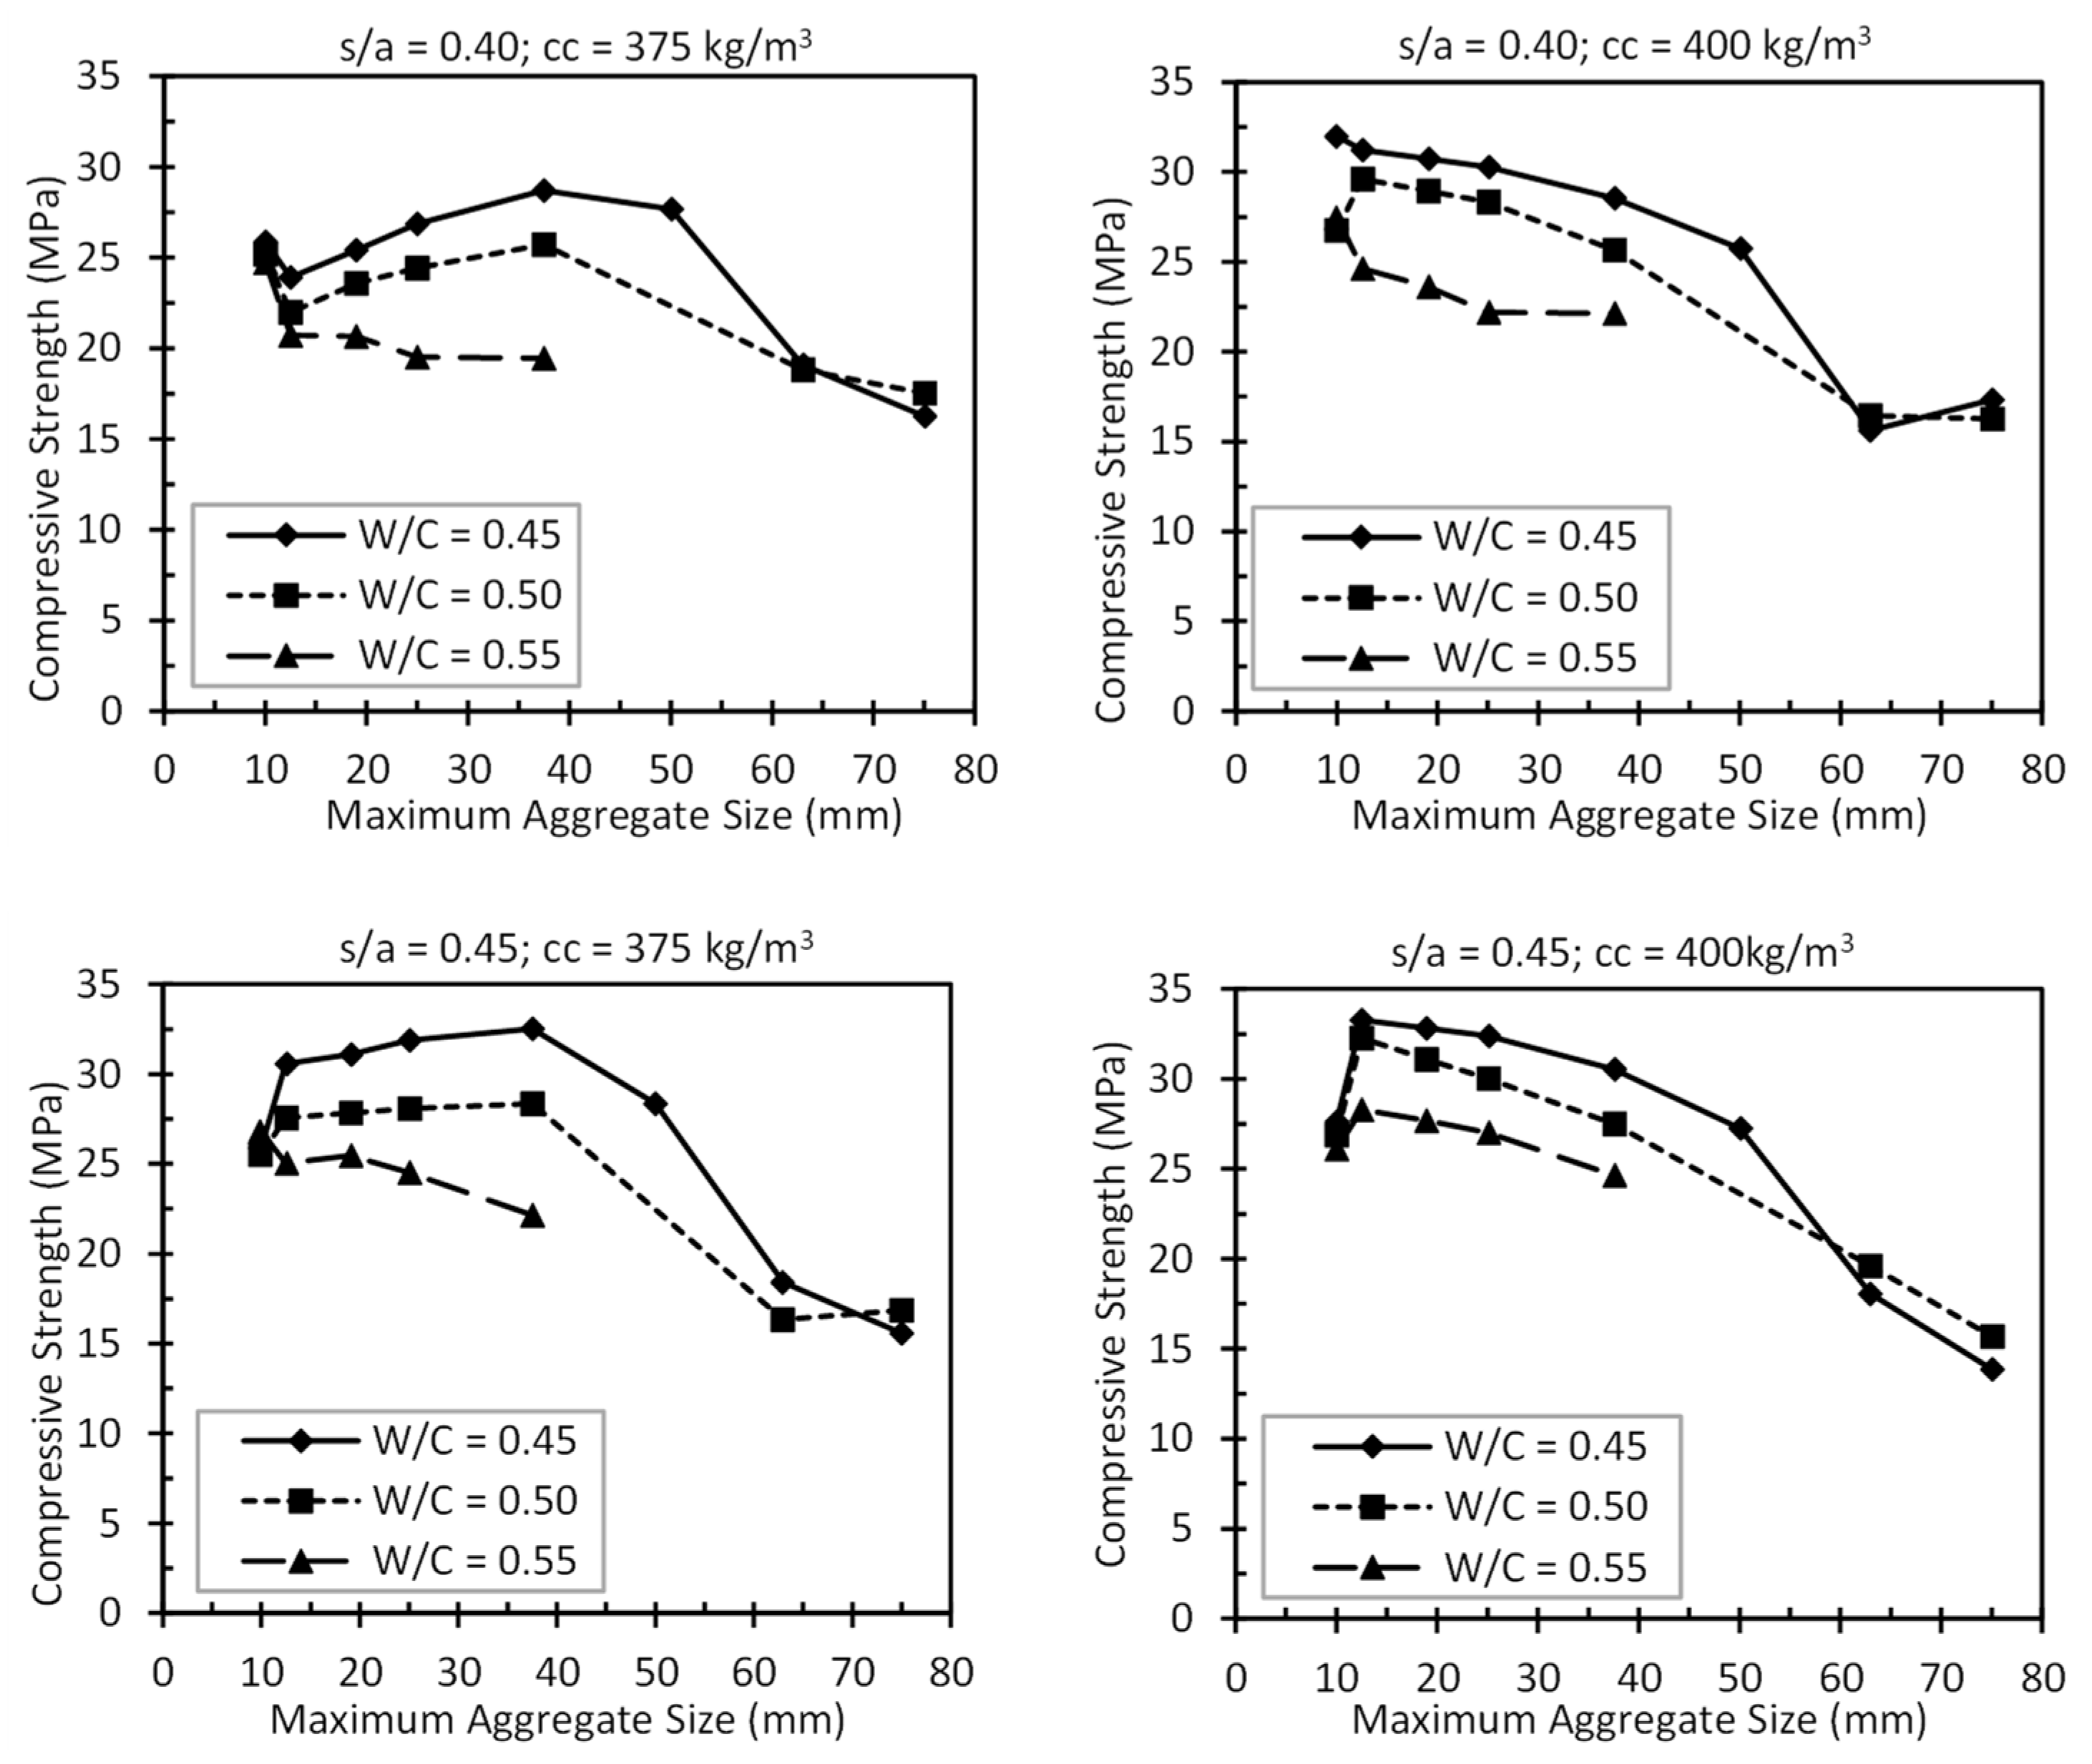
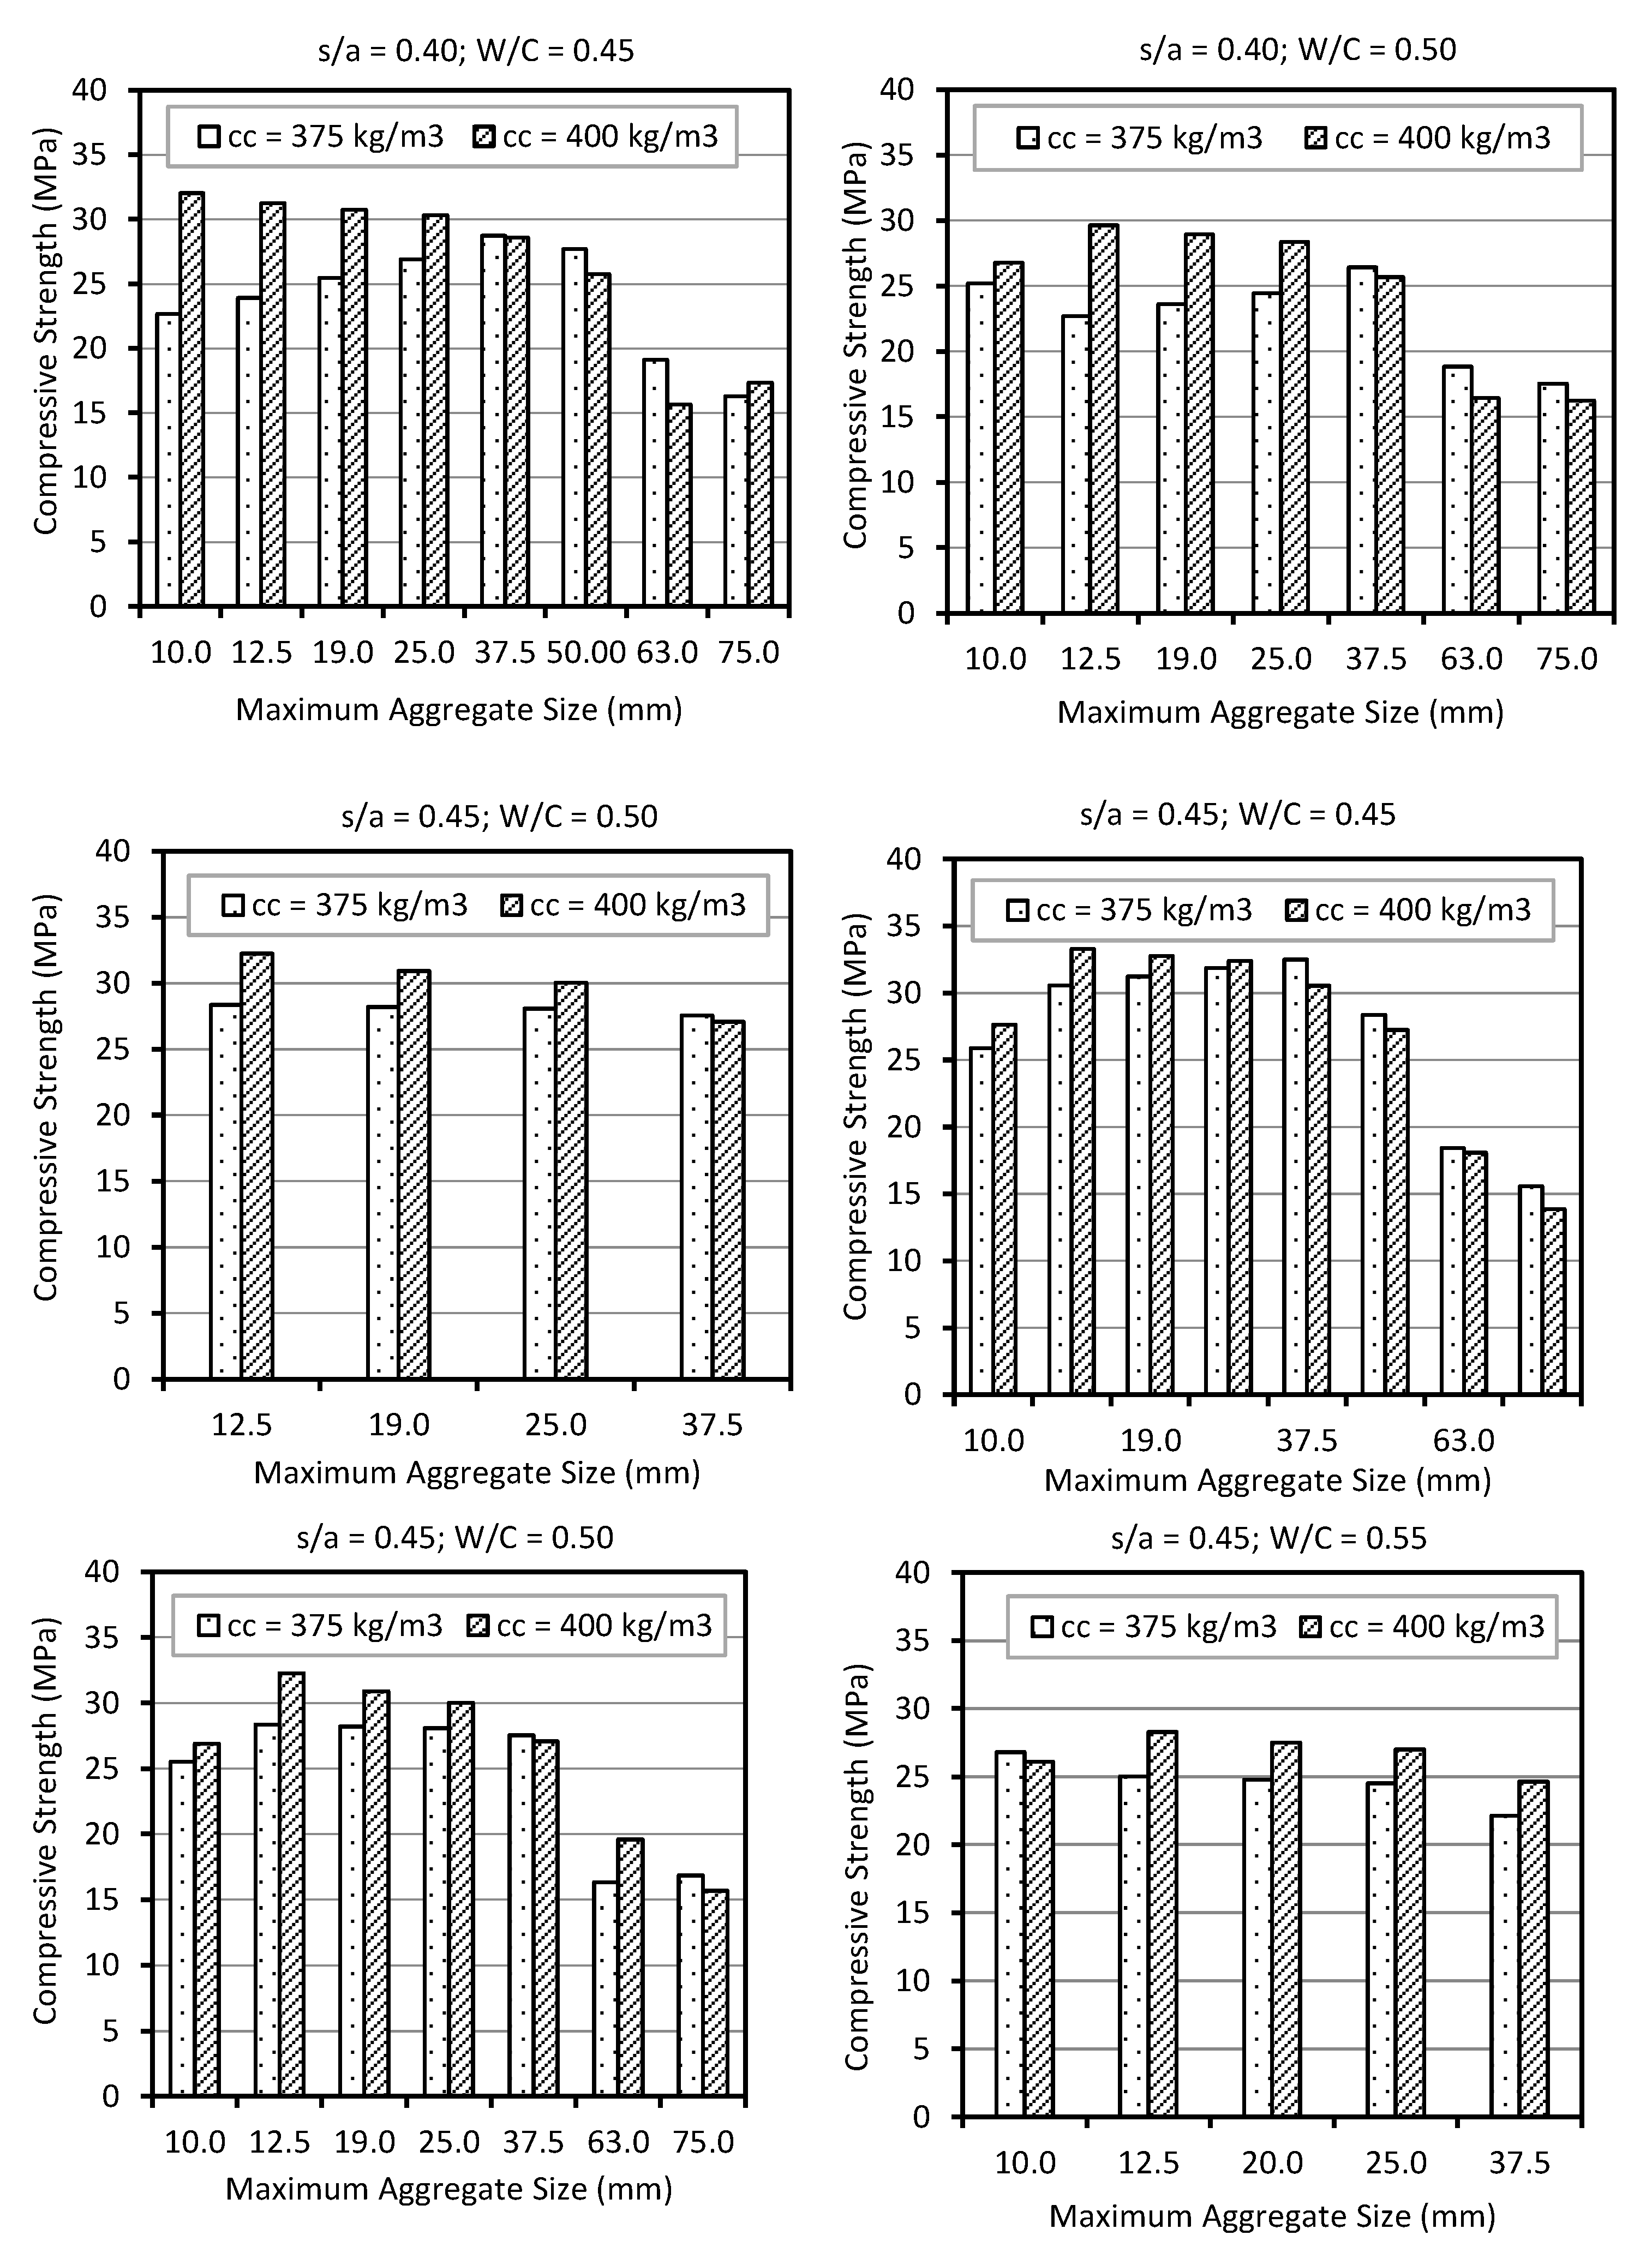
Figure 4 illustrates the effect of MAS on the compressive strength of concrete at 28 days. Two trends are found in the compressive strength of concrete with respect to the cement contents investigated. At a relatively lower cement content of 375 kg/m3 and lower W/C (0.45 and 0.50), the compressive strength increases with increasing aggregate size up to 37.5 mm, and a significant drop in compressive strength is observed for larger MAS irrespective of s/a. On the other hand, the cases studied with a cement content of 400 kg/m3 show a gradual decrease in compressive strength with an increase in aggregate size, irrespective of s/a and W/C. For large aggregates, although the overall perimeter of ITZ is reduced (Figure 3b), the interaction of the aggregate surface with the binding paste and mortar is impacted by aggregate size. Moreover, the effect of MAS on compressive strength is somewhat influenced by the cement content.
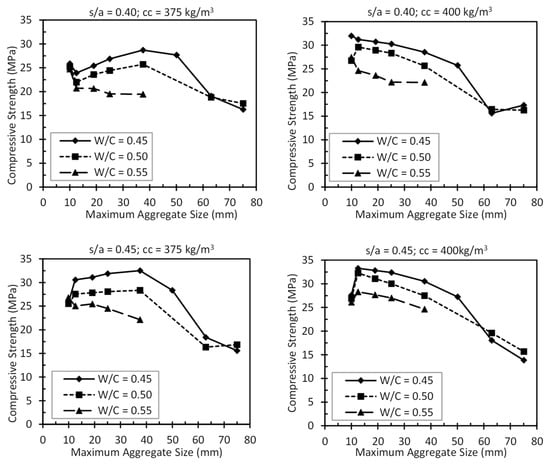
Figure 4.
Effects of MAS on compressive strength of concrete.
Based on the visual inspection of the crushed specimens, it was evident that at a cement content of 375 kg/m3, the failure propagated along the aggregate–mortar interface. For such cases, the aggregate–mortar interface plays a vital role. With an increase in aggregate size, the total area of the interfacial transition zone (ITZ) is reduced (as explained in later sections), and therefore, there is a reduction in the weaker plane and as such, a reduction in the possibility for an improved ITZ [27]. Thus, for 375 kg/m3 cement content, higher compressive strength for larger MAS is observed up to 37.5 mm. However, for MAS over 37.5 mm, the heterogeneity of ITZ around aggregate becomes significant and critical, resulting in a drop in the compressive strength. Further microstructural observations are reported in the following sections to justify the trend.
In contrast, for a cement content of 400 kg/m3, the perimeter of ITZ for smaller MAS seems to be stronger resulting in a relatively higher compressive strength. Also, when the proportion of smaller coarse aggregates increases in the mix, it often eliminates micro-cracks and internal defects of larger sizes of the same aggregate [11]. However, substantial heterogeneity of aggregate–mortar interface due to blockage of bleeding water under the aggregate is observed for larger MAS as explained by Aïtcin [11]. Thus, there is a formation of weaker ITZ. The heterogeneity of the ITZ around large aggregates can be observed even by the naked eye after splitting concrete specimens. The presence of a layer of white deposit can be found under the larger MAS due to the blockage of bleed water (Figure 5) under the aggregate during the plastic stage of concrete. The white deposit is expected to be a layer of calcium hydroxide (CH) along with other hydration products, later confirmed in microscopic investigations, and detailed in Section 4.4. These observations can also corroborate the utilisation of smaller MAS for fabricating high-strength concrete, i.e., the compressive strength over 40 N/mm2 [3]. For lower cement content of 375 kg/m3, the improvement of the aggregate–mortar interface due to an increase in aggregate size (up to 37.5 mm) is significant when compared to the weakening of the interface resulting from the blocking of bleed water under the aggregate [27]. The compressive strength of concrete drops significantly with the increase of W/C for all cases investigated in this study.
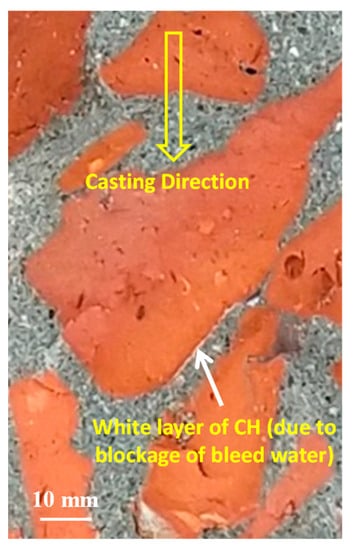
Figure 5.
White deposit under a 63 mm nominal size aggregate.
Based on the discussions in earlier sections, it is also evident that a relatively lower content of cement can improve the ITZ around larger MAS of coarse aggregates [27]. Consequently, for 375 kg/m3 cement content, the relatively higher mechanical strength of concrete has been observed in the case of larger MAS up to 37.5 mm. Moreover, for a smaller size of coarse aggregate, a higher cement content improves the ITZ resulting in an improved mechanical strength of brick aggregate concrete.
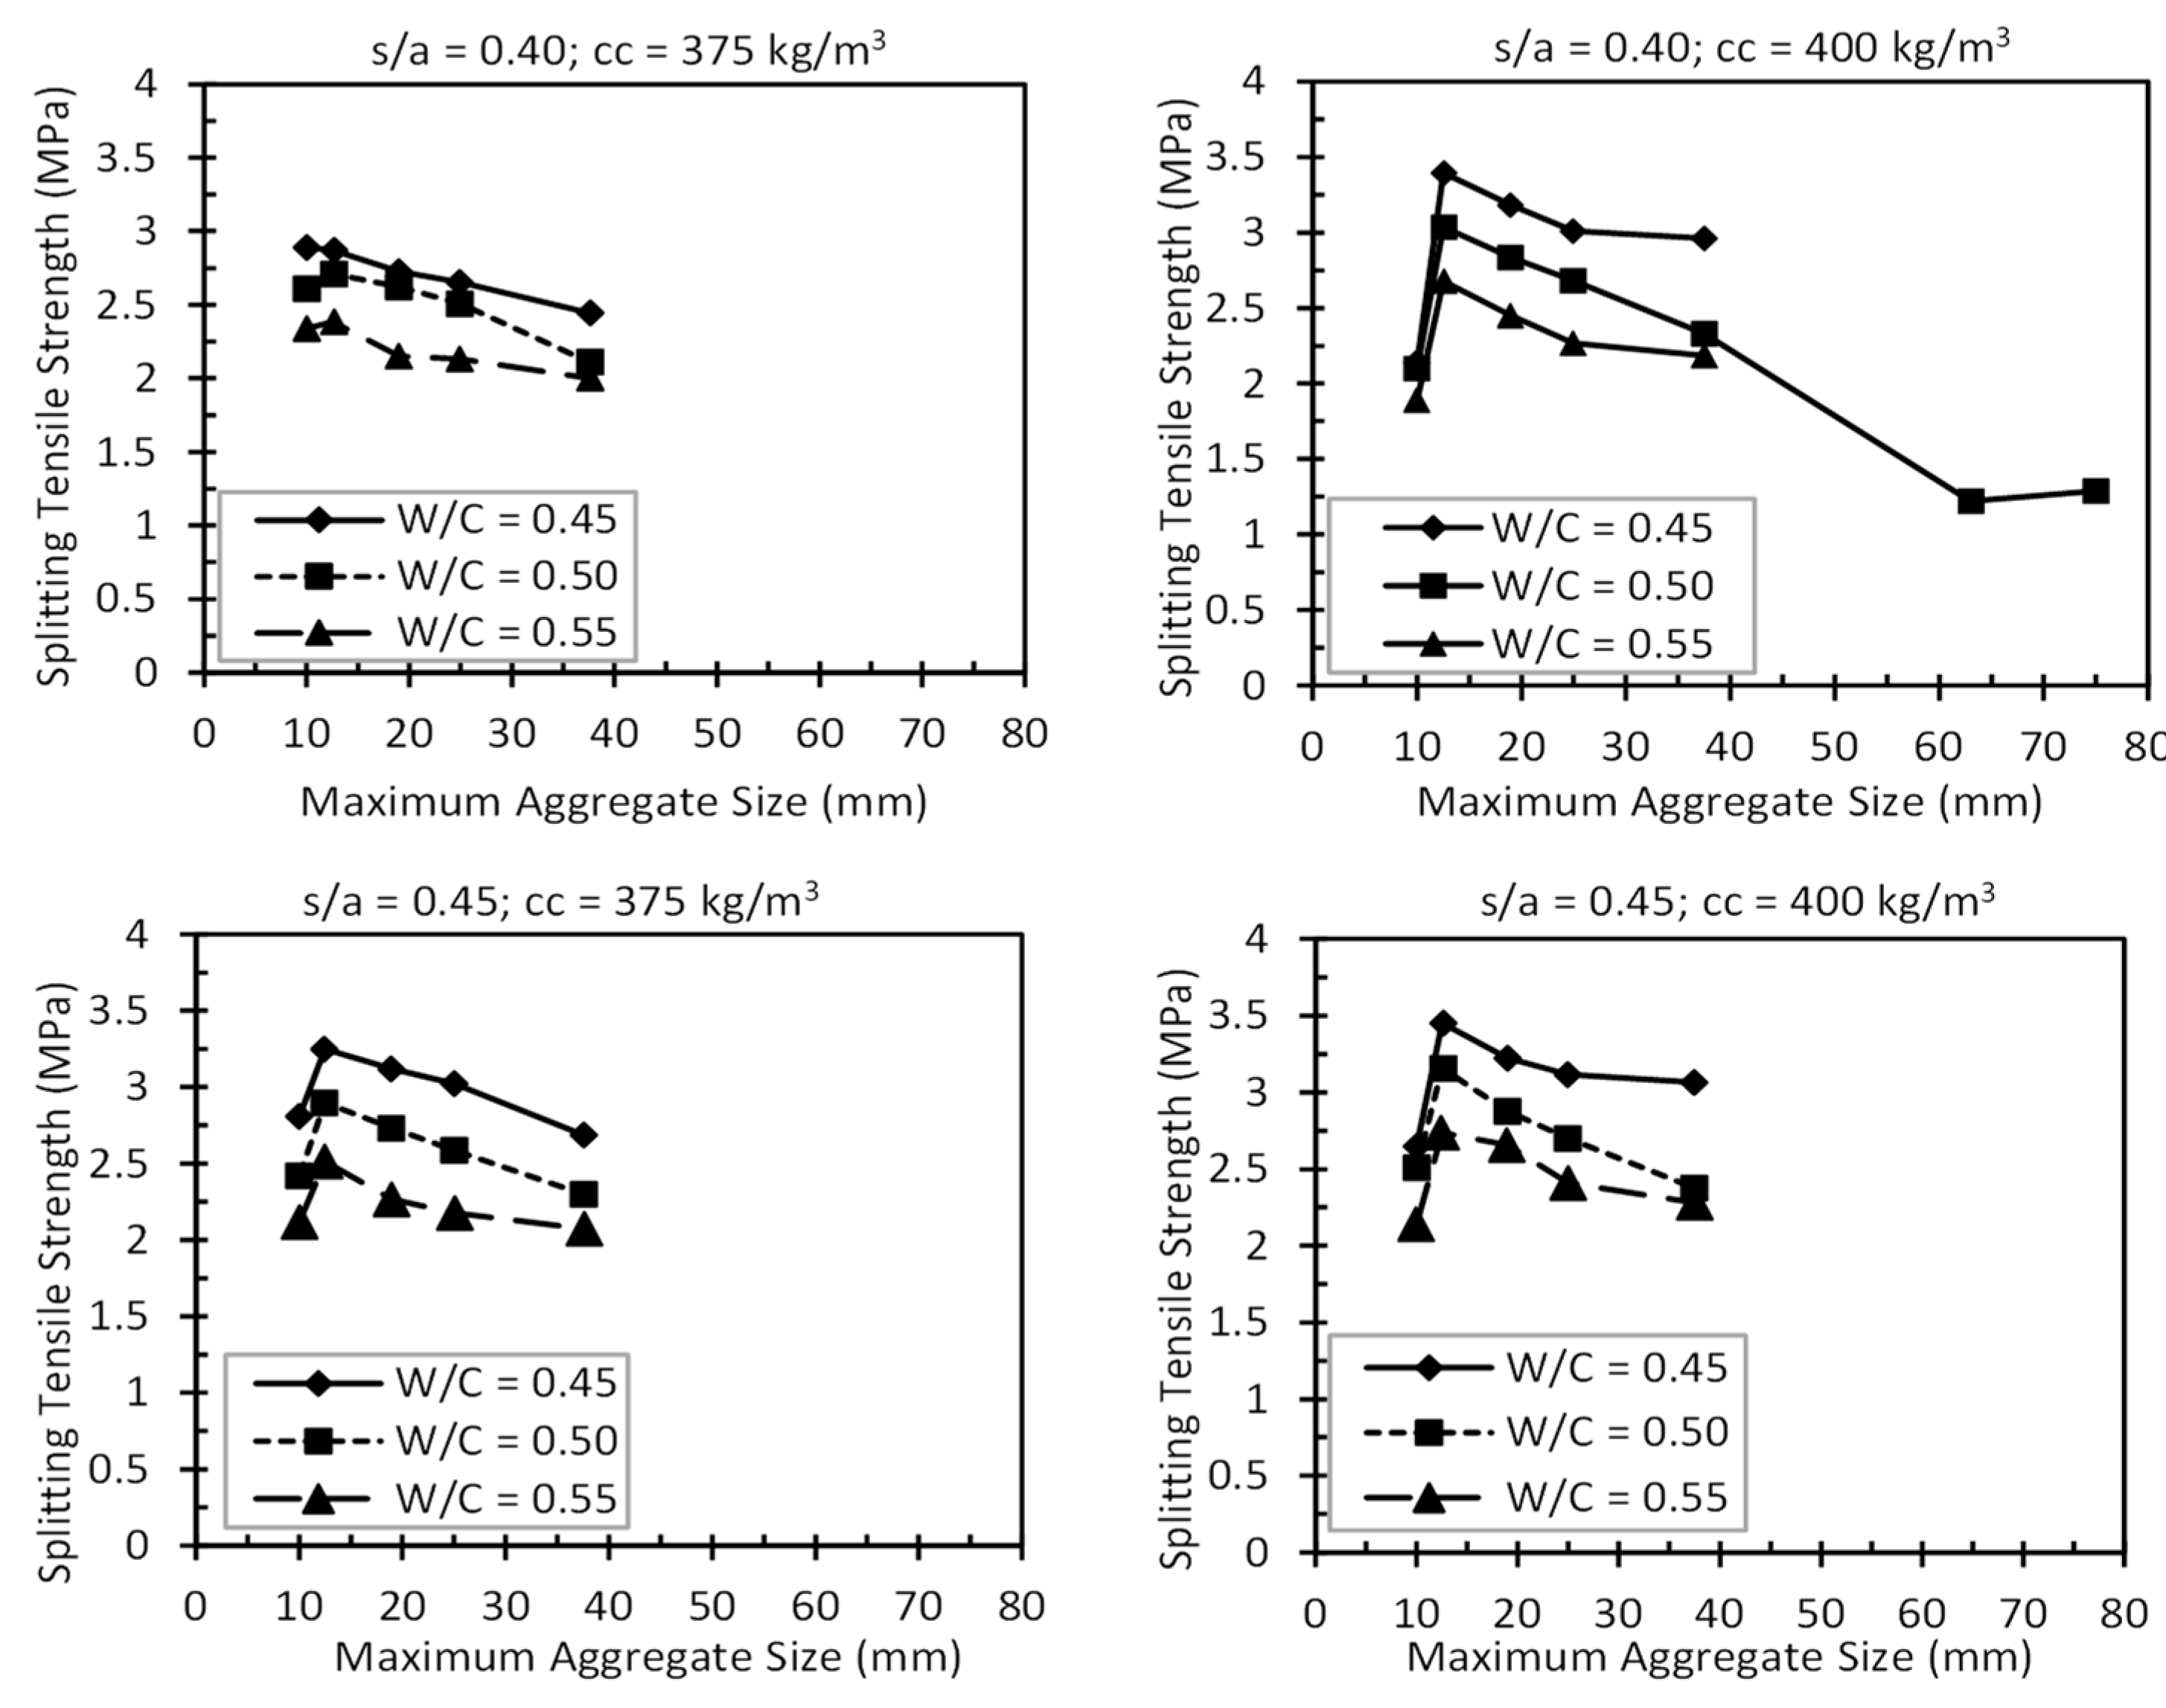
4.3.2. Splitting Tensile Strength
Figure 6 illustrates the influence of MAS on the splitting tensile strength (at 28 days) of concrete for different s/a, cement content, and W/C. For 10 mm aggregate, a reduced level of the tensile strength of concrete has been observed compared to the other aggregate sizes. It is expected due to the increase in the total surface area of coarse aggregates due to the use of smaller MAS. To improve the interface around the coarse aggregates for such a small MAS, cement content is to be increased. The tensile strength increases for MAS of 12.5 mm but later reduces gradually with the increase of aggregate size irrespective of cement content and s/a. The tensile strength of concrete for MAS over 63 mm dropped significantly. With the increase of MAS, the homogeneity of concrete, particularly ITZ around the aggregates deteriorated significantly. It results in a significant drop in tensile strength as well as compressive strength as explained earlier. The trend of the results related to tensile strength is different from the results of the compressive strength of concrete as explained in the previous section. As tensile strength and compressive strength of concrete are significantly affected by MAS, respective correlations between these mechanical properties for different MAS need to be formulated instead of a general relationship as proposed in ACI 318-14 [26].
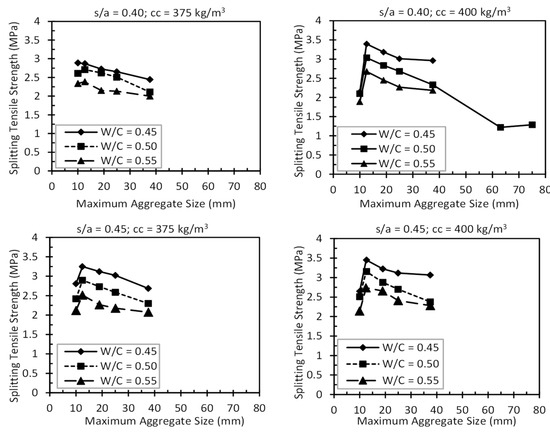
Figure 6.
Effects of MAS on splitting tensile strength of concrete.
4.3.3. Elastic Modulus
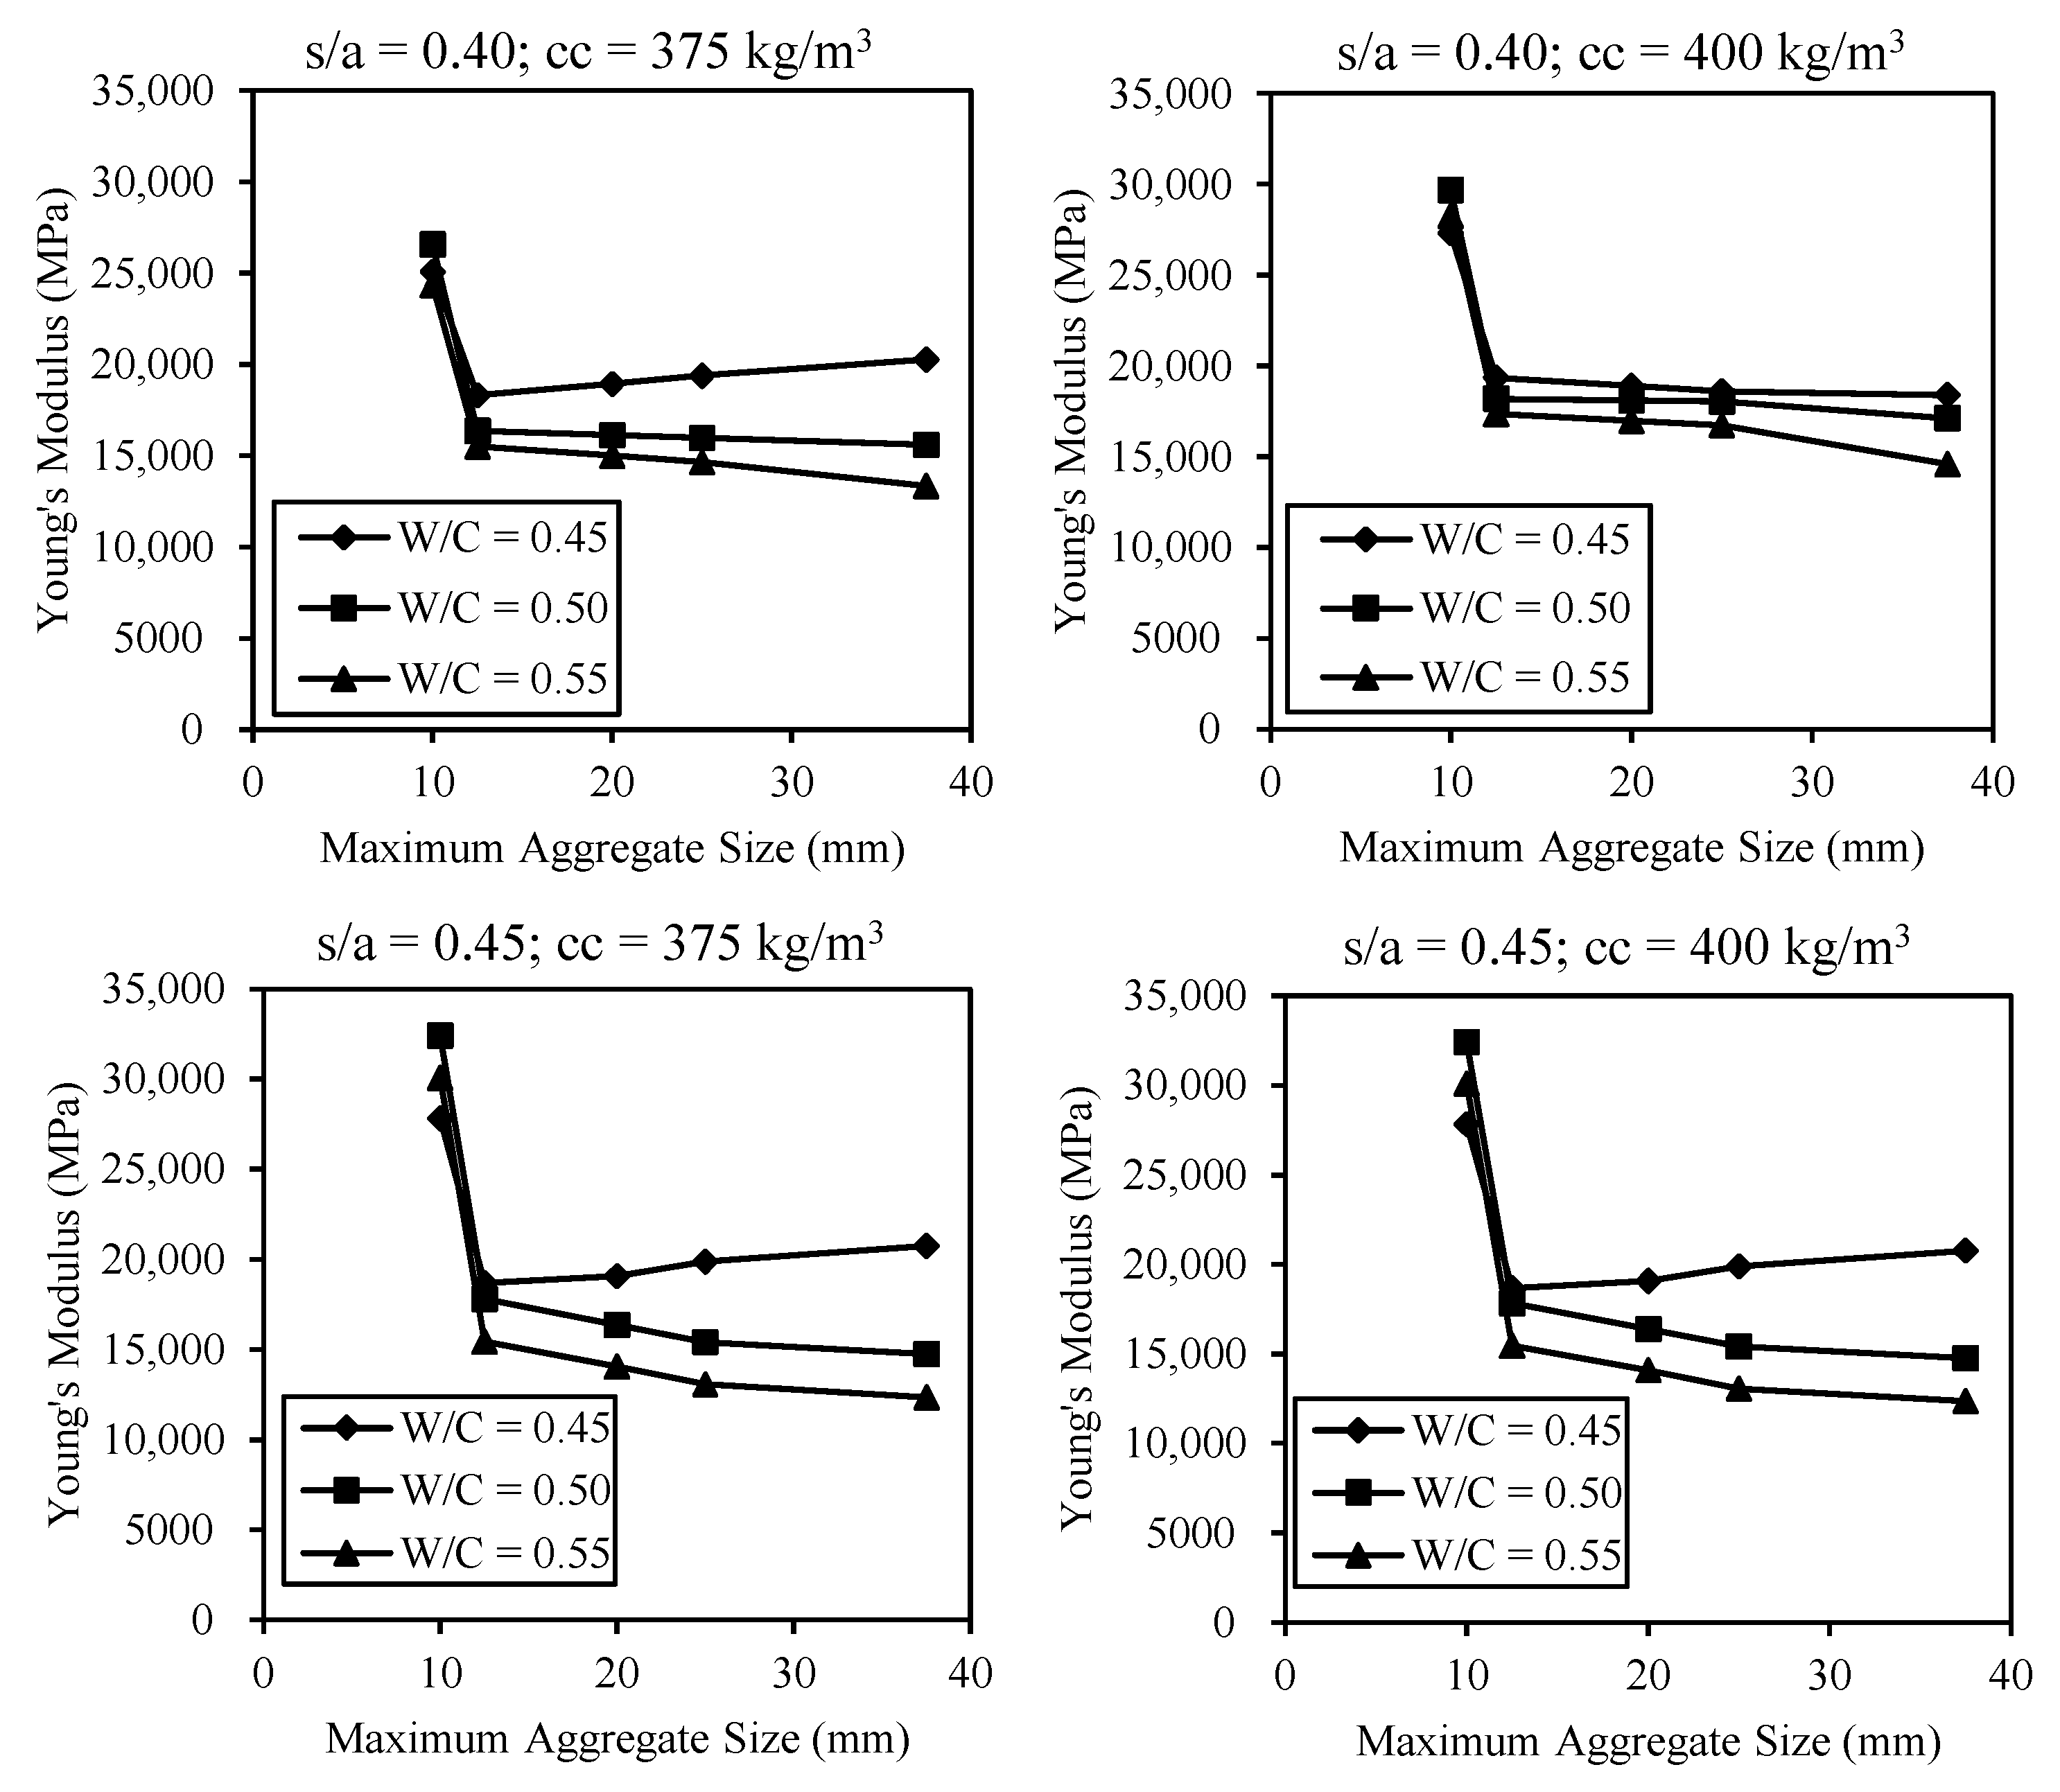
The effect of MAS on the elastic modulus of brick aggregate concrete (at 28 days) is presented in Figure 7. Irrespective of cement content and s/a, the elastic modulus decreases with an increase in MAS, particularly for the mixes with higher W/C (0.50 and 0.55). Due to the increase of MAS, the homogeneity of ITZ around the aggregate deteriorates and the deterioration seems to be more significant for higher W/C. A reflection of this phenomenon can also be found in this study. For higher cement content (400 kg/m3), the elastic modulus of concrete for MAS of 10 mm is found to be relatively lower compared to the other smaller MAS, irrespective of W/C and s/a. Same as compressive strength, for lower cement content (375 kg/m3) and lower W/C (0.45), a tendency of increasing elastic modulus is observed with the increase of MAS up to 37.5 mm. In this study, due to the limitation of the strain gauge device, the elastic modulus data for larger specimens could not have been recorded. The compressive strength data with the variation of cement content and s/a are explained in later sections. A similar trend in results as in elastic modulus is detected for the compressive strength of concrete. The trend of increase/decrease in both compressive strength and elastic modulus agrees with the findings in the literature [36,37]. As expected, similar to compressive strength and tensile strength, the elastic modulus of concrete is reduced with an increase in W/C.
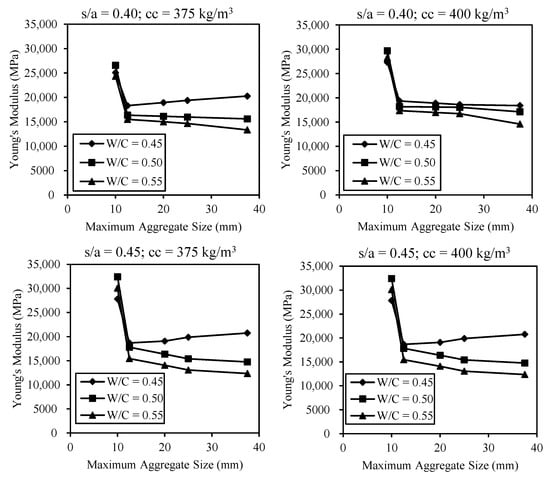
Figure 7.
Effects of MAS on the elastic modulus of concrete.
4.4. Microstructural Investigation
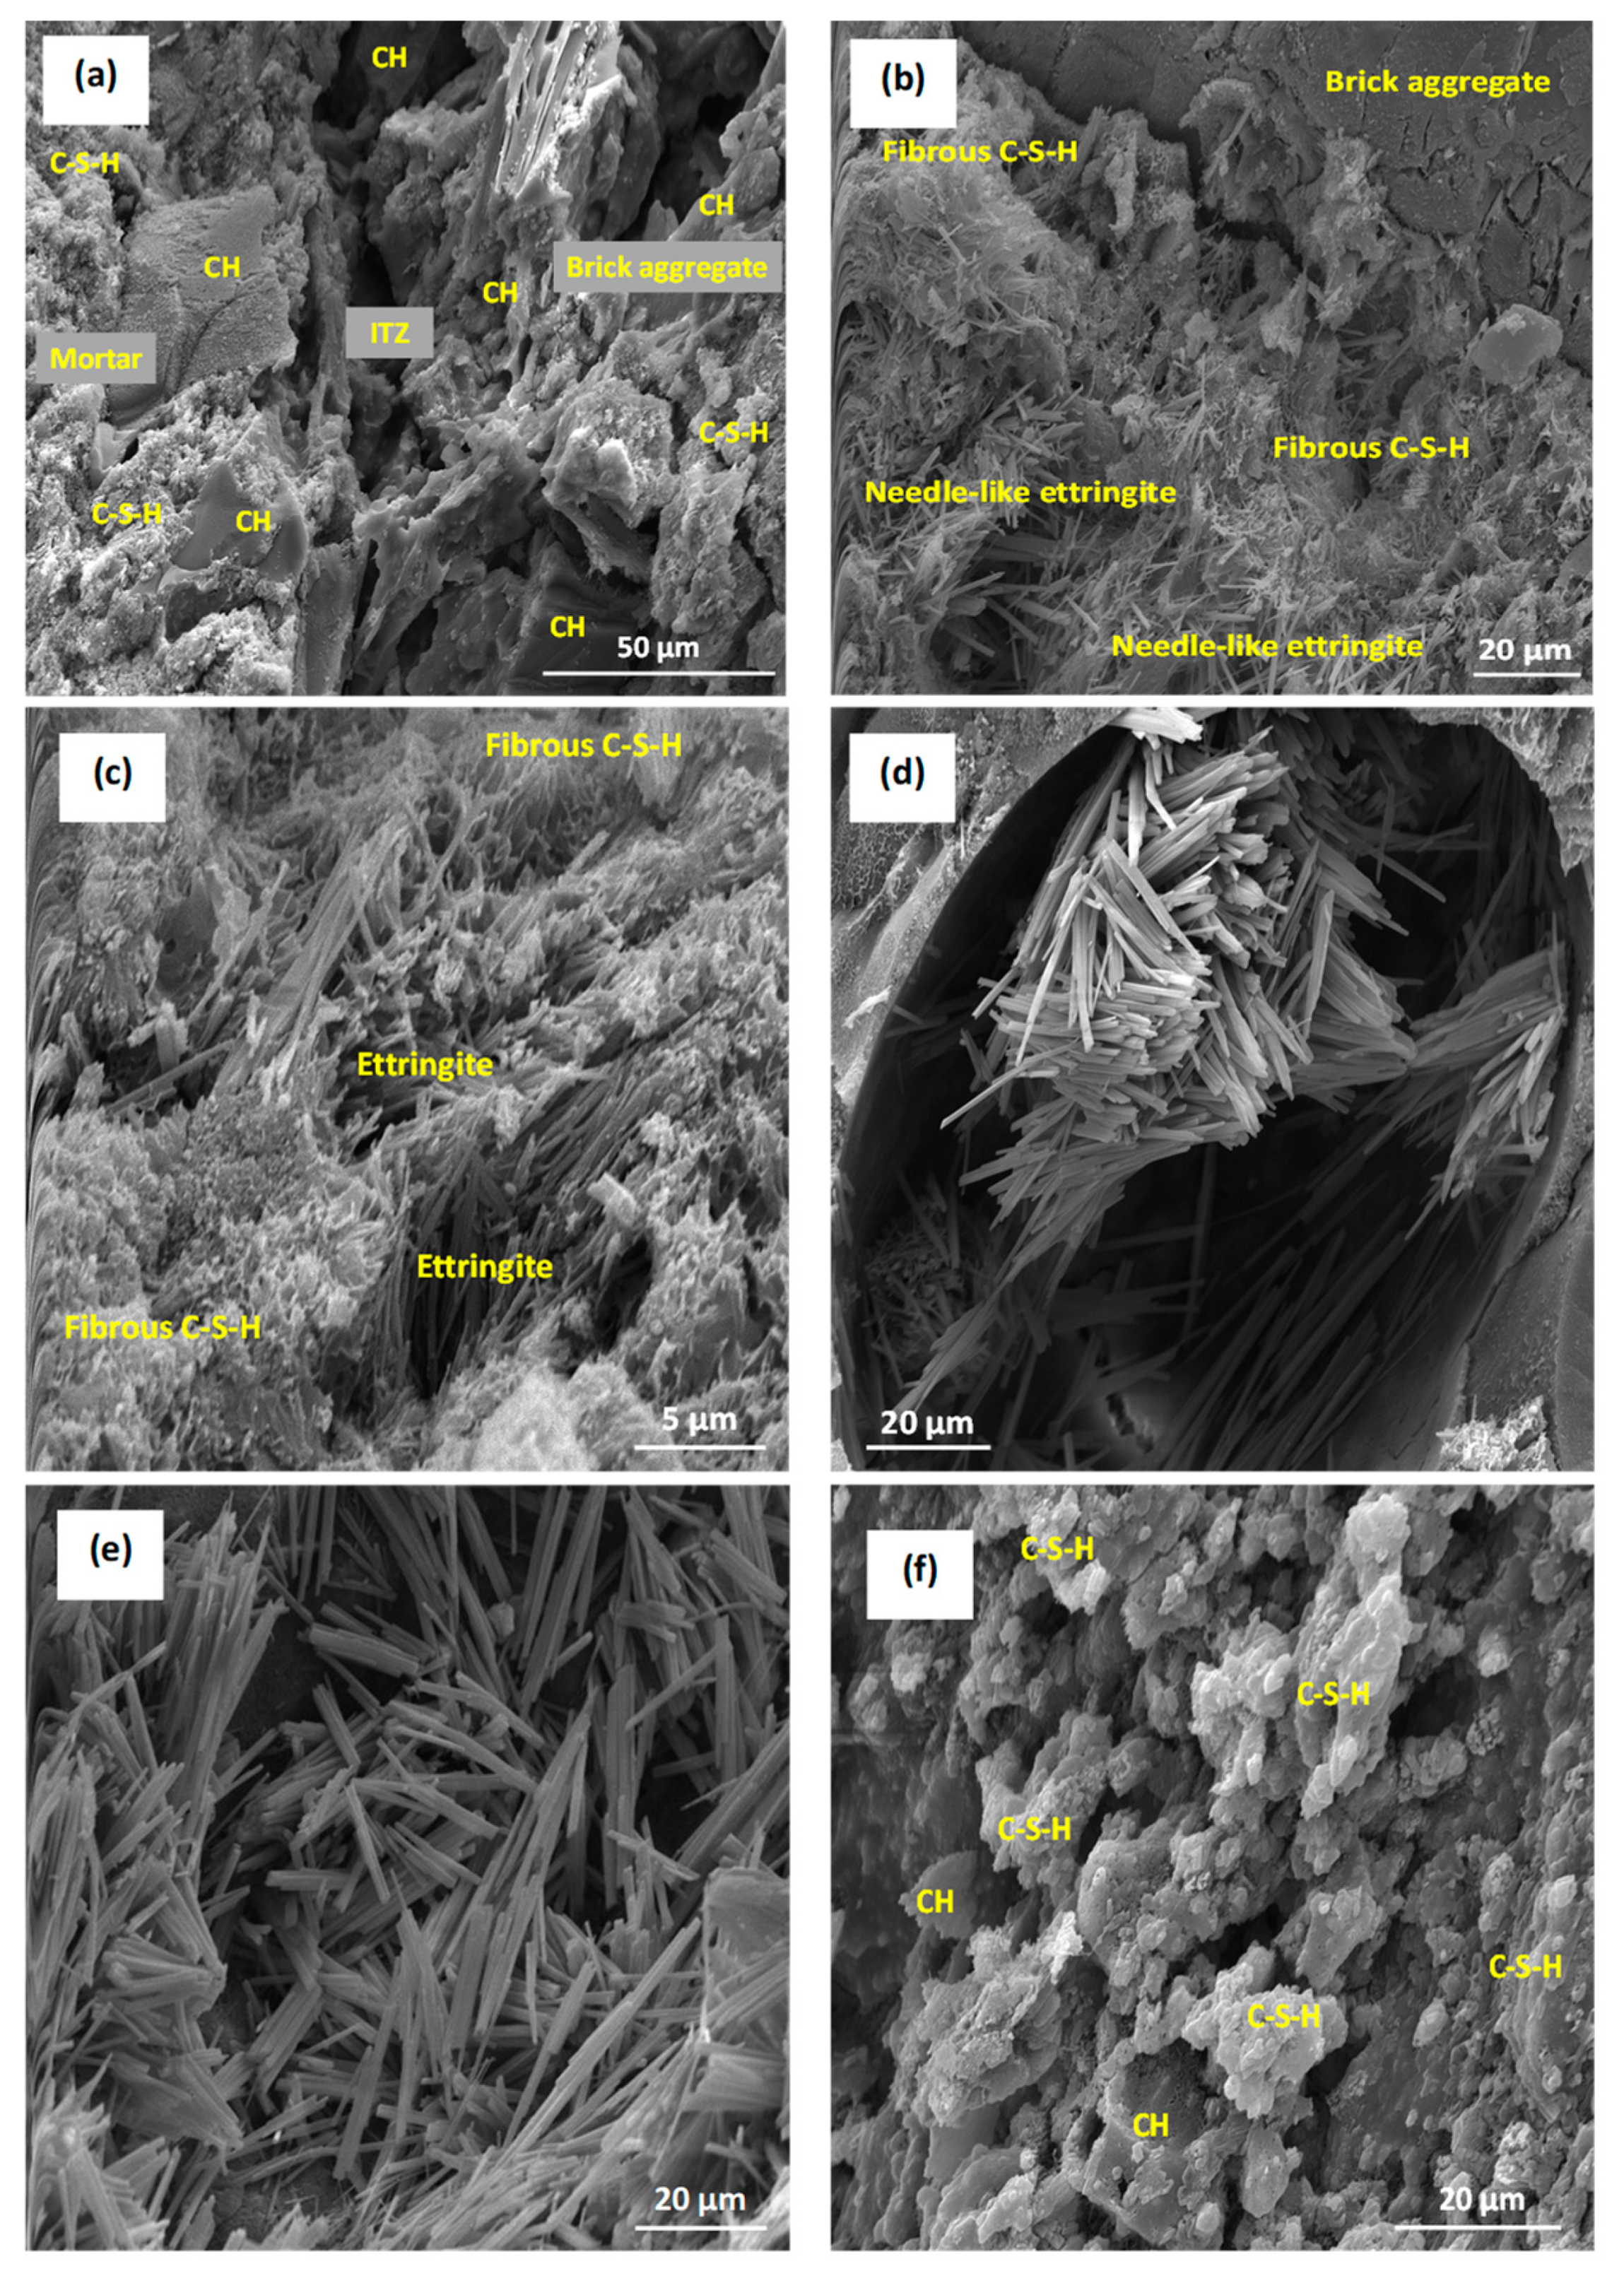
The concrete microstructures around the ITZ (at the age of 28 days), particularly along the top and bottom of the 63 mm aggregates were investigated as areas of interest as shown in Figure 8. The top and bottom of coarse aggregates were realised based on the direction of concrete pouring during specimen preparation. Figure 8a shows the ITZ along the top surface of a 63 mm brick aggregate particle and the presence of reaction products like Portlandite (CH) sheets and C-S-H layers can be easily identified, including similar depositions along the ITZ. On the contrary, at the bottom surface of the aggregate, patches of fibrous C-S-H can be observed in Figure 8b,c along with several instances of ettringite formations along the ITZ with few instances of CH. Also of interest are the voids below the large aggregates that are predominantly filled with ettringite depositions as can be seen in Figure 8d,e. The ettringite clusters along the ITZ and their intra-pore formations along with the fibrous C-S-H structure in the ITZ indicate heterogeneity in the aggregate–mortar interface [41], particularly for larger MAS. In addition, during concrete bleeding, the bleed water gets trapped under the aggregate and accumulates there, leading to the formation of voids either through the uptake of bleed water in cement hydration or simply evaporation. These voids under the larger aggregates act as sites for ettringite formations and in the process, weaken the aggregate–mortar interface and cause a reduction in concrete strength, particularly made with large MAS as identified in the discussions on hardened properties. Depositions of CH and C-S-H were also observed on the brick aggregate surface in Figure 9f that may have originated from the pozzolanic reactivity of clay-burnt brick [42].
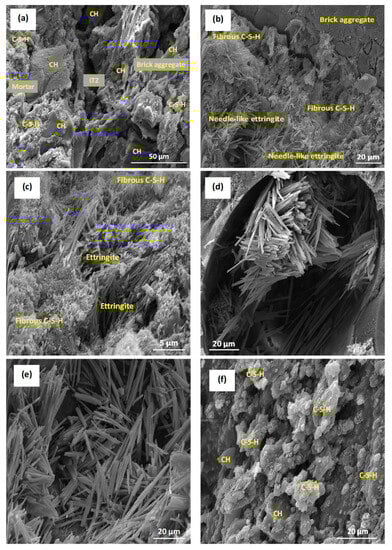
Figure 8.
Microstructural analysis of brick aggregate concrete near the ITZ of 63 mm aggregate: (a) ITZ along the top surface of the aggregate; (b,c) ITZ along the bottom surface of the aggregate surrounded by fibrous C-S-H and ettringite; (d,e) formations of ettringite clusters in the ITZ along the bottom surface of the aggregate; (f) reaction products onto the bottom surface of aggregate.
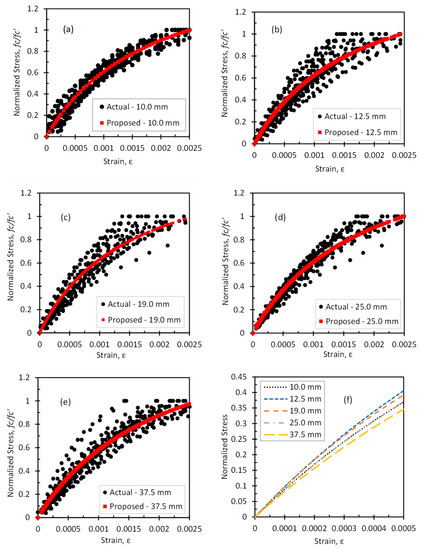
Figure 9.
Stress–strain curves of brick aggregate concrete of different MAS: (a) 10.0 mm; (b) 12.5 mm; (c) 19.0 mm; (d) 25.0 mm; (e) 37.5 mm; (f) comparison.
4.5. Stress–Strain Curve
As the mechanical properties of concrete change with changes in MAS, inevitable variations in the stress–strain behaviour of concrete with different MAS have also been observed as shown in Figure 9a–e. The ratio of stress to compressive strength (normalised stress) was plotted against the strain data of different MAS in Figure 9a–e. Based on the stress–strain curves, correlations between the stress and strain of concrete for MAS of 10 mm, 12.5 mm, 19.0 mm, 25.0 mm, and 37.5 mm are proposed. Correlations for 50 mm MAS and beyond are not proposed due to the limitations of the strain measuring setup.
The following non-linear stress–strain correlations are formulated for brick aggregate concrete made with different maximum aggregate sizes (Equations (4)–(8)):
where is the stress at strain ε, and is the 28 days compressive strength of concrete. These correlations are valid for strains of up to 0.0025, due to limitations in strain measurements beyond maximum stress. A fairly good correlation is found based on the R2 values associated with the Equations (4)–(8).
Figure 9f shows the effect of MAS on the stress–strain curves of concrete for strain levels of up to 0.0005 as per the proposed correlations. The stress–strain curve gradually flattens with the increase in aggregate size except for the MAS of 10 mm. This is in line with the elastic modulus results of concrete discussed in earlier sections.
4.6. Variations of Compressive Strength with Cement Content
The effect of cement content on the compressive strength of concrete is presented in Figure 10. In this study, the cement contents were 375 kg/m3 and 400 kg/m3. Irrespective of s/a (0.40 and 0.45) and W/C (0.45, 0.50, 0.55), the compressive strength of concrete increases with an increase in cement content. The influence of cement content on the compressive strength of concrete is diminished with the increase of MAS and the effect of MAS becomes unremarkable for MAS over 37.5 mm. This occurs due to the formation of weaker ITZ around aggregate for larger MAS. For a lower level of MAS, such as 10 mm, the influence of cement content was also found not to be as significant as in intermediate levels of MAS such as 12.5 mm and 19 mm. This is due to the significant increase in the surface area of the aggregate for MAS of 10 mm. It is also expected that the cement content is to be increased further to get the benefits of small-sized coarse aggregates as used for the production of high strength concrete [3,43].
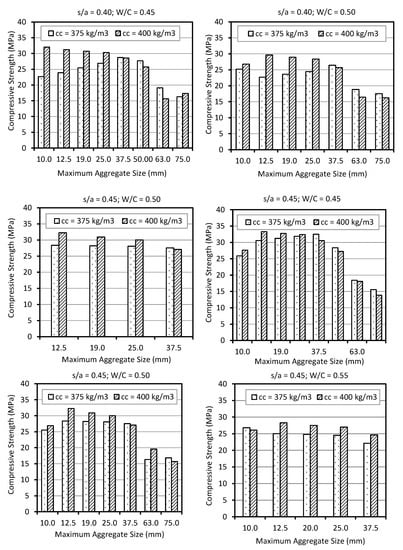
Figure 10.
Effect of cement content on compressive strength for different MAS.
4.7. Variations of Compressive Strength with s/a
The variations in compressive strength (at 28 days) with the variations in sand to total aggregate volume ratio (s/a) (0.40 and 0.45) are illustrated in Figure 11.
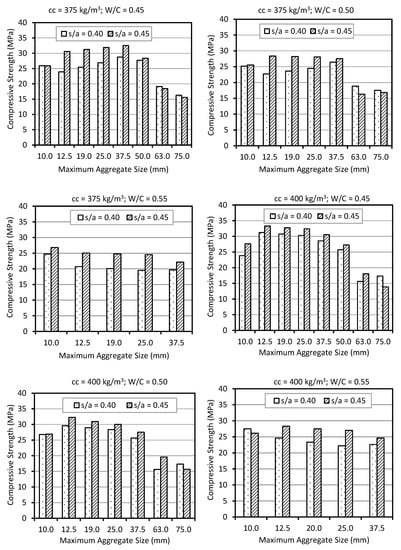
Figure 11.
Effect of sand to total aggregate volume ratio (s/a) on compressive strength for different MAS.
It is evident that an increase in s/a from 0.40 to 0.45 enhances the compressive strength of concrete irrespective of cement content (375 kg/m3 and 400 kg/m3) and W/C (0.45, 0.50, and 0.55). Similar results were also observed in other studies [44,45]. However, for the cases with a cement content of 375 kg/m3, the effect is more prominent. With an increase of s/a, the absolute volume of coarse aggregate is reduced, and the absolute volume of fine aggregate is increased. It is reasonable to consider that there should be an optimum s/a for each MAS (10 mm, 12.5 mm, 19 mm, 25 mm, 37.5 mm, 50 mm, 63 mm, and 75 mm) that will achieve maximum strength with optimum cement content. Further studies are necessary, considering the variation of s/a in a wider range for commonly used MAS (10 mm, 12.5 mm, 20 mm).
5. Conclusions
Based on the experimental results of this extensive study conducted on MAS of 10 mm, 12.5 mm, 15 mm, 19 mm, 25 mm, 37.5 mm, 50 mm, 63 mm, and 75 mm with the variation of cement content (375 kg/m3 and 400 kg/m3), s/a (0.40 and 0.45), and W/C (0.45, 0.50, and 0.55), the following conclusions are drawn:
- The workability of concrete increases with the increase in maximum aggregate size (MAS).
- SEM images confirm the entrapment of bleed water under large aggregates leaving a weak, heterogeneous ITZ filled with clusters of ettringite and fibrous C-S-H. As such, with increasing MAS, the mechanical strength of concrete reduces. However, there is an enhancement in the compressive strength of concrete with an increase in MAS from 10 mm to 37.5 mm for a cement content of 375 kg/m3 and W/C of 0.45 and 0.50. At such a relatively lower cement content, smaller aggregates provide a significantly larger ITZ perimeter, critical for the drop in strength irrespective of s/a. In addition, the increase of MAS gradually decreases the splitting tensile strength of concrete irrespective of s/a, cement content, and W/C.
- The compressive strength of concrete at s/a of 0.40 is higher than the compressive strength at 0.45, particularly for smaller MAS.
Author Contributions
Conceptualization, T.U.M.; formal analysis, A.H.M., A.S., F.A.K. and S.I.S.; funding acquisition, T.U.M.; investigation, A.H.M., A.S., F.A.K. and S.I.S.; methodology, T.U.M. and A.H.M.; project administration, T.U.M.; resources, T.U.M.; software, A.S., F.A.K., and S.I.S.; supervision, T.U.M.; validation, A.H.M.; writing—original draft, A.H.M. and A.S.; writing—review and editing, T.U.M., A.H.M. and A.S. All authors have read and agreed to the published version of the manuscript.
Funding
This research received no external funding.
Data Availability Statement
The data can be made available upon request to the corresponding author, A.H.M. at aziz.mahmood@uts.edu.au.
Acknowledgments
The authors express sincere gratitude to the Islamic University of Technology (IUT), Gazipur, Bangladesh, for administering the research work and Seven Rings Cement, Bangladesh for supplying the cement used in the study.
Conflicts of Interest
The authors declare no conflict of interest.
References
- Meddah, M.S.; Zitouni, S.; Belâabes, S. Effect of content and particle size distribution of coarse aggregate on the compressive strength of concrete. Constr. Build. Mater. 2010, 24, 505–512. [Google Scholar] [CrossRef]
- Neville, A.M. Properties of Concrete, 5th ed.; Pearson Education Ltd: Harlow, UK, 2011. [Google Scholar]
- Aitcin, P.C.; Mehta, P.K. Effect of Coarse Aggregate Characteristics on Mechanical Properties of High-Strength Concrete. ACI Mater. J. 1990, 87, 103–107. [Google Scholar]
- Cetin, A.; Carrasquillo, R.L. High-performance concrete: Influence of coarse aggregates on mechanical properties. ACI Mater. J. 1998, 95, 252–261. [Google Scholar]
- Walker, S.; Bloem, D.L. Effects of aggregate size on properties of concrete. J. Proc. 1960, 57, 283–298. [Google Scholar]
- Bloem, D.L.; Gaynor, R.D. Effects of aggregate properties on strength of concrete. J. Proc. 1963, 60, 1429–1456. [Google Scholar]
- Aitcin, P. From Gigapascals to Nanometers. In Proceedings of the Engineering Foundation Conference, Potosi, MI, USA, 10–15 July 1988. [Google Scholar]
- Kasu, S.R.; Deb, S.; Mitra, N.; Muppireddy, A.R.; Kusam, S.R. Influence of aggregate size on flexural fatigue response of concrete. Constr. Build. Mater. 2019, 229, 116922. [Google Scholar] [CrossRef]
- Chen, B.; Liu, J. Investigation of effects of aggregate size on the fracture behavior of high performance concrete by acoustic emission. Constr. Build. Mater. 2007, 21, 1696–1701. [Google Scholar] [CrossRef]
- Kim, K.-M.; Lee, S.; Cho, J.-Y. Effect of maximum coarse aggregate size on dynamic compressive strength of high-strength concrete. Int. J. Impact Eng. 2019, 125, 107–116. [Google Scholar] [CrossRef]
- Aïtcin, P.C. High Performance Concrete; CRC Press: Boca Raton, FL, USA, 2011. [Google Scholar]
- Vu, X.H.; Daudeville, L.; Malecot, Y. Effect of coarse aggregate size and cement paste volume on concrete behavior under high triaxial compression loading. Constr. Build. Mater. 2011, 25, 3941–3949. [Google Scholar] [CrossRef]
- Vilane, B.R.T.; Sabelo, N. The effect of aggregate size on the compressive strength of concrete. J. Agric. Sci. Eng. 2016, 2, 66–69. [Google Scholar]
- Yu, F.; Sun, D.; Wang, J.; Hu, M. Influence of aggregate size on compressive strength of pervious concrete. Constr. Build. Mater. 2019, 209, 463–475. [Google Scholar] [CrossRef]
- Ezeldin, A.S.; Aitcin, P.-C. Effect of coarse aggregate on the behavior of normal and high-strength concretes. Cem. Concr. Aggreg. 1991, 13, 121–124. [Google Scholar]
- Cachim, P.B. Mechanical properties of brick aggregate concrete. Constr. Build. Mater. 2009, 23, 1292–1297. [Google Scholar] [CrossRef]
- Khaloo, A.R. Properties of concrete using crushed clinker brick as coarse aggregate. ACI Mater. J. 1994, 91, 401–407. [Google Scholar]
- Debieb, F.; Kenai, S. The use of coarse and fine crushed bricks as aggregate in concrete. Constr. Build. Mater. 2008, 22, 886–893. [Google Scholar] [CrossRef]
- Poon, C.-S.; Chan, D. The use of recycled aggregate in concrete in Hong Kong. Resour. Conserv. Recycl. 2007, 50, 293–305. [Google Scholar] [CrossRef]
- Padmini, A.K.; Ramamurthy, K.; Mathews, M.S. Relative moisture movement through recycled aggregate concrete. 2002, 54, 377–384.
- Mohammed, T.U.; Mahmood, A.H.; Apurbo, S.M.; Noor, M.A. Substituting brick aggregate with induction furnace slag for sustainable concrete. Sustain. Mater. Technol. 2021, 29, e00303. [Google Scholar] [CrossRef]
- Khalaf, F.M.; DeVenny, A.S. Performance of Brick Aggregate Concrete at High Temperatures. J. Mater. Civ. Eng. 2004, 16, 556–565. [Google Scholar] [CrossRef]
- Dey, G.; Pal, J. Use of Brick Aggregate in Standard Concrete and Its Performance in Elevated Temperature. IACSIT Int. J. Eng. Technol. 2013, 5, 523–526. [Google Scholar] [CrossRef]
- Ge, Z.; Wang, Y.; Sun, R.; Wu, X.; Guan, Y. Influence of ground waste clay brick on properties of fresh and hardened concrete. Constr. Build. Mater. 2015, 98, 128–136. [Google Scholar] [CrossRef]
- Dang, J.; Zhao, J. Influence of waste clay bricks as fine aggregate on the mechanical and microstructural properties of concrete. Constr. Build. Mater. 2019, 228, 116757. [Google Scholar] [CrossRef]
- ACI Committee 318. Building Code Requirements for Reinforced Concrete and Commentary (ACI 318-14); American Concrete Institute: Farmington Hills, MI, USA, 2014. [Google Scholar]
- Uddin, M.T.; Mahmood, A.H.; Kamal, M.R.I.; Yashin, S.M.; Zihan, Z.U.A. Effects of maximum size of brick aggregate on properties of concrete. Constr. Build. Mater. 2017, 134, 713–726. [Google Scholar] [CrossRef]
- ASTM C33/C33M-16; Standard Specification for Concrete Aggregates. ASTM International: West Conshohocken, PA, USA, 2016.
- BDS EN 197-1:2000; Cement—Part 1: Composition, Specifications and Conformity Criteria for Common Cements. BSI: London, UK, 2000.
- ASTM C39/C39M-16; Standard Test Method for Compressive Strength of Cylindrical Concrete Specimens. ASTM International: West Conshohocken, PA, USA, 2016.
- ASTM C31/C31M-15; Standard Practice for Making and Curing Concrete Test Specimens in the Field. ASTM International: West Conshohocken, PA, USA, 2015.
- ASTM C127–15; Standard Test Method for Relative Density (Specific Gravity) and Absorption of Coarse Aggregate. ASTM International: West Conshohocken, PA, USA, 2015.
- ASTM C128–15; Standard Test Method for Relative Density (Specific Gravity) and Absorption of Fine Aggregate. ASTM International: West Conshohocken, PA, USA, 2015.
- ASTM C131; Standard Test Method for Resistance to Degradation of Small-Size Coarse Aggregate by Abrasion Resistance and Impact in The Los Angeles Machine. ASTM International: West Conshohocken, PA, USA, 2006.
- ASTM C143-15; Standard Test Method for Slump of Hydraulic-Cement Concrete. ASTM International: West Conshohocken, PA, USA, 2015.
- Neville, A. Aggregate bond and modulus of elasticity of concrete. ACI Mater. J. 1997, 94, 71–74. [Google Scholar]
- Yildirim, H.; Tasdemir, M.A.; Oktar, O.N. Effect of Aggregate Concentration on The Strength and Tensile Strength Capacity of Concrete. In Proceedings of the 11th European Ready Mix Concrete Congress, Istanbul, Turkey, 21–23 June 1995. [Google Scholar]
- Benjamin, J.R.; Cornell, C.A. Probability, Statistics, and Decision for Civil Engineers; Courier Corporation: Gloucester, MA, USA, 2014. [Google Scholar]
- ASTM C469; Standard Test Method for Static Modulus of Elasticity and Poisson’s Ratio of Concrete in Compression. American Society for Testing and Materials: West Conshohocken, PA, USA, 2022.
- ASTM C496; Standard Test Method for Splitting Tensile Strength of Cylindrical Concrete Specimens. American Society for Testing and Materials: West Conshohocken, PA, USA, 1996.
- Binici, H.; Kapur, S.; Arocena, J.; Kaplan, H. The sulphate resistance of cements containing red brick dust and ground basaltic pumice with sub-microscopic evidence of intra-pore gypsum and ettringite as strengtheners. Cem. Concr. Compos. 2012, 34, 279–287. [Google Scholar] [CrossRef]
- Navrátilová, E.; Rovnaníková, P. Pozzolanic properties of brick powders and their effect on the properties of modified lime mortars. Constr. Build. Mater. 2016, 120, 530–539. [Google Scholar] [CrossRef]
- Beshr, H.; Almusallam, A.; Maslehuddin, M. Effect of coarse aggregate quality on the mechanical properties of high strength concrete. Constr. Build. Mater. 2003, 17, 97–103. [Google Scholar] [CrossRef]
- Yang, K.-H.; Hwang, H.-Z.; Lee, S. Effects of water-binder ratio and fine aggregate–Total aggregate ratio on the properties of Hwangtoh-based alkali-activated concrete. J. Mater. Civ. Eng. 2010, 22, 887–896. [Google Scholar] [CrossRef]
- Yang, C.-C.; Yang, Y.-S.; Huang, R. The effect of aggregate volume ratio on the elastic modulus and compressive strength of lighweight concrete. J. Mar. Sci. Technol. 1997, 5, 31–38. [Google Scholar] [CrossRef]


Disclaimer/Publisher’s Note: The statements, opinions and data contained in all publications are solely those of the individual author(s) and contributor(s) and not of MDPI and/or the editor(s). MDPI and/or the editor(s) disclaim responsibility for any injury to people or property resulting from any ideas, methods, instructions or products referred to in the content. |
© 2023 by the authors. Licensee MDPI, Basel, Switzerland. This article is an open access article distributed under the terms and conditions of the Creative Commons Attribution (CC BY) license (https://creativecommons.org/licenses/by/4.0/).