
Article

Characterization of Sand–Gravel Mixtures Using Shear Wave Velocity Method and Intergranular State Concept

1
Department of Civil and Environmental Engineering, University of Canterbury, Private Bag 4800, Christchurch 8140, New Zealand
2
Beca Ltd., ANZ Centre 267 High Street, Christchurch Central City, Christchurch 8011, New Zealand
3
Beca Pty Ltd., 4/825 Ann Street, Brisbane, QLD 4006, Australia
*
Author to whom correspondence should be addressed.
Geotechnics 2026, 6(2), 47; https://doi.org/10.3390/geotechnics6020047
Submission received: 14 February 2026 / Revised: 24 April 2026 / Accepted: 11 May 2026 / Published: 15 May 2026
(This article belongs to the Special Issue New Trends in Ground Response Analysis and Liquefaction Assessment)

Abstract

Shear wave velocity (VS) measurements are widely used to characterize geomaterials, evaluate small-strain stiffness, and develop indirect approaches for estimating the liquefaction resistance of various soil types. In this study, the bender element method was employed to investigate the VS characteristics of sand–gravel mixtures (SGMs), with the aim of clarifying the combined effect of key factors such as gravel content (GC), relative density (Dr), packing state, and soil fabric. Laboratory tests were performed on reconstituted specimens composed of two sandy soils and pea gravel with GC of 0, 10, 25, 40, 60, 80 and 100% and Dr of 20, 30, 45 and 60%. Specimens were prepared using wet tamping (WT) and air pluviation (AP) techniques. VS measurements were conducted under effective confining stresses ( σ 0 ) of 50, 100, 150 and 200 kPa. The results show that the VS of SGMs increases with increasing Dr and p 0 , whereas the influence of GC depends on the limiting and threshold sand contents. The effect of soil fabric was found to be marginal. Furthermore, the combined effects of GC and Dr on VS can be uniquely captured using the equivalent void ratio approach for SGMs with sand-dominated microstructures, while the skeleton void ratio approach is more appropriate for SGMs with gravel-dominated microstructures.

1. Introduction

Material characterization is fundamental to geotechnical engineering applications, including seismic ground response analysis, site characterization, liquefaction triggering assessment, evaluation of earth structures and foundation performance, and soil–structure interaction studies. In this context, shear wave velocity (VS) has become a key parameter for characterizing geomaterials, as it provides a reliable measure of small-strain stiffness (Gmax) and forms the basis for several indirect approaches to evaluating liquefaction resistance. To determine VS, most previous investigations have relied on well-controlled laboratory experiments using established testing devices such as resonant columns [1] and bender elements [2]. Several semi-empirical correlations have been developed for clean sands to estimate VS and the corresponding Gmax [1,3,4]. These correlations consistently indicate that VS is primarily influenced by overburden pressure, density state, and soil fabric [5].
Natural alluvial deposits and engineering fills are commonly composed of mixtures of silts, sands and gravels [6,7]. Field investigations at liquefaction sites following recent earthquakes in New Zealand have confirmed that sandy gravelly soils are susceptible to liquefaction [8,9,10]. In practice, soil liquefaction resistance is often assessed using VS as an index parameter, based on the premise that VS and liquefaction resistance are influenced by similar controlling factors, including overburden stress, density and soil fabric. However, for mixed soils, both VS and cyclic resistance ratio (CRR) are strongly affected by the content of coarser or finer particles [11,12]. In particular, Toyota and Takada [13] reported that gravel content (GC) has a remarkable influence on the VS and CRR. Consequently, a more comprehensive understanding of soil liquefaction resistance can be achieved by knowing how these governing parameters affect VS.
Semi-empirical correlations developed for clean sands have generally shown predictive capability, but their applicability to mixed soils such as sand–silt and sand–gravel mixtures has been found to be unsatisfactory [12,14]. Recognizing the need to better characterize mixed soil types, several studies have investigated the Vs behavior of sand–silt mixtures [15,16,17]. These studies concluded that void ratio, confining stress and gradation characteristics are the significant variables governing the VS in mixed soils. In comparison with sand and sand–silt mixtures, systematic studies focusing on gravel and sand–gravel mixtures (SGMs) remain relatively limited. This is noteworthy, because natural sands frequently contain gravel-size particles (size ≥ 2 mm, NZS 4402.2.8.1 [18]), which can significantly influence soil properties such as small-strain stiffness, critical state line slope, and friction angle. These effects arise from fundamental differences between sand and gravel particles, including their mineral composition, particle shape and surface roughness, which reflect the distinct natures of pure sand and pure gravel within SGMs. As a result, GC plays a critical role in controlling the mechanical behavior of SGMs [19].
Several studies have highlighted the influence of GC on VS. Toyota and Takada [13] investigated gap-graded SGMs composed of Toyoura sand and pebble gravel using bender element tests, with GC up to 50%. They reported that VS increased significantly from 216 m/s to 294 m/s as GC increased from 0 to 50% under a confining stress of 100 kPa for a constant sand matrix relative density (Dr) of 75%. Similarly, Hubler [20] examined gap-graded mixtures of Ottawa sand and pea gravel and showed that a 1% increase in GC resulted in approximately a 0.22% rise in VS at a Dr of 44% and confining stress of 100 kPa. Chang et al. [21] noted that the Vs in granular soils is mainly governed by particle characteristics, confining stress state and composite packing conditions. According to Kokusho and Yoshida [22], for soils with a given GC, VS varies approximately linearly with the void ratio, but differs significantly with different particle gradations. Thus, VS–void ratio relationships established for one soil type cannot be directly applied to other soil types. Although these studies collectively indicate that, in addition to confining pressure and Dr, the VS of SGMs is strongly influenced by GC, the underlying mechanisms and the combined effects of GC with other governing parameters are not yet fully understood.
The influence of confining pressure (p′) is commonly accounted for by normalizing the vertical effective stress, and the effect of density is addressed using the void ratio function (F(e)) proposed by Hardin and Richart [3]. For clean sands, generalized VSDr (or global void ratio, e) correlations work well to estimate VS as a function of packing state. However, in mixed soils such as SGMs, the presence of sand and gravel can induce atypical microstructural characteristics within the sand matrix. As a result, estimating the VS of SGMs using conventional indirect approaches based on a unique function of void ratio becomes very challenging [14,23]. Consequently, it is essential to consider the combined effects of packing state, Dr and GC on the VS of SGMs.
Past studies have employed intergranular state framework concepts (such as skeleton void ratio, equivalent void ratio, and equivalent state parameter) to capture the combined effect of Dr and fine content (FC) in sand–silt mixtures on the mechanical response. However, this framework has rarely been applied to SGMs. Moreover, these concepts were primarily developed based on theoretical considerations of uniform spherical-particle assemblies. Therefore, the applicability of such index/state parameter concepts to SGMs is yet to be investigated in detail. By evaluating VS at different GC of gap-graded SGMs, Chang et al. [21] reported a linear increase in VS with increasing GC at any given sand skeleton void ratio. By reorganizing the experimental data of Kokusho et al. [23], Thevanayagam and Liang [14] suggested that the equivalent void ratio could uniquely characterize the VS of SGMs. These findings indicate that such state concept-based interpretations may be effective for characterizing SGMs using a VS-based approach. Considering these findings and limitations, further laboratory studies are required to improve understanding of the combined effects of GC and Dr on the VS of gravelly soils, particularly SGMs. Such studies are essential to establish an appropriate VS evaluation framework for SGMs based on the index and/or state parameters. Accordingly, the objective of this study is to provide new insights into this issue.

2. Test Materials, Apparatus and Procedure

2.1. Test Materials

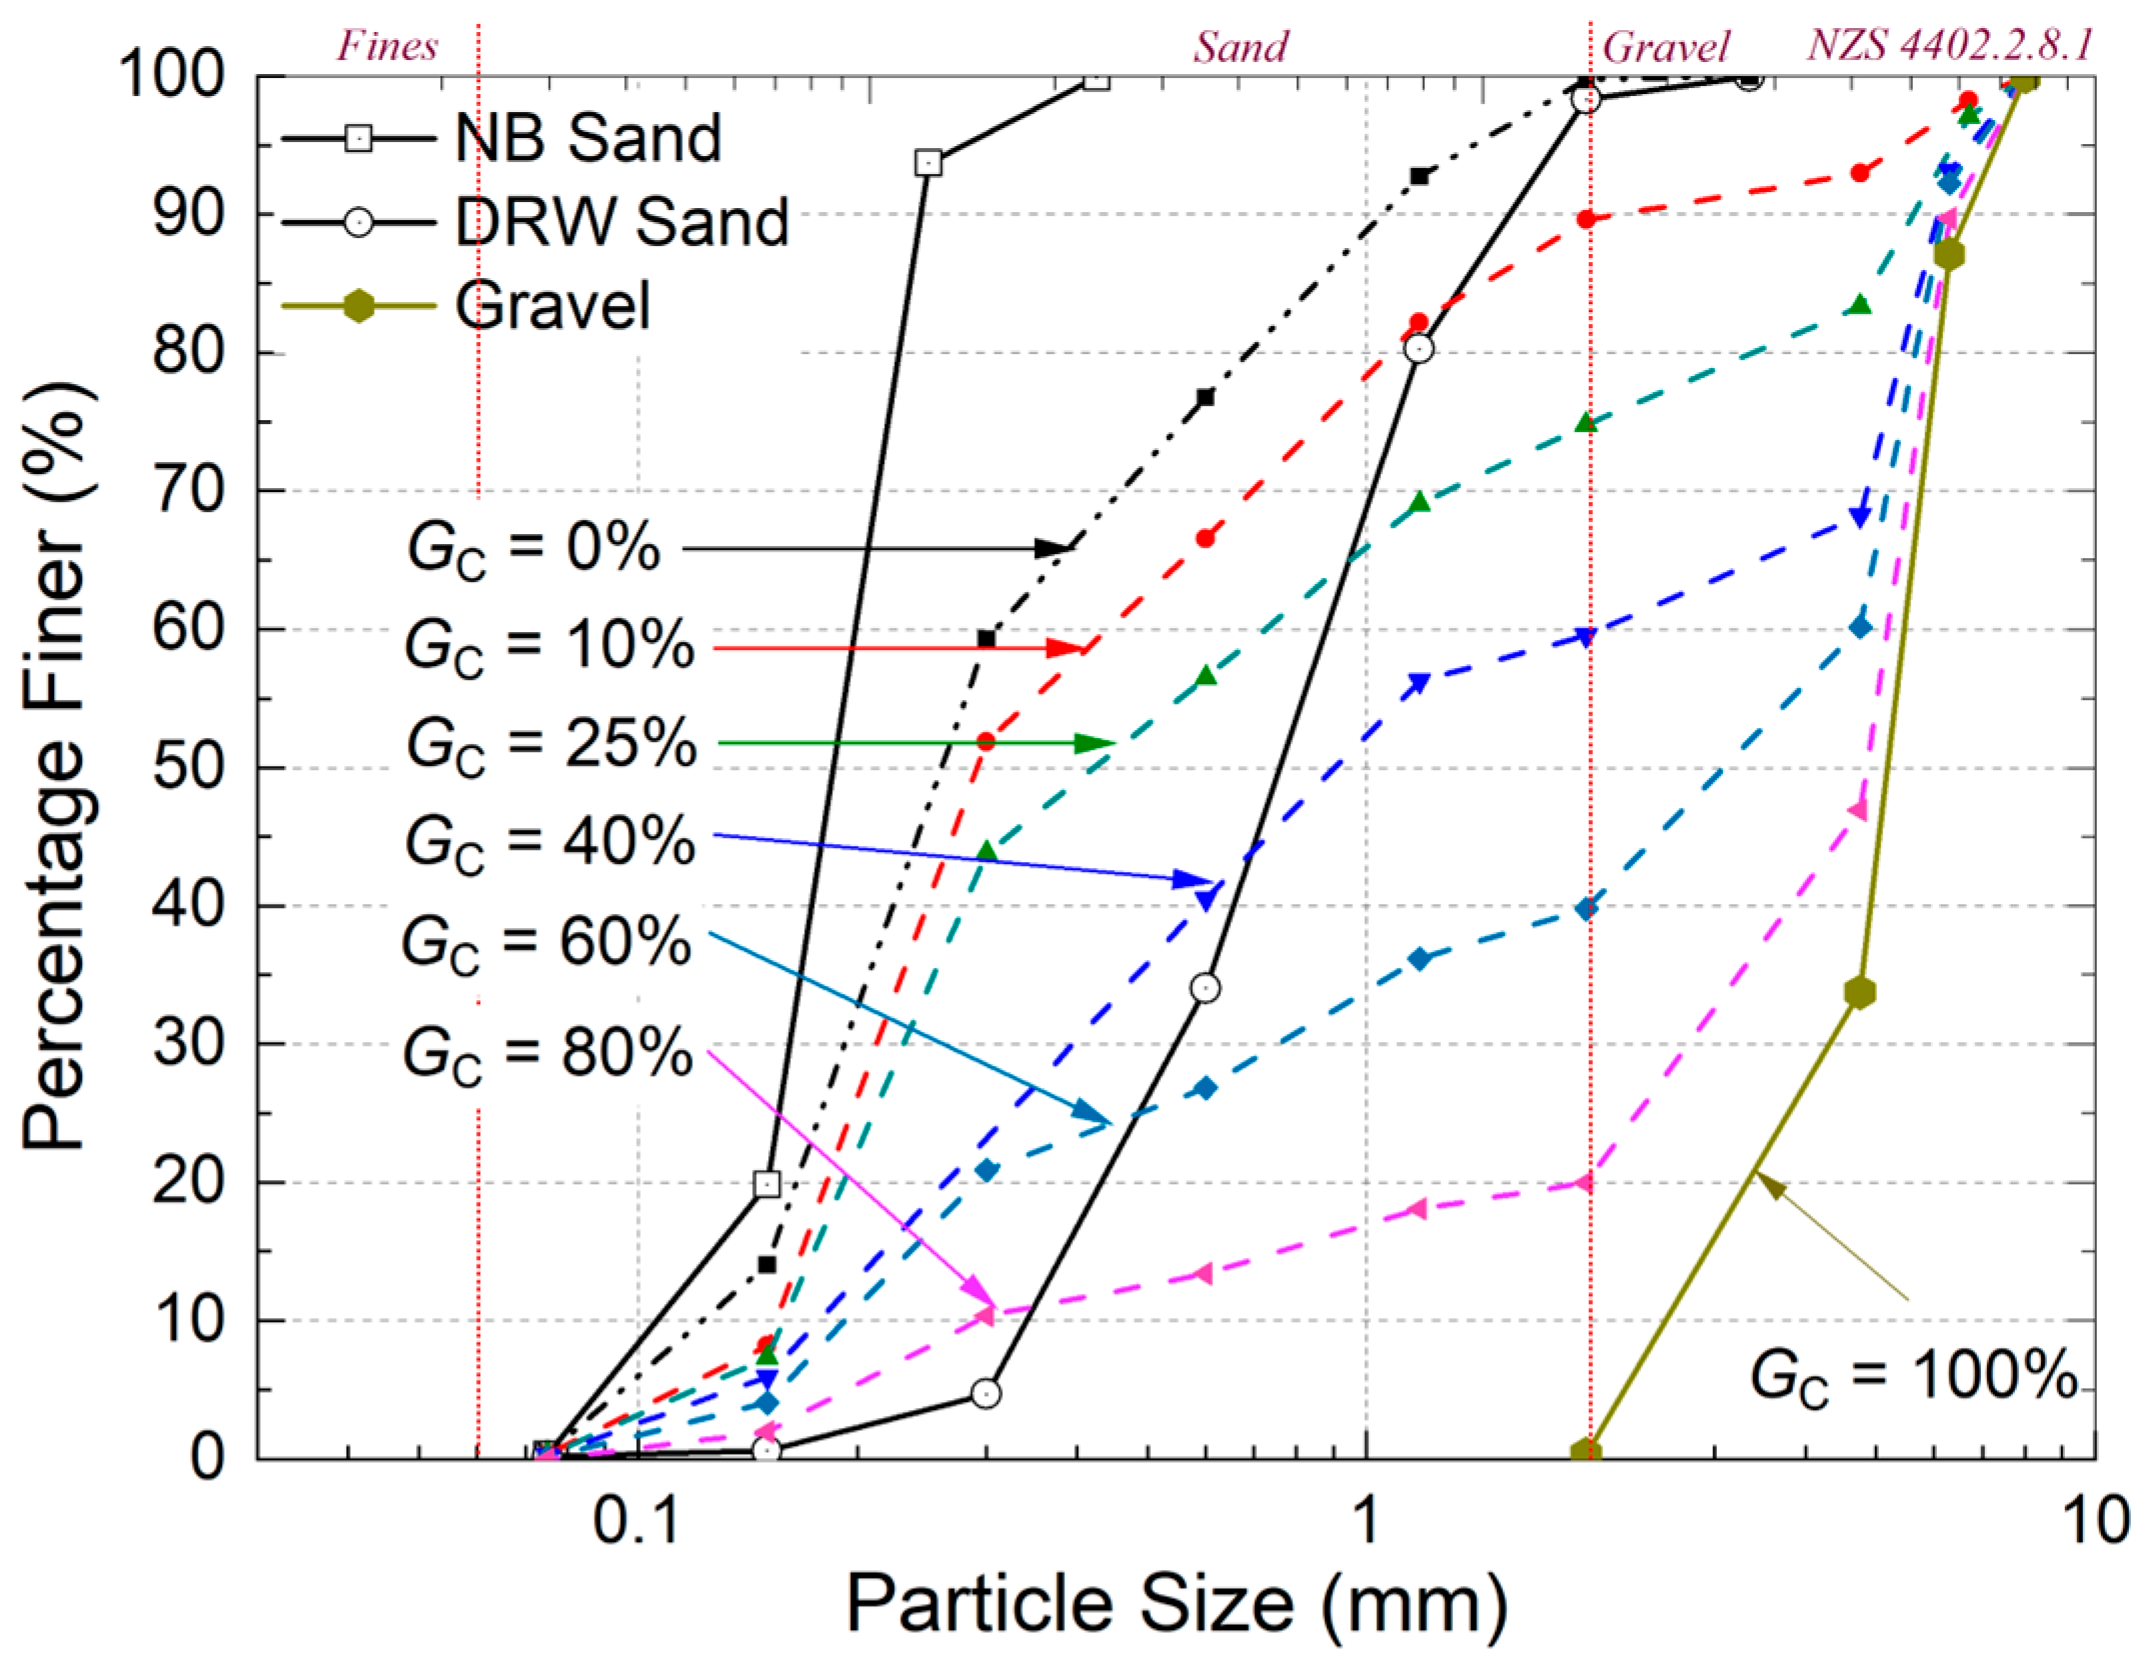
Three types of materials were used in this study: New Brighton sand (NB sand; mean diameter, D50 = 0.18 mm; maximum particle size, Dmax = 0.425 mm; specific gravity, Gs = 2.67), Dalton River Washed sand (DRW sand; D50 = 0.75 mm; Dmax = 3.5 mm; Gs = 2.65), and rounded pea gravel (D50 = 5.1 mm; Dmax = 8 mm; Gs = 2.66). The NB sand and DRW sand were first mixed in equal proportion by dry mass (50:50) to create a well-graded host sand. Rounded pea gravel was then added to produce SGMs with the desired GC. Figure 1 shows the particle size distribution curves of the parent materials and SGMs with GC values of 0, 10, 25, 40, 60, 80 and 100% by mass, which were used to investigate the VS characteristics of SGMs.
The NB sand was collected from New Brighton Beach, Christchurch, New Zealand, whereas the DRW sand and gravel were commercially sourced. To eliminate organic matter and potential chemical contaminants, all materials were thoroughly washed with water and oven-dried. The dried materials were then mixed to achieve a uniform gradation within each batch and stored in airtight containers. Representative samples were taken from the prepared batches to determine their index properties.
The basic index properties of the parent materials are listed in Table 1. The specific gravity (Gs) of all the materials was determined in accordance with JGS 0111-2009 [24]. The maximum and minimum densities of NB sand and DRW sand were measured following the procedure specified by JGS 0161-2009 [25]. The maximum and minimum densities of gravel and SGMs were determined using a cylindrical mold with an inner diameter of 200 mm and a depth of 200 mm, in accordance with JGS 0162-2009 [26].
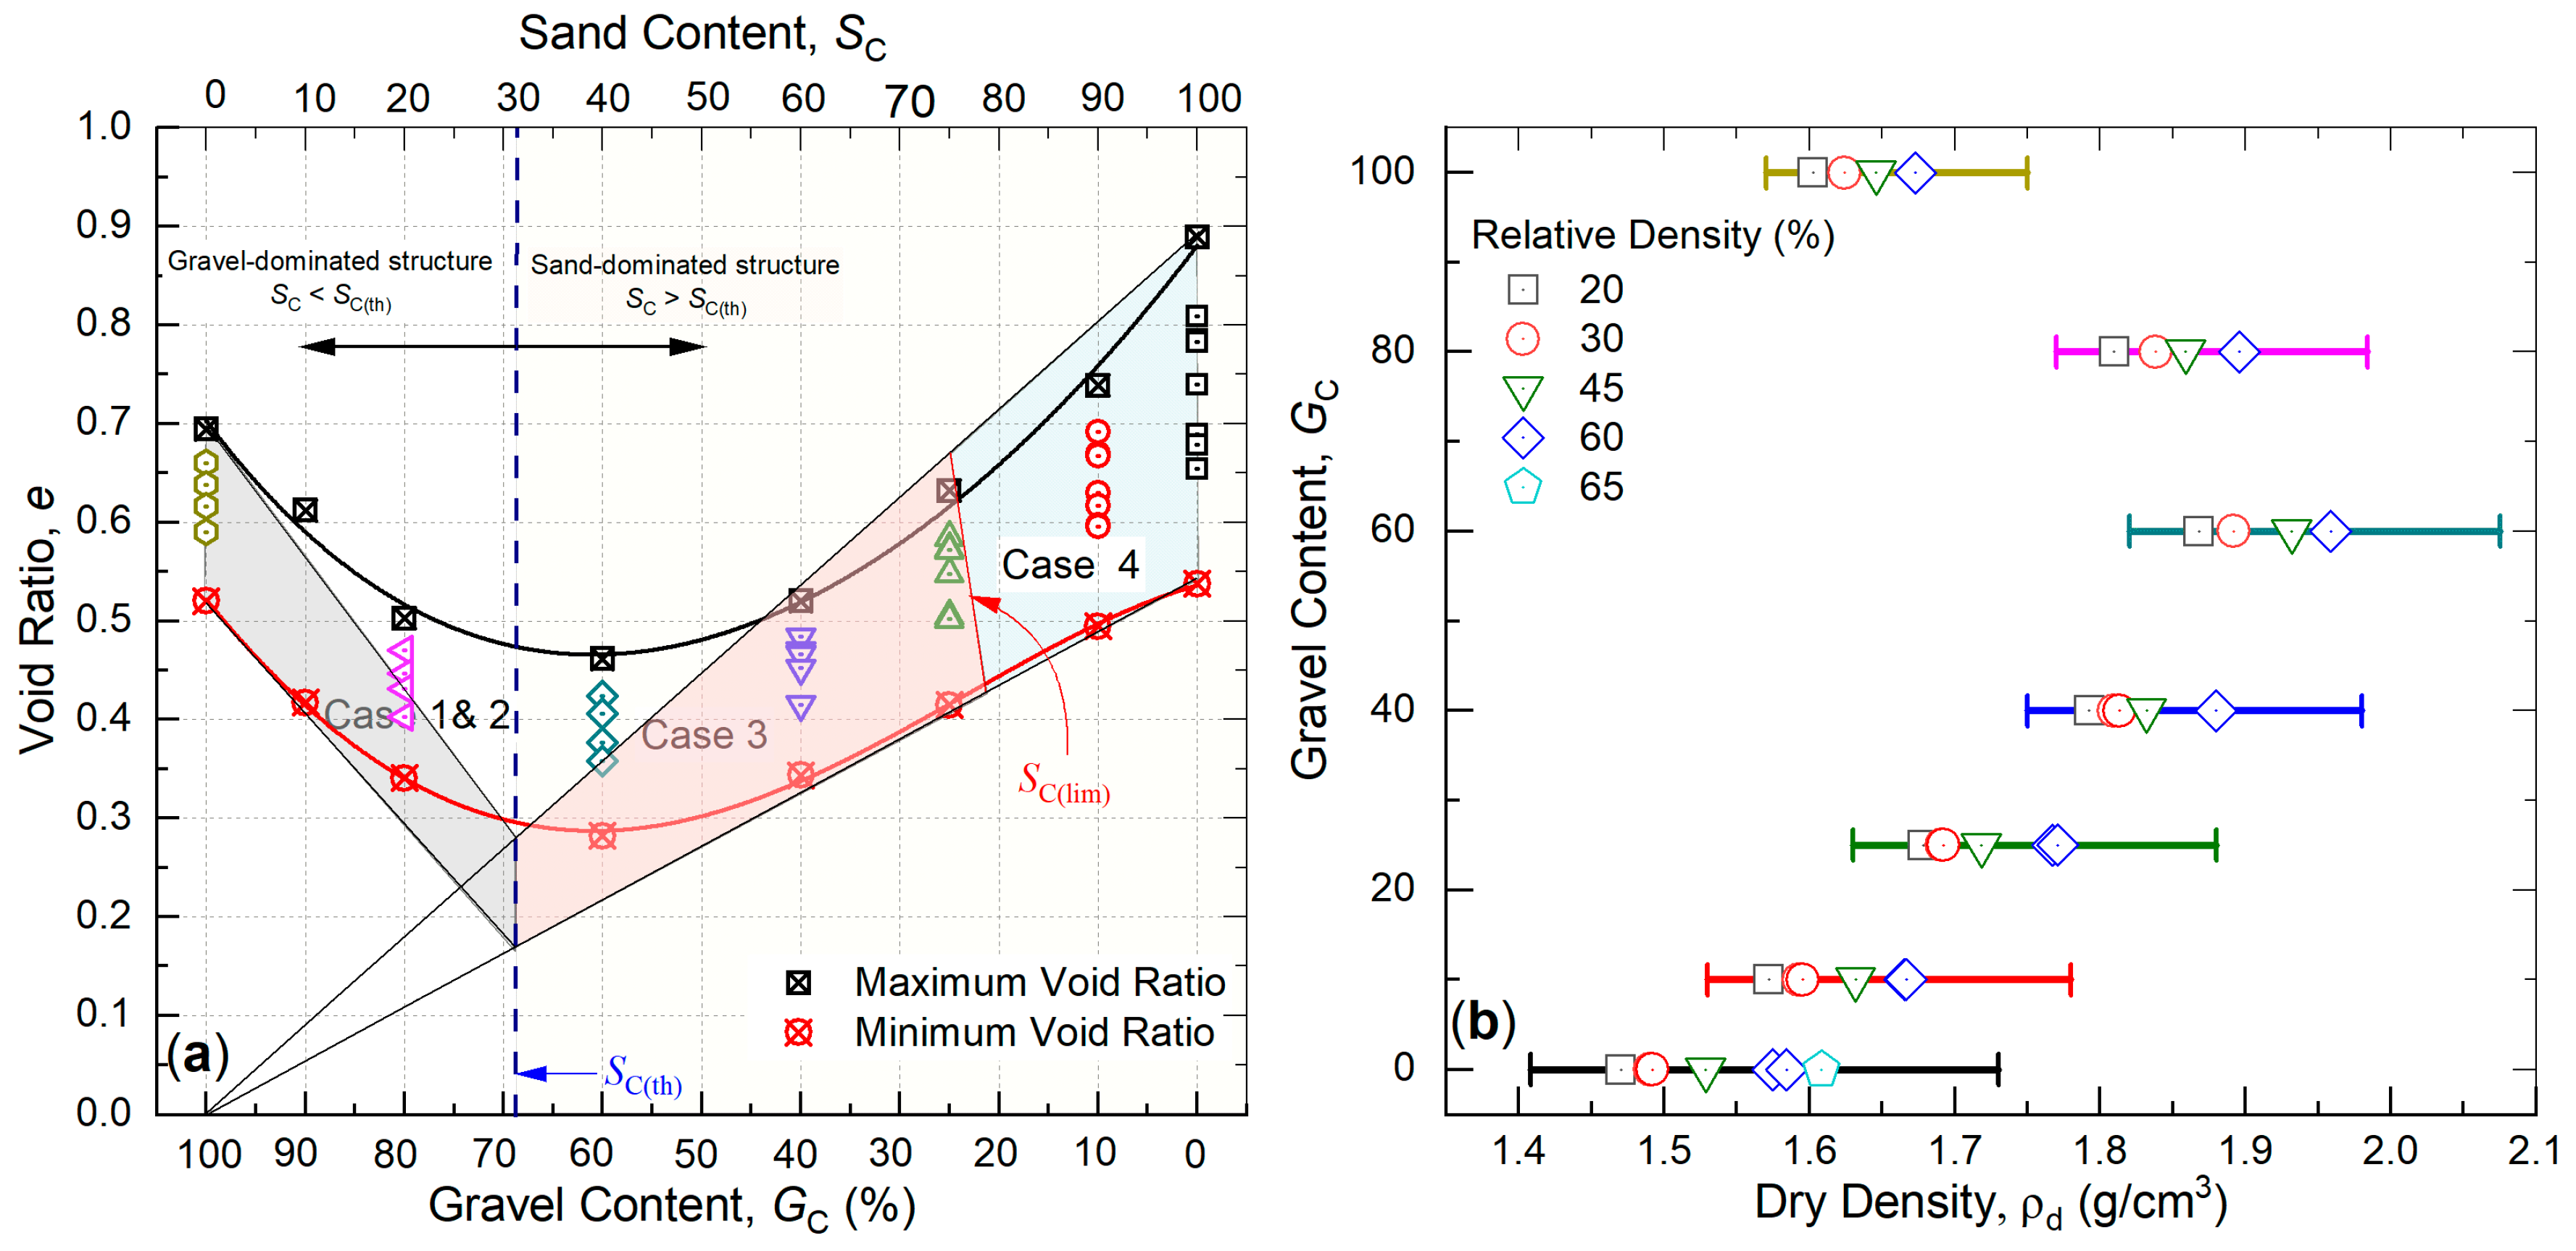
Figure 2a illustrates the variation in the maximum and minimum void ratios (emax and emin, respectively) of the combined host sand, gravel, and their mixtures at various GC values. As the sand content (SC) initially increases, sand particles progressively fill the voids between gravel particles, resulting in a reduction in the global void ratio (e) of the mixtures until a threshold sand content (SC(th)) is reached. Beyond this SC(th), the voids between gravel particles are completely filled, causing gravel particles to become suspended within the sand matrix and lose direct interparticle contact. This transition leads to an increase in the global void ratio with a further increase in SC. Figure 2b illustrates the variation in dry densities across different GC for specimens prepared at different Dr. Each marker type represents a different Dr and the horizontal bars indicate the range of measured dry densities for each GC.
The selection of these three materials was guided by two primary considerations: (1) their similar specific gravity values, and (2) slight overlap in the particle size distributions, which allowed the preparation of SGMs without gap gradation. Naturally deposited gravelly soils are typically well-graded, and previous studies have reported well-graded gravelly soil ejecta at liquefied sites. Accordingly, to replicate natural conditions and ensure consistency with observations from liquefied gravelly soils, this study focused on investigating SGMs with non-gap-graded gradation.
In binary mixtures, it is commonly assumed that the specific gravities of fine and coarse materials are the same [21,27,28,29]. This assumption underpins the conceptual framework in which gravel particles are considered to float within a sand-dominated matrix, while sand particles act as fillers within a gravel-dominated skeleton. Hence, the interfine void ratio is used to eliminate the load-transfer contribution of floating gravel particles in sand-dominated mixtures, whereas the intergranular void ratio is used to neglect the load-transfer contribution of filler sand particles in gravel-dominated mixtures. A detailed description of this framework is provided in Section 5. Therefore, for the sake of accuracy, materials with almost identical specific gravities were selected.

2.2. Specimen Preparation

In this study, reconstituted specimens were prepared using two specimen preparation techniques: wet tamping (WT) and air pluviation (AP). Initially, the VS of SGM specimens prepared by the WT method was investigated under seven GC conditions, including pure gravel (i.e., GC = 100%) and pure sand (i.e., GC = 0%). Subsequently, VS measurements were carried out for SGMs with GC = 0, 10, 25 and 40% prepared by the AP method to examine the effects of fabric on the VS response of SGMs. The AP method was avoided for specimens with a GC greater than 40% due to noticeable segregation of sand and gravel particles during specimen preparation, which could result in non-uniform deposition of sand and gravel particles in the sample and potential errors in the VS estimation. In the AP method, when the material is deposited under gravity, non-spherical particles tend to settle with their long axes oriented preferentially in the horizontal direction [30], leading to the development of pronounced geometrical anisotropy in the sample [31]. On the other hand, the presence of initial moisture in the WT method generates capillary suction that promotes interparticle bonding between sand and gravel particles, thereby controlling the formation of the preferential particle orientation and resulting in more isotropic samples compared with the AP method [32].
All SGM specimens were prepared with a height of 130 mm and a diameter of 61 mm according to the JGS0520-2009 [33]. The required mass of SGMs for each specimen was first calculated based on the dry target density and specimen dimensions (volume), after which the mass of each constituent material was determined based on its percentage in each mix.
In the WT method, the total mass of material was divided into five equal portions to obtain specimens with homogeneous density and uniform particle size distribution, as recommended by Ishihara [34]. The pre-weighed oven-dry host sands and gravel were mixed with deaired water at a water content varying with gravel content, 5% for GC = 0 and 10%; 4% for GC = 25% and 40%; 3% for GC = 60% and 2% for GC = 80 and 100%. To prevent slurry formation (as lower sand content in SGMs requires a lower level of water), the water content was adjusted depending on the GC in SGMs: approximately 5% water content was required to achieve a moist condition for sand-dominated mixtures, whereas gravel-dominated mixtures required only about 2%. The moist material was then placed into the mold using a spoon and compacted in five layers by means of a small flat-bottom compaction rod (mass = 200 g and diameter = 25 mm). The compaction energy was controlled to achieve a uniform relative density across layers. The loosest and densest specimens prepared using the WT method corresponded to Dr = 20% and 60%, respectively. The relative density of the specimens was determined using Equation (1).
D r = e m a x e e m a x e m i n
In the case of the AP method, pre-weighed oven-dried sands and gravel were thoroughly mixed and placed into a cone-shaped funnel with a 20 mm diameter nozzle. The mixture was then allowed to fall freely into a split mold. The desired density was achieved by adjusting the pluviation height and applying gentle tapping to the sides of the mold.

2.3. Apparatus and Test Procedure

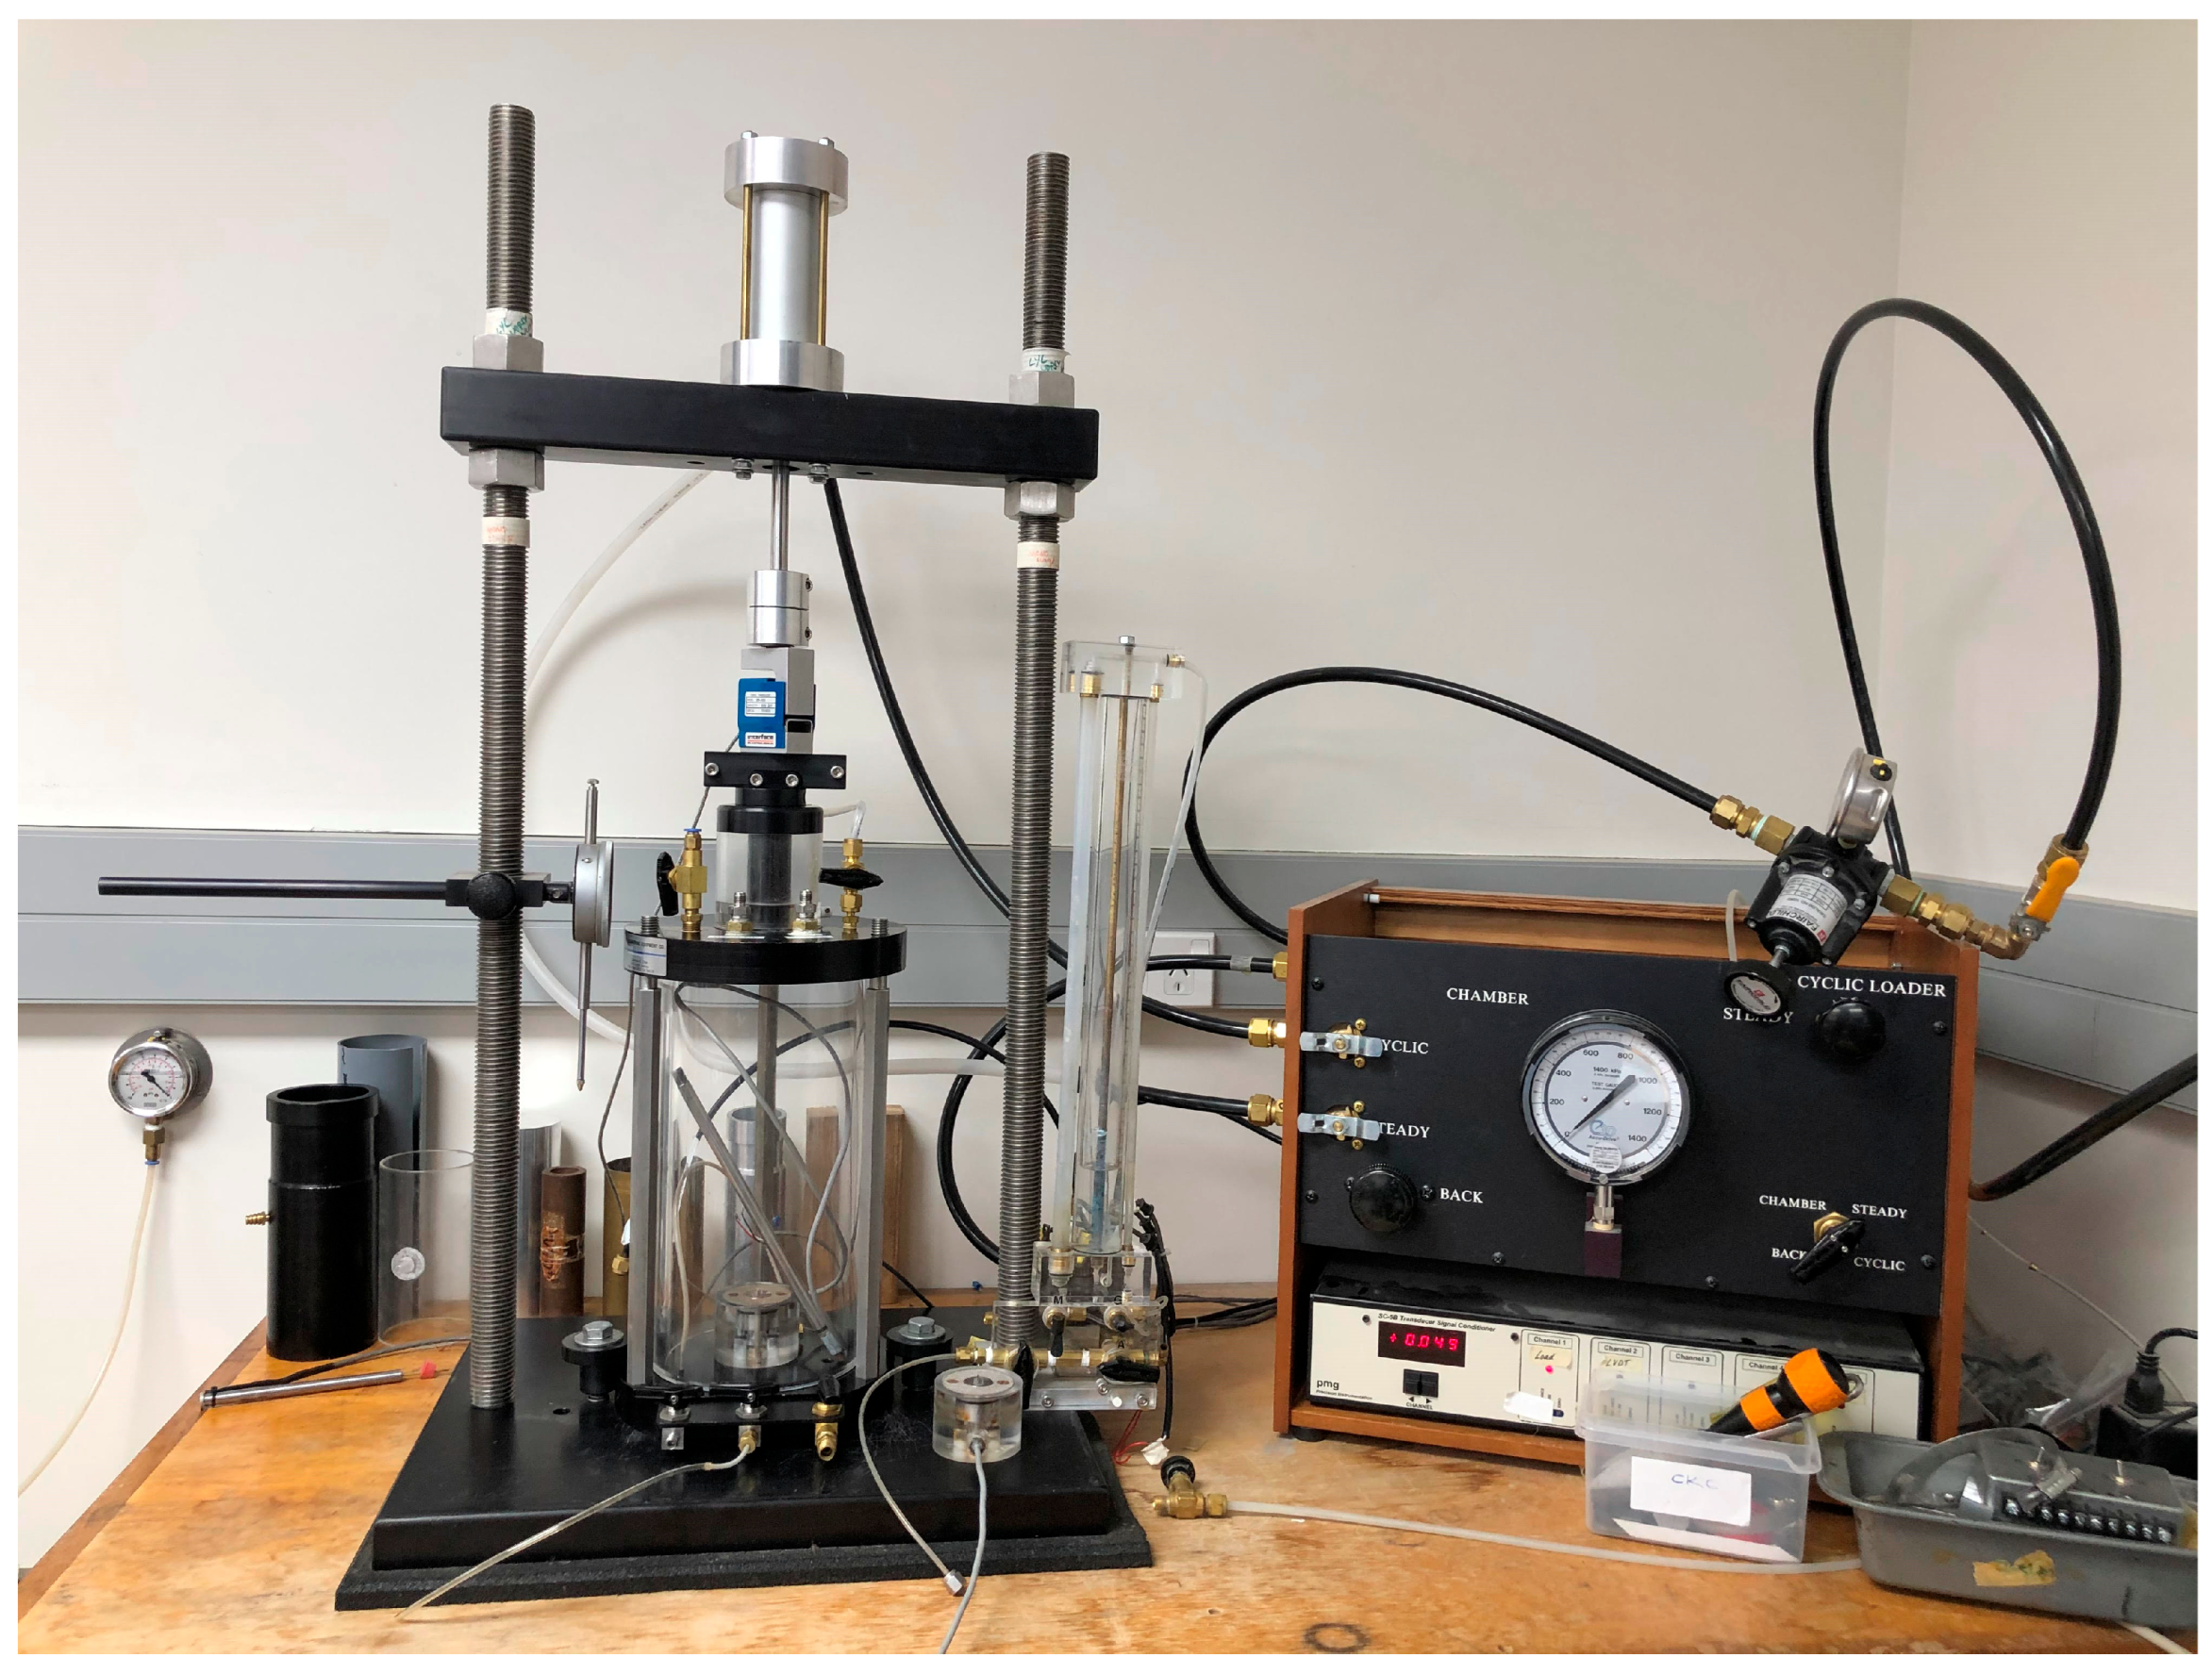
The VS measurements were carried out using bender elements attached to the top cap and bottom pedestal of a CKC-type automatic triaxial testing system (Soil Engineering Equipment Co., San Francisco, CA, USA) [35], available in the geotechnical laboratory of the University of Canterbury, as shown in Figure 3. Previous studies on gravelly soils recommend that the specimen diameter be approximately 6 to 8 times larger than the maximum soil particle size to minimize boundary effects [36]. In this study, the specimen diameter was 61 mm and the maximum particle size was 8 mm, resulting in a diameter-to-particle-size ratio close to 8, which satisfies the recommendation.
After mounting each specimen in the triaxial device, the triaxial cell was filled with deionized water through the bottom inlet of the cell. The cell was then positioned under the loading frame/rod and the CKC computer-controlled triaxial program was started, following the instructions prompted by the software to achieve the desired cell pressure. An initial isotropic confining pressure of 50 kPa was applied, and the specimen was allowed to consolidate for at least 30 min. Following consolidation, VS measurements were performed using bender elements at multiple excitation frequencies. The isotropic confining pressure was subsequently increased to 100 kPa and the same consolidation and VS measurement procedures were repeated. This process was further carried out for confining pressures of 150 kPa and 200 kPa, with no deviatoric stress applied during testing.
One potential source of measurement error in bender element testing is the coupling effect between the bender elements and the soil specimen, commonly referred to as bedding error, which results in delayed wave arrival times and consequently underestimates VS values. Wicaksono [37] suggested that geomaterials with a mean diameter larger than 1 mm are particularly susceptible to bedding error due to the poor contact between loosely arranged gravel particles and the bender element tips during the excitation of the input wave. To mitigate this effect in SGM specimens with GC greater than 60%, a small amount of NB sand was placed around the bender element tips to improve contact between soil particles and bender elements and, thus, ensure reliable wave transmission.
Table 2 summarizes the index properties of the SGMs tested in this study and the testing conditions. VS measurements were conducted on specimens with eight GC conditions with various global Dr under mean effective stress (p′) of 50, 100, 150 and 200 kPa.

3. Shear Wave Measurement

The VS measurements were performed on AP specimens prepared in a dry state, and on WT specimens tested in their as-prepared moist state without additional drying. The input excitation signals were generated by a digital function generator “Keysight Technologies 33210A”, Santa Rosa, CA, USA, capable of generating a peak-to-peak voltage of up to 10 V. The transmitted and received signals were recorded using an oscilloscope “Keysight InfiniiVision DSOX2002A” Santa Rosa, CA, USA, at a sampling interval of 2.8 × 10⁻⁶ s. For each test, sinusoidal input signals with frequencies ranging from 1 to 25 kHz were applied, and the corresponding received signals were examined to determine the shear wave travel time. At low (i.e., less than 3 kHz) and high (i.e., greater than 15 kHz) input frequencies, the received waveforms were distorted, making accurate identification of shear wave arrival difficult, whereas input frequencies between 5 and 15 kHz produced clear and interpretable waveforms. The variation in VS values obtained within this frequency range was within 2%, which is consistent with the level of uncertainty reported by Li et al. [17] for sand–silt mixtures. Based on these observations and consistent with previous studies on mixed soil [38,39], an input frequency of 10 kHz was adopted for the evaluation of VS in this study.
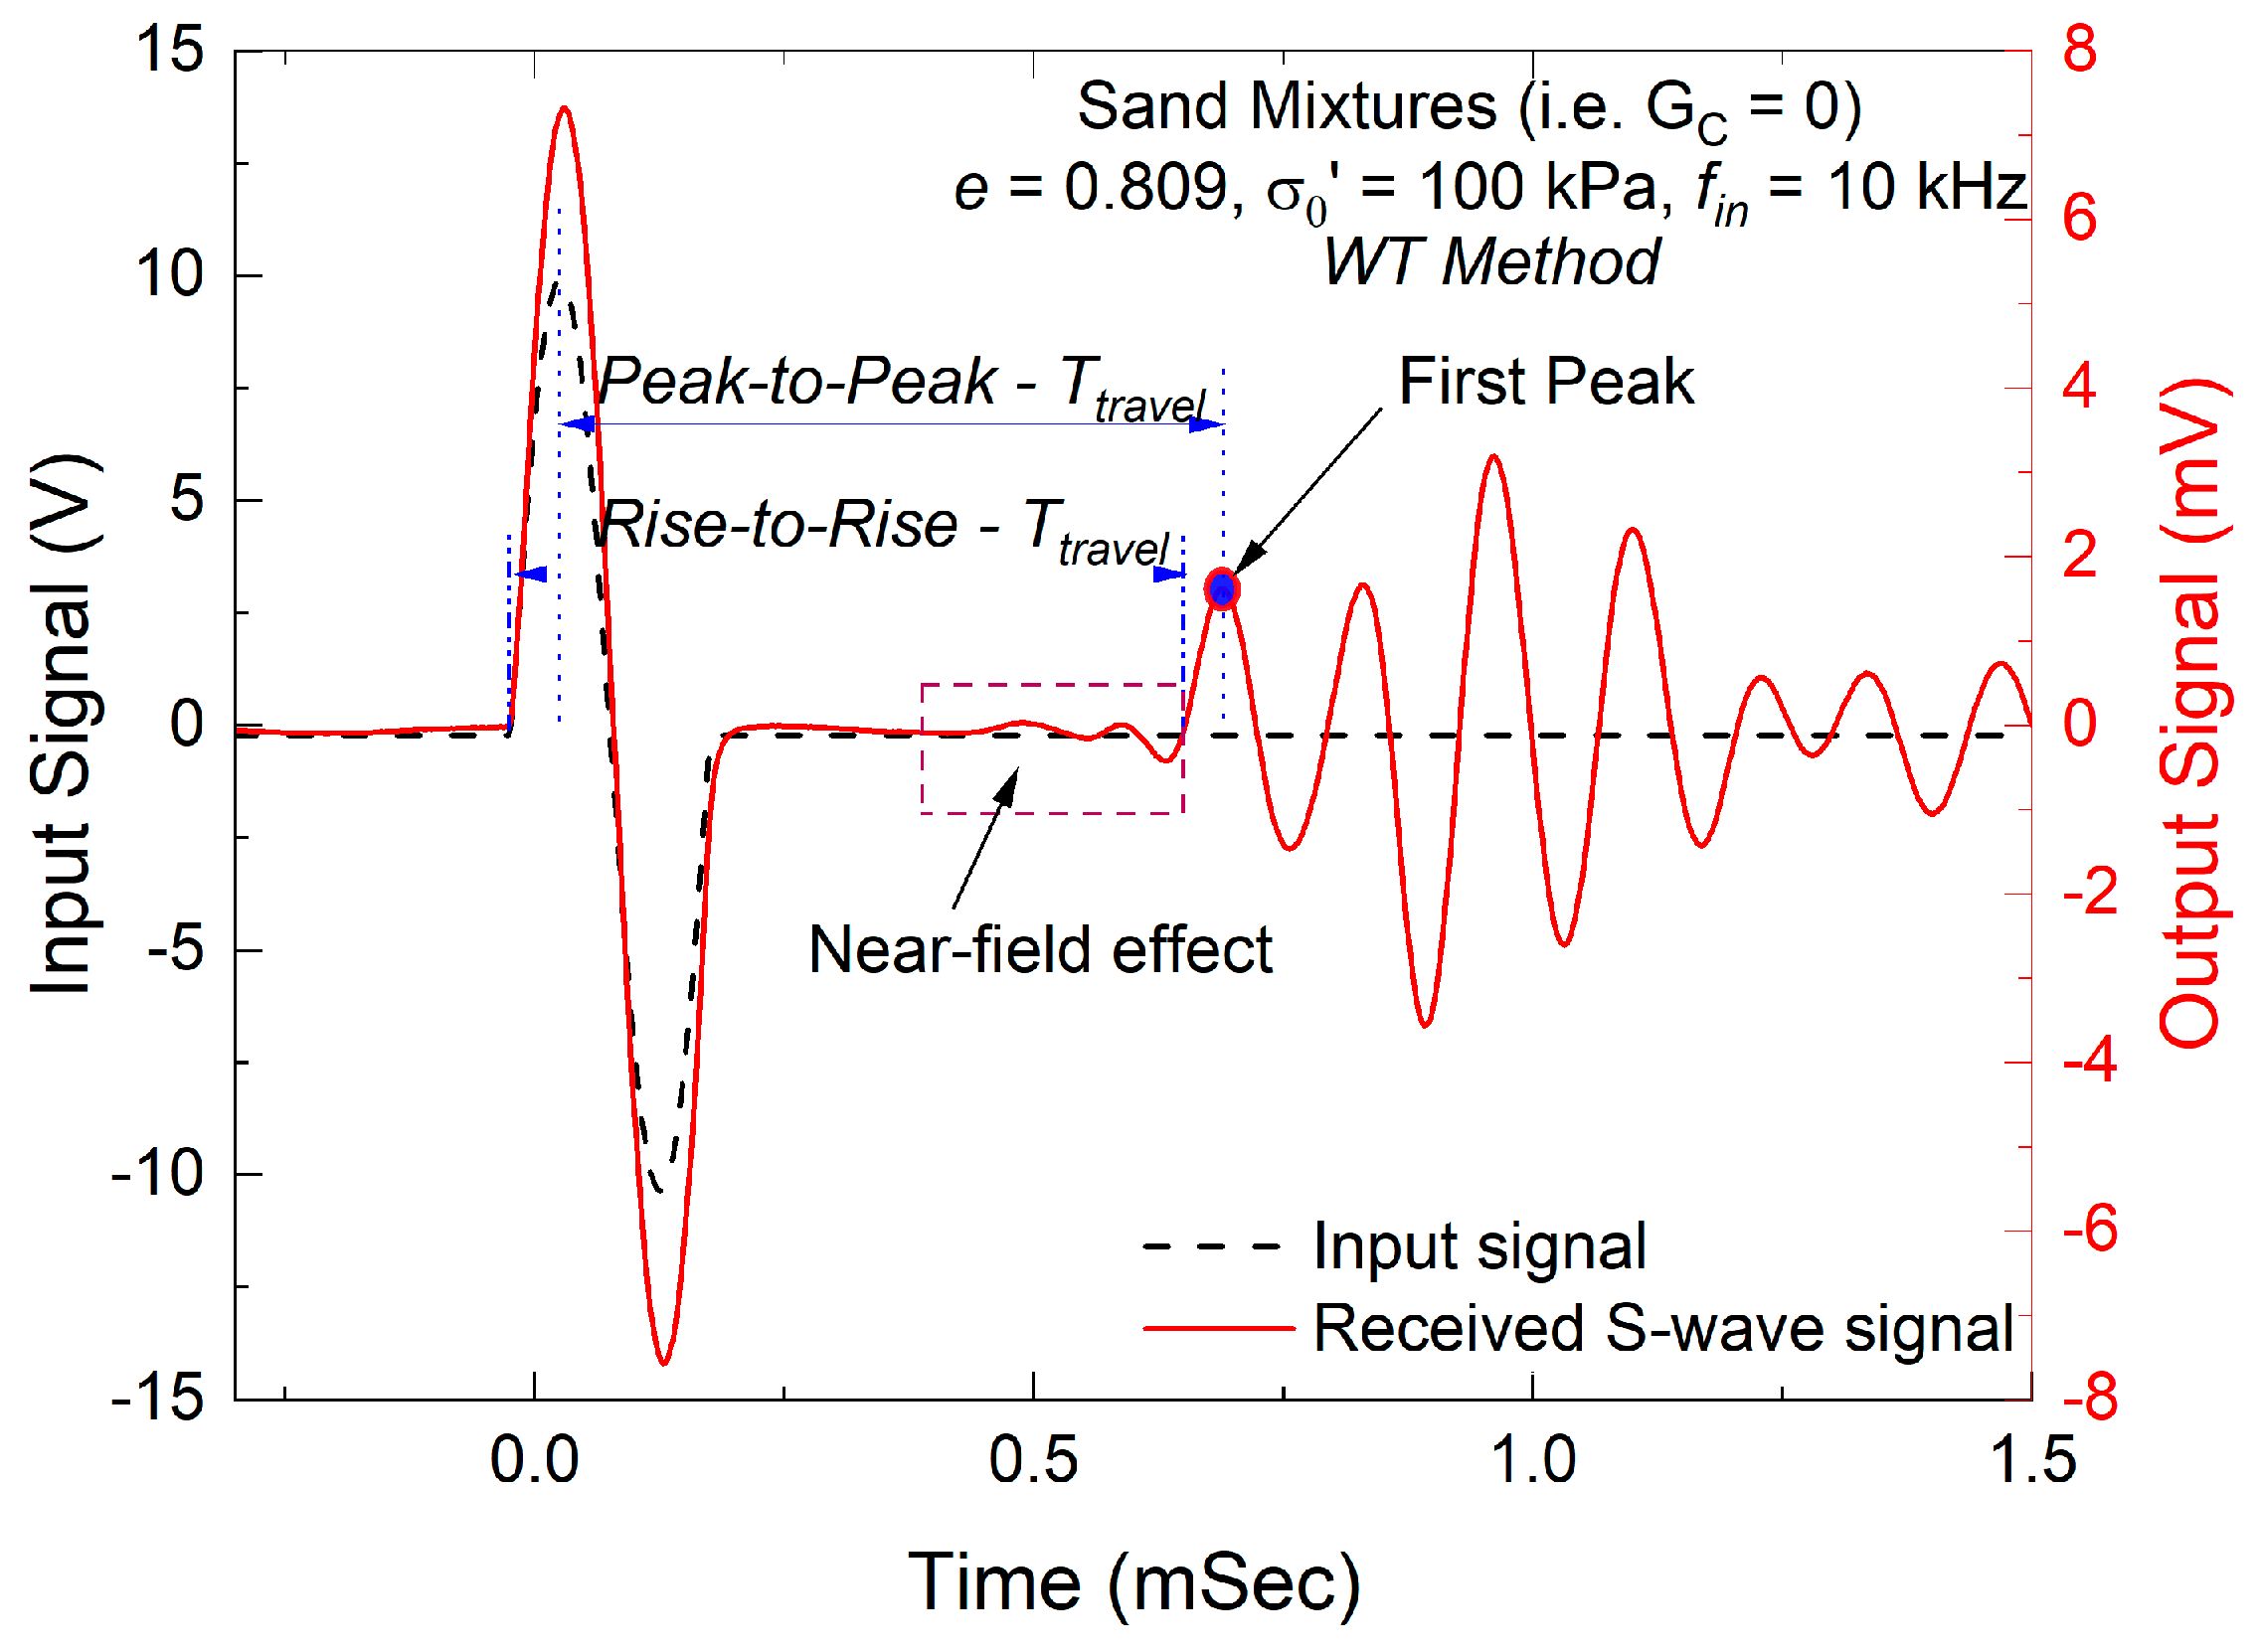
Travel time in VS measurements using a bender element is commonly estimated using peak-to-peak or start-to-start methods, which determine the time interval between characteristic points on the input and output signals [40,41]. As illustrated in Figure 4, the shear wave arrival point can be identified using either approach. Previous studies [40,42] have demonstrated that VS values obtained by both methods are generally comparable when the frequencies of the input and output signals are equal. However, due to the adverse influence of the near-field component, the peak-to-peak method has often been preferred for determining shear wave travel time [43,44]. Consistent with this practice, the peak-to-peak approach has also been used in studies involving gravelly soils [45,46]. In this study, the relative difference in VS obtained using the peak-to-peak and start-to-start methods was within 3%, which aligns with the error range of less than 4% reported by Liu et al. [45] for coarse-grained materials with a maximum particle size of 20 mm. A detailed reporting of the effect of the picking methods is beyond the scope of this paper. Therefore, based on the outcomes of this study and recommendations of previous research, the peak-to-peak approach was adopted to obtain the VS of SGMs.
VS can be calculated using Equation (2):
V s = L T S
where L is the length (height) of the specimen in the shear wave travel direction and TS is the shear wave travel time.
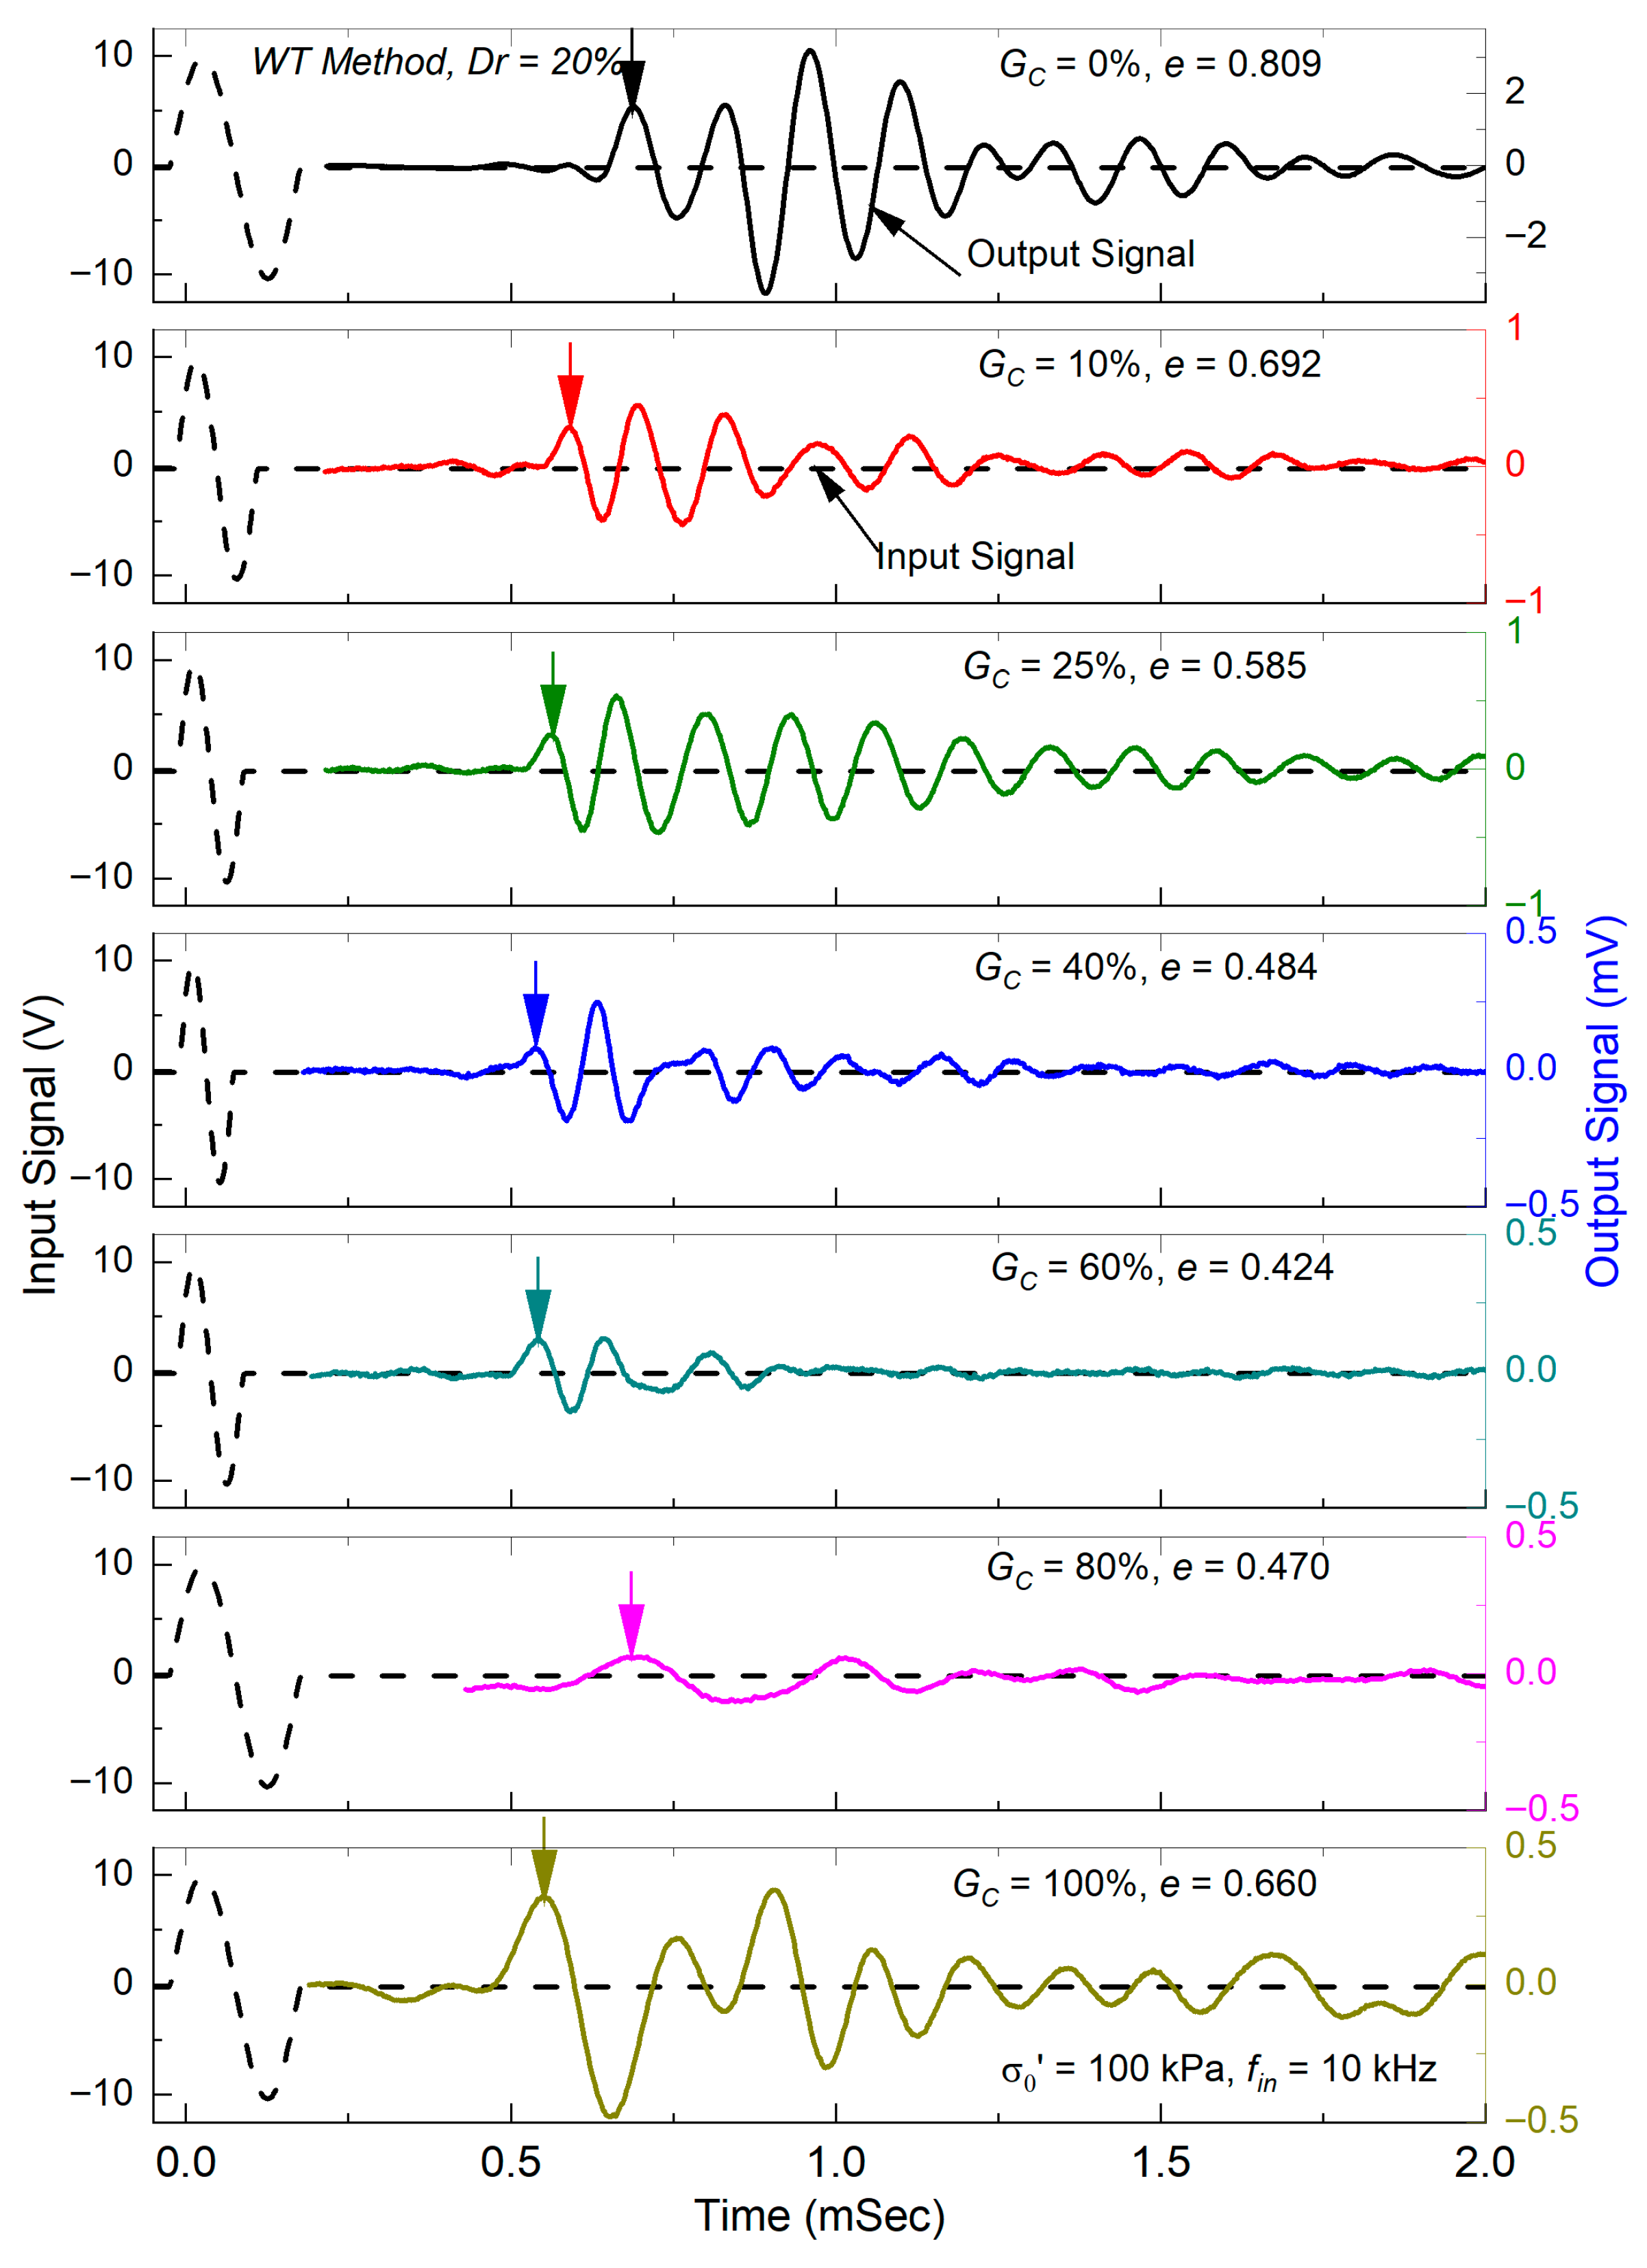
Figure 5 presents representative shear waveforms for seven tested conditions of the SGM specimens prepared using the WT method under a confining stress of 100 kPa and an input frequency of 10 kHz in the time domain responses. Owing to variations in the density index associated with different SC, it was not possible to prepare SGM specimens at identical global or equivalent void ratios. For ease of comparison of arrival times, the first prominent peak of each waveform is indicated with downward arrows. The VS arrival time decreases progressively by increasing GC up to 60%, after which a different trend is observed for GC = 80 and 100%. This observation reveals that, at a given void ratio, SGMs with GC = 80% may exhibit VS values comparable to those of sand (GC = 0%) specimens, representing the lowest VS among the testing conditions. Both the amplitude and overall characteristics of the received waveform are influenced by GC. As shown on the right Y-axis, the received amplitude is highest for GC = 0% and generally decreases up to GC = 80%, indicating that lower GC results in stronger received signals. The attenuation of waveform amplitude with increasing particle coarseness is consistent with trends reported for sand–silt mixtures [43]. For SGMs with lower GC (<40%), the first peak of the received waveform exhibits a smaller amplitude than the subsequent peaks. In contrast, for SGMs with higher GC (>60%), the first peak is dominant and is followed by the lower-amplitude peaks. The presence and magnitude of these early peaks are known to be influenced by particle size and confining pressure [38].

4. Test Results and Discussion

4.1. Variation in Shear Wave Velocity with Gravel Content and Relative Density

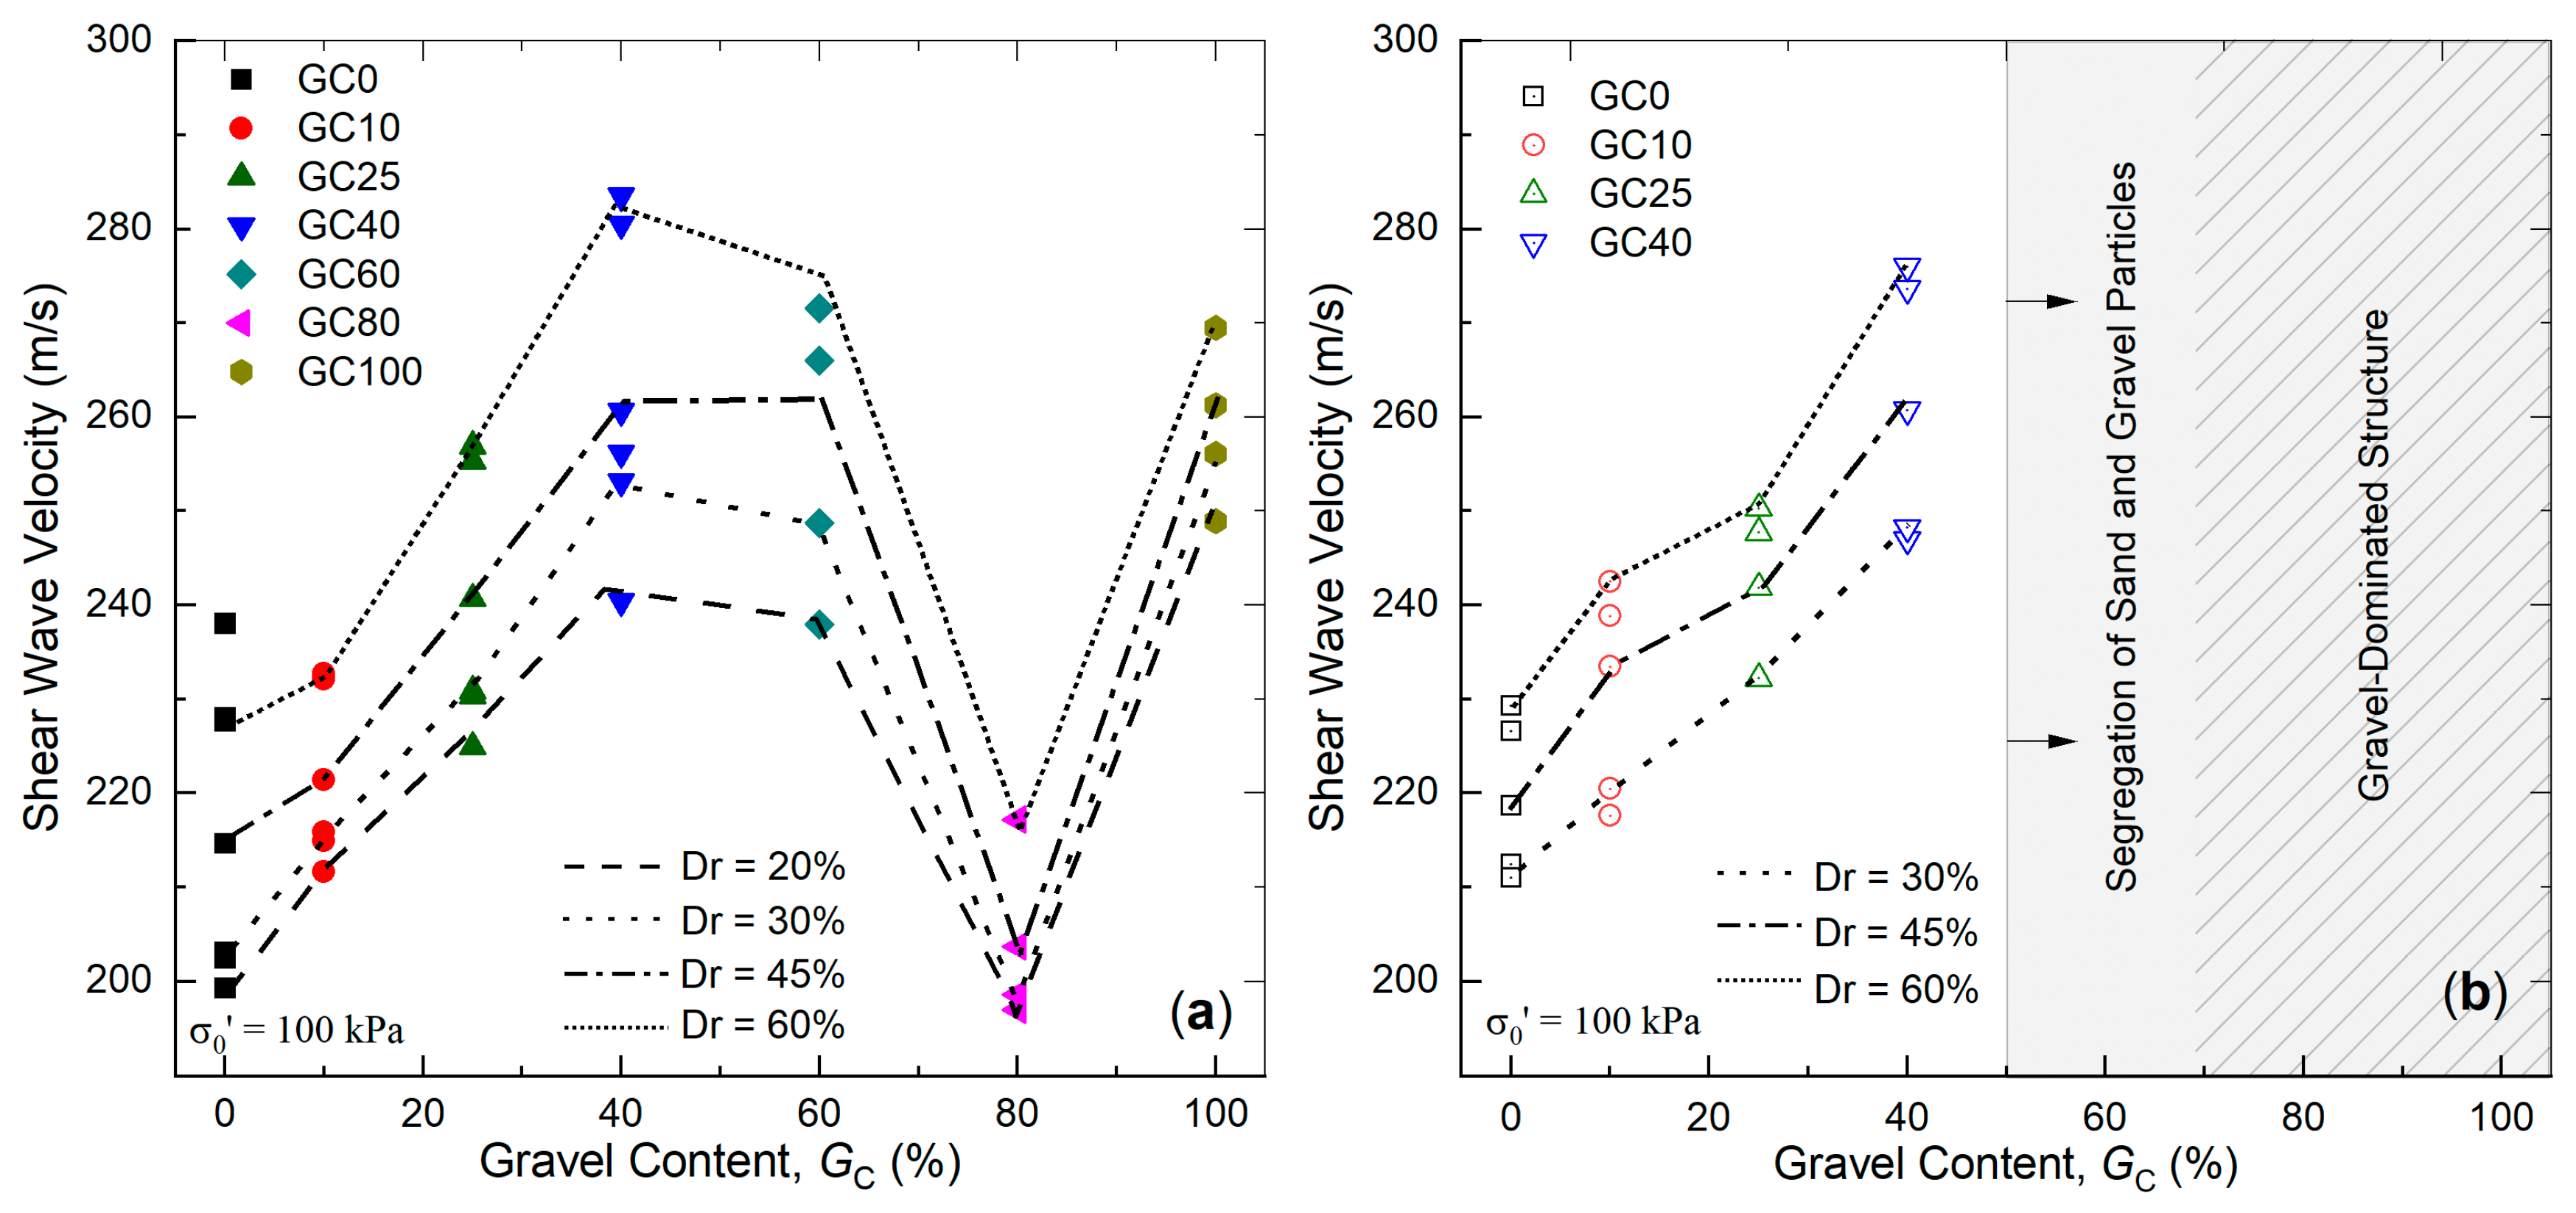
Figure 6a and Figure 6b present the variations in VS with GC under 100 kPa confining stress for specimens prepared using the WT and AP methods, respectively. The WT dataset includes seven SGM configurations tested at Dr = 20, 30, 45 and 60%, whereas the AP dataset comprises four SGM configurations tested at Dr = 30, 45 and 60%. The Vs value of gravel (i.e., GC = 100%) is approximately 25% higher than that of sand (i.e., GC = 0%). For WT specimens, regardless of the density state, VS increases progressively with increasing GC up to Gc = 40%. Similar increasing trends are also observed for AP specimens; however, SGMs with GC greater than 40% were not tested using the AP method due to particle segregation during specimen preparation.
As shown in Figure 6a, WT specimens with GC = 60% exhibit VS values that are comparable to, but slightly lower than (i.e., 3% difference), those at GC = 40%. This suggests that the addition of gravel particles beyond GC = 40% does not contribute to a denser packing condition (i.e., microstructure) of SGMs. With a further increase in GC to 80%, VS decreases markedly (by approximately by 20%), reflecting a transition in the soil microstructure from sand-dominant to gravel-dominant. Notably, despite the high GC, the VS at 80% is comparable to that of GC = 0% (i.e., sand). Overall, the Vs values at GC = 80% are the lowest among all investigated SGMs and are approximately 25% lower than those at GC = 100%. The lowest VS at GC = 80% is attributed to the limited or negligible contribution of sand particles to the force chain network of the soil matrix. This behavior can be interpreted using the intergranular state concept, as discussed further in Section 5 and Section 6 of this paper. The plot demonstrates that the VS of SGMs is significantly influenced by the GC and Dr, with SGMs at the same Dr values exhibiting significantly different VS values depending on GC.

4.2. Normalized Shear Wave Velocity

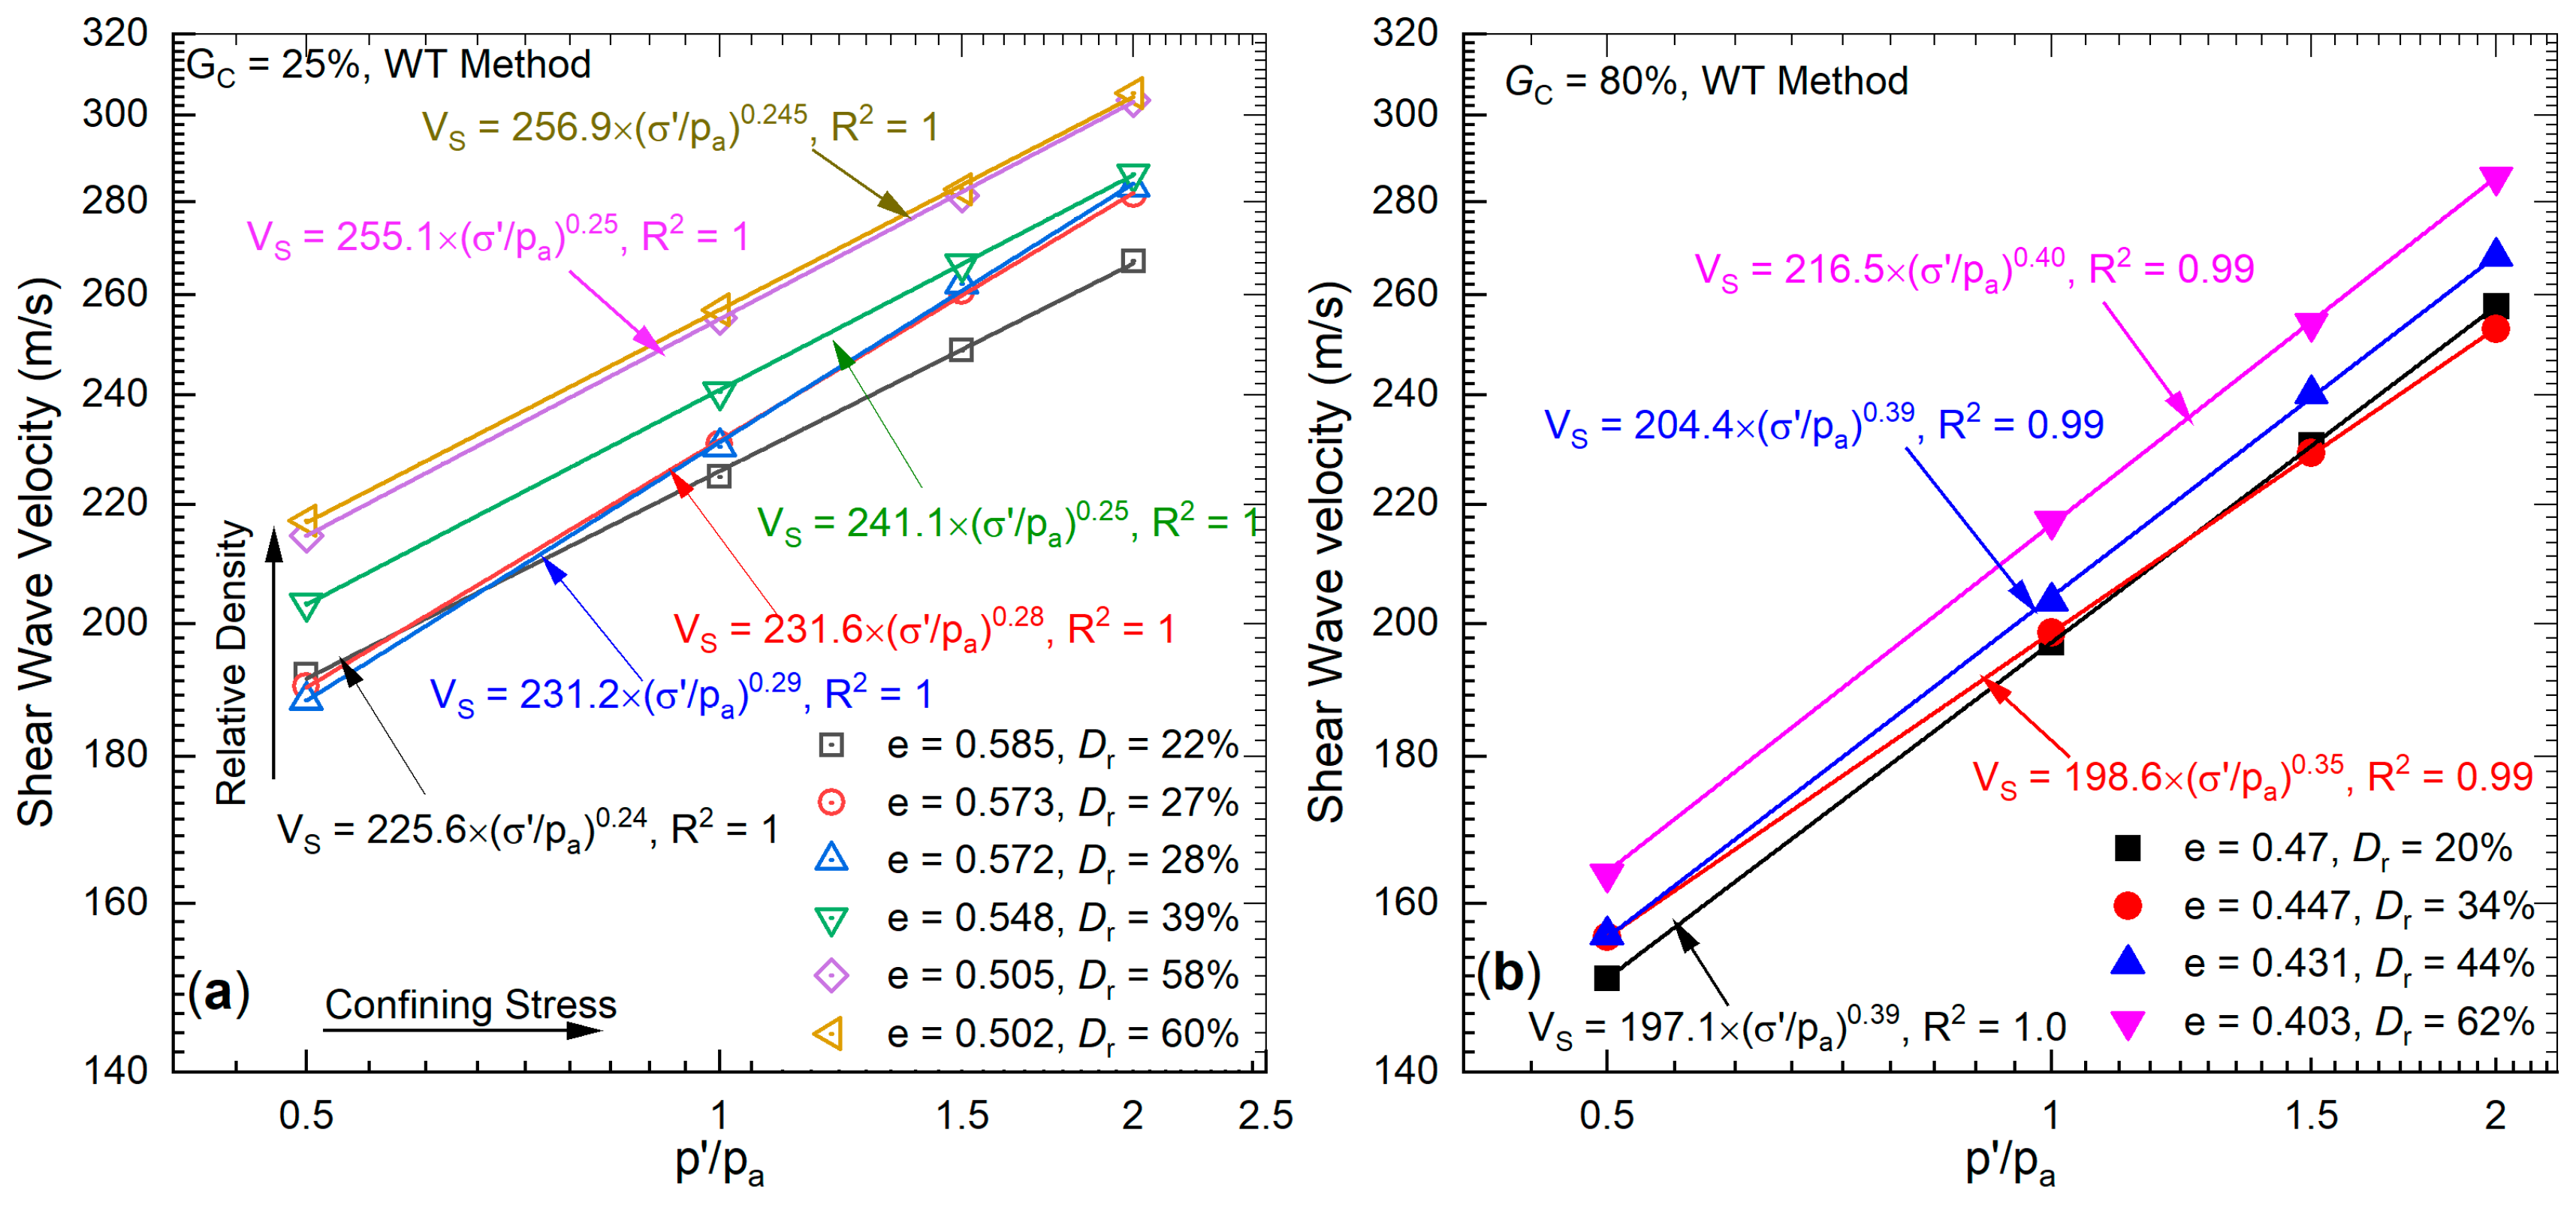
Figure 7 shows the variation in VS with confining stress for GC = 25% and 80%, which is presented as a representative plot for SGMs tested in this study. It indicated that VS is influenced not only by GC and Dr but also by the confining stress state. In field measurements, for a given Dr, VS typically increases with increasing depth due to increasing effective overburden stress. Consequently, VS is commonly normalized with respect to vertical effective stress using an overburden correction factor to remove the effect of effective stress level. In a similar manner, laboratory-measured VS can be normalized for confining stress. The widely used relationship to normalize VS is given by Equation (3):
V S 0 = V S / p P a n
where VS0 is the normalized shear wave velocity (m/s); VS is the measured shear wave velocity (m/s); Pa is the atmospheric pressure or reference stress, normally taken equal to 100 kPa; σ0′ is the vertical overburden stress (kPa); and n is a function of effective overburden stress.
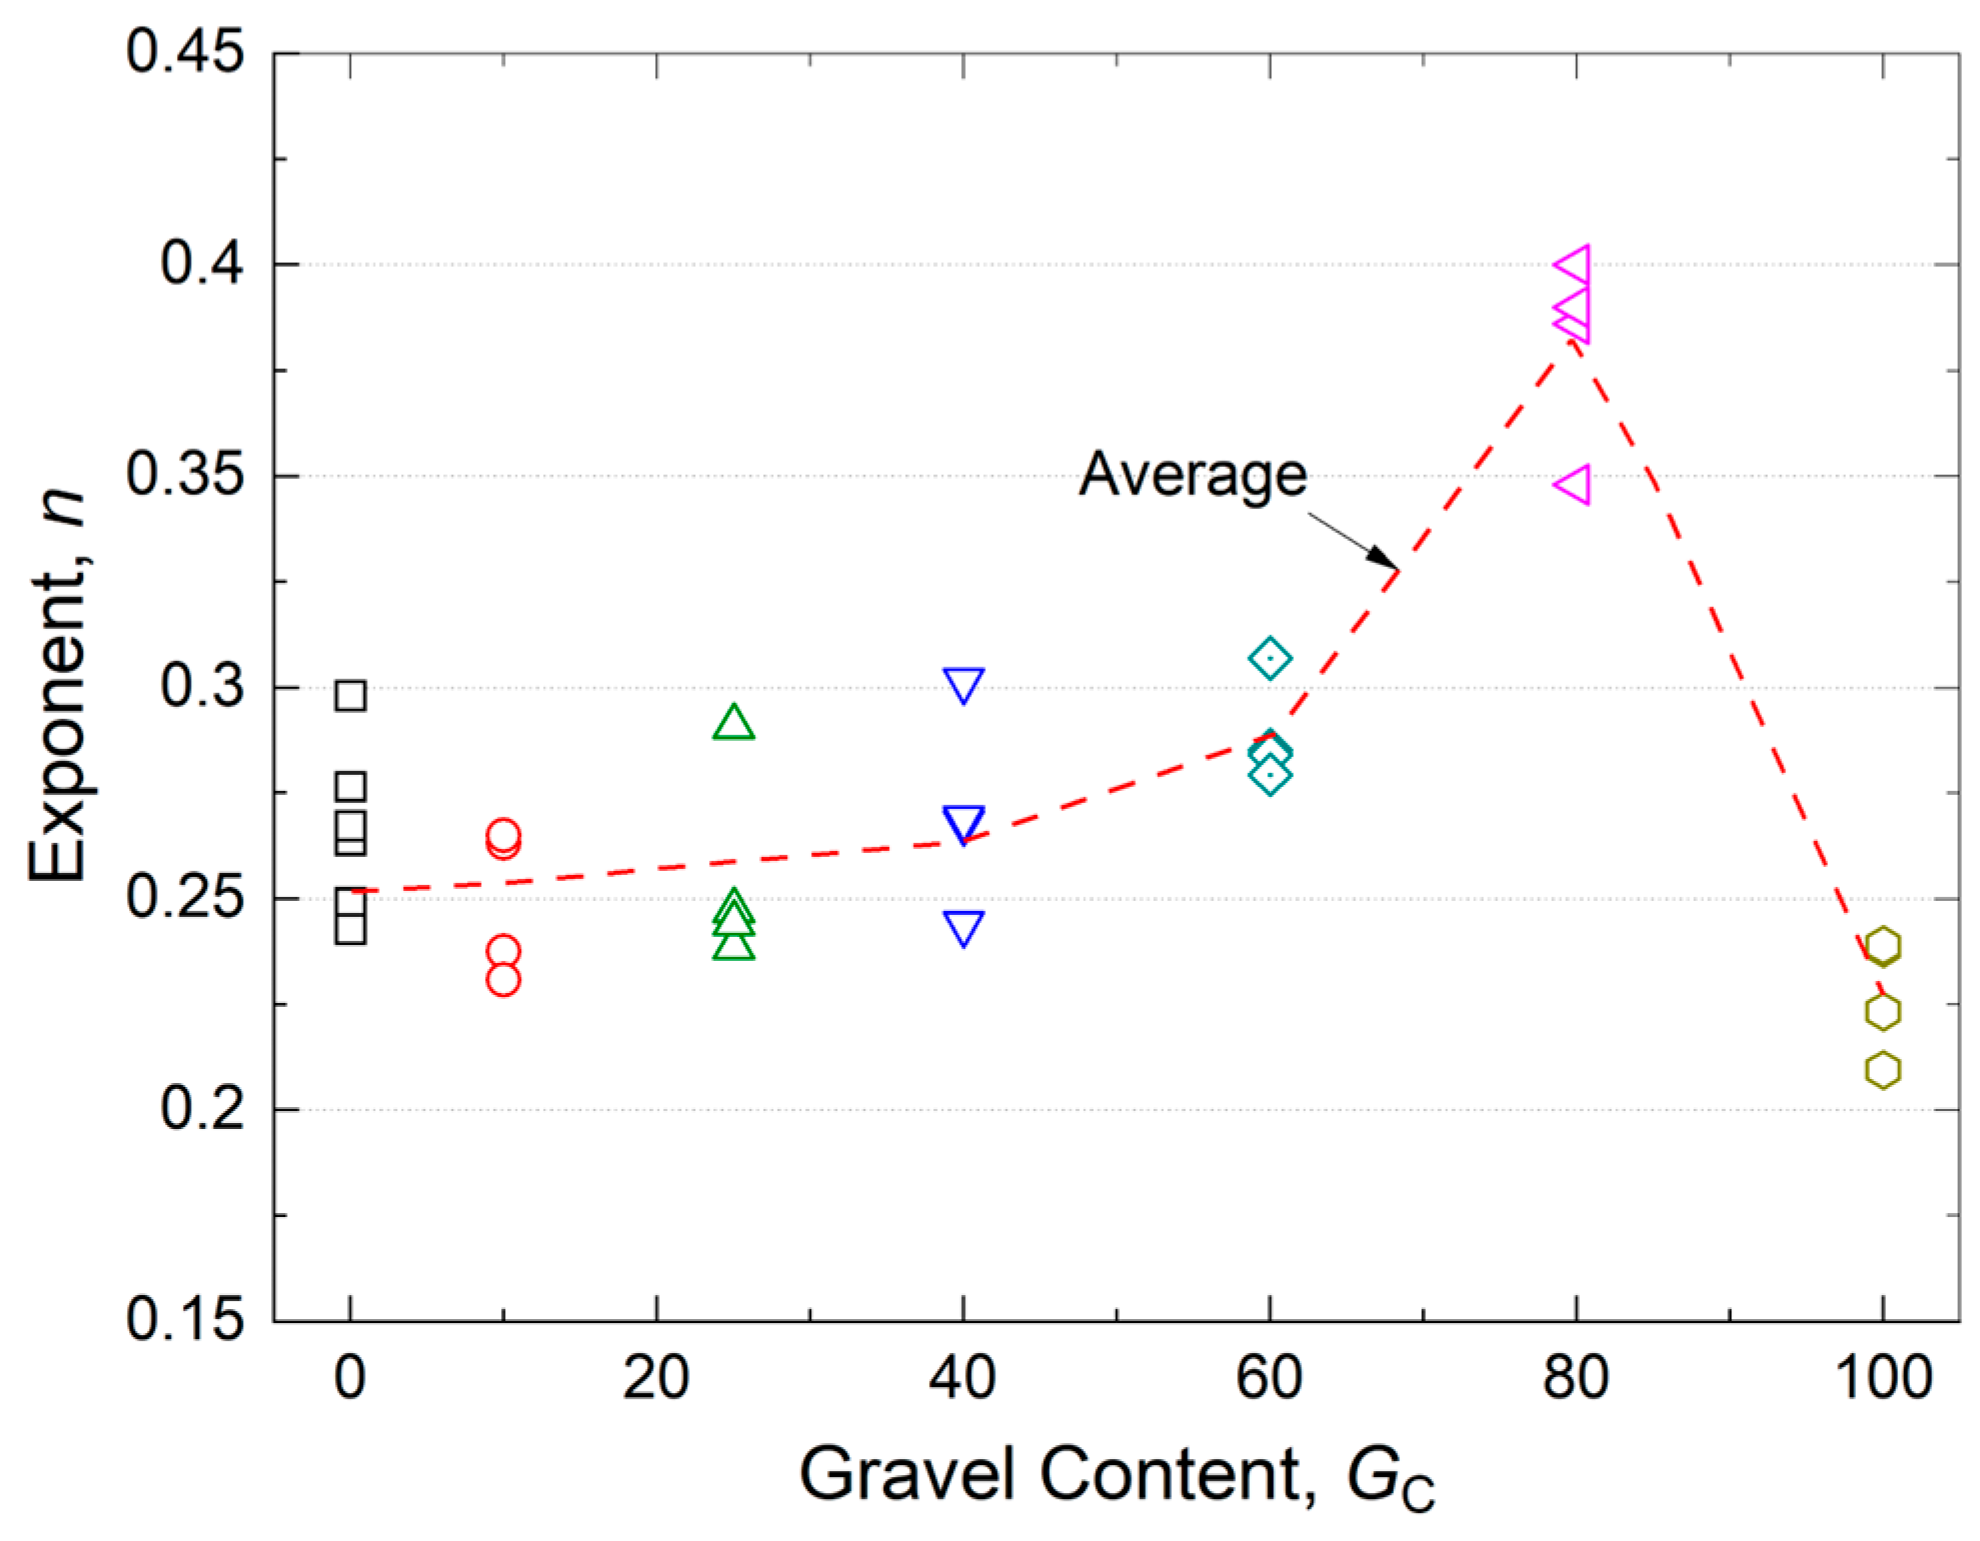
For sands, n is typically 0.25 [1,47,48]. In the case of gravelly soils and mixed soils, contradictory values have been reported in previous studies. Kokusho et al. [23] found the average value of n to be 0.25, consistent with Hardin and Drnevich [1]. However, other researchers reported a range of values between 0.22 and 0.45 [49,50,51]. Similarly, Ishihara [52] and Kokusho and Tanaka [53] reported values ranging from 0.42 to 0.47 for undisturbed gravelly soils. For mixed soils, Iwasaki and Tatsuoka [4] and Yang and Liu [15] reported that the exponent n is insensitive to fines content. However, Salgado et al. [54] reported n = 0.405 for a fines content of 20% and Dr < 59%. Such an unusually high n value does not agree with observations on sand–silt mixtures reported in the literature [4,55] for fines content up to 20%. Therefore, this study examines the variation in exponent n with GC for all SGMs tested. The exponent n was determined through regression analysis of the slope of linear relationships obtained for individual initial void ratios. As shown in Figure 7, for SGMs with GC = 25%, the values of n range from 0.24 to 0.29.
The n values obtained for each SGM under all the tested void ratio conditions are plotted in Figure 8. For SGMs with GC ≤ 40%, n generally ranges from 0.23 to 0.3, increasing slightly to 0.28–0.31 for GC = 60%. In contrast, SGMs with GC = 80% show significantly higher n values, ranging from 0.35 to 0.40, whereas GC = 100% exhibits the lowest n values, in the range of 0.21–0.24. The average value for each SGM was calculated and connected by a dotted trend line. The average n value close to 0.25 for SGMs with GC ≤ 40% is consistent with values reported in previous studies and increases slightly for GC = 60%. However, the average n values for the SGMs with GC = 80 are close to 0.4, which is comparable to values reported for sand–silt mixtures with fines content of 20% [54] and for gravelly soils [53]. The average value of 0.22 for GC 100% closely matches the value reported by Nishio et al. [50] for gravel samples. These results clearly demonstrate that the exponent n is strongly dependent on GC, highlighting the need to account for soil composition when normalizing VS for confining stress.
Figure 7. Variation in VS with confining stress for SGMs prepared at different void ratios (relative densities) by the WT method: (a) GC = 25% and (b) GC = 80%.
Geotechnics 06 00047 g007
Figure 8. Variation in exponent n with gravel content for SGMs prepared by the WT method.
Geotechnics 06 00047 g008

4.3. Variation in Normalized Shear Wave Velocity (VS0) with Global Void Ratio

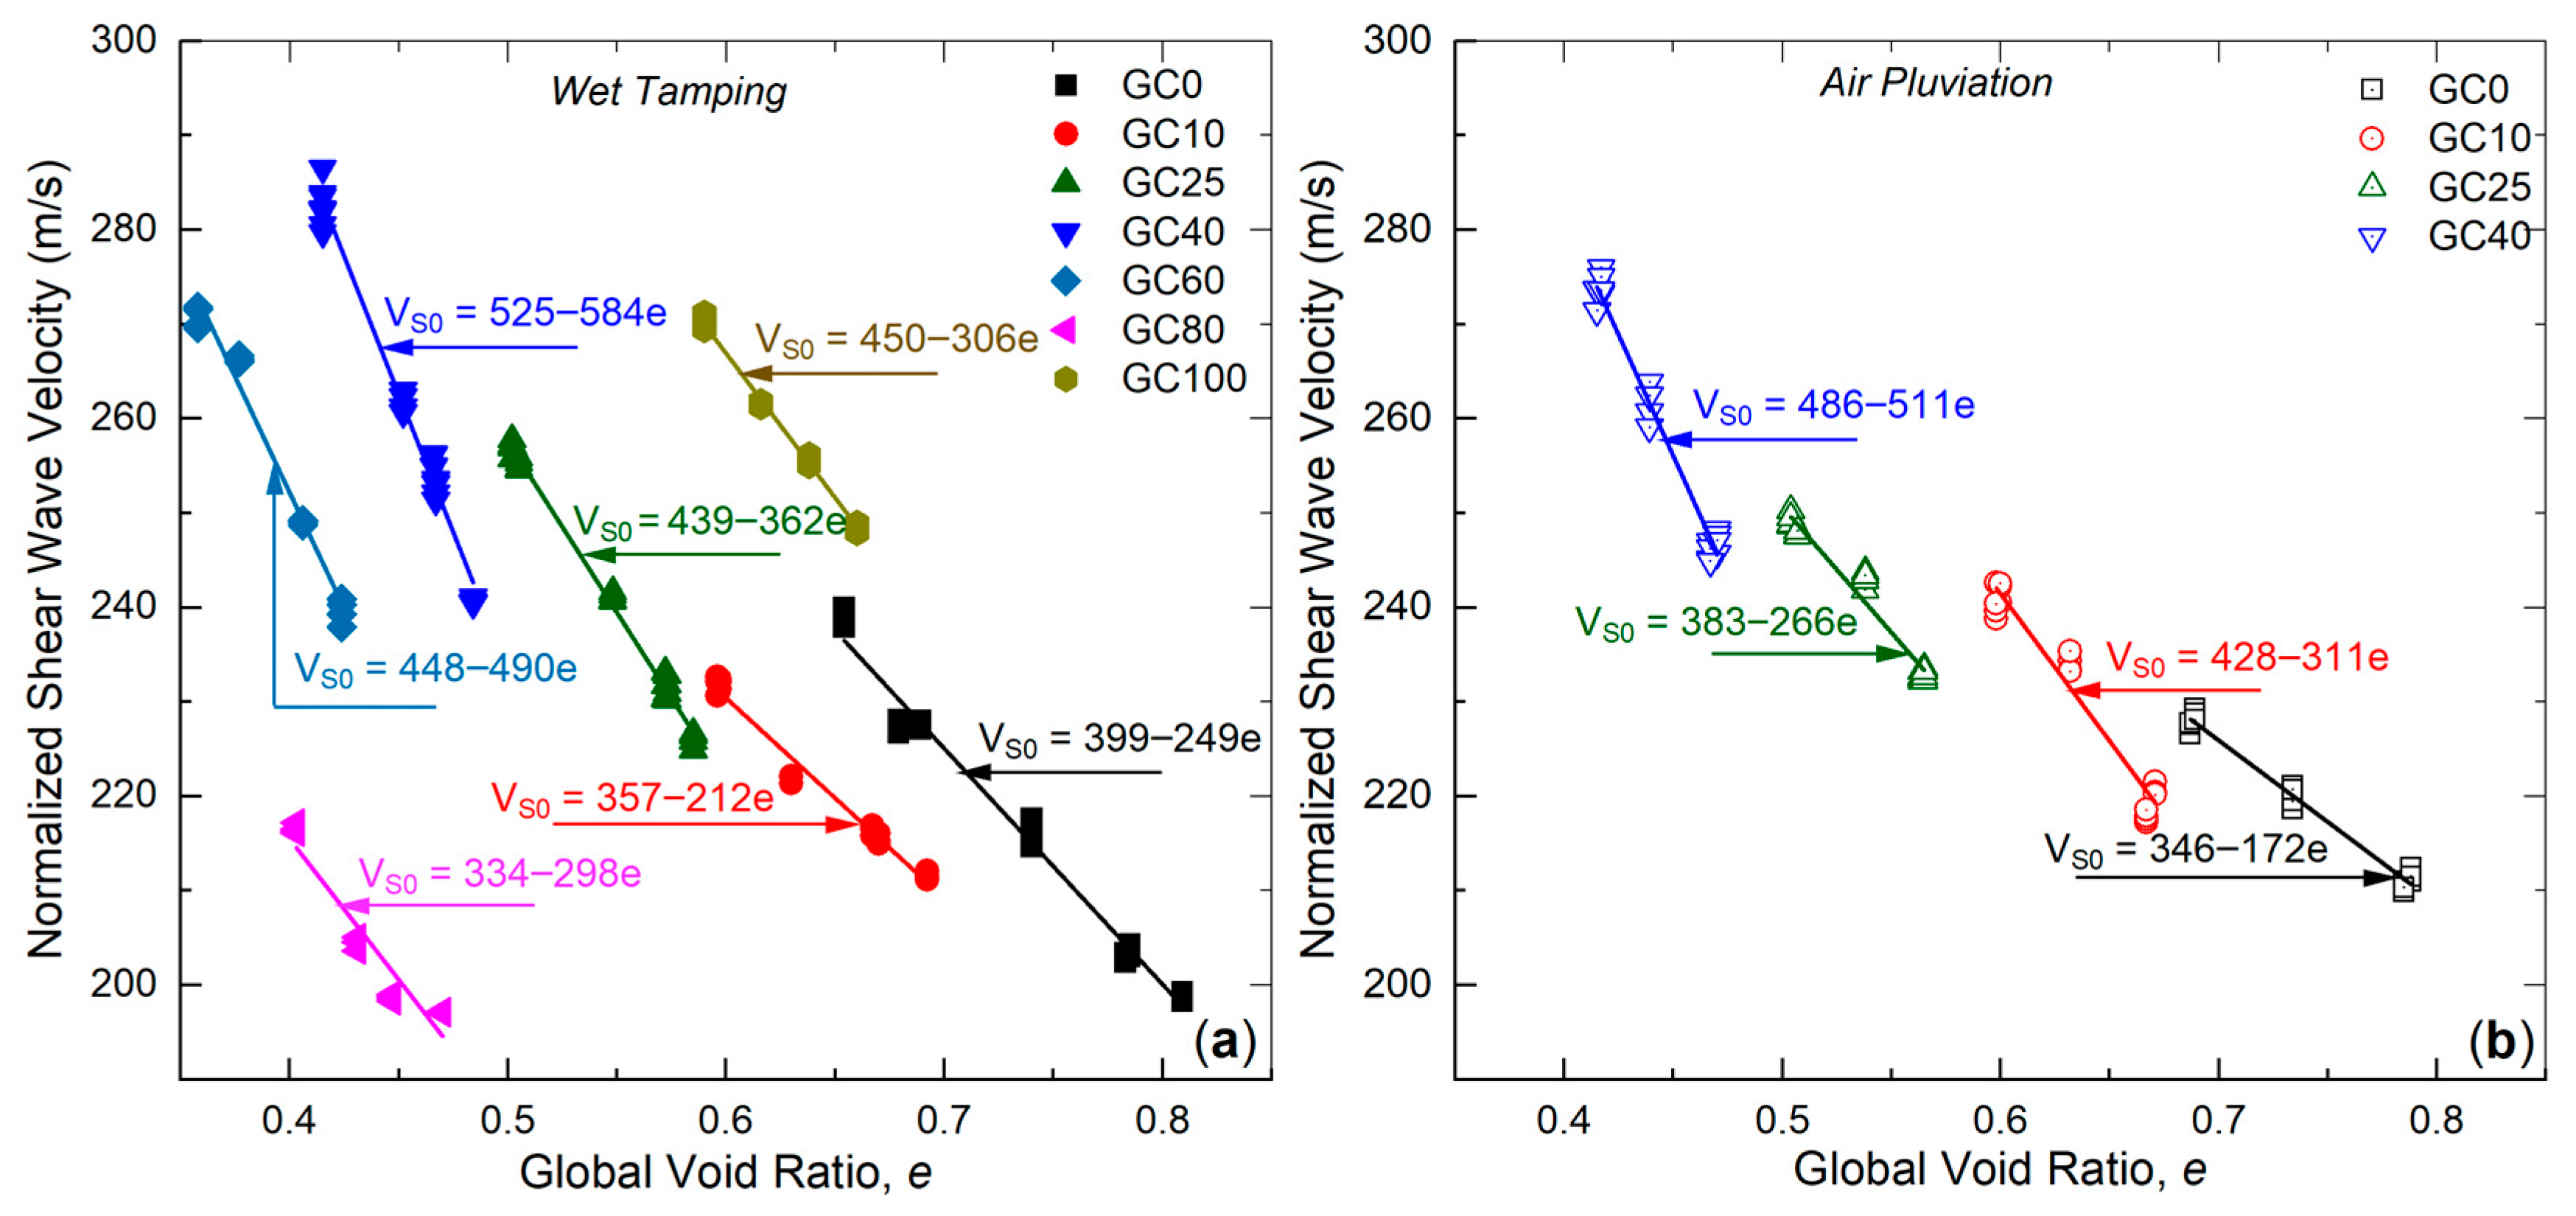
The data discussed in Section 4.1 were obtained at a confining pressure of 100 kPa. However, the datasets measured under confining pressures of 50, 150 and 200 kPa were normalized to eliminate the effect of confining pressure and are presented in Figure 9a and Figure 9b for the WT and AP specimens, respectively. The normalized results are used to examine the relationship between normalized shear wave velocity (VS0) and global void ratio (e) for SGMs prepared using both specimen preparation methods. The results indicate that VS0 for each GC condition has a linear relationship with e. Similar linear VS0 e relationships have been reported in previous studies [22,43,56]. Thus, the relationship between VS0 and e can be expressed by the following Equation (4):
V S 0 = A B e
where A and B are fitting parameters. They are summarized in Table 3 for each GC configuration and for both the WT and AP methods.
Figure 9. Variation in normalized shear wave velocity with global void ratio for SGMs prepared using (a) wet tamping and (b) air pluviation methods.
Geotechnics 06 00047 g009
For both specimen preparation methods, VS0 increases with increasing GC up to 40%. The slope of the VS0 e relationship (i.e., the B parameter) increases progressively, and the inclination shifts systematically leftward with increasing GC up to 40%, with the exception of GC = 10% for WT specimens. This behavior is consistent with the VS trend reported by Kokusho and Yoshida [22] for gravelly soils. This indicates that VS significantly increases with increasing GC as the SGM becomes coarser and better graded. This trend can be partially attributed to the increasing contribution of gravel particles to the overall packing condition (microstructure) of SGMs. Differences in the fitted parameters A and B between WT and AP methods reflect the influence of soil fabric on VS0.
The slope corresponding to GC = 80% is substantially lower than that for GC = 60%, highlighting changes in mixture microstructure. The distinct and independent slopes observed for each SGM composition provide clear evidence that conventional VSDr (or global void ratio, e) are not directly applicable to mixed soils. This finding aligns with the conclusion made by Mitchell and Soga [57], who noted that the global Dr of mixed soils varies depending on the proportions of finer and coarser constituents. Thus, correlation between VS and alternative state parameters, such as the skeleton and equivalent void ratios, should be examined to assess whether a unique composition-independent framework can be established for SGMs.

5. Intergranular State Concept for SGMs

As concluded above, the commonly used reference parameters, global void ratio and relative density, are not suitable for evaluating the VS of SGMs. Therefore, alternative reference parameters need to be explored, guided by the intergranular state concept for binary mixtures.

5.1. Threshold Sand Content and Gravel Content

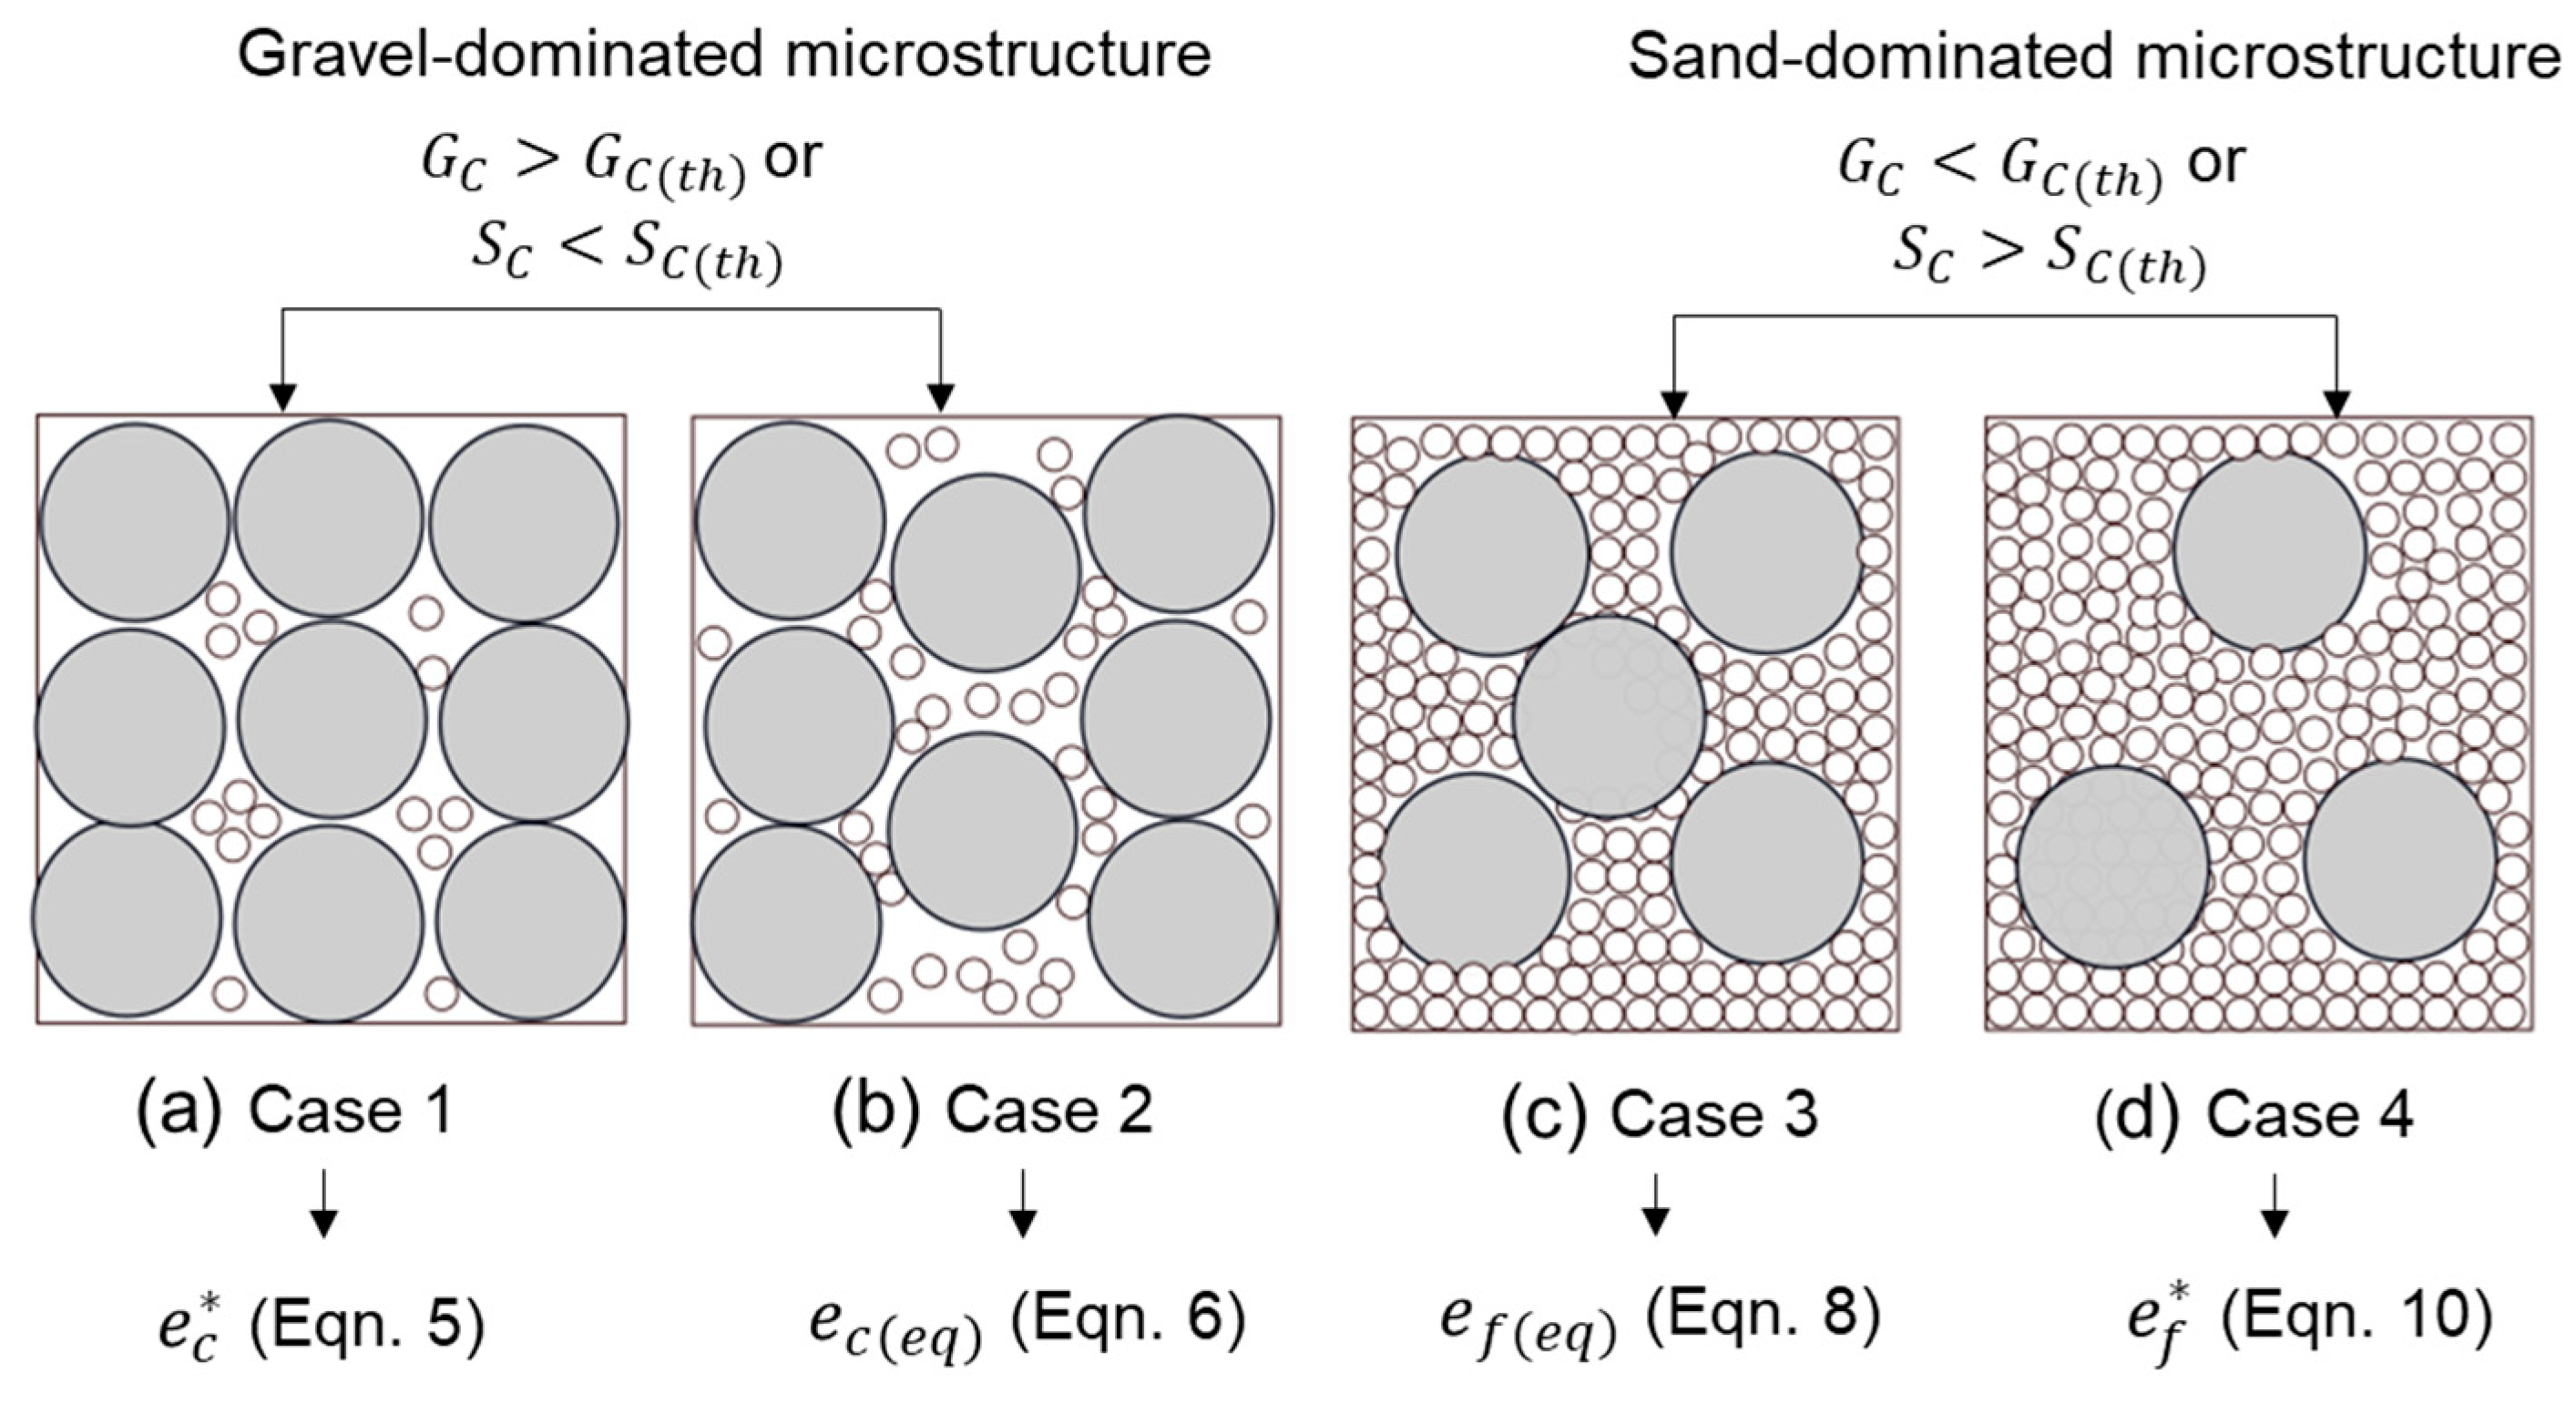
Depending on the SC, SGMs can exhibit either sand-dominated or gravel-dominated microstructures, as illustrated schematically in Figure 10. The SC separating these two zones is referred to as the threshold sand content, SC(th) [58], with GC(th) denoting the corresponding threshold gravel content. Previous studies [58,59,60] have proposed various models to estimate SC(th) for sand–silt mixtures, and these approaches can also be applied to SGMs. Therefore, in this study, the semi-empirical equation of Rahman et al. [59] expressed by Equation (5), originally developed for sand–silt mixtures, was adopted to calculate SC(th) and, consequently, GC(th) for SGMs. Using this method, the SC(th) for the tested SGMs was found to be 31%, corresponding to G C ( t h ) = 69%.
G C ( t h ) = 1 0.4 1 1 + exp 0.5 0.12 r + r   ×   100   ( % )
where r = d 50 / D 10 ; d 50   is the mean diameter of the sand; and D 10 corresponds to the effective particle size of the gravel.
It should be noted that the intergranular state concept for binary mixtures of different soil particle sizes was originally developed for gap-graded sand–silt mixtures [6,27]. However, the binary packing conditions observed for SGMs in this study are analogous to those previously reported for sand–silt systems. Consequently, the void ratios for sand-dominated and gravel-dominated microstructures can be described using the intergranular state concept, following the approach proposed by Thevanayagam [27] for sand–silt mixtures [61].
Based on the SC(th) that separates SGM microstructures, this study envisages two primary regimes: (1) sand-dominated and (2) gravel-dominated microstructures. In total, four microstructural cases were considered, as schematically illustrated in Figure 10 to define the skeleton and equivalent void ratios of SGMs:
  • Case 1: Sand particles are fully confined within the voids available between the gravel particles and do not contribute to load transfer among gravel particles.
  • Case 2: Sand particles partially fill the voids between gravel particles but still participate in stress transmission.
  • Case 3: Sand particles fill the voids and begin to separate the gravel particles from one another, while gravel particles continue to contribute to the stress-bearing network.
  • Case 4: Gravel particles are fully separated by sand particles, effectively becoming part of the force-chain network in the sand matrix.
Figure 10. Schematic diagrams of the microstructures defined in this study for SGMs.
Geotechnics 06 00047 g010

5.2. Gravel-Dominated Microstructures

Microstructures with GC > GC(th) (SC < GC(th)) are considered gravel-dominated, in which sand particles remain inactive and do not contribute to the mechanical response of the mixture. In this case, gravel particles are dispersed within a sand matrix and do not participate in the sand particle force-chain network. The corresponding gravel skeleton void ratio ( e c * ) treats the SC as void space within the mixture and can be estimated using Equation (6):
e c * = e   + [ 1 ( G C / 100 ) ] ( G C / 100 )
where e is the global void ratio and SC and Gc are the sand and gravel contents, respectively.
The above hypothesis neglects the contribution of sand particles to stress transfer in gravel-dominated microstructures and the contribution of gravel particles in sand-dominated microstructures. Even in gravel-dominated microstructures, where SC < SC(th), some sand particles are expected to actively participate in the force-chain network, as schematically described in Case 2 in Figure 10. The concept of equivalent intergranular void ratio ( e c ( e q ) ) proposed by Thevanayagam [62] may account for the contribution of sand grains to load transmission, as defined by Equation (7):
e c e q = e   + 1 b ( 1 ( G C / 100 ) ) G c + b ( 1 ( G C / 100 ) )
where b represents the finer fraction that contributes to the coarse-grain force-chain network. Rahman et al. [63] proposed the semi-empirical formula expressed by Equation (8) to estimate the b value based on fines content and particle size through r = d 50 D 10 :
b = 1 exp 0.3 1 G C 1 G C ( t h ) 1 r 0.25 r 1 G C 1 G C ( t h ) r

5.3. Sand-Dominated Microstructures

Microstructures with SC > SC(th) (GC < GC(th)) are considered sand-dominated. Thevanayagam [64] proposed that the contribution of gravel particles to the sand grain force- chain network cannot be entirely neglected, as gravel particles act as embedded reinforcement elements within the sand particle matrix when SC exceeds SC(th) but remains below a limiting sand content (SC(lim)). The equivalent interfine void ratio ( e f ( e q ) ) and SC(lim) can be calculated using Equations (9) and (10), respectively:
e f ( e q ) = e ( 1 ( G C 100 ) ) + ( G C / 100 ) R d m
G C ( l i m ) = π 1 + e 6 S 3   ×   100   ( % )
where R d is the particle disparity ratio ( = D 50 d 50 ) , D 50 is the mean diameter of gravel particles, d 50 is the mean diameter of sand particles, m is a fitting parameter that depends on the particle gradation and packing condition, and S = 1 + 10 R d .
Beyond SC(lim) (i.e., SC > SC(th) > SC(lim),), gravel particles are sufficiently separated and no longer influence the behavior of the finer sand matrix. In this case, the effect of gravel particles can be neglected, and the resulting sand skeleton void ratio ( e f * ) can be estimated using Equation (11):
e f * = e 1 ( G C / 100 )
As shown in Figure 2, in this study, SGMs with GC = 80 and 100% represent Cases 1 and 2; GC = 25, 40 and 60% denote Case 3; and GC = 0 and 10% correspond to Case 4; Table 4 reports the SC(lim) and SC(th) values calculated using Equations (10) and (5), respectively, as well as the contact index types based on the above discussion.

6. Variation in VS0 with Skeleton Void Ratio and Equivalent Void Ratio

6.1. Gravel-Dominated Microstructures

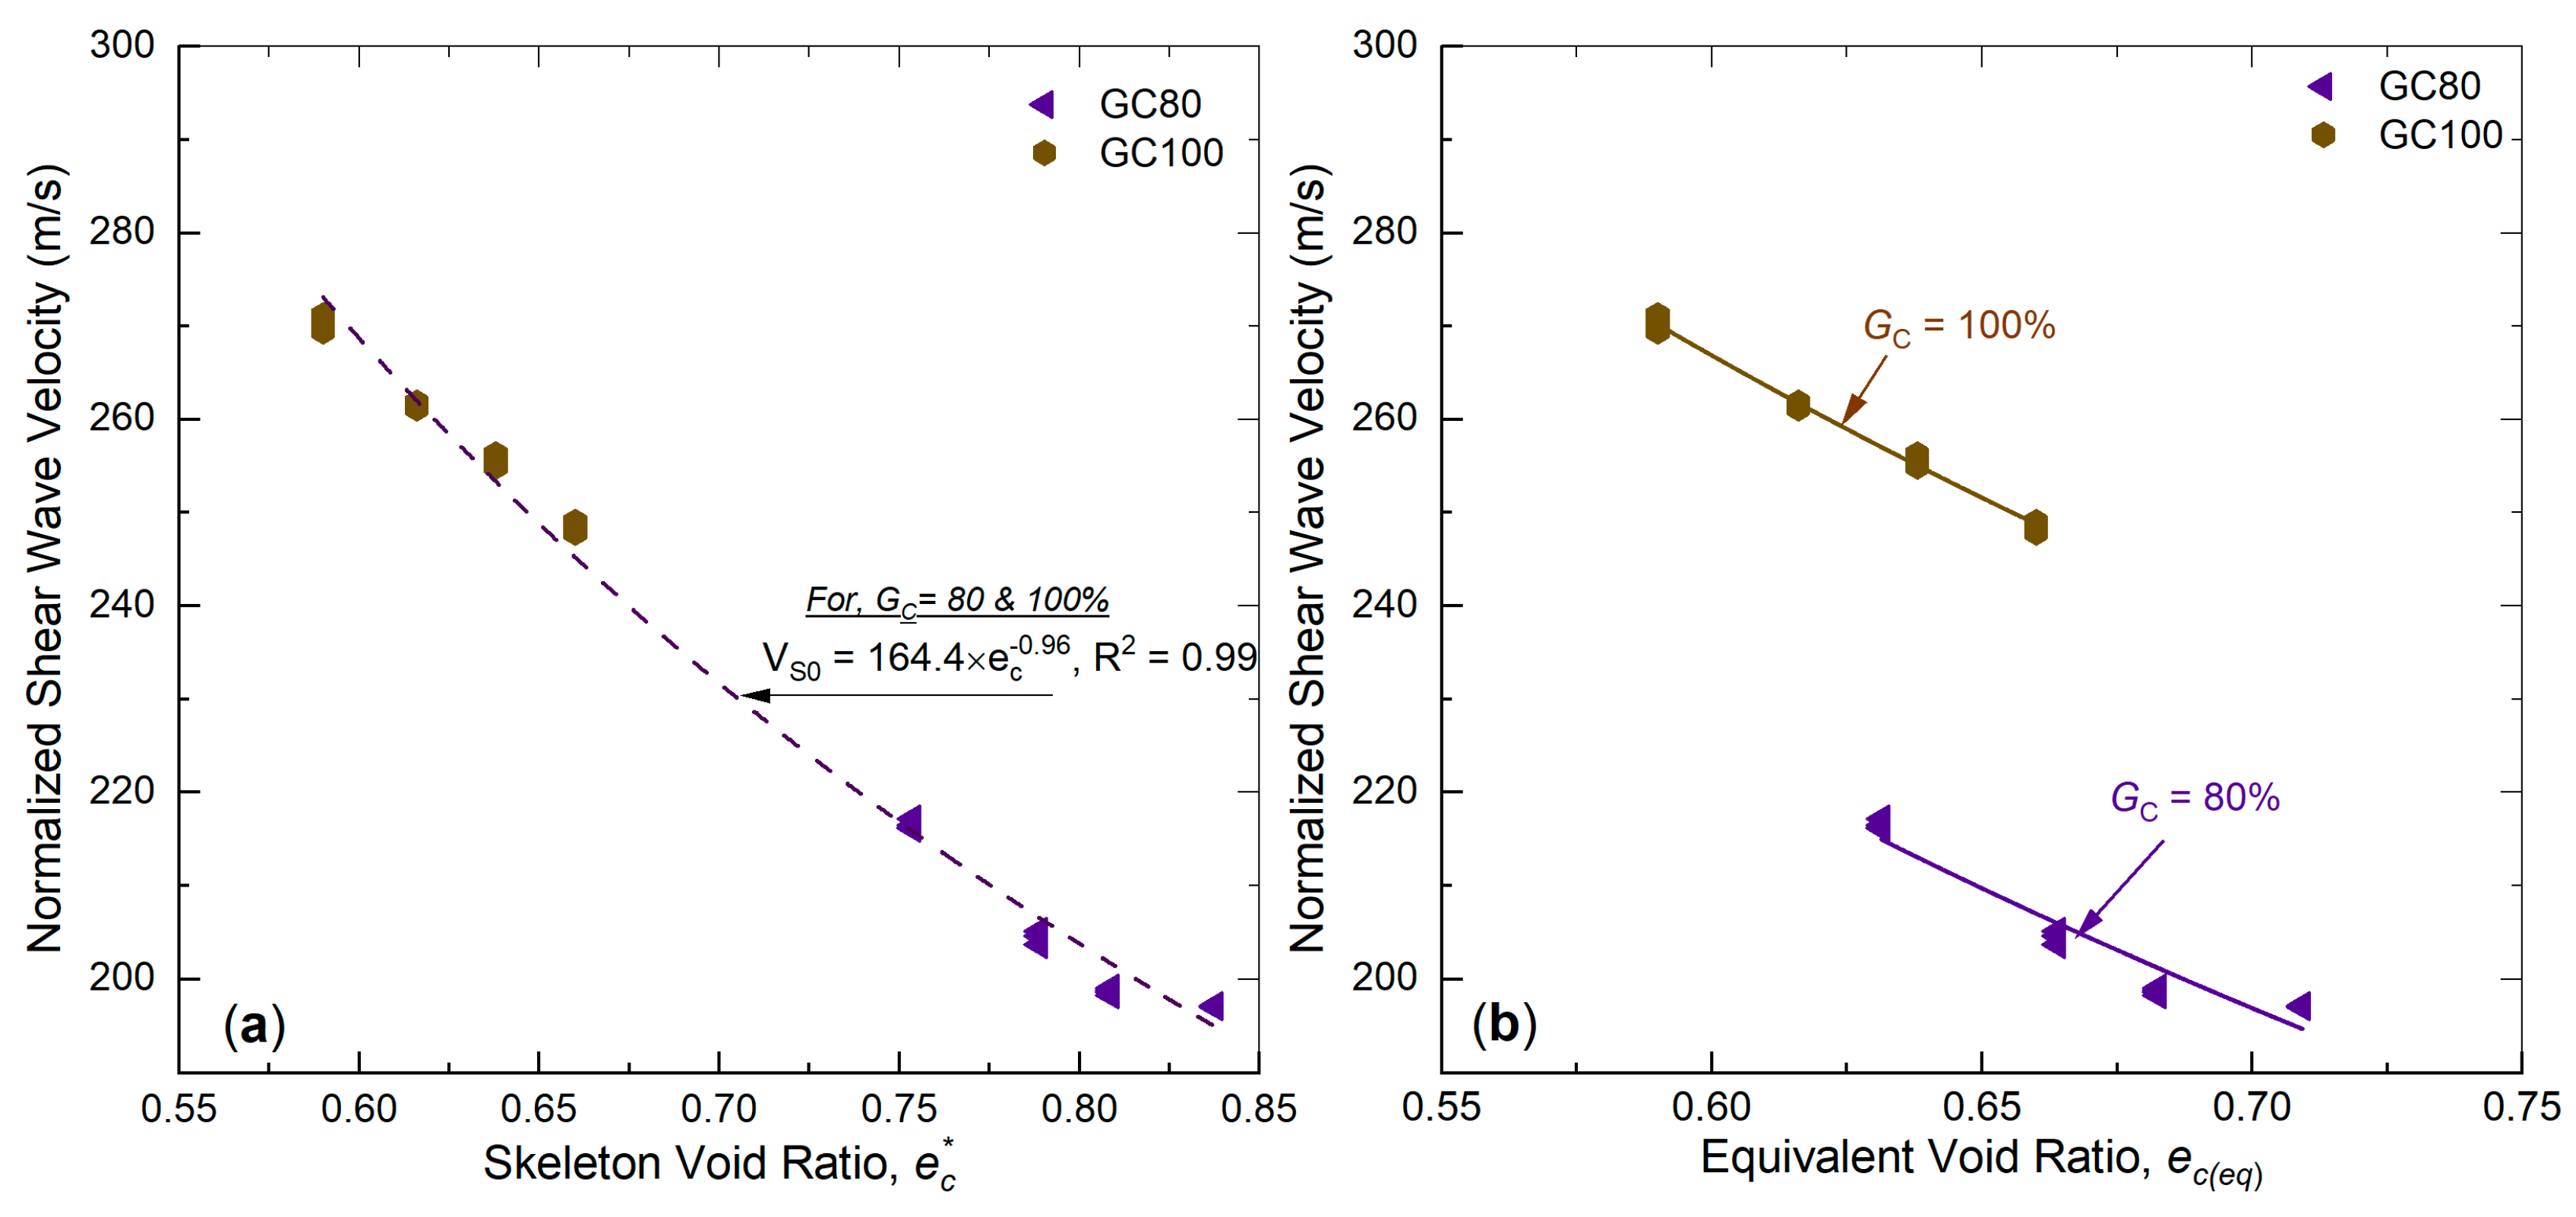
In this study, gravel-dominated microstructures (Cases 1 and 2) are represented by SGMs with GC = 80 and 100%. The variation in VS0 with e c * and e c ( e q )   for gravel-dominated SGM microstructures is presented in Figure 11. The values of e c * and e c ( e q )   are calculated using Equations (5) and (6), respectively.
As shown in Figure 11a, the VS0 values for GC = 80 and 100% fall into a single band when correlated with e c * . This indicates that the VS0 of SGMs with gravel-dominated structures is not influenced by the filler matrix (i.e., sand), corresponding to Case 1 of the hypothesized microstructure.
In contrast, when VS0 is plotted against e c ( e q ) ,   as shown in Figure 11b, the data exhibit noticeable scatter for all SGMs. It should be noted that, based on Equation (7), the contact index b value is found to be 0.3. This further confirms that the filler matrix (i.e., sand) does not contribute to the VS of SGMs with gravel-dominated microstructures, which is in agreement with Chang et al. [21].
Therefore, e c * is a more appropriate parameter than e c ( e q ) for estimating the VS0 of SGMs with a gravel-dominated microstructure.

6.2. Sand-Dominated Microstructures

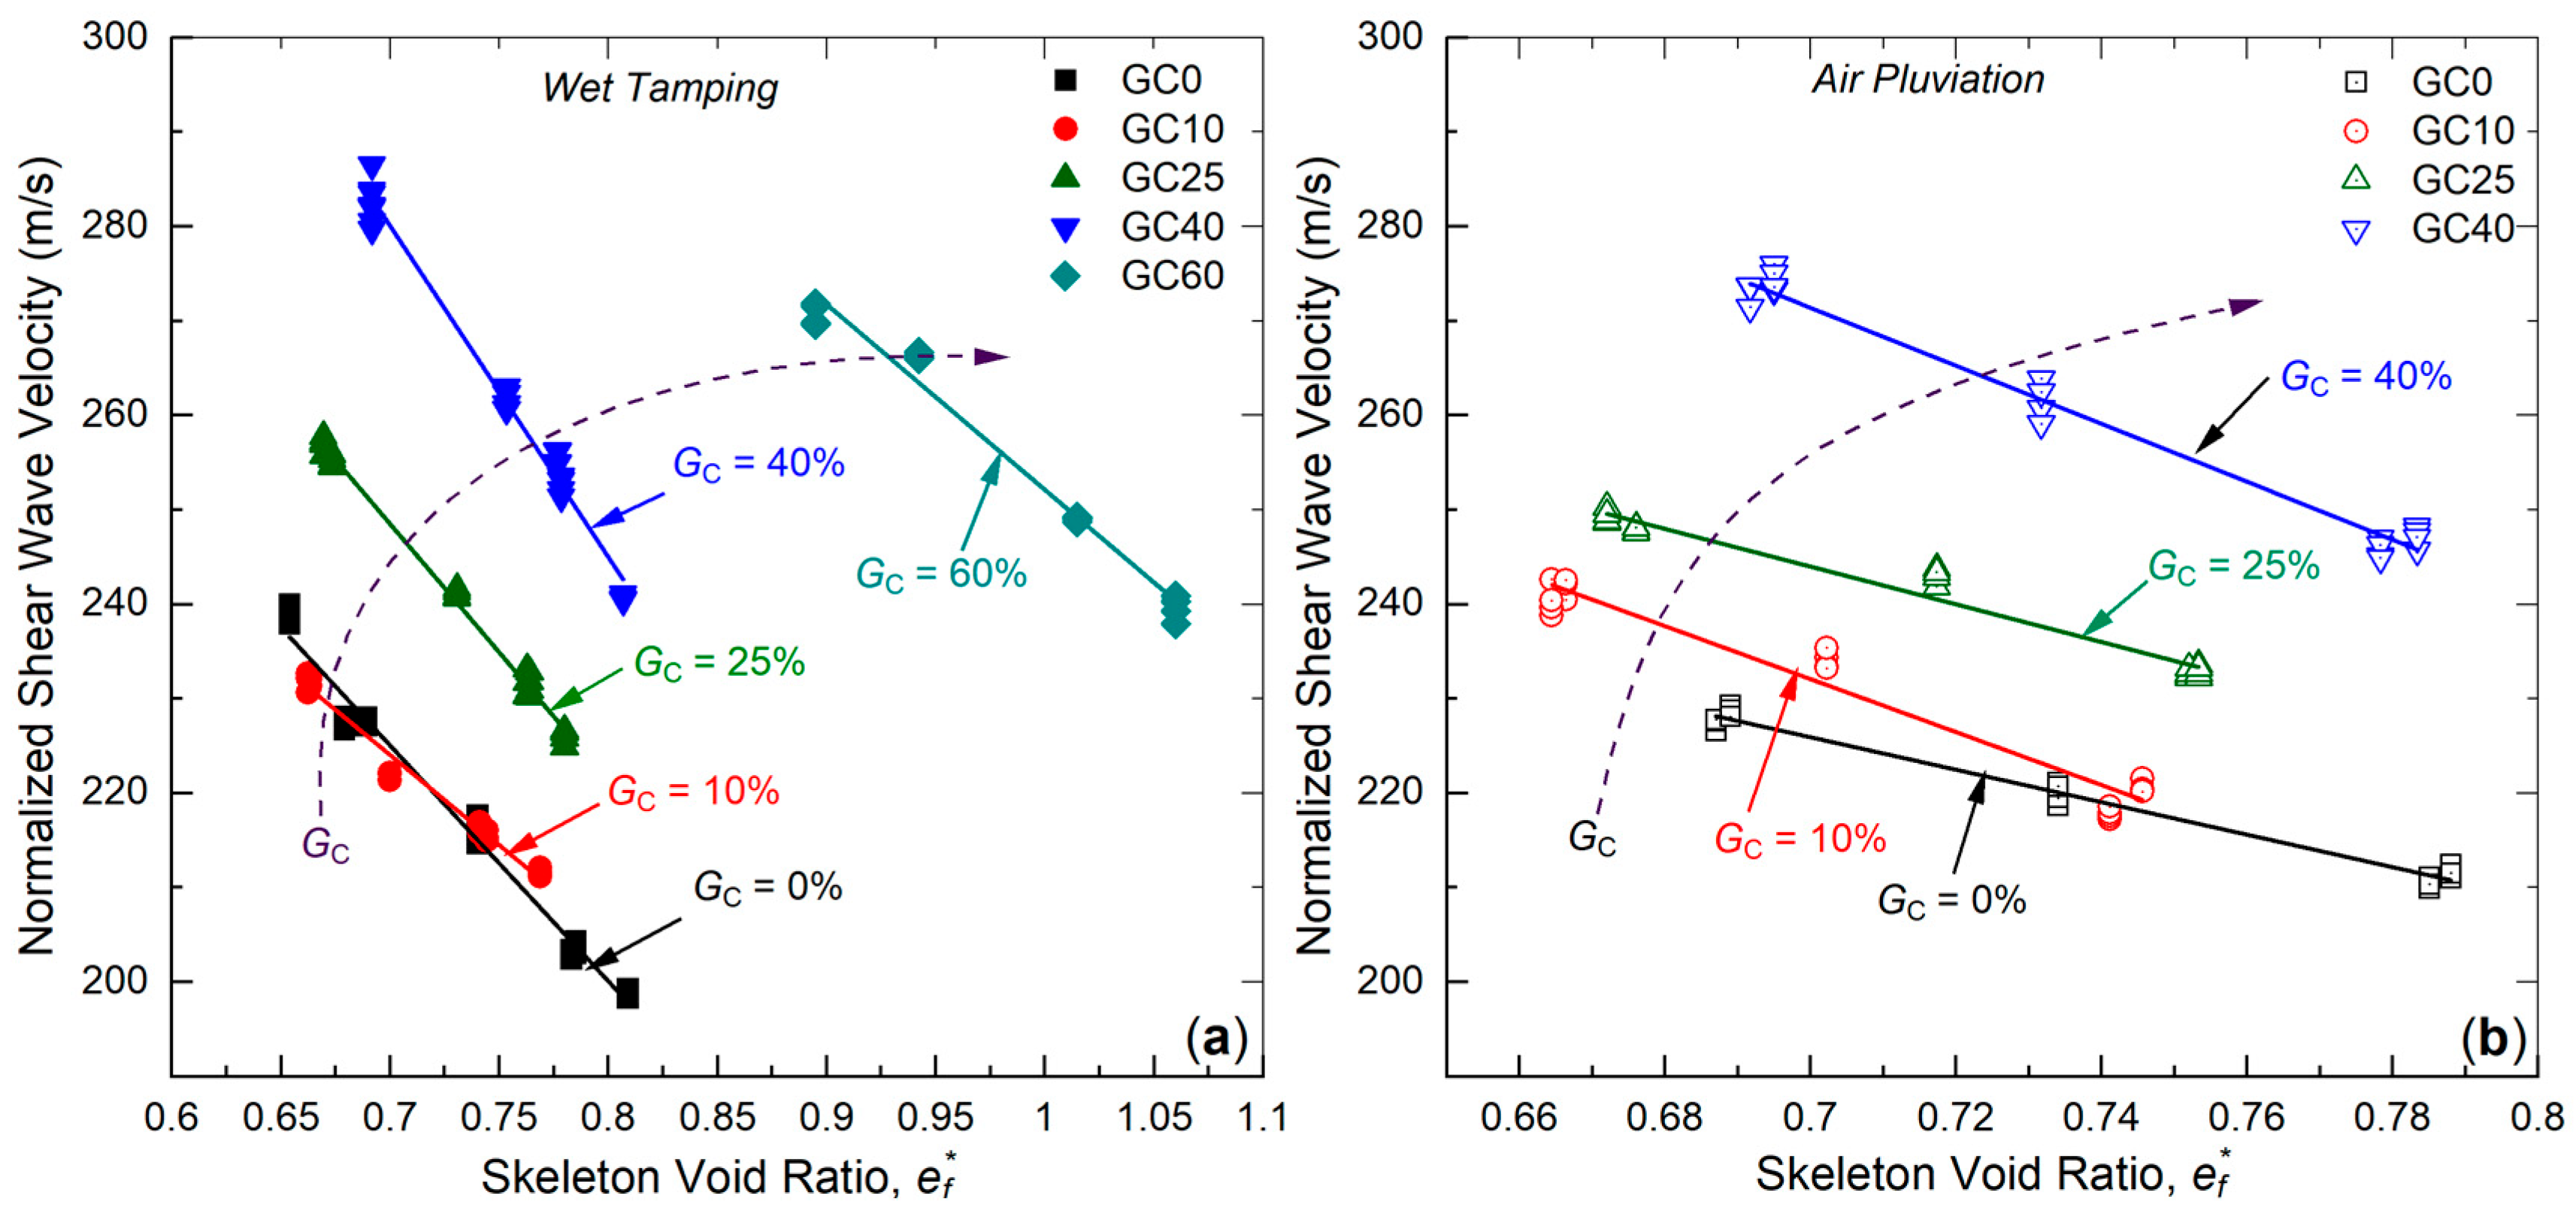
The variation in VS0 with e f *   and e f ( e q )   for SGMs with sand-dominated microstructures is presented in Figure 12 and Figure 13, respectively. The values of e f *   and e f ( e q ) are calculated using Equations (10) and (8), respectively.
As shown in Figure 12a,b, unique linear V S 0   e f * relationships forming a single band are observed only for SGMs with GC = 0 and 10% for both the WT and AP preparation methods. With further increases in GC, the V S 0   e f * relationship progressively shifts rightward, resulting in distinct linear trends for different GC levels. This behavior is consistent with the microstructural framework schematically presented in Figure 10. According to Case 4 of the proposed hypothesis, gravel particles are sufficiently separated from sand particles and do not participate in the force-chain network of the sand matrix beyond S C ( l i m ) (i.e., up to the GC = 20–23%). In contrast, SGMs with GC = 25, 40 and 60% correspond to Case 3, in which gravel particles actively contribute to stress transmission within the sand matrix.
Previous studies on gap-graded SGMs with GC = 0, 15 and 30 reported a linear increase in VS with increasing GC at a given V S 0   e f *   relationship for sand-dominated microstructures, classifying such mixtures as belonging to a sand-like zone [21,28]. However, such trends have not been observed in this study. Therefore, e f * alone may not be sufficient to estimate the VS of SGMs, even when the mixture exhibits a sand-dominated microstructure. This suggests the need for an alternative state parameter, such as the equivalent void ratio ( e f ( e q ) ), which explicitly accounts for the contribution of gravel particles to the force-chain mechanism in sand-dominated mixtures if S C ( t h ) <   S C <   S C ( l i m ) .
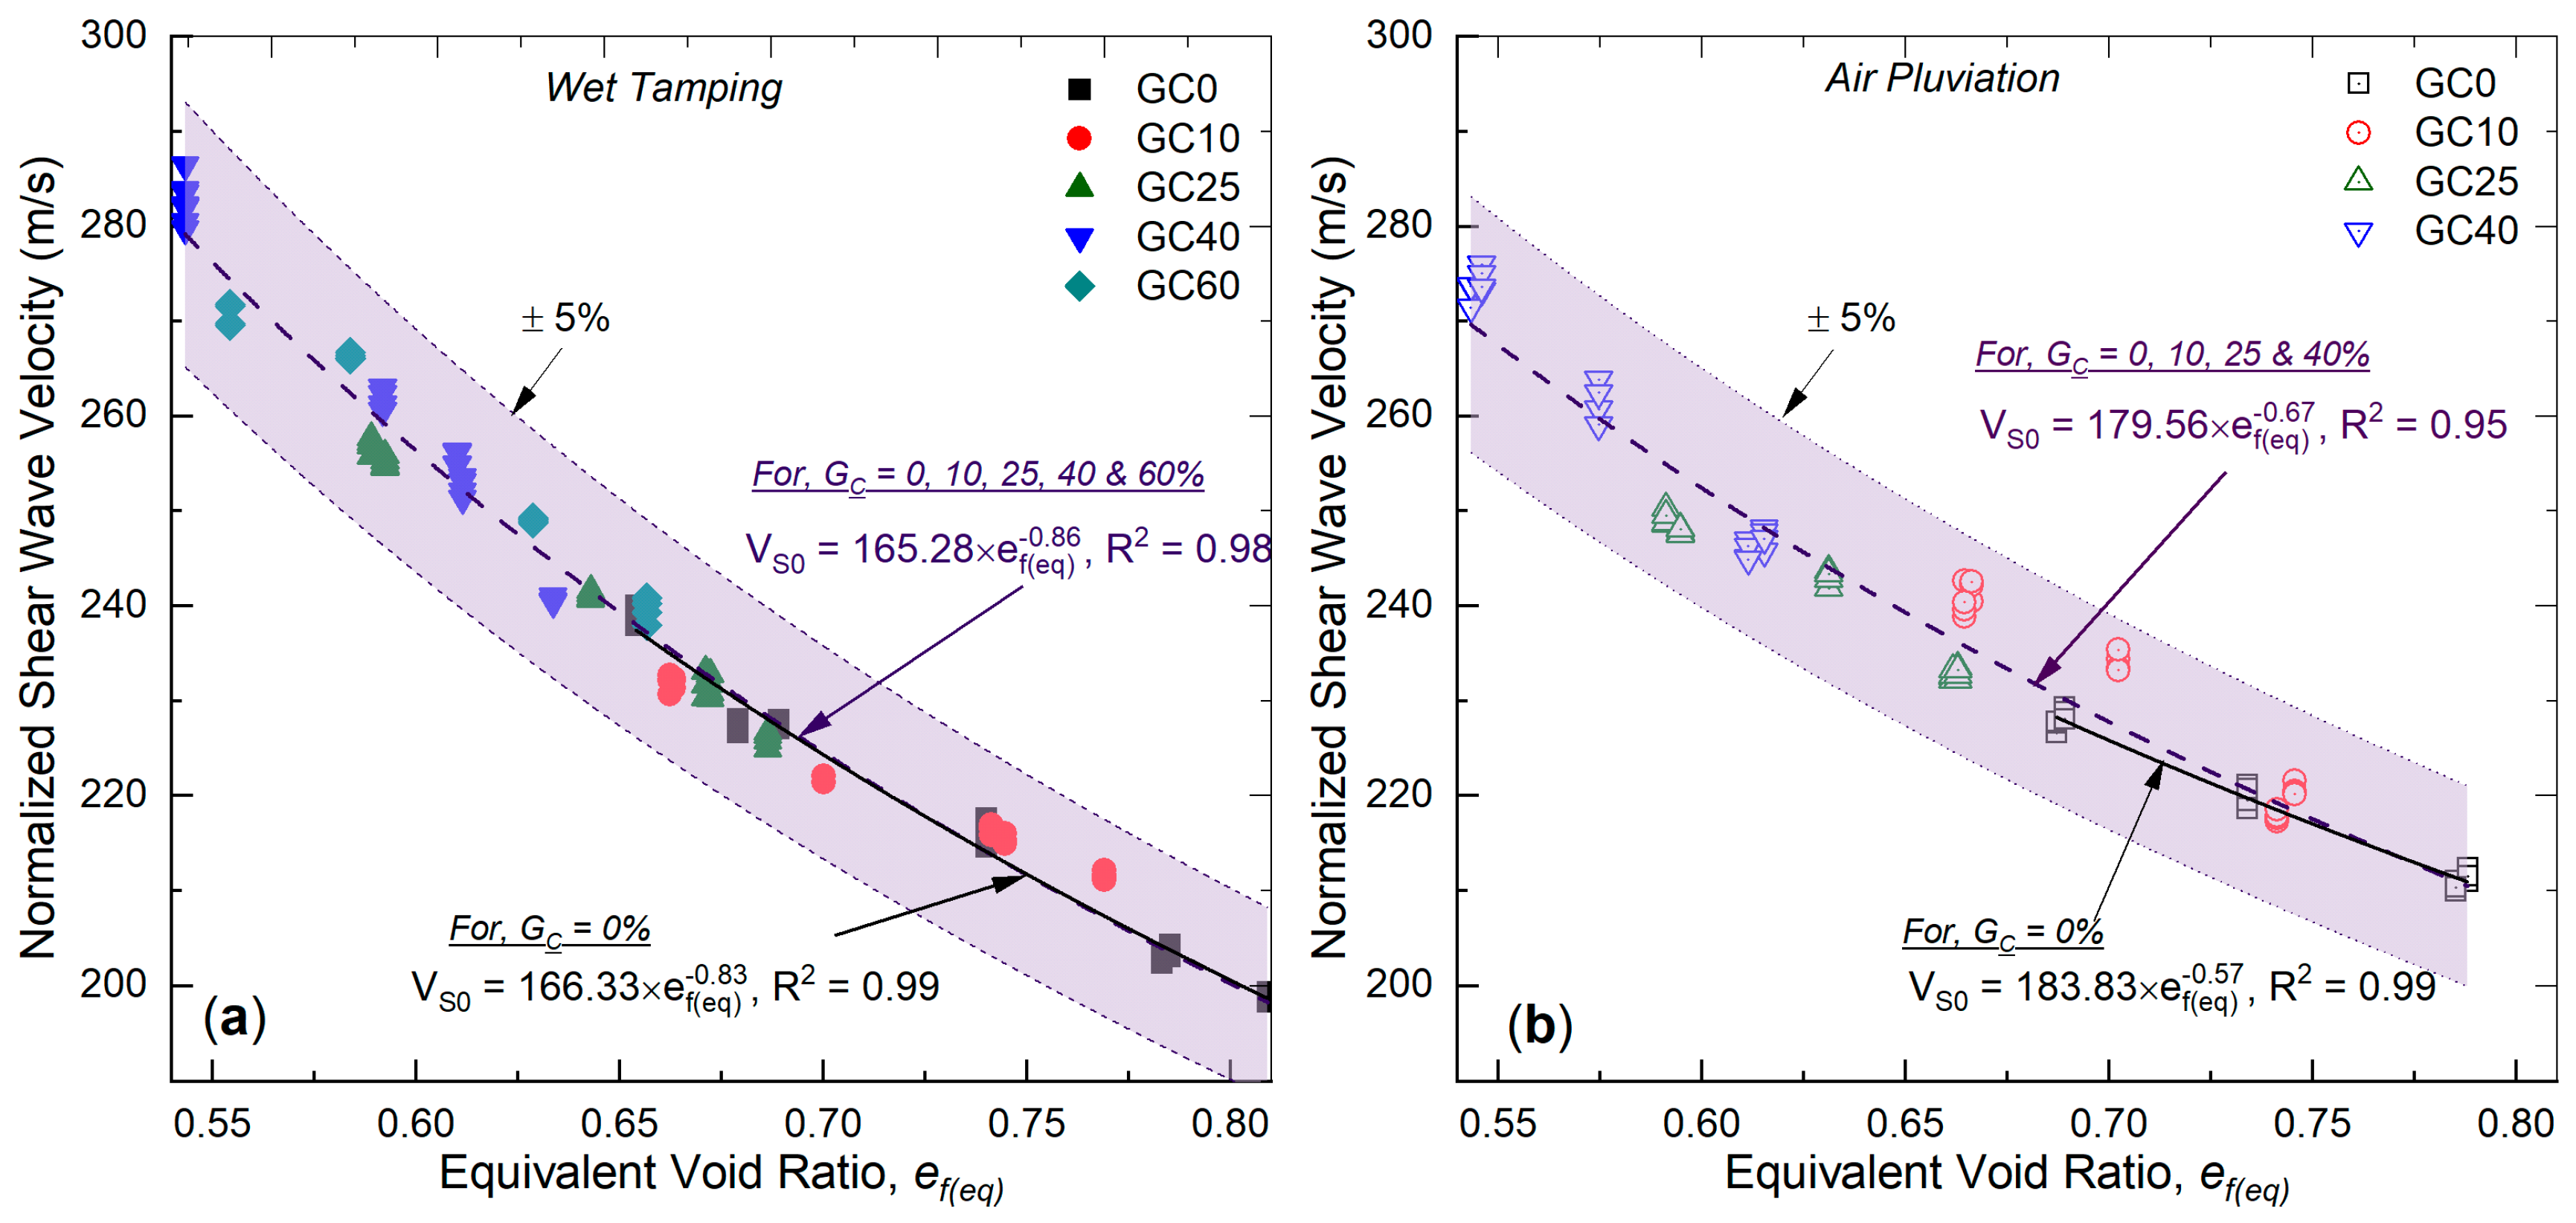
Figure 13a and Figure 13b present the variation in VS0 with e f ( e q ) for specimens prepared using the WT and AP methods, respectively. The contact index value m was back-calculated from the experimental data. Regression analysis of all the datasets indicated that a value of m = 0.3 yields the highest fitting R2 for both specimen preparation methods. The dataset includes all SGMs with sand-dominated microstructures (i.e., Cases 3 and 4). As shown in the figures, the data points collapse into a single narrow band, resulting in a unique V S 0   e f ( e q ) relationship that is independent of GC. The results indicate that V S 0   decreases nonlinearly with increasing e f ( e q ) . Accordingly, the V S 0 e f ( e q ) relationship can be described by the following power-law expression:
V S 0 = C e f ( e q ) D
where C and D are regression constants.
For the WT method, the regression constants C and D are 165.28 and 0.86 respectively, whereas for the AP method they are 179.56 and 0.67. The R2 values obtained from the nonlinear regression equations are 0.98 for the WT method and 0.95 for the AP method, indicating an excellent quality of fit. These results suggest that e f ( e q ) is a promising parameter for capturing the effect of GC on the VS of SGMs with sand-dominated microstructures. In other words, the V S 0 e f e q   relationship provides a practical and reliable framework for estimating the VS of SGMs across a wide range of GC for SGMs with sand-dominated microstructures.

6.3. Contact Indices b and m

Following Rahman and Lo [63]’s approach, in this study, Equation (7) was used to calculate index b for gravel-dominated mixtures ( S C <   S C ( t h ) ), and to convert e into e c ( e q ) , thereby accounting for the effect of S C . Accordingly, a value of b = 0.3 was determined and adopted to establish the VS0   e c ( e q ) relationships shown in Figure 11. However, the results of this study indicate that VS of SGMs with gravel-dominated microstructures can be reasonably estimated using the skeleton void ratio concept, effectively ignoring the influence of S C in SGMs. It should be noted that this observation may not be applicable to soil mixtures with different gradation characteristics.
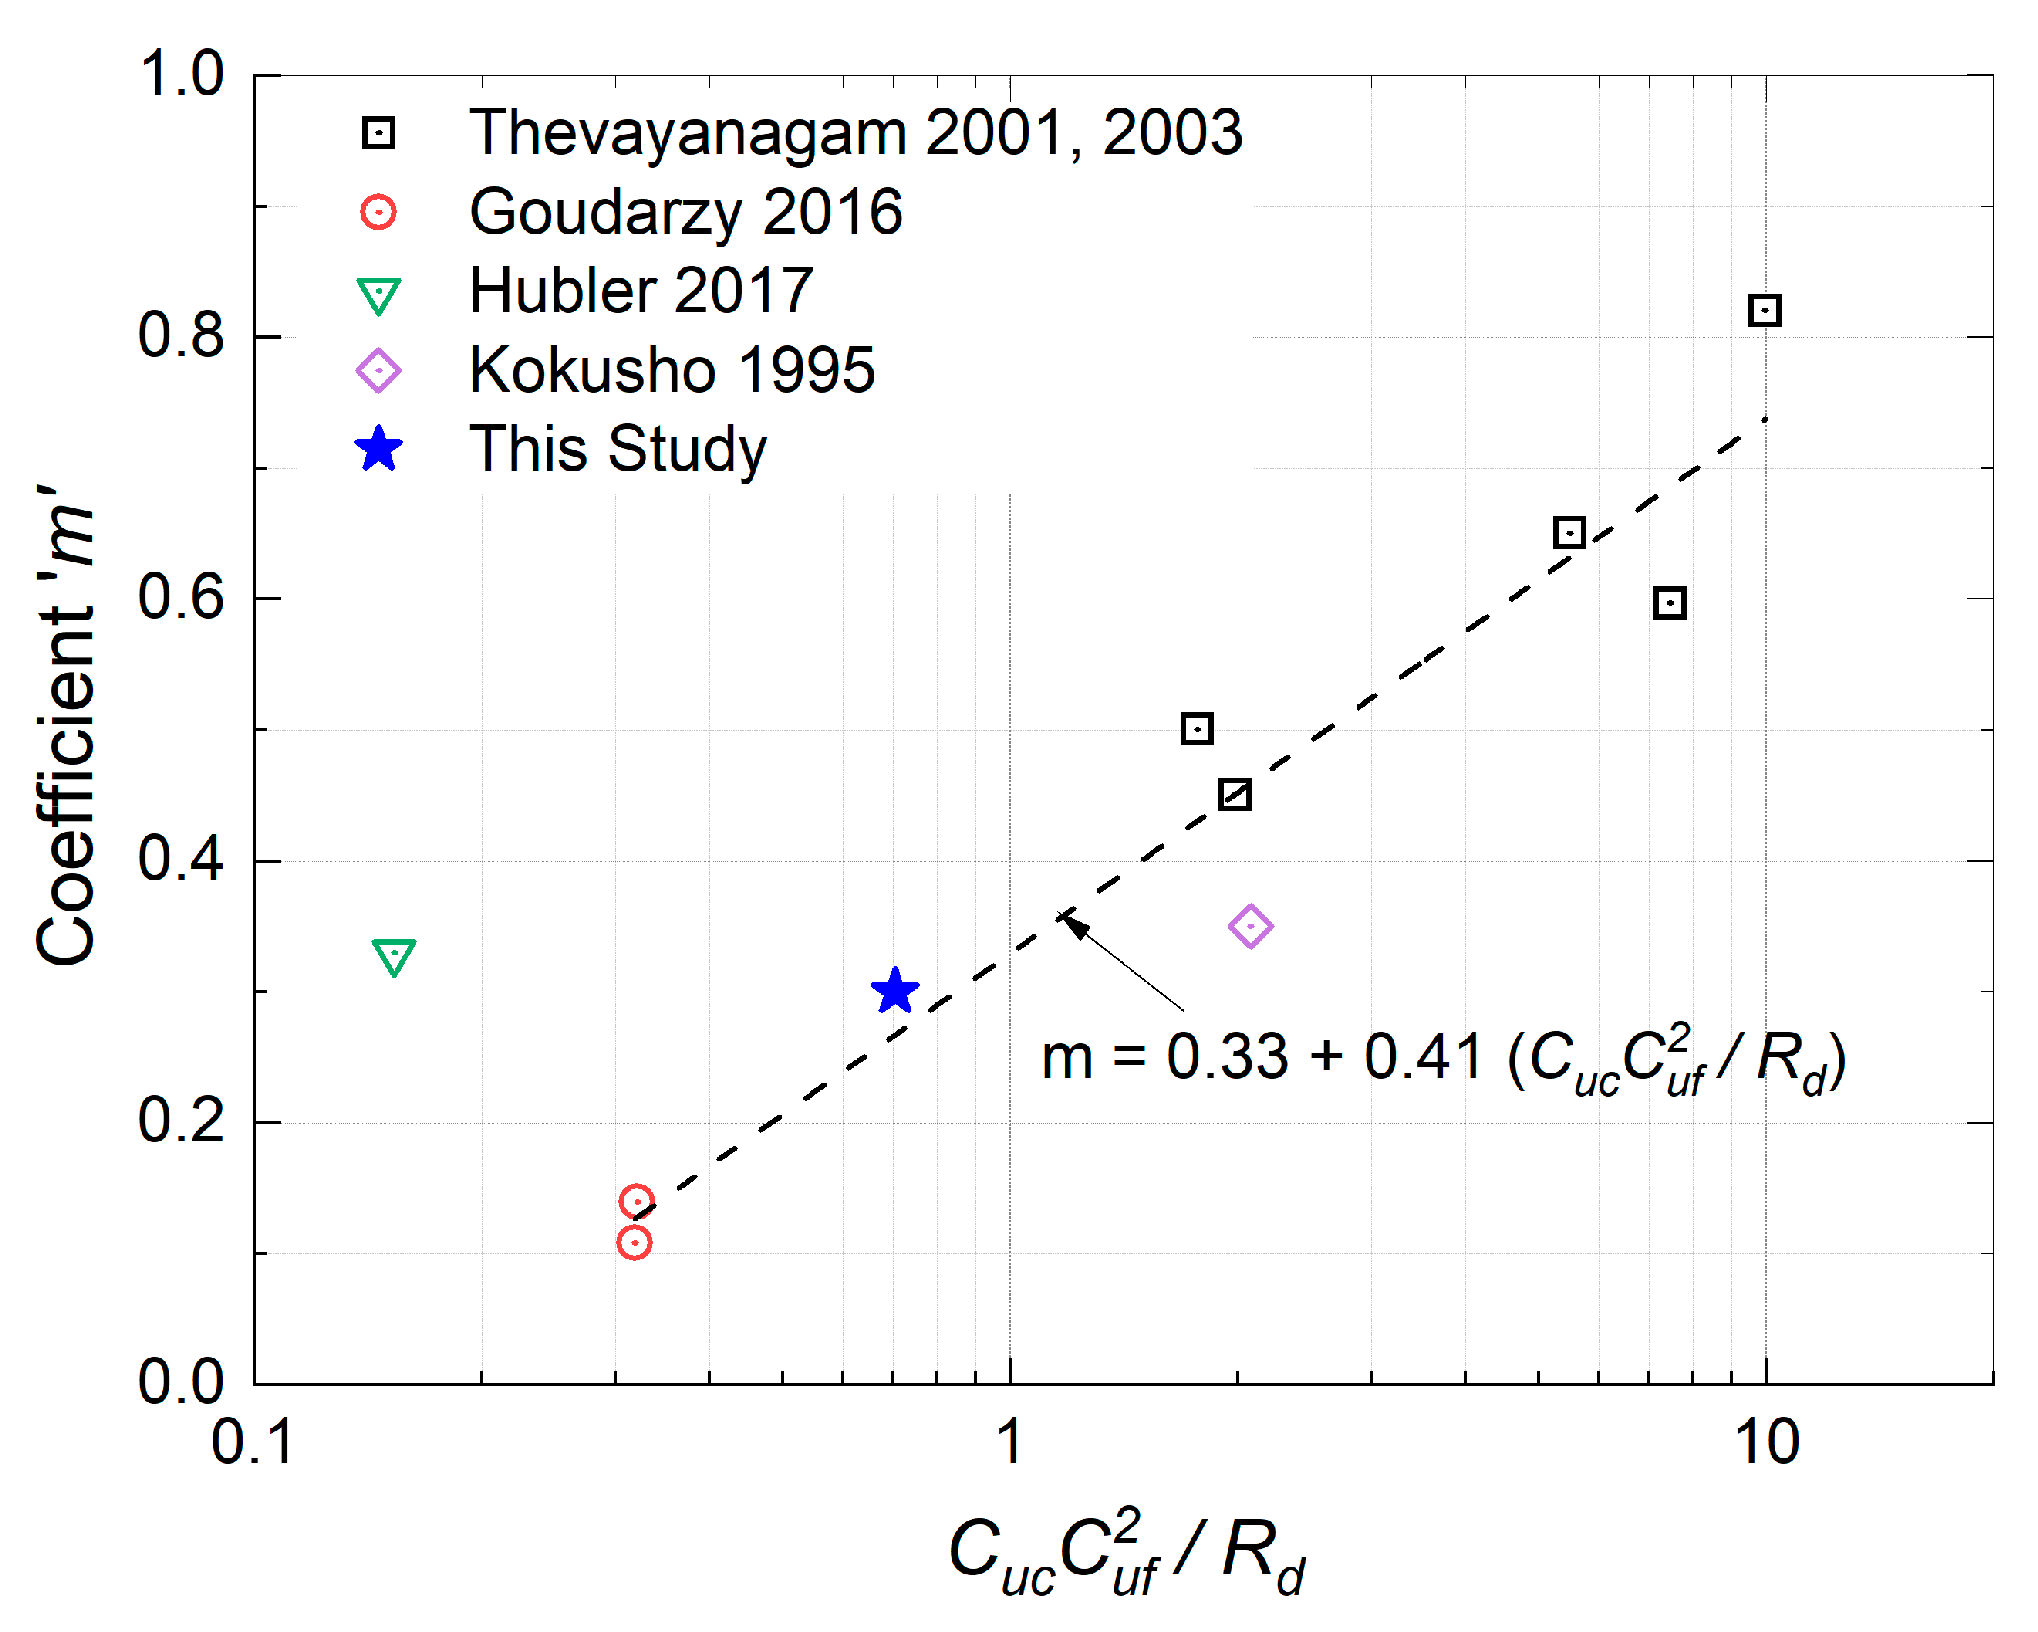
For sand-dominated mixtures ( S C >   S C ( t h ) ), the index m in Equation (8) is a function of C u c C u f 2 / R d ratio, where C u c and C u f represent the coefficient of uniformity of gravel (coarser fraction) and sand (finer fraction), respectively [65]. The value of m can be approximated using a linear relation with C u c C u f 2 / R d , as shown in Figure 14 [66]. In this study, however, m = 0.3 was determined directly from experimental data. For comparison, the value of m = 0.3 is also plotted in Figure 14, where it is shown to fit satisfactorily within the framework proposed by Thevanayagam et al. [65]. More specifically, the linear framework m C u c C u f 2 / R d predicts a value of m = 0.27 based on the grading characteristics of the materials used in this study. Although the available dataset is limited, the proposed framework appears promising for approximating m from particle grading characteristics. Nevertheless, further experimental data are required to validate and refine this relationship.

7. Soil Fabric Effect

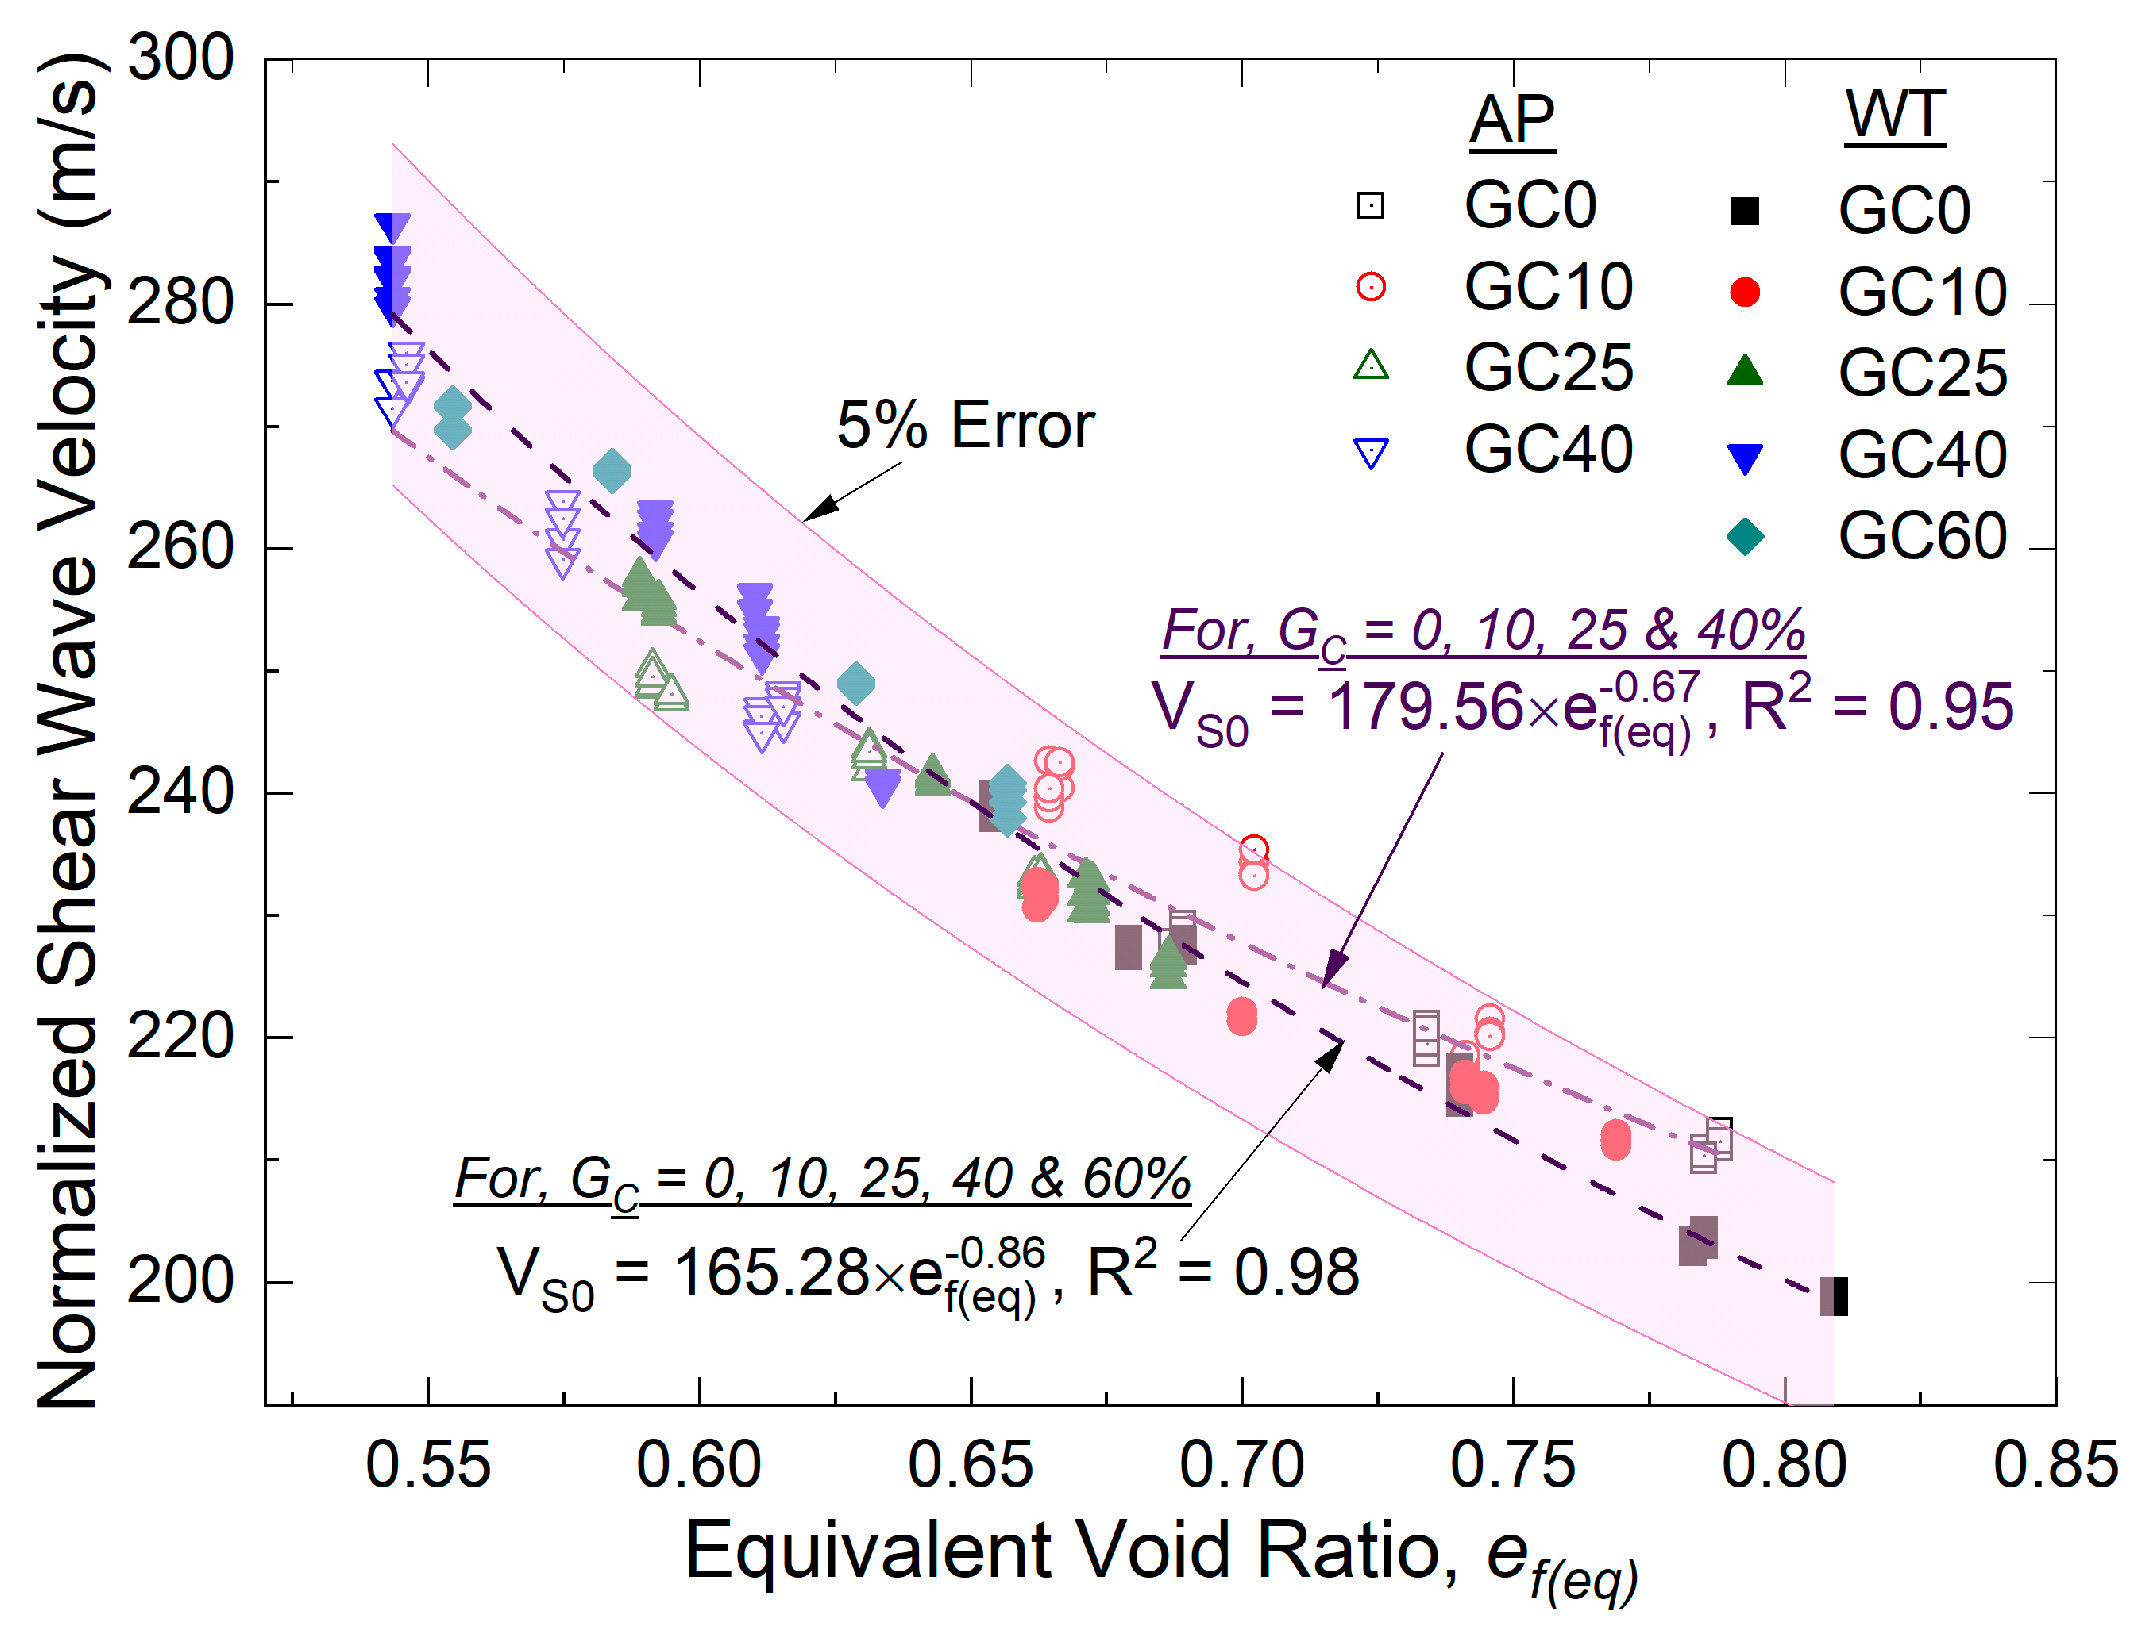
To better understand the effect of fabric on the VS of SGMs, Figure 15 combines the V S 0   e f ( e q ) relationships for sand-dominated mixtures (i.e., S C >   S C ( t h ) ) prepared using both the WT and AP methods. The V S 0   e f ( e q ) trend for AP specimens lies slightly above that of WT specimens for e f ( e q ) > 0.65 and becomes marginally lower for e f ( e q ) < 0.65. This divergence of VS0 with e f ( e q ) can be interpreted as an effect of the soil microstructure. Data points with e f ( e q ) > 0.65 mainly correspond to GC = 0 and 10% specimens, associated with the Case 4 microstructure shown in Figure 10. In contrast, data points w i t h   e f ( e q ) < 0.65 are primarily from GC = 25, 40 and 60% specimens, corresponding to the Case 3 microstructure in Figure 10.
The maximum divergence between the two trend lines is approximately 3% (i.e., AP > WT) at higher e f ( e q ) and 2.5% (i.e., AP < WT) at lower e f ( e q ) . This is consistent with the findings of Allahyari and Maleki [69], who reported that the small-strain stiffness of pure sand increases or remains unchanged with the addition of small amounts of moisture (up to 5%) but decreases with increasing GC. Notably, all V S 0   e f ( e q ) values obtained using the AP method fall within ±5% error band of those measured using the WT method.
It should be noted that this observation is limited to sand-dominated SGMs. Overall, the results indicate that under the testing conditions adopted in this study, VS is insensitive to the soil fabric induced by the WT and AP specimen preparation methods. This conclusion is in good agreement with previous studies on sands, which have shown that the small-strain shear modulus is relatively insensitive to the sample preparation including pouring, compacting, moistening, saturating, freezing and thawing [70,71].
In our study, the discrepancy is primarily attributed to differences in soil fabric and particle distribution induced by the preparation method. While WT can enhance interparticle contacts in clean, uniform sands, in the case of GC0 (a less uniform and relatively coarser sand), the WT process may promote a more heterogeneous and less efficiently packed structure. This can lead to a softer load-bearing skeleton at small strains and, consequently, a reduction in the effective stiffness governing Vs0. In contrast, AP deposition may produce a more stable granular framework, where finer particles occupy void spaces more effectively, increasing interparticle stiffness and resulting in a higher Vs0, even if the overall liquefaction resistance is lower.

7.1. Measured Versus Predicted Normalized Shear Wave Velocity

In Figure 13, the V S 0   e f ( e q )   correlation obtained for sand (i.e., GC = 0%) is shown. The V S 0   e f ( e q ) relationships for the sand matrix obtained using the WT and AP methods are as follows:
V S 0 = 166.33 e f ( e q ) 0.83
V S 0 = 182.83 e f ( e q ) 0.57
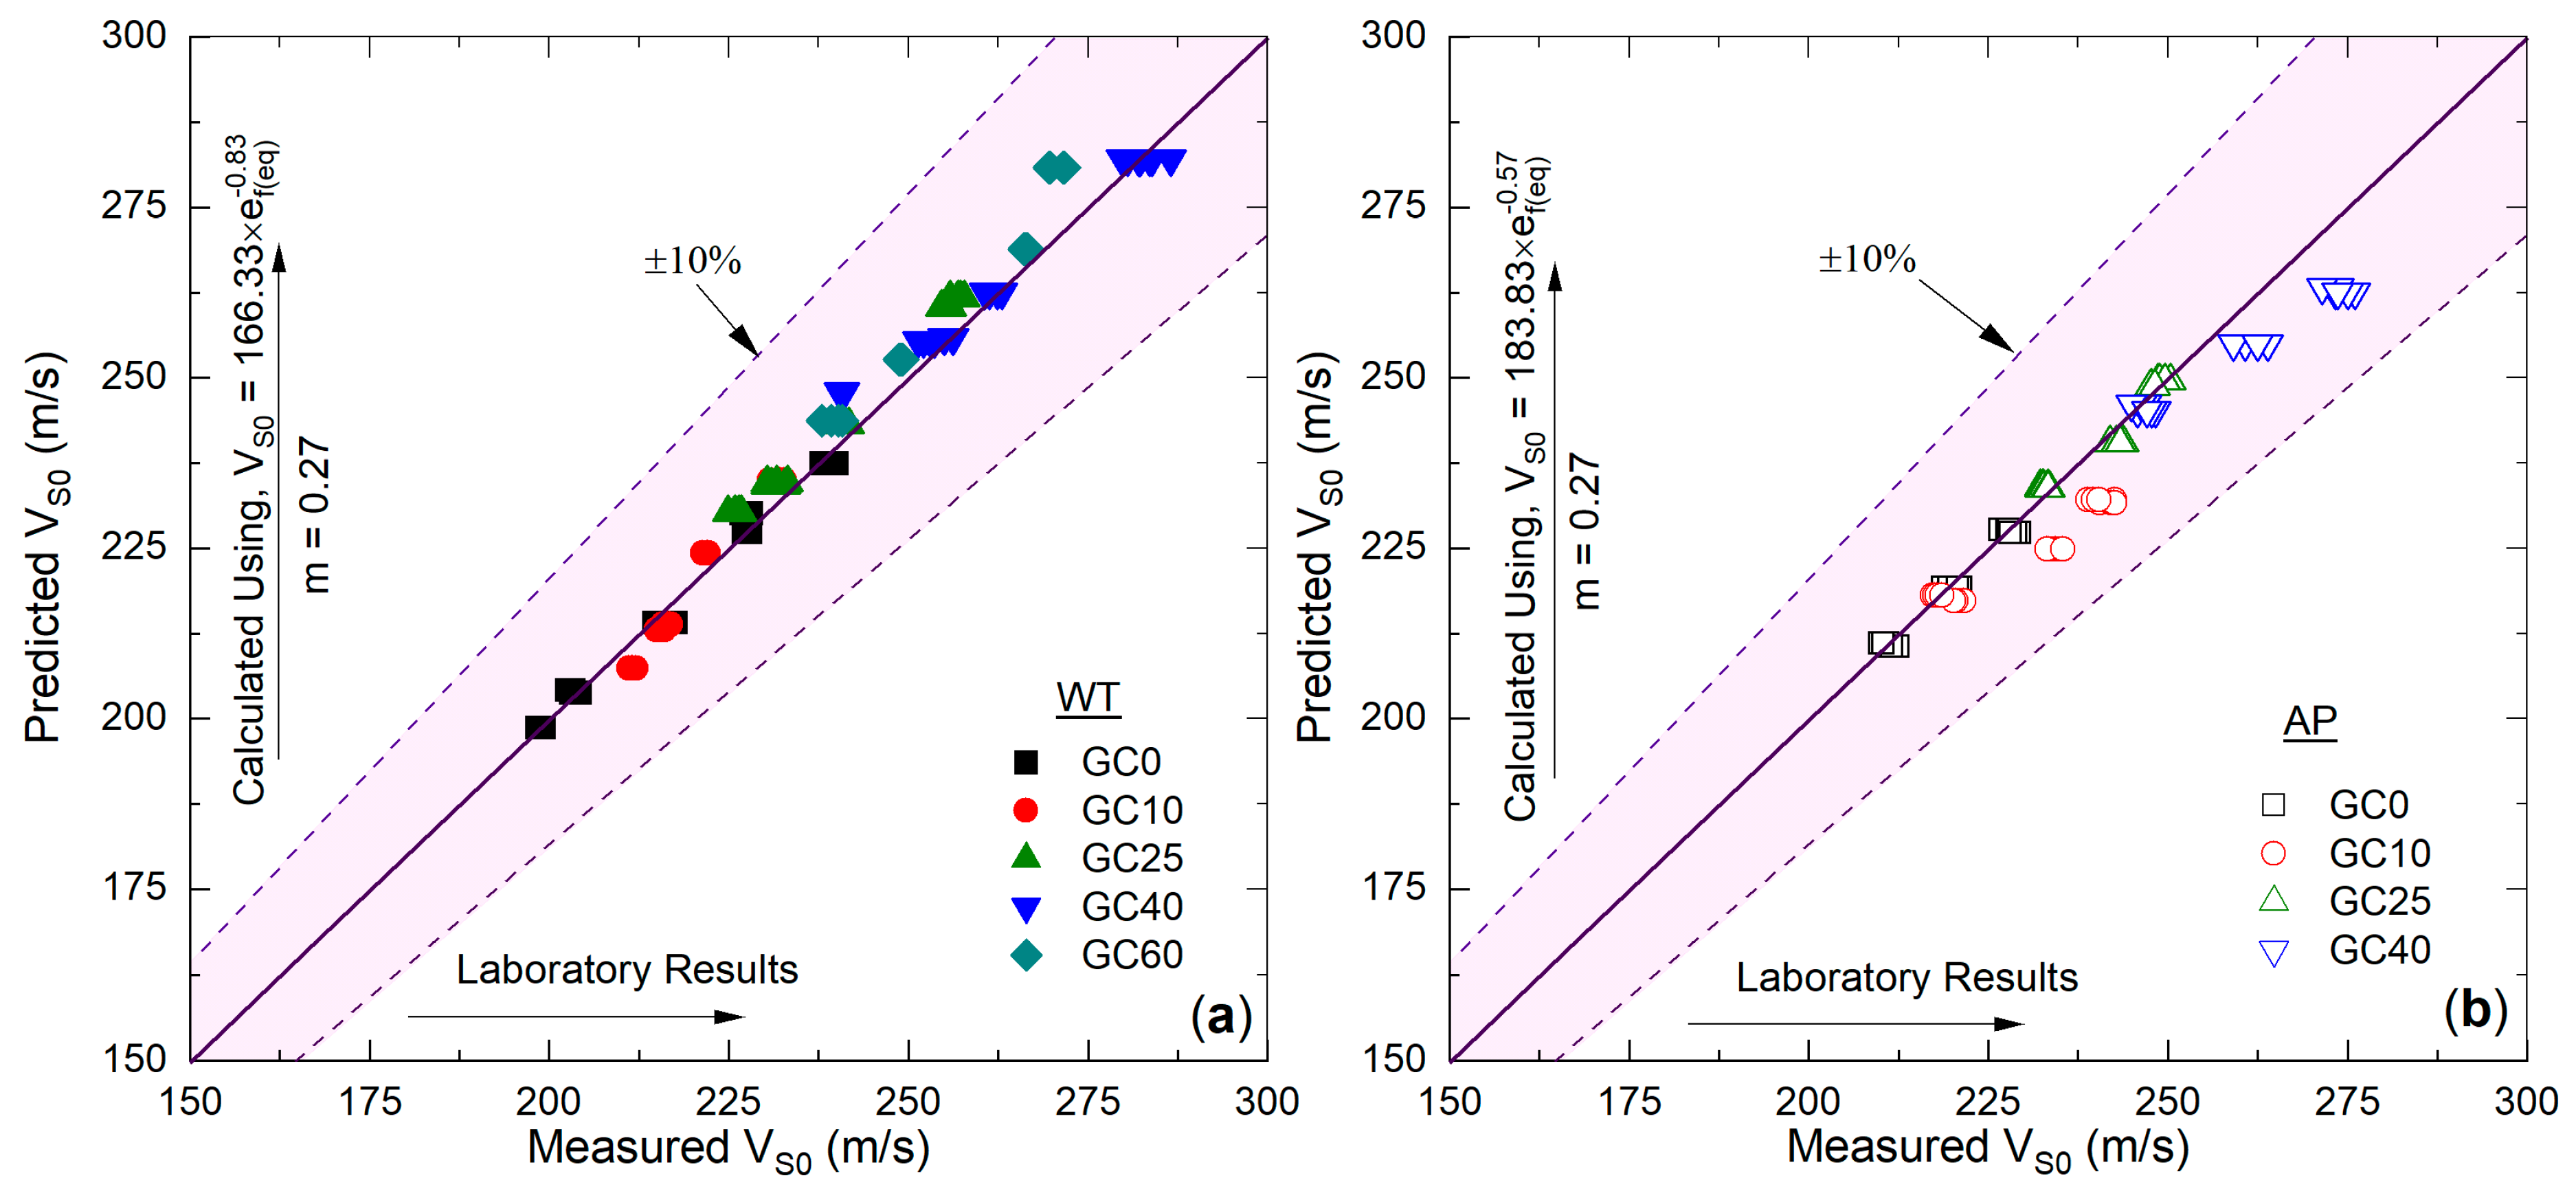
For the WT method, the a and b values for pure sand are 166.33 and 0.83 (R2 = 0.99), which are very close to those obtained by considering all the SGMs (a = 165.28; b = 0.86; R2 = 0.98). Similarly, for the AP method, the a and b values are 183.83 and 0.57 (R2 = 0.99), which are comparable to those obtained using the full dataset of SGMs (a = 179.55; b = 0.67; R2 = 0.95). Since e f ( e q ) captures the combined effect of the packing state (i.e., GC and Dr) on the VS of SGMs, VS0 is expected to be independent of GC for a given e f ( e q ) . This implies that the VS of sand-dominated SGMs can be estimated using the nonlinear correlation developed for the sand matrix alone, provided that the e f ( e q ) of SGMs is known. To examine the applicability of sand-based expression for predicting the VS0 of SGMs, VS0 values were calculated using the nonlinear regression in Equations (12) and (13) for the WT and AP methods, respectively. The e f ( e q ) values in these equations were calculated using the contact index value m = 0.27 given by the m C u c C u f 2 / R d framework shown in Figure 14.
Figure 16 compares the predicted versus laboratory-measured VS0 values for both specimen preparation methods. The results fall well within a ±10% error band, confirming the applicability of sand-based expression for predicting the VS of SGMs for GC up to Sc(th). This finding is particularly useful for estimating the VS of SGMs with varying GC based solely on particle grading characteristics of SGMs, especially in cases where experimental testing is not feasible due to particle size limitations. Furthermore, the predicted VS values may be valuable for assessing key geotechnical properties of SGMs, such as liquefaction resistance.

7.2. Possible Implications for Liquefaction-Related Studies

In clean sands, wet tamping (WT) specimens often exhibit higher liquefaction resistance than air pluviation (AP) specimens, which is commonly associated with a denser or more stable fabric and could suggest a higher initial shear wave velocity (Vs0). However, the behavior observed for GC0 in Figure 15 indicates that additional factors influence Vs0 beyond liquefaction resistance alone.
In our study, the discrepancy is primarily attributed to differences in soil fabric and particle distribution induced by the preparation method. While WT can enhance interparticle contacts in clean, uniform sands, in the case of GC0 (a less uniform and relatively coarser sand), the WT process may promote a more heterogeneous and less efficiently packed structure. This can lead to a softer load-transfer skeleton at small strains and, consequently, a reduction in the effective stiffness governing Vs0. In contrast, AP deposition may produce a more stable granular framework, where finer particles occupy void spaces more effectively, increasing interparticle stiffness and resulting in a higher Vs0, even if the overall liquefaction resistance is lower.
It is also important to note that Vs0 reflects small-strain stiffness governed by contact mechanics and fabric at very low strain levels, whereas liquefaction resistance is a large-strain phenomenon controlled by pore pressure generation, cyclic mobility, and deformation mechanisms. As such, these two properties do not necessarily vary consistently—particularly in less uniform coarser sands, where fabric effects are more complex.
Furthermore, based on an ongoing work by the authors on similar materials prepared using WT and water sedimentation (WS) [72], it has been observed that although WT specimens generally exhibit higher Vs0 than WS specimens, their liquefaction resistance can vary significantly depending on the criterion used to define liquefaction (e.g., excess pore water pressure versus shear strain). When 5% double-amplitude shear strain is adopted as the governing criterion, the differences in liquefaction resistance between preparation methods can become negligible. This is likely due to the development of strain localization during cyclic loading, which progressively destroys the initial fabric and diminishes the influence of specimen preparation.

8. Validation Using Datasets from Previous Studies

To verify the reliability of the VS e f ( e q )   correlation for SGMs, experimental data from independent and relevant studies [20,22] were examined. Hubler [20] performed VS measurements on gap-graded SGMs composed of pea gravel and Ottawa C109 sand mixtures with GC = 0, 20, 40 and 60%. The VS measurements were conducted using bender elements installed in a newly developed large-size cyclic simple shear (CSS) device under 100 kPa isotropic confining stress. Kokusho and Yoshida [22] investigated the VS0 of gravelly soils with GC = 25, 50 and 75%. In their study, shear waves of 1.5 kHz were generated by impacting a large circular steel container with an internal diameter of 2 m and a height of 1.5 m and the waves were recorded using wave sensors. Although both studies differ substantially from the present work in terms of particle grading characteristics and testing methodology, they provide valuable independent datasets for validation. The index and intergranular properties of SGMs used by Hubler [20] and Kokusho and Yoshida [22] are listed in Table 5.
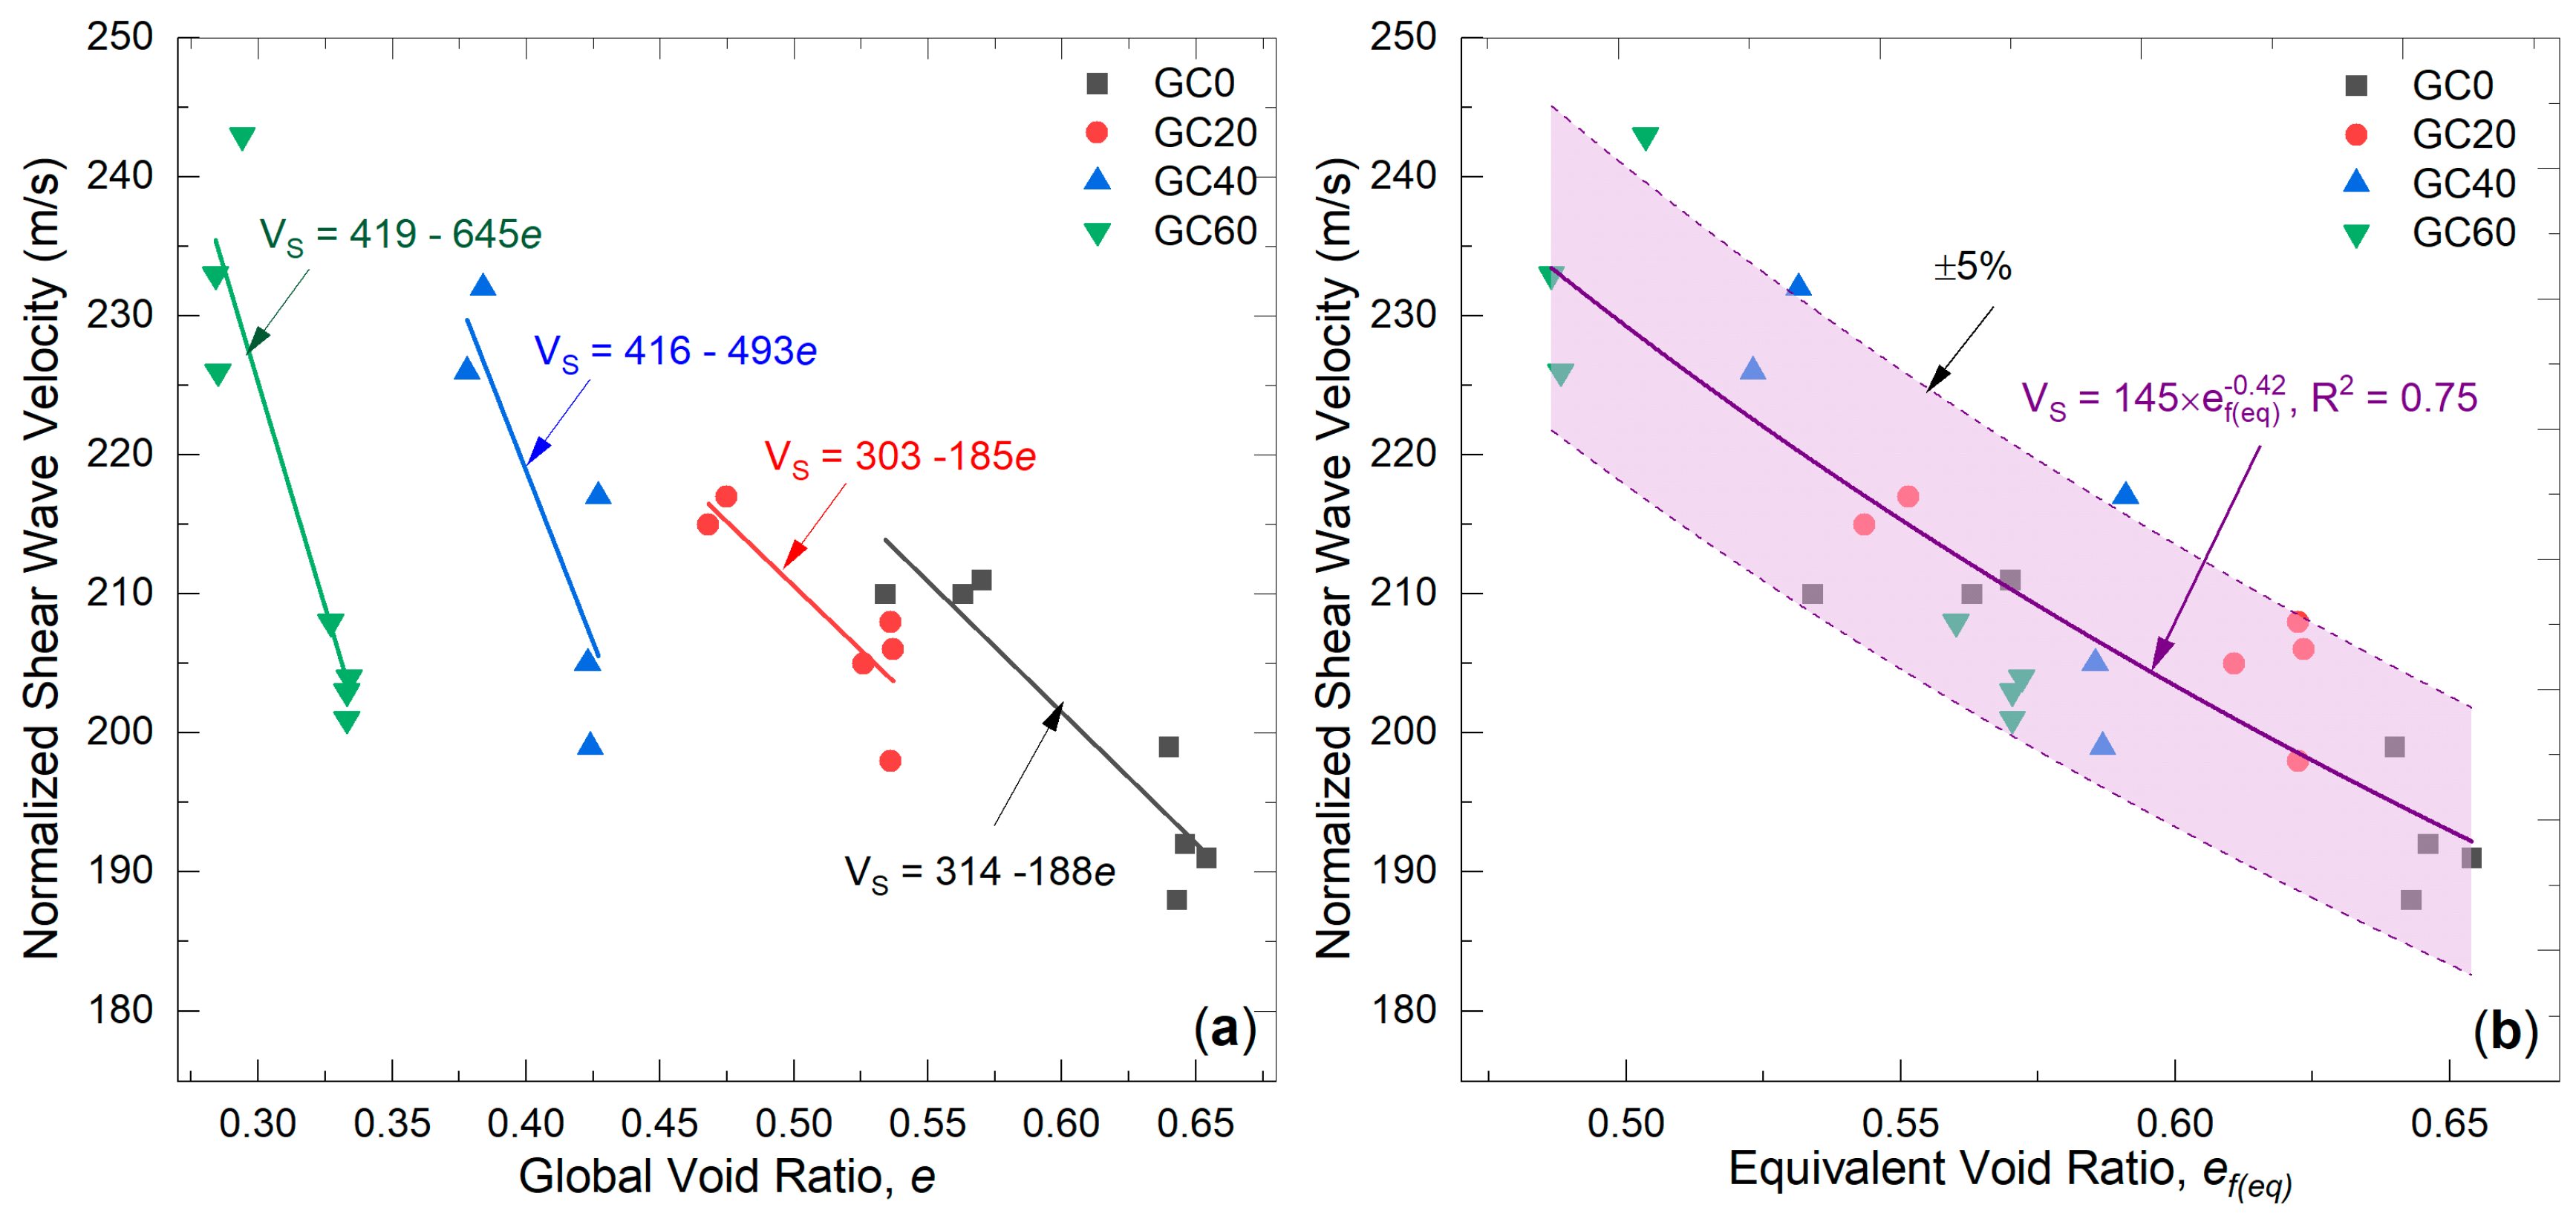
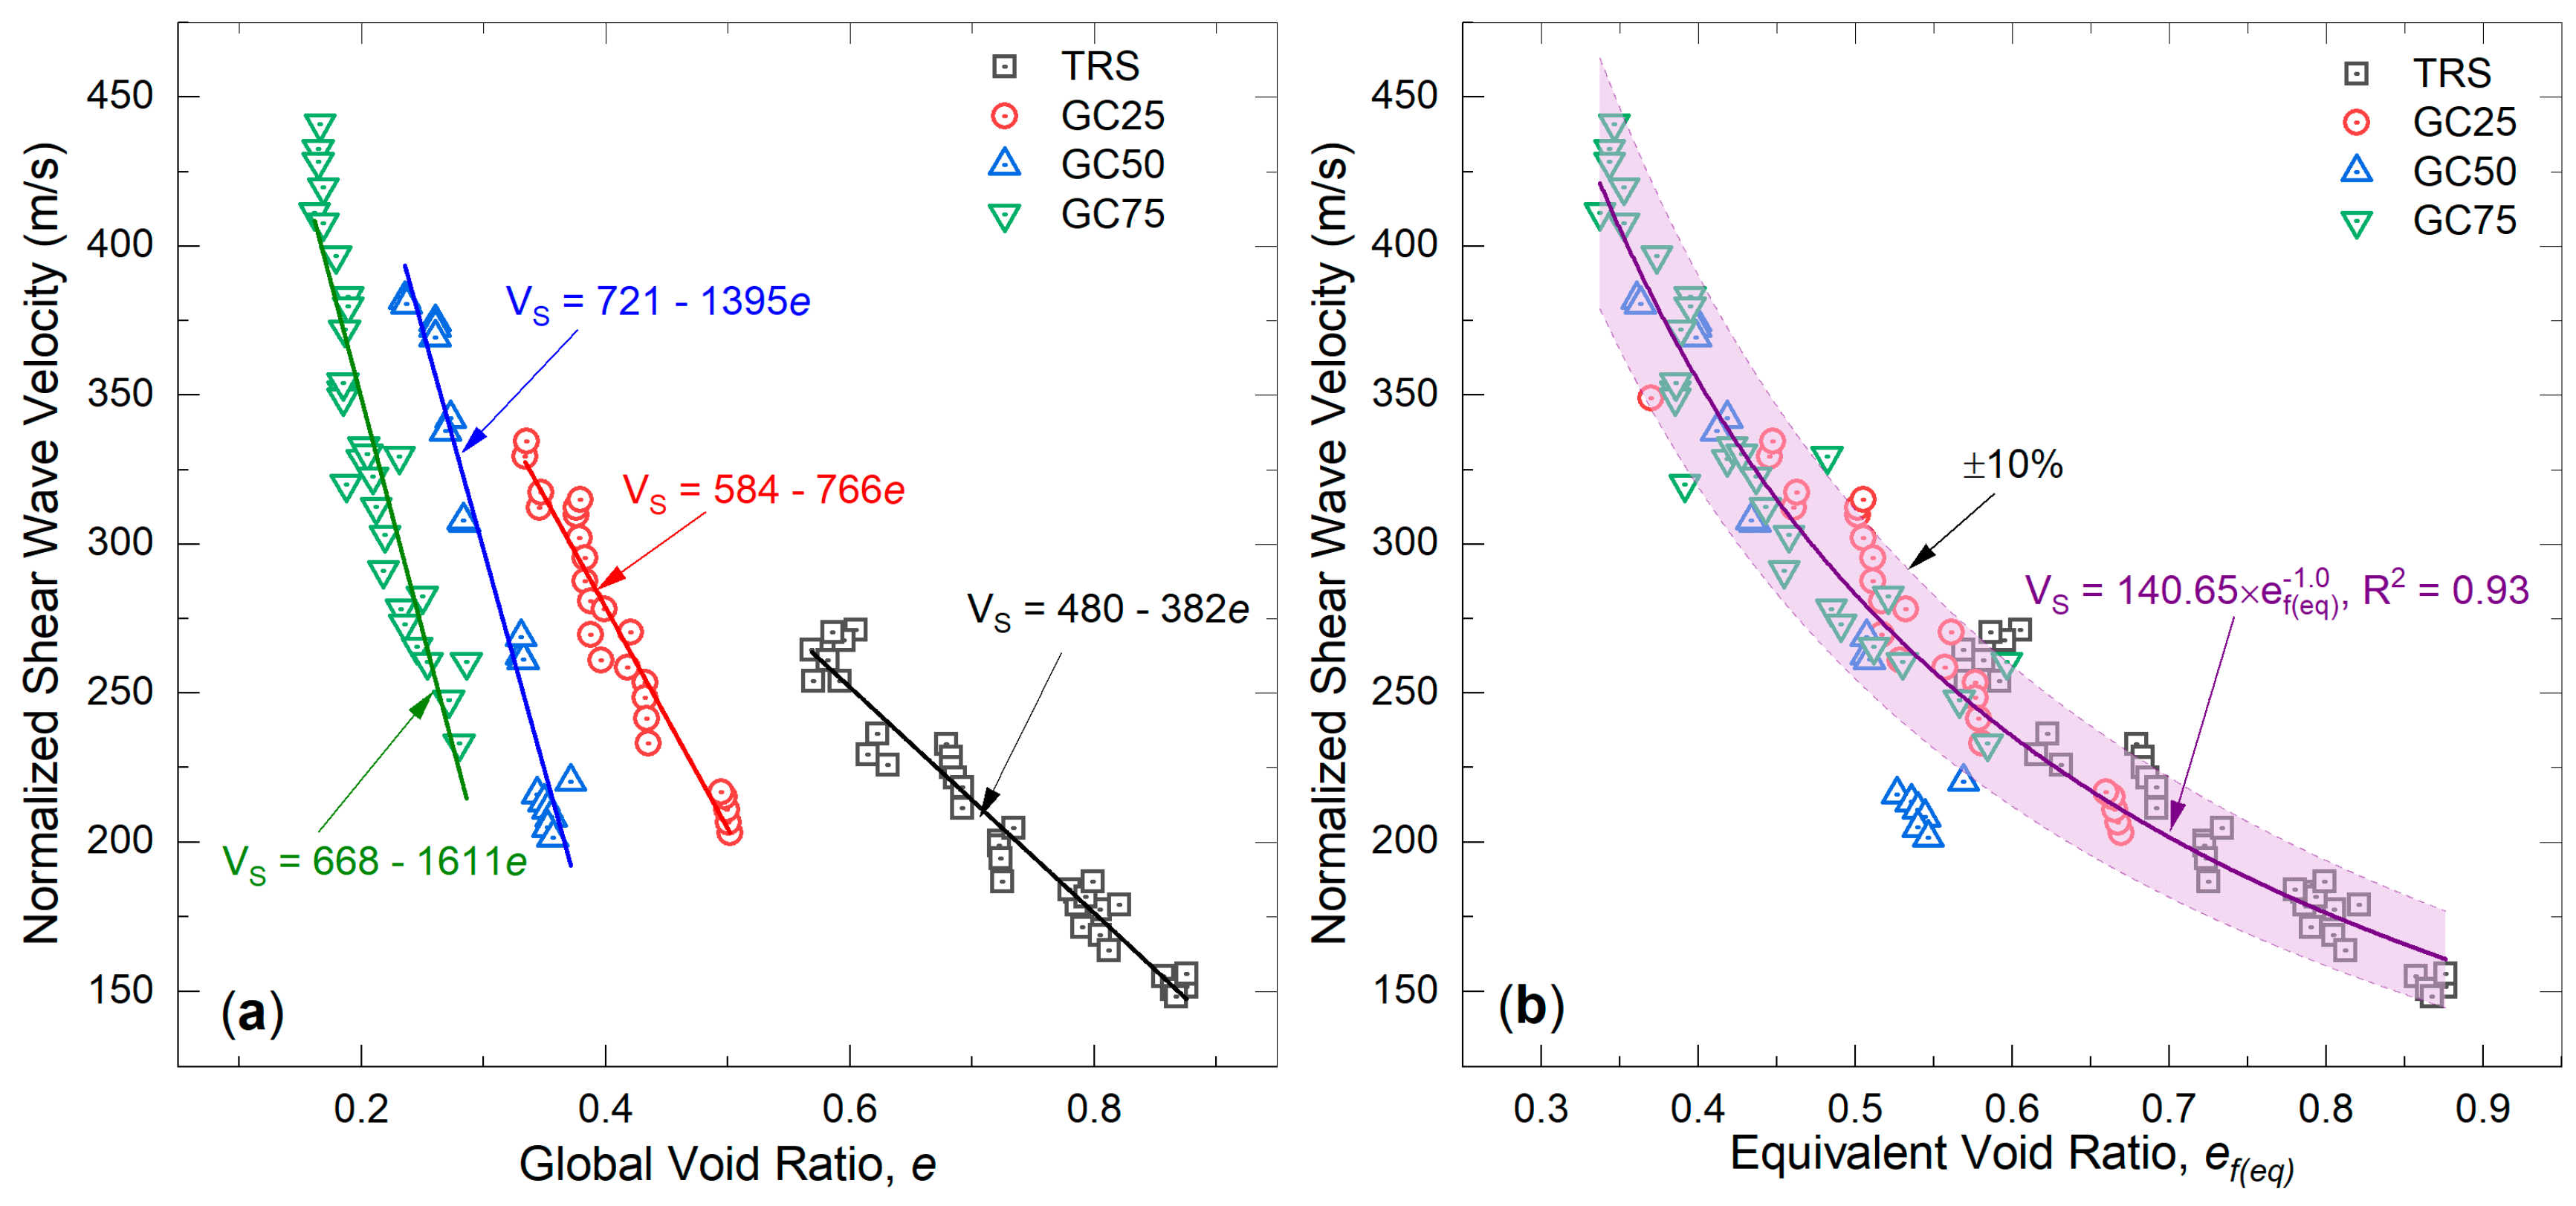
Figure 17a illustrates the variation in VS data reported by Hubler [20] with the global void ratio (e). It is evident that, for each GC, VS exhibits a linear relationship with the void ratio along with a clear leftward shift of the trend as GC increases. This observation is consistent with the findings of the present study. Similarly, the VS0 relationship with the global void ratio for gravelly soils reported by Kokusho and Yoshida [22] has a similar pattern of VS0 increase with increasing GC as shown in Figure 18a. Together, these studies confirm that the use of global Dr (or e) as a reference state parameter (i.e., VSDr or VSe relation) is not ideal for estimating VS of SGMs.
The data reported by Hubler [20] and Kokusho and Yoshida [22] were further reinterpreted using the intergranular equivalent void ratio concept to determine the VS e f ( e q ) correlations. First, the contact index m value in Equation (8) was back-calculated to achieve the highest R2 value for each study. The optimal values were found to be m = 0.33 for Hubler [20] and 0.35 for Kokusho and Yoshida [22], respectively.
Figure 17b presents the VS e f ( e q ) relationship obtained using data points reported by Hubler [20]. The VS values corresponding to different GC show a reasonable correlation with e f ( e q ) yielding an R2 value of 0.75. The relatively lower R2 value is mainly attributed to the limited number of available data points. Nevertheless, with a few exceptions, most of the measured Vs values fall within a ±5% error band. Similarly, the VS e f ( e q ) relationship derived from the data of Kokusho and Yoshida [22] is shown in Figure 18b. In this case, the VS0 data for all GC conditions collapse into a single narrow band, resulting in a high R2 value of 0.93.
The experimentally back-calculated values of m for both studies are plotted within the m C u c C u f 2 / R d framework as shown in Figure 14. The value m = 0.35 obtained for the data of Kokusho and Yoshida [22] is reasonably consistent with the predicted trend. In contrast, the value m = 0.33 corresponding to Hubler [20] deviates noticeably from the framework. This discrepancy is mainly due to the low value of C u c C u f 2 / R d = 0.15, which results in a large particle disparity ratio (Rd) of 36. These results suggest that the linear m C u c C u f 2 / R d framework may not always be suitable for gap-graded SGMs with very high Rd.
The two independent studies and the present investigation collectively confirm the robustness of e f ( e q ) in capturing the effects of the composite packing state (influenced by both GC and Dr) on the VS of SGMs, irrespective of testing methods and particle gradation characteristics for a given material. However, it should be noted that the VS e f ( e q ) relationship depends on the gradation parameters C u c , C u f and R d . Therefore, direct comparison or combination of correlations derived from SGMs with different grading characteristics may be misleading. Nonetheless, the VS e f ( e q ) framework is applicable to SGMs with S C >   S C ( t h ) (i.e., sand-dominated microstructures).

9. Conclusions

This study investigated the shear wave velocity (VS) characteristics of sand–gravel mixtures (SGMs) with seven different gravel contents (GC). VS was measured using the bender element method on dry specimens subjected to various confining stress levels (50, 100, 150 and 200 kPa). Reconstituted specimens were prepared using two specimen preparation techniques, namely wet tamping (WT) and air pluviation (AP), to examine the effect of soil fabric on the VS of SGMs.
The intergranular state framework, including skeleton void ratio and the equivalent void ratio, originally developed for sand–silt mixtures, was successfully applied to interpret the experimentally obtained (normalized) VS of SGMs. Experimental results were further validated using data from previous studies on SGMs reported in the literature.
The following conclusions can be drawn from this study:
  • The VS of SGMs is influenced by confining pressure and void ratio but appears to be insensitive to the soil fabric formed by the WT and AP methods. The differences in VS measured using two different specimen preparation methods were within the range of ±5%.
  • The stress exponent n in the normalized VS equation is approximately 0.25 for SGM specimens with sand-dominated microstructures, but is significantly higher (up to ≈0.4) for GC = 80%. For GC = 100%, n is around 0.22, similar to values observed for sand-dominated microstructures, indicating variability within gravel-dominated microstructures. These results suggest that normalization parameters should be chosen based on the microstructure of SGMs.
  • The effect of GC on VS varies from marginal to significant depending on the amount of GC and the Dr of the specimen. For low GC values (i.e., GC < 40%), a 1% increase in GC corresponds to an average 1% increase in VS.
  • For a given GC, the normalized VS varies almost linearly with global void ratio (e) but differs significantly for different GC values. The slope of the linear VSe relationships depends on the GC, highlighting the limitations of commonly used Vs − Dr (or VSe) correlations for the evaluation of the Vs of SGMs.
  • The normalized VS of SGMs with sand-dominated microstructures can be uniquely correlated with the equivalent void ratio ( e f ( e q ) ), indicating that this approach is effective for evaluating Vs in sand-dominated SGMs. Alternatively, the skeleton void ratio ( e c * ) provides a unique correlation with Vs for SGMs with gravel-dominated microstructures.

Author Contributions

Conceptualization, A.P., A.T., S.R. and G.C.; methodology, A.P., A.T., S.R. and G.C.; formal analysis, A.P.; investigation, A.P.; writing—original draft preparation, A.P.; writing—review and editing, A.T., S.R. and G.C.; visualization, A.P.; supervision, G.C.; funding acquisition, G.C. All authors have read and agreed to the published version of the manuscript.

Funding

This research was (partially) funded by QuakeCoRE, a New Zealand Tertiary Education Commission-funded center. This is QuakeCoRE publication number 11145. The first author was awarded a three-year doctoral scholarship by the University of Canterbury, New Zealand, to undertake this research. The support is gratefully appreciated.

Institutional Review Board Statement

Not Applicable.

Informed Consent Statement

Not Applicable.

Data Availability Statement

The raw data supporting the conclusions of this article will be made available by the authors on request.

Conflicts of Interest

A.P. and A.T. are employed by the company Beca Ltd. The authors declare that this study received funding from QuakeCoRE. The funder was not involved in the study design, collection, analysis, interpretation of data, the writing of this article, or the decision to submit it for publication.

Notations

A & BFitting parameters for VS0 e correlationGCGravel content
APAir pluviation methodGSSpecific gravity
bSand fraction that participates in gravel structureGmaxSmall-strain shear modulus
C & DRegression constant for V S 0 e f ( e q ) correlation G C t h Threshold gravel content
C u Coefficient of uniformity G C l i m Limiting gravel content
C c Coefficient of curvatureLLength of the specimen
C u c Coefficient of uniformity of gravelmGravel fraction that participates in sand structure
C u f Coefficient of uniformity of sandnFunction of effective confining stress
DrGlobal relative Density P a Atmospheric pressure
d50Mean diameter of the sandR2Coefficient of determination
D50Mean diameter of gravelRdParticle disparity ratio ( D 50 d 50 )
D1010% gravel particles finer than D10SCSand content
DmaxMaximum particle size of gravel S C t h Threshold sand content
eGlobal void ratio S C l i m Limiting sand content
emaxMaximum void ratioSGMsSand–gravel mixtures
eminMinimum void ratioTSShear wave travel time
e c * Inter-coarse skeleton void ratioVSShear wave velocity
e f * Inter-fine skeleton void ratioVS0Normalized shear wave velocity
e c e q Inter-coarse equivalent void ratioWTWet tamping method
e f e q Inter-fine equivalent void ratio σ 0 Effective confining pressure

References

  1. Hardin, B.O.; Drnevich, V.P. Shear Modulus and Damping in Soils: Measurement and Parameter Effects. ASCE J. Soil Mech. Found. Div. 1972, 98, 603–624. [Google Scholar] [CrossRef] [Scilit]
  2. Shirley, D.J.; Hampton, L.D. Shear-wave measurements in laboratory sediments. J. Acoust. Soc. Am. 1978, 63, 607–613. [Google Scholar] [CrossRef] [Scilit]
  3. Hardin, B.O.; Richart, F.E.J. Elastic Wave Velocities in Granular Soils. J. Soil Mech. Found. Div. 1963, 81, 33–65. [Google Scholar] [CrossRef] [Scilit]
  4. Iwasaki, T.; Tatsuoka, F. Effects of Grain Size and Grading on Dynamic Shear Moduli of Sands. Soils Found. 1977, 17, 19–35. [Google Scholar] [CrossRef] [Scilit] [PubMed]
  5. Hussien, M.N.; Karray, M. Shear wave velocity as a geotechnical parameter: An overview. Can. Geotech. J. 2016, 53, 252–272. [Google Scholar] [CrossRef] [Scilit]
  6. Thevanayagam, S.; Shenthan, T.; Mohan, S.; Liang, J. Undrained Fragility of Clean Sands, Silty Sands, and Sandy Silts. J. Geotech. Geoenviron. Eng. 2002, 128, 849–859. [Google Scholar] [CrossRef] [Scilit]
  7. Pokhrel, A.; Chiaro, G.; Kiyota, T.; Cubrinovski, M. Liquefaction characteristics of sand-gravel mixtures: Experimental observations and its assessment based on intergranular state concept. Soils Found. 2024, 64, 101444. [Google Scholar] [CrossRef] [Scilit]
  8. Cubrinovski, M.; Bray, J.D.; De La Torre, C.; Olsen, M.J.; Bradley, B.A.; Chiaro, G.; Stocks, E.; Wotherspoon, L. Liquefaction effects and associated damages observed at the Wellington Centerport from the 2016 Kaikoura Earthquake. Bull. N. Z. Soc. Earthq. Eng. 2017, 50, 152–173. [Google Scholar] [CrossRef] [Scilit]
  9. Chiaro, G.; Stringer, M.; Wotherspoon, L.; Stolte, A.; Pokhrel, A. Site Characterisation and Liquefaction Potential of Blenheim Gravelly Sandy Deposits; Earthquake Commission: Chistchurch, New Zealand, 2022.
  10. Pokhrel, A.; Chiaro, G. Pore Water Pressure Generation and Energy Dissipation Characteristics of Sand—Gravel Mixtures Subjected to Cyclic Loading. Geotechnics 2024, 4, 1282–1303. [Google Scholar] [CrossRef] [Scilit]
  11. Flora, A.; Lirer, S. Small Strain Shear Modulus of Undisturbed Gravelly Soils During Undrained Cyclic Triaxial Tests. Geotech. Geol. Eng. 2013, 31, 1107–1122. [Google Scholar] [CrossRef] [Scilit]
  12. Pokhrel, A.; Chiaro, G. Correlation between liquefaction resistance and shear wave velocity of sand-gravel mixtures: An experimental investigation. Soil Dyn. Earthq. Eng. 2026, 203, 110124. [Google Scholar] [CrossRef] [Scilit]
  13. Toyota, H.; Takada, S. Effects of gravel content on liquefaction resistance and its assessment considering deformation characteristics in gravel—Mixed sand. Can. Geotech. J. 2019, 56, 1743–1755. [Google Scholar] [CrossRef] [Scilit]
  14. Thevanayagam, S.; Liang, J. Shear wave velocity relations for silty and gravely soils. Fourth Int. Conf. Recent Adv. Geotech. Earthq. Eng. Soil Dyn. 2001, 26, 1–6. [Google Scholar]
  15. Yang, J.; Liu, X. Shear wave velocity and stiffness of sand: The role of non-plastic fines. Geotechnique 2016, 66, 500–514. [Google Scholar] [CrossRef] [Scilit]
  16. Papadopoulou, A.I.; Tika, T.M. Laboratory-Based Correlation between Liquefaction Resistance and Shear Wave Velocity of Sand with Fines. Geotechnics 2021, 1, 219–242. [Google Scholar] [CrossRef] [Scilit]
  17. Li, Y.; Otsubo, M.; Ghaemi, A.; Dutta, T.T.; Kuwano, R. Transition of gap-graded soil fabric—Shear wave measurements and dispersion relation. Soils Found. 2022, 62, 101092. [Google Scholar] [CrossRef] [Scilit]
  18. NZS4402.2.8.1; Methods of Testing Soils for Civil Engineering Purposes Part 2.8.1: Soil Classification Tests-Determination of the Particle-Size Distribution-Standard Method by Wet Sieving. Standards New Zealand (SNZ): Wellington, New Zealand, 1986.
  19. Lin, S.Y.; Lin, P.S.; Luo, H.S.; Juang, C.H. Shear modulus and damping ratio characteristics of gravelly deposits. Can. Geotech. J. 2000, 37, 638–651. [Google Scholar] [CrossRef]
  20. Hubler, J.F. Laboratory and In-Situ Assessment of Liquefaction of Gravelly Soils. Ph.D. Thesis, The University of Michigan, Ann Arbor, MI, USA, 2017. [Google Scholar]
  21. Chang, W.J.; Chang, C.W.; Zeng, J.K. Liquefaction characteristics of gap-graded gravelly soils in K0 condition. Soil Dyn. Earthq. Eng. 2014, 56, 74–85. [Google Scholar] [CrossRef] [Scilit]
  22. Kokusho, T.; Yoshida, Y. SPT N-value and S-wave velocity for gravelly soils with different grain size distribution. Soils Found. 1997, 37, 105–113. [Google Scholar] [CrossRef] [Scilit]
  23. Kokusho, T.; Yoshida, Y.; Tanaka, Y. Static and Dynamic Properties of Gravelly Soils with Different Particle Gradings. In Proceedings of the ASCE National Convention, Geotechnical Special Publication; American Society of Civil Engineers (ASCE): Reston, VA, USA, 1995; pp. 91–106. [Google Scholar]
  24. JGS 0111-2009; JGS0111-Test Method for Density of Soil Particles. Japanese Geotechnical Society: Tokyo, Japan, 2009.
  25. JGS 0161-2009; JGS0161-Test Method for Minimum & Maximum Densities of Sands. Japanese Geotechnical Society: Tokyo, Japan, 2009.
  26. JGS 0162-2009; JGS0162-Test Method for Minimum & Maximum Densities of Gravels. Japanese Geotechnical Society: Tokyo, Japan, 2009.
  27. Thevanayagam, S. Effect of Fines and Confining Stress on Undrained Shear Strength of Silty Sands. J. Geotech. Geoenviron. Eng. 1998, 124, 479–491. [Google Scholar] [CrossRef] [Scilit]
  28. Chang, W.J. Evaluation of Liquefaction Resistance for Gravelly Sands Using Gravel Content–Corrected Shear-Wave Velocity. J. Geotech. Geoenviron. Eng. 2016, 142, 04016002. [Google Scholar] [CrossRef] [Scilit]
  29. Chen, G.; Wu, Q.; Sun, T.; Zhao, K.; Zhou, E.; Xu, L.; Zhou, Y. Cyclic Behaviors of Saturated Sand-Gravel Mixtures under Undrained Cyclic Triaxial Loading. J. Earthq. Eng. 2018, 25, 756–789. [Google Scholar] [CrossRef] [Scilit]
  30. Oda, M. Initial fabrics and their relations to mechanical properties of granular material. Soils Found. 1972, 12, 17–36. [Google Scholar] [CrossRef] [Scilit]
  31. Arthur, J.R.F.; Menzies, B.K. Inherent anisotropy in a sand. Geotechnique 1972, 22, 115–128. [Google Scholar] [CrossRef] [Scilit]
  32. Sze, H.Y.; Yang, J. Failure modes of sand in undrained cyclic loading: Impact of sample preparation. J. Geotech. Geoenviron. Eng. 2014, 140, 152–169. [Google Scholar] [CrossRef] [Scilit]
  33. JGS 0520-2009; JGS0520-Preparation of Soil Specimens for Triaxial Tests. Japanese Geotechnical Society: Tokyo, Japan, 2009.
  34. Ishihara, K. Liquefaction and flow failure during earthquakes. Geotechnique 1993, 43, 351–451. [Google Scholar] [CrossRef] [Scilit]
  35. Chan, C.K. Electropneumatic Cyclic Loading System. Geotech. Test. J. 1981, 4, 183–187. [Google Scholar] [CrossRef] [Scilit]
  36. Evans, M.D.; Zhou, S. Liquefaction behavior of sand-gravel composites. J. Geotech. Eng. 1995, 121, 287–298. [Google Scholar] [CrossRef] [Scilit]
  37. Wicaksono, R.I. Elastic Wave Measurement and Evaluation of Mechanical Behavior of Bound and Unbound Geomaterials. Ph.D. Thesis, The University of Tokyo, Tokyo, Japan, 2010. [Google Scholar]
  38. Yang, J.; Gu, X.Q. Shear stiffness of granular material at small strains: Does it depend on grain size? Geotechnique 2013, 63, 165–179. [Google Scholar] [CrossRef] [Scilit]
  39. Chen, G.; Wu, Q.; Zhao, K.; Shen, Z.; Yang, J. A Binary Packing Material–Based Procedure for Evaluating Soil Liquefaction Triggering during Earthquakes. J. Geotech. Geoenviron. Eng. 2020, 146, 04020040. [Google Scholar] [CrossRef] [Scilit]
  40. Yamashita, S.; Kawaguchi, T.; Nakata, Y.; Mikamt, T.; Fujiwara, T.; Shibuya, S. Interpretation of international parallel test on the measurement of G max using bender elements. Soils Found. 2009, 49, 631–650. [Google Scholar] [CrossRef] [Scilit]
  41. Suwal, L.P.; Kuwano, R. Disk shaped piezo-ceramic transducer for P and S wave measurement in a laboratory soil specimen. Soils Found. 2013, 53, 510–524. [Google Scholar] [CrossRef] [Scilit]
  42. Dutta, T.T.; Otsubo, M.; Kuwano, R.; O’Sullivan, C. Stress wave velocity in soils: Apparent grain-size effect and optimum input frequencies. Geotech. Lett. 2019, 9, 340–347. [Google Scholar] [CrossRef] [Scilit]
  43. Dutta, T.T.; Otsubo, M.; Kuwano, R. Stress wave transmission and frequency-domain responses of gap-graded cohesionless soils. Soils Found. 2021, 61, 857–873. [Google Scholar] [CrossRef] [Scilit]
  44. Arroyo, M.; Wood, D.M.; Greening, P.D. Source near-field effects and pulse tests in soil samples. Geotechnique 2003, 53, 337–345. [Google Scholar] [CrossRef]
  45. Liu, X.; Zou, D.; Liu, J.; Zheng, B. Predicting the small strain shear modulus of coarse-grained soils. Soil Dyn. Earthq. Eng. 2021, 141, 106468. [Google Scholar] [CrossRef] [Scilit]
  46. Pokhrel, A.; Kuwano, R.; Suwal, L.P. Development of large size Disk Transducer to evaluate elastic properties of coarse granular materials. In Proceedings of the 6th International Symposium on Deformation Characteristics of Geomaterials, IS-Buenos Aires 2015, Buenos Aires, Argentina, 15–18 November 2015; Volume 6. [Google Scholar]
  47. Huang, Y.T.; Huang, A.B.; Kuo, Y.C.; Tsai, M.D. A laboratory study on the undrained strength of a silty sand from Central Western Taiwan. Soil Dyn. Earthq. Eng. 2004, 24, 733–743. [Google Scholar] [CrossRef] [Scilit]
  48. Wichtmann, T.; Triantafyllidis, T. Influence of the Grain-Size Distribution Curve of Quartz Sand on the Small Strain Shear Modulus Gmax. J. Geotech. Geoenviron. Eng. 2009, 135, 1404–1418. [Google Scholar] [CrossRef] [Scilit]
  49. Goto, S.; Sayamoto, Y.; Tamaoki, S. Dynamics properties of undisturbed gravel samples obtained by the in situ freezing method. In Proceedings of the 8th Asian Regional Conference on Soil Mechanics and Foundation Engineering, Kyoto; Japanese Geotechnical Society: Tokyo, Japan, 1987; pp. 233–236. [Google Scholar]
  50. Nishio, S.; Tamaoki, K.; Shamoto, Y.; Goto, S.; Baba, K. Measurement of S-wave velocity in large scale triaxial cell. In Proceedings of the 22nd Annual Conference of Japanese Geotechnical Society; Japanese Geotechnical Society: Tokyo, Japan, 1987; pp. 511–514. (In Japanese) [Google Scholar]
  51. Tanaka, Y.; Kudo, K.; Yoshida, Y.; Ikemi, M. A Study on the Mechanical Properties of Sandy Gravel-Dynamic Properties of Reconstituted Sample; Central Research Institute of Electric Power Industry: Tokyo, Japan, 1988. [Google Scholar]
  52. Ishihara, K. Soil Behaviour in Earthquake Geotechnics; Oxford University Press: Oxford, UK, 1996. [Google Scholar]
  53. Kokusho, T.; Tanaka, Y. Dynamic properties of gravel layers investigated by in-situ freezing sampling. In Proceedings of the ASCE Specialty Conference on Ground Failures under Seismic Conditions; American Society of Civil Engineers (ASCE): Reston, VA, USA, 1994; pp. 120–140. [Google Scholar]
  54. Salgado, R.; Bandini, P.; Karim, A. Shear strength and Stiffness of silty sand. Manager 2000, 126, 451–462. [Google Scholar] [CrossRef] [Scilit]
  55. Wichtmann, T.; Navarrete Hernández, M.A.; Triantafyllidis, T. On the influence of a non-cohesive fines content on small strain stiffness, modulus degradation and damping of quartz sand. Soil Dyn. Earthq. Eng. 2015, 69, 103–114. [Google Scholar] [CrossRef] [Scilit]
  56. Otsubo, M.; O’Sullivan, C.; Hanley, K.J.; Sim, W.W. Influence of packing density and stress on the dynamic response of granular materials. Granul. Matter 2017, 19, 50. [Google Scholar] [CrossRef] [Scilit]
  57. Mitchell, J.K.; Soga, K. Fundamentals of Soil Behavior; John Wiley & Sons: Hoboken, NJ, USA, 2005; ISBN 0471463027. [Google Scholar]
  58. Lade, P.V.; Liggio, C.D.; Yamamuro, J.A. Effects of Non-Plastic Fines on Minimum and Maximum Void Ratios of Sand. Geotech. Test. J. 1998, 21, 336–347. [Google Scholar] [CrossRef] [Scilit]
  59. Rahman, M.M.; Lo, S.R.; Gnanendran, C.T. Reply to the discussion by wanatowski and chu on “on equivalent granular void ratio and steady state behaviour of loose sand with fines”. Can. Geotech. J. 2009, 46, 483–486. [Google Scholar] [CrossRef] [Scilit]
  60. Zuo, L.; Baudet, B.A. Determination of the transitional fines content of sand-non plastic fines mixtures. Soils Found. 2015, 55, 213–219. [Google Scholar] [CrossRef] [Scilit]
  61. Pokhrel, A.; Chiaro, G. Small-strain shear stiffness of sand-gravel mixtures. In Proceedings of the 8th International Symposium on Deformation Characteristics of Geomaterials, E3S Web of Conferences; EDP Sciences: Porto, Portugal, 2024; Volume 544, p. 10004. [Google Scholar]
  62. Thevanayagam, S. Liquefaction potential and undrained fragility of silty soils. In Proceedings of the 12th World Conference Earthquake Engineering; New Zealand Society of Earthquake Engineering: Wellington, New Zealand, 2000; pp. 1–8. [Google Scholar]
  63. Rahman, M.M.; Lo, S.R. The prediction of equivalent granular steady state line of loose sand with fines. Geomech. Geoengin. 2008, 3, 179–190. [Google Scholar] [CrossRef] [Scilit]
  64. Thevanayagam, S. Intergrain contact density indices for granular mixes—I: Framework. Earthq. Eng. Eng. Vib. 2007, 6, 123–134. [Google Scholar] [CrossRef] [Scilit]
  65. Thevanayagam, S.; Shenthan, T.; Kanagalingam, T. Role of Intergranular Contacts on Mechanisms Causing Liquefaction and Slope Failures in Silty Sands; University at Buffalo, State University of New York, Department of Civil, Structural, and Environmental Engineering: Buffalo, NY, USA, 2003. [Google Scholar]
  66. Goudarzy, M.; König, D.; Schanz, T. Small strain stiffness of granular materials containing fines. Soils Found. 2016, 56, 756–764. [Google Scholar] [CrossRef] [Scilit]
  67. Goudarzy, M.; Rahman, M.M.; König, D.; Schanz, T. Influence of non-plastic fines content on maximum shear modulus of granular materials. Soils Found. 2016, 56, 973–983. [Google Scholar] [CrossRef] [Scilit]
  68. Ni, Q.; Tan, T.S.; Dasari, G.R.; Hight, D.W. Discussion: Contribution of fines to the compressive strength of mixed soils. Geotechnique 2005, 55, 627–628. [Google Scholar] [CrossRef] [Scilit]
  69. Allahyari, N.; Maleki, M. Investigation into small-strain shear modulus of sand–gravel mixtures in different moisture conditions and its correlation with static stiffness modulus. Int. J. Geotech. Eng. 2022, 16, 962–973. [Google Scholar] [CrossRef] [Scilit]
  70. Tatsuoka, F.; Iwasakji, T.; Yosida, S.; Fukushima, S.; Sudo, H. Shear Modulus and Damping by Drained Tests on Clean Sand Specimens Reconstituted by Various Methods. Soils Found. 1979, 19, 39–54. [Google Scholar] [CrossRef] [Scilit]
  71. Alarcon-Guzman, A.; Chameau, J.L.; Leonards, G.A.; Frost, J.D. Shear Modulus and Cyclic Undrained Behavior of Sands. Soil Found. 1989, 29, 105–119. [Google Scholar] [CrossRef] [Scilit]
  72. Wang, L.; Chiaro, G.; Rees, S.; Cappellaro, C.; Pokhrel, A. Liquefaction characteristics of gravelly soils prepared by water sedimentation method. In Proceedings of the 2025 NZGS Symposium, Auckland, New Zealand, 15–18 October 2025; p. 8. [Google Scholar]
Figure 1. Particle size distribution curves of the investigated sands, gravel and SGMs.
Geotechnics 06 00047 g001
Figure 2. (a) Maximum and minimum void ratios and microstructures of the tested SGMs; and (b) variation in dry densities for different gravel contents.
Geotechnics 06 00047 g002
Figure 3. CKC-type triaxial testing device with bender elements used in this study.
Geotechnics 06 00047 g003
Figure 4. Typical time domain response and waveform characteristics obtained in this study by the bender element method.
Geotechnics 06 00047 g004
Figure 5. Typical time domain responses obtained in this study for SGM specimens prepared by the WT method at Dr = 20%.
Geotechnics 06 00047 g005
Figure 6. Variation in VS with gravel content for SGMs prepared by (a) the wet tamping, WT, and (b) air pluviation, AP, methods.
Geotechnics 06 00047 g006
Figure 11. Variation in normalized shear wave velocity with (a) skeleton void ratio and (b) equivalent void ratio for gravel-dominated SGMs.
Geotechnics 06 00047 g011
Figure 12. Variation in normalized shear wave velocity with skeleton void ratio for sand-dominated SGMs prepared using (a) wet tamping and (b) air pluviation methods.
Geotechnics 06 00047 g012
Figure 13. Variation in normalized shear wave velocity and equivalent void ratio for sand-dominated SGMs prepared using (a) wet tamping and (b) air pluviation methods.
Geotechnics 06 00047 g013
Figure 14. The framework used in this study to estimate the contact index m (datapoints from Thevayanagam et al. [14,65], Goudarzy et al. [66], Hubler [20], Kokusho [23] and this study) modified after Thevayanagam et al. [65], Goudarzy et al. [67], Ni et al. [68].
Geotechnics 06 00047 g014
Figure 15. Effect of soil fabric on the normalized shear wave velocity of SGMs.
Geotechnics 06 00047 g015
Figure 16. Comparison of measured and predicted normalized shear wave velocity of SGMs using (a) WT and (b) AP specimen preparation methods.
Geotechnics 06 00047 g016
Figure 17. Variation in normalized shear wave velocity with (a) global void ratio and (b) equivalent void ratio for SGMs (datapoints from Hubler [20]).
Geotechnics 06 00047 g017
Figure 18. Variation in normalized shear wave velocity with (a) global void ratio and (b) equivalent void ratio for SGMs (datapoints from Kokusho and Yoshida [22].
Geotechnics 06 00047 g018
Table 1. Index properties of parent sands and gravel used in this study.
Materialsd50 (mm)D50
(mm)
GsemaxeminCuCc
NB sand0.182.670.990.611.731.22
DRW sand0.752.651.070.702.590.97
Gravel5.12.660.690.522.211.32
Table 2. Index properties of tested sand–gravel mixtures and summary of testing conditions (i.e., specimen preparation method and relative density).
MaterialsGC
(%)
d50 or D50
(mm)
GSemaxeminCuCcSP
Method
Dr
(%)
GC000.262.660.8890.5382.500.90WT20, 30, 45, 60, 70
AP30, 45, 60
GC10100.292.660.7390.4942.770.66WT20, 30, 45, 60
AP30, 45, 60
GC25250.412.660.6320.4154.500.42WT20, 30, 45, 60
AP30, 45,60
GC40400.92.660.5200.34311.760.47WT20, 30, 45, 60
AP30, 45, 60
GC606032.660.4620.28225.260.62WT20, 45, 60
GC80804.92.660.5030.34117.005.12WT20, 45, 60
GC1001005.12.660.6940.5202.211.32WT20, 30, 45, 60
Table 3. A and B fitting parameters for SGMs prepared by both the WT and AP methods.
Wet Tamping (WT)Air Pluviation (AP)
MaterialABR2ABR2
GC0399.80249.640.99346.43172.820.98
GC10357.57211.950.98428.44311.680.95
GC25438.87362.600.99383.70266.120.96
GC40525.57584.600.99486.34511.790.98
GC60448.45490.840.98N/AN/AN/A
GC80334.66298.020.90N/AN/AN/A
GC100450.53306.050.99N/AN/AN/A
Table 4. Intergranular state characteristics of SGMs.
Mixturesd50 or D50
(mm)
RdSC(lim) (%)SC(th) (%)RemarksContact Index Typemb
GC00.2619.6271–7731SC(th) < SCe--
GC100.2973–77SC(th) < SCef--
GC250.4175–78SC(th) < SC < SC(lim)ef(eq)0.3-
GC400.977–80SC(th) < SC < SC(lim)ef(eq)0.3-
GC603.078–80SC(th) < SC < SC(lim)ef(eq)0.3-
GC804.977–80SC(th) > SCec or ec(eq)-0.3
GC1005.174–77--e-
Table 5. Summary of the datasets for SGMs compiled from previous studies.
Hubler [20]
MaterialsGSemaxemind50 or D50
(mm)
RdSC(Lim)(%)SC(th)(%)Contact Indexm
Ottawa Sand2.650.7520.5290.253669–7139e-
20% Gravel + 80% Sand2.670.6020.4430.2570–71ef
40% Gravel + 60% Sand2.690.4770.3580.4871–72ef(eq)0.33
60%Gravel + 40% Sand2.700.3790.2795.571–72ef(eq)
Pea Gravel2.650.7720.574968–70e-
Kokusho and Yoshida [22]
MaterialsGSemaxemind50 or D50
(mm)
RdSC(Lim)(%)SC(th)(%)Contact Indexm
Tone River Sand2.7010.9660.5840.3429.4157–6635e-
25% Gravel + 75% Sand2.6740.5670.3341.1366–71ef
50% Gravel + 50% Sand2.6680.4290.2402.2869–73ef(eq)0.35
75% Gravel + 25% Sand2.6530.3540.1847.3070–75ef(eq)
GravelN/AN/AN/A10 N/Ae-
Disclaimer/Publisher’s Note: The statements, opinions and data contained in all publications are solely those of the individual author(s) and contributor(s) and not of MDPI and/or the editor(s). MDPI and/or the editor(s) disclaim responsibility for any injury to people or property resulting from any ideas, methods, instructions or products referred to in the content.