Article

Experimental Verification of Anchor Tip Angles Suitable for Vibratory Penetration into Underwater Saturated Soft Soil

1
Functional Control Systems, Graduate School of Engineering and Science, Shibaura Institute of Technology, Saitama 337-8570, Saitama, Japan
2
Department of Mechanical & Electrical Engineering, Faculty of Engineering, Mechanical and Electrical Engineering, Suwa University of Science, Kayano 391-0213, Nagano, Japan
3
College of Systems Engineering and Science, Niigata University, Niigata 950-2181, Niigata, Japan
4
Department of Robotics, Faculty of Information Technology, International Professional University of Technology in Tokyo Cocoon Tower, Shinjuku 160-0023, Tokyo, Japan
5
Mariculture Research Institute, Fisheries Research Department, Hokkaido Research Organization, Muroran 051-0013, Hokkaido, Japan
6
Central Fisheries Research Institute, Hokkaido Research Organization, Yoichi 046-8555, Hokkaido, Japan
*
Author to whom correspondence should be addressed.
Geotechnics 2025, 5(4), 68; https://doi.org/10.3390/geotechnics5040068
Submission received: 3 July 2025 / Revised: 11 September 2025 / Accepted: 22 September 2025 / Published: 1 October 2025
(This article belongs to the Special Issue Recent Advances in Geotechnical Engineering (3rd Edition))

Abstract

Currently, Japan’s fishing industry is facing a severe decline in its workforce. As a response, fishing mechanization using small underwater robots is promoted. These robots offer advantages due to their compact size, although their operating time is limited. A major source of this limited operating time is posture stabilization, which requires continuous thruster use and rapidly drains the battery. To reduce power consumption, anchoring the robot to the seabed with anchors is proposed. However, due to neutral buoyancy, the available thrust is limited, making penetration into the seabed difficult and reducing stability. To address this, we focus on composite-shaped anchors and vibration. The anchors combine a conical tip and a cylindrical shaft to achieve both penetrability and holding force. However, a trade-off exists between these functions depending on the tip angle; anchors with larger angles provide better holding capacity but lower penetrability. To overcome this limitation, vibration is applied to reduce soil resistance and facilitate anchor penetration. While vibration is known to aid penetration in saturated soft soils, the effect of tip angle under such conditions remains unclear. This study aims to clarify the optimal tip angle for achieving sufficient penetration and holding performance under vibratory conditions. Experiments in underwater saturated soft soil showed that vibration improves both penetration and holding. This effect was strong in anchors with tip angles optimized for holding force. These findings support the development of energy-efficient anchoring systems for autonomous underwater operations in soft seabed environments.

1. Introduction

Japan has long benefited from its marine resources. However, in recent years, the fishing industry has faced significant challenges, including declining fish production and an aging workforce [1,2]. According to the Ministry of Agriculture, Forestry and Fisheries, Japan’s number of fishers has decreased from approximately 180,000 in 2013 to about 120,000 in 2022—a 30% reduction over a decade [3]. Furthermore, over 50% of fishers are aged 50 or older, reflecting an aging trend. These factors have led to a serious labor shortage. In response, the ministry has promoted the development of a smart fishing industry to ensure sustainability and growth in the fishery sector [4,5]. Consequently, demand has increased for measures that integrate digital technologies. These technologies include Artificial Intelligence (AI), Internet of Things (IoT), and underwater robotics [5,6,7,8,9]. Among them, this paper focuses on fisheries using underwater robots.
In fishing with underwater robots, the mechanization of existing operations is underway. Mechanization reduces reliance on expert skills and may lower the barrier to entry for newcomers. One example of underwater robot-assisted fishing is a robot developed to support abalone harvesting [7]. This robot assists fishers in assessing the size of abalones. Underwater robots have also been used to locate juvenile flathead flounder [8] and support aquaculture operations [6,9], highlighting their diverse roles in fisheries. The preceding examples mainly utilize compact and lightweight types of AUVs and ROVs. This is because these types are easier to handle in unstable environments, such as on fishing vessels. Moreover, their types lead to lower deployment and operational costs, making them a practical solution for widespread use in the fishing sector.
Small underwater robots have certain advantages in the fishing industry. However, the robots face operational limitations. Battery capacity is limited, which restricts their operation time to only a few hours. This constraint affects their efficiency and applicability in the field. Therefore, extending operational time remains a critical technical challenge. A major source of power consumption is the stationary posture stabilization of underwater robots. This stabilization relies solely on thrusters, requiring continuous power consumption to maintain a stable orientation [10]. Additionally, as shown in Figure 1a, underwater robots are floating and thus easily displaced by water currents. This displacement makes the posture of underwater robots unstable and can introduce noise into observational data [11,12,13]. Thus, developing a new posture stabilization method that reduces power consumption is essential.
This study proposes anchoring as a new stabilization method in underwater saturated soft soil. Among these soils, sandy soils were selected as the representative seabed condition because the soils are widely distributed in Japanese coastal waters. Achieving stable posture stabilization in such soils would enable application in many fishing grounds. By anchoring to the seabed, as illustrated in Figure 1b, the robot can maintain a fixed posture without using thrusters. This method reduces power consumption and posture instability. However, a significant challenge in this method lies in the neutral buoyancy of small underwater robots [14,15]. Due to the neutral buoyancy counteracting gravity, the anchor relies solely on the limited thrust of underwater robots to penetrate the seabed. This limitation reduces penetration depth, weakening holding force, and destabilizing posture. Therefore, an approach is required to achieve sufficient anchor penetration depth using only thrust.
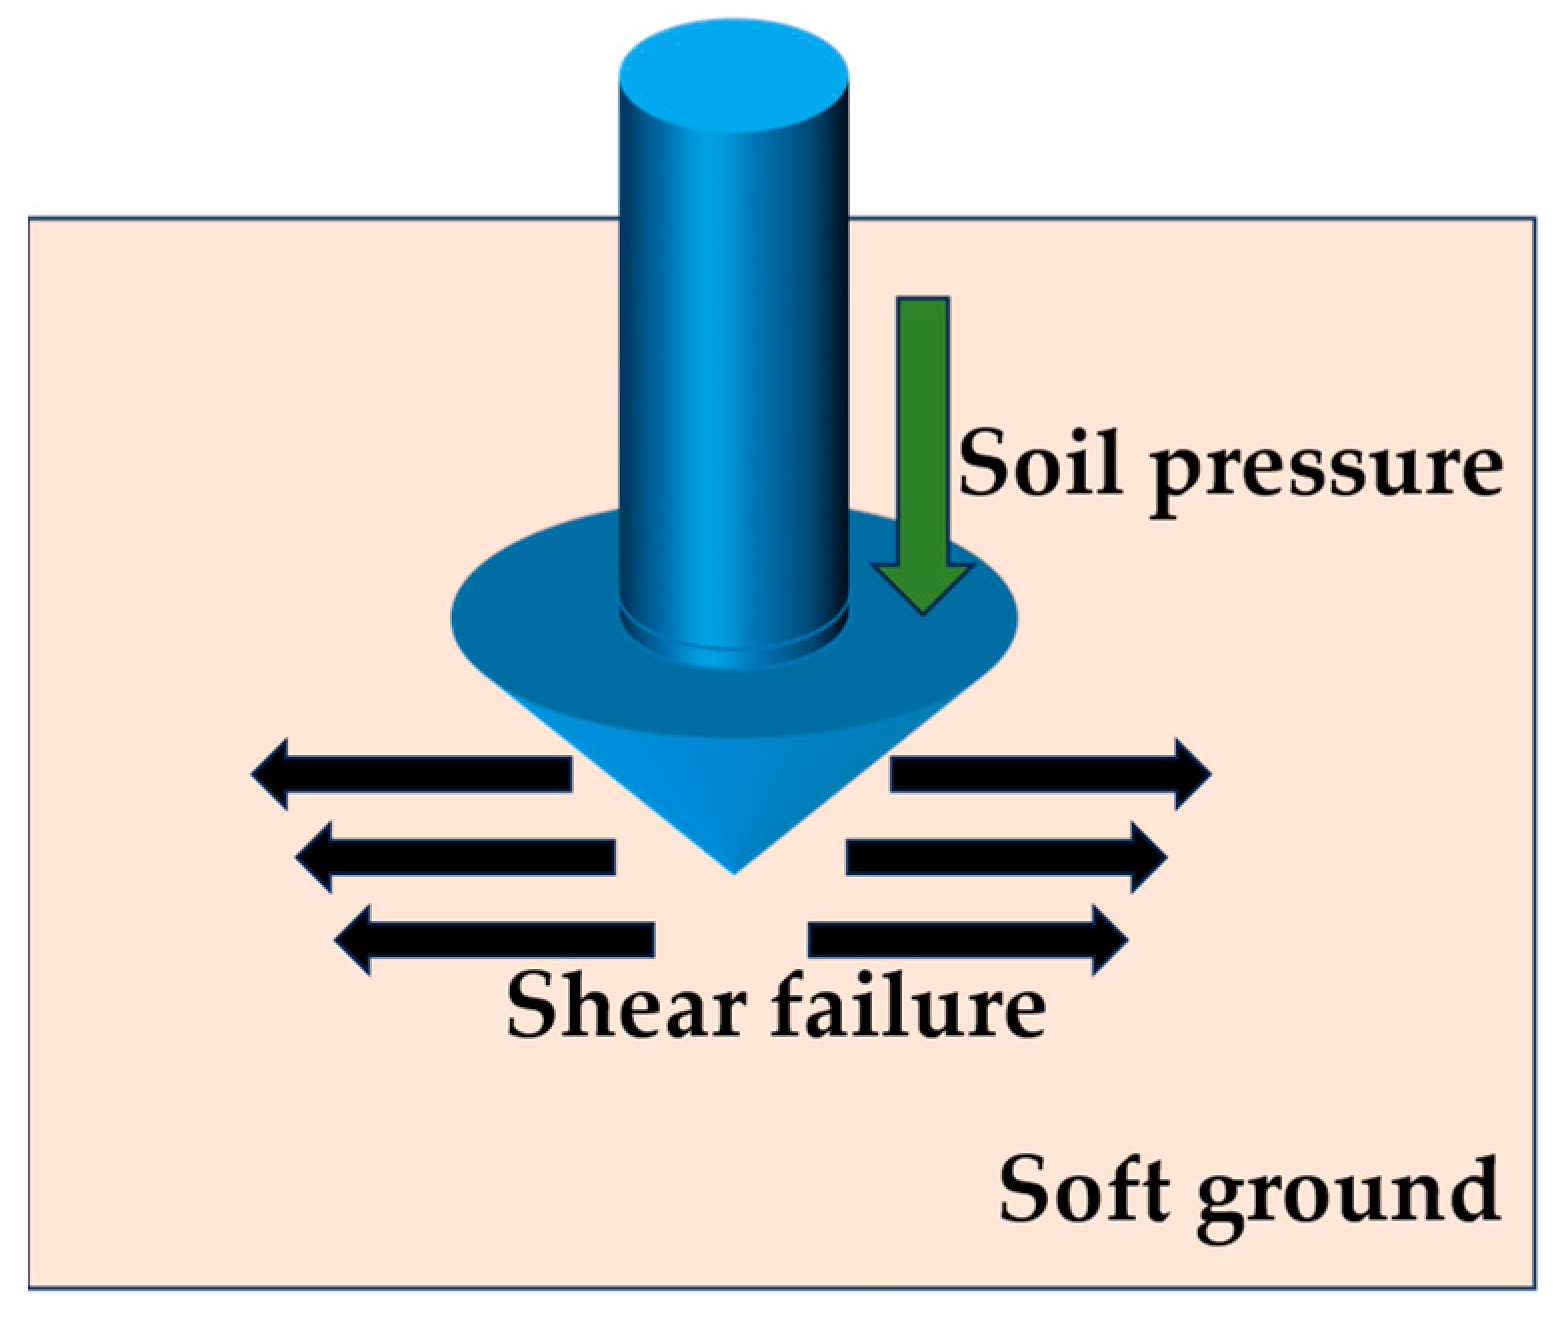
To penetrate anchors into the soil using small forces, a composite-shaped anchor combining a conical tip and a cylindrical shaft is considered suitable. The tip induces stress concentration near the apex, promoting localized shear failure and thereby reducing penetration resistance [16,17]. In addition, soil pressure acting on the conical base generates a normal force [18,19]. This force enhances the holding force. These characteristics make the shape effective in both penetration and holding performance. A smaller tip angle lowers penetration resistance, allowing deeper embedment under limited thrust [16,17]. However, the extent to which penetration resistance can be minimized through geometric optimization is inherently limited. Moreover, efforts to enhance holding force by modifying anchor shape result in increased penetration resistance. This means that the shape effect presents a trade-off. To overcome this limitation, this study focuses on vibration, which reduces penetration resistance and enhances holding capacity [20,21].
Previous studies have confirmed that vibration enhances anchor penetration in saturated soft soils, such as the seabed [20,21]. Thus, vibration can allow deeper embedment of anchors with poor penetrability. However, the effect of anchor tip angle on penetration under vibratory loading in such environments has received limited attention. As a result, the optimal tip angle for anchoring the underwater robot to the seafloor using vibration remains unclear. Clarifying the optimal angle is crucial for designing anchoring systems suitable for robots with limited thrust. Therefore, this study aims for stable anchoring of a small and lightweight underwater robot using only downward thrust and clarifies the tip angle required to achieve sufficient penetration under vibratory conditions. Specifically, penetration and towing experiments were conducted on composite-shaped anchors with different tip angles under vibratory loading. The results were used to evaluate how tip angles influence both the penetration and holding performance of the anchors and to analyze the penetration conditions that may lead to sufficient holding force.

2. Anchoring Mechanism and Penetration Enhancement for Underwater Robots

2.1. Soil Holding Mechanisms of Anchors

Section 1 proposed a posture stabilization method in underwater saturated soft soil, which involved anchoring small underwater robots to the seabed. However, due to the robot’s neutral buoyancy, the force available for penetration is extremely limited. This limited force hinders the anchor from achieving sufficient penetration. Therefore, this section examines methods to increase the penetration depth. As a first step, the necessity of achieving sufficient depth for stable anchoring in soil is confirmed through a theoretical horizontal resistance model of anchors. In developing this model, only horizontal resistances were considered, while rotation and moment were neglected. This simplification was made because the primary objective of this study was to clarify the influence of tip angle and vibration on penetration, and including rotation would have significantly complicated the model and obscured these effects.
When anchors penetrate the soil, they are held in position by various forces acting on the soil. The main forces are passive soil pressure and frictional resistance at the side and base. Since this study focuses on sandy soils, soil cohesion is assumed to be negligible and is therefore not considered in the analysis [22,23]. Figure 2 illustrates the distribution of these forces around the embedded anchor. The details of these forces are as follows:
Passive soil pressure: Passive soil pressure is the soil pressure received from the soil when an object penetrating the soil moves. Based on Rankine’s theory [22,23], the local passive soil pressure P p   N/m2 at a depth of y m can be expressed as follows:
P p = K p γ y
where γ N/m3 is the effective unit weight of soil, defined as γ = γ s a t γ w , with γ s a t N/m3 being the saturated unit weight of the soil and γ w N/m3 the unit weight of water [22]. K p is the passive earth pressure coefficient, defined as K p = 1 + sin φ 1 sin φ , where the soil’s internal friction angle φ °.
As shown in Figure 2, the combined force of passive soil pressure F 1 N is obtained by integrating the local soil pressure along the depth direction, as shown in Equation (2).
F 1 = A p K p γ y · d A p
where A p m2 denotes the area over which the passive soil pressure is applied. In this case, the area element d A p m2 is given by
d A p = W · d y
where W m is the width of the anchor in the direction of movement. Substituting Equation (3) into Equation (2), the equation can be reformulated as follows:
F 1 = A p K p γ y · d A p = 0 H K p γ y W · d y = 1 2 K p γ H 2 W
where H m denotes the penetration depth of the anchor into the soil.
Frictional resistance at the side: Frictional resistance is the resistance exerted by the soil in contact with the side of the object as it moves. The local frictional force f N/m2 is expressed by Equation (5) [24]:
f = σ n tan δ
where σ n N/m2 is the effective normal soil stress acting on the anchor surface. Additionally, the effective normal stress σ n at depth y can be expressed as the passive horizontal stress σ n = P p = K p γ y based on Rankine’s passive earth pressure theory [22,23]. Furthermore, δ ° denotes the friction angle between the soil and the anchor surface. δ is typically assumed to be approximately two-thirds of the internal friction angle φ [24].
The total frictional force F 2 N can be obtained by integrating the local frictional forces over the contact area A s m2 of the object surface, as follows:
F 2 = A s f · d A s
In this case, the area element d A s m2 for an object with a width W is expressed as follows:
d A s = W · d y
By substituting Equations (5) and (7) into Equation (6), the expression can be rewritten as follows:
F 2 = A s f · d A s = 0 H ( K p γ y tan δ ) W · d y = 1 2 K p γ H 2 W tan δ
Frictional resistance at the base: The frictional resistance at the base F 3 N is the resistance acting on the bottom surface of an object. This frictional resistance can be expressed as the product of the bearing force acting on the base N N and the coefficient of friction μ , as shown in Equation (9) [25].
F 3 = μ N
The bearing force N can be represented as the resultant of the stresses exerted by the soil over the base area, and is calculated as follows:
N =   σ n A b = K p γ y A b
where A b m2 is the base area.
Furthermore, the coefficient of friction μ can be expressed as follows using the surface friction angle δ ° between the object and the soil [24].
μ = tan δ
By substituting Equations (10) and (11) into Equation (9), we have
F 3 = μ N = K p γ y A b tan δ
In this case, assuming that the base area A b is given by the square of the anchor width W and the depth y corresponds to the embedment depth H , the following expression is obtained:
F 3 = μ N = K p γ H W 2 tan δ
As shown in Equations (4), (8) and (13), the holding force depends on the penetration depth H . In addition, the force increases with larger anchor width W , internal friction angle φ , and effective unit weight γ . While the holding capacity has been examined from a theoretical perspective, achieving sufficient embedment depth requires overcoming soil resistance during penetration. Therefore, the following section addresses the penetration resistance acting on the anchor.

2.2. Soil Penetration Mechanisms of Anchors

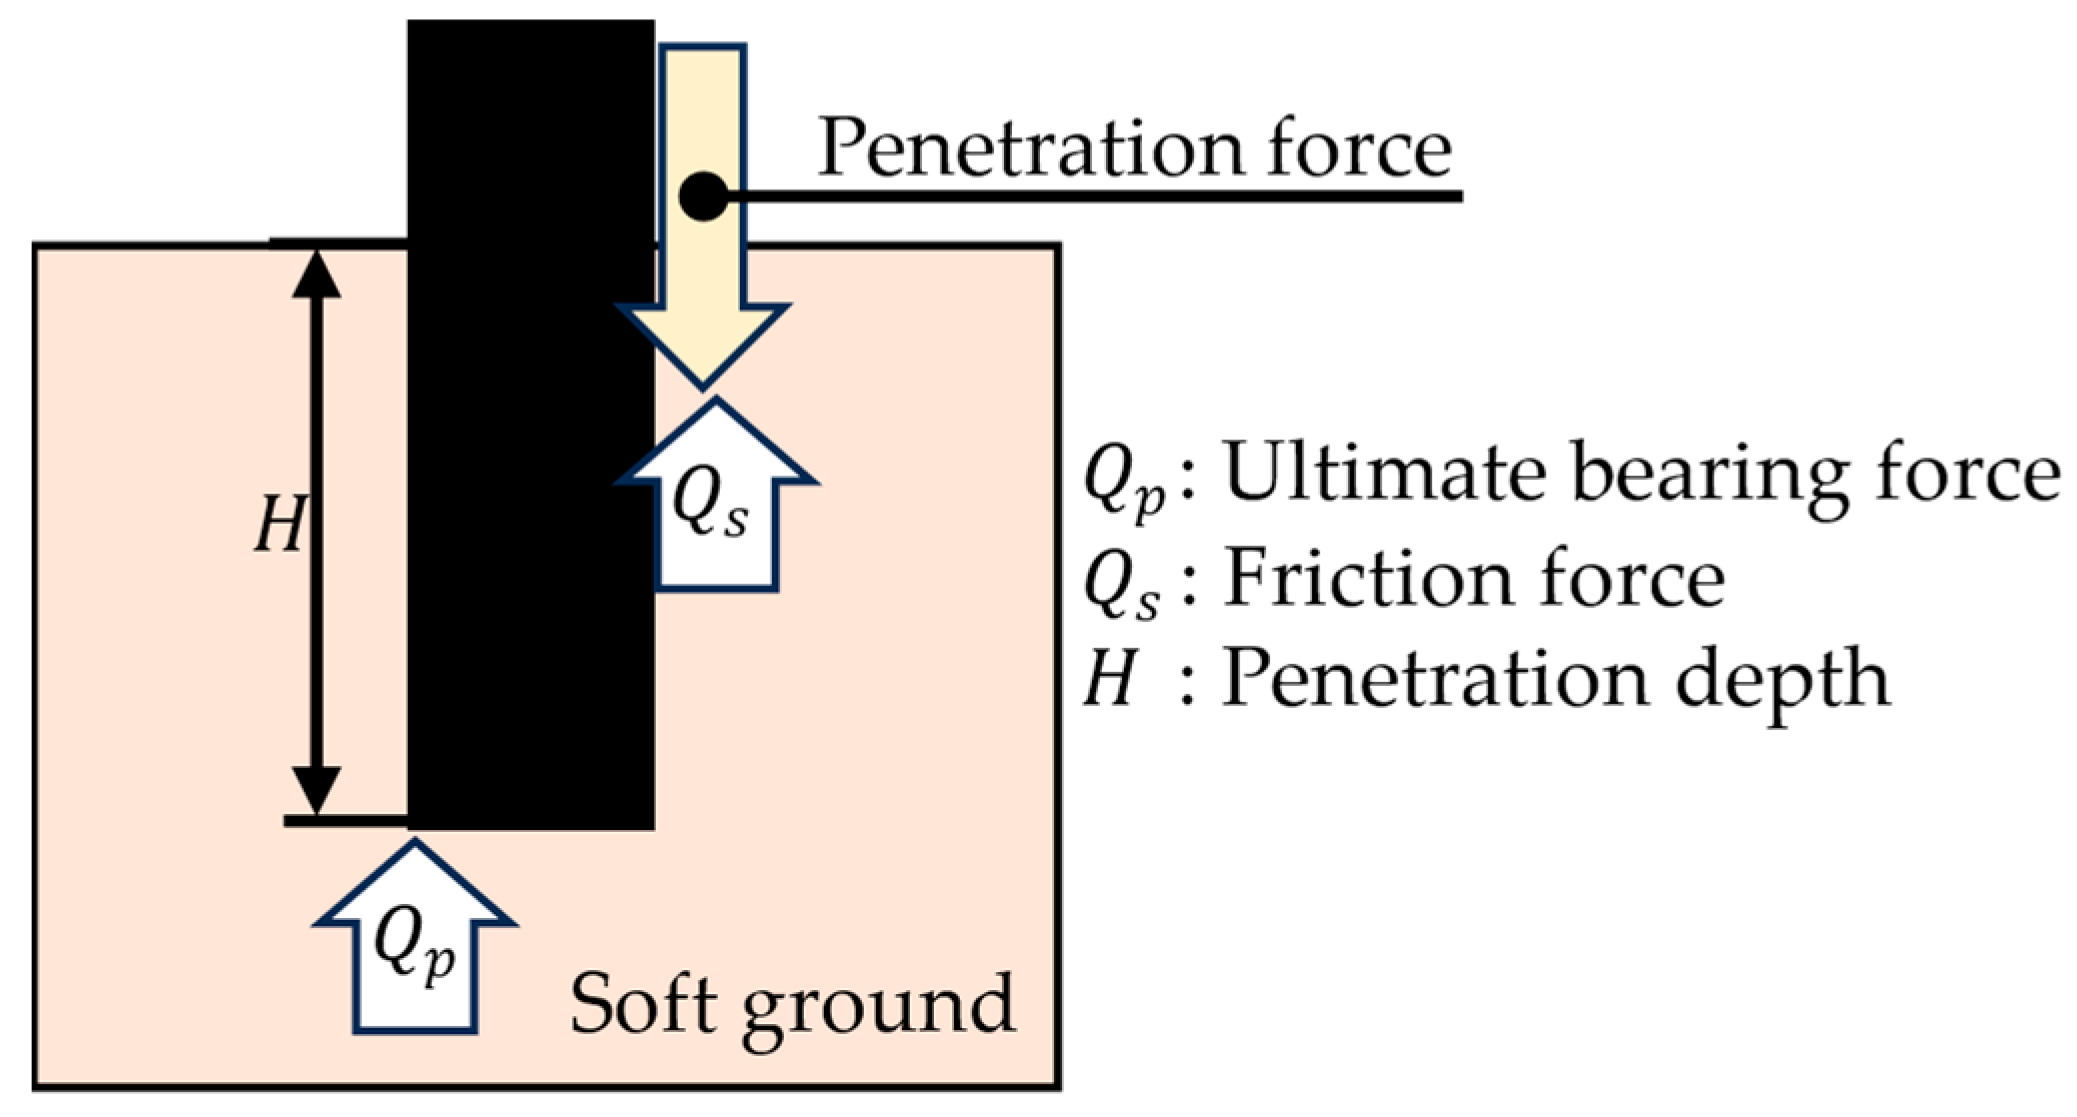
During penetration into soil, anchors are subjected to two primary resistive forces, tip resistance Q p N and shaft frictional resistance Q s N along the lateral surface [23,24,26]. The distribution of these forces is shown in Figure 3. Consistent with the holding force model (Section 2.1), rotation and soil cohesion were neglected to simplify the penetration model. These forces are defined as follows:
Q p = N q σ v A Q p = N p γ H A Q p
Q s = β σ v A Q s = β γ H A Q s
where N q is the bearing force coefficient, σ v N/m2 is the vertical component of the soil stress, A Q p m2 is the tip area of the anchor, β are empirical coefficients, and A Q s m2 is the lateral surface area of the embedded portion of the anchor. Furthermore, based on Equation (1), the vertical soil stress σ v N is given by σ v = γ H , N q is commonly expressed as a function of the soil’s internal friction angle φ °, and defined as N q = e π tan φ tan 2 ( 45 ° + φ 2 ) .
Equations (14) and (15) show that penetration resistance increases with higher penetration depth H , internal friction angle φ , and effective unit weight γ , and the areas over which the forces act, A Q p and A Q s . This indicates that achieving a higher holding force tends to result in higher penetration resistance. However, the downward thrust generated by small underwater robots is limited, making it difficult to achieve sufficient embedment depth. Therefore, approaches such as geometric optimization or ground intervention are necessary to achieve deep embedment under constrained loading conditions.

2.3. Proposal of Composite-Shaped Anchors for Enhanced Penetration

To increase the penetration depth of an anchor under limited force, this study focuses on the tip angle of the anchor. According to Equation (14), the ultimate bearing force Q p acting on the anchor tip decreases as the tip area becomes smaller. Therefore, a sharper tip angle results in a smaller base area of the anchor and decreases in Q p . This decrease enhances penetration efficiency. Sharp tips also induce stress concentration, making it trigger localized soil failure. This mechanism enables the anchor to penetrate deeper into the soil by inducing localized shear failure. However, a sharper tip reduces the contact area with the surrounding soil. This reduction in area diminishes the holding force of anchors.
To resolve this trade-off, a composite-shaped anchor combining a conical tip and cylindrical shaft is adopted, as shown in Figure 4. The conical tip concentrates stress near the apex, triggering localized shear failure and reducing penetration resistance. In addition, the conical base is subjected to passive soil pressure, which contributes to the holding force. This geometric configuration enables the anchor to achieve both high penetrability and reliable holding capacity. The effectiveness of this geometric configuration has been demonstrated in umbrella-type anchors. These anchors are deployable and feature a sharp, penetration-efficient shape before deployment. After deployment, they assume a form like that of the composite-shaped anchor, which improves pull-out resistance [27]. The previous study has demonstrated the effectiveness of the composite-shaped anchors. On the other hand, umbrella anchors cannot return to their pre-deployment state after deployment. This design limits reusability [27]. In fisheries applications, underwater robots are expected to alternate between movement and stationary phases, necessitating the reusability of the anchoring system. Therefore, a composite-shaped anchor that maintains a simple structure and allows repeated use is employed in this study. The composite-shaped anchors exhibit a trade-off concerning tip angle: sharper tips facilitate penetration, while blunter tips increase holding capacity. This trade-off suggests that a moderately blunt tip angle is necessary to ensure sufficient holding force. However, blunt tips increase penetration resistance. High penetration resistance makes it difficult to achieve the depth required for sufficient holding capacity. Accordingly, to achieve deeper penetration, it is essential to reduce penetration resistance.

2.4. Increased Penetration Depth by Vibration

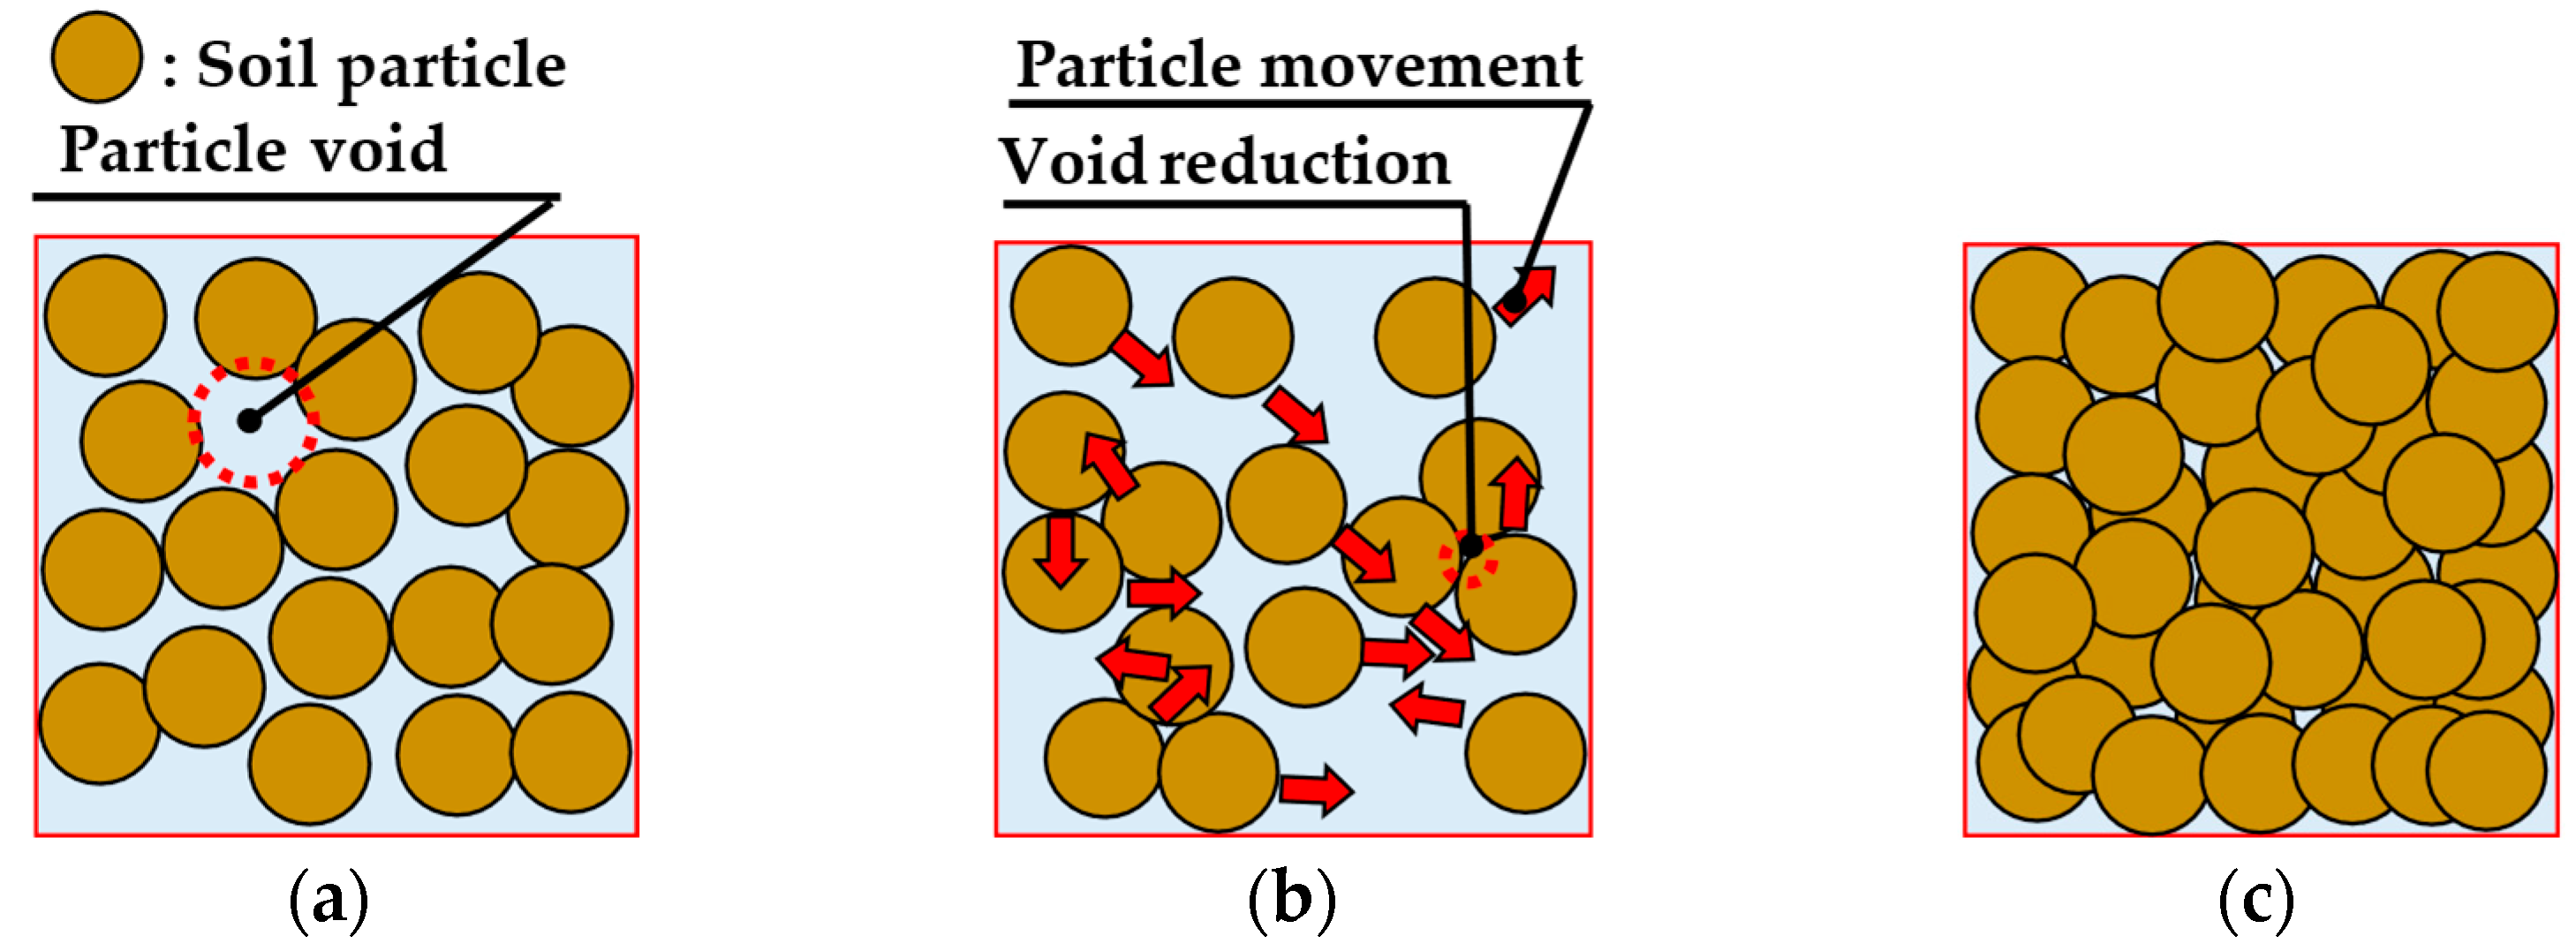
The previous analysis examined the geometric parameters of the anchor to improve penetration performance. However, since improvements based on geometry are limited, attention is next directed to the properties of the soil as a method of reducing resistance. To this end, this section focuses on the liquefaction phenomenon induced by vibration. When soft soil is subjected to vibration, it temporarily behaves like a fluid [28,29]. Under these fluidized conditions, the effective stress within the soil decreases transiently, resulting in a reduction in penetration resistance. The mechanism of fluidization is illustrated in Figure 5 as follows:
1
Initial phase (Figure 5a): Initially, the soil is loosely packed, and voids exist between the soil particles. These voids are saturated with water.
2
Vibration phase (Figure 5b): When vibration is applied to the soil, the soil particles begin to move. This particle movement reduces the voids, increasing pore water pressure. Consequently, the effective stress within the soil decreases.
3
Rearrange phase (Figure 5c): Once the vibration ceases, the particles penetrate a more compact configuration, reducing the void ratio. As a result, the unit weight of the soil increases, and the soil transitions into a denser state.
Based on this principle, the application of vibration during anchor penetration causes a temporary reduction in stress around the anchor, allowing for deeper embedment. Furthermore, the soil becomes denser after vibration, increasing the effective unit weight and internal friction angle. Therefore, penetration with vibration is considered an effective method to enhance both penetrability and the holding force of the soil. Previous studies have demonstrated that in saturated soft ground conditions—such as seabed—vibrating the anchor improves penetration performance [20,21]. Despite the proven effectiveness of vibration, little is known about how anchor tip angle affects penetration under such conditions, leaving the optimal design parameters unclear. Therefore, this study aims to clarify the influence of tip angles on vibratory penetration performance by conducting penetration and towing experiments on composite-shaped anchors with various tip angles. The experimental details are presented in Section 3, Section 4 and Section 5.

3. Target Values for Penetration and Holding Performance

3.1. Anchor Design and Geometrical Specifications

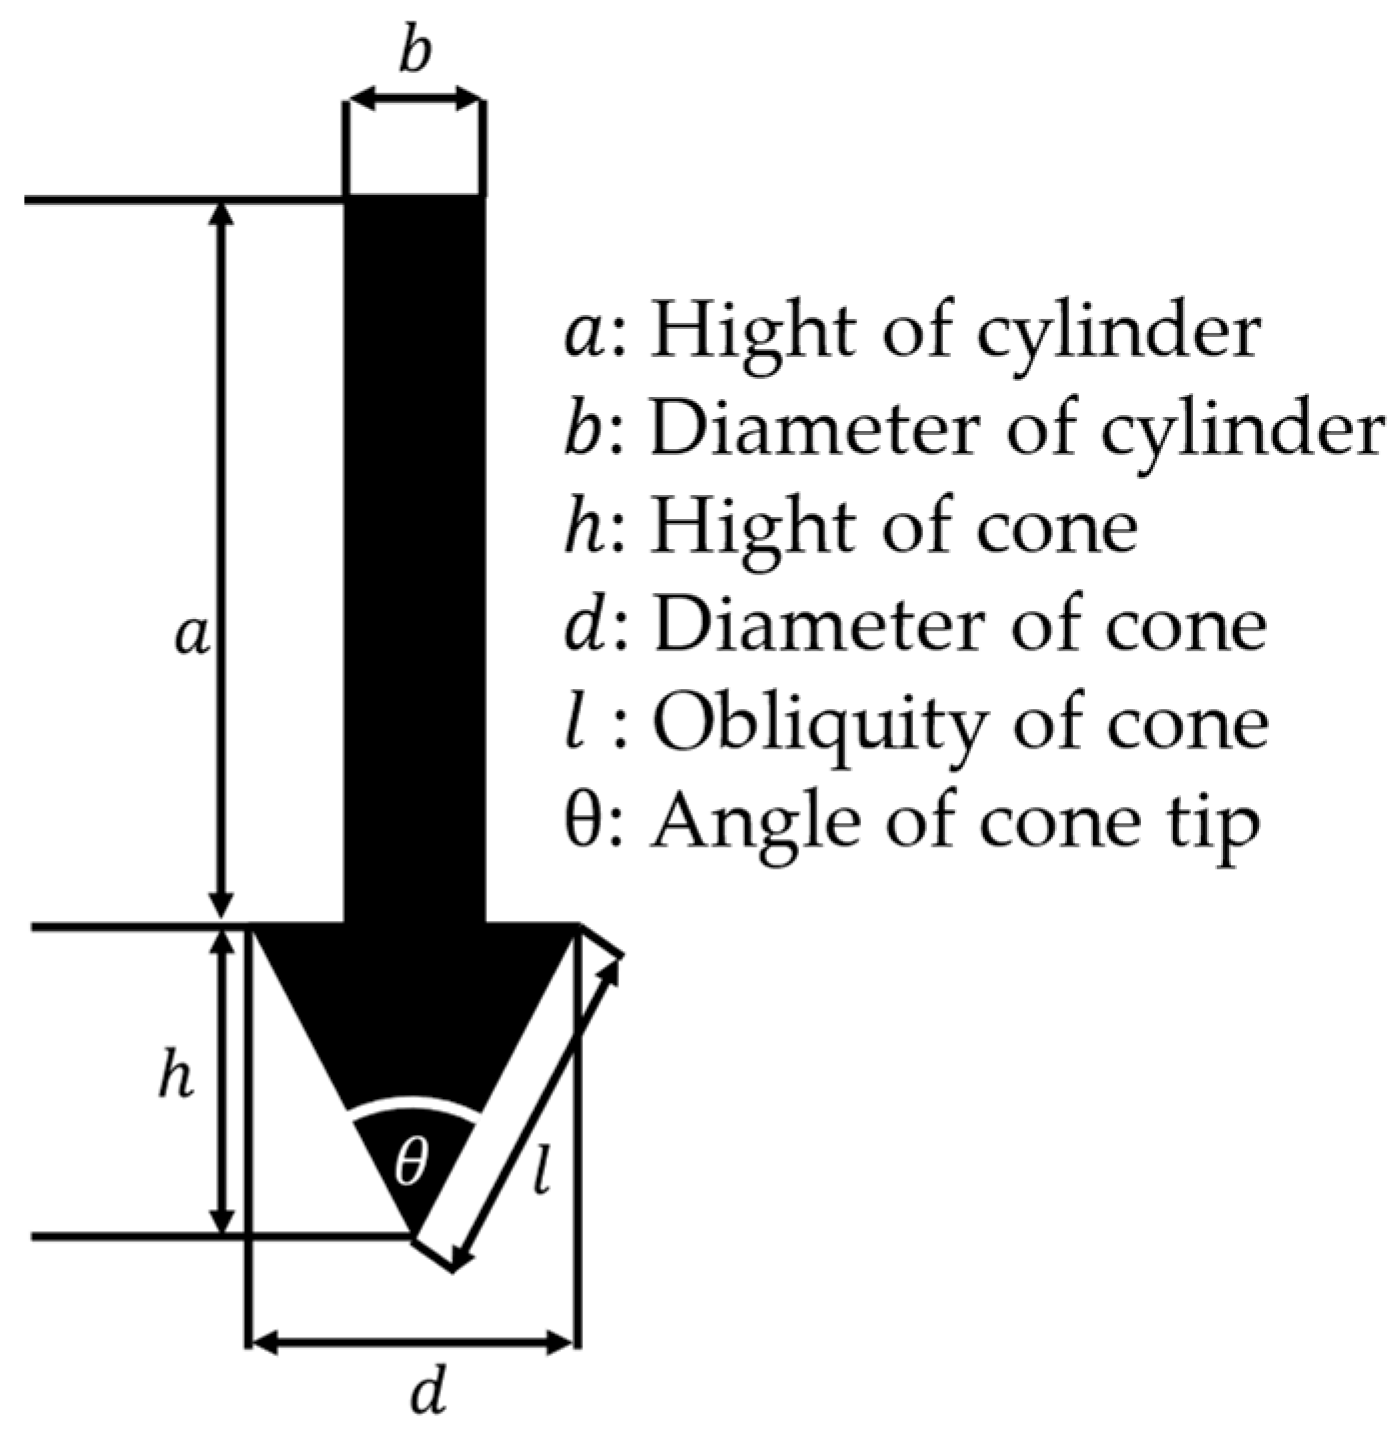
This section presents the composite-anchor geometry used in the experiments and then defines the target penetration depth and holding force. As shown in Figure 6, the anchor consists of a cylindrical upper section (height a m and diameter b m) and a conical lower section (height h m, base diameter d m, oblique length l m, and tip angle θ °). In the experiments, the dimensions of the cylinder and cone were fixed at a = 0.07 m, b = 0.02 m, and h = 0.04 m, respectively. The cone tip angle θ varied between 45, 60, 75, and 90°. Among these, the tip angle of 60° is commonly used in penetration tests due to its balance between penetrability and holding capacity. Therefore, 60° was adopted as the reference angle in the experiments [30]. 45° was selected to represent anchors with enhanced penetrability, as smaller angles reduce tip resistance. Conversely, larger tip angles (75 and 90°) were adopted to emphasize holding performance. Under these conditions, the base diameter d and the oblique line l are determined according to the following equations, which are functions of θ :
d = 2   h tan θ 2
l = h cos θ 2
The geometric specifications of each anchor are summarized in Table 1.

3.2. Required Penetration Depth and Holding Force

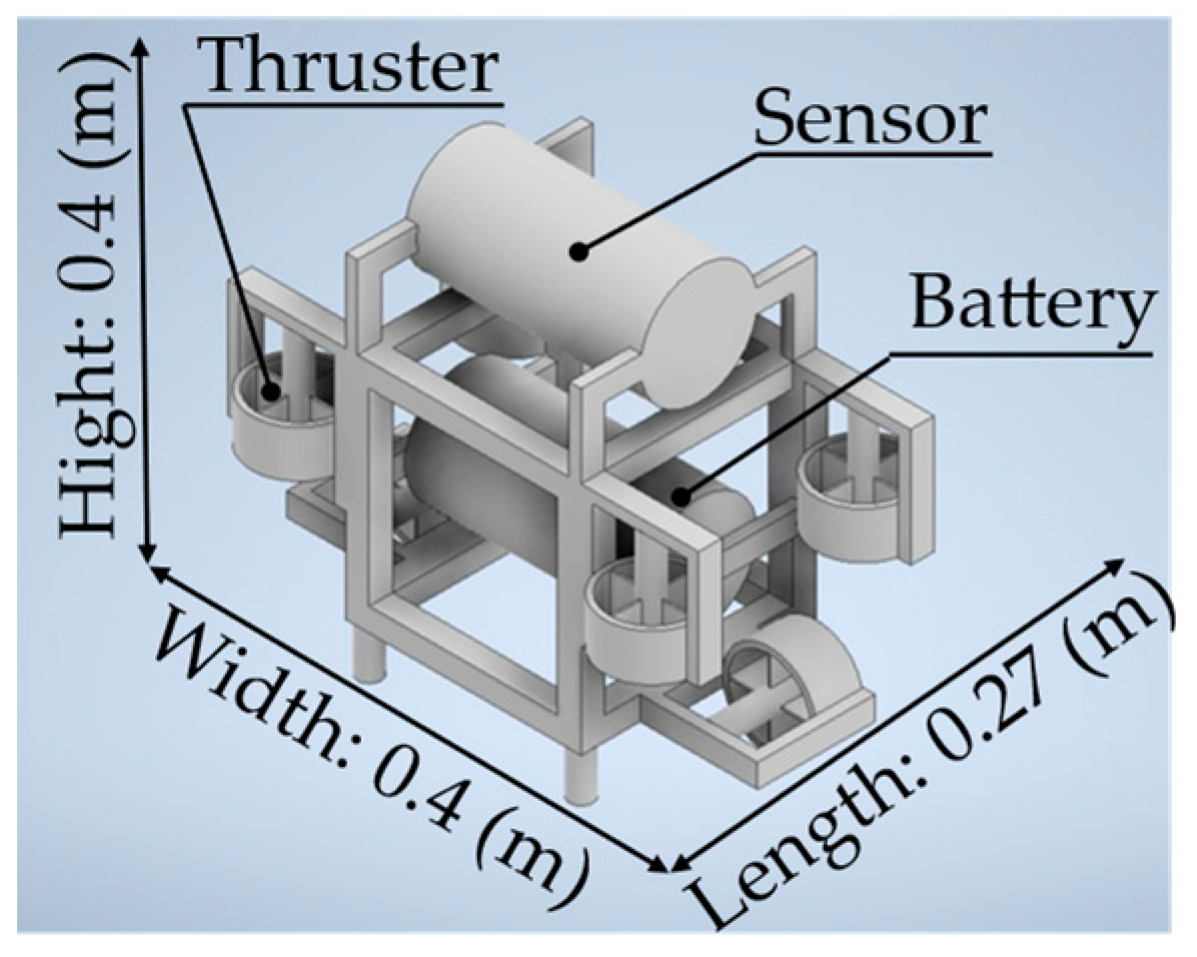
The experiments assume the use of the abalone harvesting-support robot introduced in Section 1 [7]. This robot was chosen as a reference because its thruster configuration and output are documented, allowing for a reasonable estimation of downward thrust. Figure 7 shows the appearance and structure of the robot. The robot is equipped with six thrusters, four of which are oriented vertically. Each thruster provides a thrust of 9 N. Therefore, four vertical thrusters generate a combined downward thrust of 36 N because 9 × 4 = 36. This value was used as the assumed maximum downward force available for anchor penetration. In addition, the drag force D N acting on the robot due to ocean currents can be estimated using the following equation [31]:
D = C D ρ v f 2 S 2
The parameters used in this calculation are as follows:
  • Drag coefficient C D = 1: conservatively estimated due to the lack of precise measurements.
  • Fluid density ρ = 1030 kg/m3: corresponding to the density of seawater.
  • Flow velocity v f = 0.5 m/s: representing the maximum operational current speed for the underwater robot [6].
  • Projected area S = 0.12 m2: calculated based on the robot’s dimensions (width: 0.4 m, length: 0.27 m, height: 0.3 m), representing the maximum projected frontal area.
From Equation (18), the drag force acting on the robot is estimated to be 15.5 N. Thus, if the anchor generates a holding force exceeding 15.5 N under the thrust of 36 N, stable anchoring is possible. The specifications of the underwater robot are summarized in Table 2.

3.3. Theoretical Estimation of Anchor Performance

Next, the holding force as a function of penetration depth is considered. The holding force of a composite-shaped anchor embedded in the soil is the sum of passive soil pressure and frictional resistance, as mentioned in Section 2. These forces are evaluated based on the anchor’s embedded depth z m, and the corresponding expressions are derived by dividing the resistance areas of the cylindrical and conical portions, as illustrated in Figure 8. The combined forces of passive soil pressure and frictional resistance at the side acting on the cylindrical section are denoted as F 1 t N and F 2 t N, respectively. Similarly, the corresponding resultant forces acting on the conical section are denoted as F 1 b N and F 2 b N, respectively. In addition, friction at the tip of the cone can be considered negligible due to its point-like geometry. However, frictional resistance F 3 b N does occur at the base of the cone, where stress is applied over the conical bottom surface. Assuming that these forces act in sandy soil, they can be expressed as follows:
F 1 t =   A p 1 K p γ y d A p 1
F 2 t = A s 1 K p γ y tan δ · d A s 1
F 1 b = A p 2 K p θ / 2 γ y cos ( θ 2 ) d A p 2
F 2 b = A s 2 K p γ y tan δ · d A s 2
F 3 b = K p γ ( z h ) A b 1 tan δ
where A p 1 m2 is the passive soil pressure area of the cylinder, A p 2 m2 is the passive soil pressure area of the cone, A s 1 m2 is the friction area of the cylinder, A s 2 m2 is the friction area of the cone, A b 1 m2 is the friction area of the conical base. The passive earth pressure coefficients are defined as K p =   1 + sin φ 1 sin φ and K p θ / 2 = 1 + sin φ 1 sin φ cos θ 2 , where K p θ / 2 accounts for the tip angle [32]. Each differential and effective area is given by
d A p 1 = b · d y   ( 0 y z h )
d A s 1 = π b · d y   ( 0 y z h )
d A p 2 = d h · y   · d y   ( z h y z )
d A s 2 = 2 π · d 2 · d l = 2 π d 2 h y l h d y = π d l h 2 y · d y   ( z h y z )
A b 1 = π ( d 2 b 2 ) 4  
Substituting these into the above expressions and solving the integrals yields
F 1 t = A p 1 K p γ y d A p 1 = K p γ b ( z h ) 2 2
F 2 t = A s 1 K p γ y tan δ · d A s 1 = K p γ b ( z h ) 2 2
F 1 b = A p 2 K p θ / 2 γ y cos ( θ 2 ) d A p 2 = K p γ d 3 h z 3 ( z h ) 3
F 2 b = A s 2 K p γ y tan δ · d A s 2 = K p γ π d l tan δ 3 h 2 z 3 ( z h ) 3
F 3 b = K p γ ( z h ) A b 1 tan δ = K p γ ( z h ) π ( d 2 b 2 ) tan δ 4
According to Equations (29)–(33), the target penetration depths required to achieve a holding force larger than 15.5 N were calculated for each tip angle.
The soil parameters used in this analysis are summarized as follows:
  • Internal friction angle φ = 32 °: adapted based on previous studies. This angle corresponds to the midpoint of the typical range (30–34°) for moderately dense No. 5 silica sand [33].
  • Friction angle δ = 21.3°: taken as two-thirds of the internal friction angle φ .
  • Effective unit weight γ = 9800 N/m3: calculated by subtracting the unit weight of water (9800 N/m3) from the unit weight of No. 5 silica sand (19,600 N/m3) under saturated conditions, consistent with standard saturated sand conditions [34].
  • Anchor parameters b , d , h : obtained from Table 1 according to the tip angle θ .
The calculation target depths z are as follows: 0.090 m for 45°, 0.081 m for 60°, 0.073 m for 75°, and 0.065 m for 90°.
To embed the anchors to the target depth, the thrust must exceed the penetration resistance at that depth. Based on Equations (14) and (15) in Section 2, the penetration resistance is the sum of ultimate bearing resistance and side friction. However, since the anchor used here is small, vertical side friction is negligible, and only ultimate bearing resistance is considered. The ultimate bearing resistance Q p N at penetration depth H m is given by Equation (34), where the bearing area A Q p m2 is approximated by the projected conical base area, A Q p = π d 2 4 .
Q p = N q σ v A Q p = N q γ H A Q p = N p γ H π d 2 4
where N q is the bearing capacity factor, and γ N/m3 is the effective unit weight of the soil.
Transforming Equation (34) into a form that determines the depth to which the anchor can penetrate at any penetration resistance yields Equation (35).
H = 4 Q p N p γ π d 2
From Equation (35), the theoretical depth that can be penetrated under any thrust is obtained. Using this equation, the theoretical depth achievable by the aforementioned abalone harvesting-support robot is estimated. The parameters used are as follows:
  • Ultimate bearing resistance Q p = 36 N: assumed as the ultimate bearing resistance, corresponding to the maximum thrust generated by the abalone harvesting-support robot. This implies that the anchor is considered to penetrate the soil until the resistance equals the available thrust. This thrust value is taken from the robot specifications presented in Table 2 (Section 3.2).
  • γ = 9800 N/m3: adapted as previously defined.
  • Base diameter d : obtained from Table 1 according to the tip angle θ .
  • Bearing capacity factor N q = e π tan φ tan 2 ( 45 ° + φ 2 ) = 23.2: based on the general formula for sandy soil with an internal friction angle of φ = 32°.
This gives the theoretical depths at 36 N thrust: 0.19 m for 45°, 0.095 m for 60°, 0.054 m for 75°, and 0.032 m for 90°.
Table 3 summarizes the target depth required for the anchor to achieve a holding force of 15.5 N and the theoretical depth achievable under a thrust of 36 N, as obtained from the above analysis. As shown in Table 3, anchors with tip angles of 45° and 60° can theoretically reach the target embedment depth under the given thrust. In contrast, anchors with tip angles of 75 and 90° are unlikely to penetrate to the necessary depth under the same conditions. However, the application of vibration may enhance penetrability, potentially allowing these anchors to reach the target depth. In this study, the primary focus was placed on penetration depth and holding performance, which are essential conditions for achieving posture stabilization. However, in practical applications, the reusability of anchors is also important, and thus an evaluation of pull-out resistance is indispensable. Previous studies have demonstrated that the application of vibration increases pore water pressure in saturated sand and decreases effective stress, thereby significantly reducing not only penetration resistance but also pull-out resistance [35,36]. Accordingly, if penetration can be achieved under vibratory loading, it is reasonable to assume that pull-out can also be facilitated by applying vibration. Based on this premise, the present experiments were limited to investigating the effects of vibration on penetration and holding force.

4. Vibratory Penetration Experiments on Anchors with Different Tip Angles

4.1. Experimental Setups and Procedures of Vibratory Penetration Experiments

To investigate the influence of vibration on the penetration of composite-shaped anchors in underwater saturated soft soil, the experimental setup shown in Figure 9 was used. As illustrated in Figure 9a, the system consists of composite-shaped anchors with different tip angles, a linear actuator to control the vertical position of the anchor, a chain connecting the actuator to the anchor, a vibration motor attached to the anchor, and a soil container filled with a mixture of water and sand to simulate saturated soft ground.
The experimental procedure is summarized as follows: First, the anchor was positioned at the initial location (Figure 9a). Next, the anchor was embedded into the saturated soft soil while applying vibration (Figure 9b). After a specified time, both the vibration and penetration were stopped, and the final penetration depth was measured (Figure 9c).
In addition, the time-dependent penetration resistance was recorded to evaluate the effect of vibration during penetration.
Based on the schematic of the experimental apparatus shown in Figure 9a, the actual experimental setup is illustrated in Figure 10a. The setup consisted of a PLA anchor with tip angles of 45, 60, 75, and 90°, suspended from a linear actuator via a chain. The actuator controlled the vertical motion of the anchor, and the chain length determined the initial position. The anchors were attached to a vibration motor and a force sensor. The vibration motor applied vibration to the anchors, and its intensity was regulated by the supplied voltage. The force sensor measured penetration resistance. The experiments were conducted on underwater saturated soft ground prepared with tap water and No. 5 silica sand. In addition, penetration resistance depends on the effective unit weight of sand and is therefore not influenced by water depth, provided that the sand is fully saturated. Accordingly, in this study, the soil bed was prepared with a water depth of 400 mm and a sand bed thickness of 350 mm to ensure full saturation. The specifications of the experimental apparatus are summarized in Table 4.
Figure 10b–d show the experimental process:
Step 1: The anchor is positioned just above the soil surface (Figure 10b). The anchor is suspended from the actuator by chains.
Step 2: Vibration is initiated by applying voltages of 0, 20, and 30 V to the motor. The corresponding vibration accelerations are 0, 8.99, and 14.4 m/s2, respectively, and are summarized in Table 5 together with other vibration parameters.
Step 3: The linear actuator extends downward while vibration is maintained, loosening the chain. This allows the anchor to penetrate the soil under its own weight of 36 N (Figure 10c). The penetration process lasts for 30 s.
Step 4: After 30 s, the vibration motor and the linear actuator are stopped (Figure 10d). The final penetration depth is then measured.
Step 5: The anchor returns to its initial position, and the soil surface is leveled.
Following the procedure above, five repeated trials were conducted for each test condition, defined by combinations of anchor shape and vibration. In addition, the variation in penetration resistance over time is also measured using the force sensor.

4.2. Experimental Results and Consideration of Vibratory Penetration Experiments

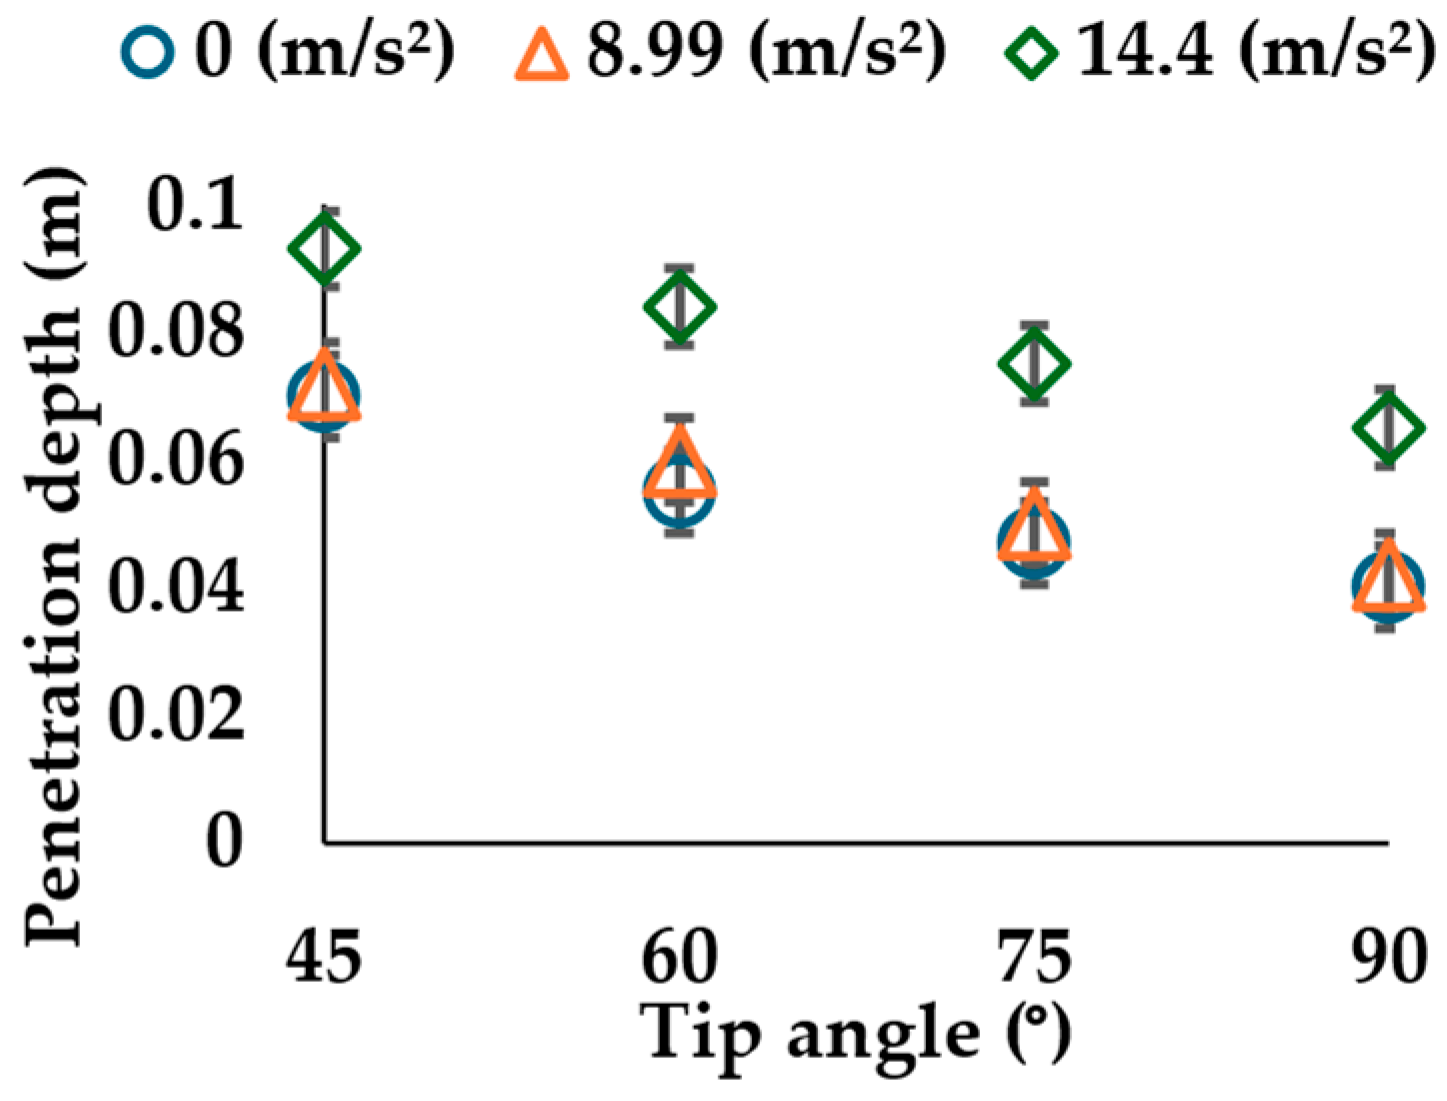
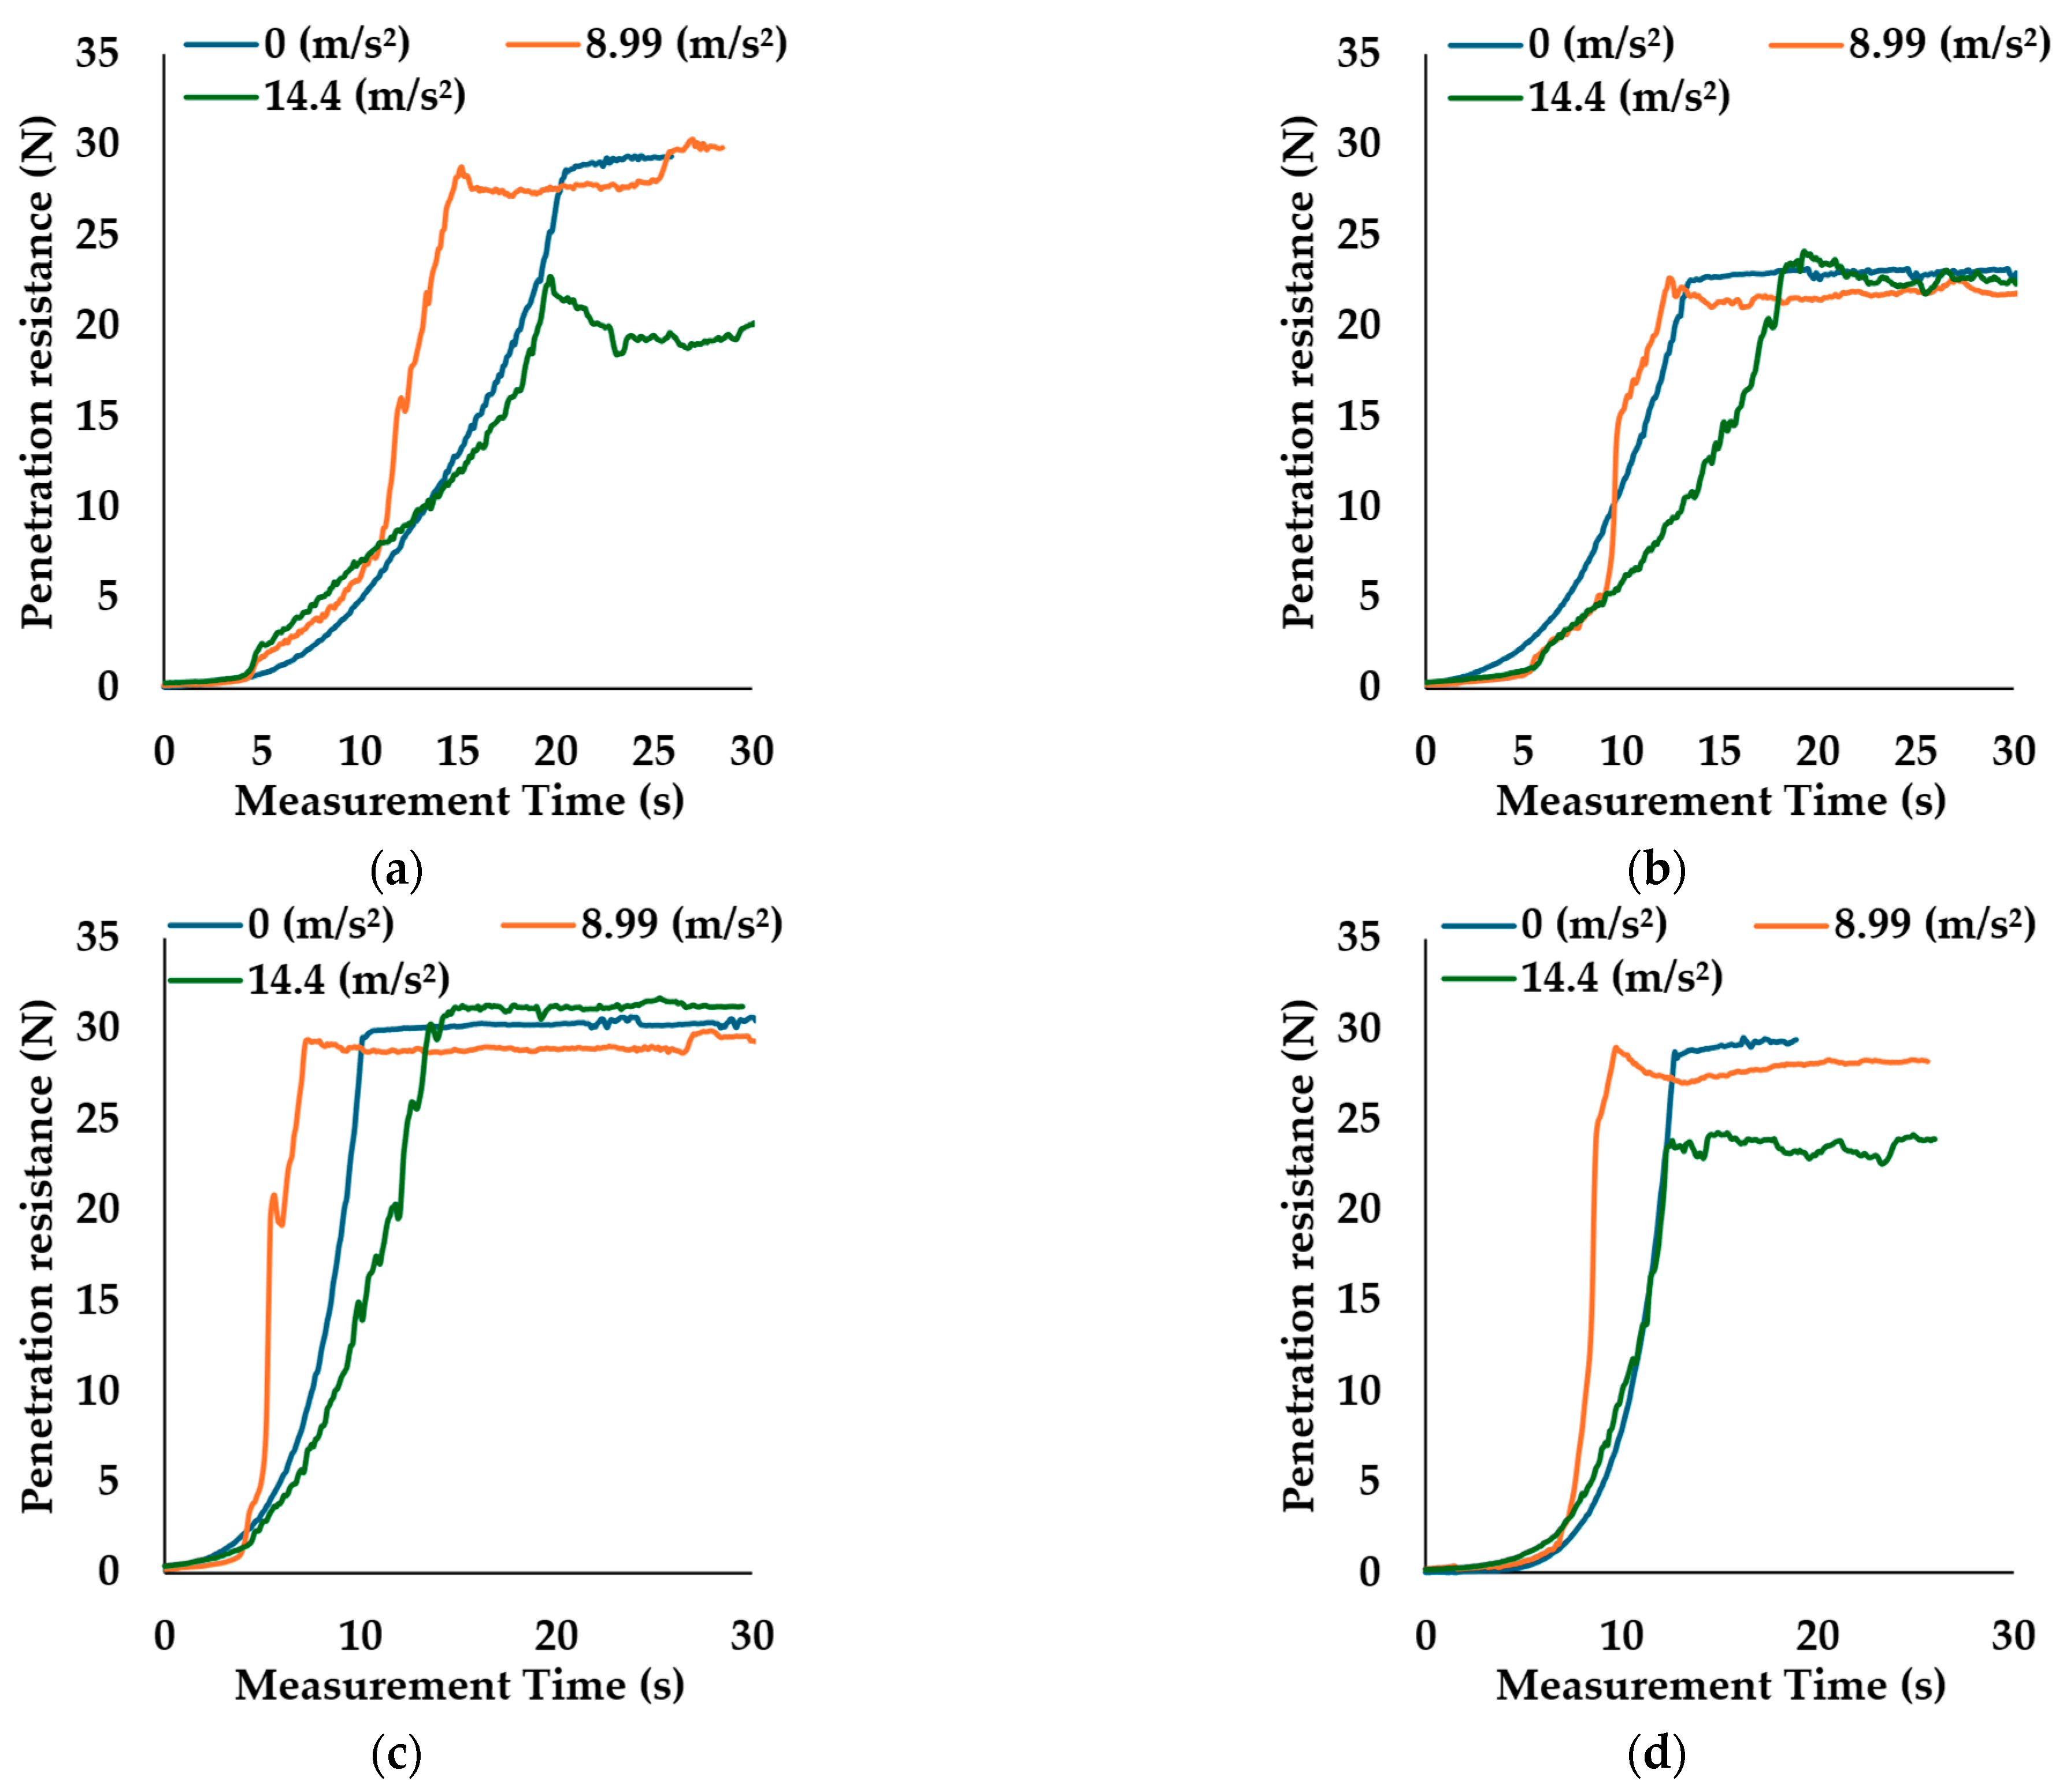
The results of the previous experiments are shown in Figure 11 and Figure 12 and Table 6. Figure 11 illustrates the relationship between tip angle and penetration depth under different vibration accelerations. Additionally, Table 6 summarizes the results of Figure 11 together with the target depth required for the anchor to achieve a holding force of 15.5 N and the theoretical depth achievable under a thrust of 36 N, as calculated in Section 3.3. Furthermore, Figure 12 illustrates the relationship between the measurement time and penetration resistance under different vibration accelerations. Specifically, Figure 12a–d correspond to tip angles of 45, 60, 75, and 90°, respectively.
These figures and the table show the following results.
Figure 11 shows that penetration depth decreases with increasing tip angle, indicating that sharper tips embed more effectively. In addition, vibration enhances penetration. This increase becomes larger at higher vibrations, as observed from the difference between the depths of 8.99 m/s2 and the depths of 14.4 m/s2. These findings indicate that the penetration depth increases with decreasing tip angle and increasing vibration intensity.
Table 6 shows that all anchors reach the target depth with 14.4 m/s2. In contrast, all anchors failed to reach the target depth for anchoring under 0 m/s2 and 8.99 m/s2. This means that sufficient penetration depth is difficult to achieve under non-vibratory or weak vibratory conditions. Additionally, the anchors with tip angles of 45, 60, and 75° failed to reach the theoretical depth under any vibration level. This result suggests that additional factors may have raised penetration resistance, thereby limiting the embedment depth. In contrast, the angle of 90° can penetrate over the theoretical depth even without the application of vibration, implying that another factor reduces resistance.
Figure 12 presents some results on the effect of vibration on penetration resistance, which differ from those in Figure 11 and Table 6. The slope of the increase in resistance varies with vibration level. 8.99 m/s2 condition shows relatively steep slopes, indicating that vibration increased the penetration speed. Conversely, 14.4 m/s2 condition results in gentler slopes, indicating that vibration continuously reduces penetration resistance. Moreover, the final resistance values differed by tip angle. For example, 60 and 75° anchors show similar final resistance under both 0 m/s2 and 14.4 m/s2 conditions, as shown in Figure 12b,c. In contrast, 45 and 90° anchors exhibit a significant difference in final resistance between 0 m/s2 and 14.4 m/s2, as shown in Figure 12a,d. 60° anchor consistently converges to a lower resistance of approximately 25 N, further highlighting its unique penetration behavior. These differences show that tip angles affect vibratory penetration.
These experimental results allow for several considerations.
First, the results show that vibration lowers penetration resistance and may increase penetration speed. This effect becomes more pronounced with stronger vibration. In other words, strong vibration is considered to enable sufficient penetration with a smaller thrust.
Next, the reasons for the discrepancy between the theoretical and experimental penetration depths are considered. One possible explanation is the lack of consideration of certain factors in the theoretical model. Among these factors, soil compression can be considered significant. During penetration, the soil beneath the anchor tip is subjected to force from the anchor, causing the soil to compress. This compression increases both the internal friction angle and the effective unit weight of the soil, thereby raising the penetration resistance and reducing the achievable penetration depth. On the other hand, in the case of the 90° anchor, the experimental penetration depth exceeded the theoretical value. This can be attributed to the omission of pore water pressure effects in the model, leading to an overestimation of effective stress. In the highly saturated surface layer of the soil, excessive pore pressure can significantly reduce effective stress, turning the soil into a fluid-like muddy state. This drastically weakened the strength of the surface layer and likely allowed the 90° anchor to penetrate deeper than expected. These results suggest that to accurately predict anchor penetration behavior in saturated soft soils, future analytical models should account for soil compressibility and moisture content per unit volume.
Finally, the differences in terminal penetration resistance due to tip angle are examined. As shown in Figure 12b, the anchor with a tip angle of 60° consistently exhibited lower maximum resistance than those with other angles. This is considered to be attributable to the fact that the 60° anchor has a geometrically intermediate shape. Compared with sharper anchors such as 45°, stress concentration at the tip was smaller, making it difficult to induce sufficient shear failure. On the other hand, compared with blunter anchors such as 75° and 90°, the contact area with the soil was smaller, limiting the lateral displacement of the surrounding soil mass. As a result, neither stress concentration nor lateral deformation became dominant, leading to shallower penetration. At such shallow embedment depths, the soil resistance could not be fully mobilized, and consequently, the terminal resistance was reduced. Furthermore, Figure 12a,c show that anchors with tip angles of 45 and 90° exhibited clear differences in terminal resistance between 0 m/s2 and 14.4 m/s2. This suggests that, even at the end of the experiments under vibration, the penetration process had not yet reached equilibrium, and the reduction in effective stress was still active. It is therefore inferred that deeper penetration could have been achieved if vibration had been applied for a longer duration. In contrast, anchors with tip angles of 60 and 75° showed almost no difference in terminal resistance between 0 m/s2 and 14.4 m/s2. This indicates that the effect of vibration had either already reached its limit or was constrained by the geometric characteristics of these anchors. From these results, it can be concluded that anchors with geometrically balanced shapes are less capable of sufficiently inducing soil failure mechanisms such as stress concentration and lateral displacement and therefore tend to reach the limit of vibratory effects at an earlier stage. Consequently, when vibratory penetration is employed, anchors with extreme geometries—either sharper or blunter—are more advantageous, as they are more likely to exhibit greater penetration effect.
The next section examines whether the application of vibration enables sufficient penetration and provides the necessary force to secure the robot through towing tests. Additionally, the tests investigate whether tip angles affect the holding force.

5. Towing Experiments on Anchors with Different Tip Angles

5.1. Experimental Setups and Procedures of Towing Experiments

To investigate the effect of vibration on the holding force of composite-shaped anchors in underwater saturated soft soil, the setup in Figure 13 was used. As shown in Figure 13a, the setup consists of the anchors with varying tip angles, linear actuator 1 for controlling the embedment depth, linear actuator 2 for towing the anchor, a chain connecting linear actuator 1 to the anchor, a vibration motor for applying vibration to the anchor, and a soil container filled with a mixture of water and sand.
The experimental procedure is outlined as follows: First, the anchor was positioned at the initial location and embedded to a specified depth in the saturated soil while vibration was applied (Figure 13a,b). After penetration, both the vibration and vertical motion were stopped. The anchor was then towed horizontally (Figure 13c), and the resistance force exerted by the soil during towing was measured and considered the holding capacity.
Based on the schematic in Figure 13a, the actual setup is shown in Figure 14a. The setup consisted of a PLA anchor with tip angles of 45, 60, 75, and 90°, suspended from linear actuator 1 via a chain. The actuator controlled the vertical motion of the anchor, and the initial position was adjusted by changing the chain length. A stopper was attached to the anchor to limit penetration depth. In addition, linear actuator 2 was connected to the anchor to tow it. A vibration motor and a force sensor were also mounted on the anchor. The vibration motor applied vibration to the anchor, with the intensity controlled by the supplied voltage. The force sensor was used to measure the holding force. The experiments were conducted on underwater saturated soft ground made of tap water with No. 5 silica sand. Following the penetration experiment in Section 4, the soil bed was prepared with 400 mm of water and 350 mm of sand to ensure full saturation. As most apparatus specifications were the same as in the penetration tests (Table 4), only the items specific to the towing tests are summarized in Table 7.
Figure 14b–d show the actual experimental process:
Step 1: The anchor is positioned just above the soil surface (Figure 14b). The anchor is suspended from the actuator by chains.
Step 2: Vibration is initiated by applying a voltage (0, 20, and 30 V) to the motor. The corresponding vibration accelerations are 0, 8.99, and 14.4 m/s2, respectively, and are summarized in Table 5 together with other vibration parameters.
Step 3: While maintaining vibration, linear actuator 1 extends, slackening the chain and allowing the anchor to penetrate the soil to the designated depth (Figure 14c).
Step 4: After reaching the designated depth, the vibration motor and linear actuator 1 are deactivated. The stopper ensures consistent embedment depth by preventing further penetration and stabilizing the anchor position. This allows subsequent towing experiments to be conducted under uniform depth conditions.
Step 5: The penetrated anchor is towed, and the holding force during towing is measured. After towing, the anchor returns to its initial position, and the soil surface is leveled in preparation for the next attempt (Figure 14d).
The target penetration depths were determined based on the results of the preliminary penetration experiments. These tests indicated that the achievable penetration depths ranged from 0.04 to 0.093 m. Accordingly, the holding force was measured at discrete depths within this range, increasing in 0.01 m increments (i.e., 0.04, 0.05, 0.06, 0.07, 0.08, and 0.09 m). However, in some cases, full penetration to 0.09 m was not feasible due to limitations imposed by the tip angle and applied vibration. In such cases, measurements were conducted only up to the maximum achievable depth under each condition. For instance, under the condition of a 90° tip angle and 30 V input, the maximum penetration depth was 0.065 m, and holding force measurements were performed at 0.04, 0.05, and 0.06 m. The penetration ranges for each condition are summarized in Table 8.
Following the procedure above, five trials were conducted for each test condition, defined by combinations of anchor shape, supplied vibration, and penetration depth. In addition, the variation in holding force over time is also measured using the force sensor.

5.2. Experimental Results and Consideration of Towing Experiments

The experimental results are shown in Figure 15 and Figure 16.
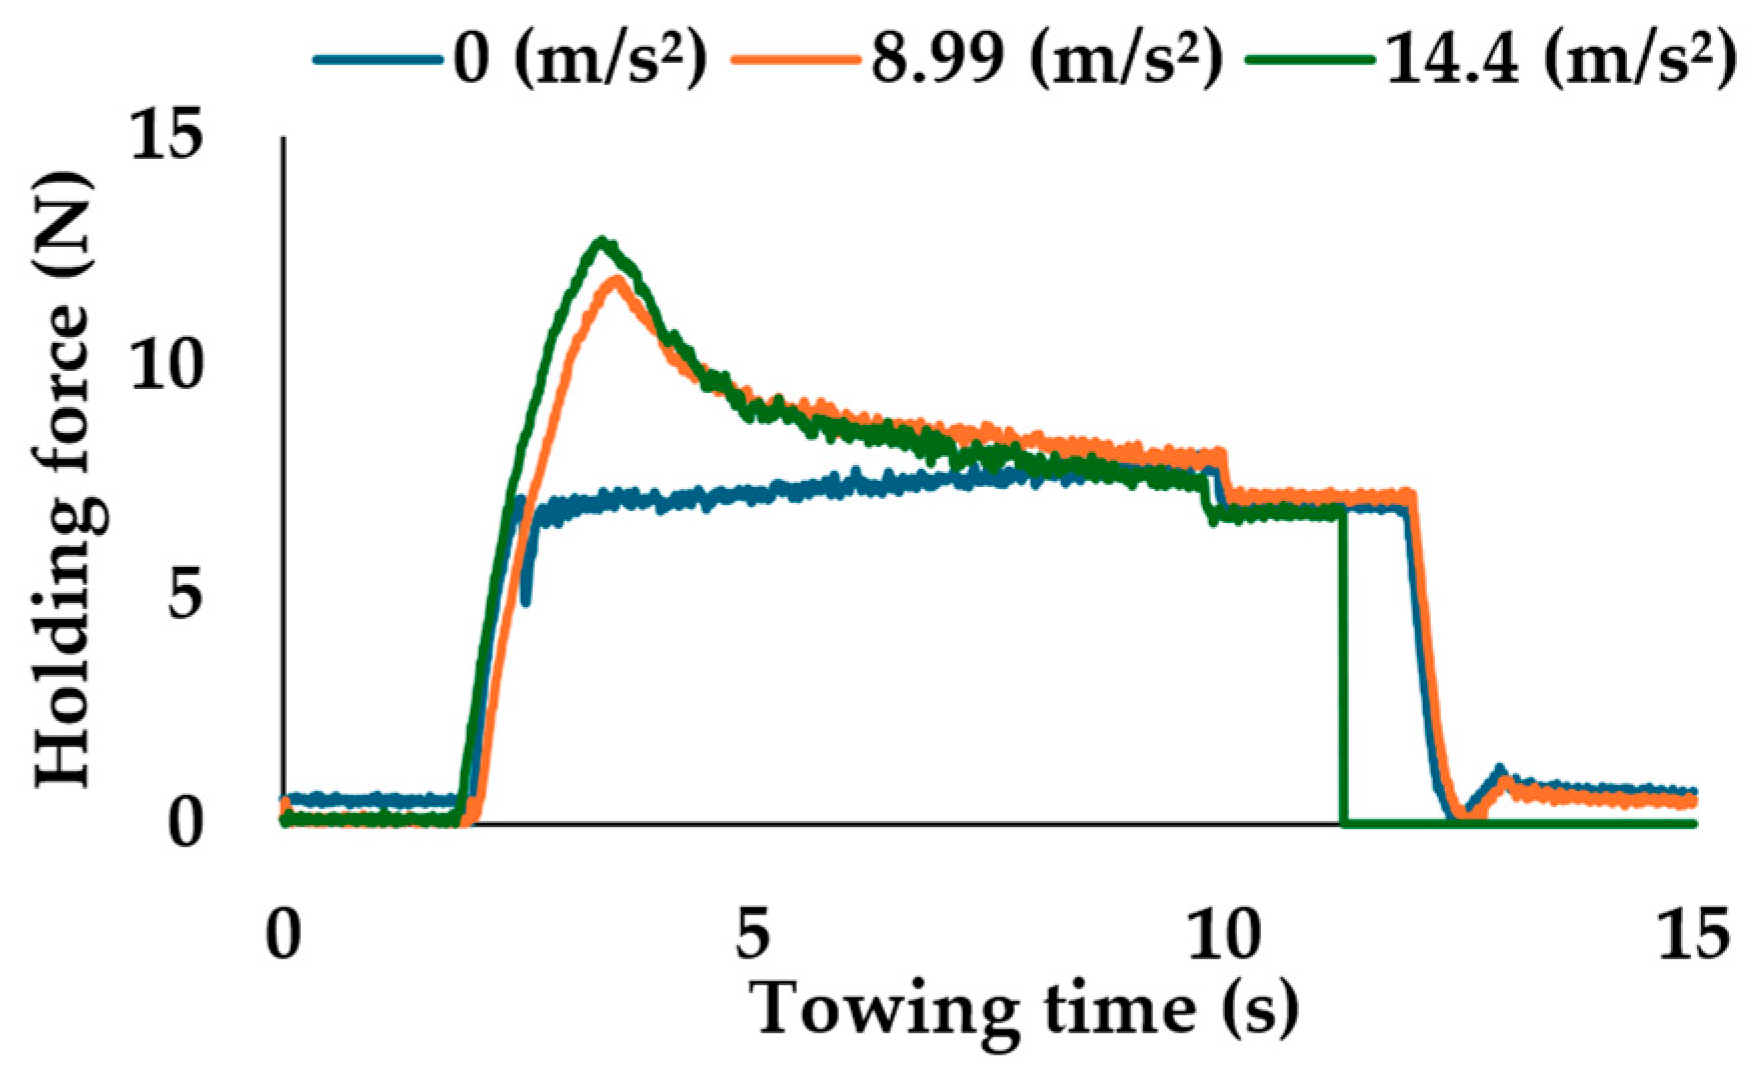
Figure 15 shows the relationship between towing time and holding force. Because of the large number of test conditions, representative data are presented for the anchor with the 45° tip angle and a penetration depth of 0.07 m. This case was selected as it includes all three vibration levels (0, 8.99, and 14.4 m/s2) and achieved the greatest penetration depth. Furthermore, Figure 16 shows the relationship between penetration depth and holding force under different vibration accelerations. As a reference, a holding force of 15.5 N and the theoretical values for each embedment depth are also shown. Figure 16a–d correspond to tip angles of 45, 60, 75, and 90°, respectively.
The results below are observed in Figure 15 and Figure 16.
In Figure 15, in all cases, the holding force increases sharply, indicating that the surrounding soil rapidly begins to resist. The application of vibration significantly increases the holding force, with 8.99 m/s2 and 14.4 m/s2 conditions exhibiting higher maximum values compared to the 0 m/s2 condition. After peaking, the holding force under 8.99 m/s2 and 14.4 m/s2 conditions gradually decreases over time, which is considered to result from the failure of the compressed soil around the anchor. In contrast, at 0 m/s2, the force does not exhibit a distinct peak. Instead, it increases rapidly at first and then continues to rise slowly before finally converging, suggesting that in the absence of vibration, the interaction between the soil and the structure is more stable.
Figure 16 shows that the holding force increases with penetration depth in all conditions. Applying vibration enhances holding force at equal depth and tip angle, evidencing soil densification. These results indicate that vibration increases holding force. Then, this effect increases with larger vibrations. Additionally, a vibration of 14.4 m/s2 is required to exceed 15.5 N for all angles, while forces remain below this reference under 0 and 8.99 m/s2 conditions. Thus, strong vibration is essential for sufficient anchoring in saturated soft soil. Furthermore, a comparison of measured and theoretical holding forces reveals discrepancies, which increase with larger tip angles and deeper embedment. Nevertheless, experimental trends generally align with theory, implying that unmodeled factors such as local densification by penetration and vibration enhanced resistance.
The experimental results allow for the following considerations:
The observed discrepancies between theoretical and experimental values are likely attributable to the compression of the surrounding soil during the towing process. Soil compression increases the internal friction angle and unit weight, thereby enhancing the holding force. The trend that this discrepancy becomes more pronounced at larger penetration depths and tip angles further supports this interpretation. This is because larger depths and tip angles increase the contact area between the anchor and the surrounding soil. As a result, the volume of compressed soil increases, leading to a higher holding force than predicted by theory. Additionally, the discrepancy also increases with stronger vibration intensity. This is likely because stronger vibration densifies the surrounding soil. Densification expands the compressed zone, further enhancing the holding force. Furthermore, as shown in Figure 16, anchors with larger tip angles exhibit higher holding forces. This result suggests that anchors with poor penetration performance benefit more from vibration. As shown in Figure 16, anchors with larger tip angles exhibit higher holding forces. Larger tip angles indicate lower penetration performance due to increased resistance during embedment. However, the use of vibration compensates for this drawback. Even with limited penetration, sufficient holding force can still be achieved. In other words, vibration enables shorter anchors to be used effectively. This makes it possible to maintain the position of underwater robots without relying on large or heavy anchors. Such a benefit is particularly important in underwater applications, where reducing anchor size and weight is critical.

6. Conclusions

This study proposed a vibratory anchoring method using composite-shaped anchors for maintaining the posture of small underwater robots. In this method, the relationship between anchor tip angle and vibration plays a crucial role, as it significantly affects the anchor’s performance. To address the relationship, we conducted penetration and towing experiments in underwater saturated soft soil to clarify the optimal tip angle for vibratory anchoring. Based on the experimental results, the following conclusions were drawn:
  • At 0 m/s2 and 8.99 m/s2, none of the anchors reached the target penetration depth, whereas at 14.4 m/s2, all anchors achieved sufficient depth. This result indicates that penetration depth increases with higher vibration.
  • Anchors with smaller tip angles exhibited greater penetrability.
  • At 0 m/s2 and 8.99 m/s2, the holding force remained below 15.5 N under all conditions, while at 14.4 m/s2, all tip angles yielded holding forces exceeding 15.5 N. This suggests that higher vibration enhances holding performance.
  • Larger tip angles tended to produce greater holding force at the same depth.
These findings suggest that penetration depth and holding force both increase with higher vibration, and that this effect becomes more pronounced for a larger tip angle.
In summary, the proposed vibratory anchoring system enables sufficient penetration and holding capacity under limited thrust conditions, thereby addressing a major limitation of conventional anchoring methods for small underwater robots. This capability allows robots to maintain a stable posture without continuous thruster use, reducing power consumption and extending operational time. In addition, posture stabilization by anchoring improves the reliability of observational data by minimizing motion noise caused by currents. These advantages make the system particularly attractive for practical applications in coastal fisheries, where compact and low-cost robots are required. Nevertheless, several limitations remain. First, this study focused solely on sandy soils, and the applicability of the system to clay or mixed seabed has yet to be verified. Second, the long-term durability of anchors under repeated use has not been assessed, although it is critical for reusability in practice. Finally, the influence of more complex field conditions—such as seabed slopes, heterogeneous layering, and ocean currents—was not examined. Addressing these issues will be essential to broaden the applicability of the system and ensure reliable operation in diverse marine environments.
For future work, we plan to refine the theoretical model by incorporating soil compression and variations in water content with depth to resolve discrepancies with experimental results. To assess reusability, pullout tests simulating retrieval conditions will be performed. In addition, a testbed reproducing realistic seabed environments—including water flow, heterogeneous soils (sand, clay, and mixed), and slopes—will be developed to enable more comprehensive validation experiments.

Author Contributions

Conceptualization, A.O., Y.K., K.M. and K.I.; Methodology, A.O.; Software, A.O.; Validation, A.O.; Formal analysis, A.O.; Investigation, A.O.; Resources, A.O.; Data curation, A.O.; Writing—original draft, A.O.; Writing—review & editing, A.O., D.F., T.W., N.M., Y.K., K.M. and K.I.; Visualization, A.O.; Supervision, K.I.; Project administration, K.I. All authors have read and agreed to the published version of the manuscript.

Funding

This research received no external funding.

Institutional Review Board Statement

Not applicable.

Informed Consent Statement

Not applicable.

Data Availability Statement

The data presented in this study are available on request from the corresponding author. The data are not publicly available due to privacy.

Conflicts of Interest

The authors declare no conflict of interest.

References

  1. Ministry of Agriculture, Forestry and Fisheries (MAFF). White Paper on Fisheries. Available online: https://www.maff.go.jp/e/data/publish/White_Paper_on_Fisheries/White_Paper_on_Fisheries_Summary_FY2023_Trends_in_Fisheries_FY_2024_Fisheries_Policy.pdf (accessed on 17 April 2025).
  2. Japan: 40% of Fishery Workers are Over 65 Years Old; 70% of Aquaculture Operators Have No Successors. Available online: https://www.seafoodnews.com/Story/1286041/Japan-40-percent-of-Fishery-Workers-are-Over-65-Years-Old-70-percent-of-Aquaculture-Operators-Have-No-Successors (accessed on 17 April 2025).
  3. Ministry of Agriculture, Forestry and Fisheries of Japan. Fisheries Structure Dynamics Survey. Available online: https://www.maff.go.jp/j/tokei/kouhyou/gyogyou_doukou/index.html (accessed on 18 January 2025). (In Japanese)
  4. Merten, W.; Reyer, A.; Savitz, J.; Amos, J.; Woods, P.; Sullivan, B. Global Fishing Watch: Bringing Transparency to Global Commercial Fisheries. arXiv 2016, arXiv:1609.08756. Available online: https://arxiv.org/abs/1609.08756 (accessed on 17 April 2025). [CrossRef]
  5. Rowan, N.J. The Role of Digital Technologies in Supporting and Improving Fishery and Aquaculture Across the Supply Chain—Quo Vadis? Trends Food Sci. Technol. 2022, 129, 226–234. [Google Scholar] [CrossRef]
  6. Akbari, A.; Nahavandi, S. Kalypso: A 3D-Printed Autonomous Underwater Vehicle for Inspection at Fisheries. J. Mech. Rob. 2022, 16, 041003. [Google Scholar] [CrossRef]
  7. Uemura, M.; Sagawa, T.; Fujii, T. Development of a Small Size Underwater Robot for Observing Fisheries Resources—Underwater Robot for Assisting Abalone Fishing. In Proceedings of the International Symposium on Underwater Technology 2010, Tokyo, Japan, 20–23 April 2010; IEEE: Piscataway, NJ, USA, 2010; pp. 1–6. [Google Scholar] [CrossRef]
  8. Seikai, T.; Matsuyama, M. The Use of an ROV in the Study of Juvenile Flatfish. Bull. Jpn. Soc. Sci. Fish. 1995, 61, 889–896. [Google Scholar]
  9. Li, Y.; Zhang, Z. Application of Intelligent and Unmanned Equipment in Aquaculture. Aquac. Fish. 2021, 6, 645–653. [Google Scholar] [CrossRef]
  10. Vu, T.; Kim, M.; Kang, H.; Park, S. Station-Keeping Control of a Hovering Over-Actuated Autonomous Underwater Vehicle under Ocean Current Effects and Model Uncertainties in Horizontal Plane. IEEE Access 2021, 9, 6854–6867. [Google Scholar] [CrossRef]
  11. Fernández, J.L.; Hollinger, G.A. Model Predictive Control for Underwater Robots in Ocean Waves. In Proceedings of the IEEE International Conference on Robotics and Automation (ICRA), Seattle, WA, USA, 26–30 May 2015; pp. 4715–4721. [Google Scholar] [CrossRef]
  12. Liu, X.; Zhang, Y.; Chen, H.; Wang, R. A Maneuverable Underwater Vehicle for Near-Seabed Observation. Nat. Commun. 2024, 15, 10284. [Google Scholar] [CrossRef] [PubMed]
  13. Yoon, J.; Lee, H.; Kim, D. Optimal Attitude Determination for the CR200 Underwater Walking Robot. Appl. Sci. 2024, 14, 11027. [Google Scholar] [CrossRef]
  14. Salah, F.; Abdellatif, A.; Elbarrad, A.; Refaat, S. Design of Light Weight–Low Cost Remotely Operated Underwater Vehicle. In Proceedings of the ASME 2021 International Design Engineering Technical Conferences and Computers and Information in Engineering Conference (IDETC/CIE 2021), Virtual, 17–19 August 2021. Paper No. DETC2021-70555. [Google Scholar] [CrossRef]
  15. Arland, M.; Sharma, V.; Sinha, S. TARGET—Development of Submersible ROV System for BMN Inspection. J. Energy 2022, 71, 24–28. [Google Scholar] [CrossRef]
  16. Durgunoglu, H.T.; Mitchell, J.K. Static Penetration Resistance of Soils; NASA Technical Note TN D-7275; NASA: Washington, DC, USA, 1973. [Google Scholar]
  17. Yu, Y.; Yang, J. The Penetration Resistance of the Elliptical Tip of Torpedo Anchors in Cohesive Soil. Ocean Eng. 2020, 208, 107413. [Google Scholar] [CrossRef]
  18. Merifield, R.S.; Sloan, S.W. The Ultimate Pullout Force of Anchors in Frictional Soils. Can. Geotech. J. 2006, 43, 852–868. [Google Scholar] [CrossRef]
  19. Rowe, R.K.; Davis, E.H. The Behaviour of Anchor Plates in Sand. Geotechnique 1982, 32, 25–41. [Google Scholar] [CrossRef]
  20. Wei, J.; Wang, W.; Wu, J. Hydro-Mechanically Coupled Numerical Modelling on Vibratory Open-Ended Pile Driving in Saturated Sand. Appl. Sci. 2022, 12, 4527. [Google Scholar] [CrossRef]
  21. Staubach, P.; Machaček, J.; Skowronek, J.; Wichtmann, T. Vibratory Pile Driving in Water-Saturated Sand: Back-Analysis of Model Tests Using a Hydro-Mechanically Coupled CEL Method. Soils Found. 2021, 61, 144–159. [Google Scholar] [CrossRef]
  22. Craig, R.F. Craig’s Soil Mechanics, 7th ed.; Spon Press: London, UK, 2004; pp. 164–167. [Google Scholar]
  23. Terzaghi, K.; Peck, R.B.; Mesri, G. Soil Mechanics in Engineering Practice, 3rd ed.; John Wiley & Sons: New York, NY, USA, 1996; pp. 83–85,132. [Google Scholar]
  24. Aksoy, H.S.; Gör, M.; İnal, E. Skin Friction Between Soil and Pile Materials. In Proceedings of the International Conference on Problematic Soils, Elazığ, Turkey, 3–5 November 2016. [Google Scholar]
  25. Atkinson, J.H. The Mechanics of Soils and Foundations, 2nd ed.; Routledge: London, UK, 2017; pp. 371–372. [Google Scholar]
  26. Budhu, M. Soil Mechanics and Foundations, 3rd ed.; John Wiley & Sons: Hoboken, NJ, USA, 2011; pp. 521–535. [Google Scholar]
  27. Evirgen, B.; Tuncan, A.; Tuncan, M. Development of Umbrella Anchor Approach in Terms of the Requirements of Field Application. Geomech. Eng. 2019, 18, 277–289. [Google Scholar] [CrossRef]
  28. Seed, H.B.; Idriss, I.M. Simplified Procedure for Evaluating Soil Liquefaction Potential. J. Soil Mech. Found. Div. 1971, 97, 1249–1273. [Google Scholar] [CrossRef]
  29. Idriss, I.M.; Boulanger, R.W. Soil Liquefaction During Earthquakes; Earthquake Engineering Research Institute: Oakland, CA, USA, 2008. [Google Scholar]
  30. Lukas, R.G. Dynamic Compaction; FHWA Report No. FHWA/RD-86/133; Federal Highway Administration: Washington, DC, USA, 1986. [Google Scholar]
  31. Munson, B.R.; Young, D.F.; Okiishi, T.H.; Huebsch, W.W. Fundamentals of Fluid Mechanics, 7th ed.; John Wiley & Sons: Hoboken, NJ, USA, 2013; pp. 512–514. [Google Scholar]
  32. Byun, Y.H.; Kim, Y.; Kim, M.M. Capacity Evaluation of Plate Anchors with Inclined Plates in Sand. Ocean Eng. 2019, 190, 106472. [Google Scholar] [CrossRef]
  33. Li, S.; Zhang, L. Cyclic Shear Behavior of Saturated Clean Sand under Consolidated Undrained Condition. Soil Dyn. Earthq. Eng. 2009, 29, 477–485. [Google Scholar] [CrossRef]
  34. Federal Highway Administration (FHWA). Soils and Foundations—Volume I; Report No. FHWA NHI-06-088; U.S. Department of Transportation: Washington, DC, USA, 2006.
  35. Seed, H.B.; Lee, K.L. Liquefaction of Saturated Sands During Cyclic Loading. J. Soil Mech. Found. Div. 1966, 92, 105–134. [Google Scholar] [CrossRef]
  36. Dong, J.; Zhang, S.; Wu, Z.-H.; Hu, J.L.; Liu, Y.Q.; Wang, Y.C.; Cheng, S.W. The Bearing Characteristics of Sand Anchors under Vibrating Load. Appl. Sci. 2023, 13, 5651. [Google Scholar] [CrossRef]
Figure 1. Attitude control of underwater robots: (a) attitude control by thrusters; (b) attitude control by anchors.
Geotechnics 05 00068 g001
Figure 2. Distribution of resistance on anchors in soft soil.
Geotechnics 05 00068 g002
Figure 3. Penetration mechanism of anchors in soft soil.
Geotechnics 05 00068 g003
Figure 4. Structure and working principle of a composite-shaped anchor.
Geotechnics 05 00068 g004
Figure 5. Soil fluidization mechanism induced by vibration: (a) before vibration; (b) during vibration; (c) after vibration. Brown circles denote soil particles; blue areas are water-filled voids. The red dotted circle marks a representative void. Arrows indicate particle motion during vibration, leading to particle rearrangement and void reduction. Colors are for distinction only.
Geotechnics 05 00068 g005
Figure 6. Cross-section of composite-shaped anchors.
Geotechnics 05 00068 g006
Figure 7. Appearance and configuration of the underwater robot.
Geotechnics 05 00068 g007
Figure 8. Distribution of resistance on composite-shaped anchors in soil.
Geotechnics 05 00068 g008
Figure 9. Schematic of penetration experimental procedures: (a) initial phase; (b) penetration phase; (c) stopping phase. Colors are used only to distinguish components: frame (gray), actuator (white), chain/anchor body (black), vibration motor (red), water (light blue), and saturated sand bed (yellow). Arrows indicate motion direction.
Geotechnics 05 00068 g009
Figure 10. Image of actual penetration experiment: (a) actual experimental machine; (b) initial phase; (c) penetration phase; (d) stopping phase.
Geotechnics 05 00068 g010
Figure 11. Relationship between penetration depth and tip angle with each vibration.
Geotechnics 05 00068 g011
Figure 12. Relationship between penetration resistance and measurement time with each tip angle: (a) 45°; (b) 60°; (c) 75°; (d) 90°.
Geotechnics 05 00068 g012
Figure 13. Schematic of towing experimental procedures: (a) initial phase; (b) penetration phase; (c) towing phase. Colors are used only to distinguish components: frame (gray), actuators (white), chain/anchor body (black), vibration motor (red), water (light blue), and saturated sand bed (yellow). Arrows indicate penetration/towing direction.
Geotechnics 05 00068 g013
Figure 14. Image of actual towing experiment: (a) actual experimental machine; (b) initial phase; (c) penetration phase; (d) towing phase.
Geotechnics 05 00068 g014
Figure 15. Relationship between towing time and holding force for the case with a tip angle of 45° and a penetration depth of 0.07 m.
Geotechnics 05 00068 g015
Figure 16. Relationship between penetration depth and holding force with each tip angle: (a) 45°; (b) 60°; (c) 75°; (d) 90°.
Geotechnics 05 00068 g016
Table 1. Geometrical parameters of a composite-shaped anchor.
Parameters of Conical Section (Unit)Cylinder Section Parameters (Unit)
Tip   Angle   θ (°)He ight   h (m) Diameter   d (m) Oblique   Line   l (m)He ight   a (m) Diameter   b (m)
450.040.0330.0430.070.02
600.0460.046
750.0610.050
900.0800.057
Table 2. Specifications of the underwater robot [7].
Name (Unit)Value
Width (m)0.4
Length (m)0.27
Height (m)0.3
Output of each thruster (N)9
Estimated downward thrust (N)36
Weight (kg)4.9
Max speed (m/s)0.5
Table 3. Relationship between geometrical shape of composite-shaped anchors, target depth, and theoretical penetration depth.
Tip Angle (°)Target Depth (m)Theoretical Depth (m)
450.0900.190
600.0810.095
750.0730.054
900.0650.032
Table 4. Specifications of penetration experimental apparatus [32,33].
NameModel/TypeParameter (Unit)Value/Material
Line actuatorJS-TGZ-U2
Vibration motorTP-2528C-24
Force sensorSIT0555014R0A00
Anchor Downward load (N)36
MaterialPLA (polylactic acid)
Water KindTap water
Unit volume weight (N/m3)9800
Depth (mm)400
Sand KindSilica sand No.5
Average particle diameter (mm)0.45
Equality coefficient2
Soil particle density2.65
Effective unit volume weight (N/m3)9800
Unit volume weight of saturated condition (N/m3)19,600
Internal friction angle in saturated condition (°) 30 34
Depth (mm)350
Table 5. Relationship between vibration voltage and vibration parameters.
Vibration Voltage (V)Displacement (mm)Speed (mm/s)Acceleration (m/s2)
0000
200.00300.548.99
300.00101.6914.4
Table 6. Relationship between penetration depth and tip angle with each vibration.
Tip Angle (°)Vibration Acceleration (m/s2)Target Depth (m)Theoretical Depth (m)
08.9914.4
450.070.0900.190.0900.19
600.0550.0810.0950.0810.095
750.0470.0720.0540.0720.054
900.040.0650.0320.0650.032
Table 7. Specifications of the towing experimental apparatus.
NameModel/Type
Line actuator 2con350050-141220+449900
StopperLHRCWM30
Table 8. Target penetration depth range for each condition.
Tip Angle (°)Vibration Acceleration (m/s2)Penetration Range (m)
4500.04–0.07
8.990.04–0.07
14.40.04–0.09
6000.04–0.05
8.990.04–0.06
14.40.04–0.08
7500.04–0.04
8.990.04–0.05
14.40.04–0.07
9000.04–0.04
8.990.04–0.04
14.40.04–0.06
Disclaimer/Publisher’s Note: The statements, opinions and data contained in all publications are solely those of the individual author(s) and contributor(s) and not of MDPI and/or the editor(s). MDPI and/or the editor(s) disclaim responsibility for any injury to people or property resulting from any ideas, methods, instructions or products referred to in the content.