1. Introduction
Ensuring the structural integrity and long-term performance of pavements and subgrades is a key concern in geotechnical and pavement engineering. To evaluate material quality, a range of testing techniques are employed, typically classified into destructive and non-destructive methods. Destructive tests, such as core sampling and laboratory analysis of extracted materials, provide detailed insight into material composition and mechanical properties but are invasive, time-consuming, and limited to discrete test locations [
1,
2].
In contrast, non-destructive testing (NDT) methods enable rapid, in situ assessment of pavement systems without causing structural damage [
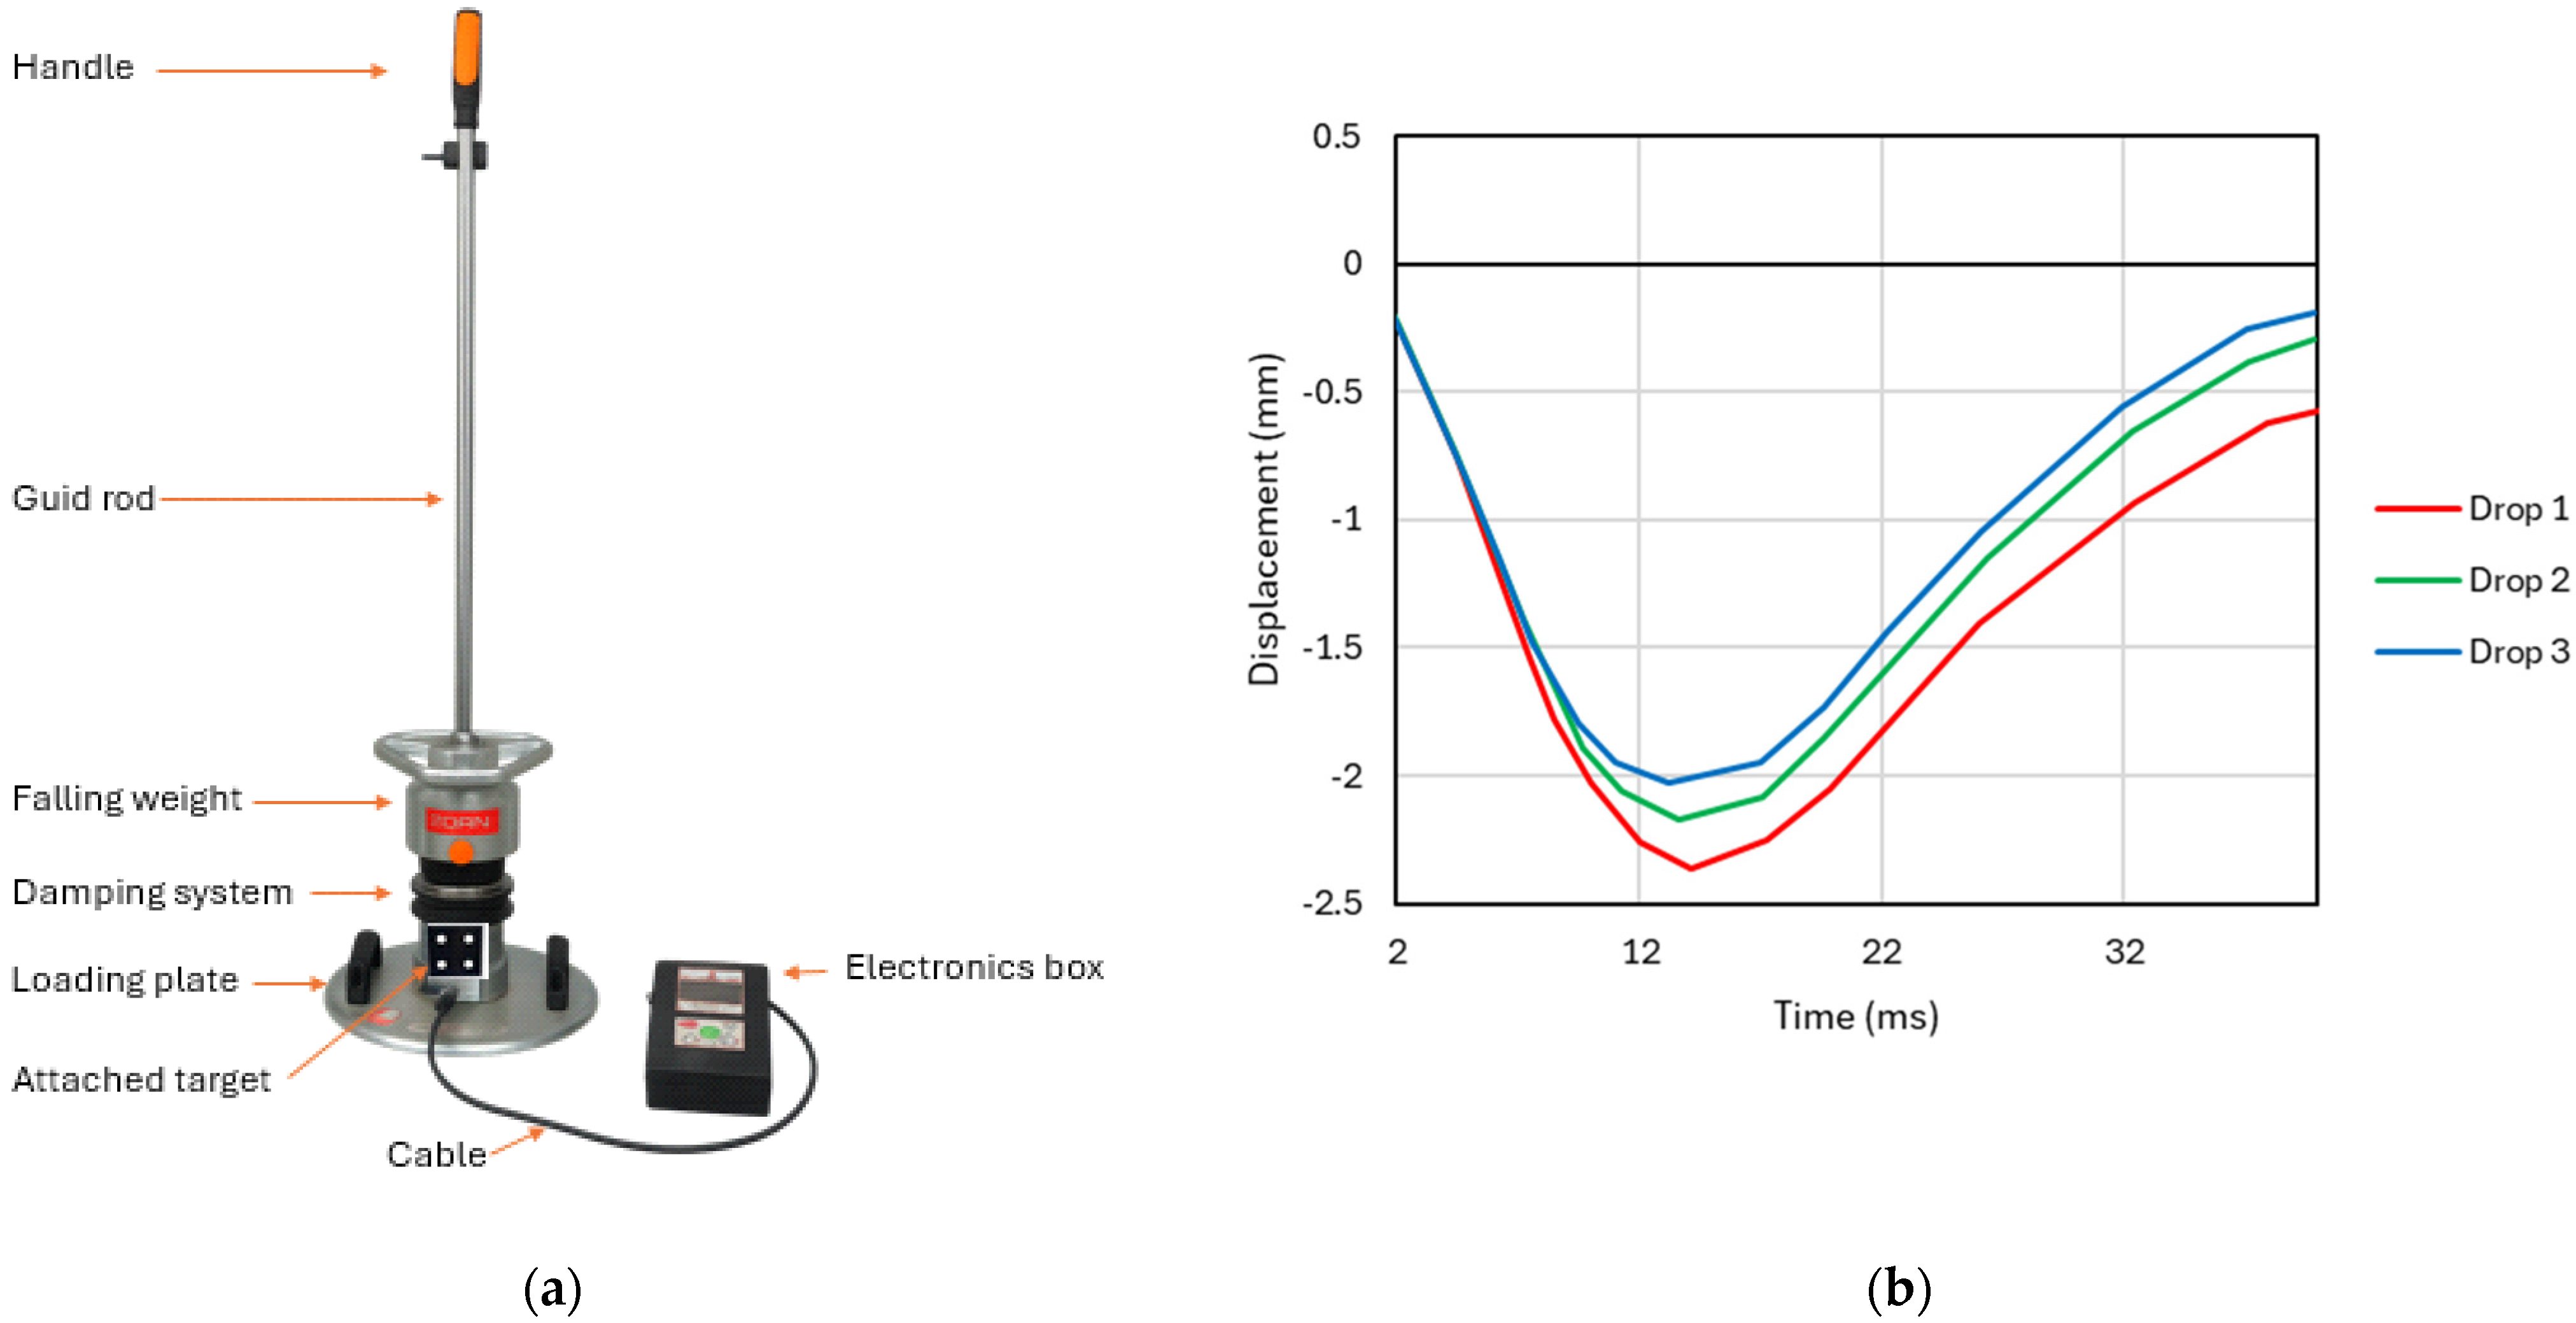
3]. Among these, the Falling Weight Deflectometer (FWD) and the Light Weight Deflectometer (LWD) are widely used due to their efficiency in measuring deflection-based responses that reflect the stiffness and load-bearing capacity of pavement layers [
4]. The FWD, typically mounted on a trailer, applies a controlled impulse load to the surface and captures the resulting deflection basin through a series of geophones. This information is crucial for evaluating structural capacity, identifying weakened sections, and designing overlays. The LWD, on the other hand, is a more compact and portable version of the deflectometer, suited for construction sites where quick compaction control is needed [
5]. It provides a direct estimate of the deformation modulus based on the deflection response to a dropped mass on a circular loading plate.
Originally developed in 1981 in Magdeburg, Germany, through collaboration between the Federal Highway Research Institute and HMP Company [
6], the LWD has since gained widespread international adoption, including in the United States [
7]. It has proven particularly valuable in geotechnical applications for assessing the stiffness of subgrade and unbound materials. In addition to LWD and FWD, other NDT methods such as Ground Penetrating Radar (GPR), visual inspections, laser profilometry, and crack detection systems contribute to a comprehensive understanding of pavement condition [
8,
9]. In the UK, over the past 20 years, increasing use of the LWD has occurred following changes to national specifications, specifically related to how data about the stiffness of underlying foundation layers is measured and used for pavement design [
10].
The stiffness modulus, often derived from deflection measurements, is a critical parameter obtained from both LWD and FWD tests [
11]. It serves as a key indicator of structural adequacy, construction quality, and compaction performance. Accurate determination of this modulus enables engineers to make informed decisions about material suitability, compaction effectiveness, and necessary reinforcement.
The LWD test provides a single-point modulus value with a relatively shallow depth of influence, whereas the FWD test measures deflections over a larger area and greater depth [
12,
13]. However, the FWD typically involves higher setup effort and cost compared to the more portable and easier-to-use LWD.
Given the importance of capturing accurate displacement data under dynamic loading, recent advancements have explored alternative or supplementary technologies to enhance testing capabilities. While the LWD remains widely used for routine assessments due to its convenience and portability [
10], its limitations, such as providing only a single-point stiffness value and lacking temporal resolution, motivate the development of more advanced methods. This study introduces a Vision-Based (VB) system developed to track surface displacement during impact loading and evaluate soil stiffness characteristics. The system’s accuracy and practicality are assessed through direct comparison with LWD-derived measurements, with the aim of establishing the VB system as a reliable tool for field and laboratory-based ground condition monitoring. It should be noted that the method still requires an impact load, such as that provided by an LWD drop weight. However, the loading source could in principle be modified (e.g., by varying drop mass and height) to mimic other deflectometer devices such as the LWD or FWD, which opens opportunities for broader application of the VB approach.
3. Verification of the VB System
3.1. Laboratory Testing
Laboratory experiments were conducted to assess the performance of the VB system under controlled conditions. Tests were carried out on three configurations: (1) sand (
Figure 4a), (2) sandy-gravel mixture (
Figure 4b), and (3) a sandy gravel layer with a buried concrete block approximately 10 cm below the surface (
Figure 4c). The particle size distributions (PSDs) of the two soils are shown in
Figure 5. Results from the VB system were directly compared with deformation modulus values obtained using the conventional Light Weight Deflectometer (LWD) test.
In the first test on sand, a single-drop LWD measurement yielded a deformation modulus of 9.39 MN/m
2, corresponding to a measured settlement of 2.395 mm. The VB system produced a closely matching modulus of 8.68 MN/m
2, demonstrating strong agreement (
Figure 6).
As expected, the stiffer sandy gravel mixture yielded higher values. The LWD test recorded a modulus of 15.7 MN/m
2, corresponding to a settlement of 1.43 mm, while the VB system returned a comparable modulus of 15.14 MN/m
2 (
Figure 7), further confirming its accuracy.
In the third scenario, involving a concrete block buried beneath the sandy gravel, the LWD test yielded a modulus of 23.22 MN/m
2 with a settlement of 0.97 mm, while the VB system estimated 20.45 MN/m
2 (
Figure 8). This indicates the system’s sensitivity to subsurface stiffness variations.
Overall, these results confirm the VB system’s capability to reliably estimate soil stiffness across different subsurface conditions. It is also important to note that the laboratory tests were conducted on uncompacted sand and gravel, which accounts for the relatively low modulus values.
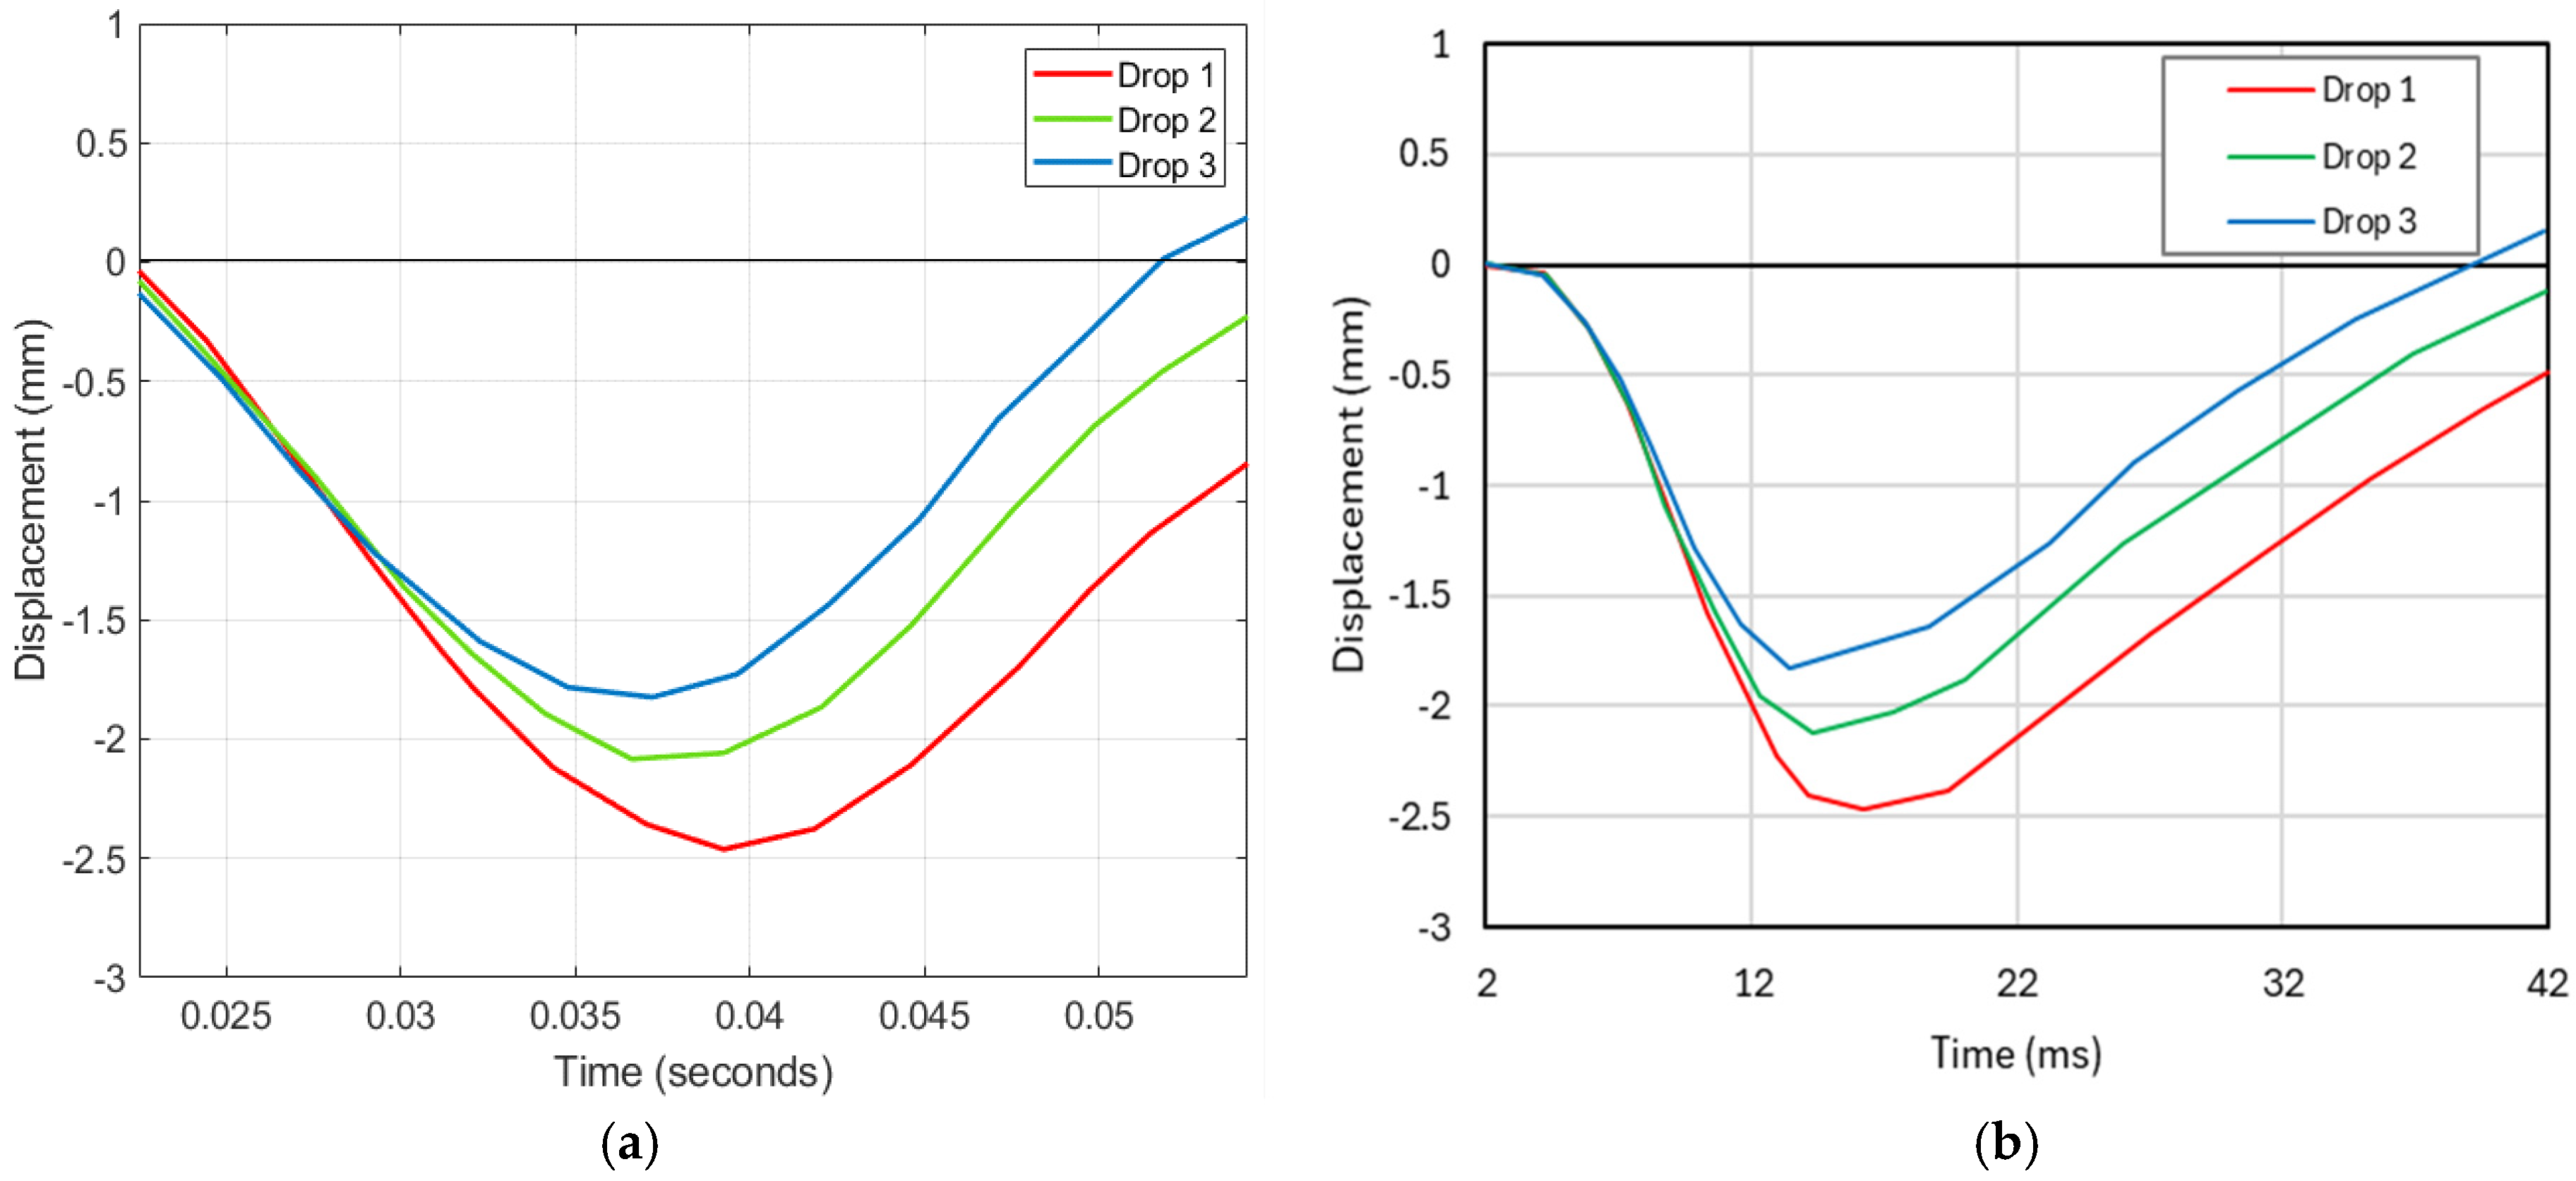
As discussed earlier, LWD testing is typically preceded by several seating (preloading) drops to ensure proper contact between the loading plate and the soil surface, which enhances repeatability and reliability. Without preloading, the displacement readings during initial drops may be exaggerated due to surface irregularities or insufficient contact pressure. To investigate this, a series of tests was conducted both to validate the VB system and to observe the displacement patterns across three consecutive drops without preloading.
Figure 9a,b show the displacement-time responses captured by the VB system and the LWD device, respectively. The results demonstrate very close agreement between both measurement methods, verifying the VB system’s accuracy. Notably, a clear reduction in maximum displacement from Drop 1 to Drop 3 was observed. This trend reflects a compaction effect resulting from repeated loading and underscores the importance of preloading in LWD procedures. The pulse shapes observed resemble the “Variable” deflection pattern described in existing literature [
17], which often indicates insufficient compaction or inconsistent plate-soil contact. For completeness,
Table 1 presents the peak displacements for each drop, further confirming the compaction behaviour and supporting the need for standardised preloading procedures.
The VB system was further tested in the laboratory using a soil box setup. Two high-speed cameras (400 fps) were synchronised to capture the wave propagation caused by an impact load. One camera was positioned at the source (LWD location on the sandy-gravel soil) and the other at a target point 1.3 m away (on the sandy soil) (
Figure 10a). The target mounted on a spring was used to measure the time delay of wave propagation from the impact point to a remote location. The spring mechanism accelerated the movement, making the displacement more visible to the high-speed camera.
The vertical displacement versus time signals recorded by both cameras is shown in
Figure 10b. The time delay (
) between the first peaks indicates the surface wave travel time, demonstrating the system’s ability to track wave propagation across the soil surface.
To assess the accuracy of the VB system under small displacement conditions, a LWD test was performed on a concrete slab surface. The results were compared directly with those obtained from the VB system. The comparison showed excellent agreement between the two methods. The VB system measured a peak vertical displacement of 0.27 mm, while the corresponding displacement recorded by the LWD was 0.29 mm. This close correlation highlights the VB system’s capability to reliably capture low-amplitude surface movements, even on rigid materials such as concrete.
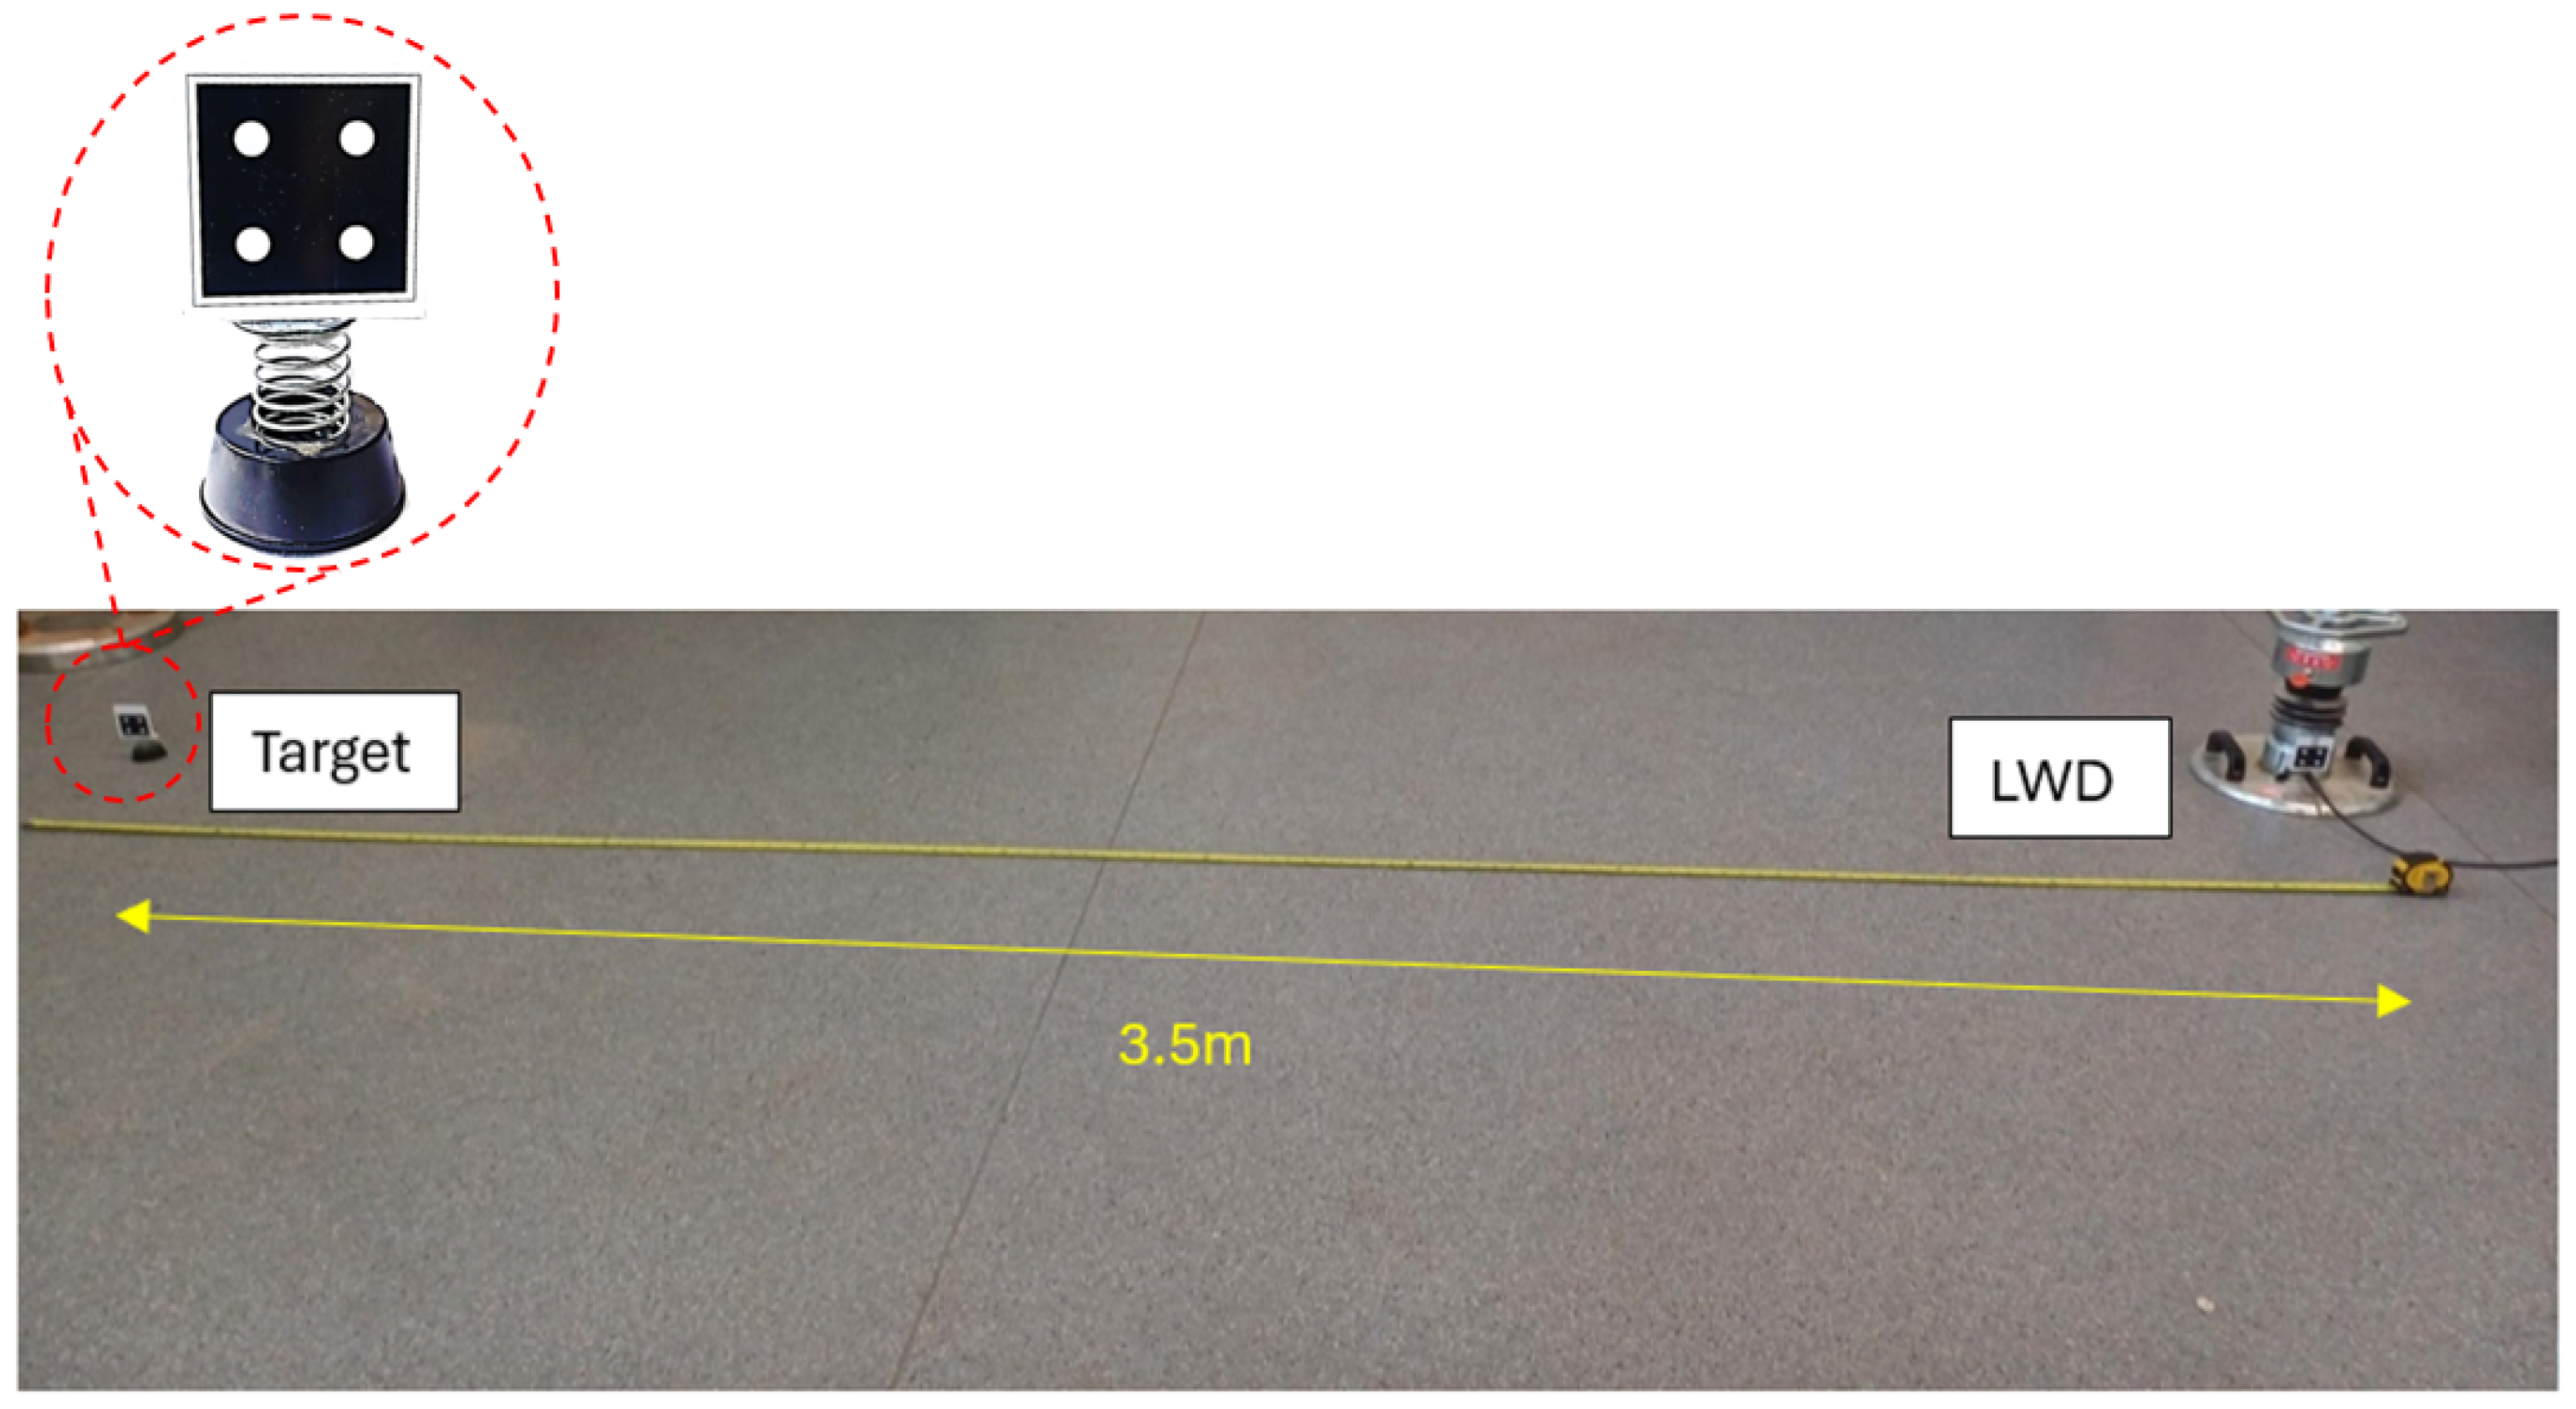
Following this initial validation at the point of impact, the system was further tested to evaluate its ability to capture wave propagation effects at a distance. For this purpose, the test was repeated on a concrete floor with an additional camera placed 3.5 m away from the source, enabling measurement of transmitted displacements at a remote location (
Figure 11).
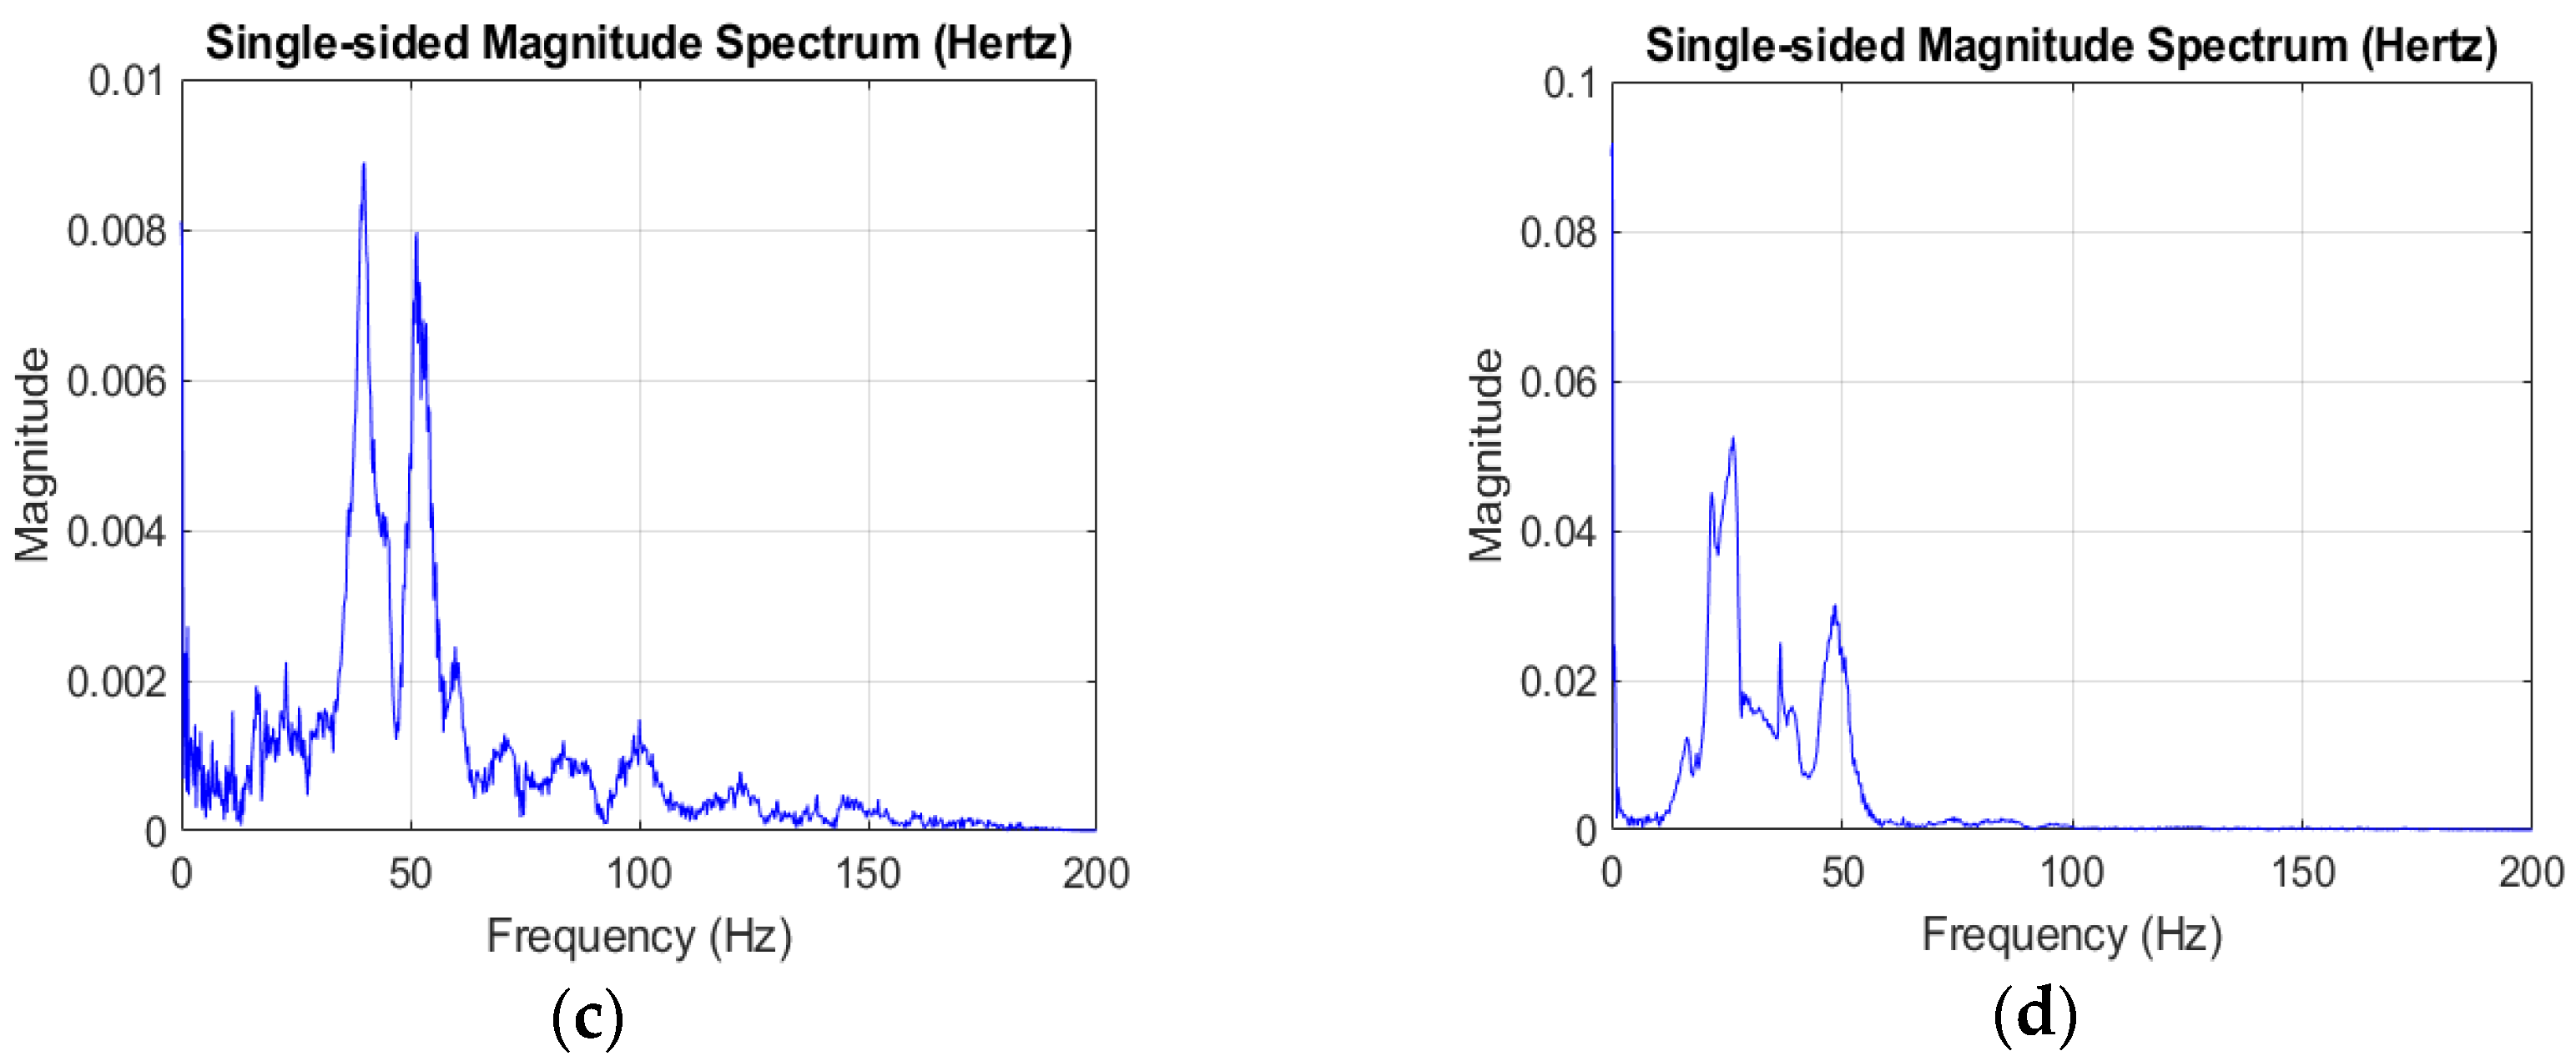
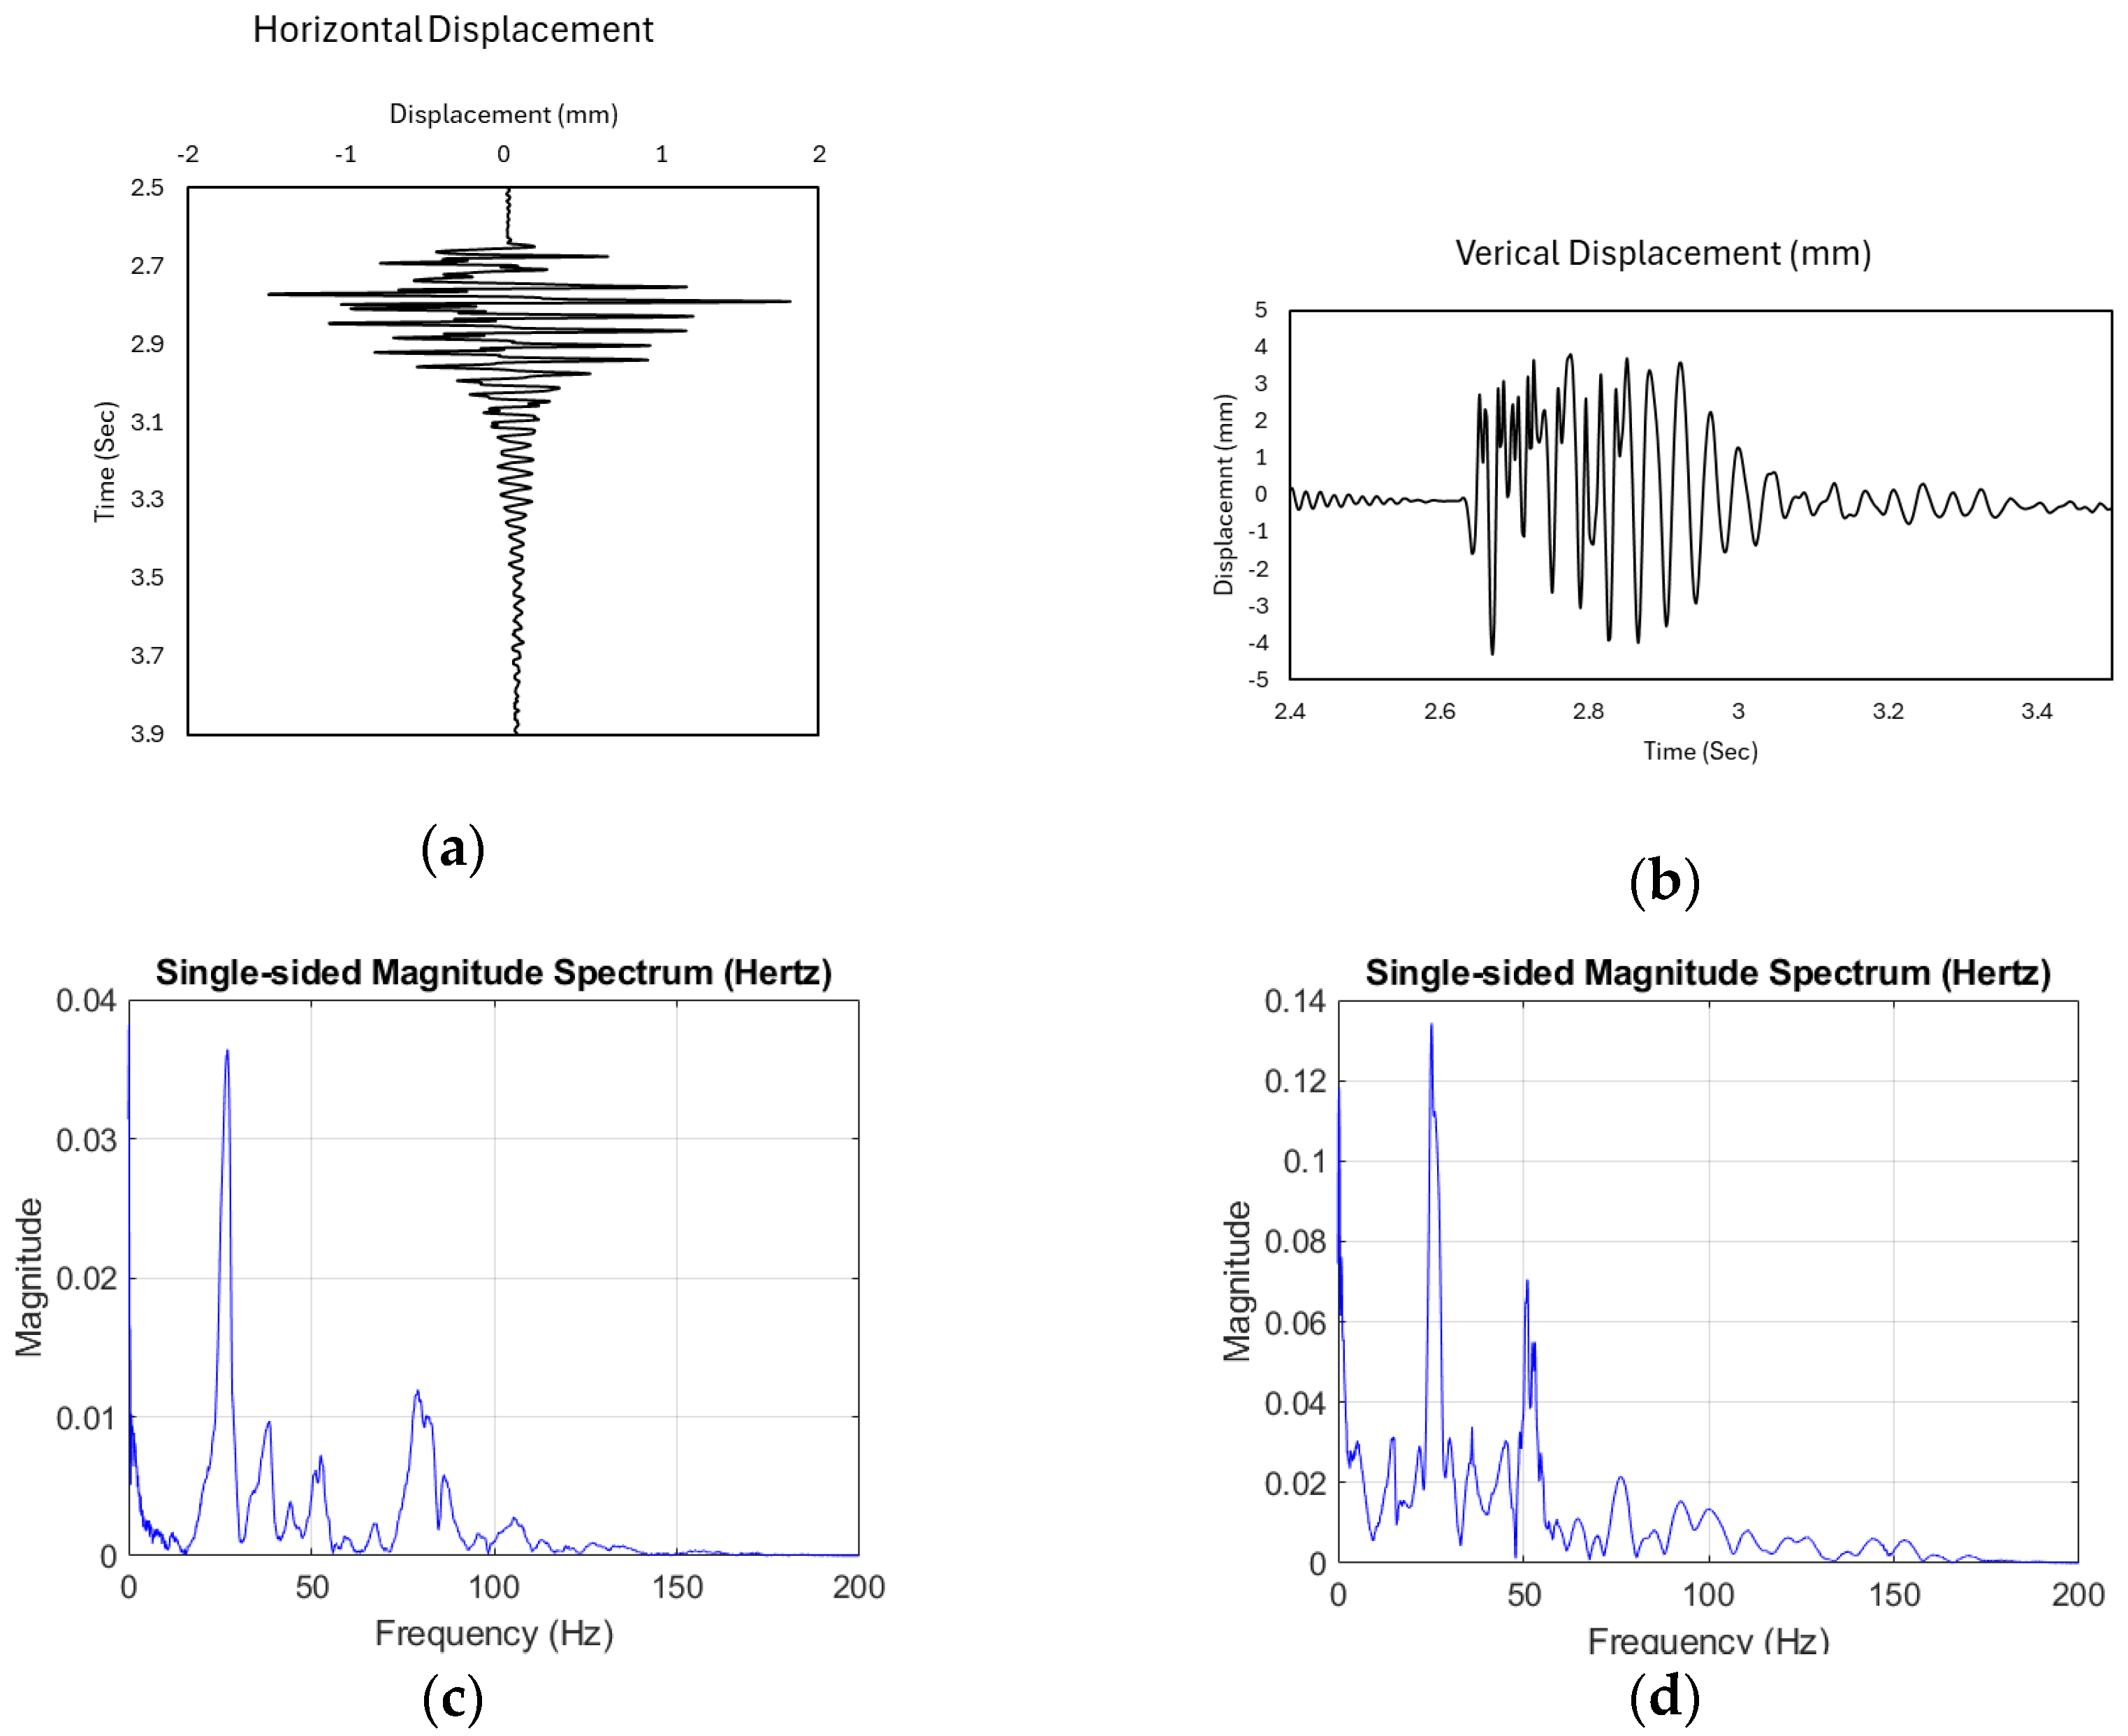
Signal analysis was carried out on both soil and concrete surfaces to evaluate the dynamic response of a spring-mounted target, as measured by the VB system.
Figure 12 shows results from the soil surface at 1.3 m from the source, where the vertical displacement peaked at approximately 2 mm and the horizontal at around 0.5 mm. The response was heavily damped, with oscillations decaying within 0.4 s, reflecting the sandy soil’s deformable and energy, absorbing characteristics. Frequency analysis showed dominant components below 50 Hz, with broad, low-magnitude peaks.
In contrast,
Figure 13 presents result from a concrete slab at 3.5 m, where despite the increased distance, the vertical displacement was larger, peaking at ~4 mm, and oscillations persisted for nearly 1 s. The horizontal response also showed higher amplitude (~1 mm) and slower decay. Frequency spectra revealed stronger and sharper peaks between 20–60 Hz, with vertical spectral magnitudes reaching up to 0.14. These findings highlight the significant role of subsurface stiffness: the stiff, low-damping concrete surface preserved and transmitted vibrational energy more efficiently, while the softer soil attenuated the response more rapidly.
3.2. Field Tests
Field testing was carried out at Brackenhurst Car Park, located on the Nottingham Trent University (NTU) campus. The site is an in-service but unpaved area underlain by compacted granular material. In both test zones (Zone A and Zone B), the LWD plate was placed directly on the compacted surface/subgrade, meaning that the measured response primarily reflects the stiffness of the near-surface layer within the LWD’s depth of influence. The site contains two visually distinct areas, Zone A and Zone B, which are illustrated in a schematic site layout (
Figure 14a). Test campaigns were organised to investigate each zone separately.
The field setup mirrored the laboratory configuration: two synchronised cameras were deployed, one focused on the LWD plate and the other on a spring-mounted target positioned 2.5 m from the impact source, shielded from wind by a Perspex cap (
Figure 14b). This setup enabled both direct comparison of VB–LWD displacement data and simultaneous measurement of wave travel time (
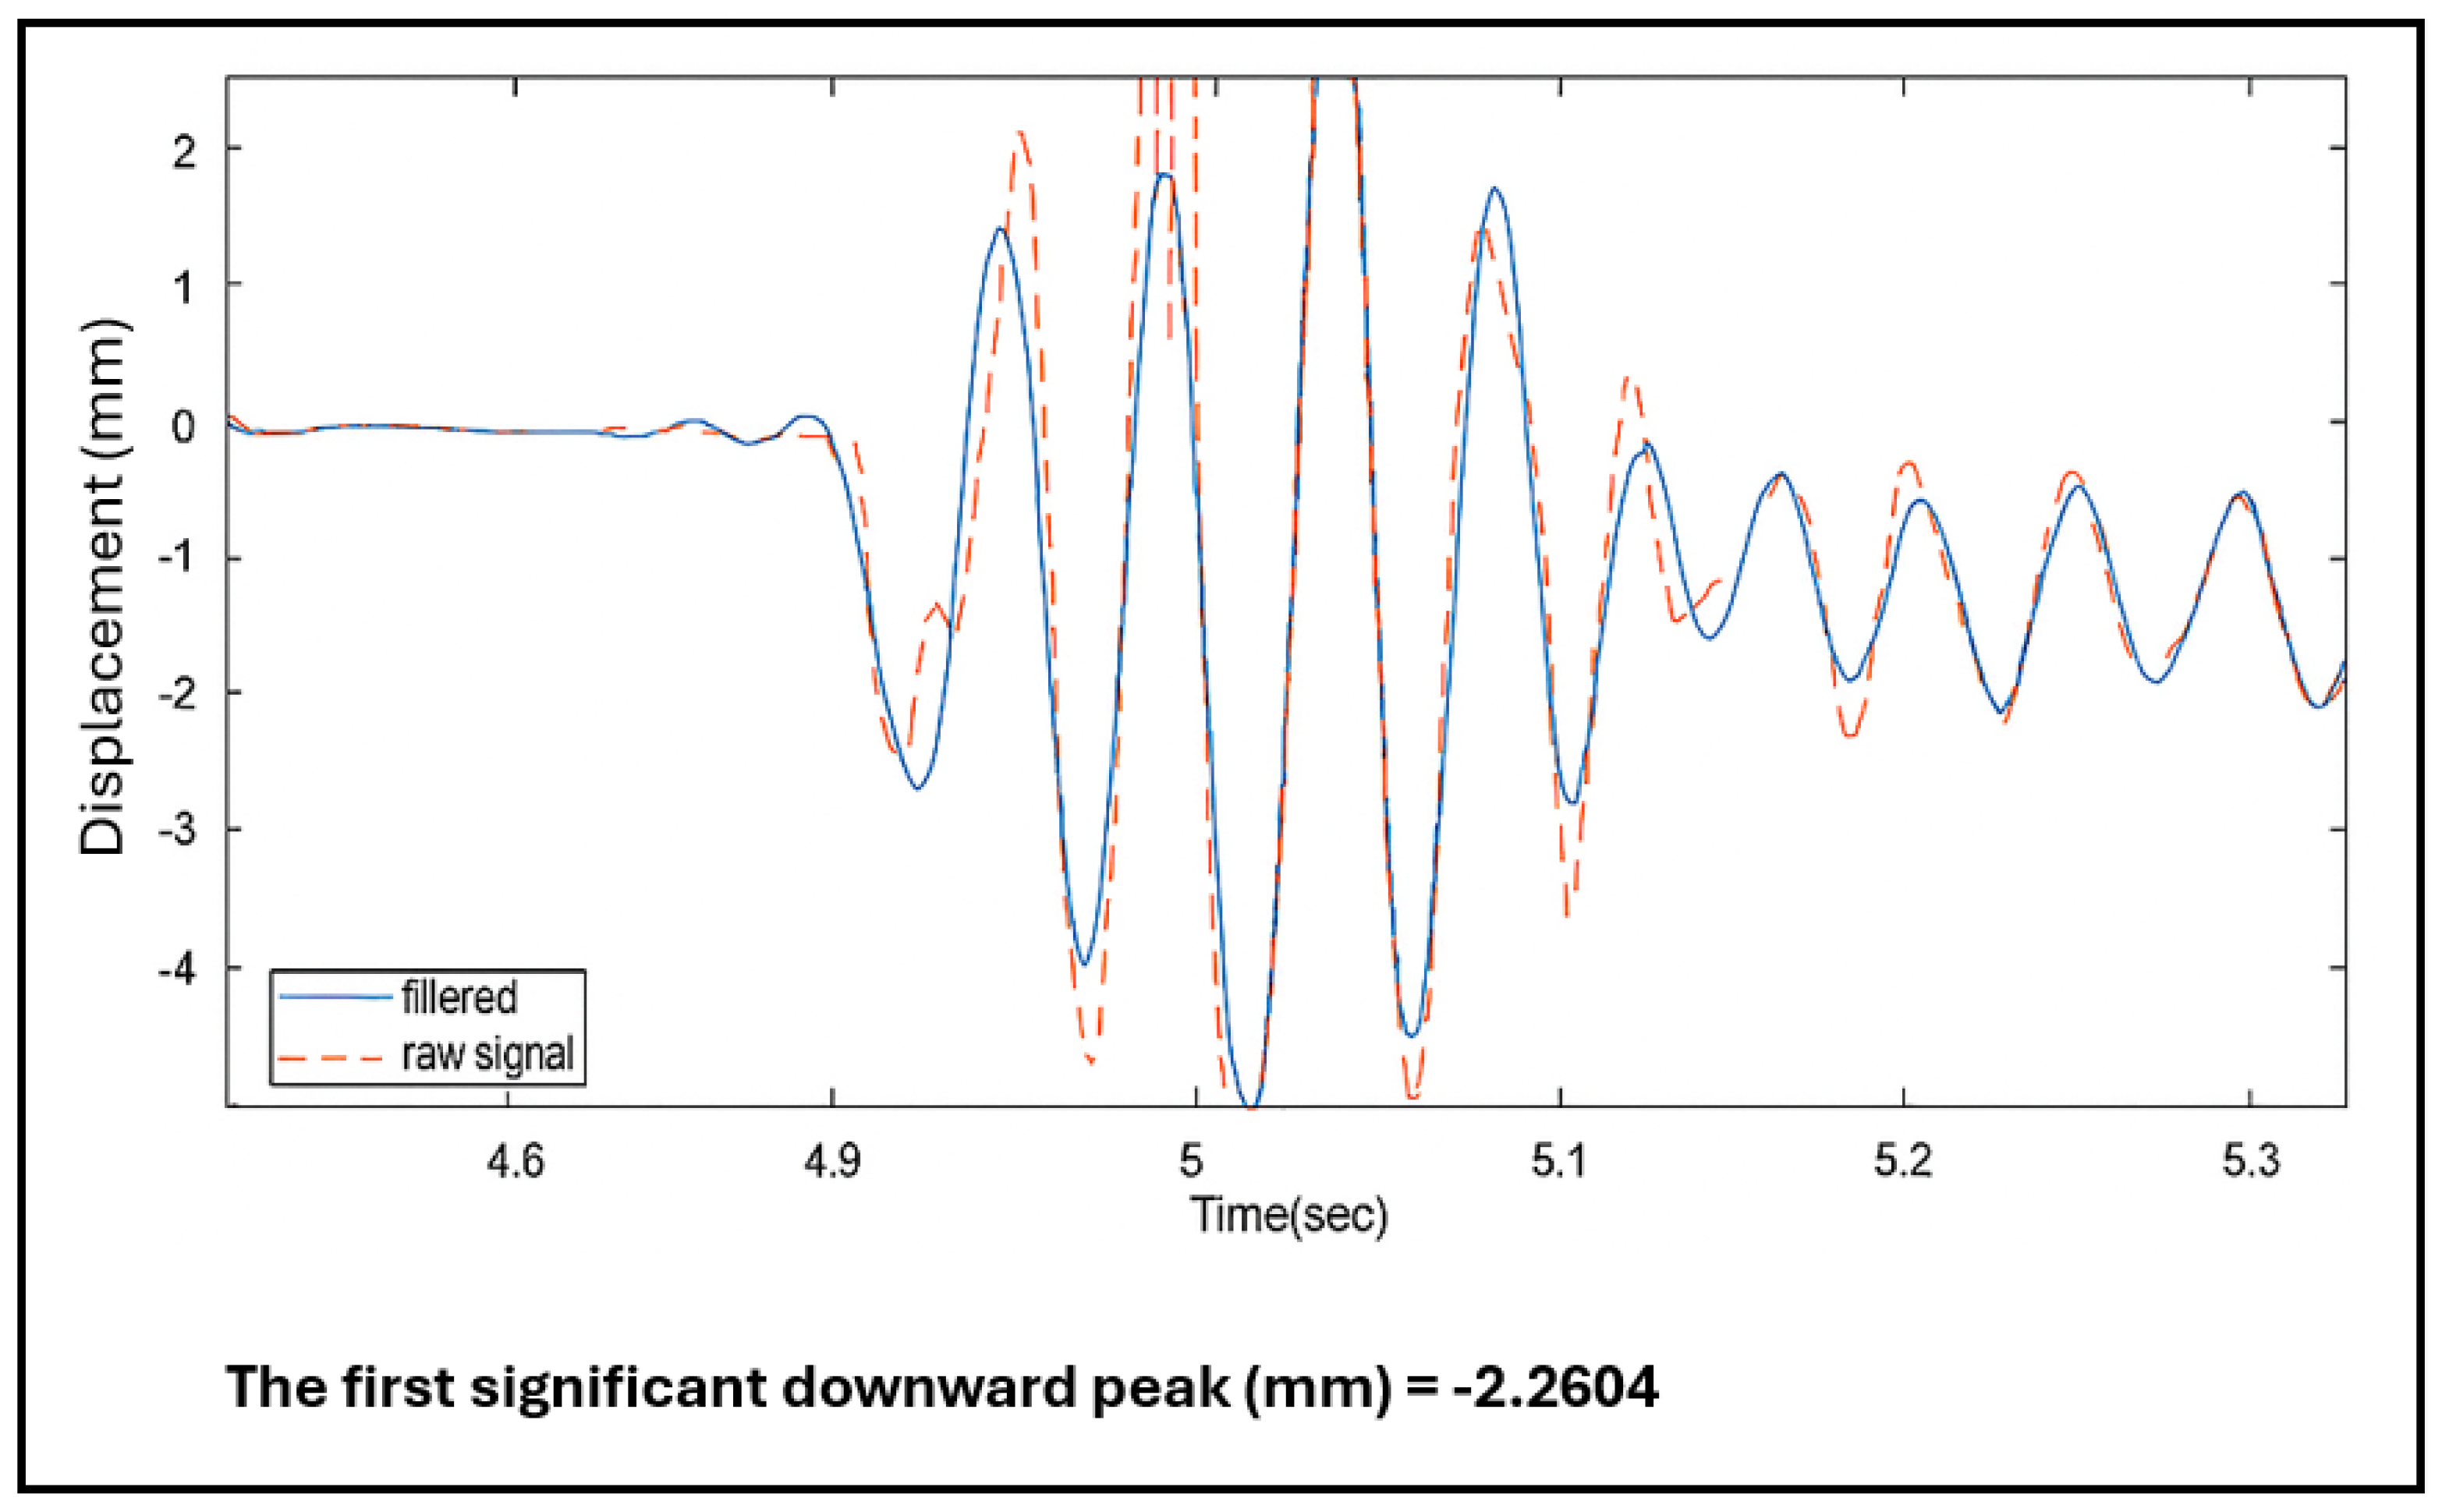
) between the source and offset target, providing preliminary insights into surface-wave propagation. Although higher temporal resolution could be achieved with >1000 fps cameras, the system was limited to 400 fps due to budget constraints.
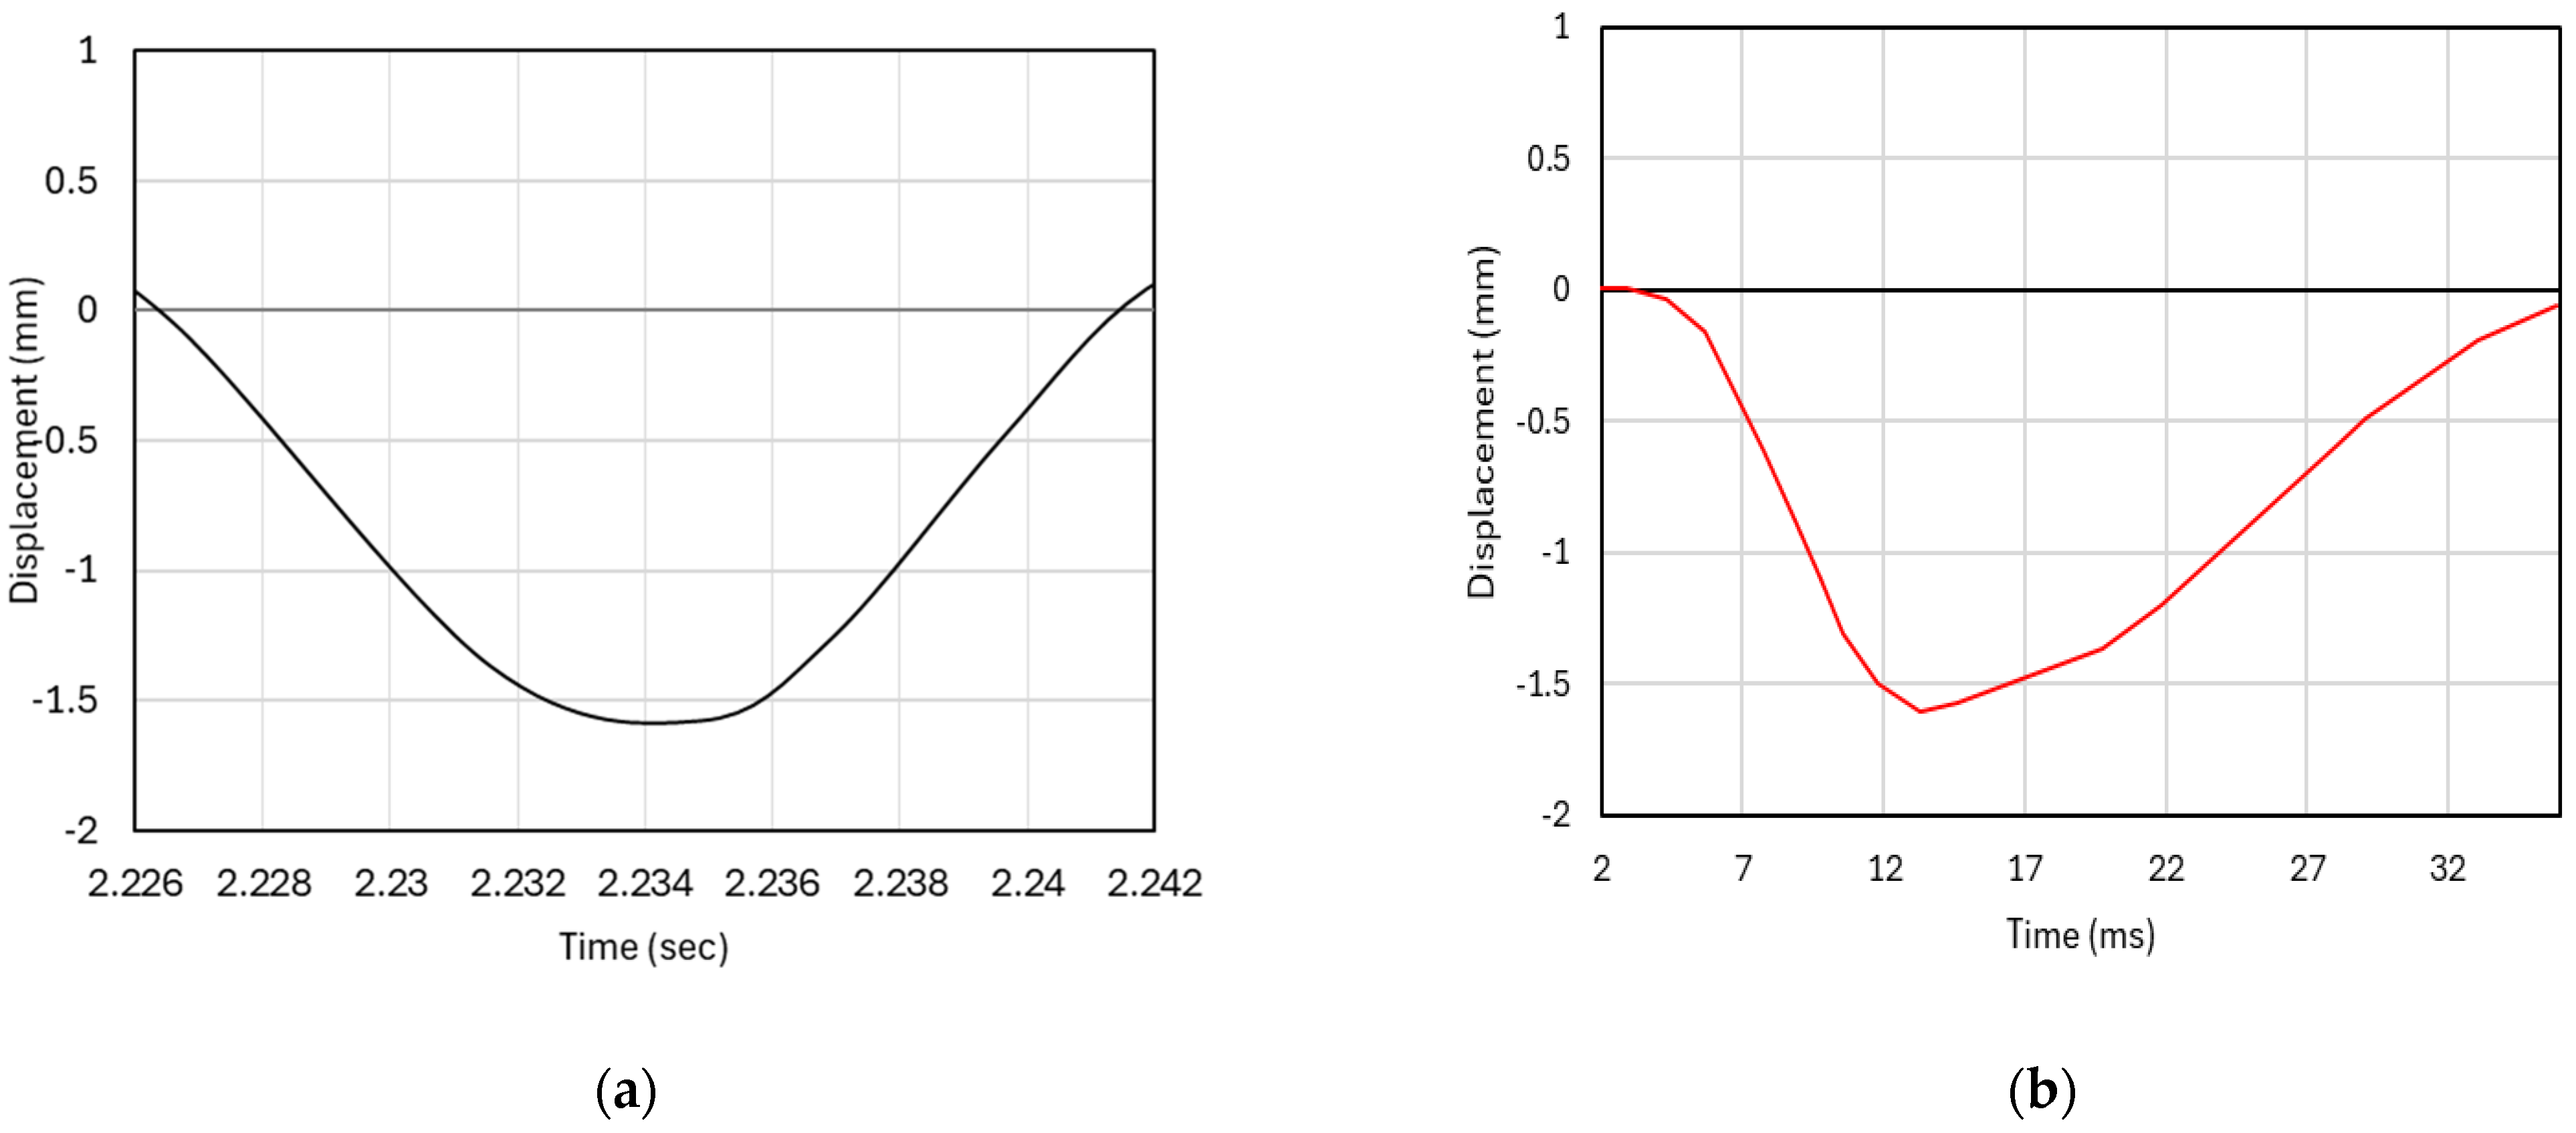
Figure 15 illustrates the observed wave delay (
) under the first drop.
While LWD provides accurate but highly localised measurements with limited depth of influence, the VB approach offers spatial scalability. By capturing multiple targets from a single vantage point and repeating acquisitions at set intervals, the VB system generates quasi-distributed displacement and data across a section. Aggregating this information (e.g., means, percentiles, coefficients of variation) enables section-level stiffness evaluation, mitigating the point-sample limitations of LWD and enhancing the method’s utility for network-scale decision-making.
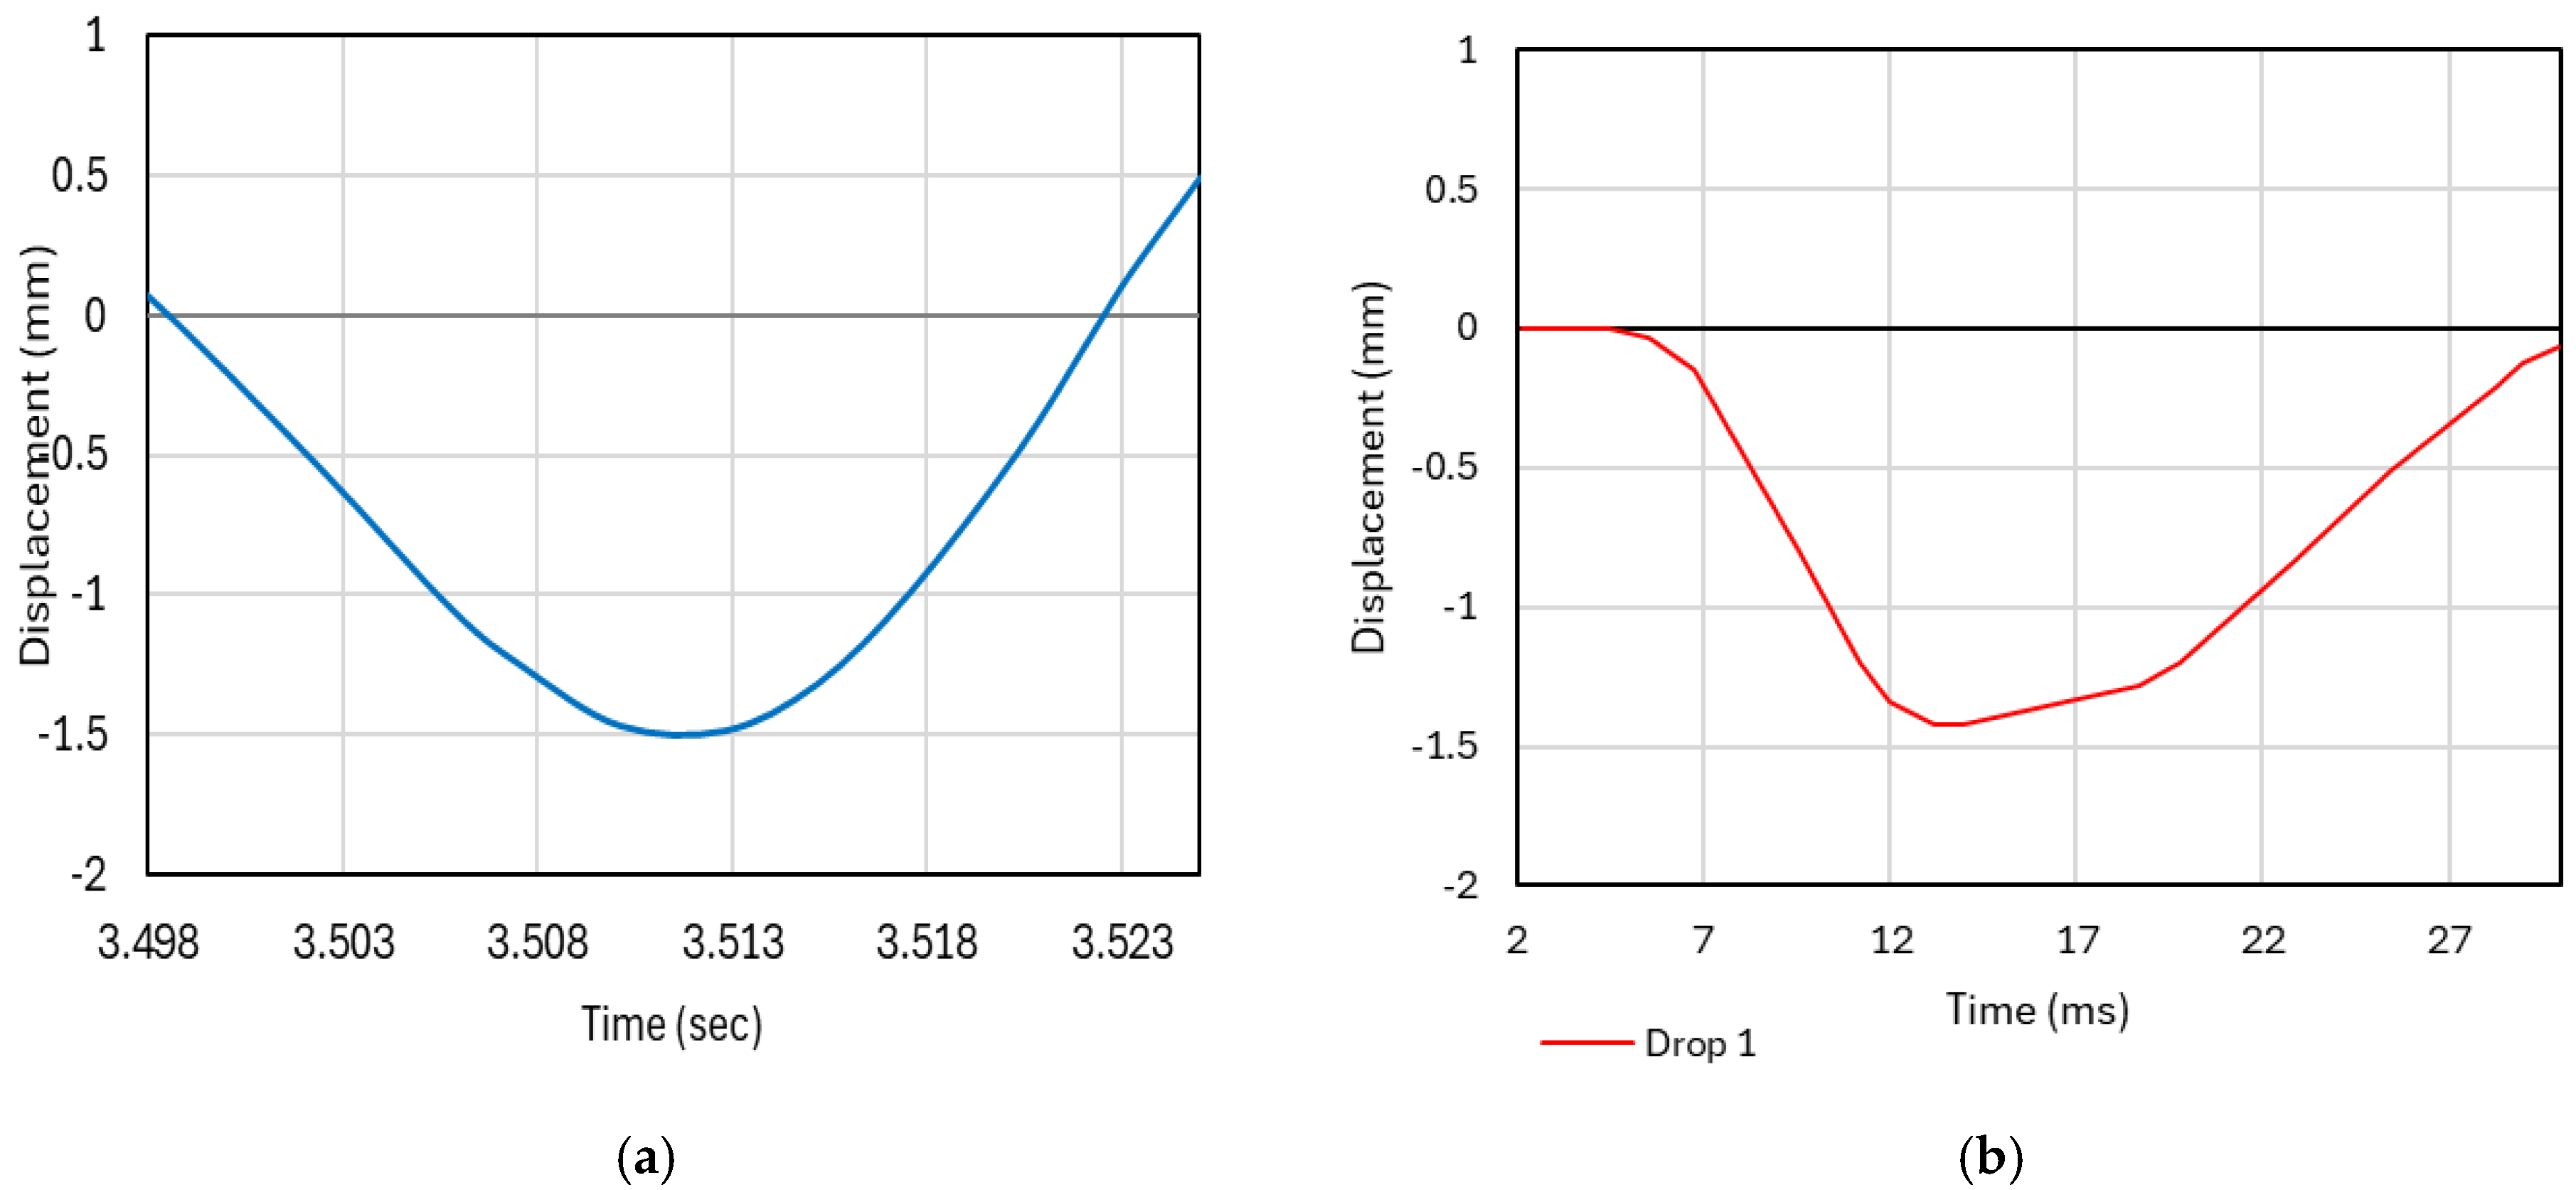
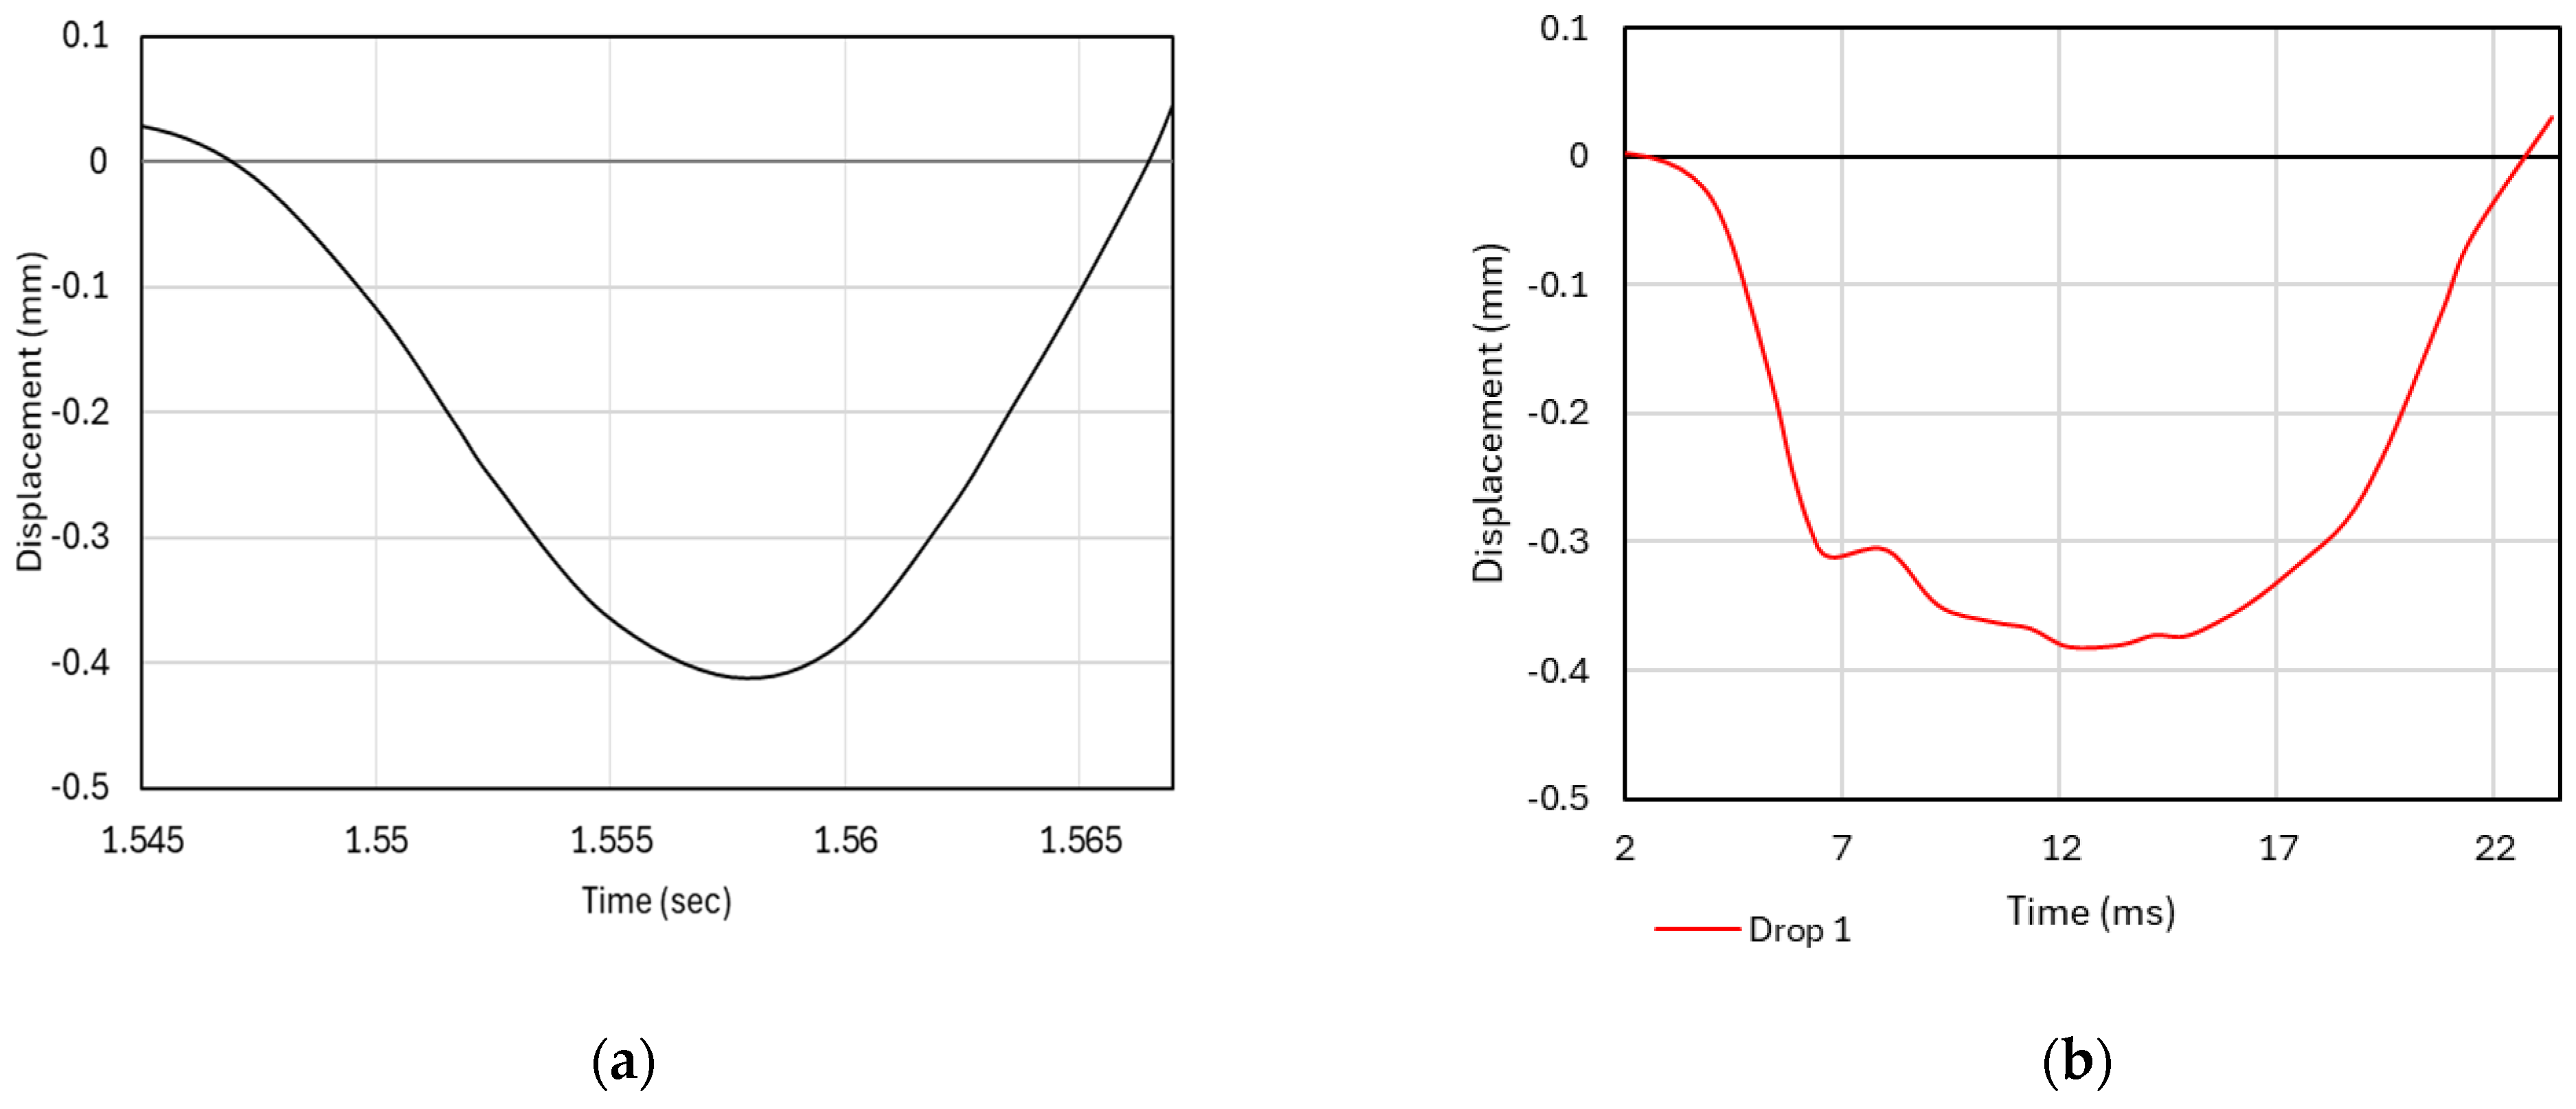
In Zone A, the LWD test was initially conducted without preloading to demonstrate its influence on measured displacements (
Figure 16b). Displacement values from the first drop were compared with those recorded by the VB system, showing excellent agreement between the two methods. The VB plot was included in
Figure 16a for the first drop only, where displacements of 1.65 mm (LWD) and 1.58 mm (VB) were recorded. For the second drop, the displacements were 0.24 mm (LWD) and 0.23 mm (VB).
In Zone B, the LWD test was conducted with preloading, and a representative comparison between the LWD and VB system results is shown in
Figure 17. Again, a strong correlation was observed between the two systems, reinforcing the reliability of the VB method for in situ displacement measurement.
The field trials demonstrated a strong correlation between the VB monitoring system and conventional LWD measurements, confirming the reliability of the VB system as a viable alternative for in situ stiffness evaluation. Displacement data and the corresponding deformation moduli were collected from two distinct test zones, referred to as Zone A and Zone B.
In Zone A, the average surface displacement was approximately 0.22 mm, resulting in a calculated deformation modulus () of 102 MN/m2. In contrast, Zone B exhibited a larger average displacement of approximately 0.40 mm, corresponding to a lower of 56 MN/m2. These findings indicate a notably higher compaction quality in Zone A, where the stiffness modulus is nearly double that of Zone B, reflecting the superior ground condition.
Additionally, further testing in Zone A without initial preloading showed that the modulus derived from the first LWD drop was significantly higher than the values obtained from subsequent drops. This outcome underscores the importance of performing initial seating drops to ensure consistent and representative stiffness measurements in dynamic loading assessments.
4. Discussion
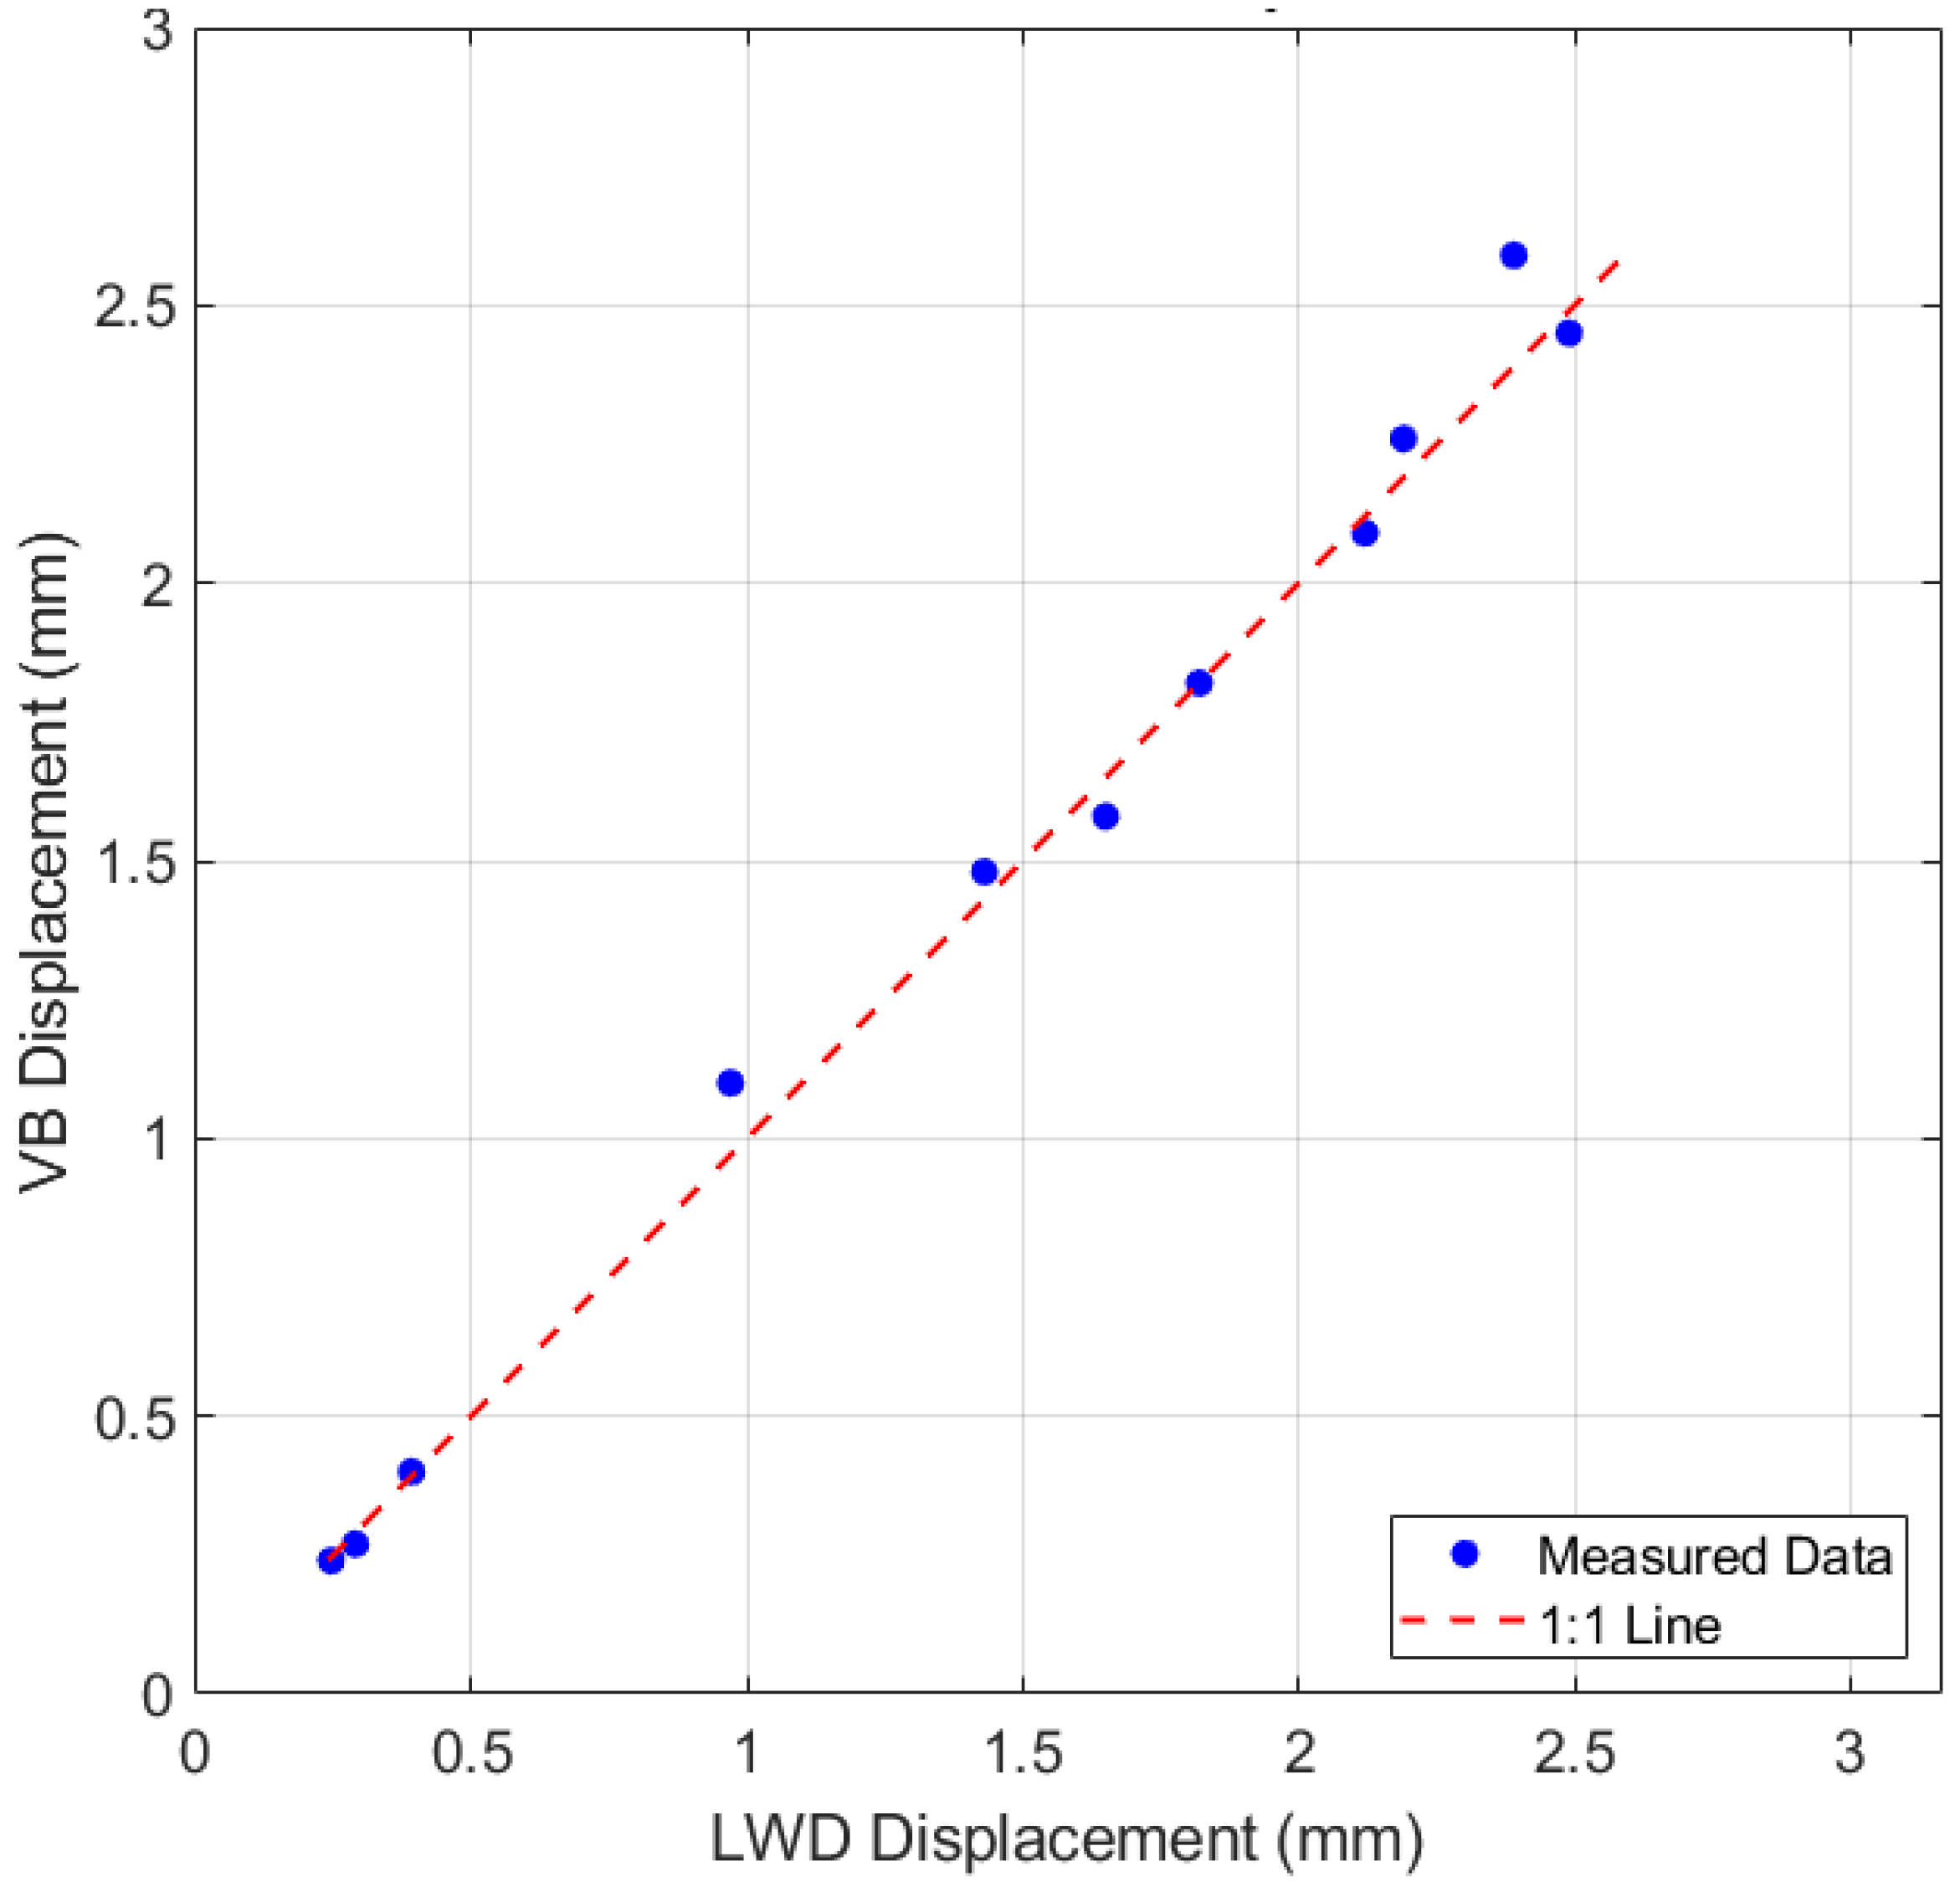
The performance of the VB system for measuring ground displacement, and subsequently estimating the dynamic deformation modulus, was evaluated through a series of LWD tests. Displacement values obtained from the VB system were compared with those recorded by the LWD. As shown in
Figure 18, the results exhibit a strong linear correlation, with data points closely following the 1:1 reference line. The coefficient of determination (R
2 = 0.9901) confirms an excellent level of agreement, demonstrating the accuracy and repeatability of the VB system in replicating LWD displacement measurements.
The VB-derived modulus is computed using the same LWD equation (Equation (1)); therefore, numerical identity would only occur if the measured settlements were exactly equal (
). In practice, small discrepancies are expected due to differences in sensing and processing chains: the VB system employs 400 fps camera tracking with explicit filtering and first-peak selection, whereas the LWD applies internal signal processing, trigger/zero definitions, and averaging protocols. Accordingly, the results in
Figure 18 show a very high degree of agreement (R
2 = 0.9901), indicating practical equivalence within expected measurement tolerances rather than exact numerical equality.
This high degree of correlation underscores the system’s potential for practical application in geotechnical testing. In addition to producing results consistent with conventional LWD measurements, the VB system offers several key advantages. Most notably, it captures the full displacement waveform during impact loading, rather than reducing the response to a single deflection value. This allows for identification of peak response timings and more accurate characterisation of soil behaviour under dynamic or transient loads, an aspect typically overlooked in standard LWD assessments.
Furthermore, the VB system’s ability to record and analyse displacement in real time from video provides valuable temporal insight into subgrade behaviour. This feature is particularly beneficial for monitoring in-service infrastructure subjected to repeated or varying loads. Unlike LWD, which provides isolated point measurements, the VB system supports spatial scalability by imaging multiple targets or repositioning the camera. As a result, it yields quasi-distributed displacement and travel-time data along a section, enabling section-level stiffness assessment and improving its suitability for network-level evaluation, thereby addressing a major limitation of the LWD.
The system is also cost-effective, relying on standard GoPro-style cameras and MATLAB-based image processing rather than specialised sensors or proprietary hardware. Compared to more complex and expensive systems such as the FWD, the VB system offers a simpler and more deployable solution, particularly in constrained or remote environments. While geophones (as used in FWD) are effective, the VB system’s non-destructive nature reduces setup complexity and minimises operator influence.
Despite these strengths, the current implementation has certain limitations. The study was constrained by limited project duration and resources. In addition, the relatively low mass and impact energy of the LWD device used may have limited the spatial extent of surface wave propagation, especially in stiffer materials such as concrete or dense gravel. Further development, including the use of higher frame-rate cameras and heavier impact devices, could extend the method’s range and improve resolution in challenging ground conditions.
As outlined in
Section 2 (Methods), the capabilities of the developed VB system were extended beyond simple deflection measurement to explore its potential for capturing and analysing wave propagation in the ground. Particular attention was given to Rayleigh waves, surface seismic waves generated by the interaction of compressional (P) and shear (S) waves. These waves are characterised by involving both vertical and horizontal displacements [
18] and are highly sensitive to near-surface soil conditions, making them widely used in geotechnical site investigations [
19]. In this extended application, two synchronised high-speed cameras can be used to monitor Rayleigh wave propagation through shallow subsurface layers. Displacement histories are recorded at two spatially separated targets: one positioned at the point of impact and the other at a known horizontal offset
. The time delay (
) between the arrival of the wavefronts at these locations is extracted from the displacement–time records. Knowing
and
, the Rayleigh wave velocity (
) was obtained as:
In the context of soil dynamics, when a Rayleigh wave propagates along the surface of a soil medium, its velocity (
) is related to the P-wave velocity (
) by the equation [
20]:
where
is given by:
In Equation (5), denotes Poisson’s ratio, is the dynamic Young’s modulus, and represents the soil’s mass density. By combining Equations (3)–(5), the dynamic Young’s modulus can be back-calculated directly from the measured time delay. This also allows the dynamic shear modulus to be derived using .
This integrated approach enhances conventional LWD testing by delivering both compaction/stiffness data and elastic property estimation within a single test configuration. Future work will focus on refining and validating the method by employing ultra-high-speed cameras (exceeding 1000 fps) and heavier drop weights (up to 50 kg) to improve waveform clarity and extend the measurable propagation range, particularly in stiffer soils.
Although validation in this study used the LWD, the VB workflow is also compatible with FWD-style, multi-offset measurements. By imaging several targets at prescribed offsets, the same camera setup can capture a deflection-basin–like spatial response and wave travel times from a single impact, supporting section-level interpretation. The additional field effort is modest, limited to camera positioning and target placement, and automated processing yields throughput comparable to routine impact testing. Compared with geophones, the optical approach is non-destructive, avoids cabling or adhesion on finished surfaces, and enables simultaneous multi-point capture. Geophones remain valuable for localised ground-truthing, and a hybrid configuration is feasible. A planned co-located FWD/VB study will further assess transferability and calibrate VB-derived moduli against FWD back-calculations.
5. Conclusions
This study has demonstrated that the adapted Vision-Based (VB) system is a reliable and accurate tool for monitoring surface displacement in geotechnical testing. Its ability to closely match conventional LWD measurements, with a strong correlation (R2 = 0.9901) and differences between the two methods ranging from 0.8% to 13%, validates its potential for use in both laboratory and field environments. Beyond capturing deformation modulus values, the system enables high-resolution displacement tracking, allowing for the analysis of wave propagation and peak impact timing, capabilities not typically offered by standard LWD tests.
Importantly, this work evaluates an innovative measurement approach that bridges the gap between simplified in situ testing and advanced dynamic analysis methods. The VB system’s non-destructive, scalable setup supports its application in diverse geotechnical scenarios, making it a viable alternative for routine ground condition assessment in civil engineering projects. While the system has proven effective, it is not presented as a final solution. Rather, it forms a foundation for further development. Future work should explore the application of this method to a wider range of soil types, incorporate higher impact energies to capture broader wave propagation effects, and employ high-speed imaging (>1000 fps) to improve the accuracy of time delay detection. These improvements will help unlock the full potential of vision-based monitoring for dynamic subgrade evaluation.
