
Article

Interjoint Range of Motion Relationships Along Myofascial Chains in Healthy Adults
by
Anna Chalkia
,
Eleftherios Paraskevopoulos
and
Dimitris Mandalidis
*
Sports Physical Therapy Laboratory, Department of Physical Education and Sports Science, School of Physical Education and Sports Science, National and Kapodistrian University of Athens, Ethnikis Antistasis 41, 17237 Athens, Greece
*
Author to whom correspondence should be addressed.
Biomechanics 2026, 6(1), 25; https://doi.org/10.3390/biomechanics6010025
Submission received: 30 December 2025 / Revised: 8 February 2026 / Accepted: 26 February 2026 / Published: 2 March 2026
(This article belongs to the Special Issue Sensors for Biomechanical and Rehabilitation Engineering)

Abstract

Background/Objectives: Emerging evidence suggests the presence of associations in joint mobility along anatomically defined myofascial continuities, indicating that joint mobility may co-vary across anatomically distant regions. This study aimed to investigate the correlations between the active range of motion (ROM) of joints belonging to the same myofascial chain in healthy, physically active individuals. Methods: Active ROM was measured in 61 adults (21 males and 40 females) at joints contributing to four myofascial chains: the superficial front line (SFL), superficial back line (SBL), functional front line (FFL), and functional back line (FBL), using an inertial measurement unit. Partial Pearson’s correlation coefficients (r), controlling for sex, were calculated to examine the relationships between joint ROM values within lines, with statistical corrections applied when necessary. Results: Significant, yet weak to moderate in most cases, partial correlation coefficients were identified among joints in the upper SFL (0.32–0.44), the lower SBL (0.42–0.44), along the FFL (0.29–0.51), and between the lower segments of the BFL (0.48–0.60). Conclusions: While some joint ROMs within myofascial chains demonstrate weak-to-strong associations, overall interdependence appears mode- and region-specific. These findings suggest that factors beyond fascial continuity, such as neuromuscular control, joint structure, and movement habits, are likely to contribute to ROM variability.

1. Introduction

In recent years, the role of fascia and the concept of myofascial chains have attracted growing attention among clinicians, being recognized as significant contributors to the development and management of musculoskeletal dysfunction [1]. Fascia has been described as a continuous, well-innervated connective tissue network that envelops and functionally integrates muscles, tendons, bones, nerves, and internal organs [2,3,4]. Specifically, muscles function as components of an integrated fascial network, forming interrelated continuities known as myofascial chains that span the body and operate in an integrated rather than isolated manner [2]. These chains are organized according to their anatomical trajectories and functional roles, encompassing lines such as the Superficial Front and Back Lines (SFL, SBL), the Front and Back Functional Lines (FFL, BFL), the Lateral Line (LL), and the Spiral Line (SL), each representing distinct pathways of myofascial continuity that extend from head to toe [2]. Collectively, they contribute to the coordination of movement and the transmission and distribution of mechanical tension across multiple regions of the body, thereby enhancing structural support and functional integration [3,4,5]. Such interconnected formations also imply that when dysfunction or alterations in the fascial properties of one segment of a myofascial chain occur, such as thickening, densification, or adhesions, they may affect the mobility and function of distant joints through these linked fascial pathways. This is often manifested by the development of compensatory or maladaptive movement patterns and/or a reduction in range of motion (ROM) [6,7,8]. Ultimately, these changes may lead to complex clinical presentations, including referred pain and regional interdependence [9,10].
Joint ROM assessment constitutes a fundamental component of clinical evaluation, providing an objective measure of the physiological limits of joint excursion and an individual’s capacity to execute functional, occupational, and athletic tasks [11,12,13]. This assessment reflects the combined mechanical and neuromuscular contributions of the myofascial, musculotendinous, and capsuloligamentous structures that traverse the joint under investigation, thereby offering critical insights into both structural integrity and neuromuscular performance. When a joint is moved passively or actively through its available range until a consistent increase in end-range resistance is detected, this point indicates the onset of passive tissue tension, limiting further displacement [14,15].
In this context, several studies have examined joint ROM relationships across body regions, particularly in athletes (e.g., hip and shoulder rotation in baseball players), though these have not been directly linked to the theory of myofascial chains [16,17,18]. Other studies have shown that both local and remote interventions, such as stretching, myofascial release, or soft tissue mobilization, can lead to significant improvements in ROM in distant regions along the same chain [19,20,21,22,23]. For instance, stretching the gastrocnemius and hamstrings has been shown to enhance cervical spine mobility [19,20], while self-myofascial release of the plantar fascia has improved hamstring and lumbar flexibility [21,22]. Similar findings have been reported following interventions targeting the suboccipital muscles, which resulted in measurable increases in lower-limb flexibility [24]. However, although studies suggest that interventions applied at one part of the kinetic chain may influence mobility at other joints, indicating possible relationships between joint ROM, evidence supporting the anatomical and functional continuity of these pathways remains limited, highlighting the need for further research.
This study aimed to explore the correlation of active ROM among joints belonging to the same myofascial chain, as defined by established anatomical and functional models [2]. Specifically, this study focuses on four myofascial chains, that is, the SFL, the SBL, FFL, and the FBL, for which anatomical continuity has been supported, and functional alignment with sagittal and frontal plane motion patterns can be consistently quantified through joint ROM testing [4,5]. Furthermore, assessing active joint ROM captures the integrated outcome of tissue extensibility, neuromuscular coordination, and sensorimotor regulation, rather than isolating the mechanical properties of muscles and fascia alone. During voluntary movement, the central nervous system modulates joint excursion through reciprocal inhibition, co-contraction, and proprioceptive feedback mechanisms that serve to maintain stability and prevent perceived overstrain [25,26]. Consequently, although structural continuity along myofascial chains has been demonstrated in cadaveric and imaging studies [4,5], the functional manifestation of these connections during active movement is likely to be attenuated by neural and behavioral factors.
By assessing the relationships between joint mobility within these chains, this study aimed to explore patterns of inter-joint association along anatomically defined myofascial continuities. Such observations may help to characterize patterns of co-variation in joint ROM and to contextualize the interconnected behavior of musculoskeletal segments within integrated anatomical systems. Furthermore, examining the interplay of joint ROM within these chains may provide a preliminary framework for interpreting compensatory movement patterns and indirect associations observed in clinical settings, and for supporting future investigations into more comprehensive approaches to the assessment of movement function.

2. Materials and Methods

2.1. Participants

A total of 61 healthy, physically active individuals (21 males and 40 females) with a mean age ± standard deviation of 23.3 ± 3.9 years, body mass of 67.0 ± 14.7 kg, height 1.7 ± 0.1 m, and body mass index 22.9 ± 3.4 kg·m−1 were recruited. The study cohort comprised undergraduate students enrolled in a physical education program at a local university, who were routinely exposed to structured physical activity as part of their academic curriculum. According to previously reported data obtained using the Greek-translated and cross-culturally validated Baecke’s Physical Activity Questionnaire [27], the participants’ physical activity levels were consistent with moderate levels of habitual physical activity in young adult populations [28].
Participants were excluded from the study if they regularly participated in structured exercise programs emphasizing systematic or high-volume stretching (e.g., gymnastics, dance, or similar disciplines), presented with musculoskeletal pain syndromes in any body region, had neurological disorders, or reported a history of injury or surgery within the year preceding testing. Individuals with significant anatomical deviations, such as scoliosis (defined as >5° angle of trunk rotation, measured by gently resting a scoliometer horizontally across the back at the apex of the rib cage prominence during the Adams forward bend test [29]) or leg length discrepancy exceeding 0.5 cm, were also excluded from the study. All participants signed a written informed consent form before participation. The study was conducted in accordance with the Declaration of Helsinki and was approved in advance by the institutional ethics committee.

2.2. Study Procedure

Range of motion measurements were obtained during a single testing session for each participant under standardized conditions by the same examiner (A.C.), following a consistent measurement protocol to ensure data reliability. Each session began with a musculoskeletal screening to confirm eligibility, followed by anthropometric measurements (e.g., body weight, height). Participants wore athletic shorts (and for females, a sports bra) to facilitate unrestricted movement and accurate sensor placement. Before the experimental procedure, participants completed a standardized 10 min whole-body warm-up consisting of 5 min of treadmill running at a self-selected moderate intensity, followed by 5 min of stretching targeting the major muscle groups assessed in the study. Stretching consisted of controlled dynamic and active range-of-motion exercises for the cervical spine, trunk, hip, knee, and ankle regions, performed bilaterally. Each exercise was executed through the available pain-free range without reaching end-range discomfort, with approximately 20–30 s devoted to each muscle group.

2.3. Range of Motion Measurements

Active ROM was measured using an inertial measurement unit (IMU) (GYKO, Microgate, Bolzano, Italy), which integrates an accelerometer, gyroscope, and magnetometer sensors (dimensions: 50 × 70 × 20 mm; weight: 35 g) and offers reliable and valid assessments of joint mobility across various body regions and planes of motion [30]. Prior to data collection, the IMU was initialized and calibrated according to the manufacturer’s standard procedure, which required positioning the device on a stable horizontal surface for zeroing. Data were sampled at a frequency of 1000 Hz and processed using the manufacturer’s proprietary sensor-fusion algorithm, which integrates accelerometer and gyroscope signals to estimate three-dimensional orientation. The magnetometer was enabled under the default configuration, and testing was conducted in an environment free from major magnetic disturbances. No additional external filtering was applied beyond the manufacturer’s processing pipeline.
With the IMU securely attached to the body using elastic straps or double-sided tape, depending on the joint and movement assessed, joint ROM was defined as the angular displacement between the initial neutral position and the peak angle reached during active movement. Raw signals were processed within the manufacturer’s software environment (GykoRePower, v.1.2.2.0, Microgate, Bolzano, Italy) and transmitted via Bluetooth to dedicated software on a computer for real-time analysis.
Each movement was explained and demonstrated by the examiner prior to each joint ROM measurement. Participants were instructed to perform each movement actively at a self-selected comfortable speed through their maximum pain-free ROM. Non-elastic straps were used to enhance stabilization of the proximal joint and adjacent anatomical segments, thereby minimizing compensatory strategies, which, if present, were assumed to be subtle and not readily detectable. Invalid trials were discarded and repeated. A trial was considered valid if the participant completed the movement smoothly through the intended plane without visible compensatory motion (e.g., trunk, pelvic, or contralateral limb movement) and without signal interruption or saturation. Trials showing compensatory strategies, irregular movement patterns, or technical artifacts were discarded and repeated. Three valid trials were recorded for each movement, and their mean value was used for analysis.
The ROM assessments employed in this study were selected based on the anticipated lengthening of tissues opposing the direction of active movement, in accordance with the primary anatomical functions and spatial orientations of the myofascial continuities as delineated in the Anatomy Trains model (Table 1).
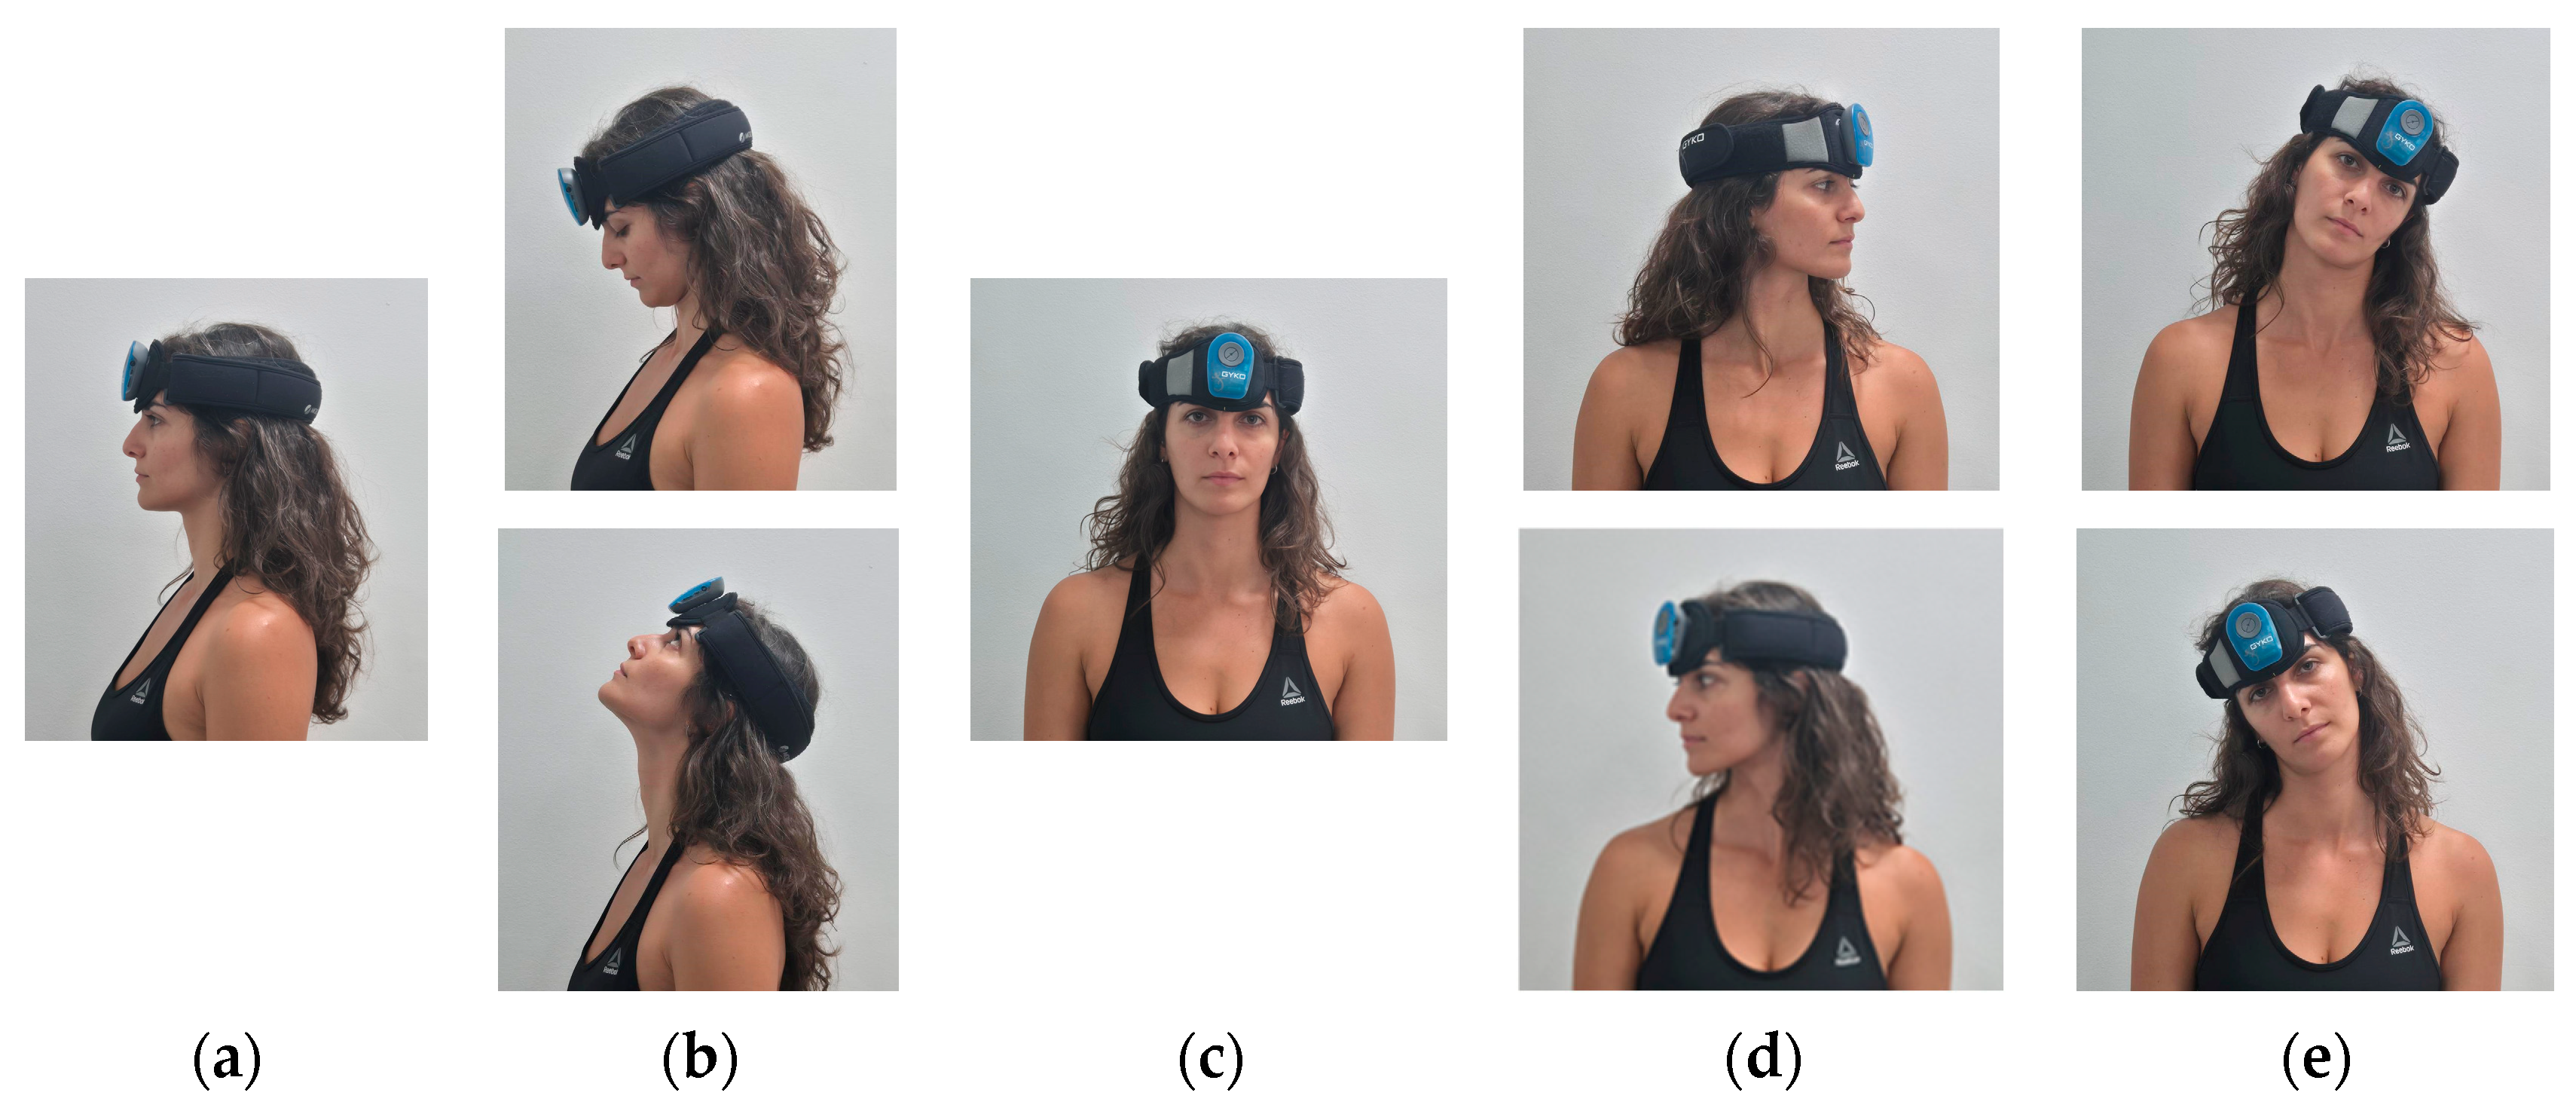
Active cervical spine flexion, extension, right and left lateral flexion, and right and left rotation range of motion were assessed with participants seated upright on a wooden box without back support, facing forward, with their arms relaxed at their sides. Participants were instructed to actively move their head and neck to the end of their available pain-free range in each direction. The examiner visually monitored each participant’s posture throughout the assessment to detect potential compensatory trunk or shoulder movements. The IMU was secured to the centre of the forehead using an elastic strap for cervical spine measurements (Figure 1).
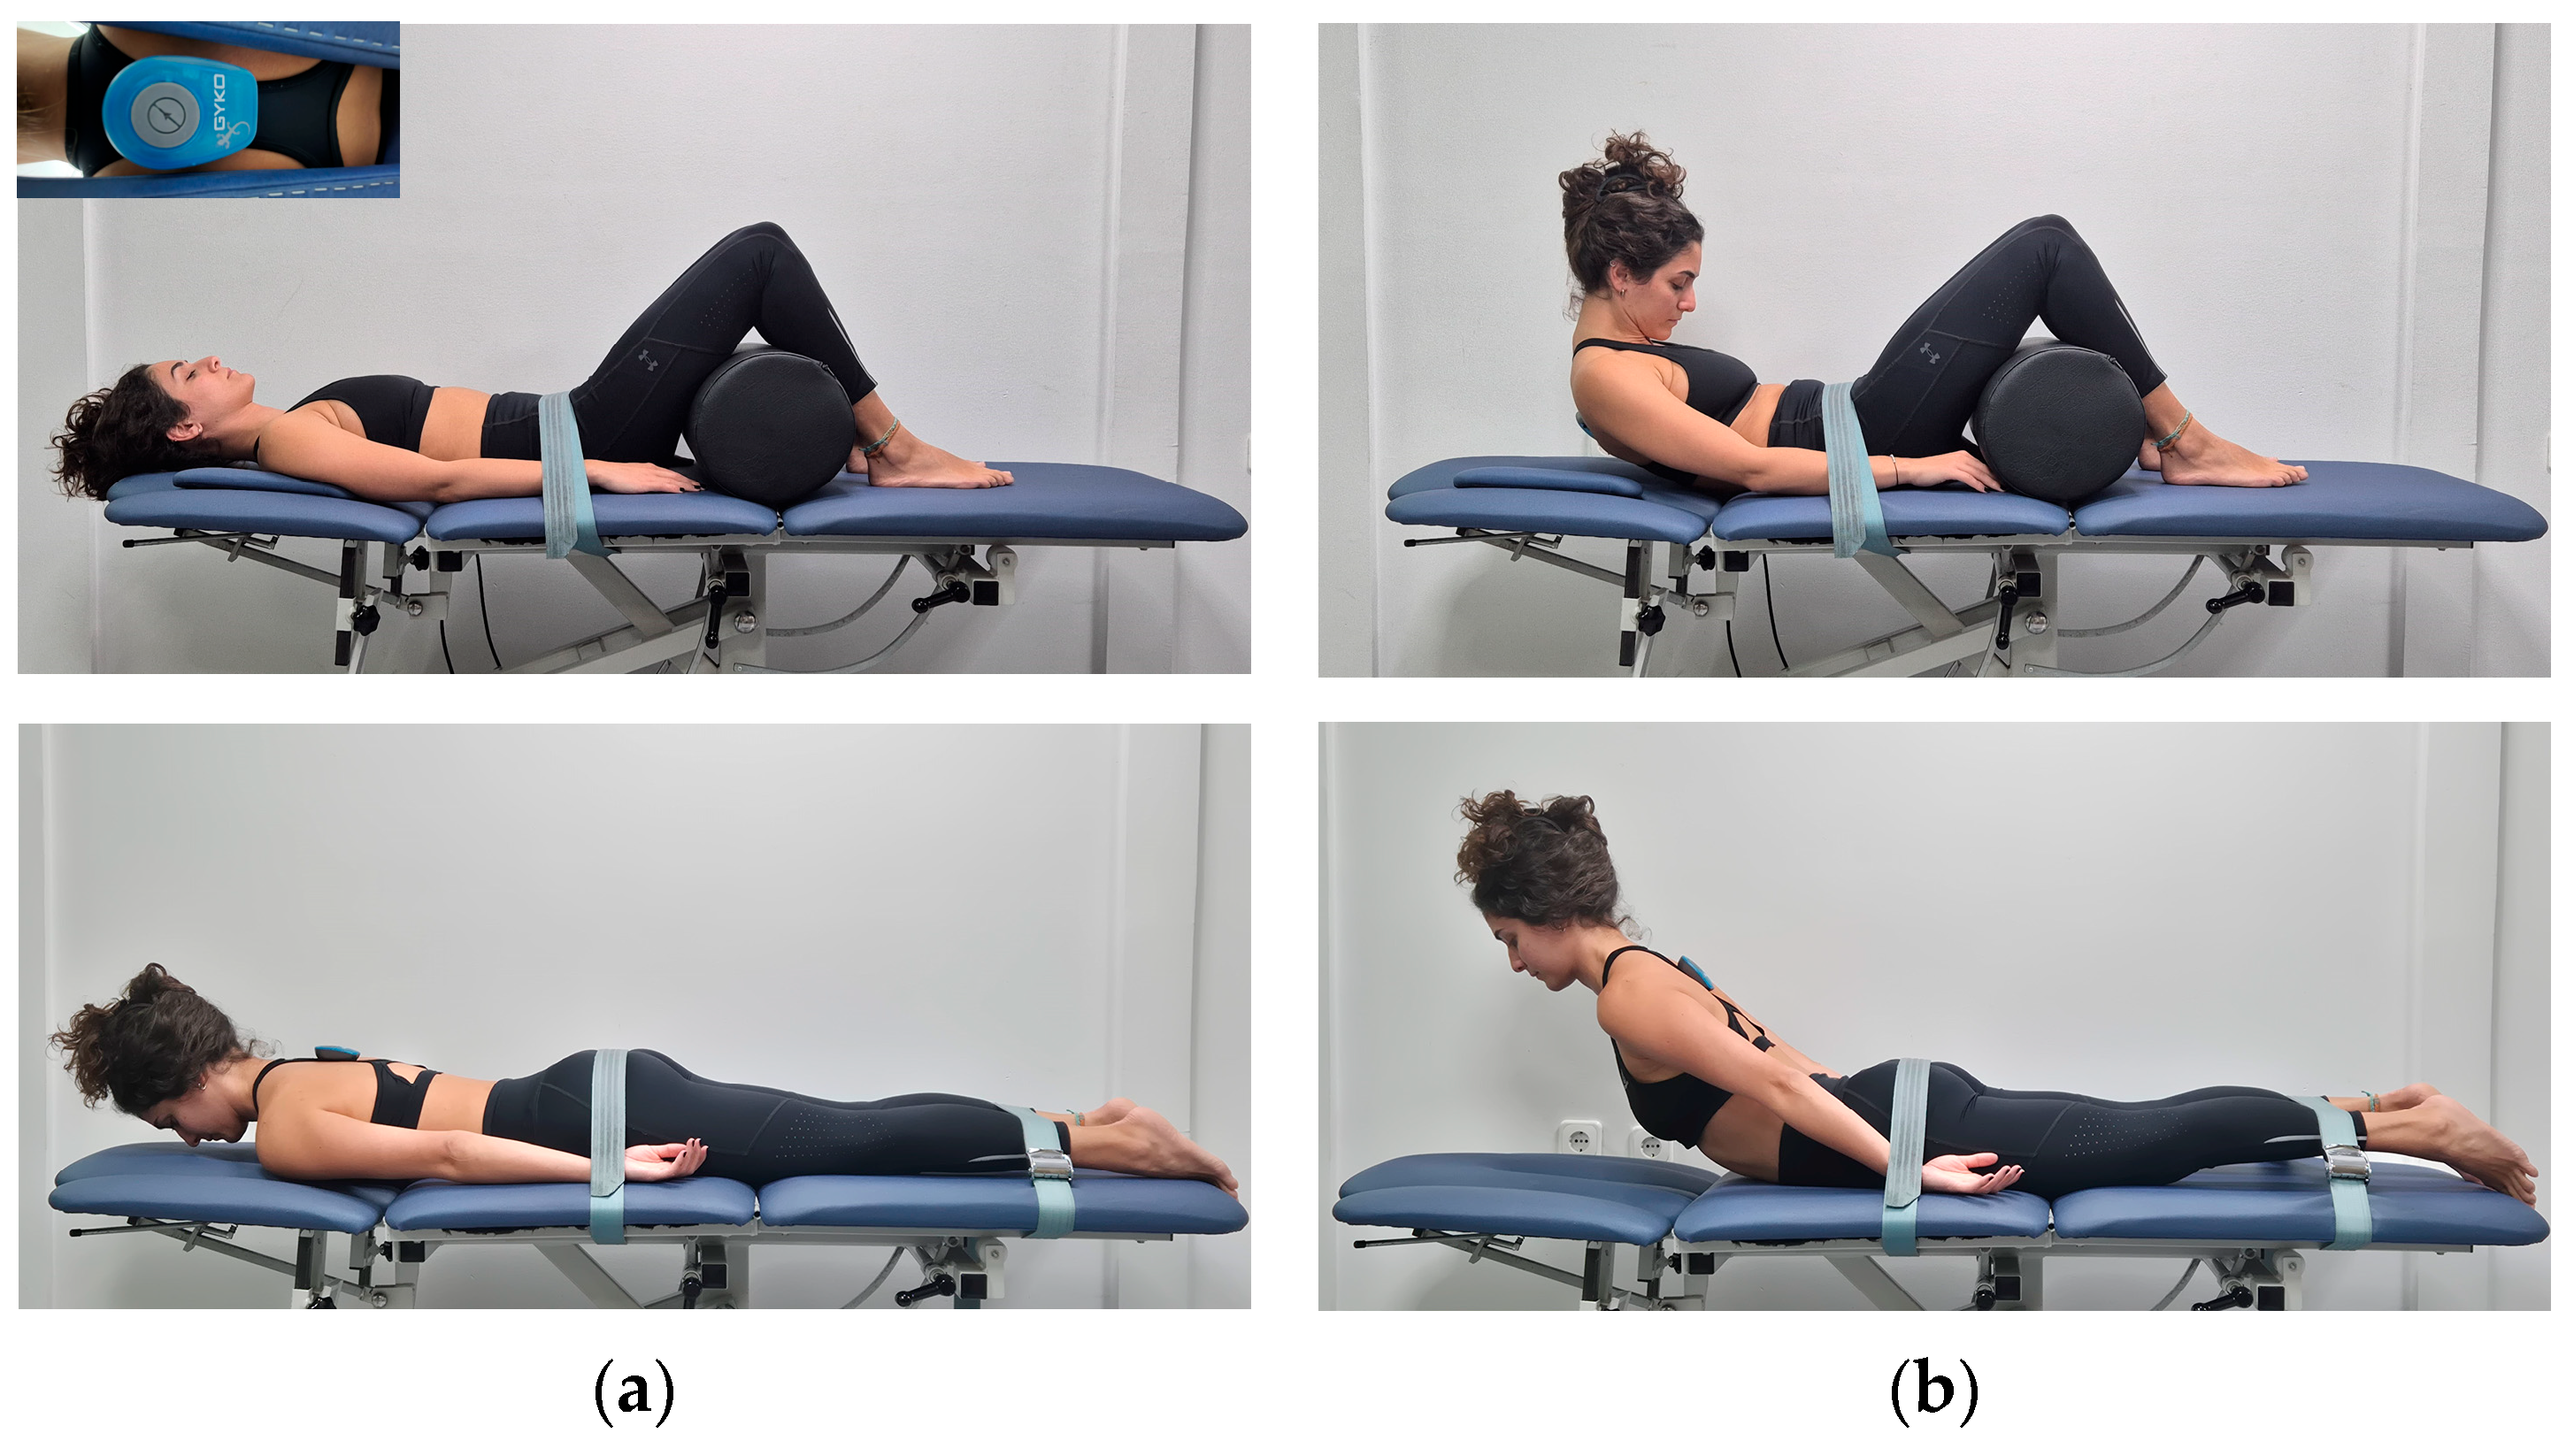
Thoracolumbar spine active ROM was assessed in different positions depending on the movement examined. Flexion was measured with participants in the supine position, while extension was measured with each subject in the prone position. In both measurements, the IMU sensors were placed on the spine at the level of the scapular spine, as illustrated in Figure 2. For trunk flexion ROM, participants were instructed to flex the trunk by bringing the chin toward the pubic symphysis as far as possible. For trunk extension, each participant was asked to extend the trunk while keeping the neck in a neutral position. Both movements were performed with a non-elastic belt applied around the pelvis to provide stabilization and prevent potential compensatory movements.
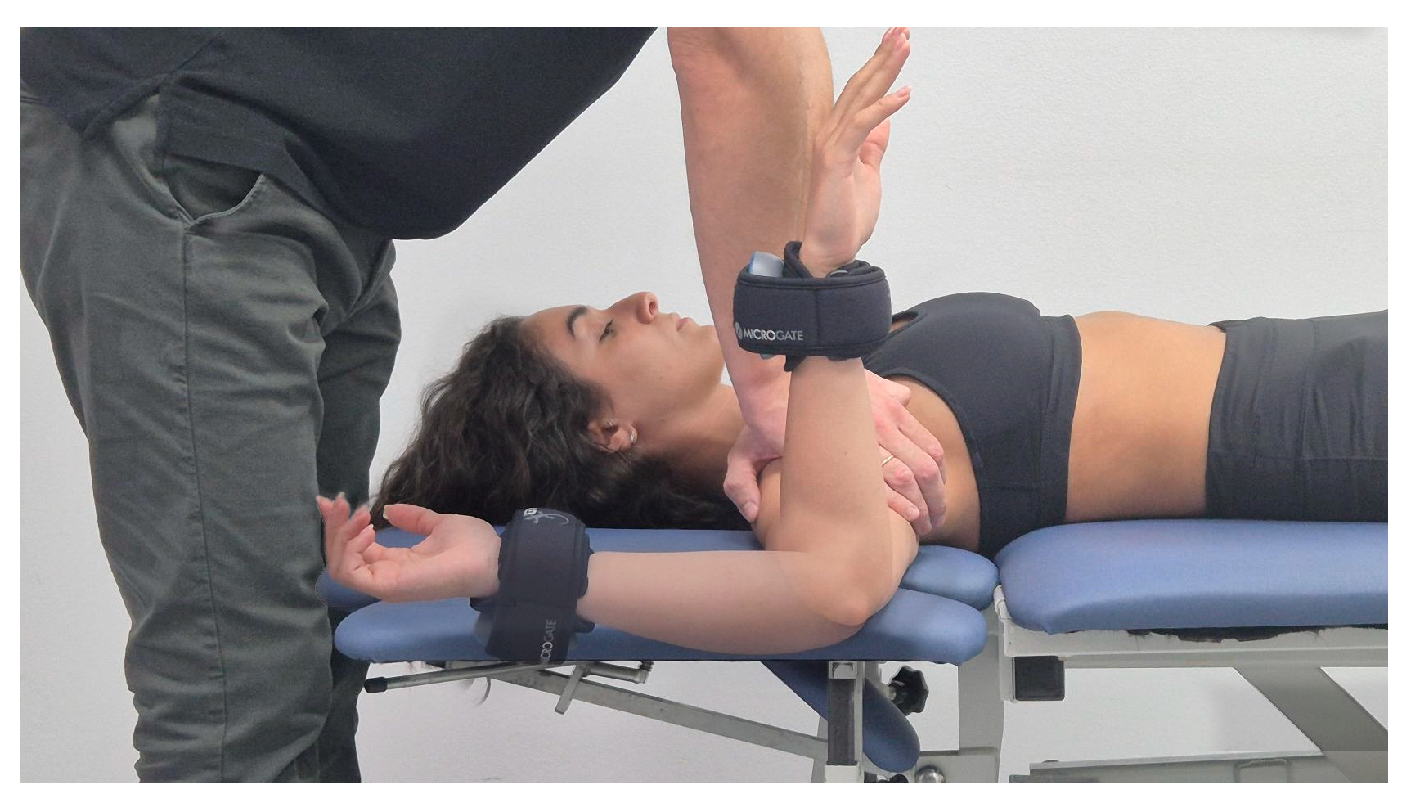
Active shoulder external rotation ROM was assessed with participants lying supine on a treatment table. The tested shoulder was positioned in 90° of abduction with the elbow flexed to 90°, maintaining a neutral rotation starting position. To minimize compensatory movements, the shoulder under examination stabilized against the table, with the examiner applying gentle pressure using both open palms. Shoulder ROM measurements were performed with the IMU secured to the dorsal aspect of the forearm just proximal to the carpal joint, using an elastic belt, as illustrated in Figure 3.
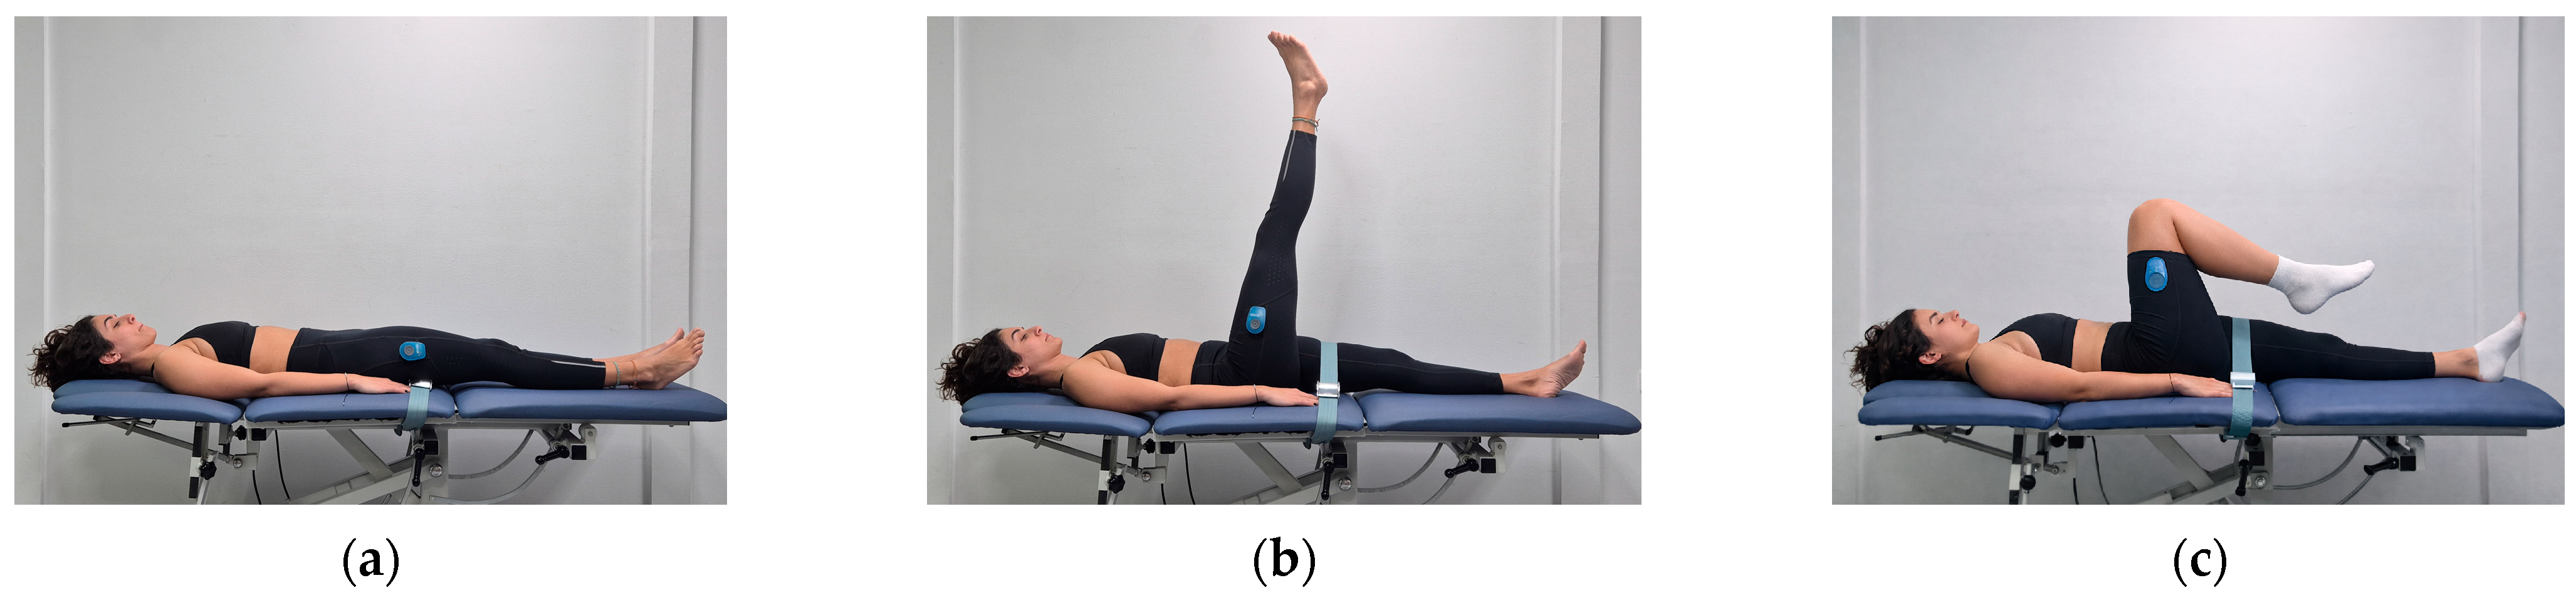
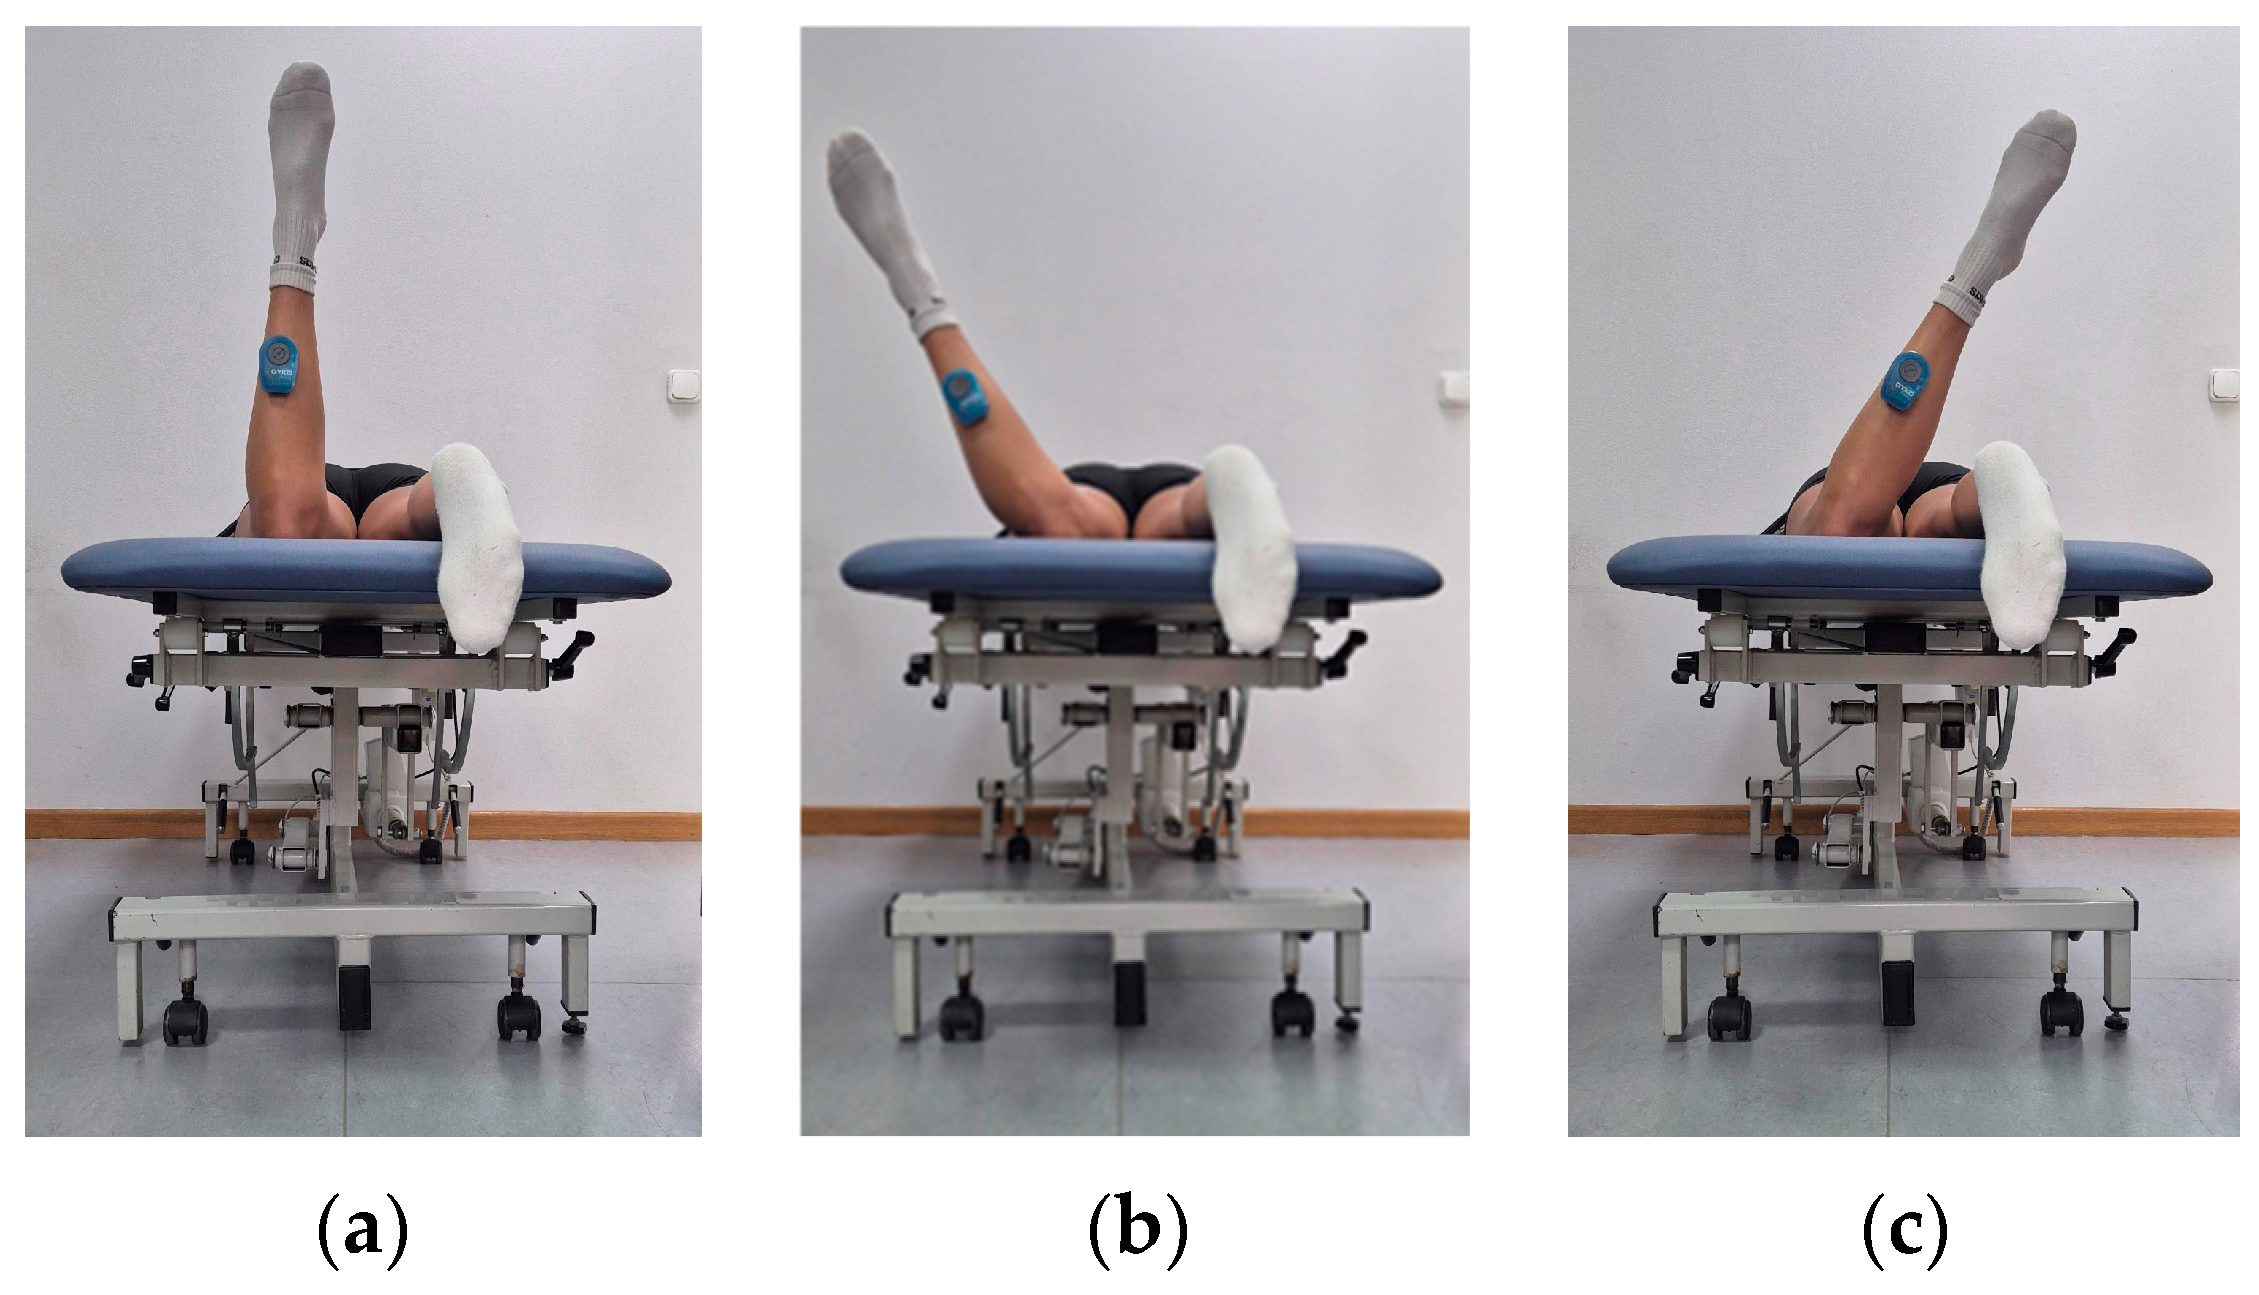
Active hip flexion ROM was assessed with participants lying supine on the examination table. Participants were instructed to actively flex the hip toward the chest while keeping the knee either fully extended or flexed and the ankle relaxed. The contralateral limb remained extended on the table and stabilized with a strap around the proximal thigh to minimize compensatory pelvic movements. Participants were instructed to move the limb to the end of their available pain-free range of motion. For hip flexion measurements, the IMU was positioned on the lateral aspect of the proximal thigh at one-third of the distance between the greater trochanter and the knee joint space using self-adhesive tape (Figure 4).
Active hip internal and external rotation ROM was assessed with participants lying prone on a treatment table, with the knees flexed to 90°. From this position, participants were instructed to actively rotate each hip inward and outward through their available pain-free range of motion, while keeping the thighs in contact with the table and as close as possible. The IMU was secured to the anterior tibia at one-third of the distance between the fibular head and lateral malleolus using self-adhesive tape, and a belt was applied around the buttocks to limit compensatory pelvic and lumbar motion (Figure 5).
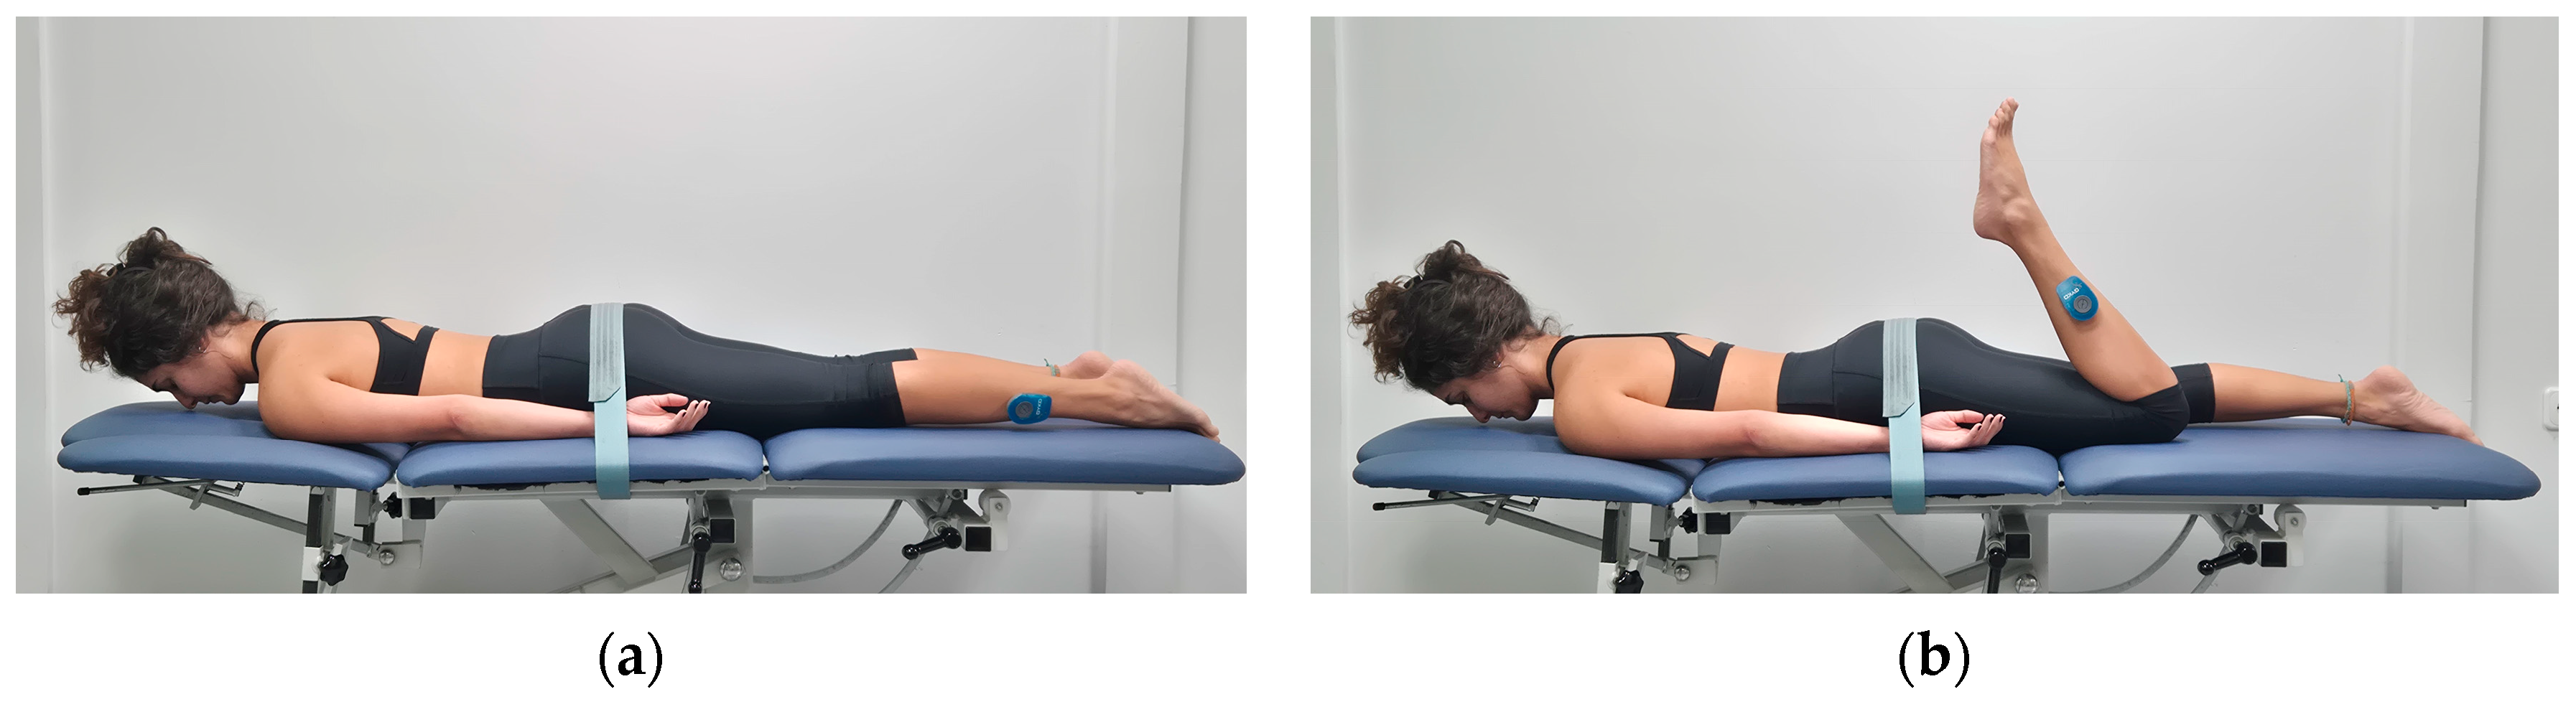
Active knee flexion ROM was assessed with participants lying in the prone position on a treatment table. From this position, participants were instructed to actively flex the knee by bringing the heel toward the buttocks through their available pain-free range of motion. Potential pelvic compensatory movements were prevented using a non-elastic belt. IMU was positioned at the lower one-third of the distance between the head of the fibula and the lateral malleolus using double-sided adhesive tape (Figure 6).
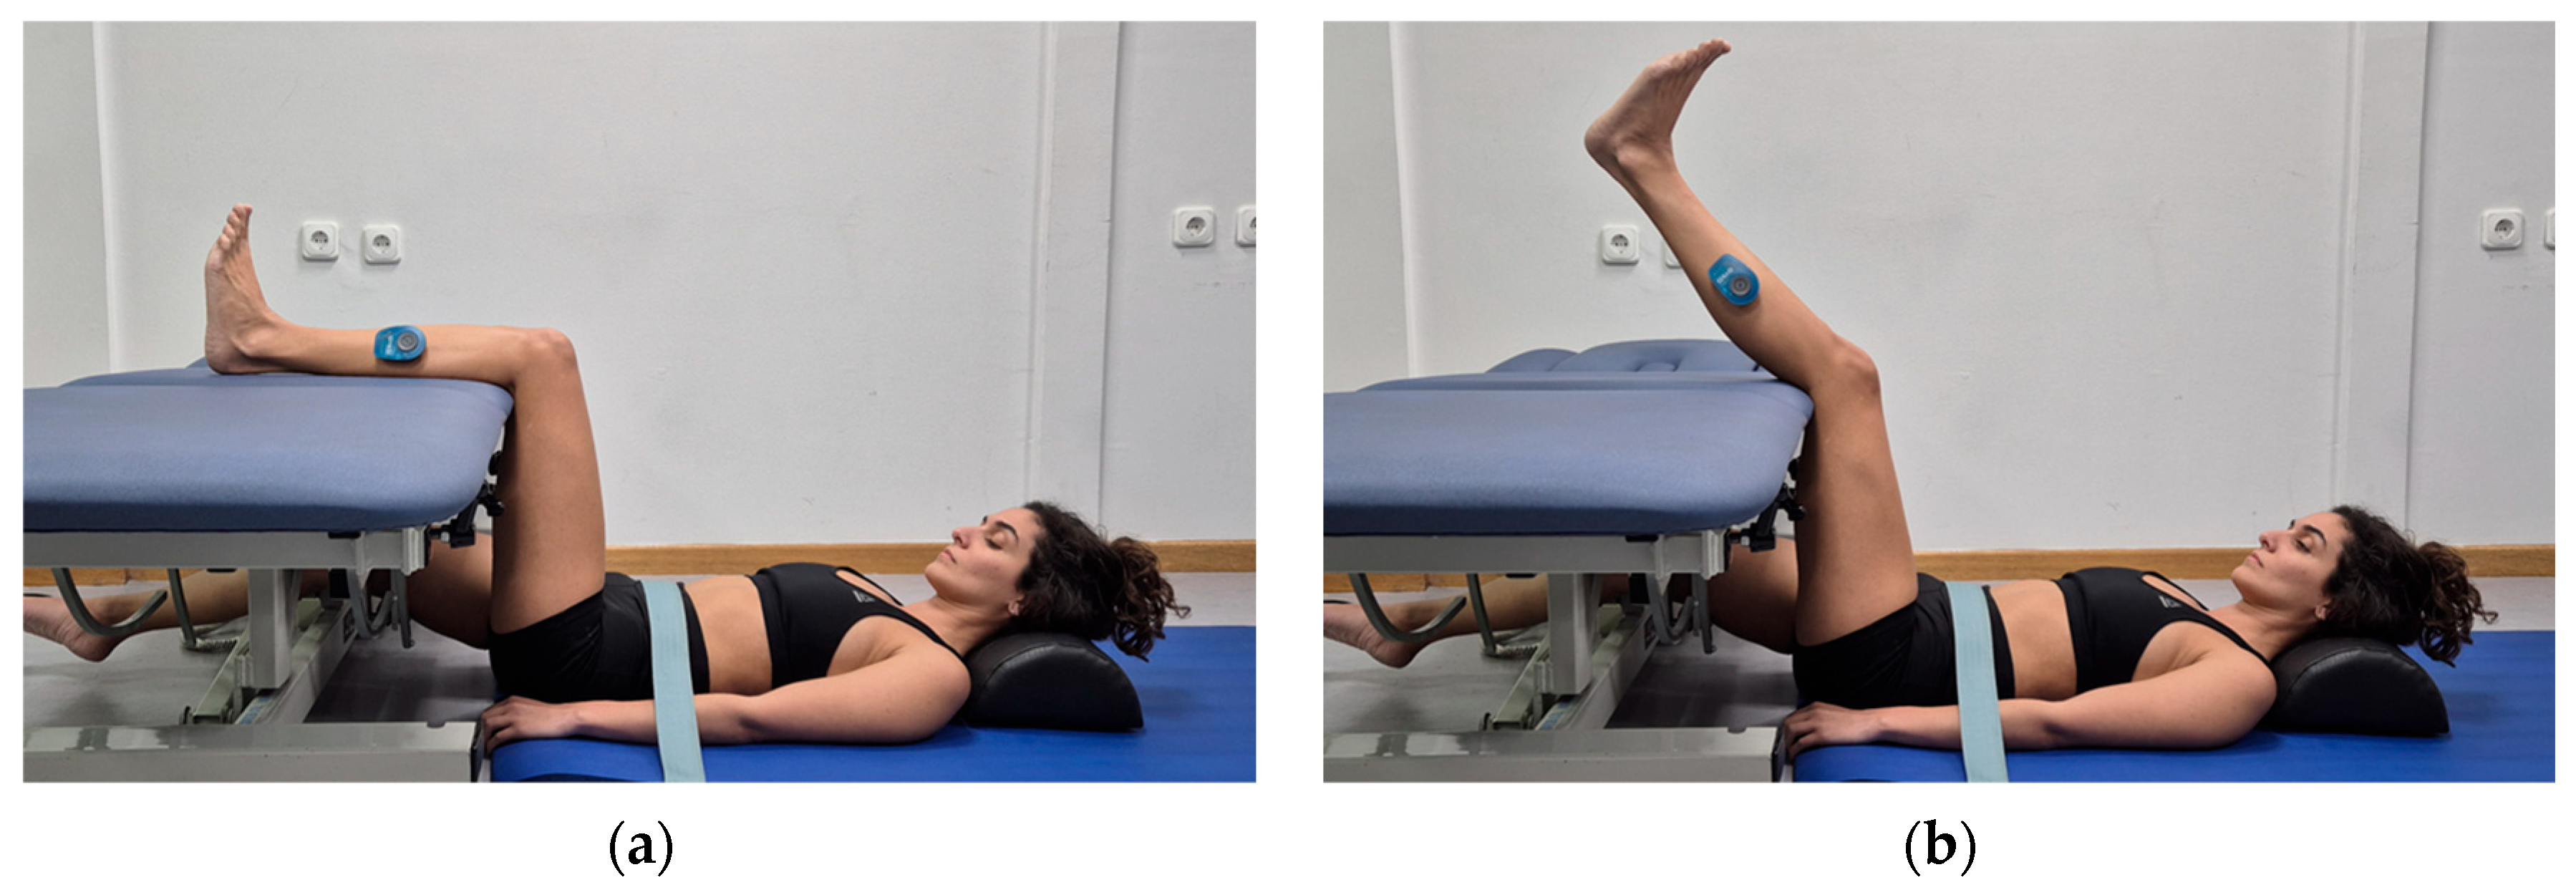
Active knee extension ROM was assessed with participants lying supine on the floor, with the hip and knee of the tested limb positioned at 90° of flexion on an adjustable support (treatment table). The contralateral limb remained extended. From this position, participants were instructed to actively extend the knee through their available pain-free range of motion. To minimize compensatory pelvic or lumbar movements, two stabilization straps were applied around the pelvis and the proximal thigh. The IMU remained affixed in the same position as for the knee flexion ROM measurement, at the lower one-third of the distance between the head of the fibula and the lateral malleolus (Figure 7).
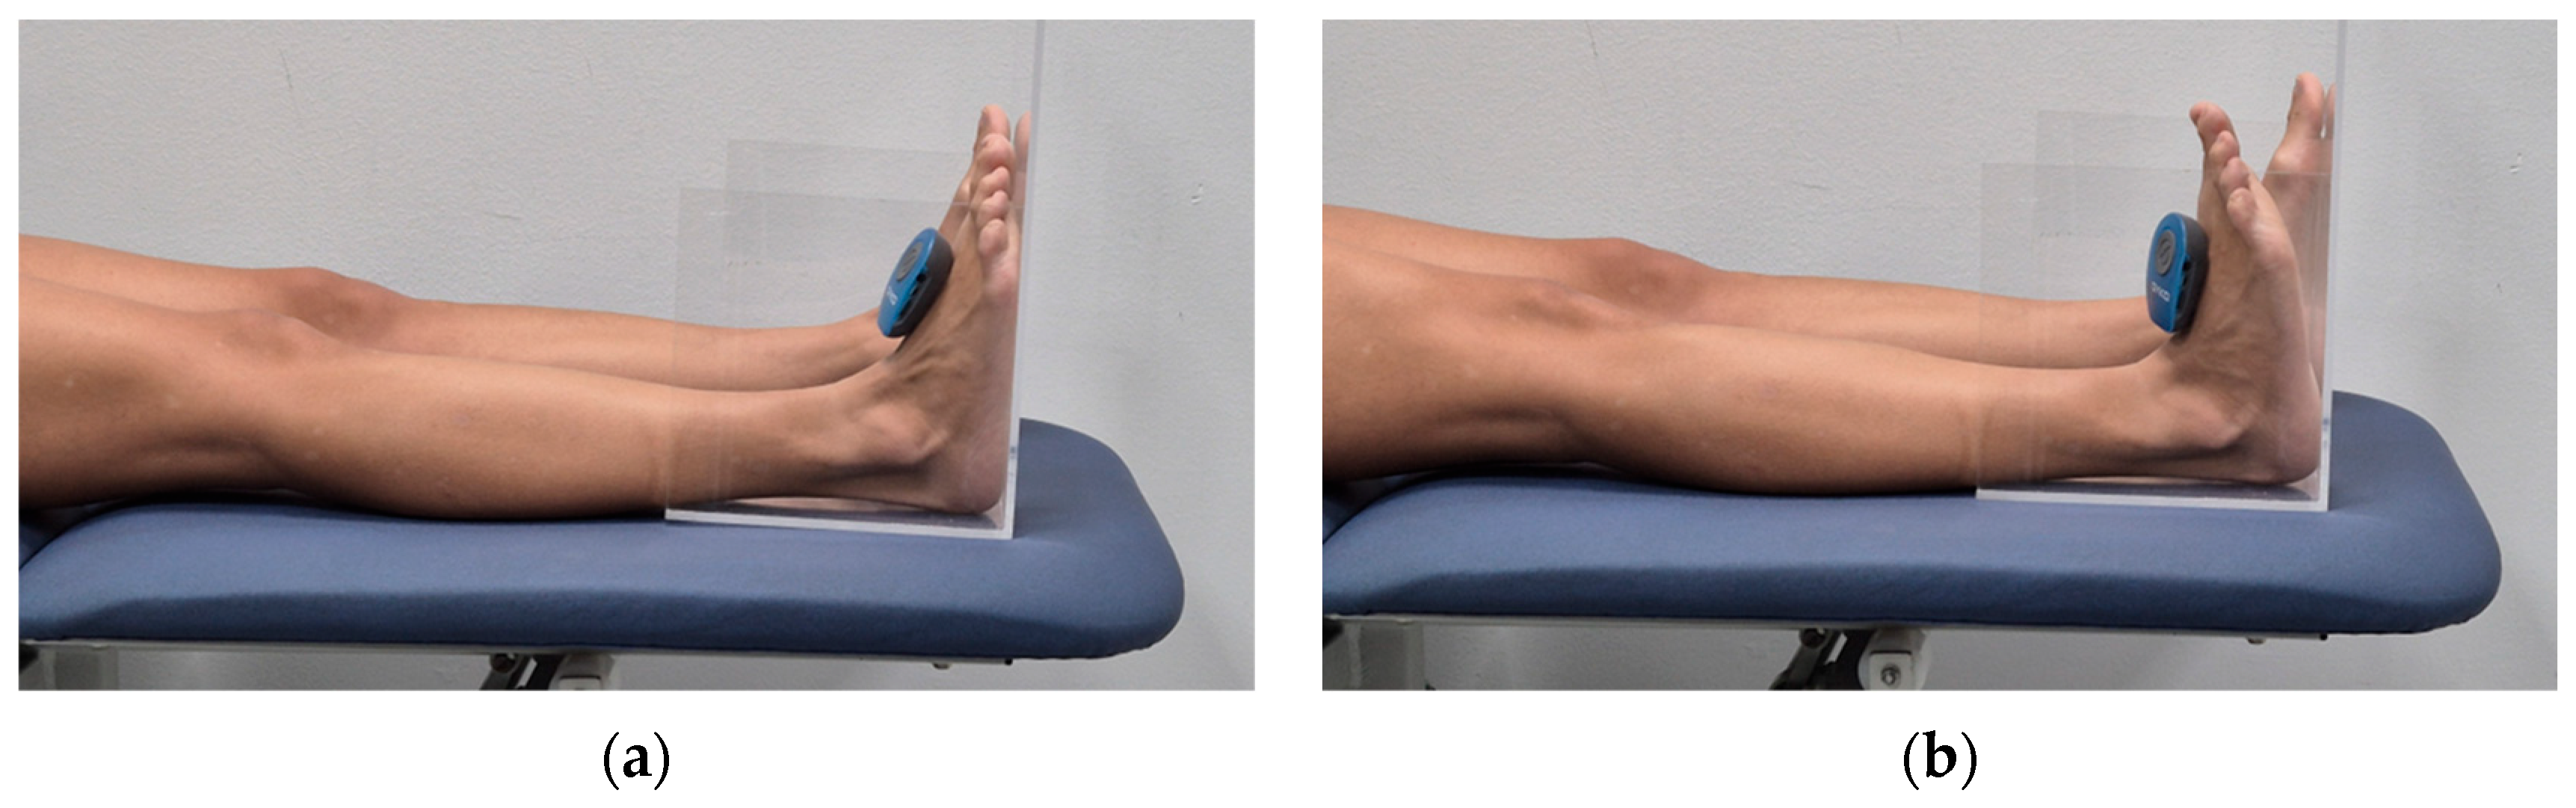
To evaluate ankle dorsiflexion ROM, participants were positioned supine on the treatment table with their knees fully extended and the plantar surface of the foot placed against a vertically fixed acrylic rectangular box to maintain a neutral foot position concerning hip rotation and subtalar inversion/eversion. The IMU was attached to the dorsum of the foot over the metatarsals using self-adhesive tape (Figure 8).

2.4. Statistical Analysis

Interjoint ROM relationships were examined for both anatomically adjacent segments (primary comparisons) and indirect or non-adjacent joint connections (exploratory comparisons). Partial correlation analyses controlled by sex were conducted using IBM SPSS Statistics (Version 30; IBM Corp., Armonk, NY, USA). Confidence intervals for the partial correlation coefficients were estimated using bootstrap resampling with 2000 samples and 95% bias-corrected and accelerated (BCa) confidence intervals. Primary and exploratory correlation pairs were distinguished following methodological recommendations to separate a priori, theory-driven hypotheses from supplementary, data-driven analyses to maintain statistical rigor and control Type I error [31,32,33]. In the present context, primary pairs represent anatomically contiguous or strongly coupled myofascial connections, whereas exploratory pairs involve mainly indirect (non-adjacent) joint connections, consistent with the hierarchical organization of myofascial continuities described in movement and fascia literature (Table 2) [2].
For primary comparisons, Holm–Bonferroni corrections were applied separately within each myofascial line, based on the number of primary tests performed. Lines including two primary pairs (SBL, FFL, and BFL) were adjusted to α′ = 0.025. For exploratory comparisons, a multiple-comparison control was applied using the Benjamini–Hochberg false discovery rate (FDR) procedure [33] with q = 0.05, and both raw p-values and adjusted q-values were reported.
The strength of Pearson’s correlation coefficient (r) was interpreted as very strong (0.80–1.00), strong (0.60–0.79), moderate (0.40–0.59), weak (0.20–0.39), or very weak (0.00–0.19). All analyses were conducted using SPSS version 30.0 (IBM Corp., Armonk, NY, USA).

2.4.1. Sample Size and Power Analyses

Sample size and power analyses were conducted in G*Power 3.1 [28] for Pearson’s correlation (bivariate normal model, two-tailed). An a priori analysis targeting 80% power with α = 0.025 (Holm/Bonferroni-adjusted for two primary correlations, Table 2) and an expected moderate effect size (r = 0.35) indicated a minimum required sample of 74 participants. Given the sample size achieved (n = 61), a sensitivity analysis indicated that correlations of approximately r = 0.38 could be detected with 80% power at α = 0.025. Accordingly, the power for detecting r = 0.35 at α = 0.025 was reduced relative to the a priori target.

2.4.2. Within-Line vs. Between-Line Specificity Analysis

To assess the specificity of associations to the predefined myofascial lines (SFL, SBL, FFL, and BFL), the observed within-line statistic was compared with an empirical random reference distribution. The within-line statistic was defined as the mean absolute correlation across all within-line pairs
S within = mean ( r )
where S within   = observed within-line statistic.
A random benchmark distribution was generated by repeatedly sampling correlation sets of equal size from the full dataset, such that within-line correlations were evaluated against between-line correlations involving the same joint ROMs paired with randomly selected and unique ROM variables from other lines. For each random draw j , the same summary statistic was calculated
S j = mean ( r ) j
where S j   = mean(|r|) from the j-th random draw, and this procedure was repeated 300 times. The relative magnitude of the observed within-line statistic was summarized descriptively by its percentile rank within the random distribution and by a random benchmark probability
p rand = # ( S j S within ) + 1 300 + 1
where p rand = The probability that a random set would show equal or greater strength, and # { S j S within } = number of random draws that are equal or greater than the observed. This comparison was used to characterize the concentration of correlation strength within myofascial lines and was not interpreted as a formal inferential test.

3. Results

3.1. Bilateral Comparisons and Correlations for Joint Range of Motion

Statistical analysis revealed significant bilateral differences for shoulder external rotation (p = 0.04) and hip internal rotation (p = 0.01). Significant bilateral correlations were observed between the ROM of corresponding joints (r = 0.58–0.92, p < 0.01). The highest values appeared in knee flexion (r = 0.92), knee extension (r = 0.90), and hip flexion ROM (r = 0.89), whereas the lowest correlations were found in cervical rotation ROM (r = 0.58) (Table 3).

3.2. Superficial Front Line

Within the SFL, correlation coefficients ranged from 0.02 to 0.44. The line was evaluated using two families of comparisons that differed only in the functional role assigned to the sternocleidomastoid muscle, being considered a lateral flexor of the neck in the CLF–TEX–KFL comparisons and a head rotator of the neck in the CRT–TEX–KFL comparisons. After controlling for multiple exploratory comparisons using the Benjamini–Hochberg procedure (q = 0.05), weak-to-moderate, significant associations were observed only between CLF and TEX (r = 0.35, p = 0.01, q = 0.03 for the right and r = 0.44, p < 0.001, q < 0.003 for the left) and between CRT and TEX (r = 0.33, p = 0.01, q = 0.03 for the right and r = 0.32, p = 0.01, q = 0.03 for the left side). All other comparisons involving lower-limb ROM (CLF/CRT–KFL and TEX–KFL) were not significant (Table 4).

3.3. Superficial Back Line

Within the SBL, primary correlation analyses were conducted for TFL–HFL and HFL–ADF, considering the hamstrings as a hip extensor, and for TFL–KEX and KEX–ADF, considering the hamstrings as a knee flexor. Following Holm–Bonferroni correction for comparisons assuming the hamstrings act as a hip extensor, weak to moderate, significant associations were observed only on the right side for TFL–HFL (r = 0.34, p = 0.009, padj = 0.009) and HFL–ADF (r = 0.42, p < 0.001, padj = 0.002). On the left side, only the HFL–ADF correlation was significant before correction; however, it did not remain significant after Holm–Bonferroni adjustment (r = 0.29, p = 0.026, padj = 0.052). When the hamstrings were considered as knee flexors, comparisons of joint ROM after adjustment revealed a moderate, significant correlation only for KEX–ADF on the right side (r = 0.44, p < 0.001, padj = 0.002).
Exploratory comparisons between active ROM of joints involving CFL and between TFL and ADF were not significant (Table 5).

3.4. Front and Back Functional Lines

In the FFL, correlation coefficients ranged from 0.29 to 0.51. Following application of the Holm–Bonferroni correction, both primary comparisons revealed statistically significant weak-to-moderate associations between SER and TEX on the right (r = 0.35, p = 0.006, padj = 0.012) and left sides (r = 0.32, p = 0.013, padj = 0.013). Statistically significant moderate associations were also observed between TEX and the contralateral HER (right-to-left: r = 0.49, p < 0.001, padj < 0.002; left-to-right: r = 0.51, p < 0.001, padj < 0.002).
Exploratory analyses between SER and contralateral HER ROM measurements also yielded significant correlations on both sides (r = 0.44, p = 0.001 for right-to-left comparisons; r = 0.29, p = 0.027 for left-to-right comparisons. No correction for multiple comparisons was applied, as only single correlations were tested for each direction (Table 6).
Primary correlation analyses within the BFL were conducted between SER–HFL and HFL–KFL, with the contralateral gluteus maximus considered a hip extensor. Additionally, associations were examined between SER–HIR and HIR–KFL, with the contralateral gluteus maximus considered an external rotator. Associations considering the gluteus maximus as a hip flexor revealed significant correlations after Holm-Bonferroni correction only between HFL–KFL for the right-to-left (r = 0.60, p < 0.001, padj = 0.002) and left-to-right side (r = 0.48, p < 0.001, padj = 0.002). Under the assumption that the gluteus maximus functioned as a hip external rotator, right-to-left side correlations for SER–HIR (r = 0.27, p = 0.038, padj = 0.076) and HIR–KFL (r = 0.026, p = 0.049, padj = 0.076) were no longer significant following Holm–Bonferroni adjustment.
Exploratory comparisons revealed very weak, non-significant bilateral correlations between SER and the contralateral KFL (Table 7).

3.5. Within-Line vs. Between-Line Specificity

When compared against the empirical random benchmark distribution (300 draws per line), within-line correlation strength showed a consistent, line-specific pattern across sides. For the SFL, the observed within-line statistics were exceeded by 234/300 (78.0%) random draws on the right (≈22nd percentile, p rand 0.78 ) and 169/300 (56.0%) on the left (≈44th percentile, p rand 0.56 ), indicating weak within-line specificity. Similarly, the SBL showed low specificity, with 263/300 (87.7%) random draws exceeding the observed value on the right (≈12th percentile, p rand 0.88 ) and 259/300 (86.3%) on the left (≈14th percentile, p rand 0.86 ).
In contrast, the FFL demonstrated strong and bilateral within-line specificity: no random draw exceeded the observed statistic on the right (0/300, >99th percentile, p rand < 0.01 ), and only 2/300 (0.7%) did so on the left (>99th percentile, p rand < 0.01 ). The BFL showed intermediate behavior, with the observed value exceeding 208/300 (69.3%) random draws on the right (≈69th percentile, p rand 0.31 ) and 95/300 (31.7%) on the left (≈32nd percentile, p rand 0.68 ). Overall, these findings indicate selective concentration of correlation strength within the FFL, whereas superficial lines, and particularly the SBL, exhibited weaker within-line specificity than expected under random pairing (Table 8).

4. Discussion

The purpose of the present study was to investigate potential associations between ROM measurements of joints that are myofascially interconnected within anatomically described continuities and to assess whether joint ROM displays regionally organized patterns of co-variation consistent with these anatomical models.

4.1. Associations of Joint Range of Motion Within Myofascial Chains

4.1.1. Associations of Joint ROM Within the Superficial Front Line

Exploratory comparisons between joints’ ROM measurements contributing to the formation of the SFL revealed weak to moderate positive associations between cervical and trunk mobility, particularly between CLF and TEX (r = 0.35–0.44) and between CRT and TEX (r = 0.32–0.33). The observation that CLF, via engagement of the SCM and anterior cervical fascia, reflects regionally coordinated movement behaviour within the SFL more clearly than CRT may be indicative of differing contributions of fascial and neuromuscular factors. Fascia behaves as an anisotropic connective tissue, meaning that it transmits mechanical effects more efficiently along directions aligned with collagen fiber orientation, whereas shear forces generated by off-axis loading or sliding between adjacent fascial planes dissipate rapidly [34,35,36,37]. Thus, because the dominant force vectors generated during cervical rotation do not align with the longitudinal orientation of the SFL, much of the load may be absorbed locally through shear and interfascial sliding, limiting the effective mechanical interactions along the chain during CRT.
Although the present findings revealed significant associations between cervical and thoraco-lumbar movements, these results should be interpreted with caution, as no cadaveric studies have yet confirmed a direct fascial continuity between the SCM and rectus abdominis muscles [4]. One reason for the absence of such evidence is that the anatomical structure most often cited as a potential intermediary, the sternalis or rectus sternalis muscle, is a highly variable anterior chest wall element, present in only approximately 5–8% of individuals and demonstrating inconsistent continuity with the rectus abdominis [38,39]. Therefore, the observed coupling is unlikely to reflect a strict myofascial linkage but may instead arise from broader biomechanical, neuromuscular, or regionally mediated fascial interactions. In this context, previous work has shown that neck flexor and abdominal muscles respond in parallel during postural perturbations [40], while other studies have demonstrated that cranio-cervical posture modulates rectus abdominis activation during core stabilization tasks [41]. Both the SCM and rectus abdominis also contribute to ventilatory mechanics, with SCM assisting forced inspiration and rectus abdominis forced expiration, leading to coordinated activation during high-demand breathing [42]. Additionally, shared descending motor pathways, particularly reticulospinal projections that span cervical and lumbar enlargements, provide a neural substrate for integrated neck–trunk activation [43]. Moreover, although the cervical, sternal, and thoracoabdominal fascia do not form a single continuous band, they operate as an integrated mechanical system capable of transmitting tension across regions. This interpretation is consistent with in vivo and cadaveric evidence showing that epimuscular myofascial force transmission can convey strain between adjacent muscles and fascial compartments [44,45]. Collectively, these functional and biomechanical explanations indicate that SCM and rectus abdominis may interact functionally through postural, neuromuscular, and mechanical pathways, even in the absence of confirmed direct fascial continuity. The lack of significant correlations with distal segments further supports the interpretation that any functional coupling is more regionally confined rather than representative of a continuous superficial front line extending into the lower limb.

4.1.2. Associations of Joint ROM Within the Superficial Back Line

Compared with the SFL, the SBL exhibited markedly weaker associations between joint ROM in the upper segments of the chain and between upper and more caudal segments, indicating minimal functional coupling within the cervical–thoracolumbar region (−0.09 ≤ r ≤ 0.19). The absent or minimal correlations between joint ROM in the upper segments of the chain suggest limited functional association during active movements, despite extensive cadaveric and imaging evidence demonstrating fascial continuity from the galea aponeurotica through the nuchal and thoracolumbar fascia to the plantar fascia [2,35,46,47]. This discrepancy indicates that, although anatomical continuity along the SBL may exhibit segmental continuity linking the body’s anatomical regions (e.g., cervical, thoracic, lumbar, and pelvic), yet it is organized into functionally semi-independent segments, each governed by its own neuromuscular control, spinal innervation, and local fascial compartments. In the context of movement science and fascial anatomy, this is supported by previous studies showing that remote myofascial interventions produce only small, inconsistent effects along the chain [22,48], suggesting limited mechanical coupling. Electromyographic research further shows that posterior-chain muscles activate with region-specific timing patterns, with lumbar, thoracic, and hamstring muscles behaving independently during trunk motion [49,50].
Furthermore, although anatomical continuity between the erector spinae and the hamstrings via the sacrotuberous ligament has been described and a potential mechanical interaction between these structures has been proposed [35,51,52], this relationship was not supported by the findings of the present study. Only weak correlations were observed between TFL and HFL, reaching statistical significance on the right side (r = 0.34) but not on the left (r = 0.18). Moreover, the very weak correlations between TFL and ADF ROM (r = 0.11 and 0.03 for the right and left side, respectively) indicate that the functional integration of the posterior chain is constrained by segmental neuromuscular organization and the attenuation of forces across the lumbosacral junction. This limitation may be further explained by anatomical inconsistency among individuals concerning the presence of myofascial continuity between the hamstrings and the sacrotuberous ligament. Cadaveric evidence indicates that despite force transfer from the biceps femoris to the sacrotuberous ligament may range from 7% to 20%, and in some cases, 58% or 69% [5,53], such a direct connection is present in approximately half of the specimens studied, with unilateral partial connections observed in about one-quarter of cases [51,53]. Additionally, the effectiveness of this connection, even when present, may be limited by the fact that epimuscular force transmission diminishes rapidly with increasing anatomical distance, further reducing the likelihood of effective mechanical interaction between distant segments [34,45,54,55].
In contrast to the upper segments of the SBL chain, stronger intersegmental relationships were evident in the distal portion of the chain, particularly among the hip, knee, and ankle joints. Hip flexion demonstrated a significant association with ADF (r = 0.42 for the right side and 0.29 for the left side), while KEX correlated weakly to moderately with ADF (r = 0.44 and 0.19 for the right and left side, respectively). This finding could be supported by the robust anatomical and fascial continuity of the lower limb, where dense structures such as the hamstrings, triceps surae, and Achilles tendon span multiple joints and effectively transmit tension along the lower segments of the SBL [4,5]. This multi-joint linkage increases the likelihood that mobility in one joint (e.g., hip flexion) will be functionally related to mobility in adjacent joints (e.g., knee extension, ankle dorsiflexion). Furthermore, lower limb joints operate in close functional interdependence during locomotor tasks such as walking, running, and squatting, which are governed by symmetrical and rhythmical locomotor patterns, and possible restrictions in one joint commonly result in compensatory adjustments in others [56,57,58]. The anatomical and functional organization of these regions contrasts with that of the upper segments of the posterior chain, where the predominance of multidirectional musculature facilitates asymmetric, task-specific movements and likely contributes to the greater variability observed in ROM associations [59,60].

4.1.3. Associations of Joint ROM Within the Front and Back Functional Lines

In the FFL, significant relationships were observed among SER, TEX, and contralateral HER (r = 0.29–0.51), reflecting the anatomical configuration for cross-body functional linkage. The structural arrangement that integrates the anterior trunk (via the lower border of the pectoralis major and the lateral sheath of the rectus abdominis) with the contralateral lower limb (adductor longus) [2] forms an oblique linkage that is engaged during dynamic tasks such as gait, running, or throwing, where concurrent rotation and stabilization of the shoulder and pelvis are essential. This assumption is consistent with previous research reporting moderate correlations between shoulder and hip rotational movements in baseball players [17,18]. From a biomechanical perspective, the observed coupling supports Vleeming’s concept of force closure within the anterior oblique sling, whereby the synergistic activation of the abdominal and adductor musculature enhances pelvic stability [61,62].
The correlation pattern observed within the BFL suggests that segmental interactions are primarily governed by regional rather than long-distance biomechanical continuity, a finding consistent with current anatomical evidence [4,5]. Cadaveric and imaging studies consistently identify the thoracolumbar fascia as a key intermediate structure integrating shoulder and hip mechanics through its anatomical and functional continuity with the latissimus dorsi superiorly and the gluteus maximus inferiorly [4,5]. Our findings do not support this structure as a potential link between shoulder and hip function, as assessed by active ROM measurements. In contrast, the moderate-to-strong associations identified between HFL and KFL (r = 0.48–0.60) likely reflect functional coupling between the gluteus maximus and the vastus lateralis during multi-segment posterior-chain tasks. However, it is important to note that cadaveric evidence for a direct myofascial linkage between these muscles is limited [63,64], and empirical data on biomechanical connections between the gluteus maximus and vastus lateralis are sparse [5]. Thus, these associations may arise not from structural continuity but from coordinated neuromuscular recruitment patterns characteristic of lower-limb extensor synergy during functional movement.
In contrast, the link between SER and KFL was weak, suggesting that although the thoracolumbar fascia and gluteus maximus provide a plausible anatomical bridge between the shoulder and knee [2,65], mechanical interactions across these tissues may be dissipated through interfascial shear, reducing the likelihood of strong functional coupling across distant segments [35,37]. Overall, the pattern of results is consistent with the concept that the BFL supports regional force coordination within the hip–knee complex, while mechanical connections across more proximal–distal links (e.g., shoulder to knee) are limited, probably by anisotropic fascial mechanics and the heterogeneity of muscular recruitment patterns across the posterior kinetic chain.

4.2. Bilateral Comparisons and Associations of Joints’ Range of Motion

Consistent with previous research, our study demonstrated significant but modest differences between the right and left sides for certain movements, including SER, and HIR. These asymmetries may reflect natural variations due to limb dominance or habitual activity patterns [66,67]. Most importantly, while we found statistically significant differences, these were small and likely of limited clinical relevance in healthy individuals.
The high correlations between corresponding movements of the right and left sides (r = 0.59–0.90) reflect the expected bilateral symmetry and coordinated neuromuscular control that characterize normal joint function [68,69]. This strong symmetry also underlines the potential of using the contralateral limb as a valid reference during clinical assessment or rehabilitation, a strategy commonly applied in clinical practice [70].

4.3. Clinical Relevance

From a clinical perspective, the weak-to-strong associations in active ROM observed in healthy young adults do not justify direct clinical decision-making or treatment strategies targeting distant anatomical regions. While the results may support the conceptual notion of regional interdependence during assessment, they suggest caution against over-reliance on the myofascial chain model alone as a diagnostic or therapeutic framework. Clinical application of cross-regional interventions requires confirmation through interventional and longitudinal research that can establish causal relationships and clinically meaningful effects. Until such evidence is available, the present findings should be considered descriptive rather than prescriptive.
On the other hand, strong bilateral correlations in joint range of motion suggest that the contralateral limb may serve as a useful within-subject reference for identifying functional deficits and informing rehabilitation targets, provided that potential bilateral adaptations, limb dominance effects, and pre-existing asymmetries are considered [71].

4.4. Limitations

The present study is subject to certain methodological limitations that should be considered when interpreting and generalizing the findings. A key limitation is that, although myofascial continuity may theoretically explain inter-joint relationships within a given myofascial chain, the cross-sectional correlational design of this study limits interpretation to descriptive associations and precludes conclusions regarding causality, directionality, or underlying mechanisms. These results should therefore be interpreted cautiously with respect to possible sex- and limb-dominance-related effects and their generalizability beyond the studied cohort, given that analyses were conducted at the group level without explicit consideration of bilateral asymmetries and were based on a sample of young, healthy, physically active participants. The evaluation of static active ROM also does not account for dynamic or load-bearing interactions within or between myofascial chains, thereby limiting inferences regarding the true behaviour of force transmission under conditions that challenge their elastic properties. In addition, IMU technology provides reliable estimates of joint angles; however, its accuracy may depend on joint complexity and the context of movement [72], with larger ROMs, such as those occurring in the hip, knee, and ankle, typically yielding higher reliability and stronger correlations than subtler spinal or upper-limb movements [73]. Furthermore, the joint ROM estimated from a single inertial measurement unit represents displacement relative to the initial reference orientation rather than true inter-segmental kinematics and is therefore sensitive to subtle distal segment compensations.

5. Conclusions

The present analysis identified weak to strong correlations in active ROM between selected joints within the same myofascial chains, confined to specific anatomical regions. Although certain correlation patterns were compatible with anatomically described myofascial continuities, namely among joints of the upper SFL, the lower SBL, across the FFL, and between the lower segments of the BFL, the findings do not support strong, uniform, or deterministic coupling across entire myofascial chains. Instead, joint mobility appears to reflect non-specific, regionally organized patterns of association, likely influenced by the combined effects of local tissue properties, neuromuscular coordination, and movement strategy. Within the constraints of the present study design, these results may provide a foundation for future investigations employing longitudinal, interventional, or experimental approaches to further elucidate myofascial organization.

Author Contributions

Conceptualization, D.M.; methodology, D.M. and A.C.; validation, D.M.; formal analysis, A.C.; investigation, A.C.; resources, D.M. and A.C.; data curation, D.M. and E.P.; writing—original draft preparation, A.C. and E.P.; writing—review and editing, D.M.; visualization, D.M.; supervision, D.M.; project administration, A.C. All authors have read and agreed to the published version of the manuscript.

Funding

This research received no external funding.

Institutional Review Board Statement

The study was conducted according to the guidelines of the Declaration of Helsinki and approved by the Bioethics Committee of the School of Physical Education and Sport Science of the National and Kapodistrian University of Athens (Reg. No 1620/11-03-2024).

Informed Consent Statement

Informed consent was obtained from all subjects involved in the study.

Data Availability Statement

The data presented in this study are available upon request from the corresponding author.

Conflicts of Interest

The authors declare no conflicts of interest.

Abbreviations

The following abbreviations are used in this manuscript:
ROMRange of Motion
IMUInertial Measurement Unit
SFLSuperficial Front Line
SBLSuperficial Back Line
FFLFront Functional Lines
BFLBack Functional Line
LLLateral Line
SLSpiral Line
CFLCervical Flexion
CEXCervical Extension
CLFCervical Lateral Flexion
CRTCervical Rotation
SERShoulder External Rotation
TFLTrunk Flexion
TEXTrunk Extension
HFLHip Flexion
HERHip External Rotation
HIRHip Internal Rotation
KFLKnee Flexion
KEXKnee Extension
ADFAnkle Dorsiflexion
ILIpsilateral
CLContralateral
RRight
LLeft
padjAdjusted p-values

References

  1. Ajimsha, M.S.; Shenoy, P.D.; Gampawar, N. Role of Fascial Connectivity in Musculoskeletal Dysfunctions: A Narrative Review. J. Bodyw. Mov. Ther. 2020, 24, 423–431. [Google Scholar] [CrossRef]
  2. Myers, T.W. Anatomy Trains: Myofascial Meridians for Manual Therapists and Movement Professionals; Elsevier Ltd., Ed.; Elsevier: Amsterdam, The Netherlands, 2021; ISBN 9780702078132. [Google Scholar]
  3. Kumka, M.; Bonar, J. Fascia: A Morphological Description and Classification System Based on a Literature Review. J. Can. Chiropr. Assoc. 2012, 56, 179–191. [Google Scholar]
  4. Wilke, J.; Krause, F.; Vogt, L.; Banzer, W. What Is Evidence-Based About Myofascial Chains: A Systematic Review. Arch. Phys. Med. Rehabil. 2016, 97, 454–461. [Google Scholar] [CrossRef]
  5. Krause, F.; Wilke, J.; Vogt, L.; Banzer, W. Intermuscular Force Transmission along Myofascial Chains: A Systematic Review. J. Anat. 2016, 228, 910–918. [Google Scholar] [CrossRef]
  6. Stecco, C.; Pirri, C.; Fede, C.; Yucesoy, C.A.; De Caro, R.; Stecco, A. Fascial or Muscle Stretching? A Narrative Review. Appl. Sci. 2020, 11, 307. [Google Scholar] [CrossRef]
  7. Schleip, R.; Müller, D.G. Training Principles for Fascial Connective Tissues: Scientific Foundation and Suggested Practical Applications. J. Bodyw. Mov. Ther. 2013, 17, 103–115. [Google Scholar] [CrossRef]
  8. Zügel, M.; Maganaris, C.N.; Wilke, J.; Jurkat-Rott, K.; Klingler, W.; Wearing, S.C.; Findley, T.; Barbe, M.F.; Steinacker, J.M.; Vleeming, A.; et al. Fascial Tissue Research in Sports Medicine: From Molecules to Tissue Adaptation, Injury and Diagnostics: Consensus Statement. Br. J. Sports Med. 2018, 52, 1497. [Google Scholar] [CrossRef]
  9. Gromakovskis, V. Exploring Fascia in Myofascial Pain Syndrome: An Integrative Model of Mechanisms. Front. Pain Res. 2025, 6, 1712242. [Google Scholar] [CrossRef]
  10. Steen, J.P.; Jaiswal, K.S.; Kumbhare, D. Myofascial Pain Syndrome: An Update on Clinical Characteristics, Etiopathogenesis, Diagnosis, and Treatment. Muscle Nerve 2025, 71, 889–910. [Google Scholar] [CrossRef]
  11. Reese, B.N.; Bandy, W.D. Joint Range of Motion and Muscle Length Testing, 3rd ed.; Elsevier: St. Louis, MO, USA, 2017; ISBN 978-1-4557-5882-1. [Google Scholar]
  12. Cejudo, A.; Sainz de Baranda, P.; Ayala, F.; De Ste Croix, M.; Santonja-Medina, F. Assessment of the Range of Movement of the Lower Limb in Sport: Advantages of the ROM-SPORT I Battery. Int. J. Environ. Res. Public Health 2020, 17, 7606. [Google Scholar] [CrossRef]
  13. Gates, D.H.; Walters, L.S.; Cowley, J.; Wilken, J.M.; Resnik, L. Range of Motion Requirements for Upper-Limb Activities of Daily Living. Am. J. Occup. Ther. 2016, 70, 7001350010p1–7001350010p10. [Google Scholar] [CrossRef]
  14. Petersen, C.M.; Hayes, K.W. Construct Validity of Cyriax’s Selective Tension Examination: Association of End-Feels with Pain at the Knee and Shoulder. J. Orthop. Sports Phys. Ther. 2000, 30, 512–527. [Google Scholar] [CrossRef]
  15. Miyamoto, N.; Hirata, K.; Miyamoto-Mikami, E.; Yasuda, O.; Kanehisa, H. Associations of Passive Muscle Stiffness, Muscle Stretch Tolerance, and Muscle Slack Angle with Range of Motion: Individual and Sex Differences. Sci. Rep. 2018, 8, 8274. [Google Scholar] [CrossRef]
  16. Anloague, P.A.; Spees, V.; Smith, J.; Herbenick, M.A.; Rubino, L.J. Glenohumeral Range of Motion and Lower Extremity Flexibility in Collegiate-Level Baseball Players. Sports Health A Multidiscip. Approach 2012, 4, 25–30. [Google Scholar] [CrossRef]
  17. Scher, S.; Anderson, K.; Weber, N.; Bajorek, J.; Rand, K.; Bey, M.J. Associations Among Hip and Shoulder Range of Motion and Shoulder Injury in Professional Baseball Players. J. Athl. Train. 2010, 45, 191–197. [Google Scholar] [CrossRef]
  18. Oliver, G.D.; Weimar, W.H. Hip and Shoulder Range of Motion in Youth Baseball Pitchers. J. Strength Cond. Res. 2016, 30, 2823–2827. [Google Scholar] [CrossRef]
  19. Hyong, I.H.; Kang, J.H. The Immediate Effects of Passive Hamstring Stretching Exercises on the Cervical Spine Range of Motion and Balance. J. Phys. Ther. Sci. 2013, 25, 113–116. [Google Scholar] [CrossRef]
  20. Wilke, J.; Vogt, L.; Niederer, D.; Banzer, W. Is Remote Stretching Based on Myofascial Chains as Effective as Local Exercise? A Randomised-Controlled Trial. J. Sports Sci. 2017, 35, 2021–2027. [Google Scholar] [CrossRef]
  21. Do, K.; Kim, J.; Yim, J. Acute Effect of Self-Myofascial Release Using a Foam Roller on the Plantar Fascia on Hamstring and Lumbar Spine Superficial Back Line Flexibility. Phys. Ther. Rehabil. Sci. 2018, 7, 35–40. [Google Scholar] [CrossRef]
  22. Grieve, R.; Goodwin, F.; Alfaki, M.; Bourton, A.J.; Jeffries, C.; Scott, H. The Immediate Effect of Bilateral Self Myofascial Release on the Plantar Surface of the Feet on Hamstring and Lumbar Spine Flexibility: A Pilot Randomised Controlled Trial. J. Bodyw. Mov. Ther. 2015, 19, 544–552. [Google Scholar] [CrossRef]
  23. Fousekis, K.; Eid, K.; Tafa, E.; Gkrilias, P.; Mylonas, K.; Angelopoulos, P.; Koumoundourou, D.; Billis, V.; Tsepis, E. Can the Application of the Ergon® IASTM Treatment on Remote Parts of the Superficial Back Myofascial Line Be Equally Effective with the Local Application for the Improvement of the Hamstrings’ Flexibility? A Randomized Control Study. J. Phys. Ther. Sci. 2019, 31, 508–511. [Google Scholar] [CrossRef]
  24. Aparicio, É.Q.; Quirante, L.B.; Blanco, C.R.; Sendín, F.A. Immediate Effects of the Suboccipital Muscle Inhibition Technique in Subjects with Short Hamstring Syndrome. J. Manip. Physiol. Ther. 2009, 32, 262–269. [Google Scholar] [CrossRef]
  25. Proske, U.; Gandevia, S.C. The Proprioceptive Senses: Their Roles in Signaling Body Shape, Body Position and Movement, and Muscle Force. Physiol. Rev. 2012, 92, 1651–1697. [Google Scholar] [CrossRef]
  26. Latash, M.L. Synergy; Oxford University Press: New York, NY, USA, 2008; ISBN 978-0-19-533316-9. [Google Scholar]
  27. Stefanouli, V.; Kapreli, E.; Anastasiadi, E.; Nakastsis, A.; Strimpakos, N. Validity and Reliability of the Greek Version of Modified Baecke Questionnaire. Public Health 2022, 203, 58–64. [Google Scholar] [CrossRef]
  28. Chatziilias, V.; Kafetzakis, I.; Mandalidis, D. Test–Retest Reliability and Agreement of Postural Control Variables Within and Between Single-Leg Squat Variations. Appl. Sci. 2026, 16, 1147. [Google Scholar] [CrossRef]
  29. Bunnell, W.P. An Objective Criterion for Scoliosis Screening. J. Bone Jt. Surg. Am. Vol. 1984, 66, 1381–1387. [Google Scholar]
  30. Hamersma, D.T.; Hofste, A.; Rijken, N.H.M.; Roe of Rohé, M.; Oosterveld, F.G.J.; Soer, R. Reliability and Validity of the Microgate Gyko for Measuring Range of Motion of the Low Back. Musculoskelet. Sci. Pract. 2020, 45, 102091. [Google Scholar] [CrossRef]
  31. Nosek, B.A.; Ebersole, C.R.; DeHaven, A.C.; Mellor, D.T. The Preregistration Revolution. Proc. Natl. Acad. Sci. USA 2018, 115, 2600–2606. [Google Scholar] [CrossRef]
  32. Rubin, M. When to Adjust Alpha during Multiple Testing: A Consideration of Disjunction, Conjunction, and Individual Testing. Synthese 2021, 199, 10969–11000. [Google Scholar] [CrossRef]
  33. Wagenmakers, E.J.; Wetzels, R.; Borsboom, D.; van der Maas, H.L.J.; Kievit, R.A. An Agenda for Purely Confirmatory Research. Perspect. Psychol. Sci. 2012, 7, 632–638. [Google Scholar] [CrossRef]
  34. Huijing, P.A. Epimuscular Myofascial Force Transmission: A Historical Review and Implications for New Research. International Society of Biomechanics Muybridge Award Lecture, Taipei, 2007. J. Biomech. 2009, 42, 9–21. [Google Scholar] [CrossRef]
  35. Turrina, A.; Martínez-González, M.A.; Stecco, C. The Muscular Force Transmission System: Role of the Intramuscular Connective Tissue. J. Bodyw. Mov. Ther. 2013, 17, 95–102. [Google Scholar] [CrossRef]
  36. Schleip, R.; Klingler, W.; Lehmann-Horn, F. Active Fascial Contractility: Fascia May Be Able to Contract in a Smooth Muscle-like Manner and Thereby Influence Musculoskeletal Dynamics. Med. Hypotheses 2005, 65, 273–277. [Google Scholar] [CrossRef] [PubMed]
  37. Yahia, L.H.; Pigeon, P.; DesRosiers, E.A. Viscoelastic Properties of the Human Lumbodorsal Fascia. J. Biomed. Eng. 1993, 15, 425–429. [Google Scholar] [CrossRef] [PubMed]
  38. Snosek, M.; Tubbs, R.S.; Loukas, M. Sternalis Muscle, What Every Anatomist and Clinician Should Know. Clin. Anat. 2014, 27, 866–884. [Google Scholar] [CrossRef]
  39. Pillay, M.; Ramakrishnan, S.; Mayilswamy, M. Two Cases of Rectus Sternalis Muscle. J. Clin. Diagn. Res. 2016, 10, AD01–AD03. [Google Scholar] [CrossRef] [PubMed]
  40. Keshner, E.A.; Woollacott, M.H.; Debu, B. Neck, Trunk and Limb Muscle Responses during Postural Perturbations in Humans. Exp. Brain Res. 1988, 71, 455–466. [Google Scholar] [CrossRef]
  41. García-Jaén, M.; Konarski, J.M.; Hernández-Sánchez, S.; Cortell-Tormo, J.M. The Effect of Cranio-Cervical Position on Core Muscle Activation during the Prone Plank Exercise. Appl. Sci. 2023, 13, 10970. [Google Scholar] [CrossRef]
  42. De Troyer, A.; Boriek, A.M. Mechanics of the Respiratory Muscles. Compr. Physiol. 2011, 1, 1273–1300. [Google Scholar] [CrossRef]
  43. Brownstone, R.M.; Chopek, J.W. Reticulospinal Systems for Tuning Motor Commands. Front. Neural Circuits 2018, 12, 30. [Google Scholar] [CrossRef]
  44. Huijing, P.A.; Baan, G.C. Myofascial Force Transmission via Extramuscular Pathways Occurs between Antagonistic Muscles. Cells Tissues Organs 2008, 188, 400–414. [Google Scholar] [CrossRef]
  45. Maas, H.; Sandercock, T.G. Force Transmission between Synergistic Skeletal Muscles through Connective Tissue Linkages. J. Biomed. Biotechnol. 2010, 2010, 575672. [Google Scholar] [CrossRef]
  46. Fede, C.; Clair, C.; Pirri, C.; Petrelli, L.; Zhao, X.; Sun, Y.; Macchi, V.; Stecco, C. The Human Superficial Fascia: A Narrative Review. Int. J. Mol. Sci. 2025, 26, 1289. [Google Scholar] [CrossRef]
  47. Ozyurek, S.; Aktar, B.; Kosova, A.; Aydin, E.; Turedi, R.; Ozunlu Pekyavas, N. Effect of Hamstring Flexibility on Cervical Range of Motion and Deep Neck Flexor Endurance in Healthy Young Adults: A Study to Explore Myofascial Tensegrity Network. J. Bodyw. Mov. Ther. 2024, 40, 662–668. [Google Scholar] [CrossRef] [PubMed]
  48. Williams, W.; Selkow, N.M. Self-Myofascial Release of the Superficial Back Line Improves Sit-and-Reach Distance. J. Sport Rehabil. 2020, 29, 400–404. [Google Scholar] [CrossRef]
  49. McGorry, R.W.; Hsiang, S.M.; Fathallah, F.A.; Clancy, E.A. Timing of Activation of the Erector Spinae and Hamstrings During a Trunk Flexion and Extension Task. Spine 2001, 26, 418–425. [Google Scholar] [CrossRef] [PubMed]
  50. van Helden, J.F.L.; Cabral, H.V.; Alexander, E.; Strutton, P.H.; Martinez-Valdes, E.; Falla, D.; Chowdhury, J.R.; Chiou, S.-Y. Changes in Thoracic Erector Spinae Regional Activation during Postural Adjustments and Functional Reaching Tasks after Spinal Cord Injury. J. Neurophysiol. 2025, 133, 727–741. [Google Scholar] [CrossRef] [PubMed]
  51. Vleeming, A. The Sacro-Iliac Joint A Clinical-Anatomical, Biomechanical and Radiological Study. Doctoral Dissertation, Erasmus University Rotterdam, Rotterdam, The Netherlands, 1990. [Google Scholar]
  52. Vleeming, A.; Stoeckart, R.; Snijders, C.J. The Sacrotuberous Ligament: A Conceptual Approach to Its Dynamic Role in Stabilizing the Sacroiliac Joint. Clin. Biomech. 1989, 4, 201–203. [Google Scholar] [CrossRef]
  53. van Wingerden, J.-P. Functional Anatomy in Low Back Rehabilitation Balance in the Biopsychosocial Model. Doctoral Dissertation, Erasmus University Rotterdam, Rotterdam, The Netherlands, 2009. [Google Scholar]
  54. Maas, H. Significance of Epimuscular Myofascial Force Transmission under Passive Muscle Conditions. J. Appl. Physiol. 2019, 126, 1465–1473. [Google Scholar] [CrossRef]
  55. Yucesoy, C.A. Epimuscular Myofascial Force Transmission Implies Novel Principles for Muscular Mechanics. Exerc. Sport Sci. Rev. 2010, 38, 128–134. [Google Scholar] [CrossRef]
  56. Dietz, V. Do Human Bipeds Use Quadrupedal Coordination? Trends Neurosci. 2002, 25, 462–467. [Google Scholar] [CrossRef]
  57. Ong, C.F.; Geijtenbeek, T.; Hicks, J.L.; Delp, S.L. Predicting Gait Adaptations Due to Ankle Plantarflexor Muscle Weakness and Contracture Using Physics-Based Musculoskeletal Simulations. PLoS Comput. Biol. 2019, 15, e1006993. [Google Scholar] [CrossRef]
  58. Sadeghi, H.; Allard, P.; Prince, F.; Labelle, H. Symmetry and Limb Dominance in Able-Bodied Gait: A Review. Gait Posture 2000, 12, 34–45. [Google Scholar] [CrossRef] [PubMed]
  59. Ackland, D.C.; Pandy, M.G. Lines of Action and Stabilizing Potential of the Shoulder Musculature. J. Anat. 2009, 215, 184–197. [Google Scholar] [CrossRef]
  60. Hik, F.; Ackland, D.C. The Moment Arms of the Muscles Spanning the Glenohumeral Joint: A Systematic Review. J. Anat. 2019, 234, 1–15. [Google Scholar] [CrossRef] [PubMed]
  61. Vleeming, A.; Schuenke, M.D.; Masi, A.T.; Carreiro, J.E.; Danneels, L.; Willard, F.H. The Sacroiliac Joint: An Overview of Its Anatomy, Function and Potential Clinical Implications. J. Anat. 2012, 221, 537–567. [Google Scholar] [CrossRef] [PubMed]
  62. Vleeming, A.; Schuenke, M. Form and Force Closure of the Sacroiliac Joints. PMR 2019, 11, S24–S31. [Google Scholar] [CrossRef]
  63. Stern, J.T. Anatomical and Functional Specializations of the Human Gluteus Maximus. Am. J. Phys. Anthropol. 1972, 36, 315–339. [Google Scholar] [CrossRef]
  64. Stecco, A.; Gilliar, W.; Hill, R.; Fullerton, B.; Stecco, C. The Anatomical and Functional Relation between Gluteus Maximus and Fascia Lata. J. Bodyw. Mov. Ther. 2013, 17, 512–517. [Google Scholar] [CrossRef]
  65. Willard, F.H.; Vleeming, A.; Schuenke, M.D.; Danneels, L.; Schleip, R. The Thoracolumbar Fascia: Anatomy, Function and Clinical Considerations. J. Anat. 2012, 221, 507–536. [Google Scholar] [CrossRef]
  66. Moromizato, K.; Kimura, R.; Fukase, H.; Yamaguchi, K.; Ishida, H. Whole-Body Patterns of the Range of Joint Motion in Young Adults: Masculine Type and Feminine Type. J. Physiol. Anthropol. 2016, 35, 23. [Google Scholar] [CrossRef]
  67. Macedo, L.G.; Magee, D.J. Differences in Range of Motion Between Dominant and Nondominant Sides of Upper and Lower Extremities. J. Manip. Physiol. Ther. 2008, 31, 577–582. [Google Scholar] [CrossRef] [PubMed]
  68. Dietz, V.; Holliger, N.S.; Christen, A.; Geissmann, M.; Filli, L. Neural Coordination of Bilateral Hand Movements: Evidence for an Involvement of Brainstem Motor Centres. J. Physiol. 2024, 602, 397–412. [Google Scholar] [CrossRef]
  69. Carson, R.G. Neural Pathways Mediating Bilateral Interactions between the Upper Limbs. Brain Res. Rev. 2005, 49, 641–662. [Google Scholar] [CrossRef]
  70. Camarillo, N.D.; Jiménez-Silva, R.; Sheehan, F.T. Using Bilateral Data in Controls and Patients with Bilateral and Unilateral Pathology Requires Increased Scrutiny. J. Biomech. 2024, 162, 111855. [Google Scholar] [CrossRef]
  71. Rabin, A.; Kozol, Z.; Spitzer, E.; Finestone, A.S. Weight-Bearing Ankle Dorsiflexion Range of Motion-Can Side-to-Side Symmetry Be Assumed? J. Athl. Train. 2015, 50, 30–35. [Google Scholar] [CrossRef]
  72. Villa, G.; Cerfoglio, S.; Bonfiglio, A.; Capodaglio, P.; Galli, M.; Cimolin, V. Validation of a Commercially Available IMU-Based System Against an Optoelectronic System for Full-Body Motor Tasks. Sensors 2025, 25, 3736. [Google Scholar] [CrossRef] [PubMed]
  73. Al-Amri, M.; Nicholas, K.; Button, K.; Sparkes, V.; Sheeran, L.; Davies, J. Inertial Measurement Units for Clinical Movement Analysis: Reliability and Concurrent Validity. Sensors 2018, 18, 719. [Google Scholar] [CrossRef] [PubMed]
Figure 1. (a) Starting position for the cervical spine (b) flexion and extension, and (c) starting position for (d) side flexion and (e) rotation range of motion measurements.
Biomechanics 06 00025 g001
Figure 2. (a) Starting positions for the trunk, (b) flexion (upper), and extension (lower) range of motion measurements. Note the position of the IMU on the posterior trunk as it becomes visible through the opening of the treatment table during the trunk flexion ROM measurement (detail in upper left figure).
Biomechanics 06 00025 g002
Figure 3. Starting (vertical forearm) and ending (horizontal forearm) position of the shoulder for external rotation range of motion measurements.
Biomechanics 06 00025 g003
Figure 4. (a) Starting position for the hip flexion range of motion measurements with the knee (b) extended and (c) flexed.
Biomechanics 06 00025 g004
Figure 5. (a) Starting position for the hip, (b) internal, and (c) external rotation range of motion measurements.
Biomechanics 06 00025 g005
Figure 6. (a) Starting position for the knee (b) flexion (upper) and extension (lower) range of motion measurements.
Biomechanics 06 00025 g006
Figure 7. (a) Starting position for the knee (b) extension range of motion measurements.
Biomechanics 06 00025 g007
Figure 8. (a) Starting position for the ankle (b) dorsiflexion range of motion measurements.
Biomechanics 06 00025 g008
Table 1. Key muscles within their respective myofascial lines, the primary joint actions associated with their shortening and lengthening behavior, and the corresponding range of motion (ROM) assessments used to examine inter-joint associations along the described myofascial lines.
Myofascial LineMuscleShortening-Associated
Joint Actions
Lengthening-Associated
Joint Actions
ROM
Tested
SFLSternocleidomastoidIpsilateral cervical lateral flexion/Contralateral rotationContralateral cervical lateral flexion/Ipsilateral rotationCLF
CRT
Rectus abdominisTrunk flexionTrunk extensionTEX
Rectus femoris/QuadricepsKnee extensionKnee flexionKFL
SBLGalea aponeurotica/
Erector spinae
(Cervical segments)
Cervical extensionCervical flexionCFL
Sacrolumbar fascia/
Erector spinae (Thoracolumbar segments)
Trunk extensionTrunk flexionTFL
HamstringsHip extension/Knee flexionHip flexion/Knee extensionHFL
KEX
Gastrocnemius/
Achilles tendon
Ankle plantarflexionAnkle dorsiflexionADF
FFLIL-Pectoralis major
(Lower edge)
Shoulder extension/
Adduction/Internal rotation
Shoulder flexion/
Abduction/External rotation
SER
IL-Rectus abdominis (Lateral sheath)Trunk flexionTrunk extensionTEX
CL-Adductor longusHip Flexion/Adduction
/Internal rotation
Hip Extension/Abduction
/External rotation
HER
BFLIL-Latissimus dorsiShoulder extension/adduction/
internal rotation
Shoulder flexion/Abduction/
External rotation
SER
CL-Gluteus maximusHip extension/External rotationHip flexion/Internal rotationHFL
HIR
CL-Vastus lateralis-
Subpatellar tendon
Knee extensionKnee flexionKFL
Note: SBL = Superficial Back Line; SFL = Superficial Front Line; BFL = Back Functional Line; FFL = Front Functional Line; CFL = Cervical Flexion; CEX = Cervical Extension; CLF = Cervical Lateral Flexion; CRT = Cervical Rotation; TFL = Trunk Flexion; TEX = Trunk Extension; SER = Shoulder External Rotation; HFL = Hip Flexion; HIR = Hip Internal Rotation; HER = Hip External Rotation; KFL = Knee Flexion; KEX = Knee Extension; ADF = Ankle Dorsiflexion.
Table 2. Primary and exploratory joint range of motion correlation pairs were examined within each myofascial line.
Myofascial
Chain
Primary CorrelationsExploratory Correlations
SFLCLF/CRT→TEX;
CLF/CRT→KFL; TEX→KFL
SBLTFL→HFL/KEX;
HFL/KEX→ADF
CFL→TFL; CFL→HFL/KEX; CFL→ADF; TFL→ADF
FFLIL-SER→TEX;
TEX→CL-HER
IL-SER→CL-HER
BFLIL-SER→CL-HFL/HIR CL-HFL/HIR→CL-KFLIL-SER→CL-KFL
Note: Each “primary pair” represented a distinct anatomical relationship evaluated bilaterally (right and left sides), resulting in two correlation coefficients per pair. Two correlation coefficients were also calculated between the range of motion of one joint and different motions of another joint (e.g., TEX vs. CLF and CRT for SCM actions) within the same myofascial pathway. For sample size estimation and control of type I error, both bilateral and multi-muscle action relationships were considered dependent observations within a common analytical family. Consequently, Holm–Bonferroni corrections and Benjamini–Hochberg false discovery rate procedures were applied at the level of each anatomical family rather than to individual correlation coefficients.
Table 3. Means ± standard deviations and bilateral correlation coefficients (Pearson r) for active joint range of motion measurements.
Anatomical Region/Joint Range of MotionSidePearson r
RightLeft
Cervical regionFlexion66.1 ± 11.9
Lateral flexion46.9 ± 8.045.8 ± 7.30.76 †
Rotation77.3 ± 7.577.2 ± 7.10.59 †
Thoracolumbar region Flexion38.3 ± 8.3
Extension33.6 ± 12.6
Shoulder jointExternal rotation105.2 ± 16.5102.4 ± 14.1 *0.75 †
Hip jointFlexion-knee straight96.7 ± 15.796.4 ± 15.30.86 †
Flexion-knee bent114.7 ± 10.5115.1 ± 11.00.81 †
Internal rotation38.0 ± 8.036.0 ± 7.5 **0.67 †
External rotation44.7 ± 8.244.8 ± 7.40.71 †
Knee jointFlexion134.5 ± 8.0134.3 ± 7.90.90 †
Extension76.2 ± 11.075.0 ± 12.10.87 †
Ankle jointDorsi flexion23.8 ± 4.723.9 ± 5.70.74 †
Note: Significant difference compared to the opposite side * p < 0.05 and ** p < 0.01; † significant bilateral correlation coefficients p < 0.001.
Table 4. Pearson’s (r) correlation coefficients between active range of motion measurements of joints myofascially connected along the Superficial Front Line (SFL), of the ipsilateral right (R), or left (L) side.
Joint ROMMyofascial Structures Under Stretch During Active Joint ROM MeasurementsPearson r (95% CI)
Origin-Site StructuresLinking StructuresInsertion-Site StructuresRL
CLF–TEXSternocleidomastoidSternalis/
Sternochondral fascia
Rectus abdominis0.35 **
(0.16, 0.52)
0.44 ***
(0.23, 0.62)
CRT–TEX0.33 **
(0.01, 0.60)
0.32 **
(0.06, 0.52)
CLF–KFLSternocleidomastoidSternalis/Sternochondral fascia/Rectus abdominisRectus femoris/
Quadriceps
0.20
(−0.02, 0.41)
0.16
(−0.10, 0.39)
CRT–KFL0.11
(−0.16, 0.39)
0.11
(−0.19, 0.38)
TEX–KFLRectus abdominisRectus femoris/
Quadriceps
0.04
(−0.19, 0.26)
0.02
(−0.21, 0.25)
Note: ROM = Range of motion; CI = Confidence intervals; CLF = Cervical Lateral Flexion; CRT = Cervical Rotation; TEX = Trunk Extension; KFL = Knee Flexion. ** p = 0.01, q = 0.03; *** p < 0.001, q < 0.003.
Table 5. Pearson’s (r) correlation coefficients between active range of motion measurements of joints myofascially connected along the Superficial Back Line (SBL), of the ipsilateral right (R) and left (L) side.
Joint ROMMyofascial Structures Under Stretch During Active Joint ROM MeasurementsPearson r (95% CI)
Origin-Site StructuresLinking StructuresInsertion-Site StructuresRL
CFL–TFLGalea aponeurotica/
Erector spinae (Cervical segments)
Sacrolumbar fascia/
Erector spinae (Thoracolumbar segments)
0.10
(−0.19, 0.36)
CFL–HFLGalea aponeurotica/
Erector spinae (Cervical segments)
Sacrolumbar fascia/
Erector spinae
(Thoracolumbar segments)
Hamstrings (via Sacrotuberous ligament)0.16
(−0.08, 0.38)
0.19
(−0.06, 0.40)
CFL–KEX0.14
(−0.13, 0.39)
0.14
(−0.13, 0.37)
CFL–ADFGalea aponeurotica/
Erector spinae (Cervical segments)
Sacrolumbar fascia/
Erector spinae (Thoracolumbar segments)/Sacrotuberous ligament/Hamstrings
Gastrocnemius/
Achilles tendon
−0.01
(−0.29, 0.26)
−0.09
(−0.37, 0.18)
TFL–HFLSacrolumbar fascia/Erector spinae (Thoracolumbar segments)Sacrotuberous ligamentHamstrings0.34 **
(0.12, 0.51)
0.18
(−0.04, 0.38)
TFL–KEX0.18
(−0.02, 0.39)
0.15
(−0.09, 0.38)
TFL–ADFSacrolumbar fascia/Erector spinae (Thoracolumbar segments)Sacrotuberous ligament/
Hamstrings
Gastrocnemius/
Achilles tendon
0.11
(−0.11, 0.35)
0.03
(−0.21, 0.28)
HFL–ADFHamstringsGastrocnemius/
Achilles tendon
0.42 ***
(0.23, 0.59)
0.29 *
(0.04, 0.49)
KEX–ADF0.44 ***
(0.20, 0.63)
0.19
(−0.08, 0.43)
Note: ROM = Range of motion; CI = Confidence intervals; CFL = Cervical Flexion; TFL = Trunk Flexion; HFL = Hip Flexion measured with knee extended; KEX = Knee Extension; ADF = Ankle Dorsiflexion. * p = 0.026, padj = 0.052; ** p = 0.009, padj = 0.009; *** p < 0.001, padj = 0.002.
Table 6. Pearson’s (r) correlation coefficients between active range of motion measurements of joints myofascially connected along the Front Functional Line (FFL), oriented from the ipsilateral right (R) to the contralateral left (L) side (R to L) and from the ipsilateral left to the contralateral right side (L to R).
Joint ROMMyofascial Structures Under Stretch During Active Joint ROM MeasurementsPearson r (95% CI)
Origin-Site StructuresLinking StructuresInsertion-Site StructuresR to LL to R
SER–TEXIL-Pectoralis major
(Lower edge)
IL-Rectus abdominis (Lateral sheath)0.35 **
(0.12, 0.55)
0.32 *
(0.10, 0.51)
SER–HERIL-Pectoralis major
(Lower edge)
Rectus abdominis
(Lateral sheath)
CL-Adductor longus0.44 ***
(0.16, 0.69)
0.29 *
(0.002, 0.52)
TEX–HERIL-Rectus abdominis
(Lateral sheath)
CL-Adductor longus0.49 ***
(0.29, 0.68)
0.51 ***
(0.32, 0.68)
Note: ROM = Range of motion; CI = Confidence intervals; SER = Shoulder External Rotation; TEX = Trunk Extension; HER = Hip External Rotation; IL = Ipsilateral; CL = Contralateral; * p = 0.027 (for r = 0.29) and p = 0.013, padj = 0.013 (for r = 0.32); ** p = 0.006, padj = 0.012; *** p < 0.001, padj < 0.002.
Table 7. Pearson’s (r) correlation coefficients between active range of motion (ROM) measurements of joints myofascially connected along the Back Functional Line (BFL), oriented from the ipsilateral right (R) to the contralateral left (L) side (R to L) and from the ipsilateral left to the contralateral right side (L to R).
Joint ROMMyofascial Structures Under Stretch During Active Joint ROM MeasurementsPearson r (95% CI)
Origin-Site StructuresLinking StructuresInsertion-Site StructuresR to LL to R
SER–HFLIL-Latissimus dorsiLumbosacral/
Sacral fascia
CL-Gluteus maximus0.07
(−0.20, 0.34)
0.02
(−0.22, 0.25)
SER–HIR0.27 *
(0.03, 0.48)
0.13
(−0.13, 0.35)
SER–KFLIL-Latissimus dorsiThoracolumbar/sacral fascia/Gluteus maximus CL-Vastus lateralis/
Subpatellar tendon
0.12
(−0.14, 0.38)
−0.01
(−0.22, 0.23)
HFL–KFLCL-Gluteus maximusCL-Vastus lateralis/
Subpatellar tendon
0.60 ***
(0.35, 0.75)
0.48 ***
(−0.20, 0.68)
HIR–KFL0.26 **
(−0.002, 0.50)
0.25
(0.01, 0.46)
Note: ROM = Range of motion; CI = Confidence intervals; SER = Shoulder External Rotation; HFL = Hip Flexion measured with knee flexed; HIR = Hip Internal Rotation; KFL = Knee Flexion; IL = Ipsilateral; CL = Contralateral; * p = 0.038, padj = 0.076; ** p = 0.049, padj = 0.076; *** p < 0.001, padj = 0.002.
Table 8. Table summarizing the specificity check for each myofascial line on the left and right sides.
Myofascial LineSideRandom > Within
(n/300)
Random < Within
(n/300)
Percentile of Observed p rand
SFLRight23466~22nd0.78
Left169132~44th0.56
SBLRight26337~12th0.88
Left25942~14th0.86
FFLRight0300>99th<0.01
Left2298>99th<0.01
BFLRight92208~69th0.31
Left20595~32nd0.68
Disclaimer/Publisher’s Note: The statements, opinions and data contained in all publications are solely those of the individual author(s) and contributor(s) and not of MDPI and/or the editor(s). MDPI and/or the editor(s) disclaim responsibility for any injury to people or property resulting from any ideas, methods, instructions or products referred to in the content.