Article

Intersegmental Coordination Patterns During Heel Rise: Effects of Knee Position and Movement Phases

1
Department of Rehabilitation, Asakura Sports Rehabilitation Clinic, Maebashi 371-0811, Gunma, Japan
2
Department of Physical Therapy, Faculty of Health Care, Takasaki University of Health and Welfare, Takasaki 370-0033, Gunma, Japan
3
Department of Rehabilitation, Kurosawa Hospital, Takasaki 370-1203, Gunma, Japan
*
Author to whom correspondence should be addressed.
Biomechanics 2025, 5(4), 87; https://doi.org/10.3390/biomechanics5040087
Submission received: 21 August 2025 / Revised: 13 October 2025 / Accepted: 24 October 2025 / Published: 3 November 2025

Abstract

Background/Objectives: This study aimed to provide preliminary normative data on intersegmental coordination patterns during heel rises at different knee joint positions and across various phases and periods. Methods: Twelve 21-year-old university students from the same cohort performed heel rises in knee-extended and knee-flexed conditions. Shank and foot kinematics were recorded using the VICON Oxford Foot Model, and intersegmental coordination was analyzed using a modified vector coding technique. Results: The results showed that coordination patterns varied significantly between the ascending and descending phases and across the early, middle, and late periods. In the early ascending phase, knee extension exhibited in-phase coordination (shank external rotation with hindfoot inversion), resembling propulsion-related coordination in gait, whereas knee flexion displayed greater anti-phase coordination between hindfoot plantar flexion and forefoot dorsiflexion. The middle and late periods demonstrated heel-rise-specific patterns, with coordination shifting from proximal to distal dominance. Knee flexion altered the coordination between the shank and hindfoot and between the hindfoot and forefoot in the sagittal plane compared to that during knee extension. Conclusions: These findings suggest that the knee position influences intersegmental coordination during heel rises, and the present results provide reference values that can enable future diagnostic validation and comparative studies in pathological populations.

1. Introduction

Heel rise is a versatile exercise used for both assessment and treatment during rehabilitation. It evaluates maximal muscle strength, muscular endurance, coordination, and balance and serves as a therapeutic exercise for shank and foot disorders [1,2,3,4]. Heel-rise exercises also enhance lower limb muscle function [1], improve standing balance [5], and increase gait speed [6]. Given their diverse benefits, heel rises are crucial in the clinical assessment and treatment of rehabilitation.
Appropriate adjustment of intersegmental coordination during heel rise provides foot rigidity, which is essential for efficient movements. This is facilitated by two main mechanisms: the midtarsal joint locking [7,8] and windlass mechanisms [9,10,11]. The midtarsal joint locking mechanism suggests that foot rigidity results from the relationship between the subtalar and midtarsal joints, which align their axes through subtalar inversion. Recent research has revealed that the transverse tarsal joint plays a central role in controlling the foot’s flexibility and rigidity, and that this function arises through coordinated multi-joint, multi-plane motion and muscle activity rather than a simple two-axis model [7,8]. In contrast, the windlass mechanism involves the extension of the metatarsophalangeal joint, which tightens the plantar fascia and elevates the medial longitudinal arch, thereby increasing the foot rigidity. Rotational movements of adjacent segments in different planes also affect heel-rise performance, with subtalar joint inversion linked to external shank rotation and eversion linked to internal rotation [12]. The mobility of the medial longitudinal arch increases when subtalar eversion and forefoot inversion are combined, leading to a decrease in the rigidity of the foot structure [13,14]. These dynamics are crucial because they contribute to overall foot rigidity.
Previous studies have focused on the maximum elevation of the heel during heel rise [15,16]. Heel raises are commonly employed in clinical practice; however, the changes occurring in intersegmental coordination across the early, middle, and late phases, or in relation to knee angles, have been scarcely investigated. Despite the frequent observation of phase-specific challenges and compensatory mechanisms in clinical settings, there is a lack of studies directly addressing these phenomena. This gap poses a limitation for conducting individualized assessments and rehabilitation. Moreover, the full range of motion, from slight dorsiflexion to plantarflexion, is essential for dynamic tasks, such as walking, running, and jumping [17,18,19]. The function of the tibialis posterior muscle is typically assessed by observing the calcaneus trajectory during heel rise, which reveals shifts from eversion at the initial posture to inversion at the peak. This detailed observation of movement helps in understanding the changes in foot kinematics and intersegmental coordination throughout the heel rise, relating these findings to dynamic tasks. The descending phase of the heel rise, such as the foot strike during running and shock absorption during jumping, is significant yet understudied. This phase involves the stretch–shortening cycle of the musculotendinous complex, which is important for energy storage and release and is crucial for maintaining the healthy condition of the tendon during rehabilitation [20,21].
Furthermore, in functional movements, heel rises are performed with different knee joint configurations that affect the exercise dynamics. For instance, knee flexion alters the foot configuration and influences the foot rigidity required for an effective heel rise. This affects the alignment of the joint surfaces and the medial longitudinal arch of the foot, highlighting the need to understand intersegmental coordination during heel rise at various knee angles. This study seeks to address the existing knowledge gaps by offering comprehensive insights into foot and ankle control during heel raises, categorized by phase and knee condition. Rather than proposing clinical applications, the present investigation provides baseline normative data that may serve as a reference for future diagnostic validation and for comparison with pathological populations. In this study, we used the Oxford Foot Model to define four segments of the lower limb and foot: the shank, hindfoot, forefoot, and hallux. This segmentation allowed us to evaluate the intersegmental coordination across the ascending and descending phases.
Therefore, this study aimed to characterize intersegmental coordination during heel rise at different phases (ascending and descending) and periods (early, middle, and late) and to evaluate the effect of knee joint configurations on this coordination in both extended and flexed knee conditions. We hypothesized that intersegmental coordination would vary, showing in-phase coordination with shank external rotation and hindfoot inversion, anti-phase coordination with hindfoot inversion and forefoot eversion, and in-phase coordination with hindfoot and forefoot plantar flexion during the elevation phase, with opposite effects during the descent phase. Additionally, knee flexion is expected to reduce gastrocnemius involvement and decrease the in-phase coordination between shank external rotation and hindfoot inversion, increasing forefoot dominance in the coordination pattern.

2. Materials and Methods

2.1. Participants

Seventeen undergraduate students were initially screened for eligibility. All were 21-year-old university students from the same cohort, recruited to minimize inter-individual variability. We excluded individuals with orthopedic conditions affecting daily activities in the past 6 months, neurological conditions impacting experimental tasks, and abnormal foot posture indicated by a Foot Posture Index (FPI) [22] score outside the range of 0–5. Ultimately, 12 participants (height: 166.3 ± 9.2 cm, body weight: 57.7 ± 9.3 kg; six males; FPI score: 4.1 ± 1.2; right-leg dominant: n = 11) were included in the analysis (Table 1). All participants were 21 years old. This study was approved by the Research Ethics Committee of Takasaki University of Health and Welfare (approval number: 2342). Regarding the sample size of the present study, we estimated it based on the effect size reported in a previous study [23] that compared intersegmental coordination between the shank and hindfoot in healthy and flatfoot groups. Using the G*Power software package (version 3.1.9.4, Kiel University), we calculated the required sample size for paired samples under the following conditions: effect size (ES) = 0.88, α error probability = 0.05, and power = 0.80. This calculation indicated that a minimum of 10 participants would be required.

2.2. Data Collection

Static foot posture was assessed by measuring the foot length from the posterior edge of the calcaneus to the anterior edge of the toes in a standing position and the truncated foot length from the calcaneus to the second metatarsal head [24]. The medial longitudinal arch height ratio was determined as the percentage of navicular height relative to the foot length [25].
Marker placement followed the Oxford Foot Model protocol [26] (see Supplementary Figure S1 for detailed marker locations). In addition, the shank, hindfoot, forefoot, and hallux were defined as independent segments, whereas toes 2–5 were not included as separate segments (see Supplementary Table S1, Figure S1 for details). The participants were barefoot and wore short knee-length leggings. Three-dimensional joint angles were calculated using a Cardan XYZ rotation sequence (plantarflexion/dorsiflexion, eversion/inversion, and abduction/adduction), with each distal segment expressed relative to its adjacent proximal segment. Based on previous studies [18,23], rearfoot abduction/adduction was expressed as shank internal/external rotation to accurately represent the axial shank rotation. From the resulting kinematic data, the following planes and segments were analyzed: shank rotation in the transverse plane, hindfoot in the sagittal and frontal planes, forefoot in the sagittal and frontal planes, and hallux in the sagittal plane. A 12-camera infrared system was used to record the marker positions at 100 Hz (VICON 2.2; Vicon Motion Systems Ltd., Oxford, UK). Bilateral heel rises were performed under two conditions: knees extended and flexed at a pace of one repetition per second for 10 repetitions, and the middle eight were analyzed. The knee flexion condition required maintenance of a knee angle of 30–45°.

2.3. Data Analysis

Marker data were filtered using a fourth-order Butterworth filter with a cut-off frequency of 6 Hz and segmented into ascending and descending phases based on the vertical position of the heel marker. Each phase was time-normalized and divided into early (0–33%), middle (34–66%), and la1te periods (67–100%) [23].
Heel-rise performance was analyzed using the maximum and normalized heel heights, with the latter adjusted for the truncated foot length [24]. We also calculated the pelvic displacement, and knee joint positional displacement in the vertical and anterior coordinates.
Kinematic analysis involved calculating the relative angles between segments: hindfoot inversion/eversion and plantar flexion/dorsiflexion relative to the shank, forefoot pronation/supination, plantar flexion/dorsiflexion relative to the hindfoot, and hallux flexion/extension relative to the forefoot.
Intersegmental coordination between the shank and hindfoot, and between the hindfoot and forefoot, was assessed using a modified vector coding technique [23,27]. Specifically, the coordination between the shank and hindfoot was evaluated using shank rotation in the transverse plane and hindfoot motion in the frontal plane. Coordination between the hindfoot and forefoot was evaluated separately in (1) the sagittal plane (hindfoot plantarflexion/dorsiflexion relative to forefoot plantarflexion/dorsiflexion) and (2) the frontal plane (hindfoot inversion/eversion relative to forefoot inversion/eversion). In accordance with the previous research [27], the coupling angle (γi) was determined by calculating the differences at each time point between the proximal (θP) and distal (θD) segment angles (θP(i + 1) − θP(i), θD(i + 1) − θD(i)). In the previous study [27], undefined or discontinuous cases arising from zero changes in either segment were handled using piecewise conditions. Similarly, in the present study, specific values (90°, −90°, −180°, or NaN) were assigned to ensure continuity of the coupling angle computation. The computed γi was normalized to a range of 0–360°, and coordination patterns were categorized into eight classifications at 45° intervals (in-phase/anti-phase and proximal/distal dominant), as detailed in Supplementary Table S2. To ensure reproducibility, a reference implementation in Python is provided in Supplementary Algorithm S1.
The proportion of each coordination pattern was calculated for each movement phase and period [20]. For each participant and knee condition, 101 time-normalized coupling angles (γi) were obtained across the 0–100% movement cycle. Ten trials were averaged into a single representative trial per participant using circular statistics (mean resultant vector approach) appropriate for angular data to ensure that the periodic nature of γi was maintained. The normalized time series was divided into three periods (early: 0–33%, middle: 34–66%, late: 67–100%), resulting in 34 data points for the early and late periods and 33 data points for the middle period per participant. According to the classification criteria detailed in Supplementary Table S2, each γi was assigned to one of eight coordination patterns. With 12 participants involved, this assignment produced a total of 408 data points per phase (396 during the middle phase). The percentage occurrence of each coordination pattern was then calculated from these data points. To simplify the presentation of the data in the heatmaps, percentages are used instead of absolute counts.
A comparative analysis was performed at the participant level, treating repeated trials as within-subject repeated measures rather than independent observations. Initial joint configurations were compared between the knee-extended (KE) and knee-flexed (KF) conditions using paired t-tests or Wilcoxon signed-rank tests. Significant differences were observed in knee and hindfoot angles, confirming that the knee flexion conditions were appropriately differentiated. However, due to the relatively large variability in knee flexion angles, subsequent comparisons of heel-rise performance and total joint displacement between KE and KF conditions were conducted using analysis of covariance (ANCOVA) with knee flexion angle as a covariate.
For total joint displacement and intersegmental coordination patterns, within-condition comparisons across movement periods (early, middle, and late) were analyzed using ANCOVA (for total joint displacement) or repeated-measures ANOVA/Friedman tests (for coordination patterns). Post hoc analyses were performed using paired t-tests or Wilcoxon signed-rank tests with Bonferroni correction, adjusting the significance level for the three pairwise comparisons among the periods (adjusted α = 0.05/3 = 0.0167). All analyses were performed using Python (version 3.11.5) and JupyterLab (version 3.6.3).

3. Results

3.1. Heel-Rise Performance

The initial joint configurations for the two heel-rise tasks are presented in Table 2. In these tasks, the knee flexion/extension angle and hindfoot plantar flexion/dorsiflexion angle were significantly greater in the knee-flexed condition than in the knee-extended condition (knee flexion/extension: 95% CI: −44.81, −26.79; p < 0.001, hindfoot plantar flexion/dorsiflexion: 95% CI: −11.65, −4.84; p < 0.001). Subsequently, an analysis of covariance (ANCOVA) was conducted to compare heel-rise performance between conditions while controlling for knee flexion angle as a covariate. After controlling for this covariate, no significant differences were found in the displacements of the pelvis, knee, or heel between the knee-extended and knee-flexed conditions (Table 3). The normalized heel height also showed no significant difference between conditions.
The results of the ANCOVA for the total joint displacement are summarized in Table 4. During the ascending phase, no significant differences were found between the knee-extended and knee-flexed conditions after controlling for knee flexion angle as a covariate. In the descending phase, however, a significant interaction was observed for hindfoot plantar flexion/dorsiflexion (F = 6.41, p = 0.032, partial η2 = 0.42, 95% CI [0.02, 0.96]), indicating that knee position influenced the behavior of the hindfoot during controlled lowering. No other segmental differences reached significance once the variability in knee angle was statistically adjusted. Within-condition multiple comparisons across movement periods (early, middle, late) revealed distinct phase-dependent patterns. Peak angle displacement generally occurred during the middle period (p < 0.0167), except for shank rotation during the descending period.

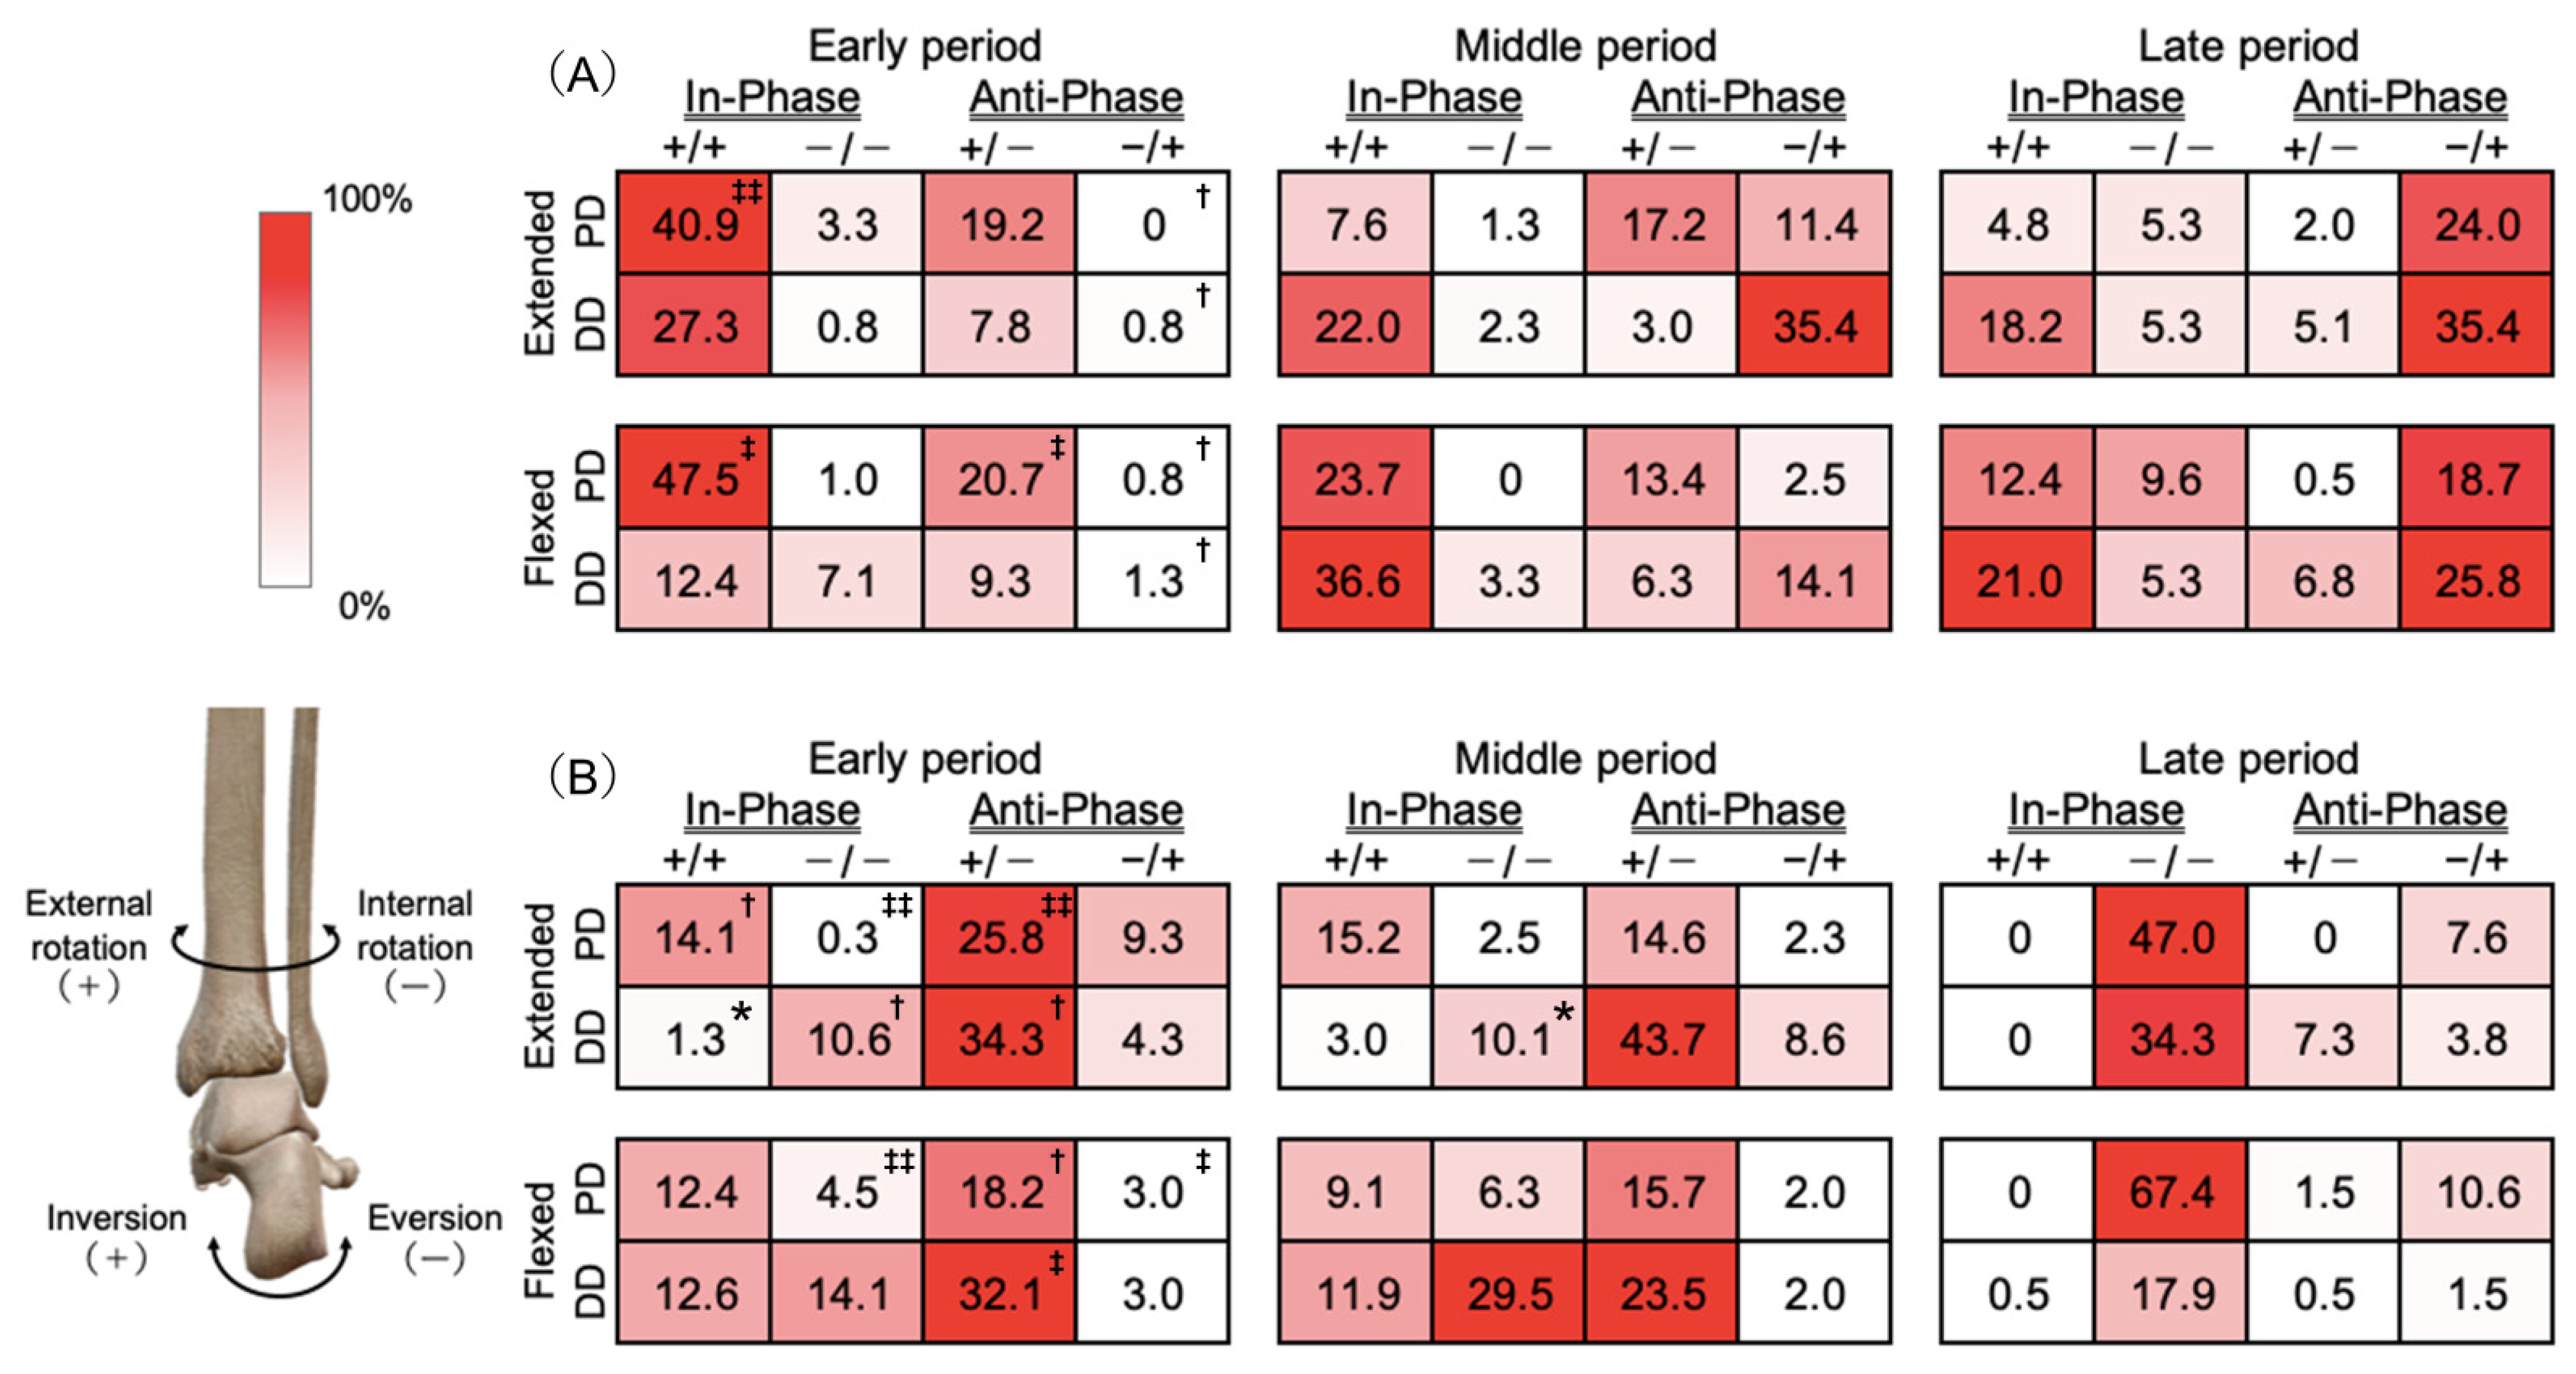
3.2. Intersegmental Coordination Between Shank Rotation in the Horizontal Plane and Hindfoot Rotation in the Frontal Plane (Figure 1)

3.2.1. Ascending Phase

There were no statistically significant differences between the conditions across any of the movement periods.
  • Early period
In-phase coordination (shank external rotation and hindfoot inversion) with proximal dominance was the dominant pattern observed in 40.9% of movements in the knee-flexed condition and 47.5% of movements in the knee-extended condition. These patterns were significantly more common in the early period than in the middle (p = 0.003) or late (p = 0.007) periods.
  • Middle period
The knee-extended condition predominantly exhibited anti-phase coordination (shank internal rotation and hindfoot inversion) with distal dominance, which occurred in 35.4% of the movements. In contrast, the knee-flexed condition showed a prevalence of in-phase coordination (shank external rotation and hindfoot inversion), with distal dominance observed in 36.6% of the movements. Anti-phase coordination in the knee-extended condition tended to occur more often in the middle period than in the early period (p = 0.018).
  • Late Period
Antiphase coordination (shank internal rotation and hindfoot inversion) with distal dominance was most common during this period in both conditions, observed in 25.8% and 35.4% of movements in the knee-flexed and extended conditions, respectively. These patterns showed a trend toward being more prevalent in the late period than in the early period under both extended (p = 0.017) and flexed (p = 0.029) knee conditions (trend-level).

3.2.2. Descending Phase

  • Early period
Antiphase coordination (shank external rotation and hindfoot eversion) with distal dominance was the most common pattern in both conditions, observed in 32.1% and 34.3% of movements in the knee-flexed and extended conditions, respectively. This pattern tended to occur more often in the early period than in the late period (knee extension, p = 0.021; knee flexion, p = 0.005). The proportion of in-phase coordination was significantly lower in the flexed-knee condition (1.3%) than that in the extended-knee condition (12.6%).
  • Middle period
The knee-extended condition predominantly showed anti-phase coordination (shank external rotation and hindfoot eversion), with distal dominance in 43.9% of the movements. Conversely, the knee-flexed condition primarily exhibited in-phase coordination (shank internal rotation and hindfoot eversion) with distal dominance. Anti-phase coordination tended to be more common in the middle period than in the late period in the knee-extended condition (p = 0.017). The proportion of in-phase coordination was significantly higher in the flexed-knee condition (29.5%) than that in the extended-knee condition (10.1%).
  • Late period
In-phase coordination (shank internal rotation and hindfoot eversion) with proximal dominance was the most prevalent, observed in 67.4% and 47.0% of movements in the knee-flexed and knee-extended conditions, respectively. This pattern was significantly more frequent in the late period than in the early (knee extended, p = 0.003; knee flexed, p < 0.001) and middle (knee extended, p = 0.001; knee flexed, p < 0.001) periods.
Figure 1. Intersegmental coordination between the shank and hindfoot during the ascending (A) and descending (B) phases. The heatmap displays the proportions of the eight coordination patterns calculated using the Modified Vector Coding Technique for the early, middle, and late periods. Lighter shades represent lower proportions, and darker red shades indicate higher proportions. The +/– notation indicates the rotation direction of the proximal (first sign) and distal (second sign) segments (e.g., shank vs. hindfoot: + = external rotation or inversion; – = internal rotation or eversion). The eight boxes within each group sum to 100% for each condition and phase. Each percentage represents the relative frequency of a coordination pattern calculated across all observations from 12 participants (408 data points per phase, 396 for the middle phase). Because each participant contributed multiple data points per period, percentages reflect the proportion of occurrences among all observations rather than the number of participants. Extended and Flexed on the y-axis correspond to the knee extended and knee flexed conditions, respectively. Comparisons between conditions were made using paired t-tests or Wilcoxon signed-rank tests, with significant differences indicated by an asterisk (*: p < 0.05). Time-related comparisons were analyzed using ANOVA or Friedman tests, with post hoc results detailed in the main text. Significant comparisons are marked with † for p < 0.05, ‡ for p < 0.01, and ‡‡ for p < 0.001. Abbreviations: PD, proximal dominance; DD, distal dominance.
Biomechanics 05 00087 g001

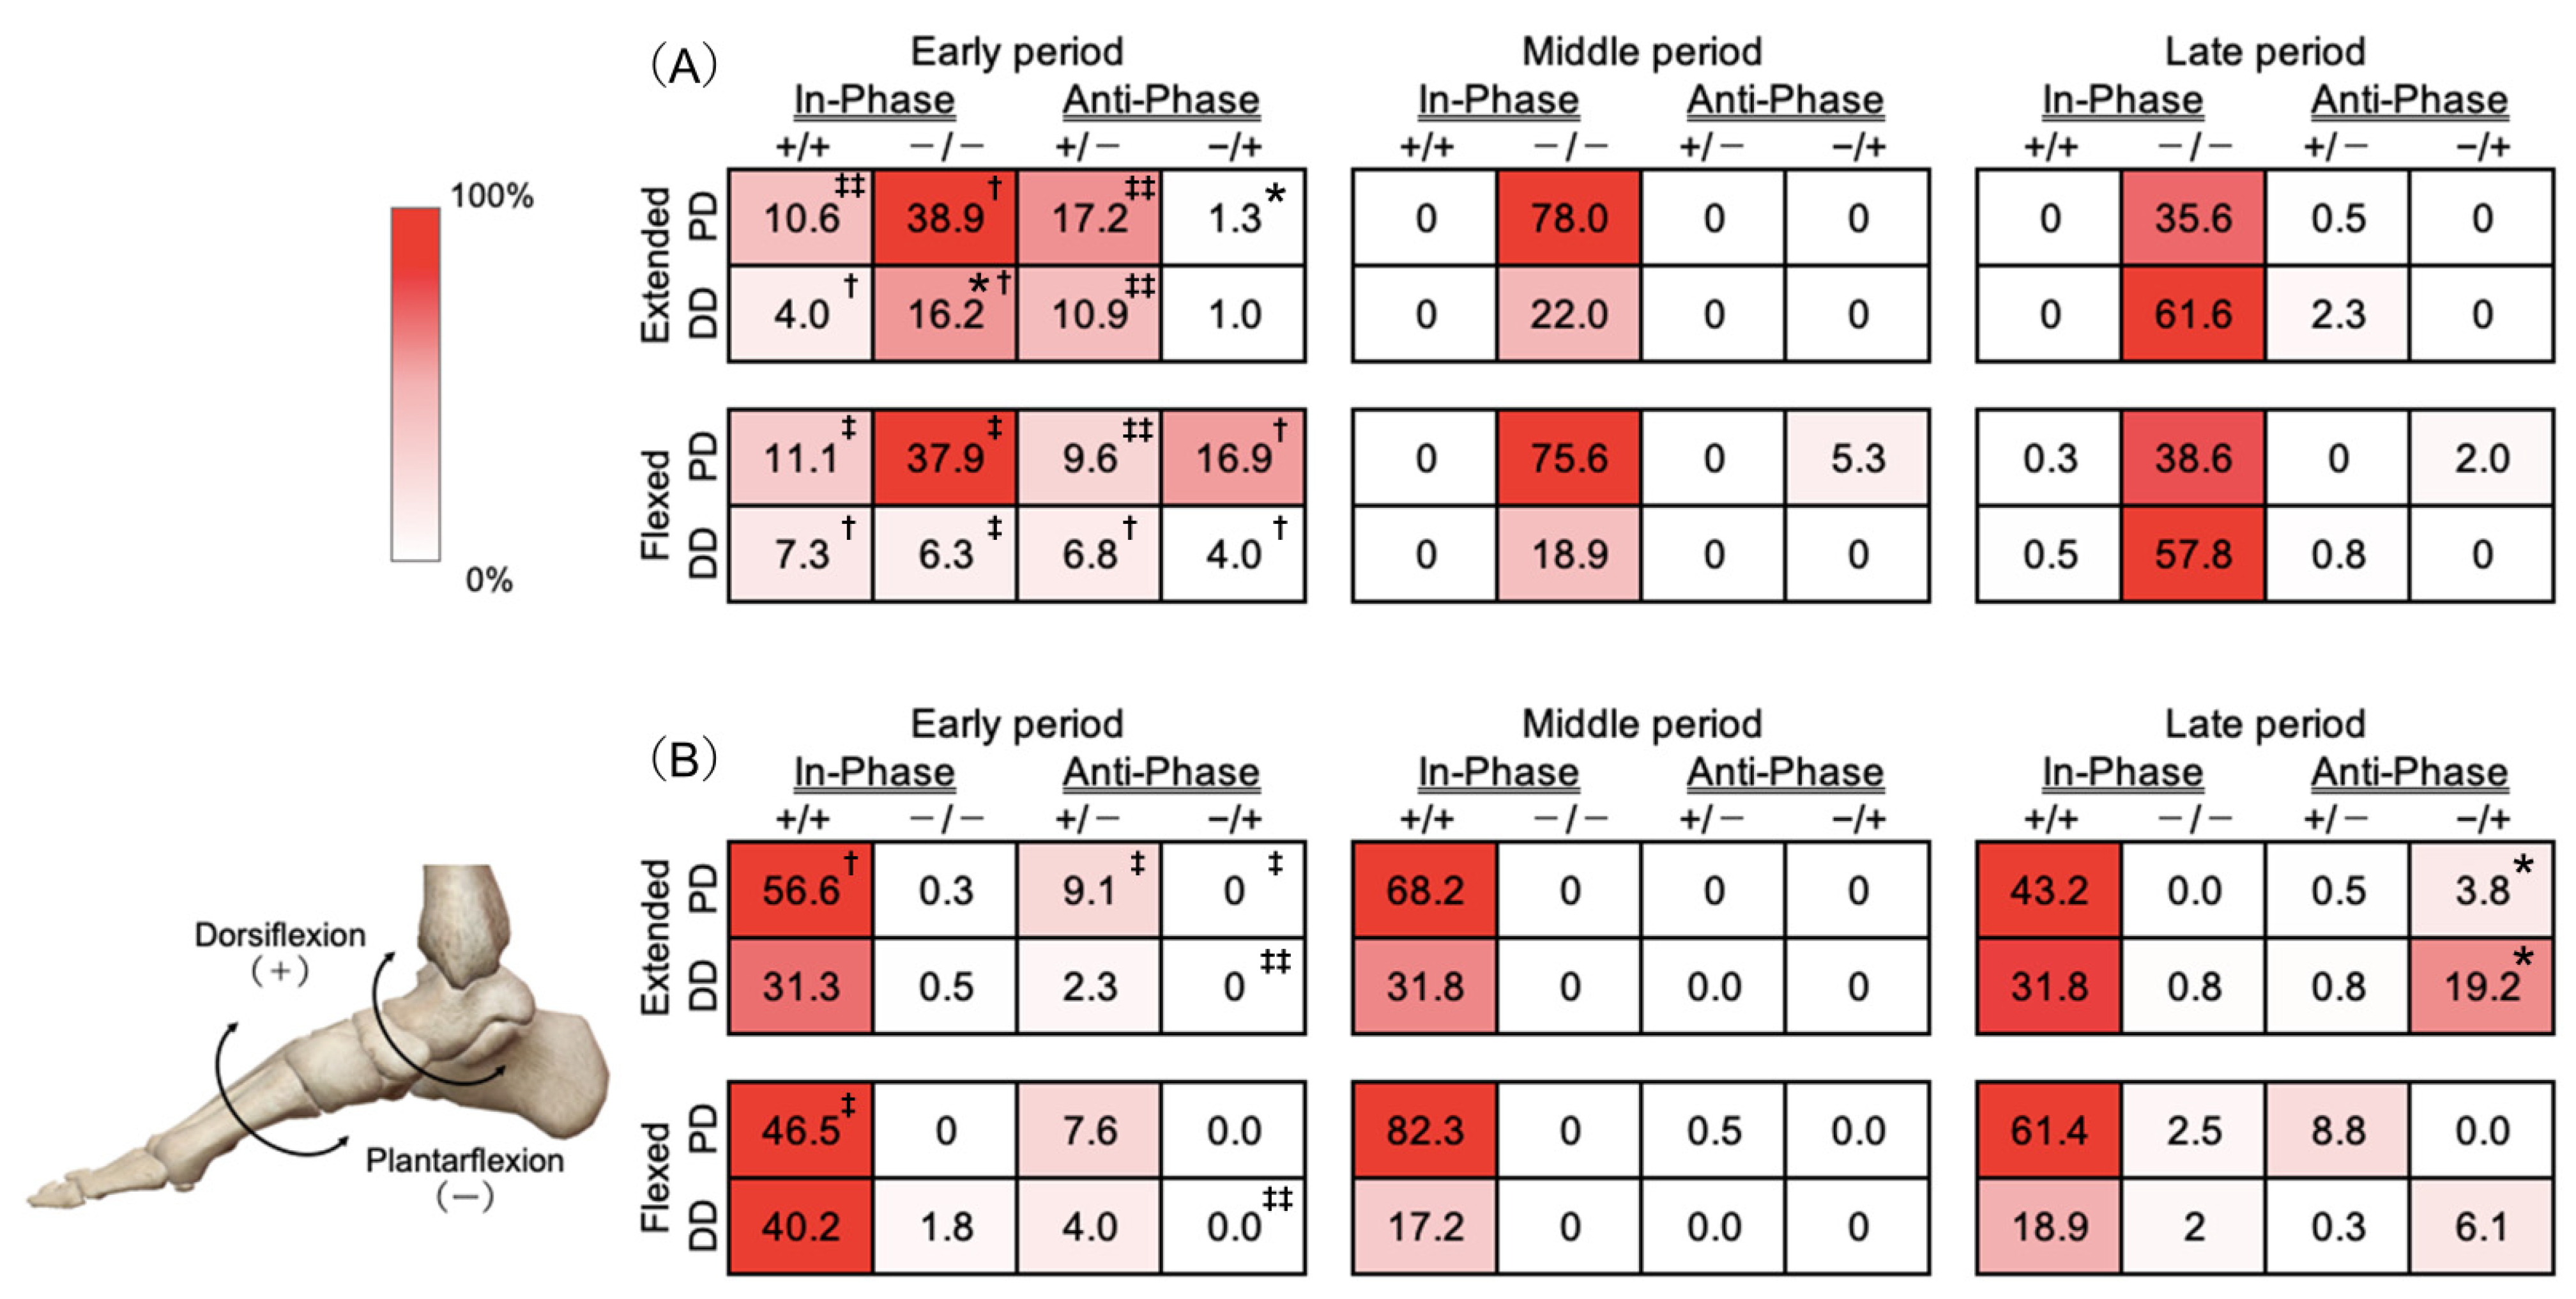
3.3. Intersegmental Coordination Between Hindfoot and Forefoot in the Sagittal Plane (Figure 2)

3.3.1. Ascending Phase

  • Early period
The most common intersegmental coordination pattern during the early period of the ascending phase was in-phase coordination (plantar flexion of the hindfoot and forefoot) with proximal dominance, observed in 37.9% and 38.9% of movements in the knee flexion and extension conditions, respectively. The proportion of anti-phase coordination (hindfoot plantar flexion and forefoot dorsiflexion) with proximal dominance was significantly greater in the knee-flexed condition (16.9%) than that in the knee-extended condition (1.3%).
  • Middle period
The most common intersegmental coordination pattern during the middle period of the ascending phase was in-phase coordination (plantar flexion of the hindfoot and forefoot) with proximal dominance, as observed in 75.8% and 78.0% of the movements in the knee-flexed and knee-extended conditions, respectively. This intersegmental coordination pattern was significantly more frequent in the middle period than in the early period under the knee-extended condition (p = 0.009), while a similar trend was observed in the knee-flexed condition (p = 0.052). Compared with the late period, the middle period also showed a trend toward higher occurrence in both conditions (p = 0.023 for knee extension; p = 0.021 for knee flexion).
  • Late period
The most common intersegmental coordination pattern during the late period of the ascending phase was in-phase coordination (plantar flexion of the hindfoot and forefoot) with distal dominance, as observed in 57.8% and 61.6% of the movements in the knee-flexed and knee-extended conditions, respectively. This intersegmental coordination pattern was observed significantly more often in the late period than in the early (knee extended, p = 0.002; knee flexed, p = 0.007) or middle (knee extended, p = 0.023; knee flexed, p = 0.008) periods.

3.3.2. Descending Phase

Both experimental conditions predominantly exhibited in-phase coordination (dorsiflexion of the hindfoot and forefoot) with proximal dominance during all the movement periods. This intersegmental coordination pattern was significantly more frequent in the middle period than in the early period under the knee-flexed condition (p = 0.008), whereas no significant difference was found under the knee-extended condition (p = 0.110). Compared with the late period, the middle period showed a trend toward higher occurrence in both conditions (p = 0.021 for knee extension; p = 0.042 for knee flexion). The proportion of the anti-phase (plantar flexion of the hindfoot and dorsiflexion of the forefoot) with proximal dominance was significantly lower in the knee-flexed condition (6.1%) than that in the knee-extended condition (19.2%).

3.4. Intersegmental Coordination Between Hindfoot and Forefoot in the Frontal Plane

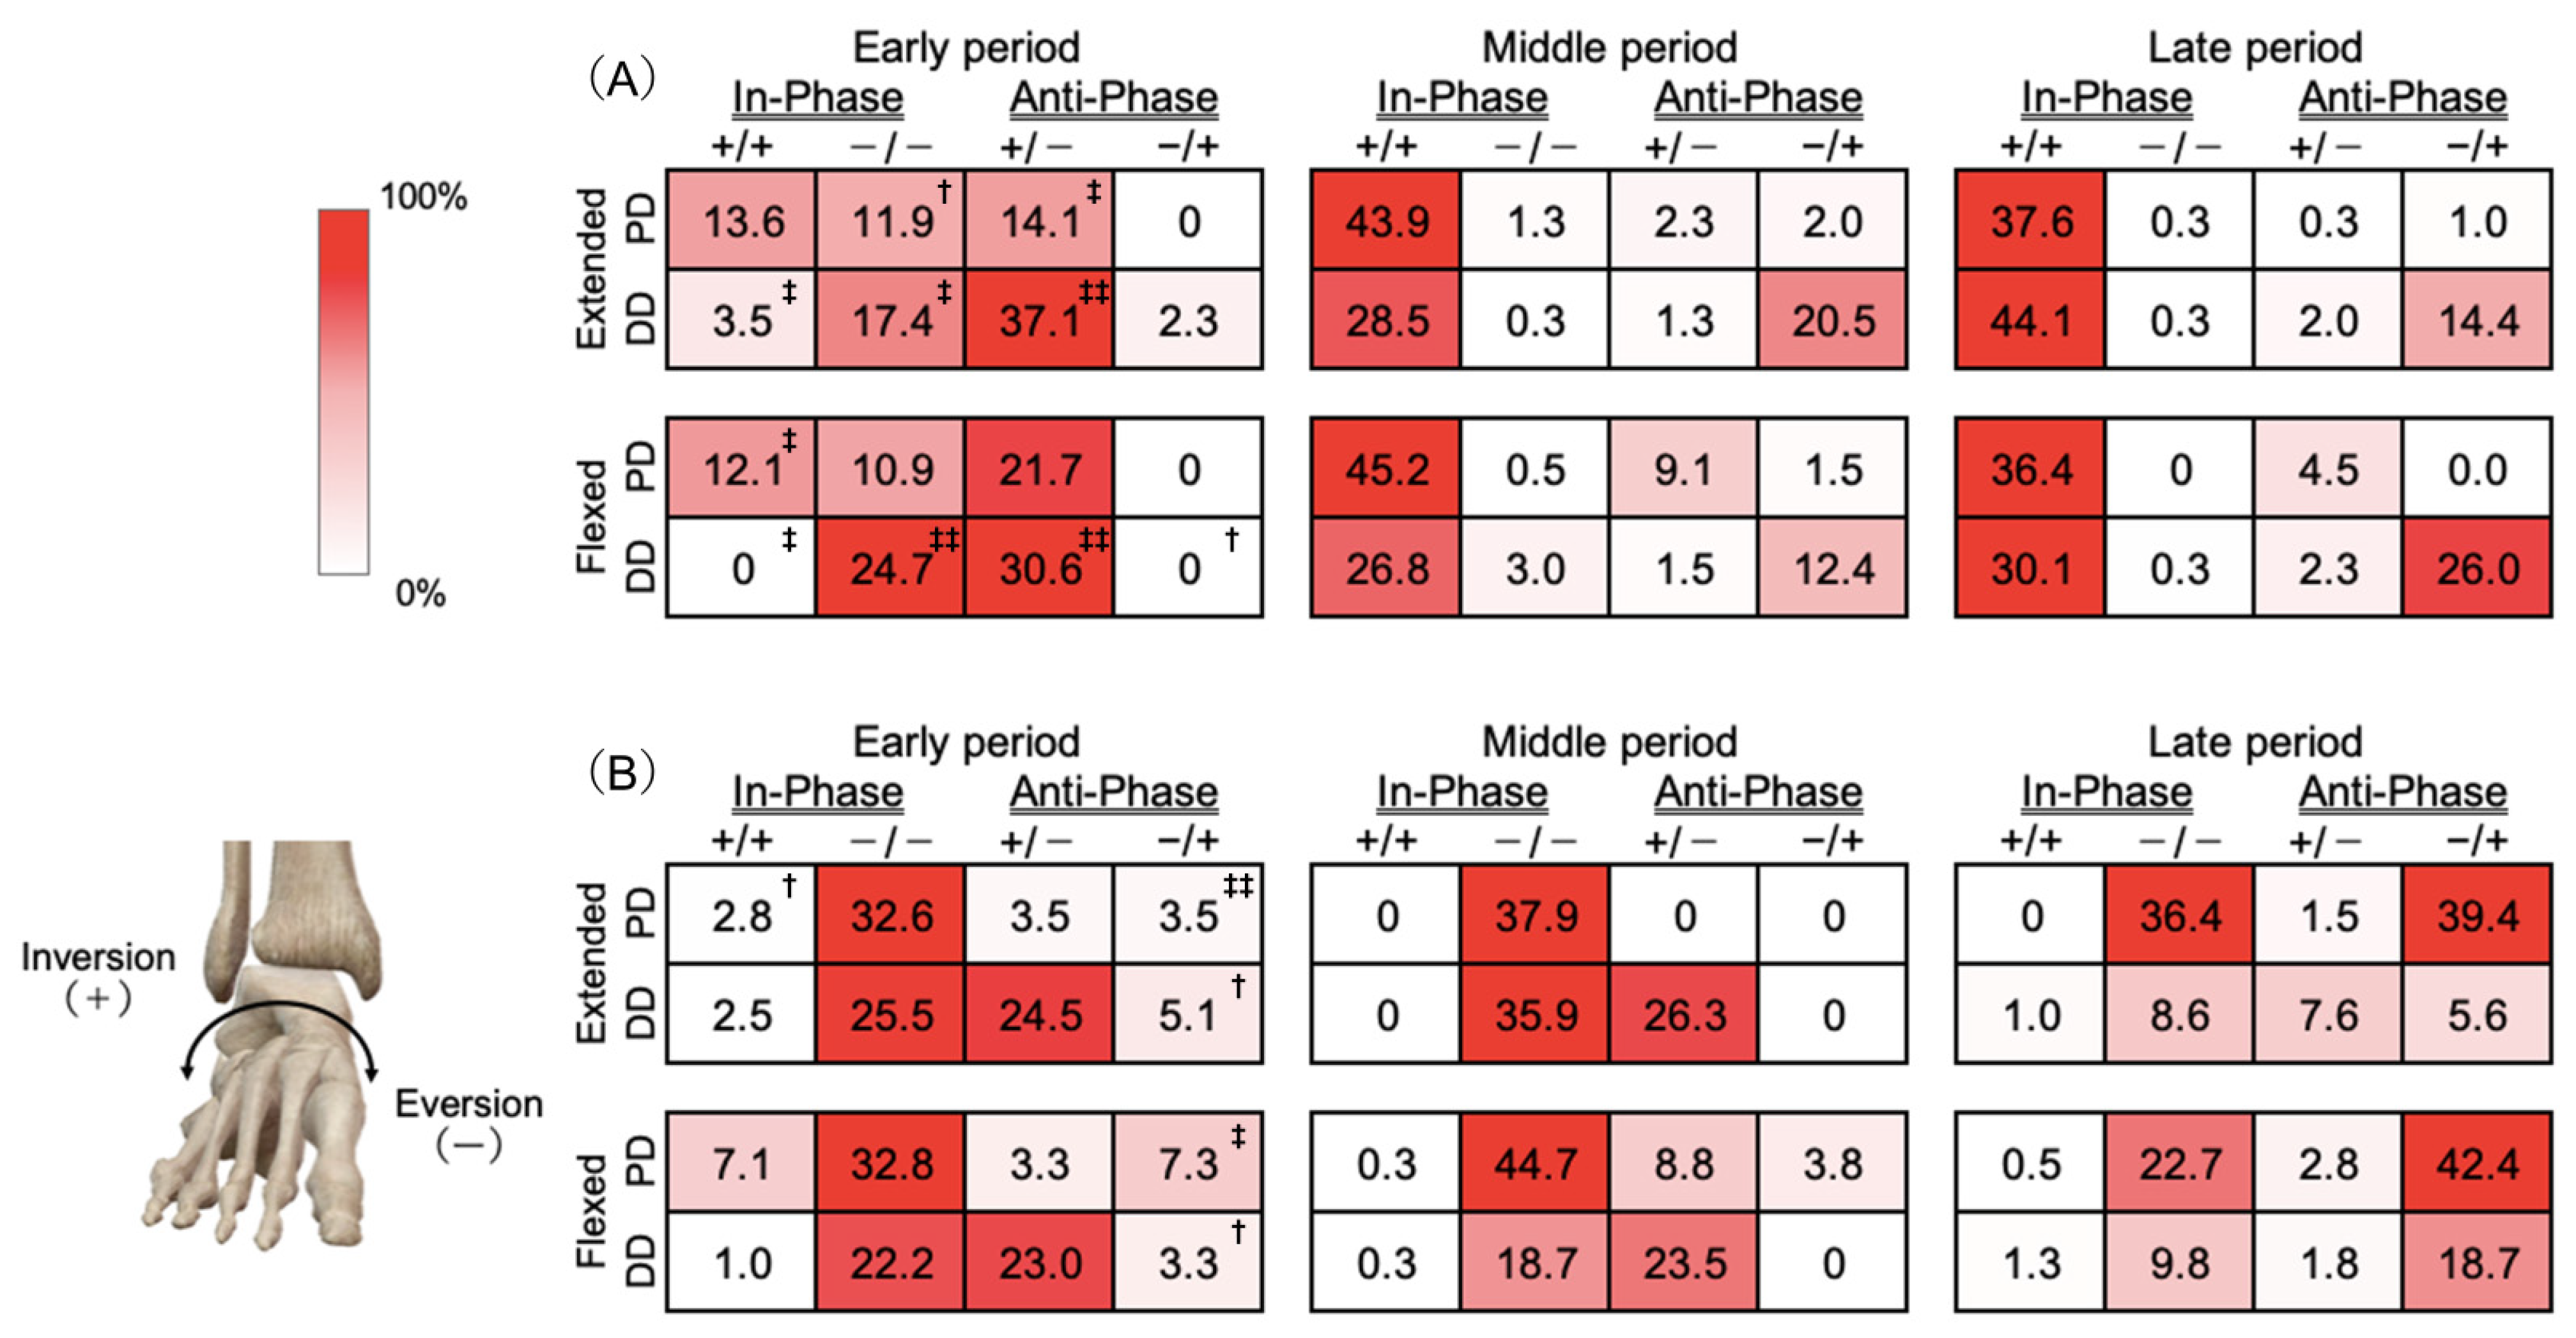
No significant differences were observed between the two conditions across all the movement periods during the ascending and descending phases (Figure 3).

3.4.1. Ascending Phase

  • Early period
The most common intersegmental coordination pattern during the early ascending phase was anti-phase coordination, involving hindfoot inversion and forefoot eversion with distal dominance. This pattern was observed in 30.6% of the movements in the flexed knee and 37.1% of the movements in the extended knee condition. This occurred significantly more often in the early period than in the middle (knee extended, p = 0.005; knee flexed, p = 0.006) or late (knee extended, p = 0.005; knee flexed, p = 0.005) periods.
  • Middle period
In the middle of the ascending phase, the predominant intersegmental coordination pattern was in-phase, characterized by hindfoot inversion and forefoot eversion with proximal dominance. This pattern was observed in 45.2% of the movements in the flexed knee condition and 43.9% of the movements in the extended knee condition. In the flexed knee condition, this pattern was significantly more prevalent in the middle period than in the early period (p = 0.006).
Figure 2. Intersegmental coordination between the hindfoot and forefoot in the sagittal plane during the ascending (A) and descending (B) phases. The heatmap displays the proportions of eight coordination patterns calculated using the Modified Vector Coding Technique for early, middle, and late periods. Lighter shades represent lower proportions, and darker red shades indicate higher proportions. The +/– notation indicates the rotation direction of the proximal (first sign) and distal (second sign) segments (e.g., hindfoot vs. forefoot: + = dorsiflexion; − = plantarflexion). The eight boxes within each group sum to 100% for each condition and phase. Each percentage represents the relative frequency of a coordination pattern calculated across all observations from 12 participants (408 data points per phase, 396 for the middle phase). Because each participant contributed multiple data points per period, percentages reflect the proportion of occurrences among all observations rather than the number of participants. Extended and Flexed on the y-axis correspond to the knee extended and knee flexed conditions, respectively. Comparisons between conditions were conducted using paired t-tests or Wilcoxon signed-rank tests, with significant differences indicated by an asterisk (*: p < 0.05). Time-related comparisons were analyzed using ANOVA or Friedman tests, with post hoc results detailed in the main text. Significant comparisons are marked with † for p < 0.05, ‡ for p < 0.01, and ‡‡ for p < 0.001. Abbreviations: PD, proximal dominance; DD, distal dominance.
Biomechanics 05 00087 g002
Figure 3. Intersegmental coordination between the hindfoot and forefoot in the frontal plane during the ascending (A) and descending (B) phases. The heatmap displays the proportions of eight coordination patterns calculated using the Modified Vector Coding Technique for early, middle, and late periods. Lighter shades represent lower proportions, and darker red shades indicate higher proportions. The +/– notation indicates the rotation direction of the proximal (first sign) and distal (second sign) segments (e.g., hindfoot vs. forefoot: + = inversion; − = eversion). The eight boxes within each grouping sum to 100% for each condition and phase. Each percentage represents the relative frequency of a coordination pattern calculated across all observations from 12 participants (408 data points per phase, 396 for the middle phase). Because each participant contributed multiple data points per period, percentages reflect the proportion of occurrences among all observations rather than the number of participants. Extended and Flexed on the y-axis correspond to the knee extended condition and knee flexed condition, respectively. Comparisons between conditions were conducted using paired t-tests or Wilcoxon signed-rank tests, with significant differences indicated by an asterisk (*): p < 0.05. Time-related comparisons were analyzed using ANOVA or Friedman tests, with post hoc results detailed in the main text. Significant comparisons are marked with † for p < 0.05, ‡ for p < 0.01, and ‡‡ for p < 0.001. Abbreviations: PD, proximal dominance; DD, distal dominance.
Biomechanics 05 00087 g003
  • Late period
During the late period of the ascending phase, the most common intersegmental coordination pattern was in-phase coordination involving inversion of both the hindfoot and forefoot, with proximal dominance observed in 36.4% of movements in the knee-flexed condition. The knee-extended condition predominantly exhibited in-phase coordination with distal dominance, which occurred in 44.2% of the movements. In the extended knee condition, this pattern was significantly more frequent in the late period than in the early period (p = 0.012).

3.4.2. Descending Phase

  • Early and middle periods
The dominant intersegmental coordination pattern during both the early and middle periods of the descending phase was in-phase coordination, involving the inversion of both the hindfoot and forefoot with proximal dominance. This pattern was consistent in both phases, occurring in 32.8% of movements in the knee-flexed condition and 32.6% in the knee-extended condition during the early phase and 44.7% in the knee-flexed condition and 37.9% in the knee-extended condition during the middle phase. No specific differences were observed between the periods.
  • Late period
The most common intersegmental coordination pattern during the late descending phase was anti-phase coordination, featuring hindfoot eversion and forefoot inversion with proximal dominance. This pattern was observed in 42.4% of the movements in the flexed knee condition and 39.4% in the knee-extended condition. These patterns were significantly more prevalent in the early (knee extended, p = 0.005; knee flexed, p = 0.016) and middle periods (knee extended, p = 0.005; knee flexed, p = 0.008).

4. Discussion

We aimed to elucidate the intersegmental coordination patterns during heel-rise movement across various phases and periods and examine how these patterns are influenced by knee joint configurations. Our findings confirmed significant variations in coordination between the ascending and descending phases, as well as distinct differences across the early, middle, and late periods, highlighting the complex biomechanical interactions that occur during heel rise, particularly for different knee configurations.
During heel rise, a combination of hindfoot plantar flexion and inversion, forefoot plantar flexion and eversion, and hallux extension occurs during ascending, whereas the movements are reversed during descending [24]. Our results demonstrated that intersegmental coordination patterns differed significantly between the movement phases (ascending vs. descending) and periods (early, middle, and late) of the task. Additionally, when the heel rise was performed with the knee flexed, the intersegmental coordination between the shank and hindfoot, as well as between the hindfoot and forefoot in the sagittal plane, differed from that in the knee-extended condition. However, the coordination patterns between the hindfoot and forefoot in the frontal plane remained consistent under both conditions. Our results also showed that intersegmental coordination patterns varied considerably, even in young individuals with normal feet.
The heel-rise performance in our study was comparable to that in a previous study [24], as evidenced by the similar normalized heel heights (54.5 ± 9.2% in our study vs. 59.3 ± 8.2% in the previous study). To the best of our knowledge, this is the first study to explore foot kinematics across different movement phases.

4.1. Effect of Movement Phase and Periods on Intersegmental Coordination

Intersegmental coordination varied substantially across the movement phases and periods. The coordination between the shank and hindfoot shifted from in-phase coordination (external rotation of the shank and inversion of the hindfoot) with proximal dominance to anti-phase coordination (internal rotation of the shank and inversion of the hindfoot) with distal dominance during the ascending phase and vice versa during the descending phase. Hindfoot inversion under weight-loaded conditions results in in-phase coordination, in which external rotation of the shank and thigh and posterior tilt of the pelvis occur [12]. This pattern is also observed during gait and running, where hindfoot eversion and shank internal rotation occur in the early stance phase for shock absorption, whereas hindfoot inversion and shank external rotation occur in the late stance phase to generate a propulsive force [17,18,19,28]. These coordination patterns are influenced by the movement speed [29].
During heel rise, the coordination between the shank and hindfoot in the middle and late phases differed from that observed during gait and running. This is likely due to the need for maximum plantar flexion while maintaining a neutral foot position in the frontal plane during the tasks. Achieving maximum plantar flexion with a neutral foot position in the frontal plane requires internal rotation of the shank and eversion of the Lisfranc joint. Our study demonstrated that while early phase coordination during heel rise resembled that of gait and running, it differed after the middle phase. Additionally, hindfoot inversion was maintained throughout all movement phases, suggesting that the midtarsal joint locking mechanism is crucial for effective knee-extended heel-rise movements.
The coordination between the hindfoot and forefoot in the sagittal plane exhibited in-phase coordination, with plantar flexion during the ascending phase and dorsiflexion during the descending phase. Although this pattern remained consistent across the movement periods, dominance shifted from proximal in the early and middle periods to distal during the late period. This shift may have resulted from passive (Windlass mechanism) or active (or dynamic support) mechanisms. The Windlass mechanism elevates the medial longitudinal arch through plantar fascia stretch during metatarsophalangeal joint extension in the late phase, whereas the dynamic support mechanism involves increased forefoot muscle activity, such as in the intrinsic foot, peroneus, and flexor digitorum longus muscles. The dynamic support mechanism contributes more to foot rigidity than the windlass mechanism [9,10,11]; however, further electromyographic studies are required to confirm this point.

4.2. Effect of Knee Joint Configurations on Intersegmental Coordination

In the knee-flexed condition, in-phase coordination between the shank and hindfoot (shank external rotation and hindfoot inversion) with distal dominance occurred significantly more often than in the knee-extended condition (knee-flexed condition: 12.6% vs. knee-extended condition: 1.3%) in the early descending period. During the middle period of the descending phase, in-phase coordination (shank internal rotation and hindfoot eversion) with distal dominance occurred significantly more often in the flexed knees (29.5%) than in the extended knees (10.1%). In the knee-extended condition, the predominant coordination pattern was anti-phase coordination (shank external rotation and hindfoot eversion) with distal dominance (43.7%), demonstrating a clear difference between the two knee conditions. Compared with knee extension, knee flexion may decrease gastrocnemius muscle activity, whereas soleus muscle activity may increase [3], where the gastrocnemius and soleus muscles contribute to hindfoot eversion and inversion, respectively [30]. In addition to the differences in the primary plantar flexor muscles involved in the heel rise, knee flexion decreases hindfoot inversion, leading to reduced foot rigidity. This reduction in foot rigidity may necessitate a greater contribution from active (or dynamic support) mechanisms to stiffen the medial longitudinal arch, which involve the active engagement of intrinsic and extrinsic foot muscles, including the posterior tibial, anterior tibial, flexor digitorum longus, flexor hallucis longus, and peroneus longus. This mechanism contrasts with the passive Windlass mechanism and has been reported to contribute substantially to foot rigidity during functional tasks [9,10,11]. The large variability in the intersegmental coordination pattern during knee-flexed heel rise observed in our study may be partly explained by the variable ability to increase the contribution of the dynamic support mechanism in healthy adults during this task. However, because we did not directly measure electromyographic activity, these interpretations remain speculative and should be verified in future studies. Taken together, these findings partly support and partly contradict our initial hypotheses. As hypothesized, coordination patterns were reversed between the ascending and descending phases, and phase-specific differences in coordination were detected, reinforcing the clinical relevance discussed in the Introduction. However, contrary to our hypothesis, both knee conditions showed a high prevalence of in-phase coordination between shank external rotation and hindfoot inversion in the early phase, transitioning to an anti-phase coordination (shank internal rotation and hindfoot inversion with distal dominance) in the middle and late phases. Similarly, our hypothesis of increased forefoot dominance during knee flexion was not supported in this study. However, knee flexion demonstrated a distinct early-phase pattern characterized by hindfoot plantarflexion and forefoot dorsiflexion with proximal dominance, indicating a potential modification of the medial longitudinal arch.

4.3. Limitations

This study has several limitations. First, we did not investigate sex differences in foot kinematics, while acquired flatfoot deformity is reported to be more prevalent in females. Although previous studies have shown no sex-specific differences in muscle activity during heel rise [31,32], and many studies on heel rise employ a mixed-sex design, future studies should clarify the influence of sex on foot kinematics during heel rise because of the scarcity of research on this topic. Second, our study did not analyze midfoot kinematics, although the midfoot is important for power transmission to the ground [11,33]. Future studies should include a multi-segment foot model that encompasses the midfoot to enhance the understanding of the findings of this study. Third, we characterized foot kinematics using only a motion capture system. We also did not record electromyographic activity or plantar pressure data, which could provide complementary information on foot rigidity and dynamic support mechanisms. Future studies should combine kinematic, EMG, and plantar pressure data to evaluate the heel-rise movement more comprehensively. Fourth, although the participants were instructed to maintain 30–45° knee flexion in the flexed-knee condition, some inter-individual variability in knee control may have occurred. Future studies should ensure stricter knee angle control to validate and extend the present findings. Fifth, we only included healthy young adults with normal feet, as verified by the FPI; however, the influence of foot abnormalities on foot kinematics during different movement periods and phases at varying knee joint angles remains unclear. Therefore, further studies involving individuals with different pathological conditions are needed. Finally, we only included healthy young adults with normal feet, as verified by the FPI; however, all participants were 21-year-old university students from a single cohort, which limits the generalizability of the results. Nevertheless, the bilateral heel-rise task is a simple and low-skill movement that can be safely performed across a wide range of ages and physical conditions. Therefore, while quantitative measures (e.g., heel rise performance or total joint displacement) may vary with age, BMI, or training level, the qualitative coordination characteristics identified in this study are likely consistent across healthy populations. Moreover, because the present study included only healthy participants, the diagnostic applicability of the proposed indices remains unverified. Future research should validate these indices in clinical populations with foot or ankle pathologies to determine their diagnostic and rehabilitative utility. Moreover, a post hoc power analysis was conducted using G*Power 3.1 based on the observed effect sizes (partial η2). The achieved statistical power for the largest effect (hindfoot sagittal displacement during the descending phase, partial η2 = 0.42) was 0.745, indicating that the study had fair sensitivity to detect large effects. However, some other comparisons likely exhibited power below 0.70, suggesting that smaller or more subtle effects might not have been detected. Therefore, future studies with larger and more heterogeneous samples are warranted to increase statistical power and confirm the robustness of these findings. Collectively, this study should be interpreted as providing preliminary normative data, which can serve as a reference for future diagnostic validation.

4.4. Clinical Implications

This study revealed different intersegmental coordination patterns during bilateral heel rise across movement phases, transitions between ascending and descending movements, and varying knee angle conditions. During the initial period of movement, the intersegmental coordination pattern between the shank and hindfoot closely resembled the propulsive phase of walking and running, whereas later periods exhibited patterns specific to the heel rise. During the initial period, the intersegmental coordination between the shank and hindfoot, as well as between the hindfoot and forefoot, exhibited proximal dominance, which transitioned to distal dominance from the mid-to late periods of movement. The present study revealed distinct intersegmental coordination patterns during bilateral heel rise across movement phases and knee angle conditions, providing baseline normative data on coordination strategies in healthy adults. Although the present results do not directly imply clinical applicability, they provide a reference framework for future diagnostic validation and for comparisons with individuals exhibiting foot or ankle dysfunctions. Future research should determine whether these coordination indices can discriminate between healthy and pathological movement patterns and assess their diagnostic performance (e.g., sensitivity, specificity, ROC analysis).

5. Conclusions

This study revealed distinct intersegmental coordination patterns during heel rise with knee extension and flexion, suggesting that the knee position influences the coordination patterns. These findings provide preliminary normative data that may serve as a reference for future studies aiming to validate diagnostic or rehabilitative applications for foot and ankle disorders.

Supplementary Materials

The following supporting information can be downloaded at: https://www.mdpi.com/article/10.3390/biomechanics5040087/s1, Table S1: Marker location of the Oxford Foot Model used in this study; Table S2: Classification of Coupling Angles; Figure S1: Visualization of the marker locations of the Oxford Foot Model; Algorithm S1: Modified Vector Coding Procedure with Circular-Mean γ and 8-Category Classification

Author Contributions

Conceptualization, Y.A. and Y.T.; methodology, Y.A. and Y.T.; software, Y.A. and T.I.; validation, Y.A. and Y.T.; formal analysis, Y.A.; investigation, Y.A., A.T., and Y.T.; resources, Y.T.; data curation, Y.A.; writing—original draft preparation, Y.A. and Y.T.; writing—review and editing, Y.A., A.T., T.I. and Y.T.; visualization, Y.A.; supervision, Y.T.; project administration, Y.T. All authors have read and agreed to the published version of the manuscript.

Funding

This research received no external funding.

Institutional Review Board Statement

The study was conducted in accordance with the Declaration of Helsinki, and approved by the Institutional Ethics Committee of Takasaki University of Health and Welfare (approval number: 2342; date of approval: 3 October 2023).

Informed Consent Statement

Informed consent was obtained from all subjects involved in the study.

Data Availability Statement

The data will be made available upon request.

Acknowledgments

We thank all the participants who volunteered for this study.

Conflicts of Interest

The authors declare no conflicts of interest.

Abbreviations

The following abbreviations are used in this manuscript:
CIConfidence Interval
ANOVAAnalysis of Variance
DDDistal Dominance
PDProximal Dominance
FPIFoot Posture Index

References

  1. Alfredson, H.; Pietilä, T.; Jonsson, P.; Lorentzon, R. Heavy-load eccentric calf muscle training for the treatment of chronic Achilles tendinosis. Am. J. Sports Med. 1998, 26, 360–366. [Google Scholar] [CrossRef]
  2. Flanagan, S.P.; Song, J.-E.; Wang, M.-Y.; Greendale, G.A.; Azen, S.P.; Salem, G.J. Biomechanics of the heel-raise exercise. J. Aging Phys. Act. 2005, 13, 160–171. [Google Scholar] [CrossRef] [PubMed]
  3. Hébert-Losier, K.; Schneiders, A.G.; García, J.A.; Sullivan, S.J.; Simoneau, G.G. Influence of knee flexion angle and age on triceps surae muscle activity during heel raises. J. Strength Cond. Res. 2012, 26, 3124–3133. [Google Scholar] [CrossRef] [PubMed]
  4. Madeley, L.T.; Munteanu, S.E.; Bonanno, D.R. Endurance of the ankle joint plantar flexor muscles in athletes with medial tibial stress syndrome: A case-control study. J. Sci. Med. Sport 2007, 10, 356–362. [Google Scholar] [CrossRef]
  5. Richardson, J.K.; Sandman, D.; Vela, S. A focused exercise regimen improves clinical measures of balance in patients with peripheral neuropathy. Arch. Phys. Med. Rehabil. 2001, 82, 205–209. [Google Scholar] [CrossRef]
  6. Lee, S.M.; Cynn, H.S.; Yoon, T.L.; Lee, J.H. Effects of different heel-raise-lower exercise interventions on the strength of plantarflexion, balance, and gait parameters in stroke survivors. Physiother. Theory Pract. 2017, 33, 706–715. [Google Scholar] [CrossRef]
  7. Phan, C.B.; Shin, G.; Lee, K.M.; Koo, S. Skeletal kinematics of the midtarsal joint during walking: Midtarsal joint locking revisited. J. Biomech. 2019, 95, 109287. [Google Scholar] [CrossRef]
  8. Wang, C.; Geng, X.; Wang, S.; Ma, X.; Wang, X.; Huang, J.; Zhang, C.; Chen, M.L.; Yang, J.; Wang, K. In vivo kinematic study of the tarsal joints complex based on fluoroscopic 3D–2D registration technique. Gait Posture 2016, 49, 54–60. [Google Scholar] [CrossRef]
  9. Farris, D.J.; Birch, J.; Kelly, L. Foot stiffening during the push-off phase of human walking is linked to active muscle contraction, and not the windlass mechanism. J. R. Soc. Interface 2020, 17, 20200208. [Google Scholar] [CrossRef]
  10. Sichting, F.; Ebrecht, F. The rise of the longitudinal arch when sitting, standing, and walking: Contributions of the windlass mechanism. PLoS ONE 2021, 16, e0249965. [Google Scholar] [CrossRef]
  11. Williams, L.R.; Ridge, S.T.; Johnson, A.W.; Arch, E.S.; Bruening, D.A. The influence of the windlass mechanism on kinematic and kinetic foot joint coupling. J. Foot Ankle Res. 2022, 15, 16. [Google Scholar] [CrossRef]
  12. Khamis, S.; Yizhar, Z. Effect of feet hyperpronation on pelvic alignment in a standing position. Gait Posture 2007, 25, 127–134. [Google Scholar] [CrossRef] [PubMed]
  13. Fourchet, F.; Girard, O.; Kelly, L.; Horobeanu, C.; Millet, G.P. Changes in leg spring behaviour, plantar loading and foot mobility magnitude induced by an exhaustive treadmill run in adolescent middle-distance runners. J. Sci. Med. Sport 2015, 18, 199–203. [Google Scholar] [CrossRef] [PubMed]
  14. Tourillon, R.; Gojanovic, B.; Fourchet, F. How to Evaluate and Improve Foot Strength in Athletes: An Update. Front. Sports Act. Living 2019, 1, 46. [Google Scholar] [CrossRef] [PubMed]
  15. Chimenti, R.L.; Tome, J.; Hillin, C.D.; Flemister, A.S.; Houck, J. Adult-acquired flatfoot deformity and age-related differences in foot and ankle kinematics during the single-limb heel-rise test. J. Orthop. Sports Phys. Ther. 2014, 44, 283–290. [Google Scholar] [CrossRef]
  16. Krautwurst, B.K.; Wolf, S.I.; Dreher, T. Three-dimensional evaluation of heel raise test in pediatric planovalgus feet and normal feet. Gait Posture 2016, 48, 146–151. [Google Scholar] [CrossRef]
  17. Leardini, A.; Benedetti, M.; Berti, L.; Bettinelli, D.; Nativo, R.; Giannini, S. Rear-foot, mid-foot and fore-foot motion during the stance phase of gait. Gait Posture 2007, 25, 453–462. [Google Scholar] [CrossRef]
  18. Pohl, M.B.; Messenger, N.; Buckley, J.G. Forefoot, rearfoot and shank coupling: Effect of variations in speed and mode of gait. Gait Posture 2007, 25, 295–302. [Google Scholar] [CrossRef]
  19. Seo, S.G.; Lee, D.Y.; Moon, H.J.; Kim, S.J.; Kim, J.; Lee, K.M.; Chung, C.Y.; Choi, I.H. Repeatability of a multi-segment foot model with a 15-marker set in healthy adults. J. Foot Ankle Res. 2014, 7, 24. [Google Scholar] [CrossRef]
  20. Cook, J.L.; Purdam, C.R. The challenge of managing tendinopathy in competing athletes. Br. J. Sports Med. 2014, 48, 506–509. [Google Scholar] [CrossRef]
  21. Docking, S.I.; Cook, J. How do tendons adapt? Going beyond tissue responses to understand positive adaptation and pathology development: A narrative review. J. Musculoskelet. Neuronal Interact. 2019, 19, 300–310. [Google Scholar]
  22. Redmond, A.C.; Crane, Y.Z.; Menz, H.B. Normative values for the Foot Posture Index. J. Foot Ankle Res. 2008, 1, 6. [Google Scholar] [CrossRef]
  23. Takabayashi, T.; Edama, M.; Inai, T.; Kubo, M. Shank and rearfoot coordination and its variability during running in flatfoot. J. Biomech. 2021, 115, 110119. [Google Scholar] [CrossRef] [PubMed]
  24. Houck, J.R.; Neville, C.G.; Tome, J.; Flemister, A. Foot kinematics during a bilateral heel rise test in participants with stage II posterior tibial tendon dysfunction. J. Orthop. Sports Phys. Ther. 2009, 39, 593–603. [Google Scholar] [CrossRef]
  25. Saltzman, C.L.; Nawoczenski, D.A.; Talbot, K.D. Measurement of the medial longitudinal arch. Arch. Phys. Med. Rehabil. 1995, 76, 45–49. [Google Scholar] [CrossRef] [PubMed]
  26. Stebbins, J.; Harrington, M.; Thompson, N.; Zavatsky, A.; Theologis, T. Repeatability of a model for measuring multi-segment foot kinematics in children. Gait Posture 2006, 23, 401–410. [Google Scholar] [CrossRef] [PubMed]
  27. Needham, R.A.; Naemi, R.; Hamill, J.; Chockalingam, N. Analysing patterns of coordination and patterns of control using novel data visualisation techniques in vector coding. Foot 2020, 44, 101678. [Google Scholar] [CrossRef]
  28. Hunt, A.E.; Smith, R.M.; Torode, M.; Keenan, A.-M. Inter-segment foot motion and ground reaction forces over the stance phase of walking. Clin. Biomech. 2001, 16, 592–600. [Google Scholar] [CrossRef]
  29. Pohl, M.B.; Buckley, J.G. Changes in foot and shank coupling due to alterations in foot strike pattern during running. Clin. Biomech. 2008, 23, 334–341. [Google Scholar] [CrossRef]
  30. Edama, M.; Takabayashi, T.; Inai, T.; Kikumoto, T.; Ito, W.; Nakamura, E.; Hirabayashi, R.; Ikezu, M.; Kaneko, F.; Kageyama, I. Differences in the strain applied to Achilles tendon fibers when the subtalar joint is overpronated: A simulation study. Surg. Radiol. Anat. 2019, 41, 595–599. [Google Scholar] [CrossRef]
  31. Sara, L.K.; Gutsch, S.B.; Hunter, S.K. The single-leg heel raise does not predict maximal plantar flexion strength in healthy males and females. PLoS ONE 2021, 16, e0253276. [Google Scholar] [CrossRef]
  32. Ugbolue, U.C.; Yates, E.L.; Ferguson, K.; Wearing, S.C.; Gu, Y.; Lam, W.-K.; Baker, J.S.; Dutheil, F.; Sculthorpe, N.F.; Dias, T. Electromyographic Assessment of the Lower Leg Muscles during Concentric and Eccentric Phases of Standing Heel Raise. Healthcare 2021, 9, 465. [Google Scholar] [CrossRef]
  33. DiLiberto, F.E.; Nawoczenski, D.A. Ankle and Midfoot Power During Single-Limb Heel Rise in Healthy Adults. J. Appl. Biomech. 2020, 36, 52–55. [Google Scholar] [CrossRef]
Table 1. Demographics.
VariableValue
Age (years)21.0 (0)
Height (cm)165.7 (10.3)
Body weight (kg)56.1 (8.8)
BMI (kg/m2)20.4 (1.9)
Dominant leg (R:L)11:1
Sex (male–female)6:6
Foot length (cm)24.4 (2.0)
Truncated foot length (cm)19.3 (1.7)
Normalized arch height (%)17.2 (2.8)
Table 2. Initial joint configurations for the two heel rise tasks (degrees).
ExtendedFlexedp Value aEffect Size (95%CI b)
KneeExt(−) Flex(+)−0.3 (6.8)35.5 (17.9)<0.001 ***−2.25 (−44.81, −26.79)
ShankIR(−) ER(+)−3.4 (19.9)−7.1 (19.6)0.5850.16 (−9.22, 16.65)
HindfootPF(−) DF(+)11.3 (3.8)19.5 (6.7)<0.001 ***−1.37 (−11.65, −4.84)
Ever(−) Inver(+)−5.9 (6.1)−7.5 (9.7)0.6390.14 (−4.79, 7.92)
ForefootPF(−) DF(+)−1.1 (8.5)6.0 (11.4)0.092−0.53 (−14.74, 0.44)
Ever(−) Inver(+)1.9 (4.7)1.3 (5.1)0.7630.09 (−3.13, 4.30)
HalluxFlex(−) Ext(+)−33.8 (20.2)−33.5 (20.6)0.970−0.01 (−13.99, 13.45)
a: Comparisons between conditions were conducted using paired t-tests or Wilcoxon signed-rank tests. b: 95% confidence interval (CI) is presented as (lower bound, upper bound). Significant differences are indicated by *** for p < 0.001. Abbreviations: Ext, extension; Flex, flexion; IR, internal rotation; ER, external rotation; PF, plantarflexion; DF, dorsiflexion; Ever, eversion; Inver, inversion. All angle values are presented in degrees (°).
Table 3. Heel rise performance for the two heel rise tasks.
ExtendedFlexedp Value aF bPartial η2 (95%CI c)
Displacement
Pelvis, cmUpward6.3 (1.5)5.2 (2.0)0.8040.0650.01 (0.01, 0.33)
Anterior4.3 (1.1)4.1 (1.0)0.1872.0050.17 (0.01, 0.60)
Knee, cmAnterior4.3 (1.1)5.6 (2.8)0.4650.5760.05 (0.01, 0.59)
Heel, cmUpward10.5 (2.0)11.4 (2.6)0.7250.1310.01 (0.01, 0.59)
Normalized heel height, %Upward54.5 (9.2)59.1 (12.7)0.6140.2250.03 (0.01, 0.67)
Displacements of the pelvis, knee, and heel markers are shown (cm). The normalized heel height (%) was calculated by standardizing the heel height relative to the truncated foot length. a: Comparisons between conditions (knee-extended vs. knee-flexed) were conducted using analysis of covariance (ANCOVA), with knee flexion angle included as a covariate. b: F values represent the main effect of condition obtained from the ANCOVA model. c: Partial η2 is reported as an effect size, with 95% confidence intervals (CI) presented as lower and upper bounds.
Table 4. The total joint displacement during ascending and descending phases of heel rise with knee extended and flexed (degrees).
Ascending PhaseDescending Phase
ExtendedFlexedp Value aF cPartial η2 (95%CI d)ExtendedFlexedp Value aF cPartial η2 (95%CI d)
ShankhorizontalEarly1.4 (0.9)1.7 (1.1)0.9690.0020 (0, 0.44)0.7 (0.5)0.8 (0.8)0.4020.7650.07 (0, 0.63)
Middle1.8 (1.2)2.3 (1.6)0.1342.6580.21 (0, 0.61)1.7 (1.5)1.6 (1.4)0.5910.3080.03 (0, 0.44)
Late1.0 (0.8)1.2 (1.0)0.2911.2410.11 (0, 0.58)2.6 (1.2)3.3 (1.6)0.4520.6130.06 (0, 0.48)
p value b0.0550.043 * <0.001 ***<0.001 ***
HindfootsagittalEarly1.9 (1.2)2.4 (1.6)0.6570.2090.02 (0, 0.25)2.8 (1.4)2.8 (1.7)0.0963.3720.25 (0.01, 0.62)
Middle9.8 (2.9)10.5 (3.4)0.1770.1830.02 (0, 0.28)8.3 (2.6)8.6 (3.3)0.4370.6570.06 (0, 0.47)
Late4.8 (2.4)4.8 (1.5)0.6820.1780.02 (0, 0.36)4.7 (3.2)6.0 (3.0)0.032 *6.4070.42 (0.02, 0.96)
p value b<0.001 ***<0.001 *** <0.001 ***<0.001 ***
frontalEarly1.1 (1.0)1.3 (1.3)0.7890.0750.01 (0, 0.459)1.0 (1.2)1.1 (1.2)0.9080.0140 (0, 0.30)
Middle4.2 (3.9)4.0 (3.7)0.5630.3580.03 (0, 0.26)3.6 (3.3)3.1 (3.0)0.98600 (0, 0.59)
Late2.2 (2.1)1.7 (1.5)0.8440.0410 (0, 0.49)2.9 (2.1)2.4 (2.3)0.9080.0140 (0, 0.30)
p value b0.002 **<0.001 *** <0.001 ***0.003 **
ForefootsagittalEarly1.5 (0.9)1.2 (0.8)0.7510.1090.01 (0, 0.46)2.4 (1.7)2.9 (2.4)0.5530.3780.04 (0, 0.37)
Middle6.9 (3.1)6.6 (4.3)0.1212.8640.22 (0, 0.60)6.8 (2.9)6.3 (3.7)0.1452.4960.20 (0.01, 0.57)
Late5.3 (2.1)5.0 (2.4)0.4690.5660.05 (0, 0.41)3.8 (2.1)2.5 (1.6)0.2631.4010.12 (0, 0.53)
p value b<0.001 ***<0.001 *** <0.001 ***<0.001 ***
frontalEarly0.9 (0.7)1.0 (0.5)0.3031.1800.11 (0, 0.56)0.9 (0.6)1.0 (0.9)0.8180.0560.01 (0, 0.36)
Middle3.9 (2.2)2.7 (1.8)0.7620.0970.01 (0, 0.47)4.0 (2.0)2.6 (1.7)0.5530.3770.04 (0, 0.45)
Late2.9 (1.6)1.8 (0.9)0.4220.7010.07 (0, 0.41)1.5 (1.5)0.9 (0.6)0.4910.5120.05 (0, 0.22)
p value b<0.001 ***<0.001 *** <0.001 ***<0.001 ***
HalluxsagittalEarly1.4 (0.8)1.3 (0.7)0.8660.0300 (0, 0.44)1.5 (1.3)2.0 (1.8)0.5860.3170.03 (0, 0.67)
Middle3.1 (1.8)4.5 (3.3)0.98300 (0, 0.55)2.1 (1.5)4.1 (3.3)0.6360.2380.02 (0, 0.61)
Late1.7 (0.6)2.3 (1.7)0.8930.0190 (0, 0.50)1.8 (1.1)1.7 (1.1)0.3011.1910.11 (0, 0.50)
p value b0.007 **<0.001 *** 0.4610.003 **
a: Comparisons between conditions (knee-extended vs. knee-flexed) were conducted using analysis of covariance (ANCOVA), with knee flexion angle included as a covariate. b: Within-condition comparisons across periods (early, middle, late) were analyzed using ANCOVA with knee flexion angle as a covariate. Post hoc analyses (Bonferroni-corrected, adjusted α = 0.0167) are described in the main text. c: F values represent the main effect of condition obtained from the ANCOVA model. d: Partial η2 is reported as an effect size, with 95% confidence intervals (CI) presented as lower and upper bounds. Significant differences are indicated as follows: * p < 0.05, ** p < 0.01, *** p < 0.001. All angle values are presented in degrees (°).
Disclaimer/Publisher’s Note: The statements, opinions and data contained in all publications are solely those of the individual author(s) and contributor(s) and not of MDPI and/or the editor(s). MDPI and/or the editor(s) disclaim responsibility for any injury to people or property resulting from any ideas, methods, instructions or products referred to in the content.