Abstract
Background/Objectives: This study aimed to examine the effects of an eight-week wearable resistance (WR) training program on jump performance and jump kinematics in experienced senior female volleyball players. It was hypothesised that using WR would increase training load, thereby enhancing vertical jump performance and influencing kinematic movement patterns. Methods: Sixteen competitive female volleyball players (mean age: 23.5 ± 3.24 years; mean weight: 66.8 ± 6.9 kg; mean height: 174.7 ± 5.8 cm) participated in the study. Participants were randomly assigned to either a control group (n = 8) or an intervention group (n = 8) that trained with calf-mounted WR. The intervention group performed supervised resistance training sessions twice per week for eight weeks, totalling 16 sessions. Jump performance was assessed using an Infrared Optical Contact Grid (MuscleLab, Ergotest Innovation AS, Norway), and jump kinematics were measured with the Xsens Link motion capture system (Movella, The Netherlands). Results: The WR group demonstrated a statistically significant improvement in vertical jump height (p = 0.031), with no significant changes in kinematic variables. The control group, however, showed a significant increase in T8–pelvis flexion during the countermovement jump (CMJ) following the intervention period. Conclusions: Eight weeks of WR training can improve CMJ performance in-season among experienced female volleyball players without affecting movement kinematics. Future research should investigate optimal loading strategies and long-term adaptations. These findings suggest that integrating small wearable loads into regular volleyball practice can help athletes maintain and improve explosive performance without disrupting normal training routines.
1. Introduction
Vertical jump plays an essential role in volleyball, particularly during actions such as spiking, serving, and blocking. As Sattler et al. [1] observed, achieving greater height during these movements allows athletes to make contact with the ball above the net, creating more effective attack angles. Among the various types of jumps used in volleyball, the CMJ is particularly important, serving as a key part of both offence and defense. Movements such as jump setting and stationary blocking rely on CMJ mechanics and directly influence match outcomes at competitive levels [2]. As such, the CMJ is widely recognized as a reliable indicator of explosive lower-body performance and overall athletic ability in volleyball players.
Building on this, athletes in sports that require vertical force production, such as volleyball, typically follow training programs that focus on plyometric performance. This aligns with the well-established principle of training specificity, which states that performance improvements are greatest when training closely matches the movement used in the actual sport [3]. With jump focused training even small improvements (e.g., 5–10%, or 2–6 cm) can have a meaningful impact in sports where lower-body power often dictates performance [4]. Furthermore, studies have shown that plyometric training over a period of 6–8 weeks can significantly improve jump performance in female athletes. For example, 14-year-old volleyball players improved their jump height by approximately 20% following a plyometrics training program [5]. Similarly, young female soccer players aged 16–20 demonstrated gains of around 17.6% in jump height after an 8-week plyometric training intervention [6].
However, achieving these gains in-season presents a challenge. Despite ongoing training, some studies suggest that vertical jump performance can stagnate or even decline during the competitive season. For example, one study showed that elite female volleyball players who continued resistance and plyometric training throughout a 12-week in-season period exhibited only a modest 3.9% improvement in CMJ height [7]. Furthermore, Newton et al. [8] observed a 5.4% drop in jump height from the start to the middle of the season, followed by a recovery at the end of it, only after reducing heavy leg training. The authors suggested that this decline was possibly due to neuromuscular fatigue caused by the combined demands of heavy lifting, gameplay, and five skill sessions, which may have limited recovery and reduced training effectiveness. These findings highlight the difficulty of maintaining or enhancing plyometric performance during the competitive season and underline the need for alternative in-season training methods that could be integrated with minimal disruption.
One such method that has gained interest in recent years is WR training. This approach involves attaching small external loads to the body, typically to the limbs, in a way that is non-invasive, sport-specific, and can be seamlessly integrated into regular practice. Because it does not require separate training sessions or interfere with skill work, WR is well-suited for maintaining or enhancing performance during the competitive season. For instance, a longitudinal study using WR over a period of 3 to 10 weeks showed improvements in vertical jump performance across different loads, typically 7% and 30% of body mass [9]. While injury risk was not the focus of the present study, it should be noted that the wearable loads used here were very small (<2% body mass) and were applied progressively, making them unlikely to place excessive strain on the joints.
Nevertheless, while some studies explored both the acute and longitudinal effects of WR training on jump performance [10,11], there is little to no research about its application specifically in the context of volleyball. This leads to the conclusion that the effects of WR on CMJ performance and kinematics in volleyball remain largely unexplored. Therefore, this study aims to address this gap by evaluating the impact of an eight-week WR training intervention on vertical jump performance and lower-body kinematics in experienced female volleyball players. It was hypothesized that WR training would improve jump performance and lead to positive kinematic changes such as faster hip and knee extension and potentially greater angular velocities during the propulsive phase of the jump.
2. Materials and Methods
2.1. Experimental Design and Methodology
In this study, players did not engage in any dedicated plyometric training. Instead, WR was incorporated into parts of their regular volleyball training. Therefore, this was not a study of WR use in plyometric training, but rather an investigation of how WR, when used as part of general training, influences performance such as counter movement jump. To examine this, 16 female volleyball players participated in an eight-week randomized controlled pretest-posttest study designed to assess changes in vertical jump height and kinematic parameters, including right and left ankle dorsiflexion/plantarflexion, knee flexion/extension, hip flexion/extension, and pelvis (T8) flexion/extension, as well as the corresponding angular velocities for each joint.
Participants were randomly assigned to either the intervention group, with WR attached to their calves, or the active control group, with WR attached to their forearms. An active control group was chosen to account for external load while maintaining their standard training regimen. Both groups were part of the same team and followed an identical training schedule consisting of four weekly sessions, two volleyball practices, where WR was applied, and two technical sessions. These sessions emphasized individual skills and 1-on-1 plays, focusing on refining technique and dynamic team play, reflecting the team’s normal in-season training structure. Additionally, players participated in weekly matches during the competitive season.
2.2. Participants
Sixteen female volleyball players from a second division team in Poland were initially recruited for this study; however, three dropped out during the intervention due to scheduling conflicts, leaving a final sample size of 13 participants (mean age: 23.5 ± 3.24 years; mean weight: 66.8 ± 6.9 kg; mean height: 174.7 ± 5.8 cm). Participants were required to have at least three years of volleyball experience and to have actively participated in competitive volleyball within the past year. Individuals were excluded from the study if they had any injuries that could affect their performance during the tests or if their attendance in training sessions was below 80% (13/16 sessions). Prior to enrolment, all players provided informed consent and completed a pre-screening questionnaire to confirm eligibility. Despite the dropout, the sample size remained above the threshold indicated by our power analysis (GPower 3.1.9.7 [12]). Parameters were set at α = 0.05 and power (1 − β) = 0.90, using the F-test family (ANOVA: repeated measures, within–between interaction). Variance estimates (variance explained by effect = 1.6, variance within group = 0.56) indicated that a minimum of 6 participants would be sufficient. A conservative expected effect size was chosen, based on previous studies showing only modest in-season CMJ improvements of around 3.9% [7] or even decreases of ~5.4% [8]. Our final sample of 13 participants therefore exceeded this requirement, ensuring adequate statistical power.
2.3. Testing Procedures
The testing procedures were conducted one week before and one week after the intervention period. Prior to testing each participant completed a standardized 10-min warm-up routine consisting of dynamic exercises designed to activate key muscle groups. This warm-up focused on lower-body muscles and full-body movements to optimize performance and ensure readiness for the test. To assess jump performance, each participant performed eight maximal-effort CMJs with arm swing in the pre-test and five in the post-test. A rest period of approximately 30–45 s was provided between jumps to minimize fatigue and ensure consistent effort. The larger number of jumps in the pre-test was intended to allow for familiarization with the testing setup and to account for natural variability in performance. From the eight pre-test jumps, the highest five were selected and used for analysis, while all five post-test jumps were included, as participants were already familiar with the procedure. For kinematic analysis, only the single best jump (based on maximal jump height) was selected from both the pre- and post-test trials. This approach ensured that movement mechanics were compared using the highest-effort performances.
2.4. Training Intervention
This study’s intervention was carried out from October to December, within the competitive season. During this period, the intervention group wore WR sleeves (Lila™, Kuala Lumpur, Malaisia) on their calves (Figure 1). The resistance was introduced progressively, starting with 100 g per leg and increasing by 100 g every two weeks, reaching 400 g per leg by the end of the intervention (Figure 2). This corresponded to ~0.15%, 0.30%, 0.45%, and 0.60% of body mass, based on the average participant body mass (66.8 ± 6.9 kg). The control group served as an active control group, wearing the WR sleeves (Lila™) on their forearms (Figure 1) to ensure a comparable external load without directly affecting lower-limb mechanics. The active control group started with 50 g per arm and increased by 50 g every two weeks, reaching 200 g per arm by the end (Figure 2). This approach helped match the total external load between groups, while isolating the specific effects of lower-limb WR in the intervention group. This gradual progression was implemented to minimize injury risk and ensure safe adaptation, which was particularly important given the in-season context where maintaining peak performance was a priority. The final load corresponded to less than 2% of body mass, which is well within the range typically applied in WR studies (0.3–8.5% BM) without adverse effects [9,10].
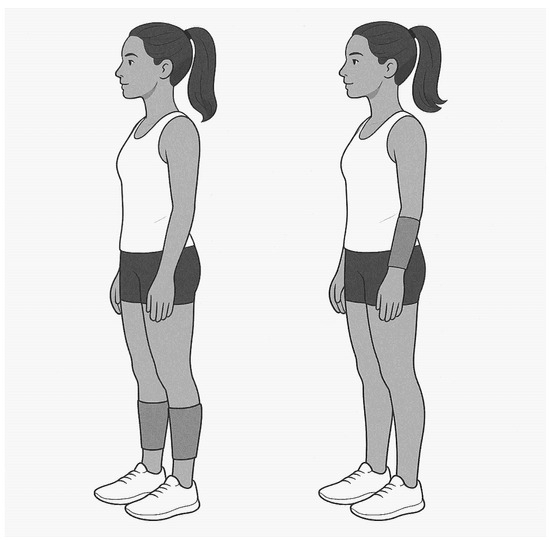
Figure 1.
WR placement for intervention (left) and control (right) group.
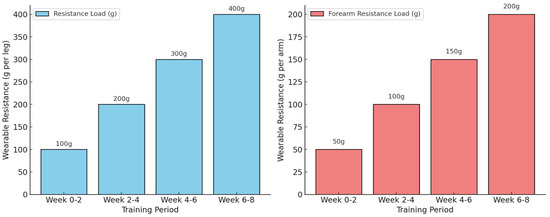
Figure 2.
Load progression for intervention (left) and control (right) groups over 8 weeks.
The difference in total loads used in the intervention (400 g per leg in the intervention group vs. 200 g per arm in the control group) was chosen based on both biomechanical principles and existing literature. From a mechanical perspective, the impact of added resistance depends not just on mass but also on its distance from the joint axis, which determines torque. As described in physics, torque increases as the distance from the pivot point increases, meaning that small masses placed on a distal segment can create significant mechanical demand during movements like jumping. This is similar to holding a stick with a weight at the end; the farther the load, the heavier it feels.
In support of this rationale, prior research has highlighted that even small WR loads, particularly when applied to the limbs (as low as 0.3–8.5% of body mass), can impact movement mechanics and metabolic demand. Although most of the research focuses on walking and running, similar effects may also occur during CMJ. Based on this, the 400 g per leg used in this study (approximately 0.6% of body mass) may still offer a sufficient training stimulus while remaining within safe and practical limits [9].
To ensure fairness in use of the WR, all players used it for only 30 min during each training session (Figure 3). This specific duration was chosen as it took place where all players, regardless of position, participated in the same warm-up drills and general training exercises. Allowing players to wear resistance throughout the entire session would have introduced variability in training load, as offensive players (e.g., hitters) typically perform more jumps and 10 high-intensity actions compared to defensive players (e.g., liberos). By limiting resistance use to a standardized and position-neutral part of practice, the intervention ensured that all participants received a comparable training stimulus.
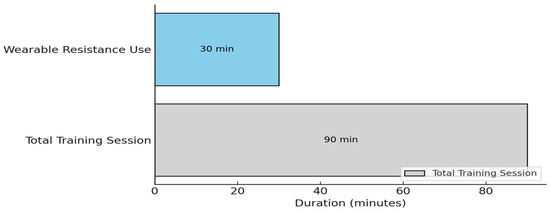
Figure 3.
Duration of WR use (30 min) within a regular 90-min volleyball training session, standardized across all participants.
In addition to the structured training, all of the participants were regularly contacted each week to remind them of the weights they were expected to use during their training sessions. Coaches were also actively involved in monitoring the use of the WR, which ensured that the intervention was followed precisely, helping maintain the integrity of the experimental design.
2.5. Measurements
An Infrared Optical Contact Grid (Musclelab, Ergotest Innovation AS, Langesund, Norway) was used to measure jump height, which was calculated from flight time. The IR mat was used only for jump height, while all kinematic analyses were performed using the Xsens MVN 2024.2 Link system, which was the primary measurement tool. Although jump height is technically derived from kinematic data, in this study it is treated as a performance measure, reported separately from joint- and segment-level kinematics. Participants were instructed to perform each jump with maximum effort, and brief rest periods were provided between attempts to minimize fatigue and ensure consistent performance. Full-body kinematic data was captured using the Xsens MVN Link motion capture system (Movella, Enschede, The Netherlands). Sensors were placed across the entire body, allowing the system to capture whole-body dynamics without restricting movement. The wireless, on-body recording capability enabled participants to jump freely with minimal interference from cables or equipment.
Kinematics were measured with Xsens MVN Link motion capture system allowing for high-precision, full-body three-dimensional (3D) motion tracking, at an update rate of up to 240 Hz. The beginning of the CMJ was defined as the instant when the vertical displacement of the center of mass (CoM) first decreased below the standing reference position, marking the onset of the downward phase. Peak CoM marked the highest jump position and defined the end of the movement. From this, joint angles were extracted for the right and left ankles (dorsiflexion/plantarflexion), knees (flexion/extension), hips (flexion/extension), and T8 pelvis segment (flexion/extension). Joint angular velocities were then calculated using a 5-point numerical differentiation filter applied to these angular measures. In total, seven joint angles and their corresponding angular velocities per group were analyzed to assess detailed kinematic changes resulting from WR training.
Both the Xsens MVN Link system and the MuscleLab IR mat (Ergotest Innovation AS, Langesund, Norway) are widely used in sports science and have been validated in previous research. Xsens offers full-body kinematic data at 240 Hz and has shown strong agreement with the gold-standard Vicon system during CMJ, with high correlations and low RMSD values [13]. Johansen et al. [14] also reported consistent results using IMUs in jump assessments. The IR mat has shown reliable performance in CMJ assessment when compared to standard contact mats [15], supporting its use as a valid and practical tool for measuring jump height and flight time.
2.6. Data Processing
Kinematic data were collected using the Xsens MVN Link motion capture system and exported as Excel files from Xsens MVN Analyze (version 2023.2). Each file contained time-series data for CMJ. Each trial was manually trimmed to isolate the jump phase, removing frames before movement onset and after landing. From both pre- and post-intervention sessions, the five highest jumps per participant (based on jump height) were selected for further analysis.
CoM velocity was used to identify eccentric and concentric phases. From these, eccentric and concentric phase velocities were calculated to assess movement speed. Additionally, four CMJ mechanical variables were derived: eccentric time (from movement onset to lowest CoM), eccentric depth (vertical displacement during descent), concentric time (lowest CoM to toe-off), and concentric height (vertical displacement during ascent). Paired-samples t-tests were used to assess pre- to post-test changes within each group (WR and No-WR), and change scores (Post–Pre) were compared between groups using independent samples t-tests.
For joint angle and angular velocity analysis, relevant parameters were extracted and down sampled to 100 frames per trial to ensure uniform time-series length across all jumps. This was required for analysis using Statistical Parametric Mapping (SPM1D), which only supports time-normalized data [16]. Each parameter was split into four datasets (WR and No-WR at pre- and post-test), resulting in four files per variable. A total of 38 one-way repeated-measures ANOVAs (1RM ANOVA) were conducted in MATLAB using the open-source SPM1D package developed by Pataky [16]. Unlike traditional point-based statistics, SPM allows for detecting time-specific differences across the full movement. A non-parametric version of the test was used due to the small sample size and potential non-normality of the data. Visualizations were generated without additional filtering to preserve the raw statistical output.
2.7. Statistics
All statistical analyses were performed using MATLAB Online (R2024b, Update 5; The MathWorks, Inc., Natick, MA, USA). A significance level of p < 0.05 was used. Jump height was analyzed using a 2 (group: WR vs. No-WR) × 2 (time: pre vs. post) repeated-measures ANOVA. Welch’s t-test was also applied to change scores (Post–Pre) due to unequal group sizes. Cohen’s d was calculated for effect sizes [17]. Eccentric and concentric phase velocities, as well as eccentric time, eccentric depth, concentric time, and concentric height, were analyzed using paired-samples t-tests (within groups) and independent-samples t-tests (between-group change scores). Joint angles and angular velocities were analyzed using one-way repeated-measures ANOVAs with Statistical Parametric Mapping (SPM1D) in MATLAB [16,18]. Assumptions of normality were tested using the Shapiro–Wilk test, and no violations were detected (all p > 0.38). This supported the use of parametric tests for the ANOVAs and t-tests. For SPM1D analyses, the non-parametric version was used due to small sample size.
3. Results
3.1. Jump Performance
A significant main effect of time was found (F = 10.76, p = 0.007), showing that participants jumped higher in the post-test compared to the pre-test. A significant group × time interaction was also observed (F = 6.97, p = 0.023), indicating that the improvement differed between groups. Because of the small and uneven group sizes, a Welch’s t-test was used to compare the change in jump height between the groups. This revealed a significant difference (t = 2.57, p = 0.031, d = 1.59), showing that the intervention group improved their CMJ more than the control group. The mean improvement in jump height was 5.13 ± 3.52 cm for the intervention group and 2.39 ± 1.52 cm for the control group. The estimated effect size (Cohen’s d) was 1.04, indicating a large effect of the intervention (Figure 4 and Figure 5).
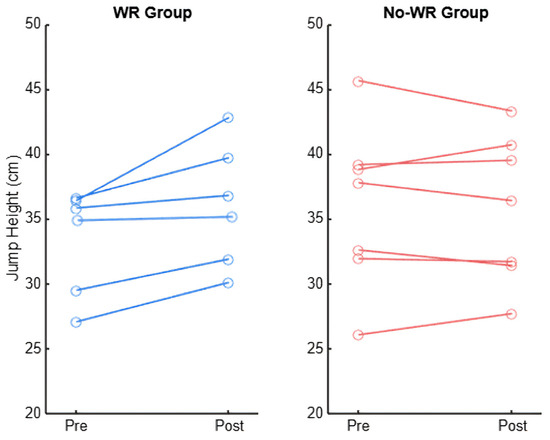
Figure 4.
Individual pre- and post-test jump heights for the intervention group (left) and control group (right). Each line represents participant’s change in jump height across the intervention period.
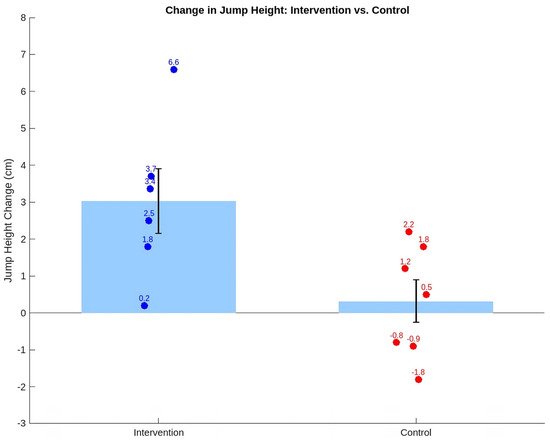
Figure 5.
Mean change in jump height (post to pre) for the intervention and control groups. Group means (black line) and individual data points illustrate each participant’s changes.
3.2. Jump Phase Velocities, Time and Depth
A significant main effect of time was observed for concentric time (F = 17.91, p = 0.0014), indicating that participants completed the concentric phase faster post-test, regardless of group (Figure 6) nor significant group × time interactions were found for eccentric velocity (F = 0.056, p = 0.819, Figure 6), concentric velocity (F = 2.00, p = 0.185), eccentric time (F = 0.091, p = 0.360), concentric time (F = 2.74, p = 0.126), eccentric depth (F = 0.092, p = 0.767), or concentric depth (F = 0.0003, p = 0.988, Figure 7).
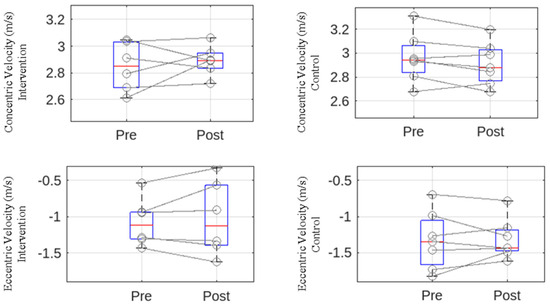
Figure 6.
Pre- and post-intervention eccentric and concentric phase velocities for the intervention (WR) and control groups. Boxplots show the distribution, and lines represent individual participants.
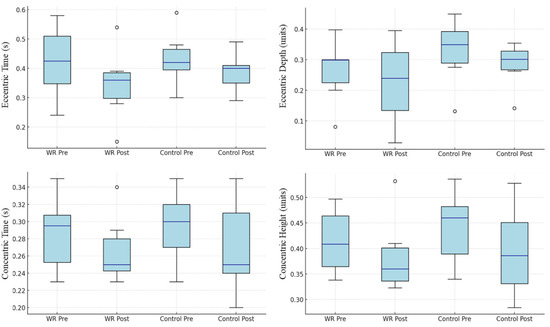
Figure 7.
Pre- and post-intervention values for eccentric time, eccentric depth, concentric time, and concentric height in the intervention group (WR) and control group.
3.3. Kinematic Analysis
As no significant differences between left and right side kinematics were found as it is a CMJ with two legs only statistical comparison of the right side were performed. Statistical Parametric Mapping (SPM) ANOVA of kinematic data revealed no significant changes in joint angles or angular joint velocities for the intervention group. While the control group showed a significant difference in T8 pelvis flexion/extension across the CMJ (p = 0.030, non-parametric test, Figure 8). No other kinematic parameters demonstrated significant changes for either group (Figure 8 and Figure 9). The joint angle at the posttest was higher at the start of the jump movement, while angular velocity as higher at the end of it around toe-off for the control group (Figure 8).
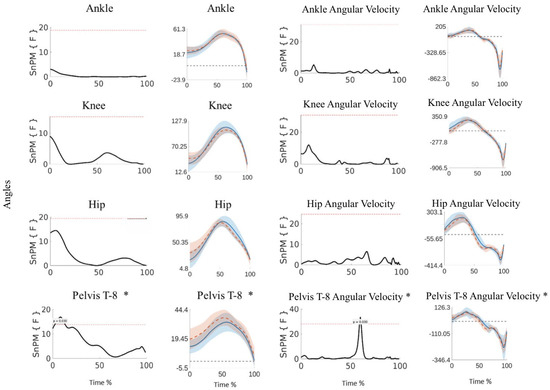
Figure 8.
Statistical Parametric Mapping ANOVA results for Joint Angles and angular velocity of the right Ankle, Knee, Hip, and Pelvis (T8) in the control group. * indicates a significant difference between pre- and post-test (p = 0.030). Pre-test (dashed red) post-test (solid blue).
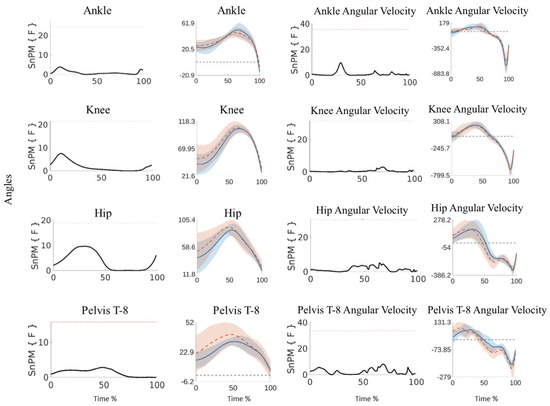
Figure 9.
Statistical Parametric Mapping ANOVA results for Joint Angles and angular velocity of the right Ankle, Knee, Hip, and Pelvis (T8) in the intervention group across the movement cycle. Pre-test (dashed red) post-test (solid blue).
4. Discussion
The results of this study demonstrate that an eight-week in-season WR training program targeting lower body led to a 9.5% improvement in CMJ height among experienced female volleyball players. This finding is particularly notable given that previous research has shown only modest improvements or even declines in jump performance during the competitive season. For example, Marques et al. [7] reported only a 3.9% increase in CMJ in elite female volleyball players despite ongoing resistance and plyometric training, while Newton et al. [8] observed a mid-season drop in jump height due to what he describes as neuromuscular fatigue. Improvements observed in the present study suggest that WR, when applied to the calves, may offer a more sport-specific and minimally disruptive training stimulus that preserves or enhances explosive performance in-season. Additionally, the placement of resistance appears to play a key role. While the intervention group trained with WR on the calves, the control group wore WR as well, only on the forearms and showed no significant improvement in jump. This highlights the importance of WR placement, as distal lower-limb loading more directly targets the musculature and movement patterns relevant to jumping, whereas forearm loading may not provide sufficient stimulus to cause meaningful adaptations for lower-body. Even modest improvements in CMJ height, such as the ~9.5% observed here, are directly relevant to volleyball performance, as they can increase attack reach during spiking and improve blocking effectiveness at the net [1,2].
In exploring the underlying mechanisms behind these performance differences, kinematic data revealed contrasting adaptations between groups. Notably, the control group exhibited changes in T8 flexion–extension, while the intervention group showed no significant kinematic changes. One plausible explanation for the control group’s adaptation is their placement of WR on the forearms during training. Although the resistance was removed during testing, training with forearm WR may have induced neuromuscular adaptations that altered trunk mechanics. Prior research shows that forearm WR can modify upper-body joint kinematics and muscle activation patterns during throwing tasks, with some effects persisting beyond the loading condition [19,20]. These adaptations may come from changes in arm swing dynamics, which are known to influence jump performance and trunk posture [21]. Therefore, it is possible that the control group modified trunk coordination patterns developed during WR training, resulting in observed changes. In contrast, the intervention group’s lack of change in kinematics suggests that performance gains were driven by adaptations elsewhere in the movement chain, particularly in the lower limbs.
Given the increase in jump height observed in the intervention group, it follows from fundamental physics that the vertical velocity of the CoM which we analyzed must also have increased. According to the equation jump height is proportional to the square of the take-off velocity of the CoM, divided by twice the acceleration of gravity. This means that as take-off velocity increases, jump height increases, assuming other factors remain constant. In this study, all six participants in the intervention group improved their jump height, but only four of the six showed increased peak velocity, which did not reach statistical significance. However, the effect size of the pre-to-post change within the intervention group was substantial, indicating a moderate-to-large improvement in concentric velocity. Moreover, when comparing the change in concentric velocity between the intervention and control groups, the between-group effect size was similarly large, favoring the intervention group. These findings suggest that while statistical significance was not achieved at peak velocity, the magnitude of the improvements was meaningful, reinforcing the potential effectiveness of WR training in enhancing performance.
To better understand why large effect sizes did not translate into statistically significant changes, movement phases were analyzed. Interestingly, for two of the athletes who jumped higher, measured CoM velocity decreased, a contradiction of basic kinematic principles. This anomaly suggests potential inaccuracies in measurement systems. While the Xsens MVN Link is suitable for field-based motion capture, it relies on IMUs, which are prone to errors such as drift, sensor misalignment and movement, especially during high-speed actions like jumping [13]. These limitations may have concealed real changes in performance, leading to the lack of statistically significant findings despite meaningful individual improvements. In addition to possible measurement errors, biomechanical factors could also help explain this discrepancy. For instance, improvements in eccentric–concentric transition efficiency [3] or subtle changes in arm swing and trunk coordination [21] may enhance jump height without producing large measurable increases in peak CoM velocity. Such adaptations could contribute to performance improvements while remaining difficult to capture with IMU-based systems.
Up to this point, the analysis has focused on kinematics, where no significant changes were observed in the intervention group despite their improvements in CMJ. This led to an investigation of movement patterns, including peak vertical velocity of the CoM. However, the findings there were inconsistent and, in some cases, contradictory, further strengthening the notion that the observed performance improvements may not be fully captured by the current measurement systems. This suggests that the key adaptations contributing to increased jump performance likely lie beyond the resolution of our analyses.
Several limitations of this study should be acknowledged. First, the pre-test included 8 jump attempts while the post-test included 5. Although only the best 5 pre-test jumps were retained for analysis to ensure comparability, the unequal number of total attempts could have introduced minor fatigue, or comparability effects. Future studies should provide a separate familiarization session and keep the number of formal trials identical across test sessions. Second, kinematic analysis was based only on the single best jump in each session. While this approach was chosen to reflect peak performance and is common in applied sports science, averaging several top trials could have reduced variability and improved reliability. Third, only the right side was analyzed, as no significant differences were found between left and right. However, leg dominance was not formally assessed, and future research should consider this factor. Fourth, the relatively small sample size reduced statistical power. Finally, the IMU-based motion capture system has known sources of error, which may have limited our ability to detect true changes in kinematics.
5. Conclusions
This study investigated the effects of integrating wearable resistance into regular volleyball training during an eight-week in-season period, focusing on countermovement jump performance and kinematics. The main findings demonstrated that placing WR on the calves resulted in a meaningful 9.5% increase in jump height, greater improvement than what is typically observed in season. Despite this performance gain, no significant kinematic changes were observed, and analyses of movements revealed inconsistencies. Control group, which used WR on forearms, showed significant changes in trunk kinematics (T8 flexion–extension). These results support WR training as a sport-specific method for enhancing vertical jump performance in volleyball. However, limitations in measurement accuracy, small sample size, and lack of physiological tracking highlight the need for further research to better understand reasons behind these improvements.
6. Practical Applications and Future Studies
From a practical standpoint, this study suggests that integrating WR on the calves into regular in-season training may be an effective strategy to enhance or maintain vertical jump performance in female volleyball players. Coaches may benefit from using WR as a targeted stimulus to improve jump-specific force production, especially when traditional strength training is limited by time or fatigue management during the season. For future research, larger sample sizes and the inclusion of direct measures of neuromuscular adaptation would provide more detailed insights into the mechanisms behind performance changes. Additionally, tracking body composition or body mass throughout the intervention period would help clarify the role of physical changes in influencing jump outcomes. Finally, studies comparing different WR placements (e.g., calves vs. thighs or arms) and loading schemes could optimize protocols for sport-specific applications, including outcomes such as spiking kinematics and ball velocity.
Author Contributions
Conceptualization, M.M., P.L. and R.v.d.T.; methodology, M.M., P.L. and R.v.d.T.; validation, M.M. and R.v.d.T.; formal analysis, M.M.; investigation, M.M. and P.L.; data curation, M.M.; writing—original draft, M.M. and R.v.d.T.; writing—review and editing, M.M., P.L. and R.v.d.T. visualization, M.M.; supervision, R.v.d.T.; project administration, M.M.; All authors have read and agreed to the published version of the manuscript.
Funding
This research received no external funding.
Institutional Review Board Statement
This study was conducted in accordance with the Declaration of Helsinki and approved by the Norwegian Center for Research Data approved 12 November 2024 (project number: 775722).
Informed Consent Statement
Informed consent was obtained from all subjects involved in the study.
Data Availability Statement
The data presented in this study are available on request from the corresponding author. The data are not publicly available due to the national laws on privacy of the Norwegian government.
Conflicts of Interest
The authors declare no conflicts of interest.
References
- Sattler, T.; Hadžić, V.; Dervišević, E.; Markovic, G. Vertical jump performance of professional male and female volleyball players: Effects of playing position and competition level. J. Strength Cond. Res. 2015, 29, 1486–1493. [Google Scholar] [CrossRef] [PubMed]
- Hsieh, C.; Cheng, L.; Kuo, C.H. Kinematic factors in countermovement jump for female volleyball players with different skill levels. Int. J. Sports Sci. 2016, 6, 6–10. [Google Scholar]
- Markovic, G.; Mikulic, P. Neuro-musculoskeletal and performance adaptations to lower-extremity plyometric training. Sports Med. 2010, 40, 859–895. [Google Scholar] [CrossRef] [PubMed]
- Markovic, G. Does plyometric training improve vertical jump height? A meta-analytical review. Br. J. Sports Med. 2007, 41, 349–355. [Google Scholar] [CrossRef] [PubMed]
- Pereira, A.; Costa, A.M.; Santos, P.; Figueiredo, T.; João, P.V. Training strategy of explosive strength in young female volleyball players. Medicina. 2015, 51, 126–131. [Google Scholar] [CrossRef] [PubMed]
- Ozbar, N.; Ates, S.; Agopyan, A. The effect of 8-week plyometric training on leg power, jump and sprint performance in female soccer players. J. Strength Cond. Res. 2014, 28, 2888–2894. [Google Scholar] [CrossRef] [PubMed]
- Marques, M.C.; van den Tillaar, R.; Vescovi, J.D.; González-Badillo, J.J. Changes in strength and power performance in elite senior female professional volleyball players during the in-season: A case study. J. Strength Cond. Res. 2008, 22, 1147–1155. [Google Scholar] [CrossRef] [PubMed]
- Newton, R.U.; Rogers, R.A.; Volek, J.S.; Häkkinen, K.; Kraemer, W.J. Four weeks of optimal load ballistic resistance training at the end of season attenuates declining jump performance of women volleyball players. J. Strength Cond. Res. 2006, 20, 955–961. [Google Scholar] [PubMed]
- Macadam, P.; Cronin, J.B.; Simperingham, K.D. The effects of wearable resistance training on metabolic, kinematic and kinetic variables during walking, running, sprint running and jumping: A systematic review. Sports Med. 2017, 47, 887–906. [Google Scholar] [CrossRef] [PubMed]
- Khlifa, R.; Aouadi, R.; Hermassi, S.; Chelly, M.S.; Jlid, M.C.; Hbacha, H.; Castagna, C. Effects of a plyometric training program with and without added load on jumping ability in basketball players. J. Strength Cond. Res. 2010, 24, 2955–2961. [Google Scholar] [CrossRef] [PubMed]
- Markovic, S.; Mirkov, D.M.; Knezevic, O.M.; Jaric, S. Jump training with different loads: Effects on jumping performance and power output. Eur. J. Appl. Physiol. 2013, 113, 2511–2521. [Google Scholar] [CrossRef] [PubMed]
- Faul, F.; Erdfelder, E.; Lang, A.G.; Buchner, A. G*Power 3: A flexible statistical power analysis program for the social, behavioral, and biomedical sciences. Behav. Res. Methods 2007, 39, 175–191. [Google Scholar] [CrossRef] [PubMed]
- Nijmeijer, E.M.; Heuvelmans, P.; Bolt, R.; Gokeler, A.; Otten, E.; Benjaminse, A. Concurrent validation of the Xsens IMU system of lower-body kinematics in jump-landing and change-of-direction tasks. J. Biomech. 2023, 154, 111637. [Google Scholar] [CrossRef] [PubMed]
- Johansen, B.; Neville, J.; van den Tillaar, R. A comparison between the use of an infrared contact mat and an IMU during kinematic analysis of horizontal jumps. Biomechanics 2025, 5, 14. [Google Scholar] [CrossRef]
- Hilmersson, M.; Edvardsson, I.; Tornberg, Å.B. Power of counter movement jumps with external load—Coherence of three assessment methods. BMC Res. Notes. 2015, 8, 156. [Google Scholar] [CrossRef] [PubMed]
- Pataky, T.C. One-dimensional statistical parametric mapping in Python. Comput. Methods Biomech. Biomed. Engin. 2012, 15, 295–301. [Google Scholar] [PubMed]
- Cohen, J. Statistical Power Analysis for the Behavioral Sciences, 2nd ed.; Lawrence Erlbaum Associates: Hillsdale, NJ, USA, 1988; p. 174. [Google Scholar]
- MathWorks. MATLAB Online, Version R2024b, Update 5; The MathWorks, Inc.: Natick, MA, USA, 2024; Available online: https://matlab.mathworks.com/ (accessed on 28 September 2025).
- Fredriksen, A.B.; van den Tillaar, R. The acute effects of different wearable resistance loads attached to the forearm on throwing kinematics, myoelectric activity and performance in experienced female handball players. J. Funct. Morphol. Kinesiol. 2022, 7, 58. [Google Scholar] [CrossRef] [PubMed]
- Fredriksen, A.B.; van den Tillaar, R. Effect of six weeks of training with wearable resistance attached to the forearm on throwing kinematics, strength, and velocity in female handball players. J. Funct. Morphol. Kinesiol. 2025, 10, 45. [Google Scholar] [CrossRef] [PubMed]
- Lees, A.; Vanrenterghem, J.; De Clercq, D. Understanding how an arm swing enhances performance in the vertical jump. J. Biomech. 2004, 37, 1929–1940. [Google Scholar] [CrossRef] [PubMed]
Disclaimer/Publisher’s Note: The statements, opinions and data contained in all publications are solely those of the individual author(s) and contributor(s) and not of MDPI and/or the editor(s). MDPI and/or the editor(s) disclaim responsibility for any injury to people or property resulting from any ideas, methods, instructions or products referred to in the content. |
© 2025 by the authors. Licensee MDPI, Basel, Switzerland. This article is an open access article distributed under the terms and conditions of the Creative Commons Attribution (CC BY) license (https://creativecommons.org/licenses/by/4.0/).