Article

Examination of Step Kinematics Between Children with Different Acceleration Patterns in Short-Sprint Dash

by
Ilias Keskinis
1,
Vassilios Panoutsakopoulos
1,*,
Evangelia Merkou
1,
Savvas Lazaridis
2 and
Eleni Bassa
3
1
Biomechanics Laboratory, School of Physical Education and Sport Science at Thessaloniki, Aristotle University of Thessaloniki, 54124 Thessaloniki, Greece
2
Hellenic Ministry of Education Religious Affairs and Sports, Regional Directorate of Education of South Aegean, 84100 Ermoupoli, Greece
3
School of Physical Education and Sport Science at Serres, Aristotle University of Thessaloniki, 62110 Agios Ioannis, Greece
*
Author to whom correspondence should be addressed.
Biomechanics 2025, 5(3), 60; https://doi.org/10.3390/biomechanics5030060 (registering DOI)
Submission received: 31 May 2025 / Revised: 26 July 2025 / Accepted: 31 July 2025 / Published: 4 August 2025
(This article belongs to the Collection Locomotion Biomechanics and Motor Control)

Abstract

Background/Objectives: Sprinting is a fundamental locomotor skill and a key indicator of lower limb strength and anaerobic power in early childhood. The aim of the study was to examine possible differences in the step kinematic parameters and their contribution to sprint speed between children with different patterns of speed development. Methods: 65 prepubescent male and female track athletes (33 males and 32 females; 6.9 ± 0.8 years old) were examined in a maximal 15 m short sprint running test, where photocells measured time for each 5 m segment. At the last 5 m segment, step length, frequency, and velocity were evaluated via a video analysis method. The symmetry angle was calculated for the examined step kinematic parameters. Results: Based on the speed at the final 5 m segment of the test, two groups were identified, the maximum sprint phase (MAX) and the acceleration phase (ACC) group. Speed was significantly (p < 0.05) higher in ACC in the final 5 m segment, while there was a significant (p < 0.05) interrelationship between step length and frequency in ACC but not in MAX. No other differences were observed. Conclusions: The difference observed in the interrelationship between speed and step kinematic parameters between ACC and MAX highlights the importance of identifying the speed development pattern to apply individualized training stimuli for the optimization of training that can lead to better conditioning and wellbeing of children involved in sports with requirements for short-sprint actions.

1. Introduction

Nowadays, children show a decrease in physical activity levels compared to previous decades, while there is an unexpected increase in their screen time [1]. The consequences of this situation are the increase in childhood obesity and the risk of other social disorders [2]. On the other hand, including physical activity in children’s daily routines has been constantly observed to enhance early motor development and overall health [3], including cognitive and emotional parameters [4]. Fundamental motor skills in the earliest developmental stages are running, jumping, and throwing, as they form the foundation for more advanced and specialized skills in a wide range of sports and physical activities [3].
Sprinting is the most favorite form of running among children. As a fundamental locomotor skill [5], it is a key indicator of lower limb strength and anaerobic power [6] and is also characterized by high trainability in early childhood [7]. Also, sprinting, as a type of physical activity, can be associated with physical fitness and health-related factors [8]. For example, symmetry in anatomical markers and their function during childhood are suggested to be related with sprinting ability in adulthood [9]. Also, as a track and field discipline, sprinting is considered a symmetrical sport, despite the lack of evidence that even in unilateral loading disciplines like the long jump, no significant interlimb asymmetry exists in sport relating performance factors [10].
Sprinting refers to the capacity of the human musculoskeletal system to achieve the maximum running velocity while moving forward. Running velocity is a key variable measured in sprinting studies and is crucial for success in many sports [11]. During development, there is a continuous increase in children’s running speed. It is reported that the most rapid improvement in sprint running velocity occurs in untrained children between 7 and 11 years old [12,13,14]. However, this progress is accomplished in a non-linear way [15], as the running velocity is the product of step length and step frequency, which are two biomechanical factors that develop at different rates from childhood to adolescence [16]. Several studies have identified the age period of 9–11 years old as a primary “window of opportunity” for speed development, in which a noticeable improvement in stride frequency is observed [15,17]. Up to this age group, there is a homogeneity in running speed values and their parameters across genders [18]. During the peak height velocity period, children experience an increase in limb length and power, which both contribute to an increased step length during sprinting [19,20]. During puberty, gender differences in running velocity are more obvious as there is a rapid development in sprinting ability in boys, while girls experience a “plateau” in sprinting ability at around 13 years of age [16,17].
In addition to greater leg length, another factor that affects stride length is the greater muscle strength of lower limbs, due to the increasing muscle mass during puberty [16,21]. Two determinants of running velocity are the efficient use of the stretch-shortening cycle and the stiffness of the musculotendinous system. These factors improve significantly during adolescence, enabling athletes to apply greater forces in a shorter contact period with the ground [16,22].
Last, but not least, several studies have shown significant differences in sprint technique between children and adults, due to the lack of high coordination skills and advanced neuromuscular function [23,24]. Firstly, preadolescents usually position their feet further ahead of the center of mass projection, resulting in a longer braking phase and a reduced stride frequency [24,25]. Secondly, children are unable to achieve a complete dynamic extension during the posterior contact phase, leading to a shorter stride [26,27]. Furthermore, children tend to lean their trunk significantly forward, and they sprint with high co-activation levels of agonist and antagonist muscles, both of which are associated with reduced running efficiency and lower sprinting speed [22,28]. Previous research [29,30] has also shown that even among children of similar age, there can be notable differences in how sprint technique develops. These differences are often linked to factors like coordination, strength, and motor skill learning, which progress at different rates from one child to another. For example, some may need to focus on step frequency, others on step length, or overall coordination, depending on how they naturally run. An individualized approach to how sprint technique training is implemented is supported by youth development guidelines in sprinting, where the importance of personalized training to support long-term athletic progress and help prevent injuries is marked [31].
Although shorter ground contact times and longer stride lengths are well-established indicators of superior sprint performance in children, considerable variability in foot strike patterns has also been observed, even among those with similar overall sprint performance [32]. This suggests that while certain biomechanical features are associated with efficient running, individual movement patterns can vary widely without necessarily impacting performance outcomes. Understanding this variability is crucial to designing developmentally appropriate training interventions. It also highlights the need for a more detailed examination of how sprinting mechanics differ among children at various stages of sprint development. Therefore, the purpose of this study was to examine possible differences in the step kinematic parameters and their contribution to sprint speed in the final stage of a short-sprint dash between children who had already reached top speed and those who were still accelerating. By focusing on how children develop sprinting ability within a narrow age and height range, the study aimed to capture variations in step parameters that reflect differences in neuromuscular development rather than growth alone. It was hypothesized that differences exist in both step kinematic parameters and their relationship with running speed between these two groups.

2. Materials and Methods

2.1. Design of the Study

To examine the hypothesis of the study, preadolescent athletes were recruited from local track and field academies. A cross-sectional design was applied to estimate the pattern of speed development in a 15 m short-sprint test. The testing procedure consisted of two maximum 15 m short-sprint dashes, with a 2 min rest interval. Based on the speed progression of the final 5 m segment of the test compared to the previous 5 m segments of the same dash, the participants were divided in the following groups:
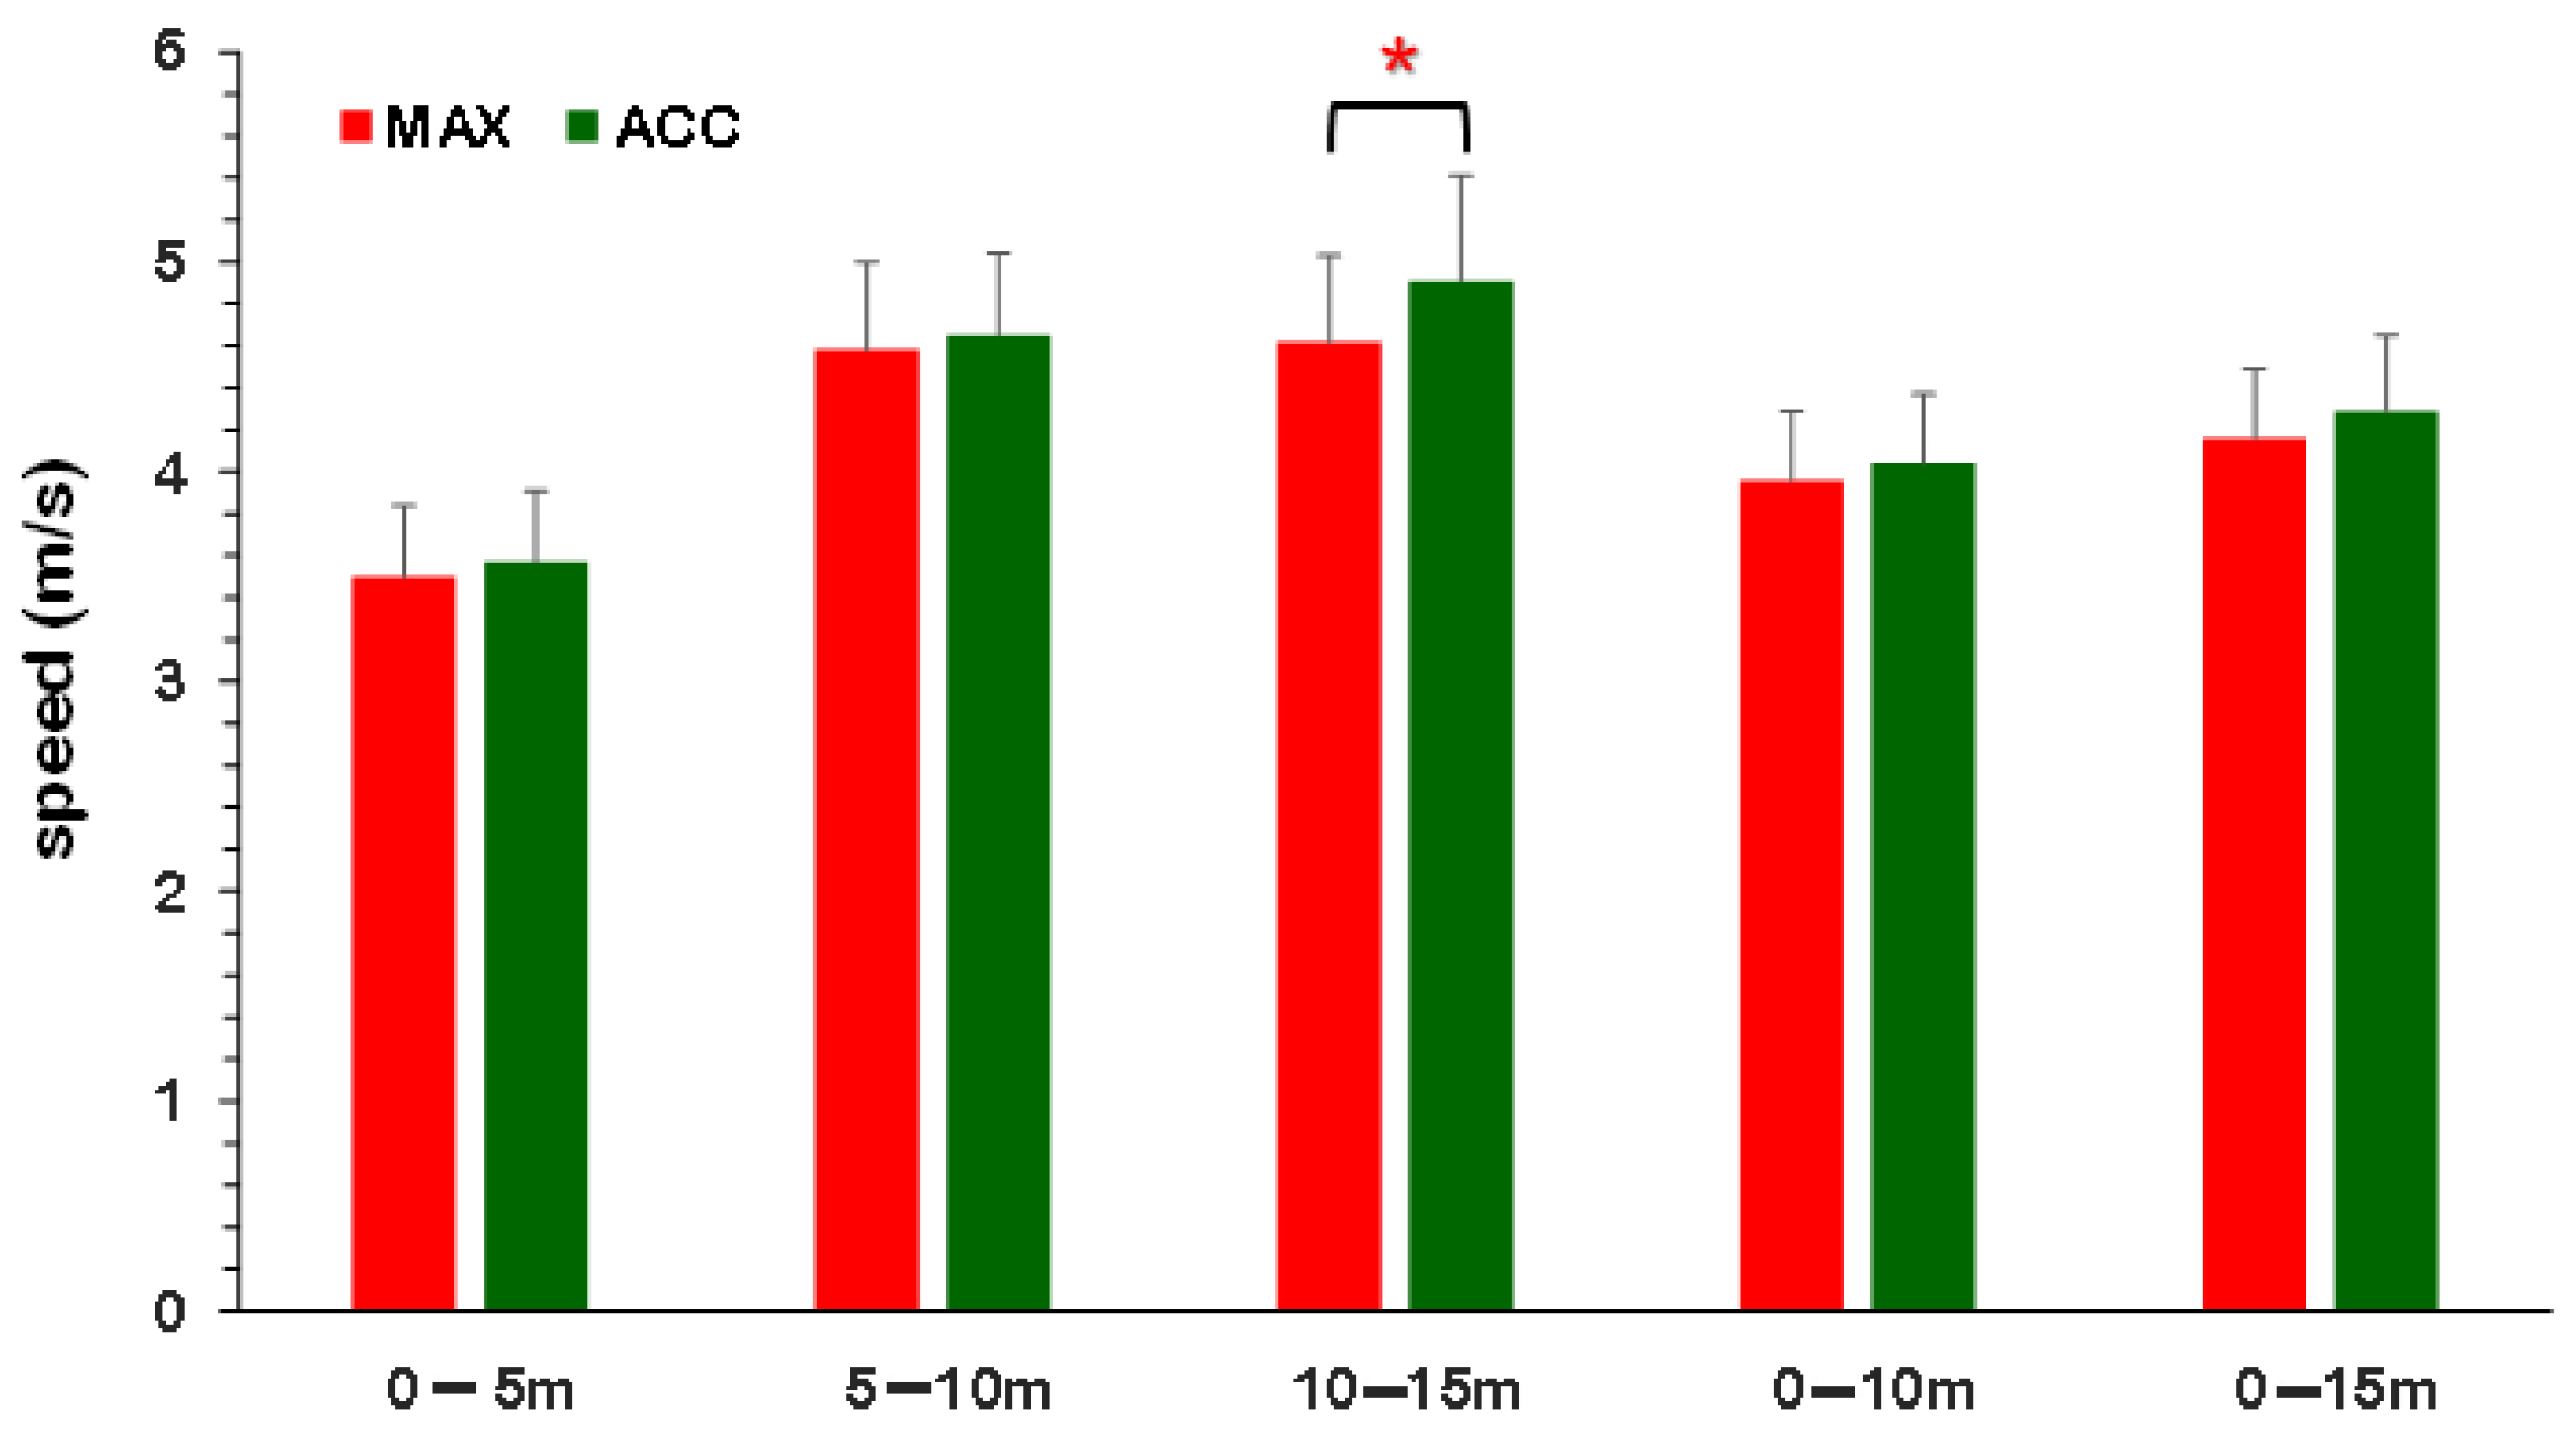
  • maximum sprint phase group (MAX): Children were placed in this group if the time difference between the last 5 m segment and the previous 5 m segment was equal to or less than 0.01 s, indicating that they had likely reached near maximum sprinting speed, and
  • acceleration phase group (ACC): Children were classified in this group if the time difference between the last and the previous 5 m segment was greater than 0.01 s, suggesting that they were still accelerating during the final portion of the sprint.
The selection of the 0.01 s threshold for the final 5 m segment was based on both methodological and practical considerations. First, even minimum differences in split times in short sprints performed by young children can reflect meaningful variations in underlying sprint mechanics, since performance changes in the range of hundredths of a second in prepubescent athletes have shown to be significant due to the relatively short distances and high interindividual variability in this age group [29]. Moreover, this threshold is within timing systems’ sensitivity and reliability, as electronic timing gates, like those used in our study, are typically accurate to within ±0.01 s. Using this value as a cutoff helps ensure that any group differences identified are not due to random variation or measurement errors but reflect real biomechanical differences in sprint phase profiles [33,34]. Finally, a data-driven approach was adopted by examining the distribution of 5 m split times within the examined children and identifying a natural point of divergence in velocity profiles. The 0.01 s criterion allowed us to distinguish two clearly defined groups, those still accelerating (ACC) and those plateauing at near maximal speed (MAX), while maintaining a sufficient sample size and statistical power in each subgroup.

2.2. Participants

Following the invitation to the local track and field academies, 65 prepubescent male and female athletes (33 males and 32 females; 6.9 ± 0.8 years, 1.24 ± 0.07 m, 26.4 ± 5.3 kg, and 17.0 ± 2.4 kg/m2 for age, body height, body mass, and body mass index, respectively) volunteered to participate in this study. This sample size is larger than the minimum number of 52 participants to achieve an effect size of 0.8, power of 0.8, and an a level of 0.05 for the time to conclude the 15 m short-sprint test according to the estimation made using the G*Power v.3.1.9.7 software [35].
Participation was allowed if the inclusion criteria were met, namely the involvement in systemic athletics training twice weekly with a record of 80% participation in the training program; the absence of musculoskeletal injuries and/or disabilities; a good health condition without respiratory, gastrointestinal, cardiovascular, neurological or other disorders; and the provision of signed parental/guardian consent. The study was conducted in accordance with the Declaration of Helsinki, and after acquiring ethical approval from the Research Ethics Committee of the School of Physical Education and Sport Science at Thessaloniki, Aristotle University of Thessaloniki, Greece (approval code: 172/2023–16 November 2023).

2.3. Experimental Design

The testing was conducted on an outdoor track with rubber surface in mild weather conditions during the early evening hours. At first, body height and mass measurements were conducted using a Delmac PS400L scale (Delmac Instruments S.A., Athens, Greece) and a Seca 220 stadiometer (Seca Deutschland, Hamburg, Germany).
Participants then executed a typical warm-up routine of 5 min low-intensity running on the track, followed by 5 min of dynamic stretching, and six sprint warm up drills for 10 m (high and low knee skips, A-skip, scissors, butt-kicks, and backward running). The warm-up routine was concluded with 2 × 10 m sprints.
To minimize fatigue and ensure consistent effort, each participant completed only two 15 m sprint trials, with a standardized rest interval of 2 min between attempts. This rest duration is generally sufficient for full recovery in young children performing short, high-intensity efforts. Although the trial order was not randomized or counterbalanced, all participants were tested under the same conditions. In addition, verbal encouragement and a prior familiarization session were provided to support consistent performance. The fastest trial was selected for analysis, aiding to control for variability in effort or concentration across trials.
A wireless training timer (WITTY System, Microgate, Bolzano, Italy) was used to measure the total 15 m time and the time splits of the 0–5 m, 5–10 m, and 10–15 m segments of the 15 m short-sprint dash. To accomplish this, the starting mat was placed firmly on the track 1 cm behind the start line, while three pairs of photocells were placed at a distance of 5 m, 10 m, and 15 m from the start line. The photocell sensors were fixed on tripods which were placed on each side of the lane where the tests were conducted. The height of the photocells was adjusted to the height of each participant’s pelvis [36].
A digital camera of a Samsung Galaxy S6 smartphone, operating in Full HD 1920 × 1080 px and a sampling frequency of 60 fps, recorded the attempts of the participants in the 10–15 m segment of the short-sprint test. The camera was stabilized on a 1 m high fixed tripod which was placed 12.5 m from the start line and 7.3 m laterally from the center of the testing lane. Custom 0.05 × 0.05 markers were placed along the lines marking the testing lane, thus creating 1.00 m × 1.21 m zones. All trials were recorded, but only the fastest trial from each participant was selected for further analysis to extract the step length (namely, the horizontal distance between the toes of the feet in two consecutive stance phases), step frequency (=1/time elapsed between two consecutive take-offs), and step velocity (the product of step length × step frequency). The extraction of step length and step frequency was performed utilizing the Kinovea 2023.1.1 software (Copyright © 2023—Joan Charmant and contributors).
The magnitude of the interlimb asymmetry in the step kinematic parameters was conducted using the absolute symmetry angle values [37]. The symmetry angle was calculated following Zifchock et al. [38] (Equation (1)).
s y m m e t r y   a n g l e = 4 5 ο arctan right   leg left   leg 9 0 ο × 100 %
In the case that the condition described in Equation (2) was evident:
4 5 ο arctan right   leg left   leg > 9 0 o
then Equation (1) was replaced by Equation (3):
s y m m e t r y   a n g l e = 4 5 ο arctan right   leg left   leg 18 0 ο 9 0 ο × 100 %

2.4. Statistical Analysis

The intra-test reliability of the short-sprint dash was examined with the intraclass correlation coefficient (ICC) using the recorded performance (time). ICC values were considered low, moderate, good, and excellent reliability in the case of ICC < 0.5, 0.5 < ICC < 0.75, 0.75 < ICC < 0.9, and ICC > 0.9, respectively [39]. The 95% confidence interval (CI) values for the ICC was also provided. Data were checked for normality with the Shapiro–Wilk test (p > 0.05). The independent samples T-test was run to examine the possible differences between MAX and ACC. A Bonferroni correction was applied to mitigate the risk of Type I error. The magnitude of the effect size was assessed using the Hedges’ g and was interpreted as small (g < 0.2), moderate (0.2 ≤ g < 0.8), and large (g ≥ 0.8). To examine the linear relationship between step length and step frequency while controlling for speed in the final 5 m segment of the short-sprint dash, the partial correlation test was performed. The level of statistical significance for all tests was set at a = 0.05. All statistical analyses were performed using the IBM SPSS Statistics v.28 software (ΙΒΜ Corp., Armonk, NY, USA).

3. Results

For the entire sample, the examination of the test–retest reliability revealed excellent reliability (ICC = 0.949 [95%IC = 0.912, 0.971]). Following the examination of the photocell data, 28 participants formed the MAX group (9 males, 19 females), whereas 37 were indexed in the ACC group (24 males, 13 females). The test–retest reliability was excellent for MAX (ICC = 0.943 [95%IC = 0.878, 0.974]) and ACC (ICC = 0.929 [95%IC = 0.836, 0.969]).
Table 1 presents their anthropometric data. No significant (p > 0.05) differences were found for age, body height, body mass, and body mass index.
Table 2 depicts performance (time) as recorded in the 5 m segments of the short sprinting tests. The groups were significantly (p < 0.05) different in the last (10–15 m) 5 m segment of the race, where MAX ran this segment 0.07 s slower than ACC. No significant (p > 0.05) time differences were observed for the first and second 5 m segment, nor for the overall 15 m time or the 0–10 m split.
Figure 1 shows the sprinting speed of the examined segments of the short-sprint test. In the last 5 m segment of the race (10–15 m), ACC were significantly (p < 0.05) faster than MAX. No significant (p > 0.05) speed differences were observed for the first and second 5 m segments, nor the average speed in the 15 m dash or at the 0–10 m split.
Table 3 presents the results for step length. No significant (p > 0.05) differences were found between MAX and ACC.
Table 4 depicts the results for step frequency. No significant (p > 0.05) differences were found between MAX and ACC.
Table 5 shows the results for step velocity. No significant (p > 0.05) differences were found between MAX and ACC.
Figure 2 depicts the results of the partial correlation analysis. In the MAX group, sprint speed during the 10–15 m segment was strongly and significantly related to step length (p < 0.001), meaning that faster children in this group tended to take longer steps. In the ACC group, sprint speed during the same final 5 m segment was also significantly related to step length (p < 0.001). However, in this group, step length and step frequency were negatively correlated (p = 0.001), suggesting that longer step lengths were generally associated with lower step frequencies.

4. Discussion

The hypothesis of the study was that children would exhibit different sprint step kinematic patterns depending on whether they had reached maximum speed or were still accelerating during the final phase of a 15 m sprint. This hypothesis was partly confirmed, as although overall sprint time (performance) did not differ between groups, two distinct sprint profiles were identified: One group had already reached top speed during the final 5 m segment (MAX group), while the other was still in the acceleration phase (ACC group). Interestingly, no significant differences were observed in the individual step kinematic parameters between the groups. However, while both groups showed a positive relationship between speed and step length, only the ACC group displayed a significant correlation between step length and step frequency, suggesting a distinct coordination pattern that was not evident in the MAX group.
Based on scientific evidence, every typical or competitive sprinting event displays a typical running velocity development pattern, which is divided into three main phases: the acceleration phase, the maximum velocity phase, and the deceleration phase [23]. Furthermore, the acceleration phase is commonly analyzed in the primary and secondary acceleration phase, with the biggest increase in the running velocity to be accomplished in the earliest stages (primary phase) [40,41]. Regarding the acceleration phase, its total duration is quite short in prepubescents. In particular, the secondary acceleration phase is quite difficult to be achieved [22]. This phase is completed at the distance of 20 to 30 m, when children achieve their maximum velocity [42]. Their maximum velocity values are also significantly lower than adolescents or adults [43]. The examined children reached similar sprint outcomes using different speed progression patterns. Some were found to continue accelerating longer, while others reached their top speed earlier. This suggests that these children did not sprint in the same manner. Rather, they relied on different movement and speed progression patterns that could be a result of their motor development stage. Past research [32] found that children had different foot strike patterns when running, yet their performance did not differ significantly. The authors concluded that young athletes often use varied techniques to achieve similar results, likely because they are still developing coordination and motor control. Thus, the differences found in the present study were not reflected in sprint time but were revealed as alternative speed progression patterns. This finding may be interpreted as the existence of different stages of neuromuscular development or motor learning in a cohort of children that were about the same age and size.
Sprint running velocity, from a biomechanical perspective, is defined as the product of two kinematic factors, step frequency and step length [44]. To achieve maximum velocity is important to optimize the step frequency and step length ratio [40,45]. Running with the individual balanced step frequency to step length ratio can also contribute to maintaining the maximum velocity longer [46]. This ratio exhibits great variations during a sprinting event, while the step frequency and step length values differentiate during the process of children development [40,47].
During a sprinting task, step frequency peaks in the acceleration phase and is maintained through the maximum sprint velocity phase, whereas the maximum contribution of step length for the achievement of peak sprint velocity is noted in the maximum velocity phase [48]. Further increases in maximum sprint velocity cannot be achieved by simultaneously maximizing both step length and step frequency, as a negative interaction exists between step length and step frequency [49]. Furthermore, there is no consensus in the literature on whether step length or step frequency is the primary contributor to achieving peak sprinting velocity. Past research has suggested that the contribution of both step kinematic parameters is highly individualized [50]. Previous studies often emphasize either step length [48,49,51,52,53,54] or step frequency [23,55,56,57,58,59,60] as the main contributor to top sprint speed, though findings across the literature remain mixed.
The extent of the acceleration and the maximum speed phase differs among athletes and appears to be related to the level of performance level [40,61]. It is suggested that top sprinters will first increase step length during the segment of the sprint dash, where speed is at a submaximal level, and in which they put in effort to increase speed, followed by an increase in step frequency in their effort to attain peak sprinting speeds [62,63]. On the other hand, children rely more on step frequency at peak sprinting velocity because of their lower musculotendinous stiffness and their decreased ability to apply high rates of force development during the stretch-shortening cycle [20]. An additional factor that may have contributed to the prolonged acceleration phase observed in the children comprising the ACC group is the reliance on sensory feedback mechanisms for step regulation. Given the developmental stage of the participants, it is possible that children who had not yet reached maximum sprint velocity were depending more heavily on reactive adjustments based on proprioceptive or visual input rather than anticipatory or feedforward control strategies. This reliance on real-time feedback may lead to a greater step-by-step inconsistency regarding the step kinematic parameters and thus a delayed transition into the maximum velocity phase. Such a pattern is consistent with motor control theories, which suggest that younger or less experienced individuals depend more on feedback-based adjustments as their neuromuscular coordination is still developing [64]. Future studies incorporating sensory motor assessments could help clarify the extent to which feedback control influences sprint profiles in youth populations.
In this study, step length was significantly related to sprint velocity. However, in the ACC group, sprint velocity was correlated with step length, which was, in turn, negatively related to step frequency. This negative relationship suggests that the children in the ACC group had not reached the margin where an optimal balance between step length and step frequency is required to maintain maximum velocity. As a result, they were able to elongate the acceleration phase, which may have enabled them to reach higher sprint velocities over longer sprint distances. The significant correlation between step length and step frequency observed in the ACC group may reflect aspects of developing coordination rather than an optimized sprint strategy. According to Bernstein’s theory of motor control [65], early skill acquisition is characterized by the gradual release and integration of redundant degrees of freedom. In this context, the interdependence between step length and frequency could suggest that these children are still in the process of refining their neuromuscular control, relying on more rigid or compensatory movement patterns to maintain sprint performance. This is supported by past research indicating that children and novice movers often exhibit more tightly coupled movement parameters as a strategy to stabilize emerging skills [66]. Therefore, the step kinematic relationships revealed in the ACC group might reflect coordination immaturity or transitional motor strategies commonly observed in developing athletes. Recognizing these patterns can help guide targeted coaching approaches that support progression toward a more independent and efficient control of gait parameters.
In the period before reaching peak height velocity, children appear to rely more on higher step frequency during the maximum velocity phase [16,22]. On the contrary, during the mid- and post- peak height velocity period, there is no evidence for significant improvement in the step frequency rates [67], while other researchers report a decrease in step frequency caused by the increased inertia of longer legs [68]. That might be the reason that researchers consider the step frequency as an age-independent factor [40]. On the other hand, step length is considered a maturity-related factor [40]. Step length is related to both anthropometric characteristics and the ability to generate high force during contact with the ground [22]. More precisely, the leg length increases rapidly during the peak height velocity period and so does the step length. From this stage onwards, athletes rely more on their step length to achieve maximum running velocity [16,22,45,69]. Additionally, the neuromuscular adaptations, which come with the maturation process, enable the implementation of greater forces [47] in briefer ground contacts and the maximization of the step length [70]. The relationship between power production ability and sprinting is evident in pre-school children [71]. Increased sprint performance in children is related to increased power and a force–velocity profile oriented to speed rather than strength [72]. This also applies to sprint acceleration performance [73].
In agreement with past findings, no significant asymmetries were observed [43]. The magnitude of asymmetry in the examined step kinematic parameters was low (range: 0–6.4%). This range is smaller than those reported in the past [43,74]. In general, past research found that sprint performance is not related to asymmetry [37,75,76] and that asymmetry is not differentiated through development [43]. It is suggested that although the mechanisms responsible for the function of the lower extremities in children are regulated differently in each leg, similar kinematics are exhibited when observing both legs as an entity [77]. The low asymmetry observed in the children’s step kinematics likely reflects their stage of motor development, rather than a sign of biomechanical efficiency. At a young age, it is common for children to show high movement variability and limited limb dominance, as their coordination patterns are still maturing [78]. Thus, rather than interpreting these low asymmetry values as an indicator of refined technique or efficiency, it might be viewed as a sign that the children are still developing consistent motor patterns. This is an important point to keep in mind, especially when comparing youth data to adult models of sprint performance, where symmetry is often linked to optimization.
In this study, children in the MAX group achieved their maximal velocity within the 15 m dash, whereas those in the ACC group were still in the acceleration phase. Considering that participants were within the age range (under 8.8 years) previously identified [79] as a period of rapid sprinting development, it is reasonable to assume that this progression probably follows an individualized developmental trajectory. Motor development and learning typically involve a gradual increase in movement consistency over time [80]. However, as previously mentioned [81], stride dynamics are not yet fully mature in many young children, even at age seven. Consequently, running mechanics in early childhood are often characterized by greater variability [82]. Age-related improvements in sprinting performance can generally be attributed to advancements in coordination, balance, and motor control [83]. Additionally, physical growth and maturation, including the growth and functional adaptation of the lower limbs, contributes to enhanced torque and force production capacity, which are also essential for sprinting. Importantly, these developmental factors can be significantly influenced by a child’s prior motor experiences, whether through unstructured play or organized sports participation [84]. Such experiences support neuromuscular and biomechanical refinement, helping explain performance differences between children of the same chronological age. This variation may also account for the differences seen between the MAX and ACC groups in the present study.
The variation in the speed progression patterns revealed in the present study, with some children still accelerating and others reaching maximum speed within the 15 m dash, can be understood through the views of the Dynamic Systems Theory, which posits that each child’s sprint pattern emerges from the dynamic interaction of individual, task, and environmental constraints [85]. Individual differences highlight the self-organizing nature of motor behavior, where each child adapts their movement strategy to optimize performance within their unique set of constraints. Furthermore, in early childhood, the neuromuscular system is still maturing. Although corticospinal pathways show structural development by around 7 years of age [86], motor unit recruitment, rapid pre-activation, and reduced coactivation continue to develop over subsequent years [87,88]. These factors can limit a child’s ability to generate and regulate rapid force during stretch-shortening actions like sprinting, potentially explaining why some children fail to accelerate vigorously.
The observation that children in the ACC group were still accelerating at 15 m raises important questions about what might be limiting the entry in the peak velocity phase. Although this study did not directly assess neuromuscular or joint-level mechanics, the existing literature offers several possible explanations. These children may be demonstrating immature patterns of force application [71], reduced concentric strength during stretch-shortening cycle actions [89], or limited neuromuscular capacity, all of which continue to develop in this age group [90]. Lower limb stiffness, which affects contact time and stretch-shortening cycle effectiveness [70], may also contribute to a longer acceleration phase [91]. Rather than deficiencies, these may reflect expected developmental stages in sprint motor learning. Furthermore, our findings indicate that acceleration deficits may be indicative of compromised neuromuscular control and poor movement efficiency, which could correlate with a differential risk of lower extremity overuse or acute injuries. Understanding these profiles is essential for developing targeted interventions that mitigate injury risk. Recent studies, such as the one examining the impact of sensor–axis combinations on activity recognition accuracy, underscore the value of using accelerometer data to identify movement patterns in clinical settings [92]. The present study demonstrates that even minimal data requirements can yield high accuracy in recognizing specific activities, which could be applied to monitor patients’ movement efficiency during rehabilitation. By integrating these insights, we can better understand how varying movement profiles relate to injury susceptibility and enhance our training and rehabilitation approaches.
The present study is not free of limitations. The data acquisition of the step kinematic data was conducted with a sampling frequency of 60 fps. Although the measurement of step frequency via a video analysis method could also be possibly affected by the rater [93], the sampling frequency of the present experimental set up is inferior compared to other methodological approaches to examine step frequency in other sprint running studies [59]. Nevertheless, step frequency is significantly lower in preadolescents compared to adult athletes [22]. Thus, the lower sampling frequency used in this study might not be of importance relating to the validity of the findings. In addition, the use of photocells to measure speed at each 5 m segment is not adequate to pinpointing the exact distance where peak sprinting velocity was achieved. Future research on the topic should include proper instrumentation for the accurate determination of the acceleration and maximum sprint phases that could aid in the identification of the athlete’s individual speed progression pattern and reliance on step length or step frequency when achieving peak sprinting velocity. Furthermore, it is also acknowledged that averaging step parameters over 5 m segments may overlook important timing details within the stride. An event-based approach, especially aligned to gait events like foot-strike or toe-off, could provide more precise insights into motor timing and coordination. While this method was chosen for its practicality in a field setting with young children, future studies should consider stride-normalized analyses to better capture developmental aspects of sprint mechanics. Finally, this study focused exclusively on spatiotemporal parameters, namely step length, frequency, and velocity, and did not include analysis of joint angles, limb trajectories, or posture control. As a result, deeper biomechanical and neuromuscular mechanisms underlying sprint performance could not be explored. Future studies incorporating joint-level kinematics and coordination measures are needed to better understand the movement strategies underlying different sprint profiles in children. Nevertheless, the information regarding the examined step kinematic parameters is useful, given the increased use of inertial sensors for measuring running step kinematics.
Although our study focused on group averages, important within-group variability likely exists, especially in developing children. Movement variability is key for motor flexibility, adaptability, and injury resilience [85,94]. Future research should explore this variability to better understand individual sprint strategies and their role in development and injury prevention. To summarize, the present findings suggest that, even among children of similar age and performance levels, differences in speed progression profiles may reflect distinct underlying movement strategies. This highlights the potential for individualized coaching approaches focused on coordination, step frequency, or strength. However, we acknowledge that our proposal remains conceptual without a defined framework or progression model. Thus, this study can be viewed as a first step toward identifying such profiles, and future research should be encouraged to establish validated thresholds and longitudinal progression strategies to guide practical applications in youth sprint training.

5. Conclusions

In this study, two distinct patterns of speed development within a 15 m short-sprint test in children were noted that did not affect performance and were not accompanied with differences in step kinematic parameters. Despite the positive relationship between speed development and step length, a difference between the patterns was revealed relating to the interrelationship between step length and step frequency that was found in children who were still accelerating in the terminal segment of the short-sprint test. This finding highlights the importance of identifying the speed development pattern to apply individualized training stimuli to optimize training in children. This is because in the context of youth athletic development, the monitoring of speed progression patterns, rather than checking the average speed or time alone, can reveal subtle but meaningful variations in sprint mechanics, as a child who reaches top speed early may rely more on step frequency and coordination, while another who is still accelerating may be depending more on power or strength. These distinctions are essential in terms of promoting each child’s individual progression, and understanding the different speed progression patterns could aid in applying personalized and effective coaching. In addition, although video analysis was used in this study to assess sprint step characteristics, future work could adapt this framework for real-time use with wearable sensors. Devices such as IMUs or smart insoles could allow coaches to monitor step length, step frequency, and acceleration patterns during short dash sprints in children. With further validation, this approach could support more personalized coaching by identifying speed progression profiles in relation with step kinematics in real time, making training both more responsive and developmentally appropriate for young athletes. The above can eventually result in better conditioning and wellbeing of children involved in sports with requirements for short-sprint actions.

Author Contributions

Conceptualization, I.K., V.P. and E.B.; methodology, V.P. and E.B.; software, V.P.; validation, I.K., V.P. and E.B.; formal analysis, I.K., V.P. and E.B.; investigation, I.K., V.P., E.M., S.L. and E.B.; resources, V.P., E.M., S.L. and E.B.; data curation, I.K. and V.P.; writing—original draft preparation, I.K. and V.P.; writing—review and editing, I.K., V.P. and E.B.; visualization, I.K., V.P. and E.B.; supervision, V.P. and E.B.; project administration, V.P. and E.B. All authors have read and agreed to the published version of the manuscript.

Funding

This research received no external funding.

Institutional Review Board Statement

The study was conducted in accordance with the Declaration of Helsinki and approved by the Research Ethics Committee of the School of Physical Education and Sport Science at Thessaloniki, Aristotle University of Thessaloniki, Greece (approval code: 172/2023–16 November 2023).

Informed Consent Statement

Informed parental consent was obtained from all subjects involved in the study.

Data Availability Statement

The data presented in this study are available on request from the corresponding authors due to ethical reasons.

Conflicts of Interest

The authors declare no conflicts of interest.

Abbreviations

The following abbreviations are used in this manuscript:
ACCacceleration phase group
MAXmaximum sprint phase group

References

  1. Venetsanou, F.; Emmanouilidou, K.; Kouli, O.; Bebetsos, E.; Comoutos, N.; Kambas, A. Physical activity and sedentary behaviors of young children: Trends from 2009 to 2018. Int. J. Environ. Res. Public Health 2020, 17, 1645. [Google Scholar] [CrossRef]
  2. Greule, C.; Sudeck, G.; Thiel, A.; Kastner, L.; Janssen, P.; Niess, A.; Rapp, F.; Junne, F.; Krauss, I. Correlates of physical activity enjoyment in children and adolescents for a new perspective on the treatment of overweight: A systematic literature review. Obes. Rev. 2024, 25, e13655. [Google Scholar] [CrossRef]
  3. Ghanamah, R. The Impact of Physical Activity and Screen Time on Motor Creativity in Kindergarteners. Children 2025, 12, 116. [Google Scholar] [CrossRef] [PubMed]
  4. Criado, E.G.; Giménez-Meseguer, J.; Ferriz-Valero, A.; Baena-Morales, S. Influence of physical activity on cognitive and emotional development in preschool children. A review of the literature. Education 2025, 53, 366–377. [Google Scholar] [CrossRef]
  5. Logan, S.W.; Webster, E.K.; Getchell, N.; Pfeiffer, K.A.; Robinson, L.E. Relationship Between Fundamental Motor Skill Competence and Physical Activity During Childhood and Adolescence: A Systematic Review. Kinesiol. Rev. 2015, 4, 416–426. [Google Scholar] [CrossRef]
  6. Sudlow, A.; Galantine, P.; Del Sordo, G.; Raymond, J.J.; Dalleau, G.; Peyrot, N.; Duché, P. Influence of growth, maturation, and sex on maximal power, force, and velocity during overground sprinting. J. Strength Cond. Res. 2024, 38, 491–500. [Google Scholar] [CrossRef]
  7. Logan, S.W.; Robinson, L.E.; Wilson, A.E.; Lucas, W.A. Getting the fundamentals of movement: A meta-analysis of the effectiveness of motor skill interventions in children. Child Care Health Dev. 2012, 38, 305–315. [Google Scholar] [CrossRef]
  8. Miguel-Etayo, D.; Gracia-Marco, L.; Ortega, F.B.; Intemann, T.; Foraita, R.; Lissner, L.; Oja, L.; Barba, G.; Michels, N.; Tornaritis, M.; et al. Physical fitness reference standards in European children: The IDEFICS study. Int. J. Obes. 2014, 38, S57–S66. [Google Scholar] [CrossRef]
  9. Trivers, R.; Palestis, B.G.; Manning, J.T. The symmetry of children’s knees is linked to their adult sprinting speed and their willingness to sprint in a long-term Jamaican study. PLoS ONE 2013, 8, e72244. [Google Scholar] [CrossRef]
  10. Chaitidou, V.; Panoutsakopoulos, V. Long jump performance is not related to inter-limb asymmetry in force application in isometric and vertical jump tests. Biomechanics 2023, 3, 389–400. [Google Scholar] [CrossRef]
  11. Haugen, T.A.; Tønnessen, E.; Hisdal, J.; Seiler, S. The role and development of sprinting speed in soccer. Int. J. Sports Physiol. Perform. 2014, 9, 432–441. [Google Scholar] [CrossRef]
  12. Branta, C.; Haubenstricker, J.; Seefeldt, V. Age changes in motor skills during childhood and adolescence. Exerc. Sport Sci. Rev. 1984, 12, 467–520. [Google Scholar] [CrossRef]
  13. Loko, J.; Aule, R.; Sikkut, T. Dynamics of Estonian adolescents physical abilities. Acta Acad. Olymp. Est. 1994, 2, 102–114. [Google Scholar]
  14. Viru, A.; Loko, J.; Harro, M.; Volver, A.; Laaneotsm, L.; Viru, M. Critical periods in the development of performance capacity during childhood and adolescence. Eur. J. Phys. Educ. 1999, 4, 75–119. [Google Scholar] [CrossRef]
  15. Meyers, R.W.; Oliver, J.L.; Hughes, M.G.; Cronin, J.B.; Lloyd, R.S. Maximal sprint speed in boys of increasing maturity. Pediatr. Exerc. Sci. 2015, 27, 85–94. [Google Scholar] [CrossRef] [PubMed]
  16. Talukdar, K.; Harrison, C.; McGuigan, M. Natural development of sprint speed in girls and boys: A narrative review. J. Sport Exerc. Sci. 2022, 6, 153–161. [Google Scholar] [CrossRef]
  17. Papaiakovou, G.; Giannakos, A.; Michailidis, C.; Patikas, D.; Bassa, E.; Kalopisis, V.; Anthrakidis, N.; Kotzamanidis, C. The effect of chronological age and gender on the development of sprint performance during childhood and puberty. J. Strength Cond. Res. 2009, 23, 2568–2573. [Google Scholar] [CrossRef] [PubMed]
  18. Jakovljević, V.; Ljubojević, A.; Karalić, T.; Gerdijan, N.; Vukić, Ž.; Pašić, G. Sprinting speed of prepubertal girls and boys. Exerc. Qual. Life 2013, 5, 20–27. [Google Scholar] [CrossRef]
  19. Colyer, S.L.; Nagahara, R.; Takai, Y.; Salo, A.I.T. The effect of biological maturity status on ground reaction force production during sprinting. Scand. J. Med. Sci. Sports 2020, 30, 1387–1397. [Google Scholar] [CrossRef]
  20. Rumpf, M.C.; Cronin, J.B.; Oliver, J.L.; Hughes, M.G. Vertical and leg stiffness and stretch-shortening cycle changes across maturation during maximal sprint running. Hum. Mov. Sci. 2013, 32, 668–676. [Google Scholar] [CrossRef]
  21. Sudlow, A.; Galantine, P.; Vercruyssen, F.; Peyrot, N.; Raymond, J.J.; Duché, P. Which factors influence running gait in children and adolescents? A narrative review. Int. J. Environ. Res. Public Health 2023, 20, 4621. [Google Scholar] [CrossRef]
  22. Chatzilazaridis, I.; Panoutsakopoulos, V.; Bassa, E.; Kotzamanidou, M.C.; Papaiakovou, G.I. Effects of Age and Sex on the Kinematics of the Sprinting Technique in the Maximum Velocity Phase. Appl. Sci. 2024, 14, 6057. [Google Scholar] [CrossRef]
  23. Mero, A.; Komi, P.V.; Gregor, R.J. Biomechanics of sprinting running. Sports Med. 1992, 13, 376–392. [Google Scholar] [CrossRef] [PubMed]
  24. Ross, A.; Leveritt, M.; Riek, S. Neural influences on sprint running: Training adaptations and acute responses. Sports Med. 2001, 31, 409–425. [Google Scholar] [CrossRef] [PubMed]
  25. Martín-Fuentes, I.; Van den Tillaar, R. Relationship between step-by-step foot kinematics and sprint performance. Int. J. Environ. Res. Public Health 2022, 19, 6786. [Google Scholar] [CrossRef] [PubMed]
  26. Wei, R.X.; Chan, Z.Y.; Zhang, J.H.; Shum, G.L.; Chen, C.Y.; Cheung, R.T. Difference in the running biomechanics between preschoolers and adults. Braz. J. Phys. Ther. 2021, 25, 162–167. [Google Scholar] [CrossRef]
  27. Wdowski, M.M.; Noon, M.; Mundy, P.D.; Gittoes, M.J.; Duncan, M.J. The kinematic and kinetic development of sprinting and countermovement jump performance in boys. Front. Bioeng. Biotechnol. 2020, 8, 547075. [Google Scholar] [CrossRef]
  28. Lloyd, R.S.; Oliver, J.L.; Radnor, J.M.; Rhodes, B.C.; Faigenbaum, A.D.; Myer, G.D. Relationships between functional movement screen scores, maturation and physical performance in young soccer players. J. Sports Sci. 2015, 33, 11–19. [Google Scholar] [CrossRef]
  29. Meyers, R.W.; Oliver, J.L.; Hughes, M.G.; Lloyd, R.S.; Cronin, J.B. Influence of Age, Maturity, and Body Size on the Spatiotemporal Determinants of Maximal Sprint Speed in Boys. J. Strength Cond. Res. 2017, 31, 1009–1016. [Google Scholar] [CrossRef]
  30. Lloyd, R.S.; Oliver, J.L.; Faigenbaum, A.D.; Howard, R.; De Ste Croix, M.B.; Williams, C.A.; Best, T.M.; Alvar, B.A.; Micheli, L.J.; Thomas, D.P.; et al. Long-term athletic development—Part 1: A pathway for all youth. J. Strength Cond. Res. 2015, 29, 1439–1450. [Google Scholar] [CrossRef]
  31. Panoutsakopoulos, V. Development and Sprint Training. In Child, Training, Health, 1st ed.; Kotzamanidis, C., Ed.; Kyriakidis Bros Publishers S.A.: Thessaloniki, Greece, 2020; pp. 185–214. [Google Scholar]
  32. Williams, S.; Netto, K.; Kennedy, R.; Turner-Bryndzej, J.; Campbell, R.; Rosalie, S.M. Biomechanical correlates of running performance in active children. J. Sci. Med. Sport 2019, 22, 65–69. [Google Scholar] [CrossRef]
  33. Brown, T.D.; Vescovi, J.D.; Vanheest, J.L. Assessment of linear sprinting performance: A theoretical paradigm. J. Sports Sci. Med. 2004, 3, 203–210. [Google Scholar] [PubMed]
  34. Haugen, T.; Buchheit, M. Sprint running performance monitoring: Methodological and practical considerations. Sports Med. 2016, 46, 641–656. [Google Scholar] [CrossRef] [PubMed]
  35. Faul, F.; Erdfelder, E.; Lang, A.G.; Buchner, A. G* Power 3: A flexible statistical power analysis program for the social, behavioral, and biomedical sciences. Behav. Res. Methods 2007, 39, 175–191. [Google Scholar] [CrossRef] [PubMed]
  36. Yeadon, M.R.; Kato, T.; Kerwin, D.G. Measuring running speed using photocells. J. Sports Sci. 1999, 17, 249–257. [Google Scholar] [CrossRef]
  37. Exell, T.A.; Gittoes, M.J.; Irwin, G.; Kerwin, D.G. Gait asymmetry: Composite scores for mechanical analyses of sprint running. J. Biomech. 2012, 45, 1108–1111. [Google Scholar] [CrossRef]
  38. Zifchock, R.A.; Davis, I.; Higginson, J.; Royer, T. The symmetry angle: A novel, robust method of quantifying asymmetry. Gait Posture 2008, 27, 622–627. [Google Scholar] [CrossRef]
  39. Koo, T.K.; Li, M.Y. A guideline of selecting and reporting Intraclass Correlation Coefficients for reliability research. J. Chiropr. Med. 2016, 15, 155–163. [Google Scholar] [CrossRef]
  40. Chatzilazaridis, I.; Panoutsakopoulos, V.; Papaiakovou, G. Stride characteristics progress in a 40-m sprinting test executed by male preadolescent, adolescent and adult athletes. J. Biol. Exerc. 2012, 8, 58–77. [Google Scholar] [CrossRef]
  41. Graubner, R.; Nixdorf, E. Biomechanical analysis of the sprint and hurdles events at the 2009 IAAF World Championships in Athletics. New Stud. Athl. 2011, 26, 19–53. [Google Scholar]
  42. Kotzamanidis, C. The effect of sprint training on running performance and vertical jumping in pre-adolescent boys. J. Hum. Mov. Stud. 2003, 44, 225–240. [Google Scholar]
  43. Meyers, R.W.; Oliver, J.L.; Hughes, M.G.; Lloyd, R.S.; Cronin, J.B. Asymmetry during maximal sprint performance in 11-to 16-year-old boys. Pediatr. Exerc. Sci. 2017, 29, 94–102. [Google Scholar] [CrossRef] [PubMed]
  44. Hay, J.G. The Biomechanics of Sports Techniques, 3rd ed.; Prentice-Hall: Englewood Cliffs, NJ, USA, 1985. [Google Scholar]
  45. Mattes, K.; Wolff, S.; Alizadeh, S. Kinematic stride characteristics of maximal sprint running of elite sprinters–verification of the “swing-pull technique”. J. Hum. Kinet. 2021, 77, 15–24. [Google Scholar] [CrossRef] [PubMed]
  46. Moura, T.B.M.A.; Leme, J.C.; Nakamura, F.Y.; Cardoso, J.R.; Moura, F.A. Determinant biomechanical variables for each sprint phase performance in track and field: A systematic review. Int. J. Sports Sci. Coach. 2024, 19, 488–509. [Google Scholar] [CrossRef]
  47. Rumpf, M.C.; Cronin, J.B.; Oliver, J.; Hughes, M. Kinematics and Kinetics of Maximum Running Speed in Youth Across Maturity. Pediatr. Exerc. Sci. 2015, 27, 277–284. [Google Scholar] [CrossRef]
  48. Ito, A.; Ishikawa, M.; Isolehto, J.; Komi, P.V. Changes in the step width, step length, and step frequency of the world’s top sprinters during the 100 metres. New Stud. Athl. 2006, 21, 35–39. [Google Scholar]
  49. Hunter, J.P.; Marshall, R.N.; McNair, P.J. Interaction of step length and step rate during sprint running. Med. Sci. Sports Exerc. 2004, 36, 261–271. [Google Scholar] [CrossRef]
  50. Salo, A.I.; Bezodis, I.N.; Batterham, A.M.; Kerwin, D.G. Elite sprinting: Are athletes individually step-frequency or step-length reliant? Med. Sci. Sports Exerc. 2011, 43, 1055–1062. [Google Scholar] [CrossRef]
  51. Brughelli, M.; Cronin, J.; Chaouachi, A. Effects of running velocity on running kinetics and kinematics. J. Strength Cond. Res. 2011, 25, 933–939. [Google Scholar] [CrossRef]
  52. Kumar, H. Age changes in the speed of running during 30 meter sprint running. J. Exerc. Sci. Physiother. 2006, 2, 92–95. [Google Scholar]
  53. Paruzel–Dyja, M.; Iskra, J.; Zajac, A. Somatic and fitness endowment of sprinting stride in the context of developmental changes and diverse sport activities. J. Hum. Kinet. 2007, 18, 109–120. [Google Scholar]
  54. Paruzel-Dyja, M.; Walaszczyk, A.; Iskra, J. Elite male and female sprinters’ body build, stride length and stride frequency. Stud. Phys. Cult. Tour. 2006, 13, 33–37. [Google Scholar]
  55. Bissas, A.I.; Havenetidis, K. The use of various strength-power tests as predictors of sprint running performance. J. Sports Med. Phys. Fit. 2008, 48, 49–54. [Google Scholar]
  56. Coh, M.; Skof, B.; Kugovnik, O.; Dolenec, A.; Kampmiller, T.; Laczo, E.; Holcek, R.; Selinger, P. Kinematic and dynamic characteristics of maximal speed in young sprinters. Kinesiol. Slov. 1995, 2, 5–10. [Google Scholar]
  57. Hay, J.G. Cycle Rate, Length, and Speed of Progression in Human Locomotion. J. Appl. Biomech. 2002, 18, 257–270. [Google Scholar] [CrossRef]
  58. Mackala, K.; Mero, A. A Kinematics Analysis οf Three Best 100 m Performances Ever. J. Hum. Kinet. 2013, 36, 149–160. [Google Scholar] [CrossRef]
  59. Monte, A.; Muollo, V.; Nardello, F.; Zamparo, P. Sprint running: How changes in step frequency affect running mechanics and leg spring behaviour at maximal speed. J. Sports Sci. 2017, 35, 339–345. [Google Scholar] [CrossRef] [PubMed]
  60. Morin, J.B.; Bourdin, M.; Edouard, P.; Peyrot, N.; Samozino, P.; Lacour, J.R. Mechanical determinants of 100-m sprint running performance. Eur. J. Appl. Phys. 2012, 112, 3921–3930. [Google Scholar] [CrossRef] [PubMed]
  61. Letzelter, S. The development of velocity and acceleration in sprints: A comparison of elite and juvenile female sprinters. New Stud. Athl. 2006, 21, 15–22. [Google Scholar]
  62. Kuitunen, S.; Komi, P.V.; Kyröläinen, H. Knee and ankle joint stiffness in sprint running. Med. Sci. Sports Exerc. 2002, 34, 166–173. [Google Scholar] [CrossRef]
  63. Weyand, P.G.; Sternlight, D.B.; Bellizzi, M.J.; Wright, S. Faster top running speeds are achieved with greater ground forces not more rapid leg movements. J. Appl. Physiol. 2000, 89, 1991–1999. [Google Scholar] [CrossRef]
  64. Shadmehr, R.; Smith, M.A.; Krakauer, J.W. Error correction, sensory prediction, and adaptation in motor control. Annu. Rev. Neurosci. 2010, 33, 89–108. [Google Scholar] [CrossRef]
  65. Bernstein, N. The Co-Ordination and Regulation of Movements; Pergamon Press: Oxford, UK, 1967. [Google Scholar]
  66. Clark, J.E. On Becoming Skillful: Patterns and Constraints. Res. Q. Exerc. Sport 1995, 66, 173–183. [Google Scholar] [CrossRef]
  67. Talukdar, K.; Harrison, C.; McGuigan, M.; Borotkanics, R. Kinetics and kinematics of sprinting in mid and post peak height velocity female athletes. Int. J. Strength Cond. 2021, 1, 1–9. [Google Scholar] [CrossRef]
  68. Miyashiro, K.; Nagahara, R.; Yamamoto, K.; Nishijima, T. Kinematics of maximal speed sprinting with different running speed, leg length, and step characteristics. Front. Sports Act. Living 2019, 1, 37. [Google Scholar] [CrossRef] [PubMed]
  69. Coh, M.; Babic, V. Biodynamic characteristics of maximum speed development. Facta Univ.-Ser. Phys. Educ. Sport 2010, 8, 141–148. [Google Scholar]
  70. Katsikari, K.; Bassa, E.; Skoufas, D.; Lazaridis, S.; Kotzamanidis, C.; Patikas, D.A. Kinetic and Kinematic Changes in Vertical Jump in Prepubescent Girls After 10 Weeks of Plyometric Training. Pediatr. Exerc. Sci. 2020, 32, 81–88. [Google Scholar] [CrossRef]
  71. Bertozzi, F.; Camuncoli, F.; Galli, M.; Tarabini, M. The relationship between jump and sprint performance in preschool children. J. Sports Med. Phys. Fit. 2024, 64, 526–531. [Google Scholar] [CrossRef]
  72. Rossi, J.; Slotala, R.; Samozino, P.; Morin, J.B.; Edouard, P. Sprint acceleration mechanics changes from children to adolescent. Comput. Methods Biomech. Biomed. Eng. 2017, 20 (Suppl. 1), S181–S182. [Google Scholar] [CrossRef]
  73. Sudlow, A.; Galantine, P.; Del Sordo, G.; Raymond, J.J.; Dalleau, G.; Peyrot, N.; Duché, P. Effects of maximal power and the force–velocity profile on sprint acceleration performance according to maturity status and sex. J. Sports Sci. 2025, 43, 1319–1328. [Google Scholar] [CrossRef]
  74. Rumpf, M.C.; Cronin, J.B.; Mohamad, I.N.; Mohamad, S.; Oliver, J.L.; Hughes, M.G. Kinetic asymmetries during running in male youth. Phys. Ther. Sport 2014, 15, 53–57. [Google Scholar] [CrossRef]
  75. Exell, T.; Irwin, G.; Gittoes, M.; Kerwin, D. Strength and performance asymmetry during maximal velocity sprint running. Scand. J. Med. Sci. Sports 2017, 27, 1273–1282. [Google Scholar] [CrossRef]
  76. Nagahara, R.; Gleadhill, S. Asymmetries of kinematics and kinetics in female and male sprinting. J. Sports Med. Phys. Fit. 2023, 63, 891–898. [Google Scholar] [CrossRef] [PubMed]
  77. Noro, K.; Hirai, H.; Okamoto, H.; Kogawa, D.; Kamimukai, C.; Nagao, H.; Kaneko, Y.; Hori, K.; Yamamoto, S.; Yamada, N.; et al. Inter-limb Asymmetry of Equilibrium Regulation in the Legs of 10–11-Year-Old Boys during Overground Sprinting. In Proceedings of the 43rd Annual International Conference of the IEEE Engineering in Medicine & Biology Society (EMBC), Guadalajara, Mexico, 1–5 November 2021; pp. 4787–4791. [Google Scholar] [CrossRef]
  78. Payne, V.G.; Isaacs, L.D. Human Motor Development: A Lifespan Approach, 9th ed.; Routledge: New York, NY, USA, 2017. [Google Scholar] [CrossRef]
  79. Nagahara, R.; Takai, Y.; Haramura, M.; Mizutani, M.; Matsuo, A.; Kanehisa, H.; Fukunaga, T. Age-Related Differences in Spatiotemporal Variables and Ground Reaction Forces During Sprinting in Boys. Pediatr. Exerc. Sci. 2018, 30, 335–344. [Google Scholar] [CrossRef] [PubMed]
  80. Smits-Engelsman, B.C.; Wilson, P.H. Age-related changes in motor imagery from early childhood to adulthood: Probing the internal representation of speed-accuracy trade-offs. Hum. Mov. Sci. 2013, 32, 1151–1162. [Google Scholar] [CrossRef] [PubMed]
  81. Hausdorff, J.M.; Zemany, L.; Peng, C.; Goldberger, A.L. Maturation of gait dynamics: Stride-to-stride variability and its temporal organization in children. J. Appl. Physiol. 1999, 86, 1040–1047. [Google Scholar] [CrossRef]
  82. Latorre-Román, P.A.; Párraga-Montilla, J.A.; Salas-Sánchez, J.; Robles-Fuentes, A.; Enrique Roche-Seruendo, L.; Lucena-Zurita, M.; Manjón-Pozas, D.; Consuegra-Gonzalez, P. Differences in spatiotemporal running parameters in children and adolescents: A cross-sectional study. J. Sports Sci. 2025, 43, 544–554. [Google Scholar] [CrossRef]
  83. Hussain, S.A.; Singh, S.; Malik, S.H. Biomechanical analysis of spatio-temporal gait factors in determining gender gait maturation in school children. Int. J. Physiol. Nutr. Phys. Educ. 2021, 6, 65–70. [Google Scholar] [CrossRef]
  84. Biino, V.; Giustino, V.; Gallotta, M.C.; Bellafiore, M.; Battaglia, G.; Lanza, M.; Baldari, C.; Giuriato, M.; Figlioli, F.; Guidetti, L.; et al. Effects of sports experience on children’s gross motor coordination level. Front. Sports Act. Living 2023, 5, 1310074. [Google Scholar] [CrossRef]
  85. Davids, K.; Glazier, P.; Araújo, D.; Bartlett, R. Movement systems as dynamical systems: The functional role of variability and its implications for sports medicine. Sports Med. 2003, 33, 245–260. [Google Scholar] [CrossRef]
  86. Koh, T.H.; Eyre, J.A. Maturation of corticospinal tracts assessed by electromagnetic stimulation of the motor cortex. Arch. Dis. Child. 1988, 63, 1347–1352. [Google Scholar] [CrossRef] [PubMed]
  87. Dotan, R.; Mitchell, C.; Cohen, R.; Klentrou, P.; Gabriel, D.; Falk, B. Child-adult differences in muscle activation-a review. Pediatr. Exerc. Sci. 2012, 24, 2–21. [Google Scholar] [CrossRef] [PubMed]
  88. Lazaridis, S.; Bassa, E.; Patikas, D.; Giakas, G.; Gollhofer, A.; Kotzamanidis, C. Neuromuscular differences between prepubescents boys and adult men during drop jump. Eur. J. Appl. Physiol. 2010, 110, 67–74. [Google Scholar] [CrossRef] [PubMed]
  89. Suchomel, T.J.; Nimphius, S.; Stone, M.H. The Importance of Muscular Strength in Athletic Performance. Sports Med. 2016, 46, 1419–1449. [Google Scholar] [CrossRef]
  90. Radnor, J.M.; Oliver, J.L.; Waugh, C.M.; Myer, G.D.; Moore, I.S.; Lloyd, R.S. The Influence of Growth and Maturation on Stretch-Shortening Cycle Function in Youth. Sports Med. 2018, 48, 57–71. [Google Scholar] [CrossRef]
  91. Meyers, R.W.; Moeskops, S.; Oliver, J.L.; Hughes, M.G.; Cronin, J.B.; Lloyd, R.S. Lower-Limb Stiffness and Maximal Sprint Speed in 11-16-Year-Old Boys. J. Strength Cond. Res. 2019, 33, 1987–1995. [Google Scholar] [CrossRef]
  92. Yamane, T.; Kimura, M.; Morita, M. Impact of Sensor-Axis Combinations on Machine Learning Accuracy for Human Activity Recognition Using Accelerometer Data in Clinical Settings. Phys. Act. Health 2025, 9, 95–109. [Google Scholar] [CrossRef]
  93. Theodorou, A.S.; Panoutsakopoulos, V.; Exell, T.A.; Argeitaki, P.; Paradisis, G.P.; Smirniotou, A. Step characteristic interaction and asymmetry during the approach phase in long jump. J. Sports Sci. 2017, 35, 346–354. [Google Scholar] [CrossRef]
  94. Stergiou, N.; Decker, L.M. Human movement variability, nonlinear dynamics, and pathology: Is there a connection? Hum. Mov. Sci. 2011, 30, 869–888. [Google Scholar] [CrossRef]
Figure 1. Results for the velocity parameters (MAX: maximum sprint phase group; ACC: acceleration phase group; *: p < 0.05).
Biomechanics 05 00060 g001
Figure 2. Results of the partial correlation between step length, step frequency, and speed at the final 5 m segment of the short-sprint test: (a) maximum sprint phase group; (b) acceleration phase group; **: p < 0.01; ***: p < 0.001.
Biomechanics 05 00060 g002
Table 1. Results (mean ± standard deviation) for the anthropometric parameters.
ParameterMAX (n = 28)ACC (n = 37)tpg
age (years)6.9 ± 1.06.9 ± 0.60.1430.8870.038
body height (m)1.23 ± 0.081.25 ± 0.071.0230.3100.265
body mass (kg)26.6 ± 6.326.3 ± 4.60.1920.8490.054
body mass index (kg/m2)17.4 ± 2.616.8 ± 2.21.0530.2970.277
Table 2. Results (mean ± standard deviation) for the time parameters.
ParameterMAX (n = 28)ACC (n = 37)tpg
time 0–5 m (s)1.44 ± 0.141.41 ± 0.130.8300.4100.205
time 5–10 m (s)1.10 ± 0.101.08 ± 0.090.7590.4510.188
time 10–15 m(s)1.10 ± 0.101.03 ± 0.11 *2.4310.0180.602
time 0–10 m (s)2.54 ± 0.212.49 ± 0.210.8900.3770.220
time 0–15 m (s)3.63 ± 0.293.52 ± 0.311.4500.1520.359
*: p < 0.05 between groups.
Table 3. Results (mean ± standard deviation) for the step length parameters.
ParameterMAX (n = 28)ACC (n = 37)tpg
step length—left leg (m)1.21 ± 0.161.25 ± 0.151.1050.2740.273
step length—right leg (m)1.21 ± 0.141.26 ± 0.141.5250.1320.378
average step length (m)1.21 ± 0.141.26 ± 0.141.3530.1810.335
step length symmetry angle (%)1.45 ± 0.931.64 ± 1.400.6300.5130.156
relative step length (%)0.97 ± 0.101.00 ± 0.091.2300.2240.318
stride length (m)2.41 ± 0.292.51 ± 0.281.3530.1810.335
Table 4. Results (mean ± standard deviation) for the step frequency parameters.
ParameterMAX (n = 28)ACC (n = 37)tpg
step frequency—left leg (Hz)3.95 ± 0.383.90 ± 0.350.5480.5860.136
step frequency—right leg (Hz)3.99 ± 0.373.90 ± 0.311.0410.3020.258
average step frequency (Hz)3.97 ± 0.353.90 ± 0.300.8520.3970.211
step frequency symmetry angle (%)1.40 ± 1.621.59 ± 1.620.4790.6330.119
stride frequency (Hz)1.98 ± 0.181.95 ± 0.150.8590.3940.213
Table 5. Results (mean ± standard deviation) for the step velocity parameters.
ParameterMAX (n = 28)ACC (n = 37)tpg
step velocity—left leg (m/s)4.73 ± 0.604.83 ± 0.520.7330.4670.181
step velocity—right leg (m/s)4.81 ± 0.594.90 ± 0.490.7060.4830.175
average step velocity (m/s)4.77 ± 0.574.87 ± 0.490.7470.4580.185
step velocity symmetry angle (%)1.59 ± 1.281.43 ± 1.240.4990.6190.124
average stride velocity (m/s)4.77 ± 0.574.87 ± 0.490.7540.4530.187
Disclaimer/Publisher’s Note: The statements, opinions and data contained in all publications are solely those of the individual author(s) and contributor(s) and not of MDPI and/or the editor(s). MDPI and/or the editor(s) disclaim responsibility for any injury to people or property resulting from any ideas, methods, instructions or products referred to in the content.

