1. Introduction
Ankle inversion injuries are among the most common musculoskeletal injuries, particularly in sports and daily activities. They often lead to chronic pain, instability, and long-term mobility impairments. These injuries primarily affect the lateral ligaments of the ankle, including the anterior talofibular ligament and the calcaneofibular ligament, and are typically the result of excessive inversion or supination. Given the high prevalence of these injuries, especially during activities such as running or walking on uneven terrain, there is an increasing need for improved diagnostic tools and treatment strategies [
1].
Traumatic injuries to the lateral ligaments of the ankle, particularly the anterior talofibular and calcaneofibular ligaments, account for approximately 77% of lower limb injuries. These injuries are most frequent during sporting activities, especially those involving running or walking on irregular surfaces. As participation in these activities continues to grow, the demand for enhanced diagnostic and treatment solutions also increases [
2,
3].
The subtalar joint, formed by the astragalus and the upper surface of the calcaneus, enables inversion and eversion (supination and pronation) movements. This range of motion is essential for understanding the potential for injury when inversion angles become excessive, and a 25-degree threshold [
2,
3] serves as the basis for this investigation.
Orthotic devices, including ankle–foot orthoses (AFOs), play a crucial role in supporting, realigning, and redistributing mechanical loads in the neuromuscular and musculoskeletal systems. Passive AFOs, which lack electronic controllers but may incorporate mechanical components such as springs or dampers, are commonly used to address ankle instability. However, their effectiveness depends on key design parameters, including stiffness properties, geometry, and material characteristics [
4,
5,
6,
7,
8,
9].
The modeling and simulation of human movement offer significant potential for improving the design of such medical devices. Advanced musculoskeletal simulations provide insights into internal muscle forces, joint loads, and gait dynamics, helping to identify cause–effect relationships in individuals with neurological or musculoskeletal impairments [
10,
11]. By accurately reproducing gait and movement patterns, these models allow researchers to pinpoint factors contributing to movement alterations, such as bone deformities, abnormal muscle activation, or muscular weakness [
6].
Dynamic musculoskeletal simulations have become increasingly valuable for testing hypotheses, predicting functional outcomes, and optimizing the design of assistive devices. Previous studies have shown that tuning the stiffness of AFOs can help keep subtalar inversion angles below 25 degrees, mitigating the risk of injury [
12,
13]. However, the current AFO development process often relies on trial-and-error approaches, lacking robust scientific and engineering methodologies. Traditionally manufactured AFOs frequently only have estimated rather than measured mechanical properties, leading to potential mismatches with patient-specific rehabilitation needs [
14].
Recent advances in three-dimensional modeling and simulation enable the design of orthoses that are more precise and tailored to individual needs [
7,
15,
16,
17,
18]. These models integrate patient-specific parameters, such as anatomy, gait patterns, and activity levels, to refine device performance. Simulation-based methodologies have been used to assess how AFO characteristics, including wall thickness, stiffness, and neutral positioning, influence gait dynamics without requiring constant patient testing [
18].
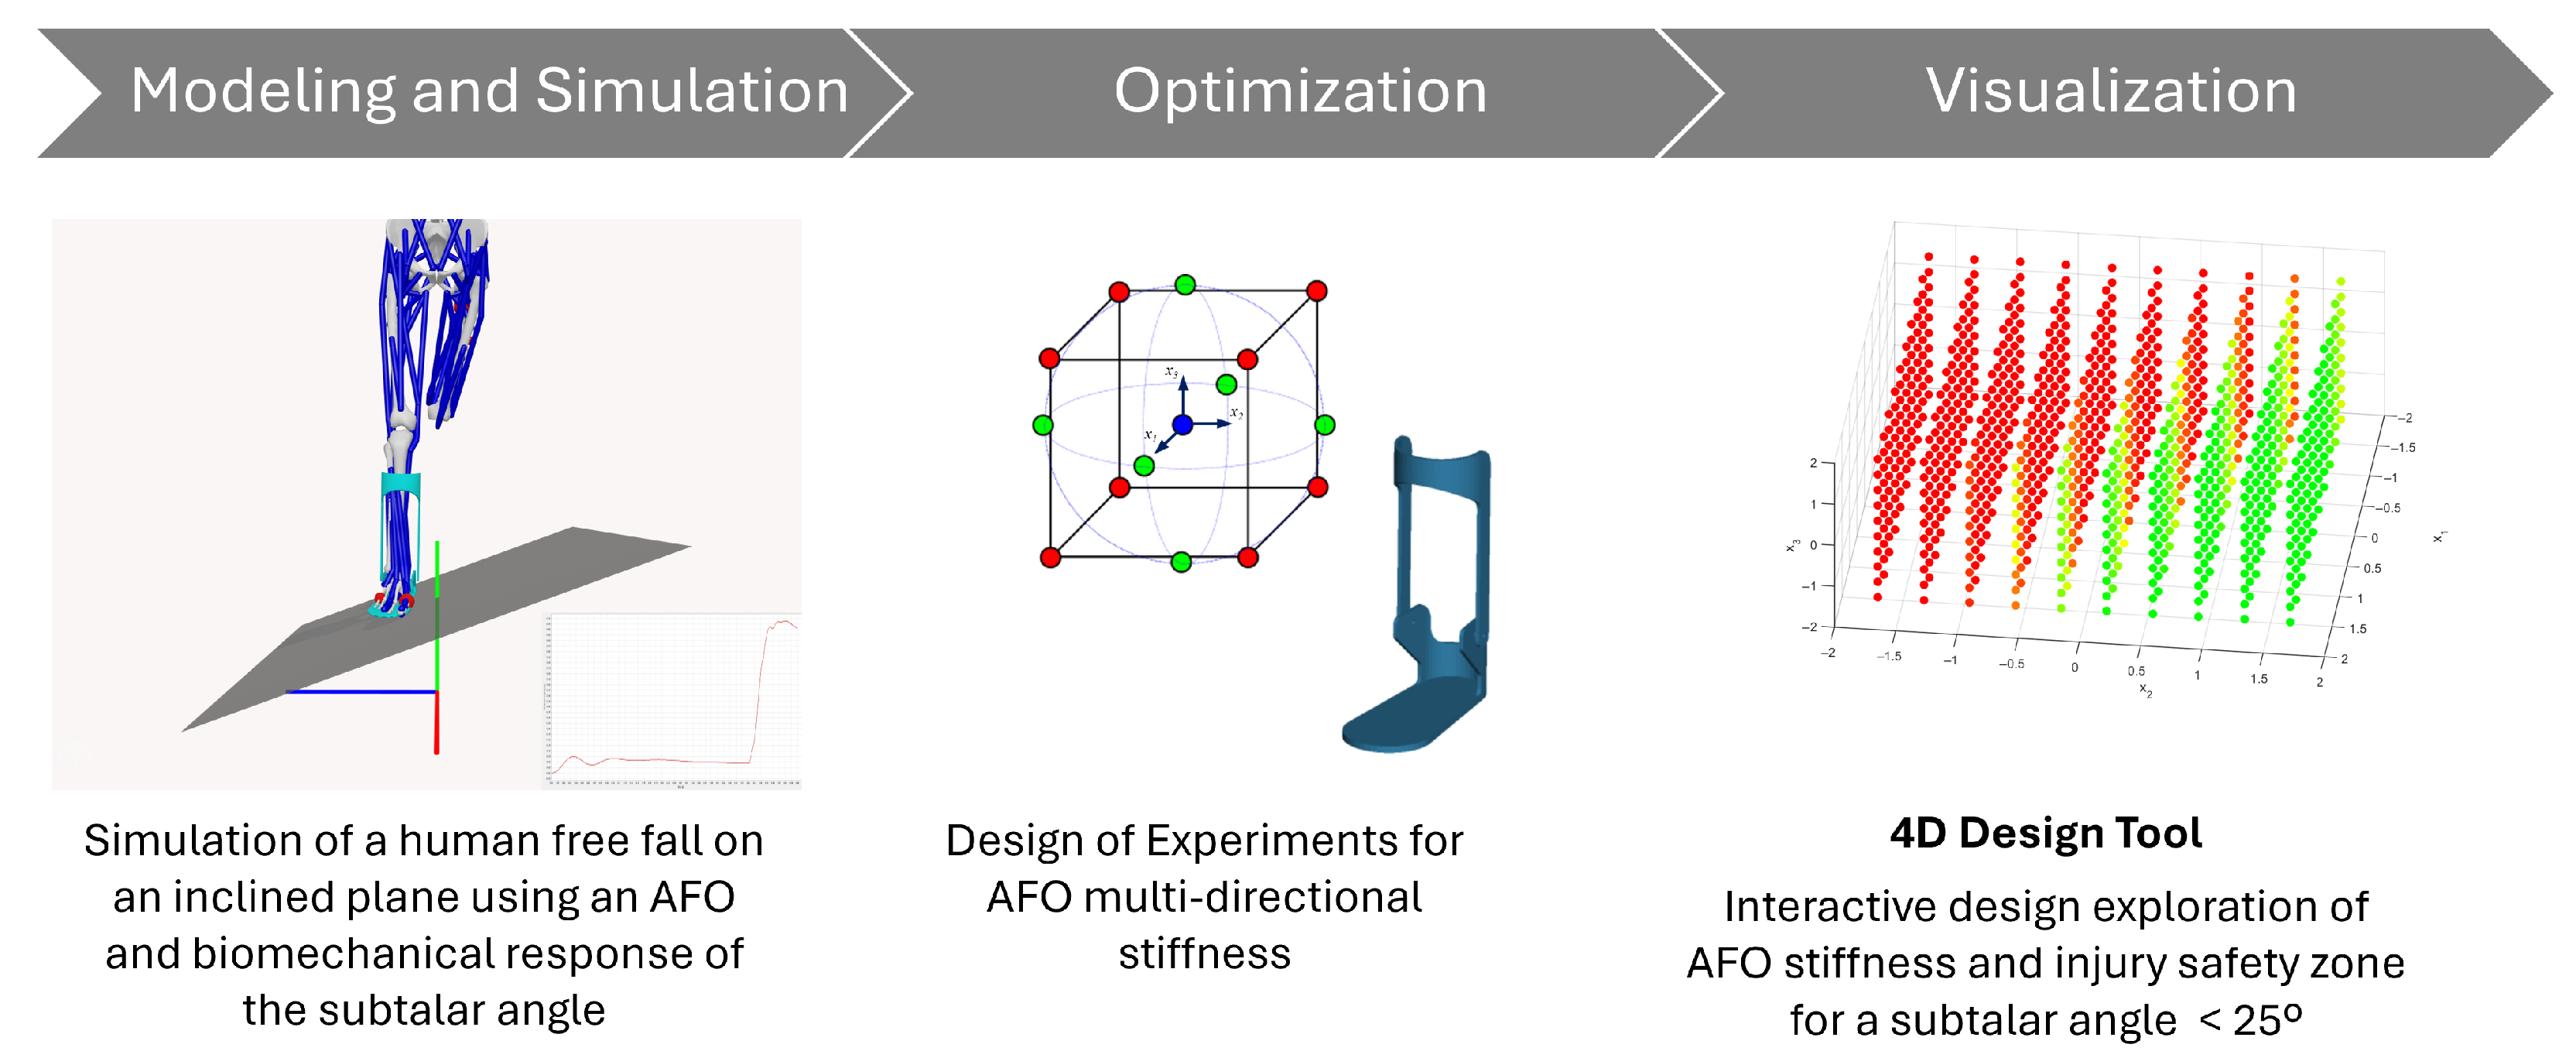
This study advances the field of AFO design by introducing an engineering software framework built on advanced biomechanical modeling techniques. The research addresses three core objectives aimed at enhancing the clinical functionality and engineering reliability of AFOs. First, we develop a simulation-based software tool for designing customized AFOs that mitigate the risk of ankle inversion injuries, particularly in populations with neuromuscular or mobility impairments. Second, the tool enables parametric analysis of design variables, such as multi-directional stiffness and material properties, to assess their biomechanical effects on orthotic performance. Third, we integrate optimization methodologies, including Design of Experiments (DoE), to identify stiffness configurations that balance stability and mobility. Crucially, the proposed framework incorporates real-time 4D visualization to support interactive design exploration and clinical decision-making. By combining modeling and simulation, optimization, and visualization in a single process, as shown in
Figure 1, this study demonstrates a concrete application of engineering software to the development of personalized medical devices.
2. Methodology
2.1. Computational Framework
To systematically evaluate the effects of translational stiffness on ankle inversion angles, we employed a computational approach using musculoskeletal modeling and dynamic simulations in OpenSim 4.5 [
19,
20]. A parametric analysis was conducted within a Design of Experiments (DoE) framework, enabling the identification of nonlinear interactions between stiffness parameters.
In OpenSim, a model represents a dynamic system of rigid bodies and joints driven by forces. These models include components such as body segments, joints, muscles, markers, constraints, contact geometries, and controllers. Muscles are modeled as specialized force elements that act between defined points (origin and insertion), providing essential information to calculate muscle lengths, velocities, and forces. External forces, such as ground reaction forces or ligament contributions, can also be integrated into simulations.
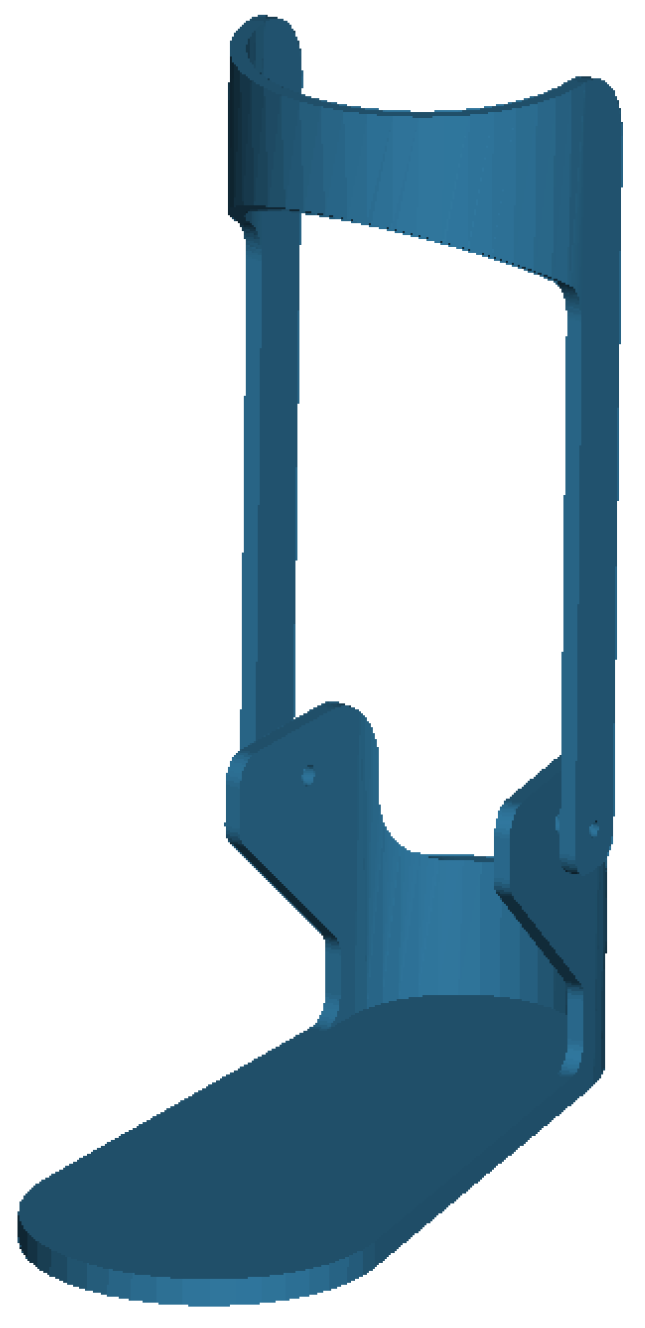
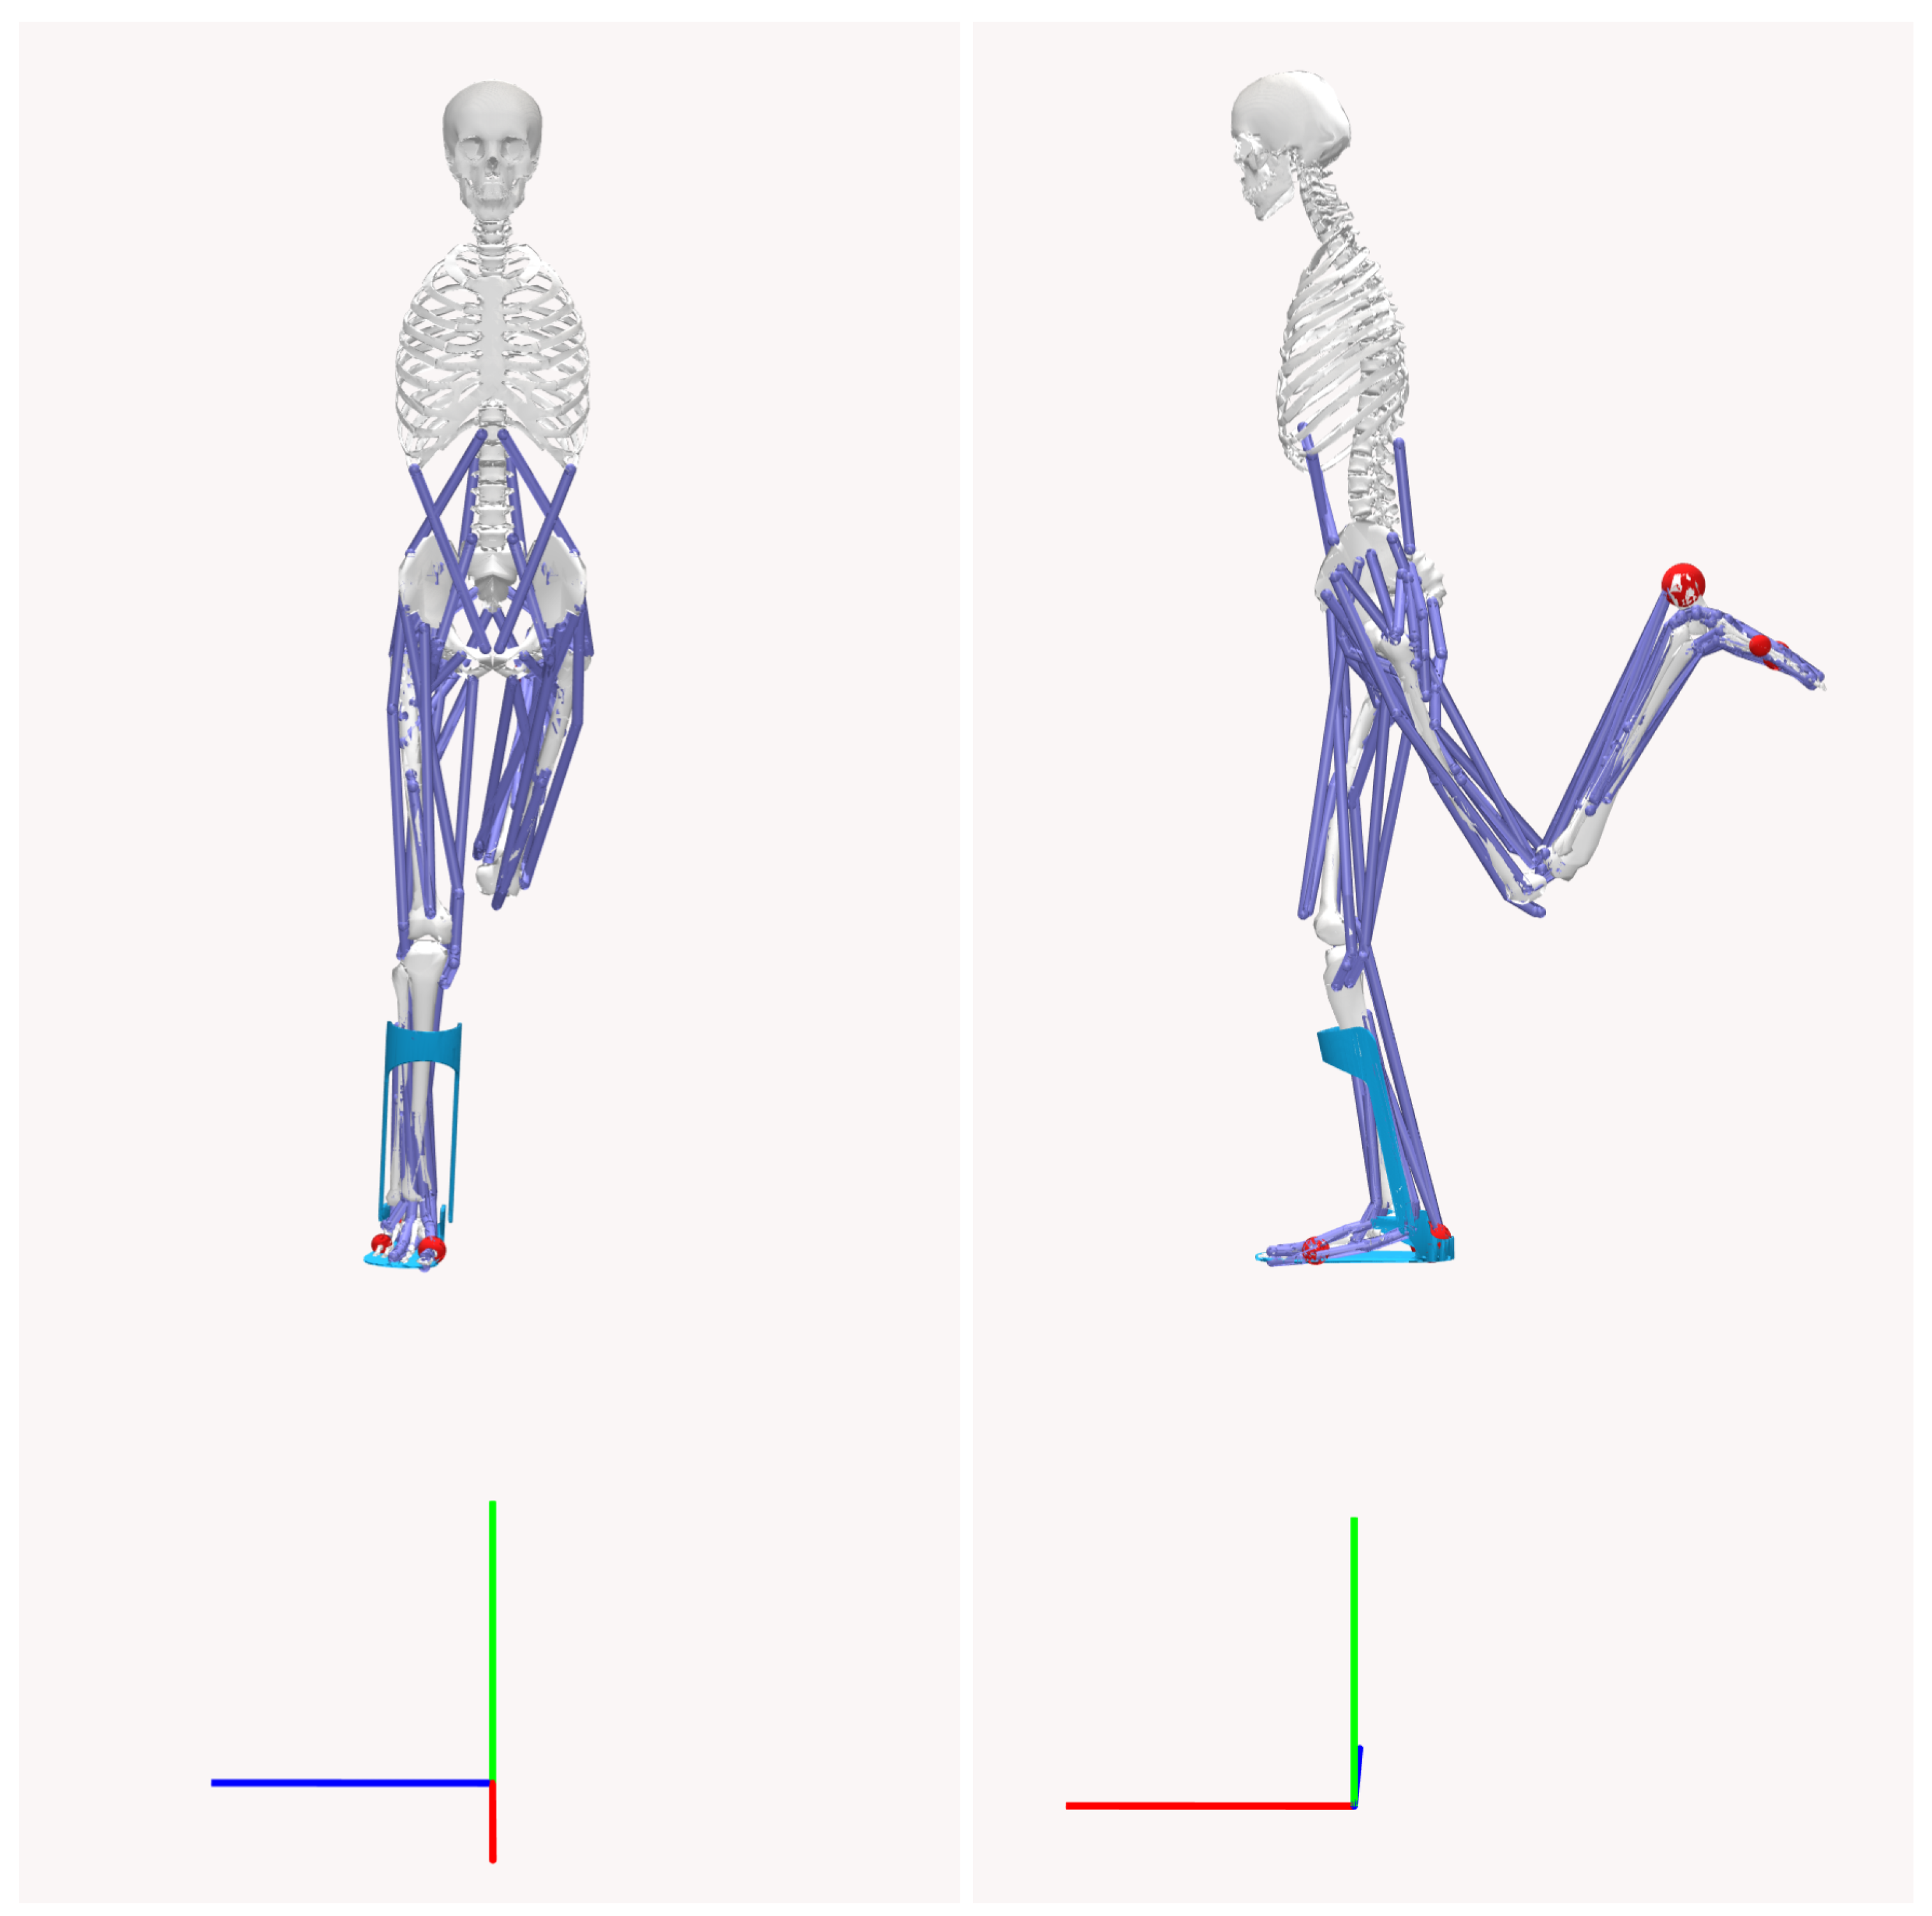
The biomechanical model used in this study is a three-dimensional musculoskeletal system with 23 degrees of freedom. The model mass is 75.3 kg without the AFO, and includes 12 rigid body segments, 70 muscle–tendon units, and 12 intersegmental joints. The AFO model consists of two components: a plate (1.5 kg) and a cuff (1.25 kg), depicted in
Figure 2. The geometry of the AFO model is imported from an STL file sourced from the OpenSim model repository. The orthosis is positioned to constrain ankle inversion/eversion and is fixed to the tibia and foot segments in the OpenSim biomechanical model, illustrated in
Figure 3.
2.2. Simulation Scenario
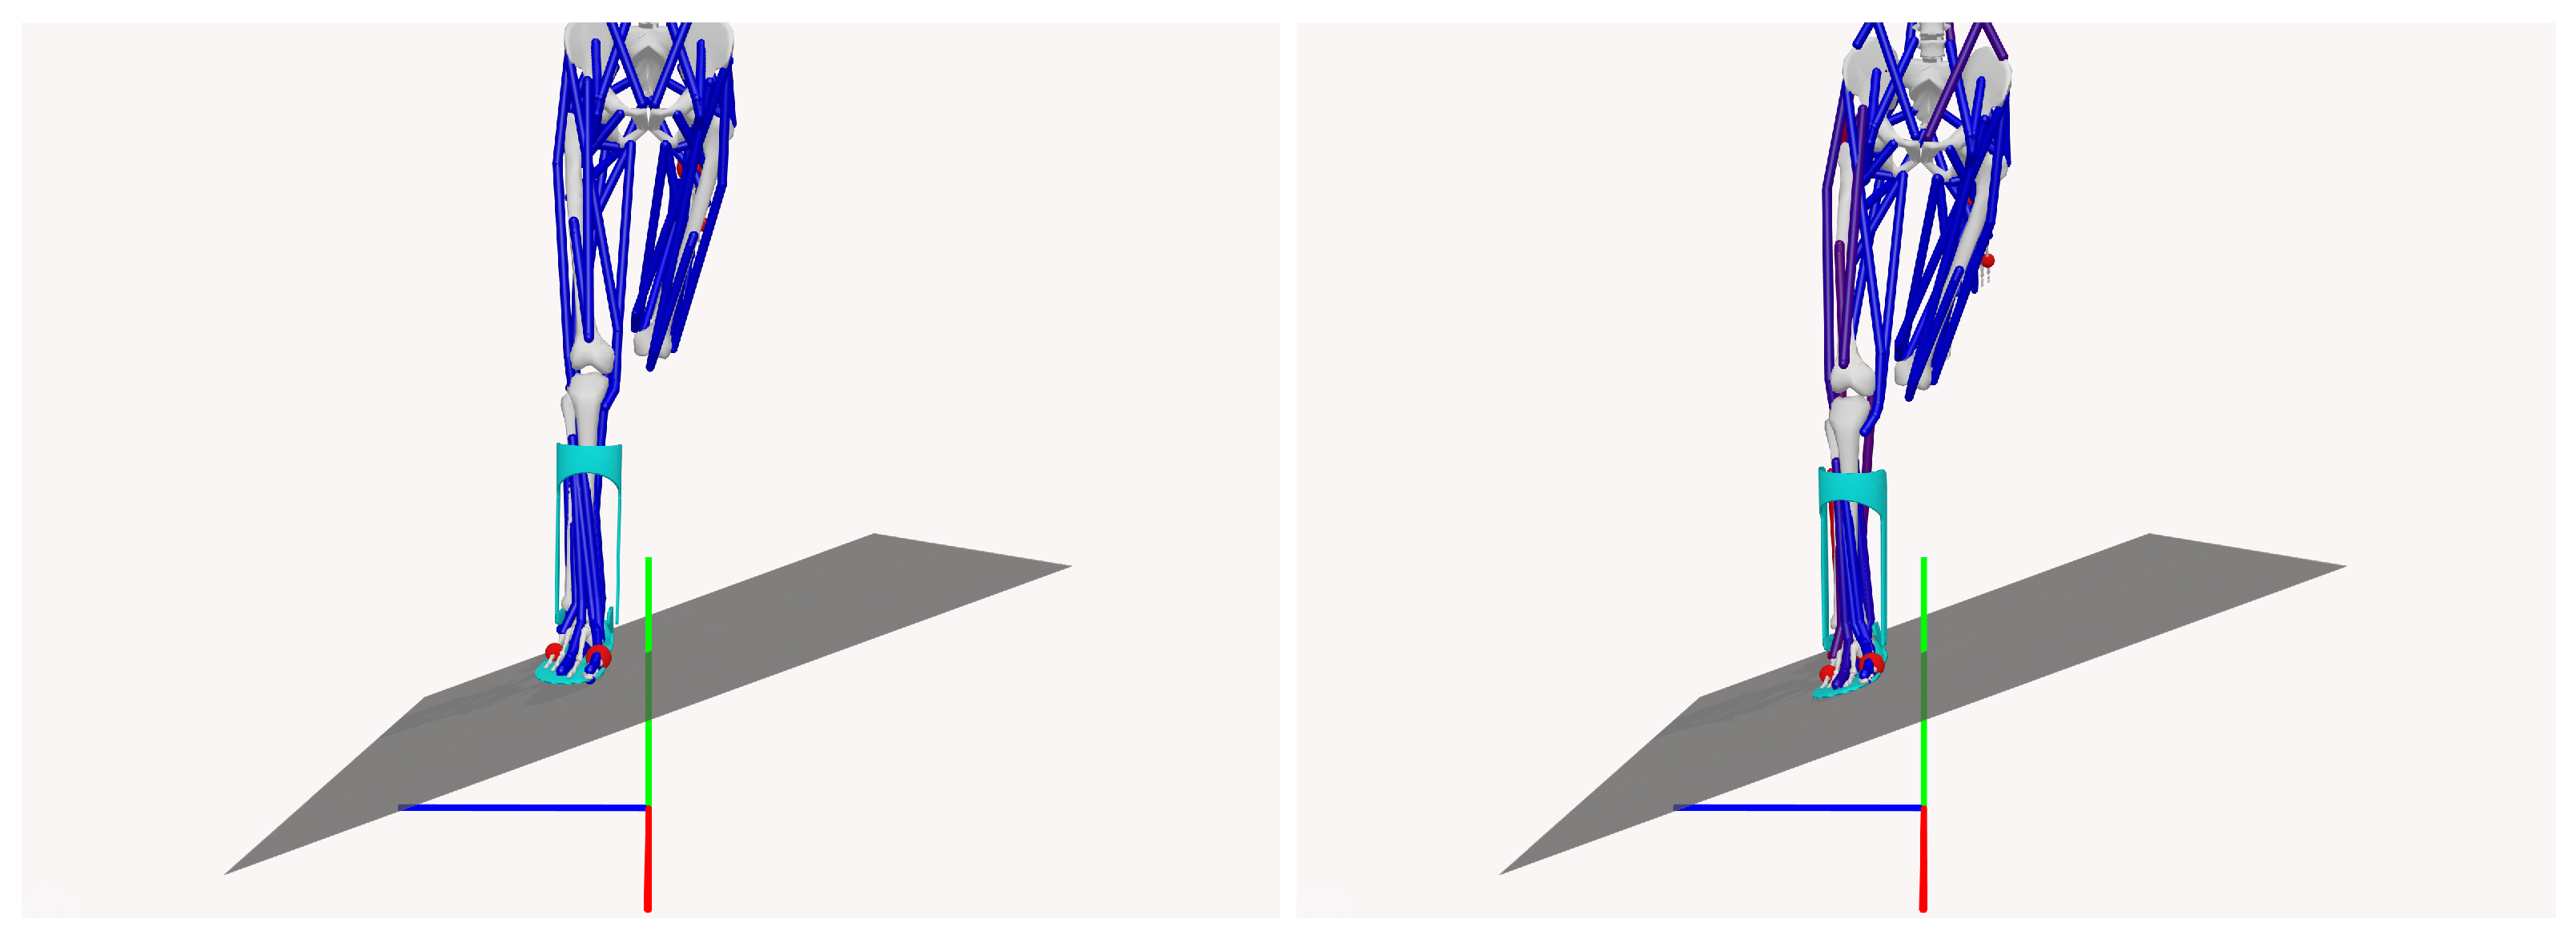
The simulations were designed to replicate a free-fall landing scenario on a 20-degree inclined plane, allowing the evaluation of subtalar joint inversion angles, a critical parameter for assessing the risk of ankle injury. A 25-degree threshold for subtalar inversion was used to define the risk of injury, as shown in
Figure 4, which illustrates the time evolution of the subtalar angles over 0.4 s, highlighting the “injury-safe” zone of angles below 25 degrees.
The simulation environment included a fixed contact platform positioned beneath the musculoskeletal model, with the model’s feet interacting through contact spheres to simulate the forces generated during landing. The contact forces were modeled by considering the normal and tangential forces between the rigid bodies. This approach assumes viscoelastic behavior for biological structures, characterized by low coefficients of restitution (less than 0.5) and significant deformation upon impact [
21].
Figure 5 shows an example of the pre- and post-contact states during the simulation.
2.3. Metamodel Building Process
Metamodels, also known as surrogate models, approximate the design space of a system or a set of experimentally collected responses using smooth functions. These models facilitate performance analysis by interpolating responses based on sampled data from physical or virtual experiments [
22]. In virtual testing, reference dynamic responses, e.g., the subtalar angle, are obtained via computer simulations.
To explore the influence of AFO stiffness parameters, this study employs the DoE methodology [
23]. The Central Composite Design (CCD) [
23,
24] was selected to assess the stiffness variations along the translation directions (
x,
y, and
z), corresponding to the stiffness of the AFO cuff relative to the footplate (
Figure 6).
The Response Surface Methodology (RSM) constructs smooth
n-dimensional surfaces that capture the variability of a function with respect to the design variables. RSM approximates the relationships between the inputs and outputs of the model using polynomial functions [
22]. The Second-Order Model function isgiven by the following formula:
where
represents coefficients obtained through predefined experiments;
represents coded variables; and
is the surrogate response function, with
being the simulated response function and
the deviation:
The CCD methodology defines an optimal set of design variables, ensuring sufficient numerical experiments while minimizing computational effort.
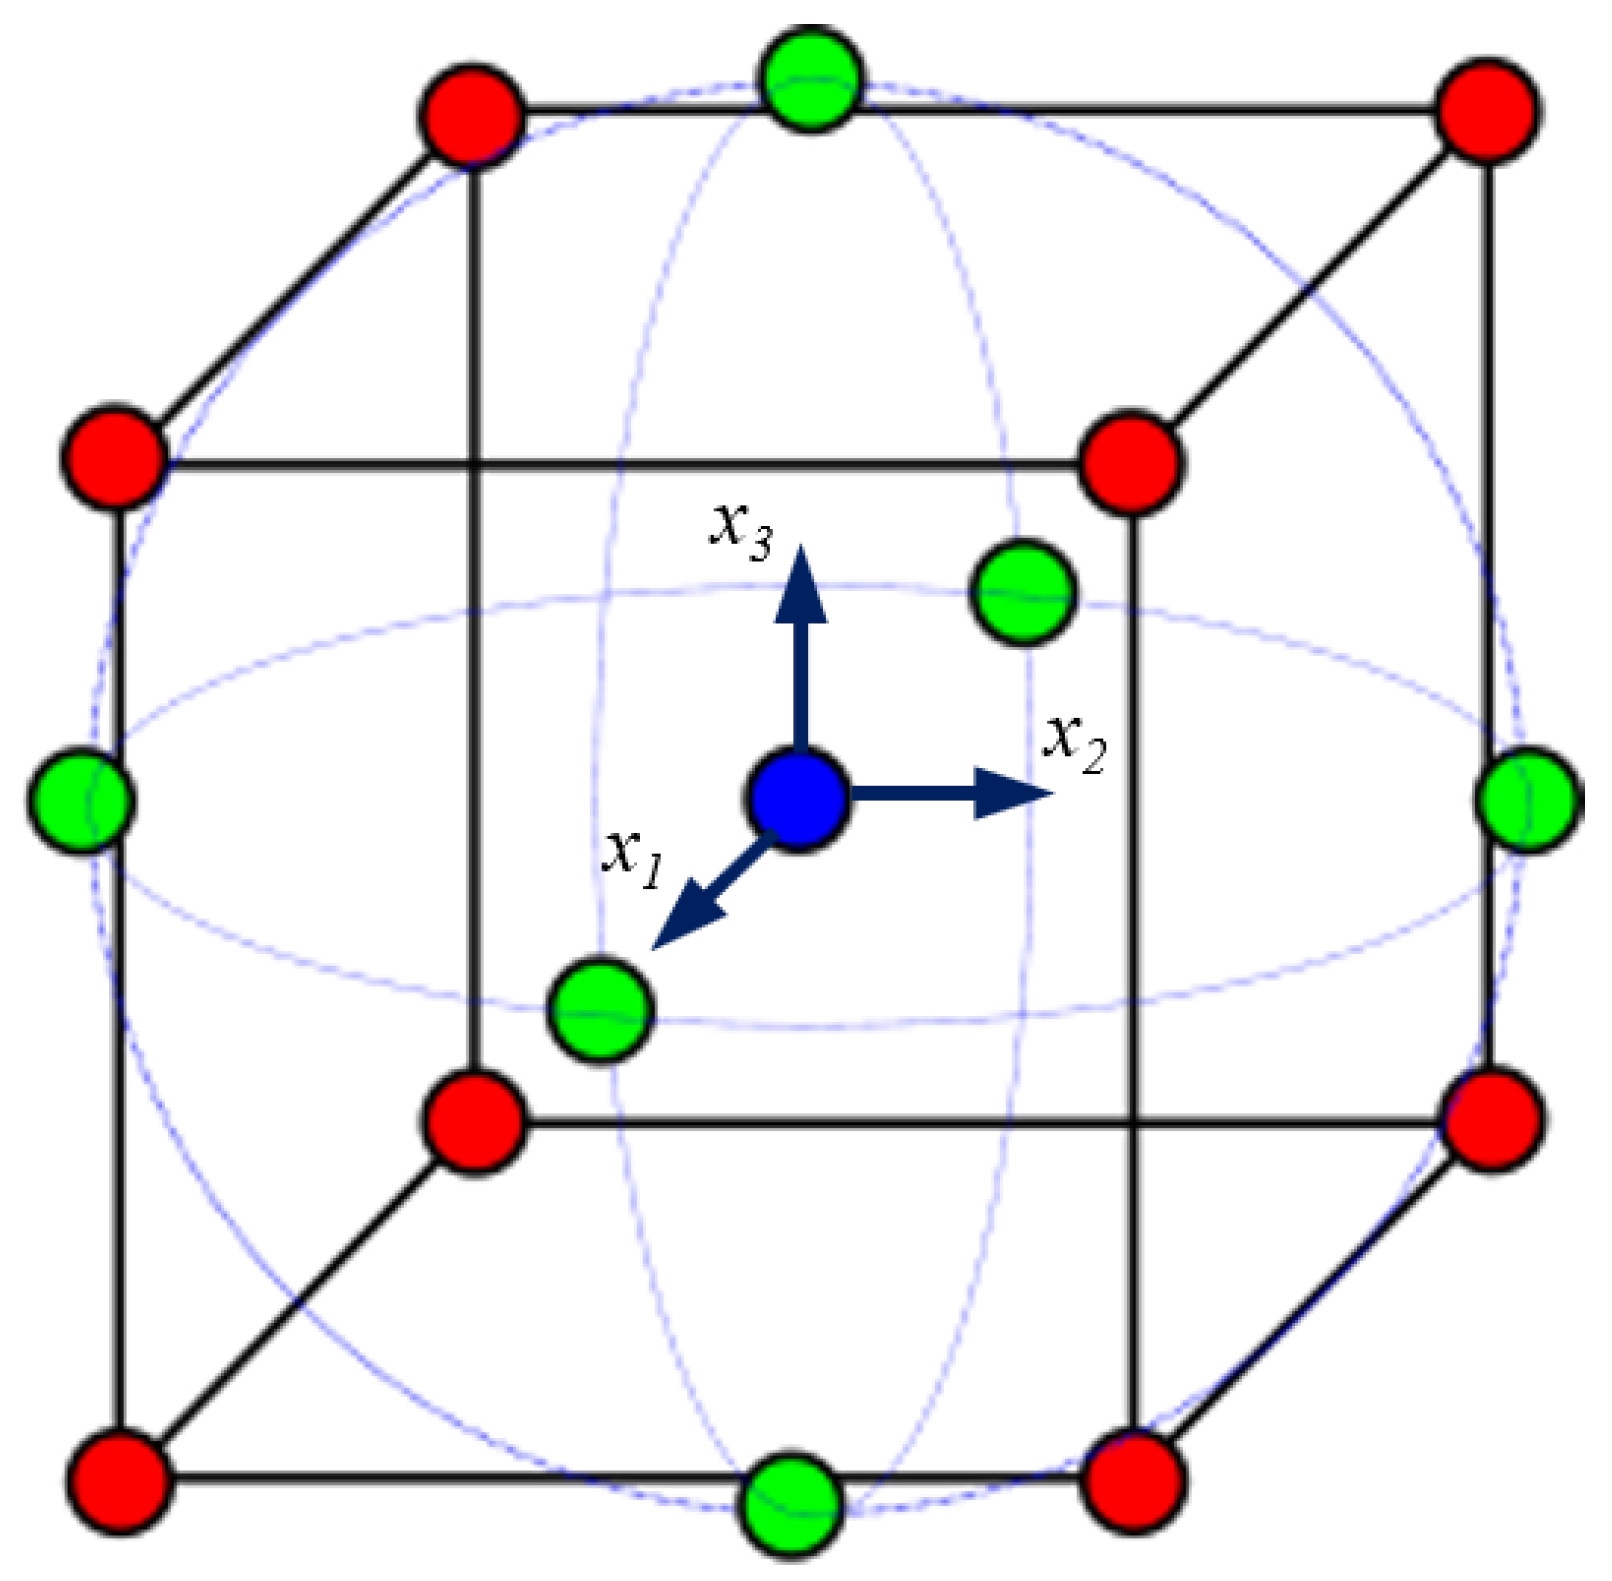
For virtual experiments, let N represent the number of design variables, , for . Their initial values, , correspond to the parameters of the reference model, restricted within . In this study, , with , respectively, corresponding to the x, y, and z directions.
To improve numerical stability, coded variables
are introduced:
where the scaling factor
is
CCD defines the coordinates of the
N coded variables for the
n numerical experiments necessary for quadratic response surface identification:
For
,
. The coded variable coordinates include cube vertices (factorial points), center points, and axial points defined by the rotatability parameter:
For
,
.
Figure 7 shows the cube and the locations of the coded variables.
These virtual experiments enable the construction of a quadratic response surface that captures the effects of stiffness variations, listed in
Table 1, on injury risk, facilitating the identification of safe and effective AFO designs.
The
n actual simulations generate a response for each experiment. Let
represent the response values. Define matrix
X (dimensions
) based on the coded design matrix
D, where the number of unknown coefficients is as follows:
For
, the number
c of unknown coefficients is 10, and the matrix
X is structured as follows:
The vector of unknown parameters
is computed using the least-squares estimator:
where
3. Results
A total of 15 simulations were conducted, systematically varying the stiffness parameters to identify safe conditions for preventing injury, specifically keeping subtalar angles below 25 degrees.
Table 2 presents the results, with configurations that are considered injury-safe marked with an asterisk (*).
From the DoE results listed in
Table 2, it is evident that higher translational stiffness values generally lead to lower subtalar angles. Notably, the maximum subtalar angle is particularly sensitive to translational stiffness in the vertical
y-axis, as injury-safe configurations were only achieved with the two highest values of
.
In general, the higher the translational stiffness, the greater the likely compromise of patient comfort, and so the AFO conception may not be viable. However, as also seen in
Table 2, several stiffness configurations resulted in subtalar angles under 25 degrees, demonstrating the potential of various stiffness combinations for injury-safe designs. Specific combinations of translational stiffness across all three directions,
x,
y, and
z, produced configurations suitable for personalizing AFOs. Therefore, a surrogate function was also identified using the DoE results to estimate the maximum subtalar angle during a drop landing simulation. The unknown parameters, referred to as
, were calculated as follows:
Therefore, the approximate response function is given by
To determine the optimal translational stiffness configuration that minimizes the subtalar angle, the surrogate response function
was minimized subject to
This optimization problem was solved using a Sequential Quadratic Programming algorithm. The optimal solution obtained was a subtalar angle of , corresponding to the coded variables for .
Since these values lie at the bounds of the variable range, the results indicate that the optimal solution is located at the extremities of the search space. After decoding these values, the corresponding translational stiffness parameters were set in OpenSim as follows:
Using these stiffness values in OpenSim, the resulting subtalar angle was . The relative error between the predicted and simulated values was , which is within an acceptable margin for engineering applications.
A stiffness of 150 kN/m, while achievable with high-stiffness materials from a mechanical perspective, is significantly greater than what is typically used in clinical applications. This level of stiffness can adversely affect comfort and mobility in passive AFOs. In contrast, active or semi-active AFOs that can adjust their stiffness during sudden ankle inversion present a promising solution. These devices not only protect the joints but also allow for natural movement and reduce energy consumption.
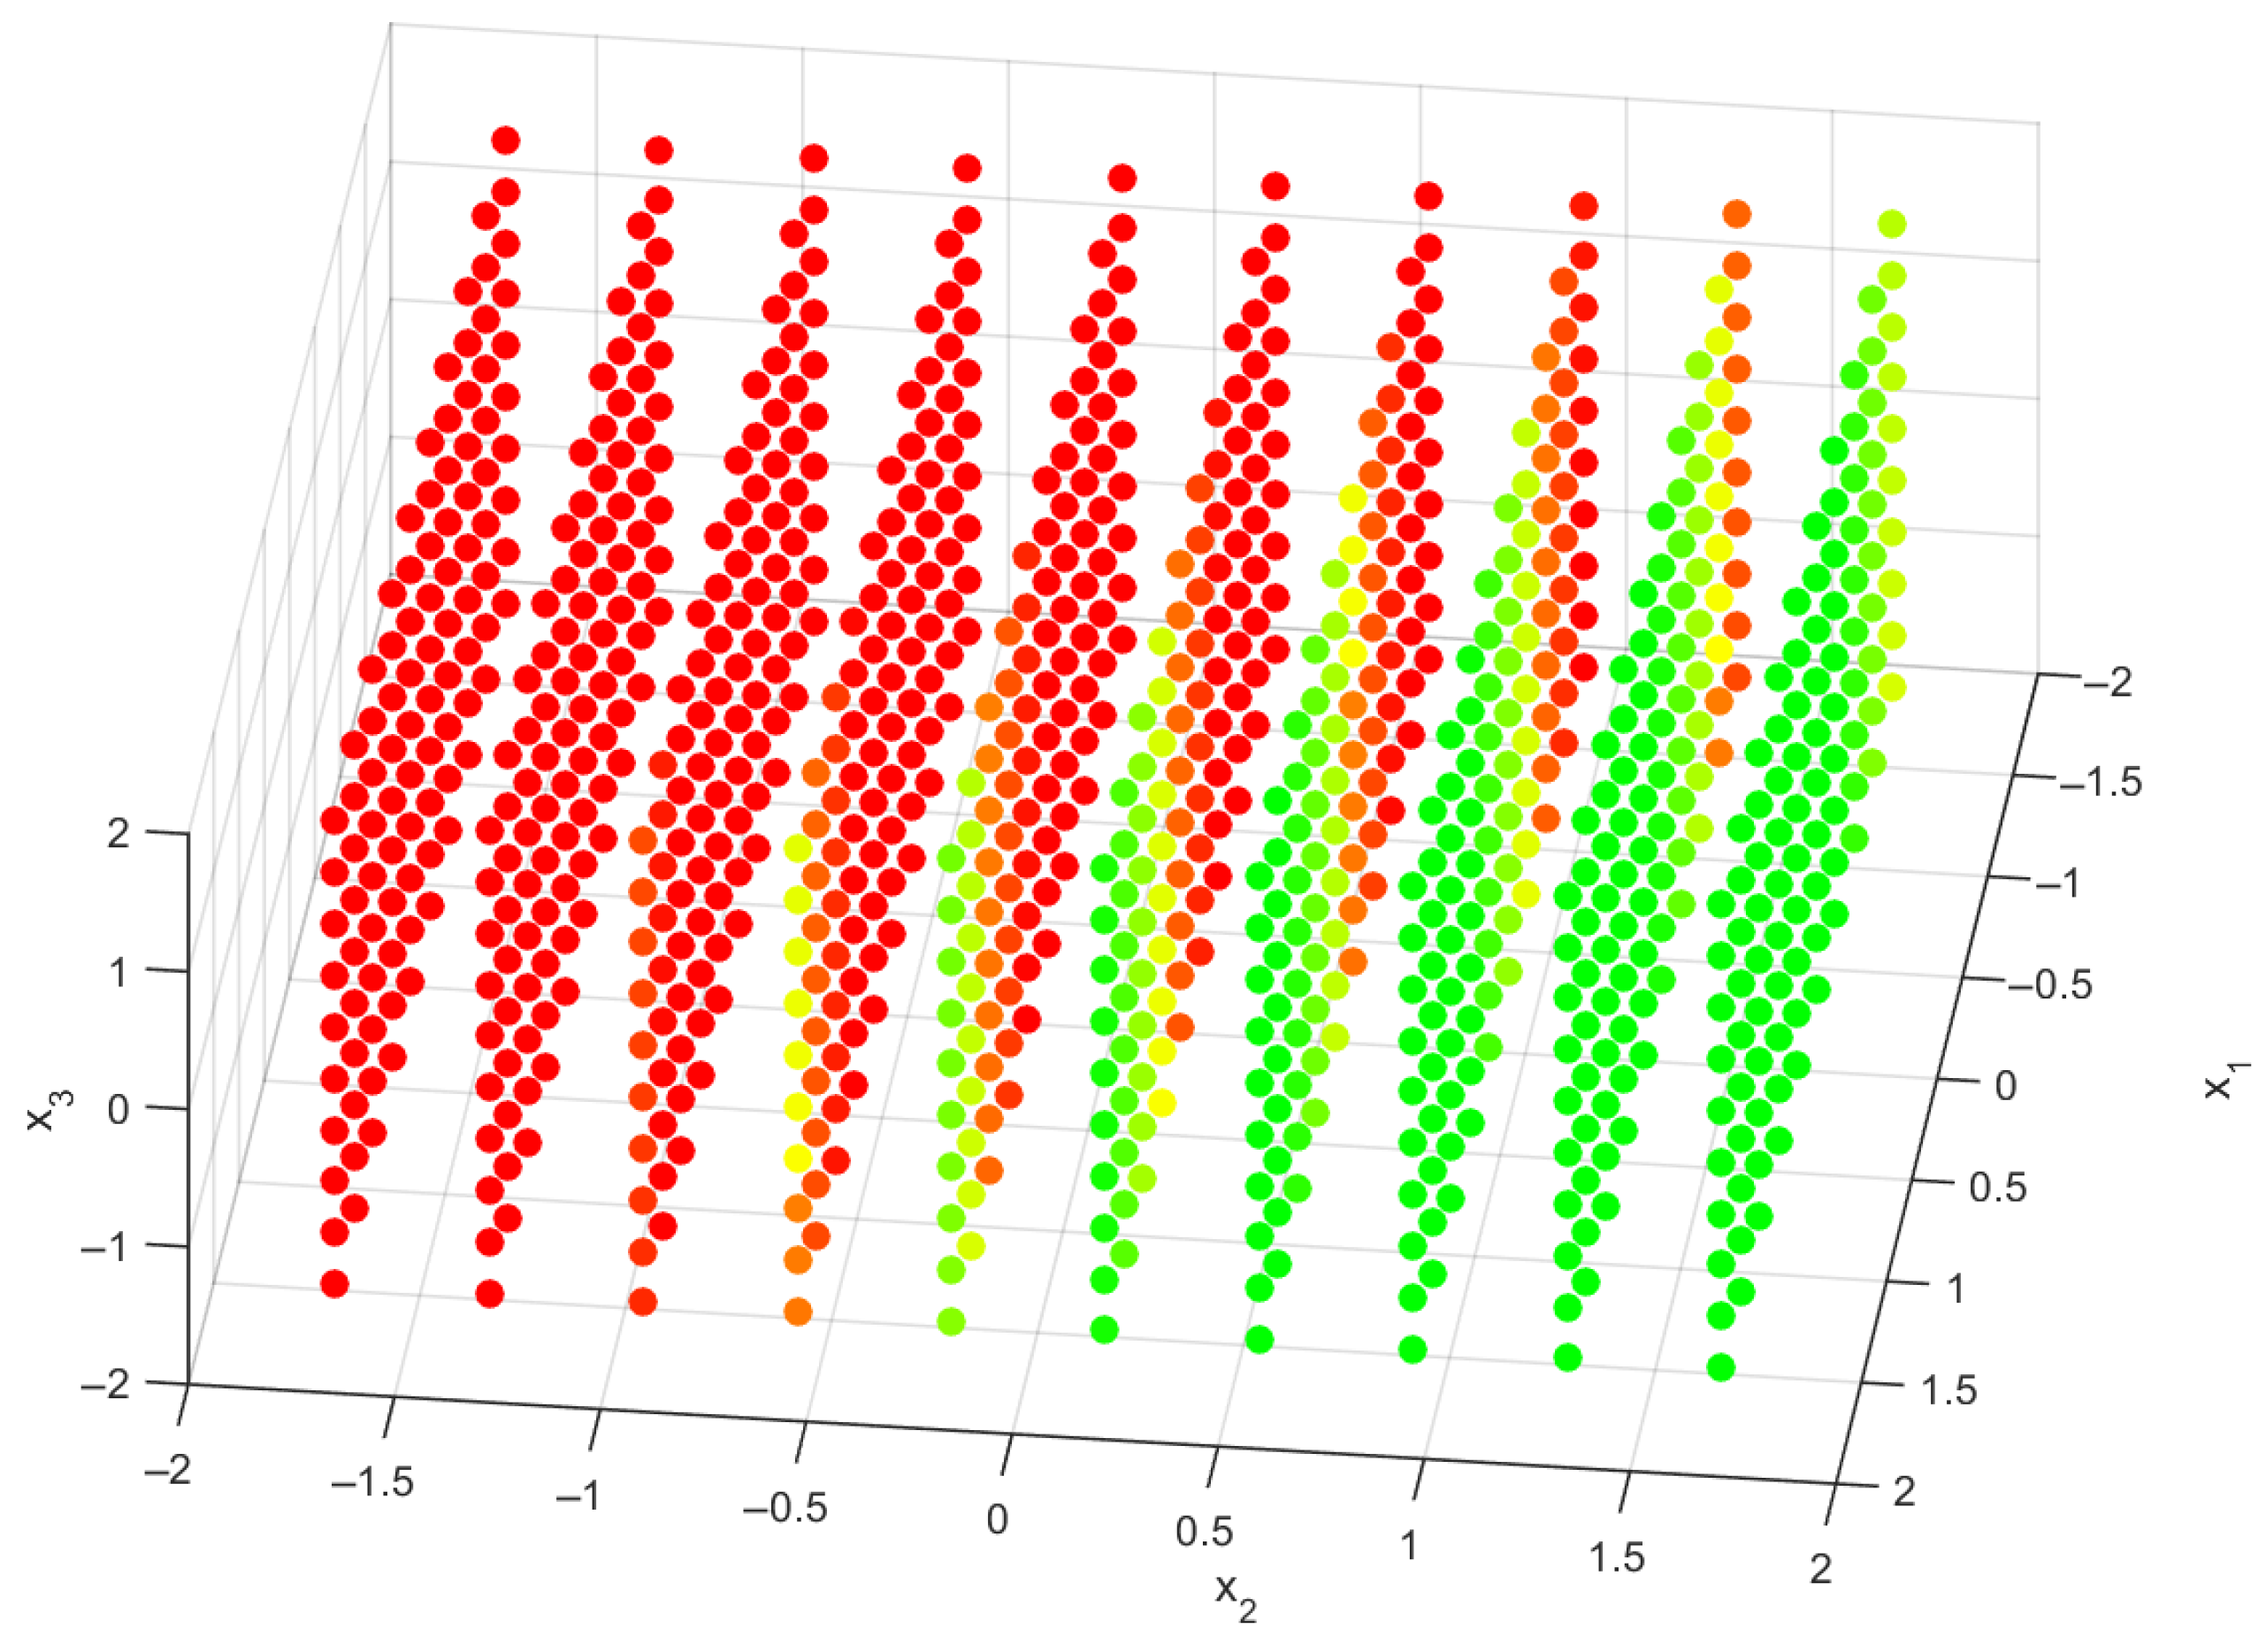
While some alternative designs may not achieve the ideal subtalar angle, they can still provide sufficient mechanical support and enhance user comfort. To illustrate the impact of translational stiffness on subtalar angles, a 3D scatter plot with a color gradient was created, as shown in
Figure 8. This visualization provides an intuitive way to interpret the simulation results by mapping various stiffness configurations to the predicted subtalar angles. The color gradient indicates different levels of injury risk. Specifically, red points indicate unsafe configurations where the maximum subtalar angle exceeds 25 degrees. Orange and yellow points represent transition regions, with maximum subtalar angles between 20 and 25 degrees, highlighting borderline configurations. Green points signify safe conditions for injury prevention, where the maximum subtalar angle remains below 20 degrees.
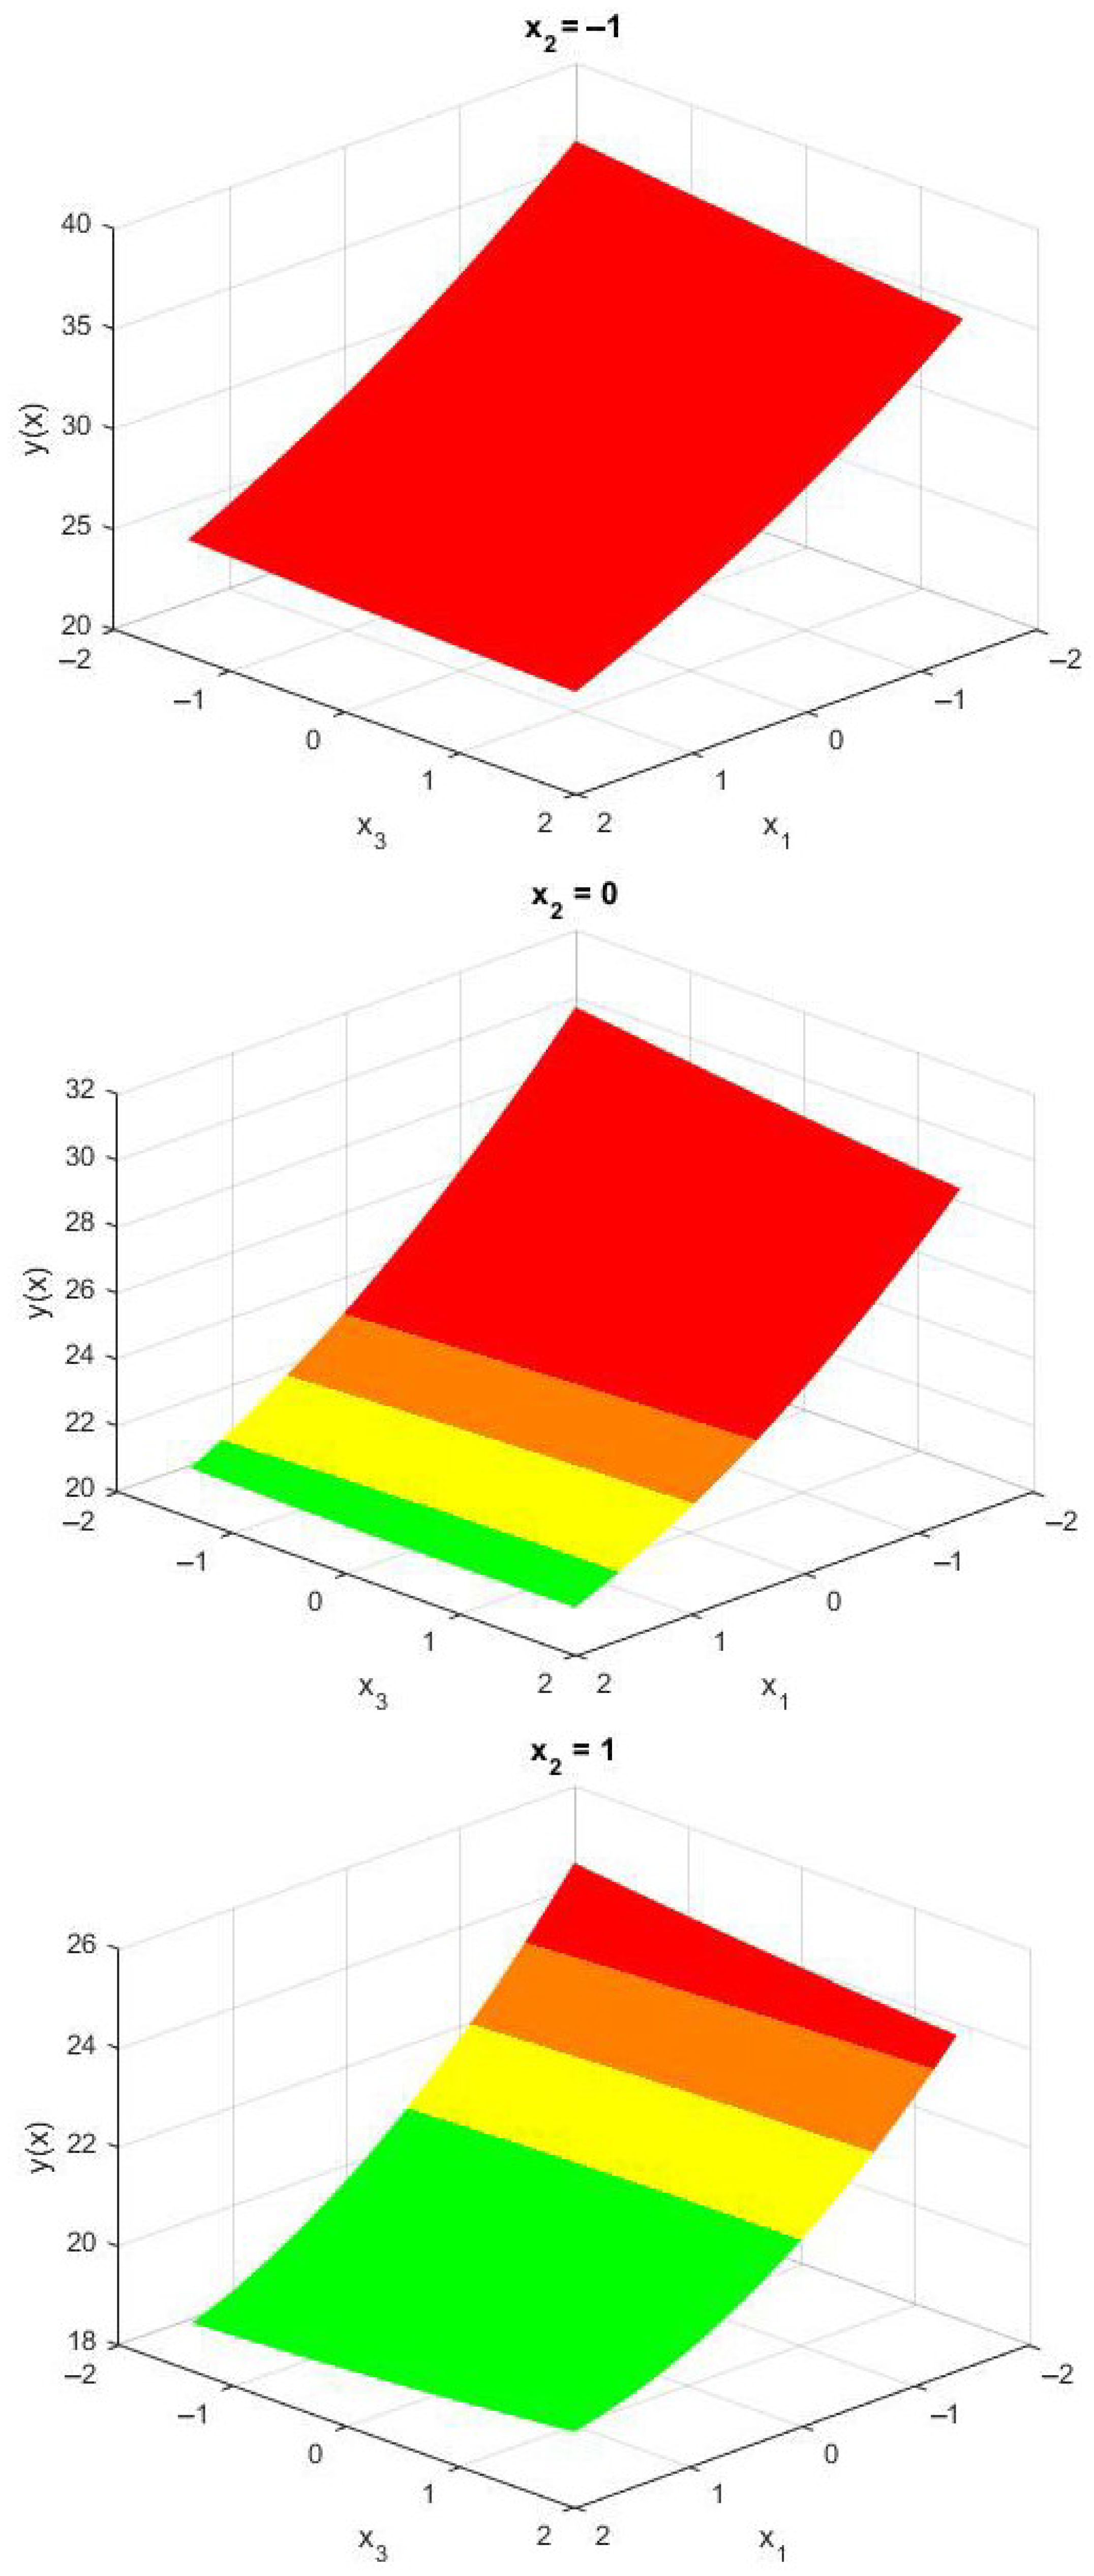
This visualization underscores the importance of stiffness parameters on injury risk and assists in identifying improved AFO configurations. It offers clear and actionable guidance for AFO designers. Given the especially high sensitivity of the maximum subtalar angle to the stiffness parameter
—a relationship that can be further confirmed by examining
Figure 8—three surface meshes are presented in
Figure 9, with the coded variable
held constant.
Overall, these results allowed the identification of stiffness combinations in the x, y, and z directions that effectively reduce subtalar angles to below 25 degrees. This highlights their potential for use in personalized AFO designs tailored to meet the biomechanical needs of individual patients.
4. Discussion
The present study builds upon previous research by examining variations in translational stiffness in ankle–foot orthoses and their impact on subtalar angles. Our findings align with those of Totah et al. [
25], who established that AFO stiffness significantly affects ankle kinematics, particularly dorsiflexion angles. We further quantify how increased translational stiffness, especially in the vertical direction (
), reduces the maximum subtalar angle.
Our research suggests that optimizing translational stiffness is crucial for preventing excessive subtalar motion, which is important for injury prevention. These results are consistent with the work of Waterval et al. [
26], which focused on the interaction between the bending stiffness of the AFO and the stiffness of the footplate. Their results indicated that increased AFO bending stiffness reduces energy costs and normalizes joint kinematics. Our study emphasizes the challenge of finding a balance in translational stiffness that promotes energy efficiency, normalizes joint mechanics, and ensures patient safety.
Our findings also align with the conclusions drawn by Waterval et al. [
27], which emphasized the importance of individually optimizing the stiffness of AFOs to enhance gait. Additionally, we support the observations made by Bregman et al. [
9] suggesting that the appropriate selection of AFO stiffness could lead to reduced energy expenditure for patients. Our surrogate model and the optimization results provide a concrete framework for achieving this personalization by identifying a range of optimal stiffness combinations that minimize subtalar angles while maintaining patient comfort.
Focusing on injury prevention, our findings further reinforce the relevance of personalized AFO design, a central theme in recent studies [
25,
26,
27] primarily addressing gait efficiency. By demonstrating that specific translational stiffness configurations can create injury-safe conditions, our study offers a pathway for integrating computational simulations into clinical design decision-making. The developed 4D design tool provides clinicians with an intuitive method to visualize the impact of stiffness combinations and select the most appropriate configurations for individual patients. In addition, the ability to fine-tune the stiffness parameters in the
x,
y, and
z directions allows custom AFOs that meet specific biomechanical needs, potentially improving rehabilitation results.
Despite the contributions of this study, several limitations should be acknowledged. The results were based on OpenSim simulations, which, as noted in prior literature [
25,
26,
27], may not fully capture the complexities of real-world gait biomechanics. Experimental validation, such as that conducted in studies [
28,
29,
30,
31] using motion capture and force plate analysis, is necessary to confirm the efficacy of the identified stiffness configurations. Furthermore, the practical deployment of optimized AFO designs poses additional challenges, including individual patient variability, usability for clinicians, and integration with current manufacturing workflows. These aspects, while beyond the scope of this initial framework, are essential considerations for clinical applications. Future work will involve comparative experiments to validate the simulation model against human gait trial data, focusing on joint angles, ground reaction forces, and subtalar kinematics, while also evaluating muscle activation predictions and the AFO model’s mechanical response. This will help assess the simulation framework’s reliability and its clinical application potential.
Finally, our surrogate model accurately predicted subtalar angles with a relative error of 5.53%, and its accuracy could be further enhanced through the application of machine learning techniques or higher-order polynomial models.
5. Conclusions
Advanced biomechanical modeling has the potential to enhance the design of ankle–foot orthoses, leading to significant improvements in user experience and clinical outcomes. This research has provided a deeper understanding of AFO stiffness optimization through extensive simulations, utilizing existing design tools such as finite element analysis, motion capture, and patient-specific morphological modeling. By systematically examining AFO stiffness parameters, this study emphasizes the possibility of creating personalized, data-driven AFO solutions that can help reduce the risk of injuries related to ankle inversion.
Furthermore, the current design space could be expanded to include additional factors beyond stiffness, such as AFO weight and motorized actuation, facilitating the creation of adaptive AFOs tailored to individual patient needs. Incorporating this methodology into the routine clinical workflow for designing personalized AFOs could represent a significant advancement in injury prevention and targeted rehabilitation strategies, ultimately enhancing long-term mobility and quality of life for users.


