Article

From Control Algorithm to Human Trial: Biomechanical Proof of a Speed-Adaptive Ankle–Foot Orthosis for Foot Drop in Level-Ground Walking

by
Pouyan Mehryar
1,*,
Sina Firouzy
2,*,
Uriel Martinez-Hernandez
3 and
Abbas Dehghani-Sanij
2
1
Department of Mechanical Engineering, Imperial College, London SW7 2AZ, UK
2
School of Mechanical Engineering, University of Leeds, Leeds LS2 9JT, UK
3
Department of Electronic and Electrical Engineering, Faculty of Engineering and Design, University of Bath, Bath BA2 7AY, UK
*
Authors to whom correspondence should be addressed.
Biomechanics 2025, 5(3), 51; https://doi.org/10.3390/biomechanics5030051
Submission received: 7 May 2025 / Revised: 14 June 2025 / Accepted: 23 June 2025 / Published: 4 July 2025
(This article belongs to the Section Injury Biomechanics and Rehabilitation)

Abstract

Background/Objectives: This study focuses on the motion planning and control of an active ankle–foot orthosis (AFO) that leverages biomechanical insights to mitigate footdrop, a deficit that prevents safe toe clearance during walking. Methods: To adapt the motion of the device to the user’s walking speed, a geometric model was used, together with real-time measurement of the user’s gait cycle. A geometric speed-adaptive model also scales a trapezoidal ankle-velocity profile in real time using the detected gait cycle. The algorithm was tested at three different walking speeds, with a prototype of the AFO worn by a test subject. Results: At walking speeds of 0.44 and 0.61 m/s, reduced tibialis anterior (TA) muscle activity was confirmed by electromyography (EMG) signal measurement during the stance phase of assisted gait. When the AFO was in assistance mode after toe-off (initial and mid-swing phase), it provided an average of 48% of the estimated required power to make up for the deliberate inactivity of the TA muscle. Conclusions: Kinematic analysis of the motion capture data showed that sufficient foot clearance was achieved at all three speeds of the test. No adverse effects or discomfort were reported during the experiment. Future studies should examine the device in populations with footdrop and include a comprehensive evaluation of safety.

1. Introduction

Footdrop is a gait abnormality in which the affected person cannot lift their forefoot on one or both of their feet. Pathologic diseases causing footdrop may originate anywhere along the neuromuscular route, from the pyramidal tract neurons in the cerebral cortex to the muscles used to elevate the foot [1]. The majority of people with footdrop have gait impairment and a severe decline in quality of life. It limits their ability to walk naturally and causes issues such as vaulting, instability, imbalance, trunk bending, and the risk of tripping and falling [2,3]. Information on the frequency and incidence of footdrop is lacking in the literature, as this condition could be due to primary neuromuscular disorders (peroneal nerve damage, spinal cord injury) or secondary conditions (stroke, peripheral neuropathy, musculoskeletal problems) [4]. Nevertheless, it is well acknowledged that the prevalence of footdrop is on the rise, mostly attributed to the growing elderly demographic, which is particularly susceptible to musculoskeletal disorders [5]. Assistive devices are used to support and maintain foot position, ranging from rigid to flexible, during walking swing phases to prevent dragging. Rigid braces are available that keep the foot at a certain angle at all times [6], but they limit the natural movement of the foot. A potential solution to this problem is the use of wearable robots, such as exoskeletons and active ankle–foot orthoses (AFOs). A few examples are described in the next paragraphs.
Exoskeletons have been used for the assistance of limbs in the upper body [7] and lower body [8]. Lower limb-powered exoskeletons have been developed with pneumatic actuators and electric motors [9,10]. They require either large air compressors or large electric power suppliers. Rigid ankle orthoses and ball screws have been used, but this concept leads to a heavy design [11,12].
Soft actuators have been used for the development of lightweight wearable robots [13,14]. Elastic materials and Boden cables have been shown to allow soft and lightweight designs [15]. Bio-inspired combinations of soft and rigid materials have been used for lightweight and comfortable ankle–foot robotic devices capable of providing active assistance [16]. All these robots rely on sensing and control methods that use predefined and fixed parameters, making them unreliable and susceptible to failure with even slight changes in their operating conditions. This limitation may be removed by suitable computational methods, including heuristic-based [17,18] and/or machine learning approaches [19].
Artificial neural networks (ANNs) and fuzzy logic (FL) are among the methods for the detection of activities of daily living (e.g., walking and running) using electromyography (EMG) sensors and inertial measurement units (IMUs). They yield accuracies ranging from 88.8% to 99% [20,21]. An average accuracy of 99% in the detection of walking activities has been observed by the use of ANNs, IMUs, and pressure sensors [22]. Support vector machine (SVM) is a computational method that has been studied using neuromuscular and mechanical sensors, shown to be capable of recognizing walking activities and gait phases with 77.3% to 99.0% accuracy [23]. However, these methods are susceptible to noise and uncertainty in sensor data. These limitations can be addressed by the use of probabilistic methods to handle uncertainty from sensor data and decision-making processes [24,25]. Probabilistic approaches such as dynamic Bayesian networks (DBNs), Gaussian mixture models (GMMs), and Gaussian processes (GPs) are becoming popular in robotics for a large number of applications [26,27]. Advances in the detection of human activities, with upper and lower limbs, have been observed by the use of DBNs and GPs methods, achieving accuracies ranging from 86.0% to 99.87% [19,28]. GMMs can detect walking activities with a mean accuracy of 91.3% [29].
One limitation of existing AFOs is that they rely on fixed and hard-coded detection and control methods, lacking the ability to adapt to changes in the user’s walking speed. This study addresses that limitation by developing an engineering-based control and motion planning strategy, grounded in biomechanical principles and adaptive to walking speed. This approach is entirely computational and does not rely on or model central nervous system strategies.
This article reports the latest progress of a series of research projects conducted at the University of Leeds, UK, aimed at the development of an automatic, active AFO for footdrop. In the first published article on this project [19], a novel method was introduced for the detection of the different phases of the human gait cycle, using a probabilistic approach and IMU data. This technique was then implemented on an initial AFO prototype with a simple design, for proof of concept [30] and later in human-in-the-loop trials [31]. An improved prototype was then developed and used for the study reported in this article.
This study focuses on the development, implementation, and assessment of a motion planning and control strategy that adapts to variations in the walking speed (and therefore, gait period) during level-ground walking. The proposed method is based on clinical gait analysis (CGA) data, the geometry of the AFO setup, and continuous gait period measurement.
At this early development stage, the safety of this method has yet to be confirmed. Therefore, two precautionary measures were taken. First, it was decided to perform the tests with a healthy subject with full lower limb ability. Second, the tests were performed at slow walking speeds. This has the additional benefit of making the test conditions more realistic since foot-drop patients typically walk at a slower pace than individuals without the disorder. These measures allowed us to evaluate the system under controlled, low-risk conditions and to verify that the device operated reliably, within the expected biomechanical limits, and without inducing user discomfort or observable adverse responses.
The performance of the device was assessed by studying data acquired by motion capture (MoCaP), mechanical power, and EMG, as explained later.
This study serves as a critical translational step, bridging algorithmic development with biomechanical validation. By using synchronized EMG, motion capture, and power data in a healthy subject simulating reduced dorsiflexion, we evaluated whether the AFO provides physiologically appropriate assistance across variable gait speeds.
The rest of this paper is organized as follows: Section 2 explains the motion planning and control method. The user test is described in Section 3, and its results are analyzed and discussed in Section 4. A summary and conclusions are presented in Section 5, together with limitations and suggested future work.

2. Motion Planning and Control Method

2.1. CGA Data of the Angular Velocity of the Ankle Joint

Figure 1 shows the angle and angular velocity of the ankle joint in the sagittal plane, during the swing phase of level-ground walking [32,33]. These data will be used together with the geometry of the device setup, as explained in the next section.

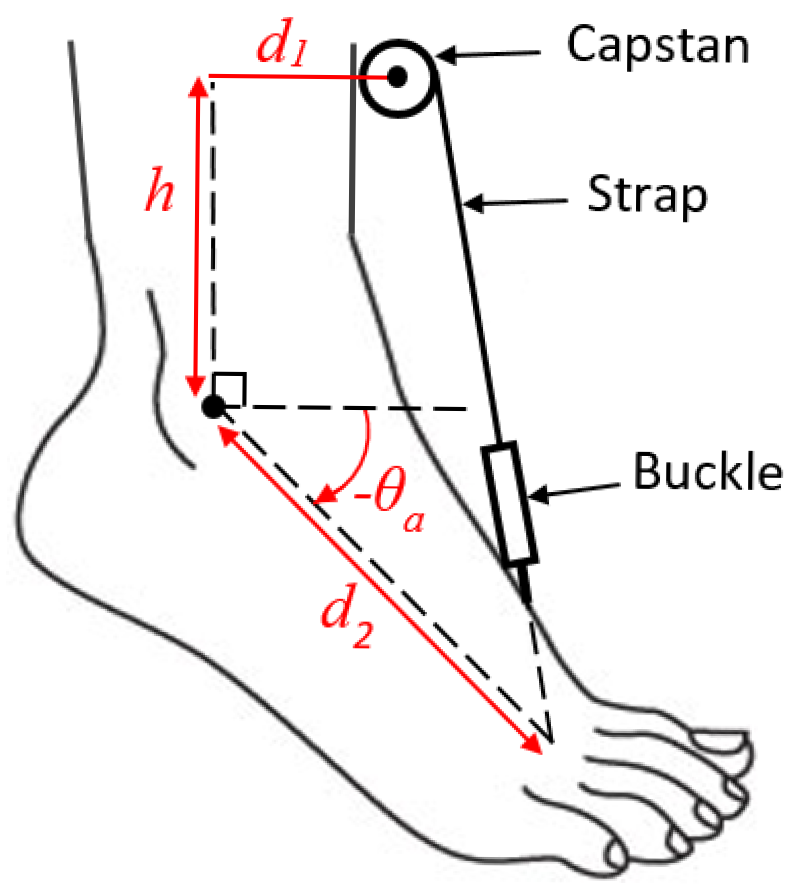
2.2. The Geometry of the Device Configuration
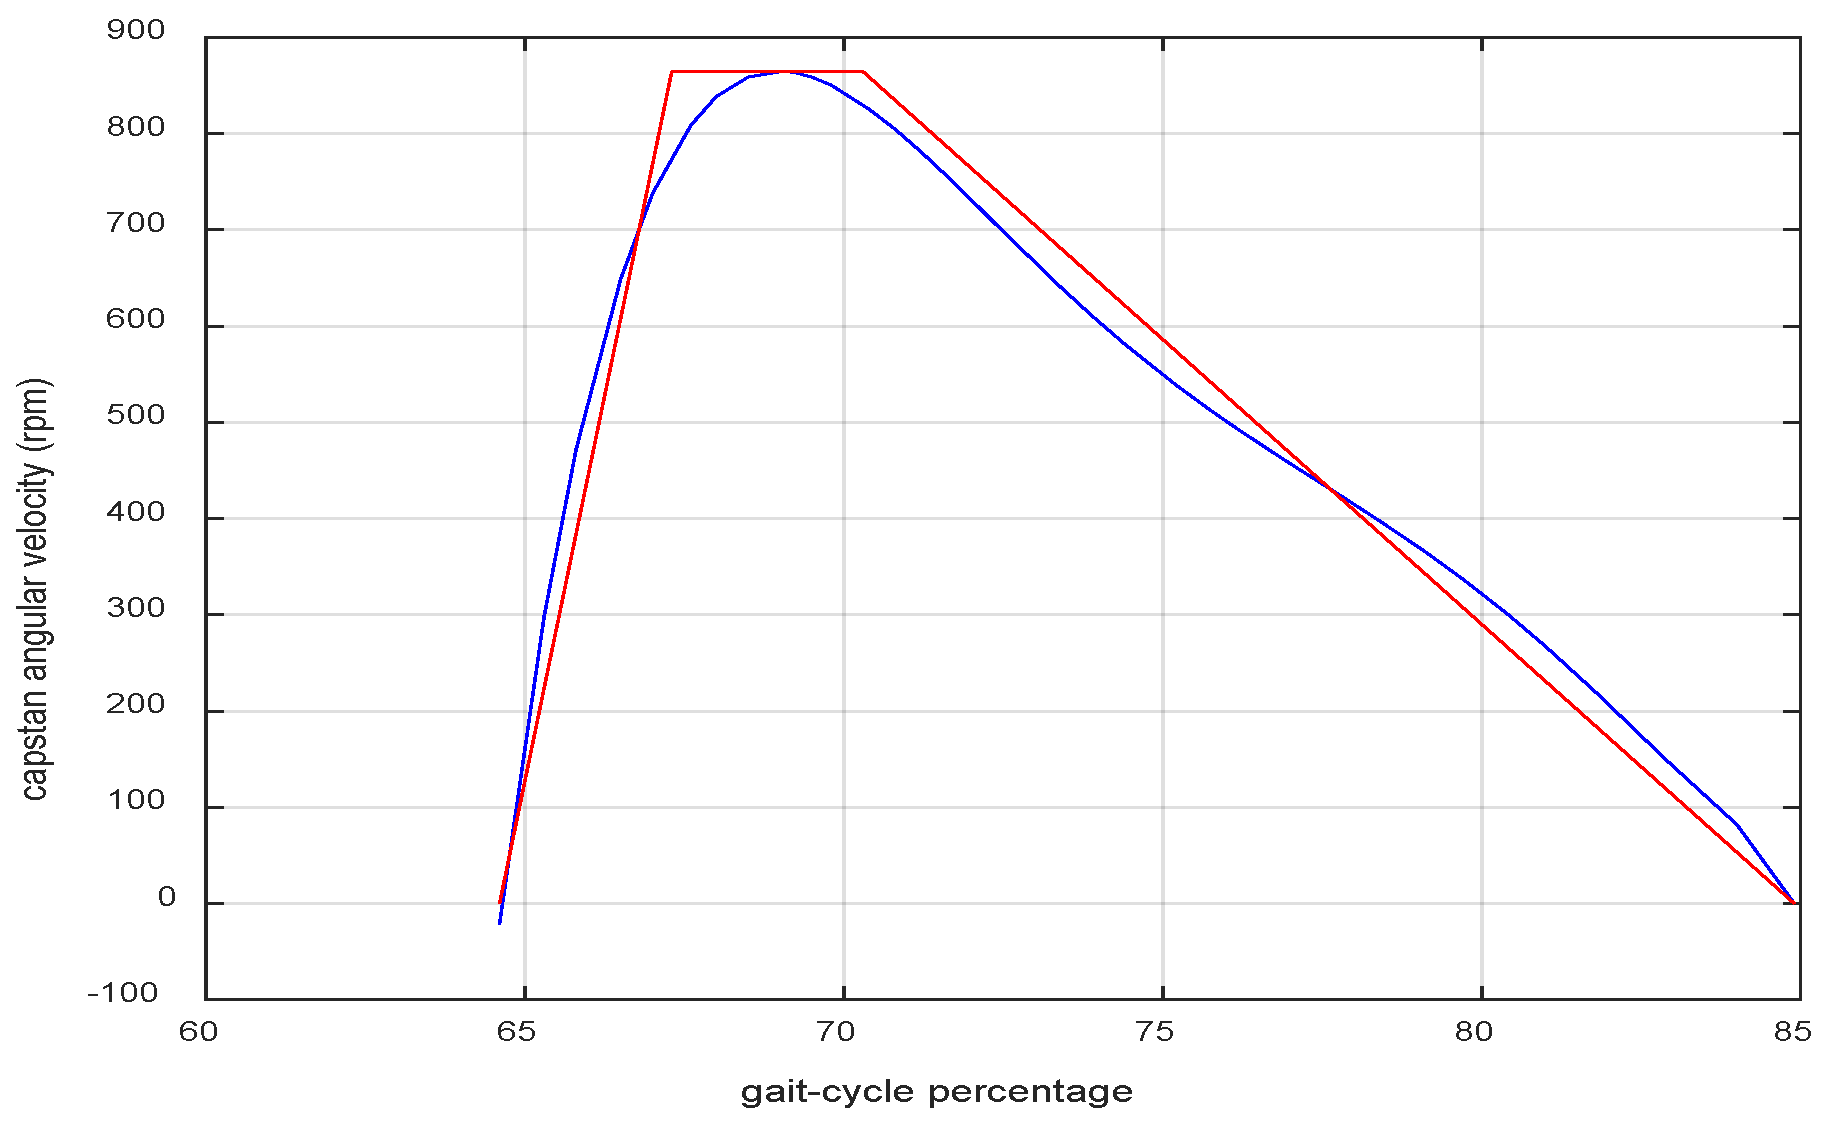
Figure 2 shows a picture of the AFO prototype. The user’s foot is connected by a buckle to a strap, the other side of which is attached to a capstan wheel. As the capstan wheel rotates, the strap winds around it and pulls up the user’s foot. Two pairs of bevel gears transmit the power from two electric motors to the capstan wheel. The two motors follow the same speed curve in opposite directions. Each motor also has an internal gearbox.
The geometric configuration of the system is depicted in Figure 3. The parameters d1, d2, and h, shown in the figure, fully determine the system model. A geometric analysis of this system yields the relation between the rate of change in the ankle angle   θ a ˙ and the angular velocity of the capstan wheel   θ c ˙ . This relation is nonlinear and dependent on the ankle angle ( θ a ). The equation is lengthy and will not be mentioned here. Figure 4 shows the resulting   θ c ˙ curve. To simplify the nonlinear speed curve, a trapezoidal approximation was used, shown in red in Figure 4. The parameters of the trapezoidal model were determined in an iterative procedure to find a close approximation of the nonlinear curve. The parameters were as follows:
  • Ramp-up time length: 2.7% of   T g ;
  • Maximum angular velocity of the capstan in rpm: 21,610 × T g ;
  • Constant speed time length: 3.6% of   T g ;
  • Ramp-down time length: 14.6% of   T g .
In the above, Tg is the gait period, in seconds. Due to its simplicity, the trapezoidal model can be easily updated in real time, using the measured value of the gait period, as explained in the next section. A speed generator algorithm creates the desired velocity of the motors at 1 ms intervals, which is then fed to the speed controller of each motor, as explained in Section 2.4.
Figure 3. The geometric configuration of the elements of the AFO.
Biomechanics 05 00051 g003
Figure 4. The profile of the desired angular velocity of the capstan wheel (blue) and a simplified trapezoidal model of it (red).
Biomechanics 05 00051 g004
It must be noted that the dimensions of the device configuration depend on the user’s foot size. The dimensions used here pertain to the test subject of this study.

2.3. Gait Period Measurement

The Bayesian detection algorithm identifies different events of the gait cycle, e.g., toe-off and heel strike. It sends the “assist” command upon detecting the toe-off event (of the foot wearing the device), and the “release” command before heel strike during the terminal swing phase (full details in [19,31]). The gait period is calculated by measuring the time elapsed between every two consecutive “assist” commands. Because this measurement can only be made after the first step has been taken, a default value needs to be assumed for the first step. For this purpose, the average human gait period (1 s [34]) was used.

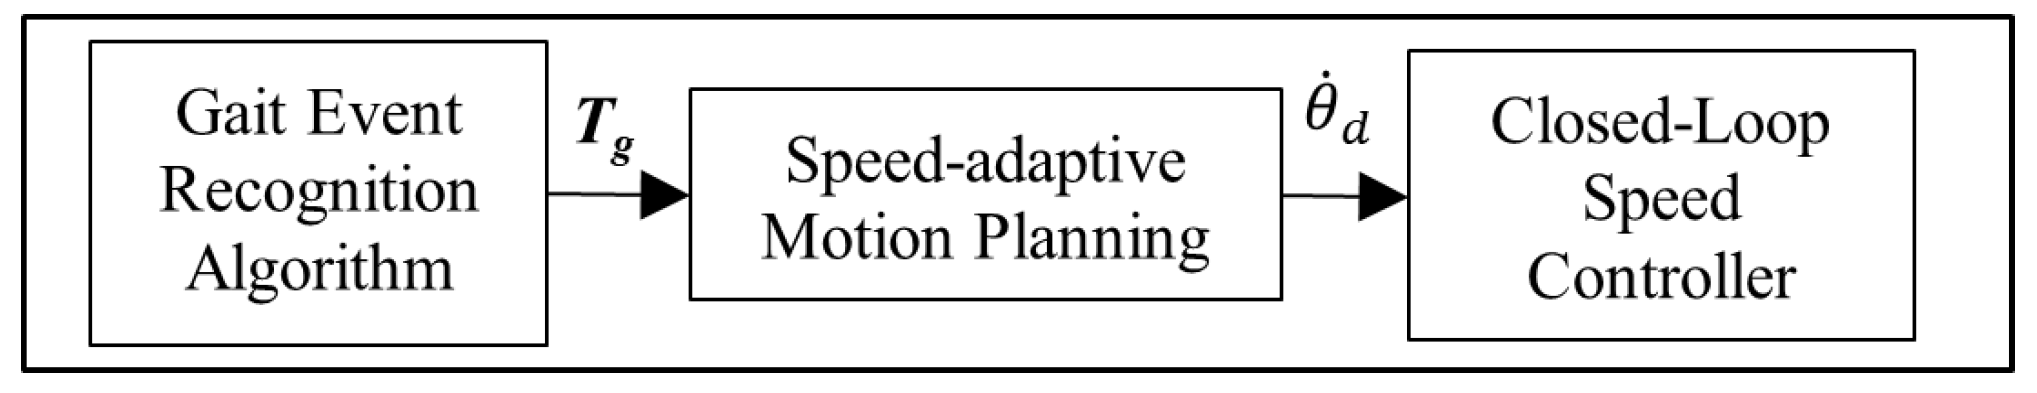
2.4. The Entire Motion Planning and Control Method

Upon receiving the “assist” command, a new value of the gait period is calculated and used to modify the parameters of the trapezoidal speed profile (Section 2.2). Using these parameters, the desired angular velocity of the motors   θ ˙ d is updated at a rate of 1 KHz and fed to the closed-loop speed control algorithm of the motors, as illustrated in Figure 5.
The shafts of the two motors are connected and bound to rotate at the same speed. However, they may contribute unequal portions of the total torque. To ensure a balanced share of torque contribution, the desired current is then fed to two separate current controllers, one for each motor. The current control loops use the PI algorithm tuning in a cascade control scheme, as shown in Figure 6. In the outer loop, the speed error of the motor shafts ( e θ ˙ ) is fed to a PID algorithm that calculates the desired current of the two motors,   i d (as differential control action can cause instability due to the fluctuating nature of current feedback). The current controllers will track the same current in the motor windings. This means that the torques of the two motors remain close to each other.

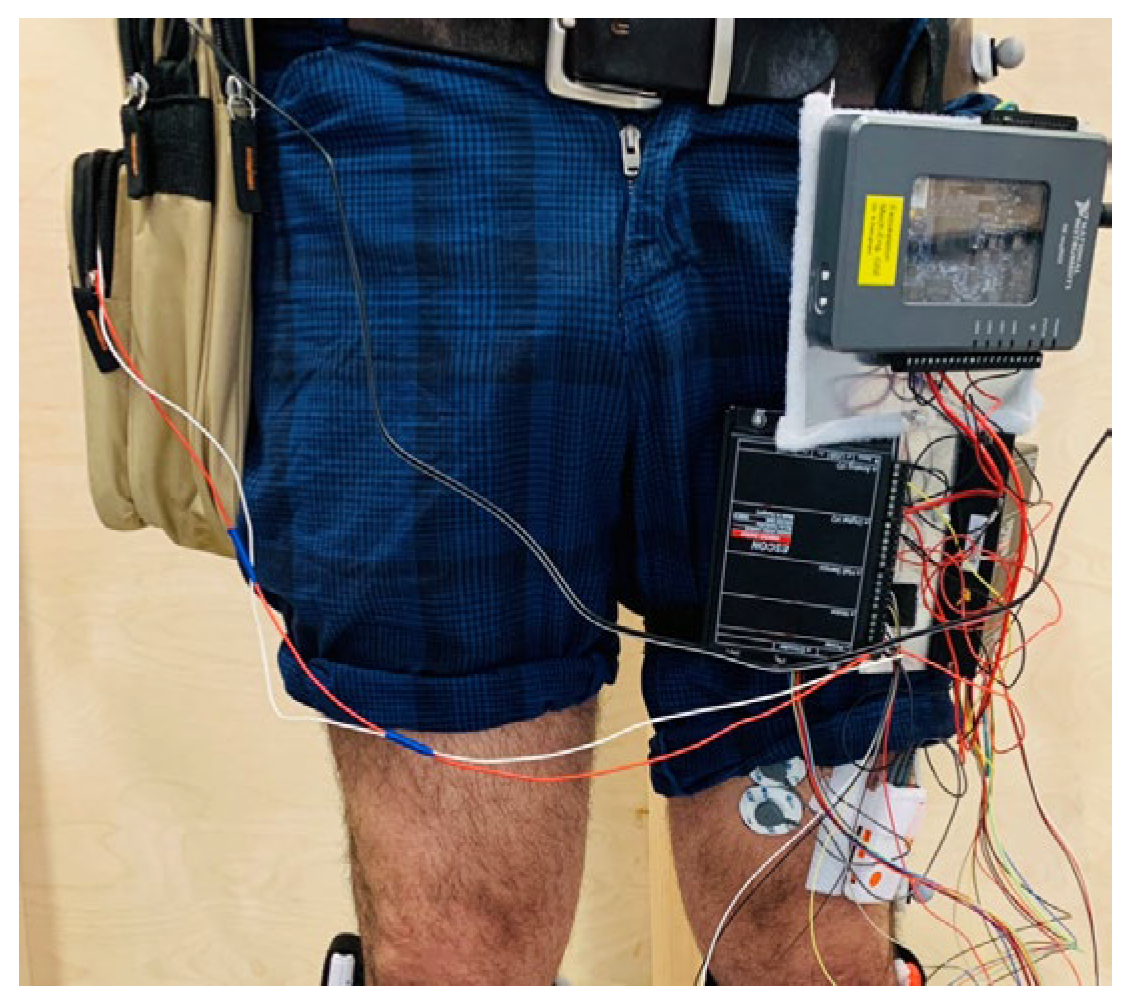
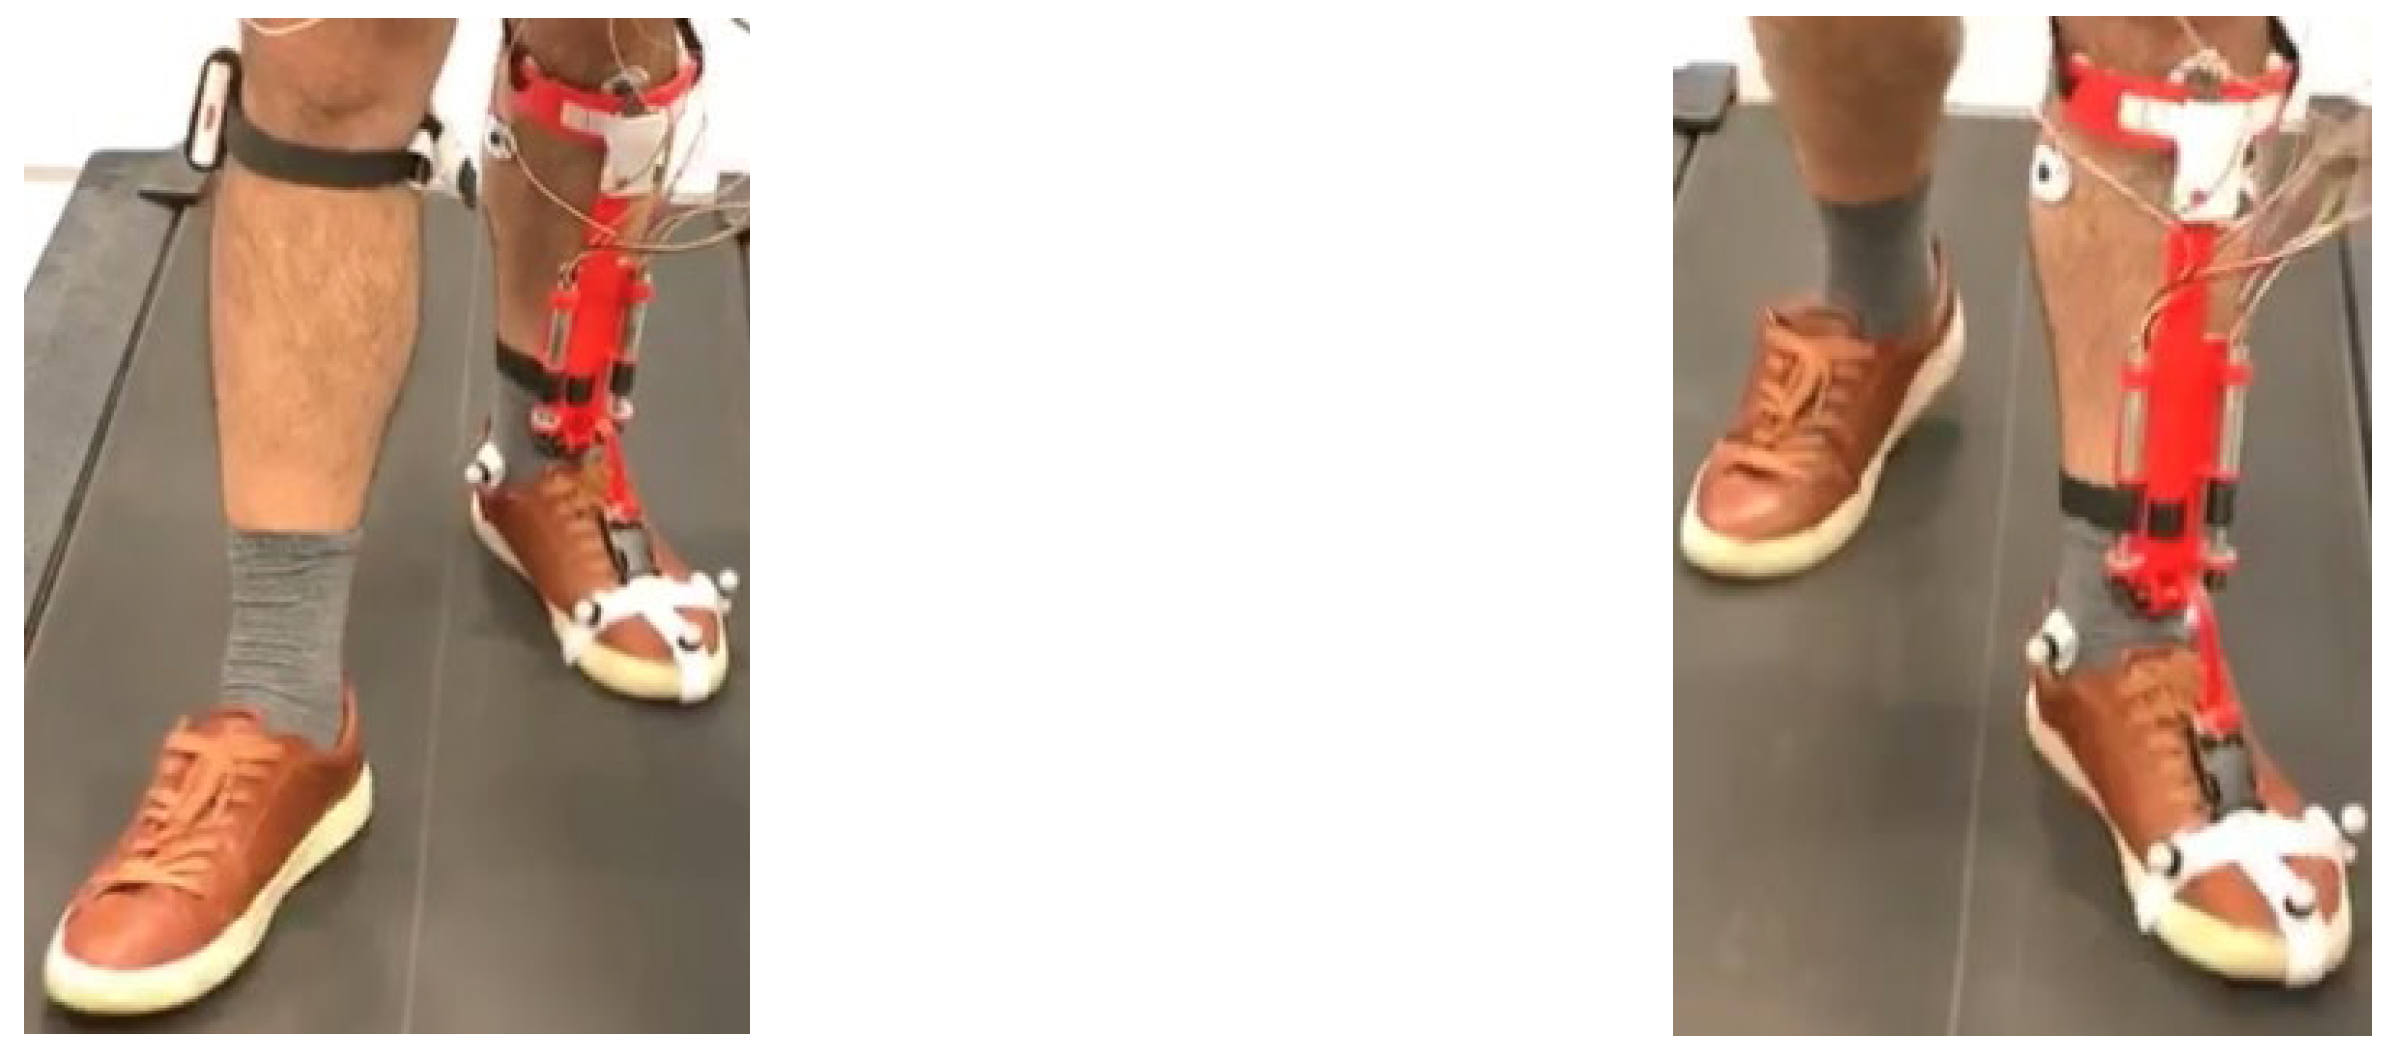
3. The User Experiments

User tests were performed on a 39-year-old male with no orthopedic or neurological pathology. The AFO was custom 3D-printed to the geometry of his shank and foot. A set of MoCap markers and an EMG sensor were attached to the subject’s body (Figure 2). The subject then wore AFO and the supporting electronics (Figure 7) and started walking on a treadmill, as shown in Figure 8. In the first set of tests, hereafter referred to as the normal gait experiments, the strap of the device was not buckled to the user’s shoe; therefore, no assistance was delivered to the user. However, the device was active and would pull up its strap and free buckle upon receiving the “assist” command. At every “release” command, the capstan would start to unwind the strap, allowing it to return to its original position. This was done to measure the no-load power, which is the amount of power needed to overcome the inertia and internal power losses in the device (more on this in Section 4.2).
EMG signal measurements were also performed to measure the muscle activation of the dorsiflexor muscle responsible for foot clearance, as explained in Section 4.3.
The tests were conducted at three different speeds, namely 0.44, 0.61, and 0.75 m/s. The test speeds were decided to be lower than the average healthy human walking speed (1.4 m/s) and closer to the footdrop patients’ speed, for safety considerations.
In the next set of tests, hereafter referred to as the assisted gait experiments, the strap of the device was buckled to the user’s shoe, and then the walking experiments were repeated at the same set of speeds as before. This time, however, the user was asked to relax the muscle responsible for lifting up his foot, i.e., the tibialis anterior (TA) muscle, on the side where the AFO was worn and avoid providing muscle effort to lift the foot. This would allow the device to provide power to pull up the foot. The subject was explicitly instructed to suppress tibialis anterior activation during swing and stance phases. Adherence to this instruction was reinforced through familiarization trials and confirmed through post hoc EMG analysis using SPM across 50 gait cycles.

4. Performance Assessment

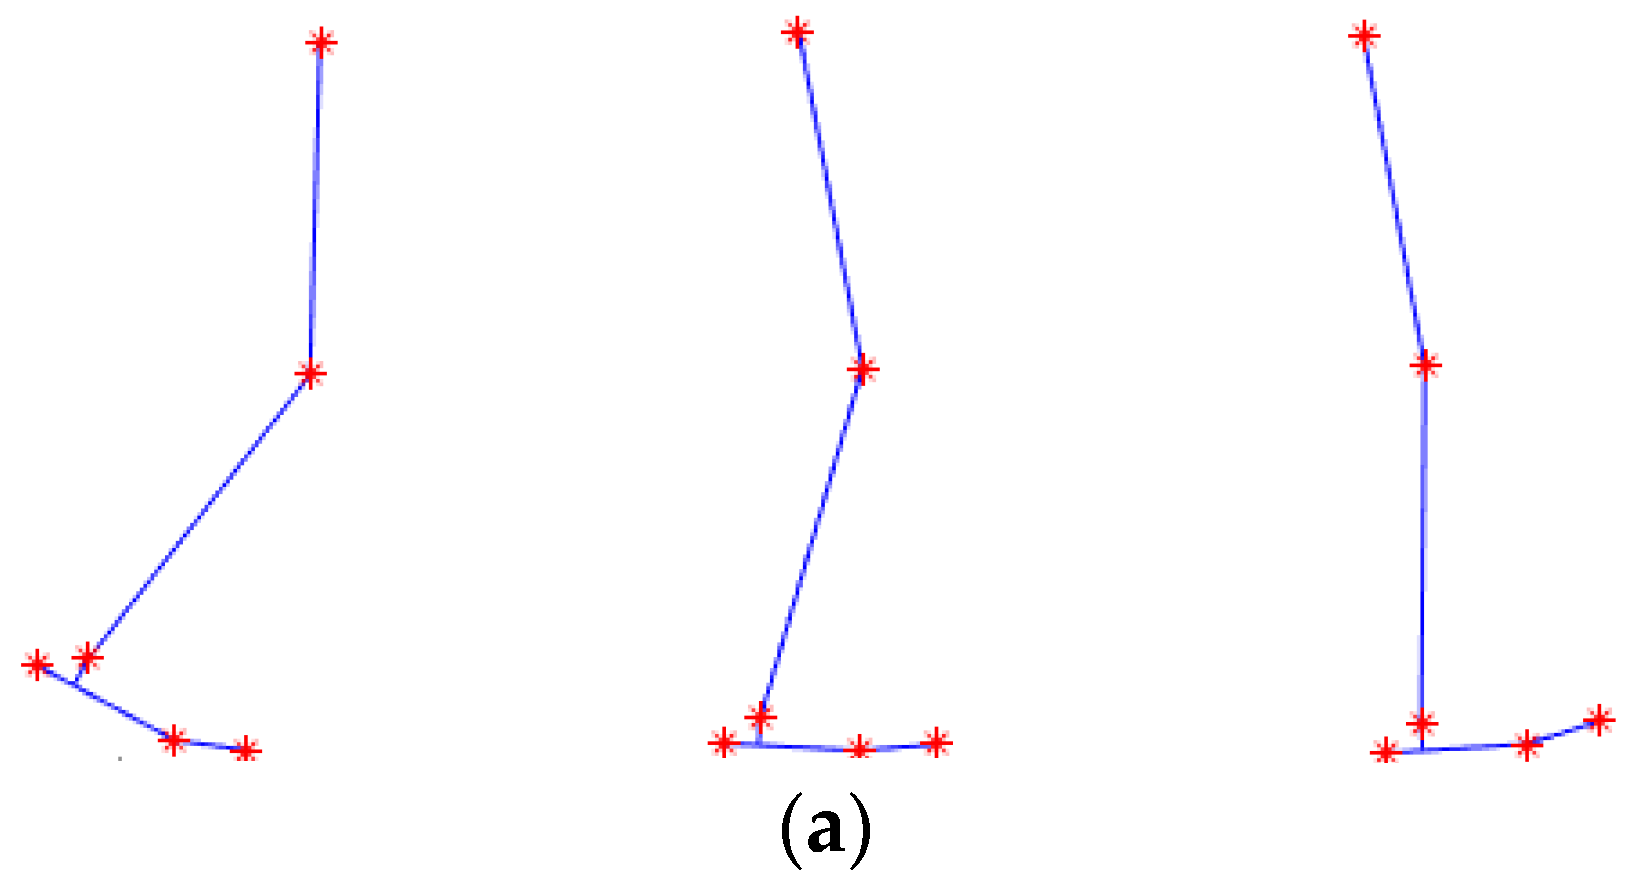
4.1. Motion Capture (MoCap) and Kinematic Analysis

Motion capture (MoCap) was used to assess the kinematic performance of the device. By using the MoCap data and a geometric model, the user’s ankle angle (in the sagittal plane) was recorded. This was done for both the normal gait and assisted gait experiments (explained in Section 3). A comparison was then made, as shown in Figure 9.
In Figure 9, the depicted section of the gait cycle starts with the toe-off (of the foot wearing the device) and ends with the heel strike (of the same foot). Each graph shows the value averaged over fifty gait cycles. Notice that, in the convention used here, the ankle is at zero angle when the user is in the standing position on level ground. Furthermore, an angle change in the positive direction corresponds to the tip of the foot moving upwards, and vice versa.
As shown in Figure 9, the ankle motion in the assisted gait (in red) is slightly larger than the normal gait (in blue). This raises concerns about safety and comfort, as well as power efficiency, as discussed in the next paragraph.
The first concern is safety; faster and larger angular displacements in the assisted gait might cause discomfort or even injury to the user by stretching the muscles. In the case of these experiments, the user did not report any discomfort when queried. Furthermore, the maximum angle that the ankle was displaced to was around 1°, which is well within the ankle range of motion of −45° to +30° [32,33]. Therefore, the slightly larger motion did not render the performance of the device uncomfortable or unsafe.
The second concern is unnecessary extra power consumption. Better power efficiency may be achievable by improving the motion planning and control method. This may, in turn, lead to a longer operation time on each battery charge. However, such fine-tuning improvements are outside the scope of this proof-of-concept study.
Since the user was walking without tipping over, it is already known that the clearance between the foot and the ground (necessary for walking without tripping) was created. However, kinematic analysis could not determine whether the foot motion was created by the device or by the user’s muscles for the following reasons: If the user’s muscles were incapable of providing any effort (which is the case in the foot-drop condition), then the device would operate under full load and provide all the effort necessary to achieve the desired motion. In contrast, in the case of our experiment with the healthy subjects, it is possible that the subject contributed some effort, which would mean that the device operated under partial load and therefore used less power. In either case, the motion of the foot may appear acceptable from a kinematic viewpoint. Therefore, we need a method to assess the user’s muscle effort and the amount of assistive power provided by the device, as explained in the next sections.

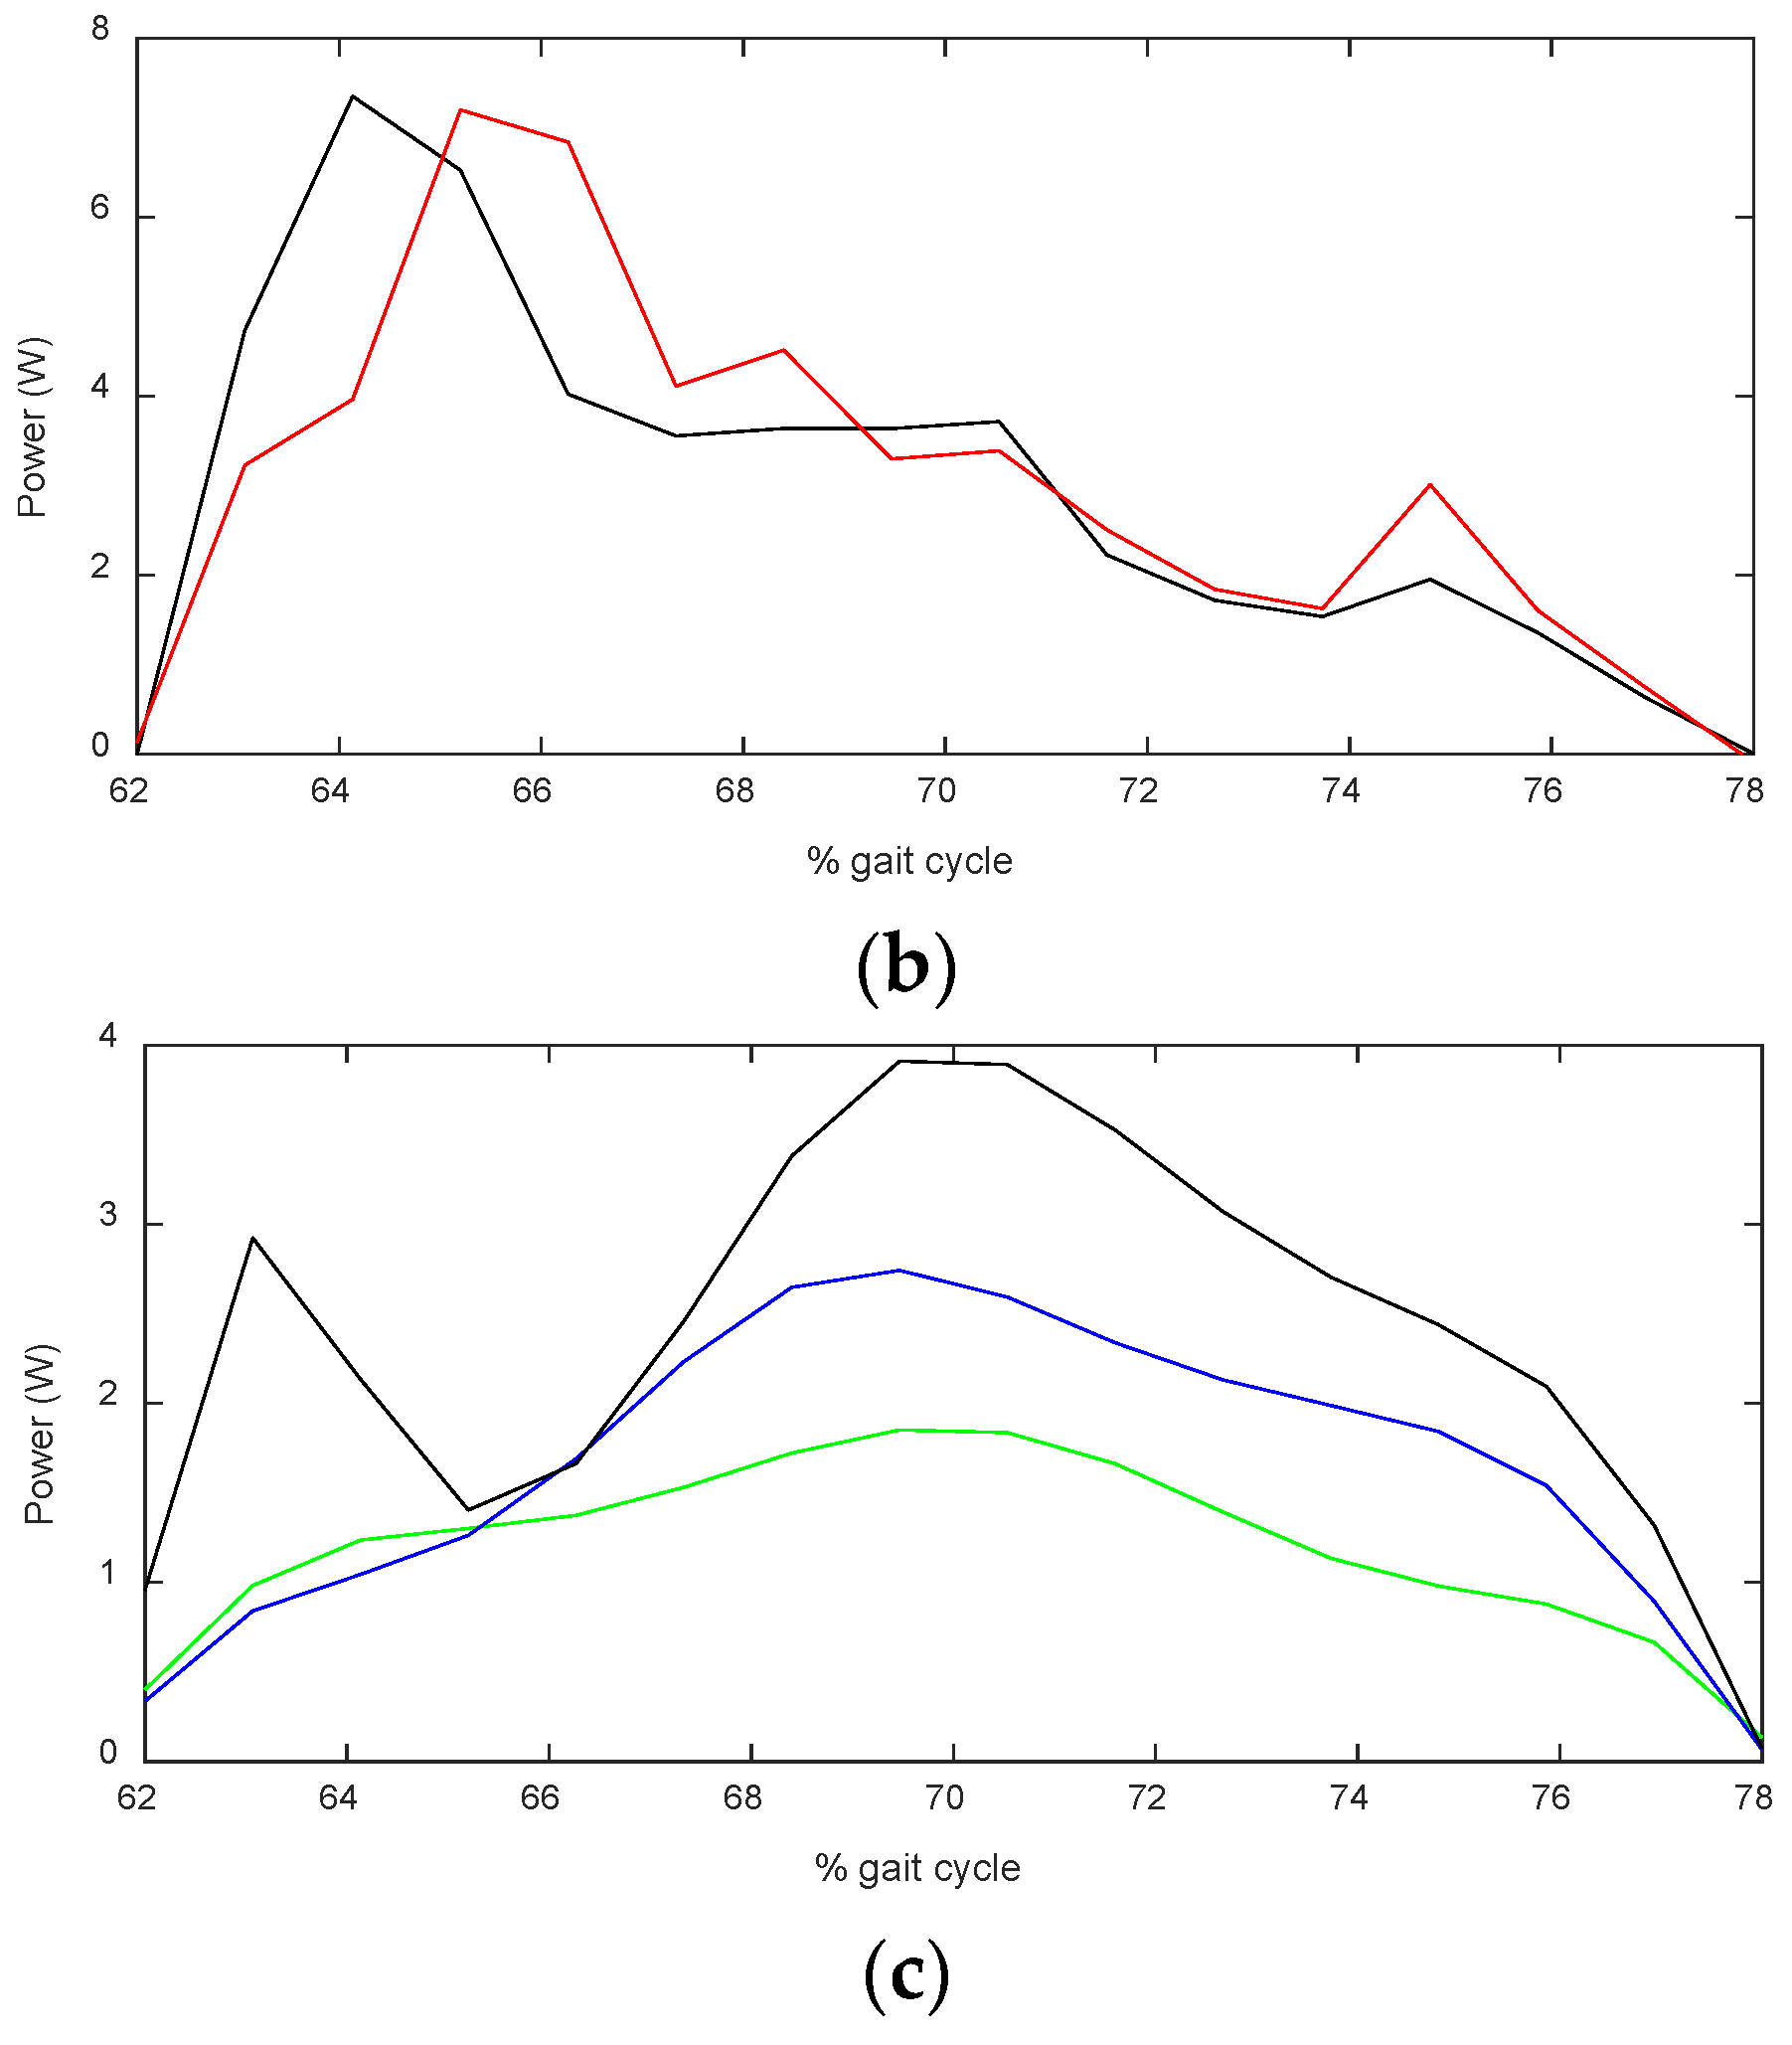
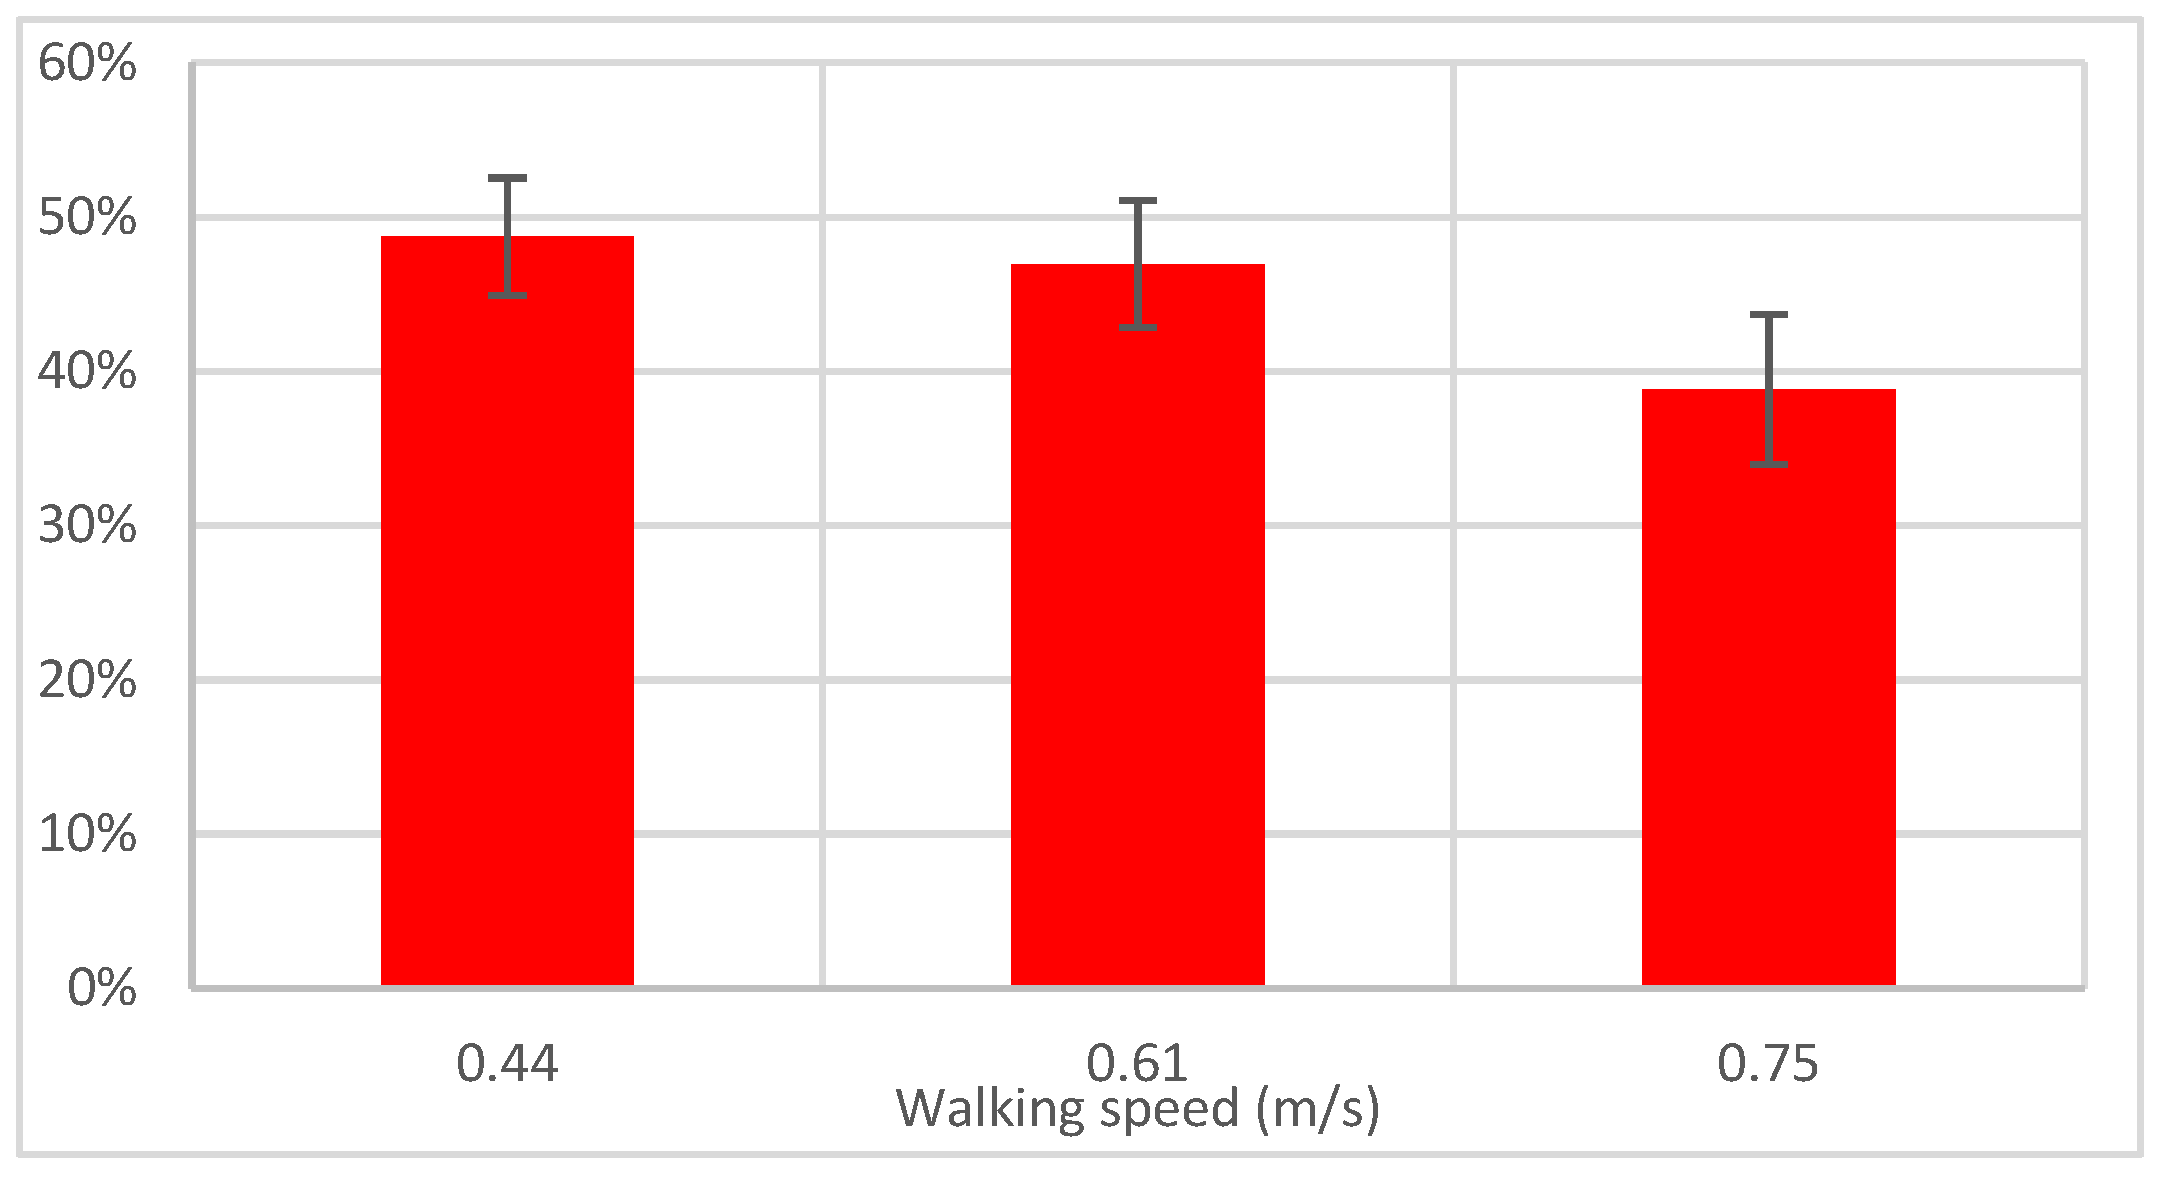
4.2. Measurement of the Output Power of the Device

The mechanical power delivered by the device can be compared to the required power, as explained in this section.
The total output power at the shaft of each motor is equal to its angular velocity (measured from the encoder feedback) multiplied by its torque (measured by multiplying the motor’s torque constant by the current feedback value). The result was multiplied by the efficiency of the motors and their gearheads (85% according to the manufacturer), as well as another efficiency factor of 95% (suggested in engineering literature) for the bevel gears, to yield the total output power.
To estimate the pure assistive power, the no-load power must be deducted from the total output power. The no-load power is the power used by the device when it operates without being strapped to the user’s foot, to overcome the inertia of the device components (shafts and other rerating parts, as well as the buckle at the end of the strap). The no-load power was measured by running the device without buckling its strap to the user’s shoe during the normal gait experiments and allowing it to pull up the unattached buckle. Note that the no-load power depends on the walking speeds. Therefore, for each walking speed, an average value was used, measured over several strides at that speed. The results are presented in Table 1. and will be discussed later in this section.
As for the required power at the ankle joint, data are available from the literature [32]. Here, we are only interested in the assistance phase, which starts at the toe-off event (at 62% of the gait cycle) and ends at the onset of the terminal swing phase event (at 88%), as shown in Figure 10. The data in the literature are for average human walking speed (1.4 m/s). However, since the experiments were conducted at different walking speeds, a simulation was performed to obtain an estimate, while using the literature data for the comparison and validation of the simulation results, as explained below.
The simulation was performed by writing the kinematic and dynamic equations of motion of the user’s leg, with input data from MoCap measurements. The equations were solved for each data sample by running the script in MATLAB (MathWorks®, version 2019b). Three snapshots of an animation of the simulation are shown in Figure 11a. Data on mass and moment of inertia of the human body segments are available in the literature [35], normalized to the total body weight. The normalized values were multiplied by the test subject’s body weight (85 kg), and the resulting values were assigned to the model parameters. These values are 1.23 kg for the foot mass and 1.1 × 10⁻³ kg.m2 for the moment of inertia of the foot around its center of mass, which is halfway between the heel and the toe tips. Finally, MoCap data from the experiments were used as the kinematic input to the simulations. The result was the torque at the ankle joint, from which mechanical power was calculated.
To assess the reliability of this method, the simulation was first performed with MoCap data of walking at the average human walking speed, and the results were compared to literature data, as depicted in Figure 11. Although the graphs are not identical, and peaks are observed at different points in the gait cycle, we are interested in the average power, as it indicates the total energy delivered to the foot. The average power of the data from the literature is 2.82 W, whereas the simulation yields 2.92 W, which is 3% larger. Since the results are close, the simulation can be used to estimate the amount of required power at other walking speeds, which are shown in Figure 11c.
The average values of the required power for the three speeds are reported in Table 1, as well as the power provided by the device. To assess the portion of the required power that was provided by the device, we defined the assistance ratio as the ratio of the assistive power to the required power. This parameter is illustrated in Figure 12. Notice that both the required power and pure assistive power were acquired over fifty gait cycles (with measurements of MoCap data and motor’s current feedback). Therefore, the standard variation in their mean value was calculated, and then the standard deviation of their ratio was calculated, which is shown in the error bars in Figure 12. The data obtained from the power analysis will be studied together with the EMG data in Section 4.4.

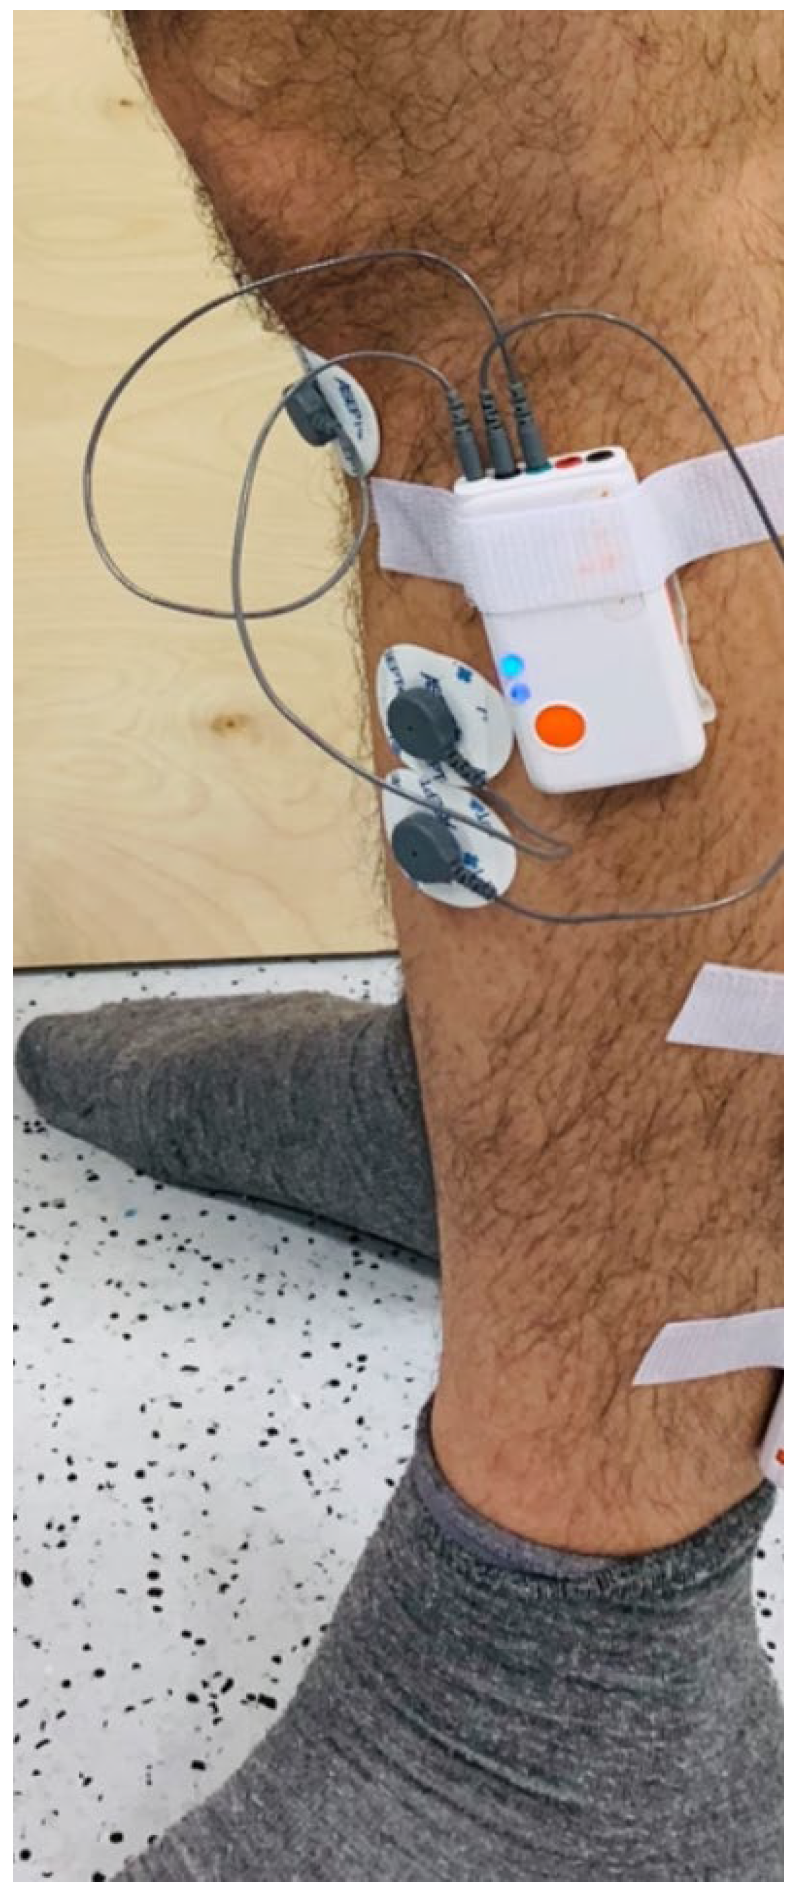
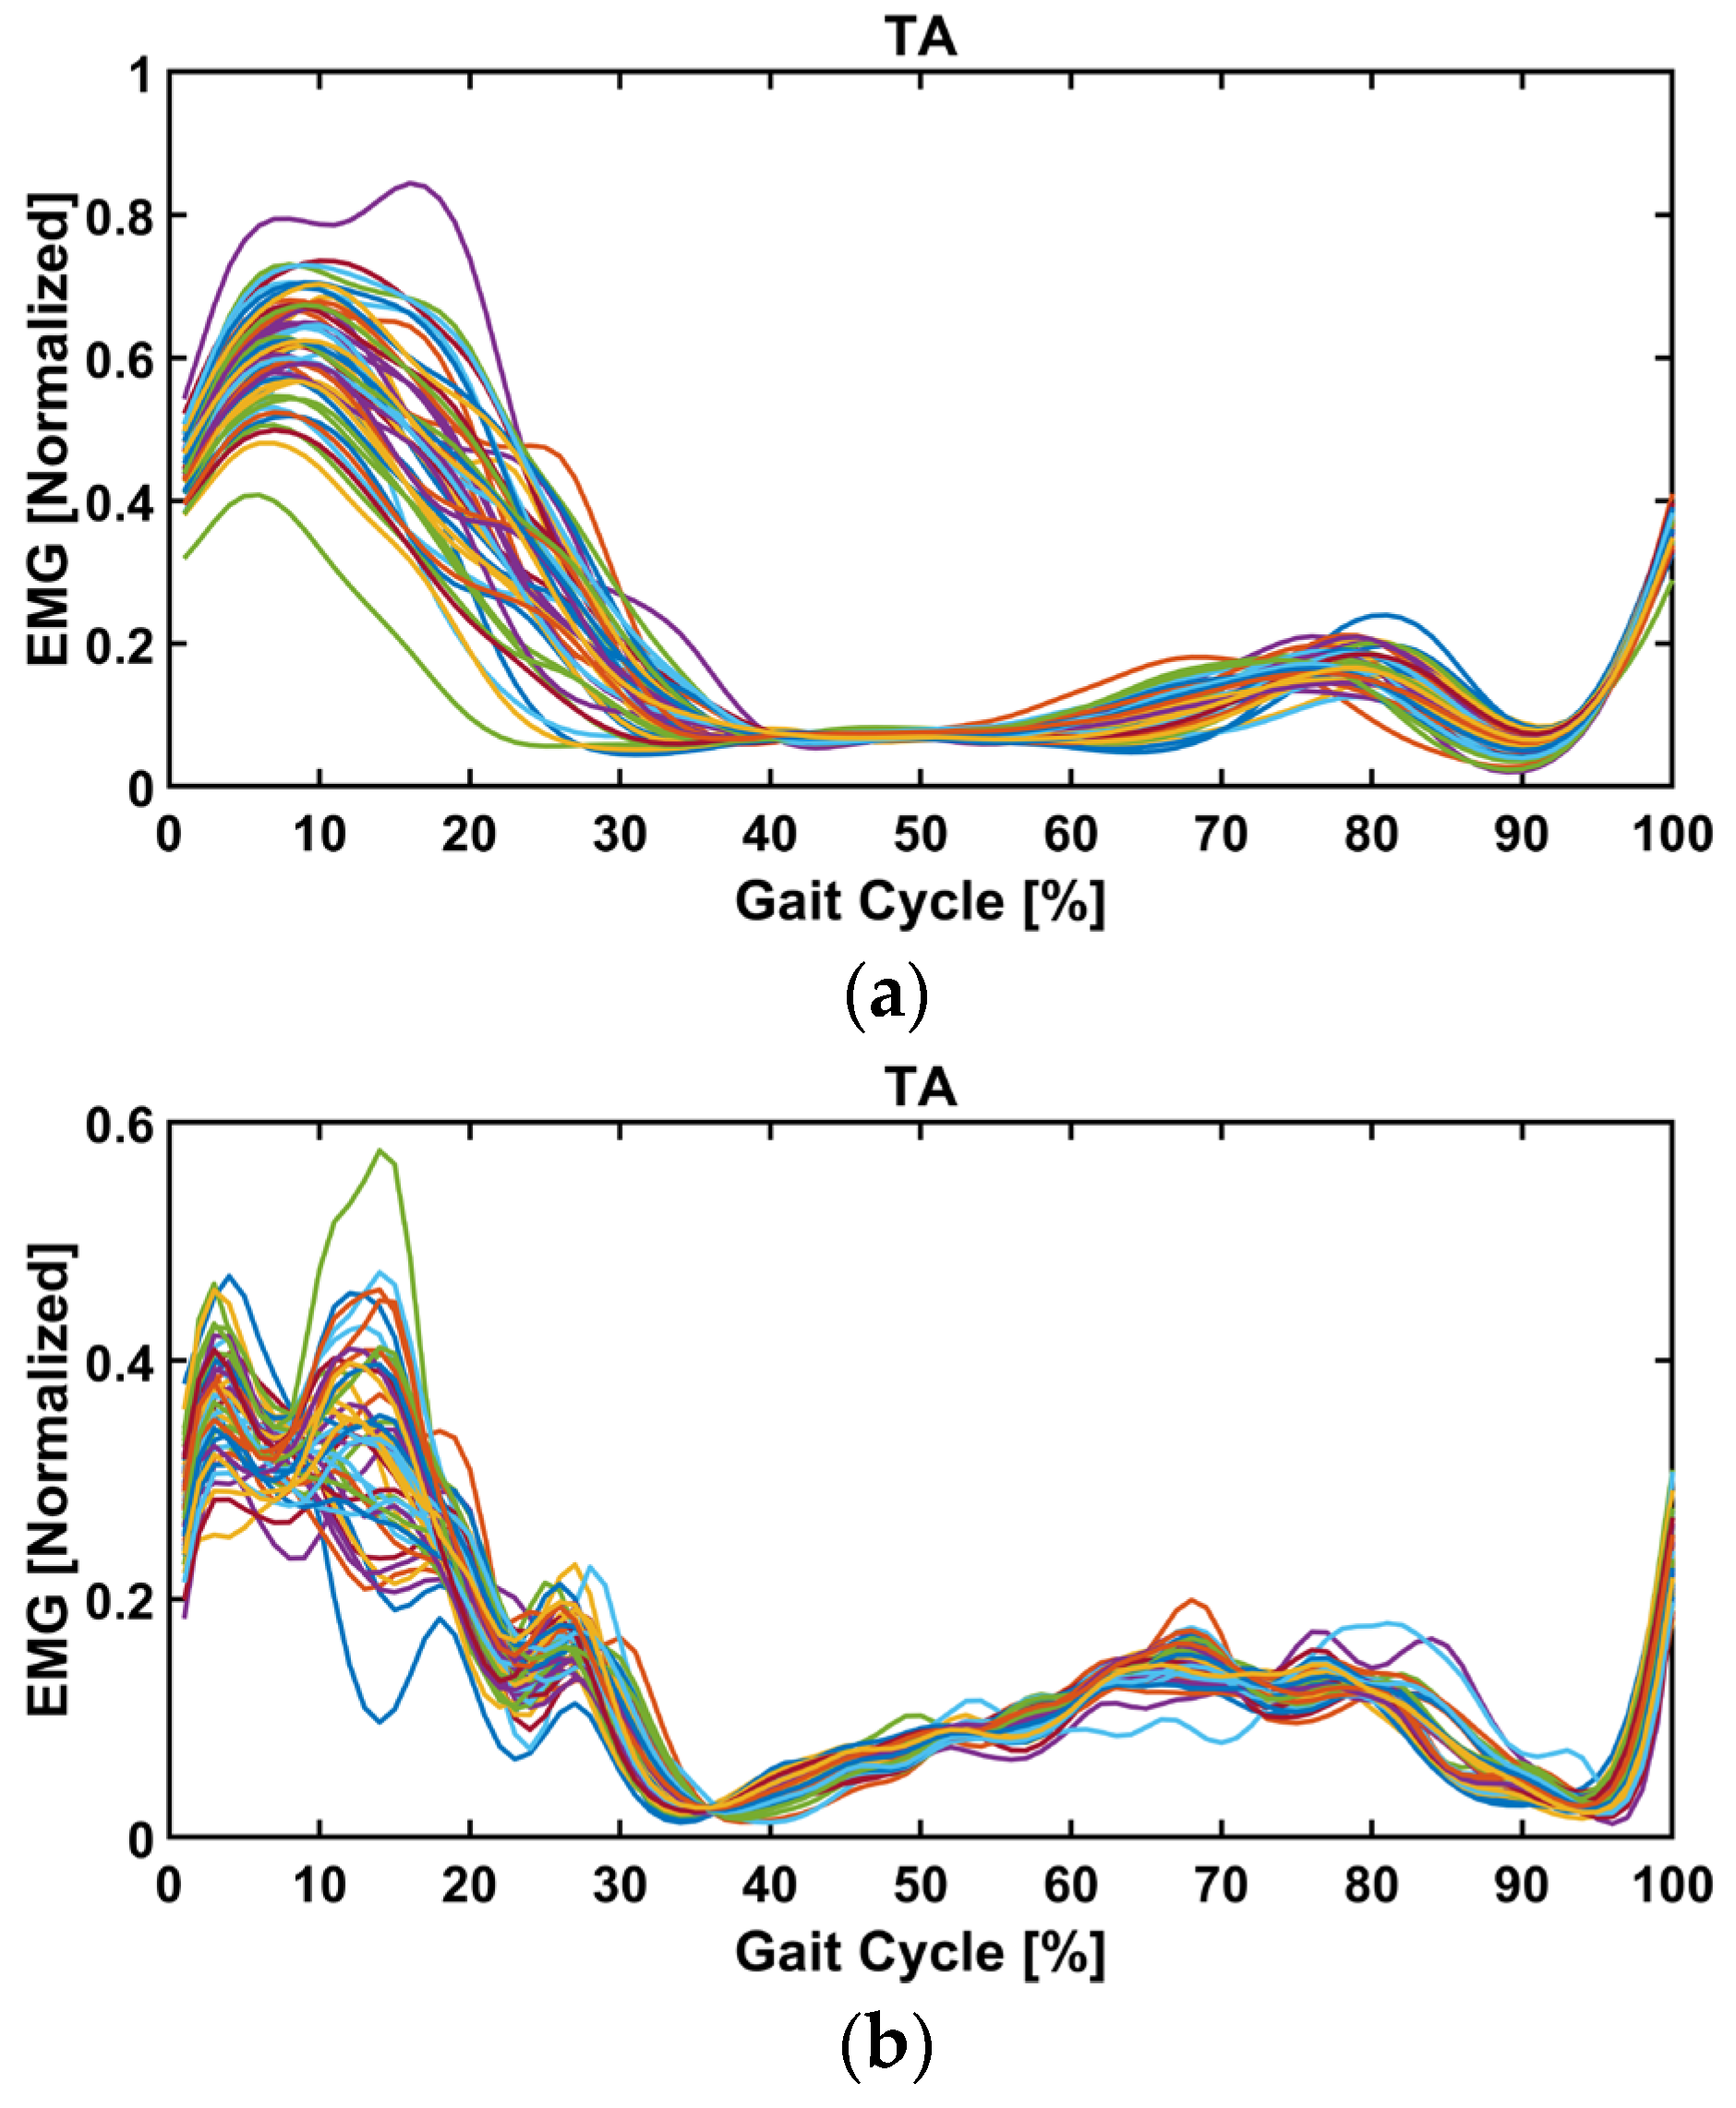
4.3. EMG Signal Measurement

To assess the amount of muscle effort and muscle activation provided by the user, high-dimensional (HD) surface electromyography (sEMG) signal measurement was used. sEMG is the electrical signal associated with the muscle contraction, which is essentially the sum of the action potential made by the active motor units [36]. The HD sEMG is a reflection of both peripheral and central properties of the neuromuscular system and so includes information from the brain, spinal cord, and muscular level extracted by means of a non-invasive approach, i.e., sEMG [37,38]. Muscle activation is a good quantitative indicator of changes in temporal information during the gait cycle [39,40]. Consequently, quantitative comparisons were made between normal and assisted gait at each speed using the statistical parametric mapping.
Surface EMG signal was recorded from one muscle of the subject’s dominant leg, the tibialis anterior. Shimmer™ wireless surface EMG sensors were used with a sampling rate of 1200 Hz and disposable, self-adhesive Ag/AgCl dual snap electrodes with an inter-electrode distance of 20 mm. The EMG electrode attachment location, shown in Figure 13, was determined by following Stegman and Mermans’ guide for locating the muscle belly, and the electrode was attached longitudinally with respect to the underlying muscle fiber direction [41].
Figure 14a,b show the EMG signals of a few gait cycles for normal and assisted walking, respectively. For the muscle activation comparison, a one-dimensional linear envelope trajectory was obtained.
For each walking speed, the EMG signal of the assisted gait experiment was compared to that of the normal gait experiment to obtain a measure of changes in muscle activation. To do this, linear envelopes were calculated separately for each separate gait cycle and for a total of fifty gait cycles. This was done for the assisted and unassisted gait experiments. For the muscle activation (Figure 14), the raw EMG was bandpass-filtered at a cutoff frequency of 20–500 Hz. Then, the linear envelope was obtained by rectifying and low-pass filtering the EMG signal using a second-order Butterworth filter and a cutoff frequency of 6 Hz. The data were normalized with respect to peak processed EMG values obtained from all walking trials at different speeds and interpolated to 101 data points corresponding to the gait cycle. All SPM analyses were performed in MATLAB using the spm1D 0.4 open source software package [42]. A paired t-test was conducted to compare the normal and assisted gait at various speeds. Both parametric and non-parametric tests yielded the same results, indicating that the data were normally distributed. Here, the parametric outcomes are displayed. The randomness was computed from the waveform, and the critical threshold was the statistical probability that the observed trajectories were not random. When the time series exceeded the threshold, the waveforms were considered statistically significantly different. Section 4.4 investigates the pure assistive power from the device and muscle activation comparison between normal and assisted gait at each speed.

4.4. Assistance from the Device and Muscle Activation Comparison

In this section, the pure assistive power of the device is studied together with the EMG signal (as an indicator of muscle activation). It must be noted that a conversion of the EMG signal to mechanical power could not be performed, due to the complex and nonlinear nature of the biomechanical system being studied. However, the linear envelope of the signal is indicative of the changes in muscle activation between the normal and assisted gait at each speed.
The red bars in Figure 12 show the pure assistive power of the device, normalized to the estimated required power for the same speed. This parameter is referred to as the assistance ratio. This is a quotient of two values, and its standard variation was calculated from the standard variation in the nominator and denominator and is shown in the error bars.
In all three speeds (0.44, 0.61, and 0.77 m/s), the assistance ratio was 49%, 47%, and 39%, respectively. This was confirmed by the SPM analysis performed on the linear envelope of the EMG signal between the normal and assisted gait at each speed. As shown in Figure 15, no significant differences were observed when the AFO was in assistance and hold mode, i.e., the initial and mid-swing phases for all speeds (d, e, and f). This suggests that the assistance provided by the AFO compensated for the lack of tibialis anterior muscle effort as opposed to the stance phase, where statistically significant differences are illustrated at lower speeds (0.44 and 0.61 m/s) in different regions (Figure 15d,e), indicating a lack of proper muscle activity. It is interesting that significant differences exist during terminal swing (88–100% of gait cycle) between conditions in 0.44 and 0.61 m/s due to the fact that the AFO stops to assist in bringing the foot down (release mode).
At the third speed (0.75 m/s), however, the assistance ratio was smaller (39%), as the muscle activity exhibited a similar range as normal walking. In other words, the user and the device simultaneously worked to lift up the foot. This finding is in accordance with the result of the kinematic analysis in Section 4.1, where the ankle was shown to be pulled up higher than necessary at the third speed. SPM analysis between normal and assisted gait showed no statistically significant difference, indicating the user instinctively activates his muscles at this speed; that is, while the user provided most of the required effort, the device also provided a noticeable portion of the required power and sufficient actuation effort explained in Section 4.1.

5. Discussion, Conclusions, and Limitations of This Study

While sufficient joint movement is needed for the efficacy of the device, avoiding excessive motion is also necessary for the operation safety, to prevent discomfort and injury. Further, the device needs to create a joint motion in a timely manner at different walking speeds; otherwise, foot clearance would not be guaranteed. This would render the device unsafe due to the possibility of the user stumbling. These aspects are discussed in this section.
The kinematic analysis showed that the joint motion caused by the device was both sufficient and in time to create the necessary foot clearance. This verified the efficacy of the motion planning. Furthermore, although the joint motion was slightly larger with the device, the user reported no discomfort, and the motion remained within anatomical limits. However, this observation alone does not constitute a formal safety evaluation, which would require a dedicated clinical investigation.
Comparison showed that while the assisted power of the device was increased at the highest speed (0.75 m/s), the reduction in the muscle activation was much lower than that in the other speeds (indicating the user’s inability to reduce muscle effort).
At higher speeds, the motion planning method reported here is based on the angular velocity curves of the ankle joint from the literature, and scaling the curves according to walking speed. A more accurate calculation may be made by studying the MoCap data of walking at different walking speeds. This could be initially performed for each user separately (on the healthy foot of patients) to obtain the best speed profile for the user. Robustness tests can also be conducted to see if a quicker and less costly way exists to tailor the motion of the device to its user’s walking pattern, without MoCap tests, perhaps based on the user’s body measurements.
The combined power and EMG signal analysis confirmed that the (healthy) user partially reduced his muscle activation, which allowed the device to provide part of the required power to lift the foot. However, the subject was not able to eliminate his muscle effort entirely. Nonetheless, simulating a footdrop condition in a healthy subject enabled the safe preclinical validation of the system, ensuring feasibility before applying the method to patients. The SPM results showed that the AFO compensated well for a lack of muscle effort after toe-off during the initial and mid-swing phase when the device was active and the foot was held up until the terminal swing phase at 0.44 and 0.61 m/s speed. The significant difference at the end of the swing phase pertains to when the AFO was in release mode. In addition, substantial differences were found between the two conditions during the stance phase when the device was deactivated and the individual sought to minimize TA activation (0.44 and 0.61 m/s).
At the walking speed of 0.75 m/s, the reduction in the subject’s muscle activation was statistically insignificant. It appears that the subject was not able to significantly reduce his muscle effort at this speed, as shown in the SPM muscle activation comparison. This is evident during both the stance and swing phases, as no significant variation was observed. Therefore, while this study provides positive preliminary results on the efficacy and safety of this method, it also indicates the necessity to follow up the study with subjects with a footdrop condition.
Future work should include testing the performance of the device under full load with a footdrop patient as the subject. Such experiments can be performed at walking speeds in the range of 0.44–0.75 m/s, where the existing motion planning method was shown to be safe. Testing at lower speeds (<0.4 m/s) should also be considered to better reflect the typical gait of more severely affected patients.

Author Contributions

Conceptualization, P.M., S.F. and U.M.-H.; methodology, P.M. and S.F. and U.M.-H.; software, P.M. and S.F.; validation, P.M., S.F. and U.M.-H.; formal analysis, P.M. and S.F.; investigation, P.M. and S.F.; resources, A.D.-S.; data curation, P.M. and S.F.; writing—original draft preparation, P.M. and S.F.; writing—review and editing, P.M. and S.F. and U.M.-H.; visualization, P.M. and S.F.; supervision, A.D.-S.; project administration, A.D.-S.; funding acquisition, A.D.-S. All authors have read and agreed to the published version of the manuscript.

Funding

This work was supported by the Engineering and Physical Sciences Research Council (EPSRC), UK for the ‘Wearable soft robotics for independent living’ project (EP/M026388/1) and the Royal Society, UK for the ‘Touching and feeling the immersive world’ project (RGS/R2/192346).

Institutional Review Board Statement

The study was conducted in accordance with the Declaration of Helsinki, and approved by the Institutional Review Board (or Ethics Committee) of University of Leeds (protocol code of MEEC 15-050 and date of approval 12 February 2017).

Informed Consent Statement

Informed consent was obtained from all subjects involved in the study.

Data Availability Statement

The data presented in this study are available on request from the corresponding author. The data are not publicly available due to privacy.

Conflicts of Interest

The authors declare that they have no conflict of interest, known competing financial interests or personal relationships that could have appeared to influence the work reported in this paper.

References

  1. Stewart, J.D. Foot drop: Where, why and what to do? Pract. Neurol. 2008, 8, 158–169. [Google Scholar] [CrossRef]
  2. Fraser, J.J.; Koldenhoven, R.M.; Jaffri, A.H.; Park, J.S.; Saliba, S.F.; Hart, J.M.; Hertel, J. Foot impairments contribute to functional limitation in individuals with ankle sprain and chronic ankle instability. Knee Surg. Sports Traumatol. Arthrosc. 2020, 20, 1600–1610. [Google Scholar] [CrossRef]
  3. Lui, Z.W.; Awad, M.I.; Abouhossein, A.; Dehghani-Sanij, A.A.; Messenger, N. Virtual prototyping of a semi-active transfemoral prosthetic leg. Proc. Inst. Mech. Eng. Part H J. Eng. Med. 2015, 229, 350–361. [Google Scholar] [CrossRef]
  4. Carolus, A.; Mesbah, D.; Brenke, C. Focusing on foot drop: Results from a patient survey and clinical examination. Foot 2021, 46, 101693. [Google Scholar] [CrossRef]
  5. Thakur, S. Global Foot Drop Treatment Devices to Grow at a Substantial CAGR of 8.15% by 2027. Available online: https://www.globenewswire.com/en/news-release/2022/11/24/2562397/0/en/Global-Foot-Drop-Treatment-Devices-to-Grow-at-a-Substantial-CAGR-of-8-15-by-2027-DelveInsight.html (accessed on 24 November 2022).
  6. Kitaoka, H.B.; Crevoisier, X.M.; Harbst, K.; Hansen, D.; Kotajarvi, B.; Kaufman, K. The Effect of Custom-Made Braces for the Ankle and Hindfoot on Ankle and Foot Kinematics and Ground Reaction Forces. Arch. Phys. Med. Rehabil. 2006, 87, 130–135. [Google Scholar] [CrossRef]
  7. Khan, A.M.; Yun, D.-w.; Zuhaib, K.M.; Iqbal, J.; Yan, R.-J.; Khan, F.; Han, C. Estimation of Desired Motion Intention and compliance control for upper limb assist exoskeleton. Int. J. Control. Autom. Syst. 2017, 15, 802–814. [Google Scholar] [CrossRef]
  8. Yoon, J.; Kumar, R.P.; Özer, A. An adaptive foot device for increased gait and postural stability in lower limb Orthoses and exoskeletons. Int. J. Control. Autom. Syst. 2011, 9, 515. [Google Scholar] [CrossRef]
  9. Gordon, K.E.; Ferris, D.P. Learning to walk with a robotic ankle exoskeleton. J. Biomech. 2007, 40, 2636–2644. [Google Scholar] [CrossRef]
  10. Ferris, D.P.; Gordon, K.E.; Sawicki, G.S.; Peethambaran, A. An improved powered ankle–foot orthosis using proportional myoelectric control. Gait Posture 2006, 23, 425–428. [Google Scholar] [CrossRef]
  11. Young, A.J.; Ferris, D.P. State of the Art and Future Directions for Lower Limb Robotic Exoskeletons. IEEE Trans. Neural Syst. Rehabil. Eng. 2017, 25, 171–182. [Google Scholar] [CrossRef]
  12. Noël, M.; Cantin, B.; Lambert, S.; Gosselin, C.M.; Bouyer, L.J. An ElectroHydraulic Actuated Ankle Foot Orthosis to Generate Force Fields and to Test Proprioceptive Reflexes During Human Walking. IEEE Trans. Neural Syst. Rehabil. Eng. 2008, 16, 390–399. [Google Scholar] [CrossRef]
  13. Jamwal, P.K.; Xie, S.Q.; Hussain, S.; Parsons, J.G. An Adaptive Wearable Parallel Robot for the Treatment of Ankle Injuries. IEEE ASME Trans. Mechatron. 2014, 19, 64–75. [Google Scholar] [CrossRef]
  14. Saglia, J.A.; Tsagarakis, N.G.; Dai, J.S.; Caldwell, D.G. Control Strategies for Patient-Assisted Training Using the Ankle Rehabilitation Robot (ARBOT). IEEE ASME Trans. Mechatron. 2013, 18, 1799–1808. [Google Scholar] [CrossRef]
  15. Rus, D.; Tolley, M.T. Design, fabrication and control of soft robots. Nature 2015, 521, 467. [Google Scholar] [CrossRef]
  16. Park, Y.-L.; Chen, B.-R.; Pérez-Arancibia, N.O.; Young, D.; Stirling, L.; Wood, R.J.; Goldfield, E.C.; Nagpal, R. Design and control of a bio-inspired soft wearable robotic device for ankle–foot rehabilitation. Bioinspir. Biomim. 2014, 9, 016007. [Google Scholar] [CrossRef]
  17. Zakria, M.; Maqbool, H.F.; Hussain, T.; Awad, M.I.; Mehryar, P.; Iqbal, N.; Dehghani-Sanij, A.A. Heuristic based gait event detection for human lower limb movement. In Proceedings of the 2017 IEEE EMBS International Conference on Biomedical & Health Informatics (BHI), Orlando, FL, USA, 16–19 February 2017; IEEE: Piscataway, NJ, USA, 2017. [Google Scholar]
  18. Maqbool, H.F.; Husman, M.A.B.; Awad, M.I.; Abouhossein, A.; Mehryar, P.; Iqbal, N.; Dehghani-Sanij, A.A. Real-time gait event detection for lower limb amputees using a single wearable sensor. In Proceedings of the 2016 38th Annual International Conference of the IEEE Engineering in Medicine and Biology Society (EMBC), Orlando, FL, USA, 16–20 August 2016; IEEE: Piscataway, NJ, USA, 2016. [Google Scholar]
  19. Martinez-Hernandez, U.; Mahmood, I.; Dehghani-Sanij, A.A. Simultaneous Bayesian Recognition of Locomotion and Gait Phases With Wearable Sensors. IEEE Sens. J. 2018, 18, 1282–1290. [Google Scholar] [CrossRef]
  20. Staudenmayer, J.; Pober, D.; Crouter, S.; Bassett, D.; Freedson, P. An artificial neural network to estimate physical activity energy expenditure and identify physical activity type from an accelerometer. J. Appl. Physiol. 2009, 107, 1300–1307. [Google Scholar] [CrossRef]
  21. Khan, A.M.; Lee, Y.K.; Kim, T. Accelerometer signal-based human activity recognition using augmented autoregressive model coefficients and artificial neural nets. In Proceedings of the 2008 30th Annual International Conference of the IEEE Engineering in Medicine and Biology Society, Vancouver, BC, Canada, 20–25 August 2008. [Google Scholar]
  22. Yuan, K.; Parri, A.; Yan, T.; Wang, L.; Munih, M.; Wang, Q.; Vitiello, N. A realtime locomotion mode recognition method for an active pelvis orthosis. In Proceedings of the 2015 IEEE/RSJ International Conference on Intelligent Robots and Systems (IROS), Hamburg, Germany, 28 September–2 October 2015. [Google Scholar]
  23. Huang, H.; Zhang, F.; Hargrove, L.J.; Dou, Z.; Rogers, D.R.; Englehart, K.B. Continuous Locomotion-Mode Identification for Prosthetic Legs Based on Neuromuscular–Mechanical Fusion. IEEE Trans. Biomed. Eng. 2011, 58, 2867–2875. [Google Scholar] [CrossRef]
  24. Thrun, S.; Burgard, W.; Fox, D. Probabilistic robotics. In Intelligent Robotics and Autonomous Agents; MIT: Cambridge, MA, USA; London, UK, 2005. [Google Scholar]
  25. Martinez-Hernandez, U.; Dodd, T.J.; Prescott, T.J. Feeling the Shape: Active Exploration Behaviors for Object Recognition With a Robotic Hand. IEEE Trans. Syst. Man Cybern. Syst. 2018, 48, 2339–2348. [Google Scholar] [CrossRef]
  26. Martinez-Hernandez, U.; Dodd, T.J.; Evans, M.H.; Prescott, T.J.; Lepora, N.F. Active sensorimotor control for tactile exploration. Robot. Auton. Syst. 2017, 87, 15–27. [Google Scholar] [CrossRef]
  27. Ferreira, J.; Lobo, J.; Bessiere, P.; Castelo-Branco, M.; Dias, J. A Bayesian framework for active artificial perception. IEEE Trans. Cybern. 2013, 43, 699–711. [Google Scholar] [CrossRef]
  28. Young, A.J.; Simon, A.M.; Fey, N.P.; Hargrove, L.J. Intent Recognition in a Powered Lower Limb Prosthesis Using Time History Information. Ann. Biomed. Eng. 2014, 42, 631–641. [Google Scholar] [CrossRef]
  29. Varol, H.A.; Sup, F.; Goldfarb, M. Multiclass Real-Time Intent Recognition of a Powered Lower Limb Prosthesis. IEEE Trans. Biomed. Eng. 2010, 57, 542–551. [Google Scholar] [CrossRef]
  30. Martinez-Hernandez, U.; Rubio-Solis, A.; Cedeno-Campos, V.; Dehghani-Sanij, A.A. Towards an intelligent wearable ankle robot for assistance to foot drop. In Proceedings of the 2019 IEEE International Conference on Systems, Man and Cybernetics (SMC), Bari, Italy, 6–9 October 2019. [Google Scholar]
  31. Martinez-Hernandez, U.; Firouzy, S.; Mehryar, P.; Meng, L.; Childs, C.; Buis, A.; Dehghani-Sanij, A.A. Human-in-the-loop layered architecture for control of a wearable ankle-foot robot. Robot. Auton. Syst. 2023, 161, 104353. [Google Scholar] [CrossRef]
  32. Winter, D.A. Biomechanics and Motor Control of Human Gait: Normal, Elderly and Pathological; CIRD: Seoul, Republic of Korea, 1991. [Google Scholar]
  33. Winter, D.A. Energy generation and absorption at the ankle and knee during fast, natural, and slow cadences. Clin. Orthop. Relat. Res. 1983, 175, 147–154. [Google Scholar] [CrossRef]
  34. Murray, M.P.; Drought, A.B.; Kory, R.C. Walking Patterns of Normal Men. JBJS 1964, 46, 335–360. [Google Scholar] [CrossRef]
  35. Krishnan, R.H.; Devanandh, V.; Brahma, A.K.; Pugazhenthi, S. Estimation of Mass Moment of Inertia of Human Body, When Bending Forward, for The Design of A Self-Transfer Robotic Facility. J. Eng. Sci. Technol. 2016, 11, 166–176. [Google Scholar]
  36. Farina, D.; Merletti, R.; Enoka, R.M. The extraction of neural strategies from the surface EMG. J. Appl. Physiol. 2004, 96, 1486–1495. [Google Scholar] [CrossRef]
  37. Mehryar, P.; Shourijeh, M.S.; Rezaeian, T.; Khandan, A.R.; Messenger, N.; O’Connor, R.; Farahmand, F.; Dehghani-Sanij, A. Differences in muscle synergies between healthy subjects and transfemoral amputees during normal transient-state walking speed. Gait Posture 2020, 76, 98–103. [Google Scholar] [CrossRef]
  38. Mehryar, P.; Shourijeh, M.; Rezaeian, T.; Iqbal, N.; Messenger, N.; Dehghani-Sanij, A.A. Changes in synergy of transtibial amputee during gait: A pilot study. In Proceedings of the 2017 IEEE EMBS International Conference on Biomedical & Health Informatics (BHI), Orlando, FL, USA, 16–19 February 2017; IEEE: Piscataway, NJ, USA, 2017. [Google Scholar]
  39. Mehryar, P.; Shourijeh, M.S.; Rezaeian, T.; Khandan, A.R.; Messenger, N.; O’Connor, R.; Farahmand, F.; Dehghani-Sanij, A. Muscular activity comparison between non-amputees and transfemoral amputees during normal transient-state walking speed. Med. Eng. Phys. 2021, 95, 39–44. [Google Scholar] [CrossRef]
  40. Mehryar, P.; Shourijeh, M.; Rezaeian, T.; Khandan, A.; Messenger, N.; O’Connor, R.; Farahmand, F.; Dehghani-Sanij, A. The Impact of Different Self-Selected Walking Speeds on Muscle Synergies in Transfemoral Amputees during Transient-State Gait. Biomechanics 2024, 4, 14–33. [Google Scholar] [CrossRef]
  41. Stegeman, D.; Hermens, H. Standards for surface electromyography: The European project Surface EMG for non-invasive assessment of muscles (SENIAM). Enschede Roessingh Res. Dev. 2007, 10, 108–112. [Google Scholar]
  42. Pataky, T.C.; Vanrenterghem, J.; Robinson, M.A. Zero-vs. one-dimensional, parametric vs. non-parametric, and confidence interval vs. hypothesis testing procedures in one-dimensional biomechanical trajectory analysis. J. Biomech. 2015, 48, 1277–1285. [Google Scholar] [CrossRef]
Figure 1. CGA data of the angle (a) and angular velocity (b) of the ankle joint in the sagittal plane during the swing phase of the gait cycle [32,33].
Biomechanics 05 00051 g001
Figure 2. The active AFO, worn by the user.
Biomechanics 05 00051 g002
Figure 5. The block diagram of the motion planning and control system.
Biomechanics 05 00051 g005
Figure 6. The cascade control algorithm for speed control of the motors. e θ ˙ is the motors’ speed error; i d is the desired current; i l and i r are the winding currents of the left and right motors, respectively; and e i l and e i r are the current errors for the left and right motors.
Biomechanics 05 00051 g006
Figure 7. The test subject wearing the controllers and other electronics.
Biomechanics 05 00051 g007
Figure 8. The test subject walking on the treadmill.
Biomechanics 05 00051 g008
Figure 9. The average foot angle of swing phase of gait cycles versus the gait cycle percentage, for the normal gait experiment (blue) and the assisted gait (red) for the speeds of 0.44 m/s (a), 0.61 m/s (b), and 0.75 m/s (c). The critical point is the “foot-clearance” event that occurred during the mid-swing phase.
Biomechanics 05 00051 g009
Figure 10. The assistance phase.
Biomechanics 05 00051 g010
Figure 11. Animation of the simulation (a), with the location of the MoCap markers shown as red stars. The ankle power graph from the simulation (in black) at normal walking speed is compared to literature data (in red) in (b). The estimated required power at the three walking speeds of the experiments is shown in (c) for walking at 0.44 m/s (green), 0.61 m/s blue and 0.75 m/s (black).
Biomechanics 05 00051 g011aBiomechanics 05 00051 g011b
Figure 12. The mean and standard variations in the pure assistive power of the device, normalized to the required power (assistance ratio).
Biomechanics 05 00051 g012
Figure 13. The EMG sensor for the tibialis anterior (TA) muscle.
Biomechanics 05 00051 g013
Figure 14. The EMG signals (linear envelope) of the tibialis anterior muscle during the gait cycle for one of the normal (a) and assisted (b) trials. The foot-clearance event occurs during the mid-swing phase.
Biomechanics 05 00051 g014
Figure 15. EMG normalized to the maximum value obtained between (averaged over all trials) between normal and assisted at (a) 0.44 m/s, (b) 61 m/s, and (c) 0.75 m/s. TA within-subject paired t statistic and the red dashed lines indicate critical thresholds of t* = 4.559, 4.539, and 4.537 for are shown for each speed (df), respectively. Significant differences are shown in gray, where p < 0.05.
Biomechanics 05 00051 g015
Table 1. The power measurement results for three different walking speeds.
Speed
(m/s)
No-Load
Power
(W)
Gross
Power
(W)
Pure Assistive
Power
(W)
Estimated
Required Power (W)
0.441.542.120.581.19
0.612.293.060.771.64
0.752.573.490.922.37
Disclaimer/Publisher’s Note: The statements, opinions and data contained in all publications are solely those of the individual author(s) and contributor(s) and not of MDPI and/or the editor(s). MDPI and/or the editor(s) disclaim responsibility for any injury to people or property resulting from any ideas, methods, instructions or products referred to in the content.

