
Effects of Simulated Hyper-Gravity on Lower Limb Kinematics and Electromyography During Walking


Abstract
1. Introduction
2. Methods
2.1. Participants
2.2. Kinematic Sensors
2.3. Electromyographic Sensors
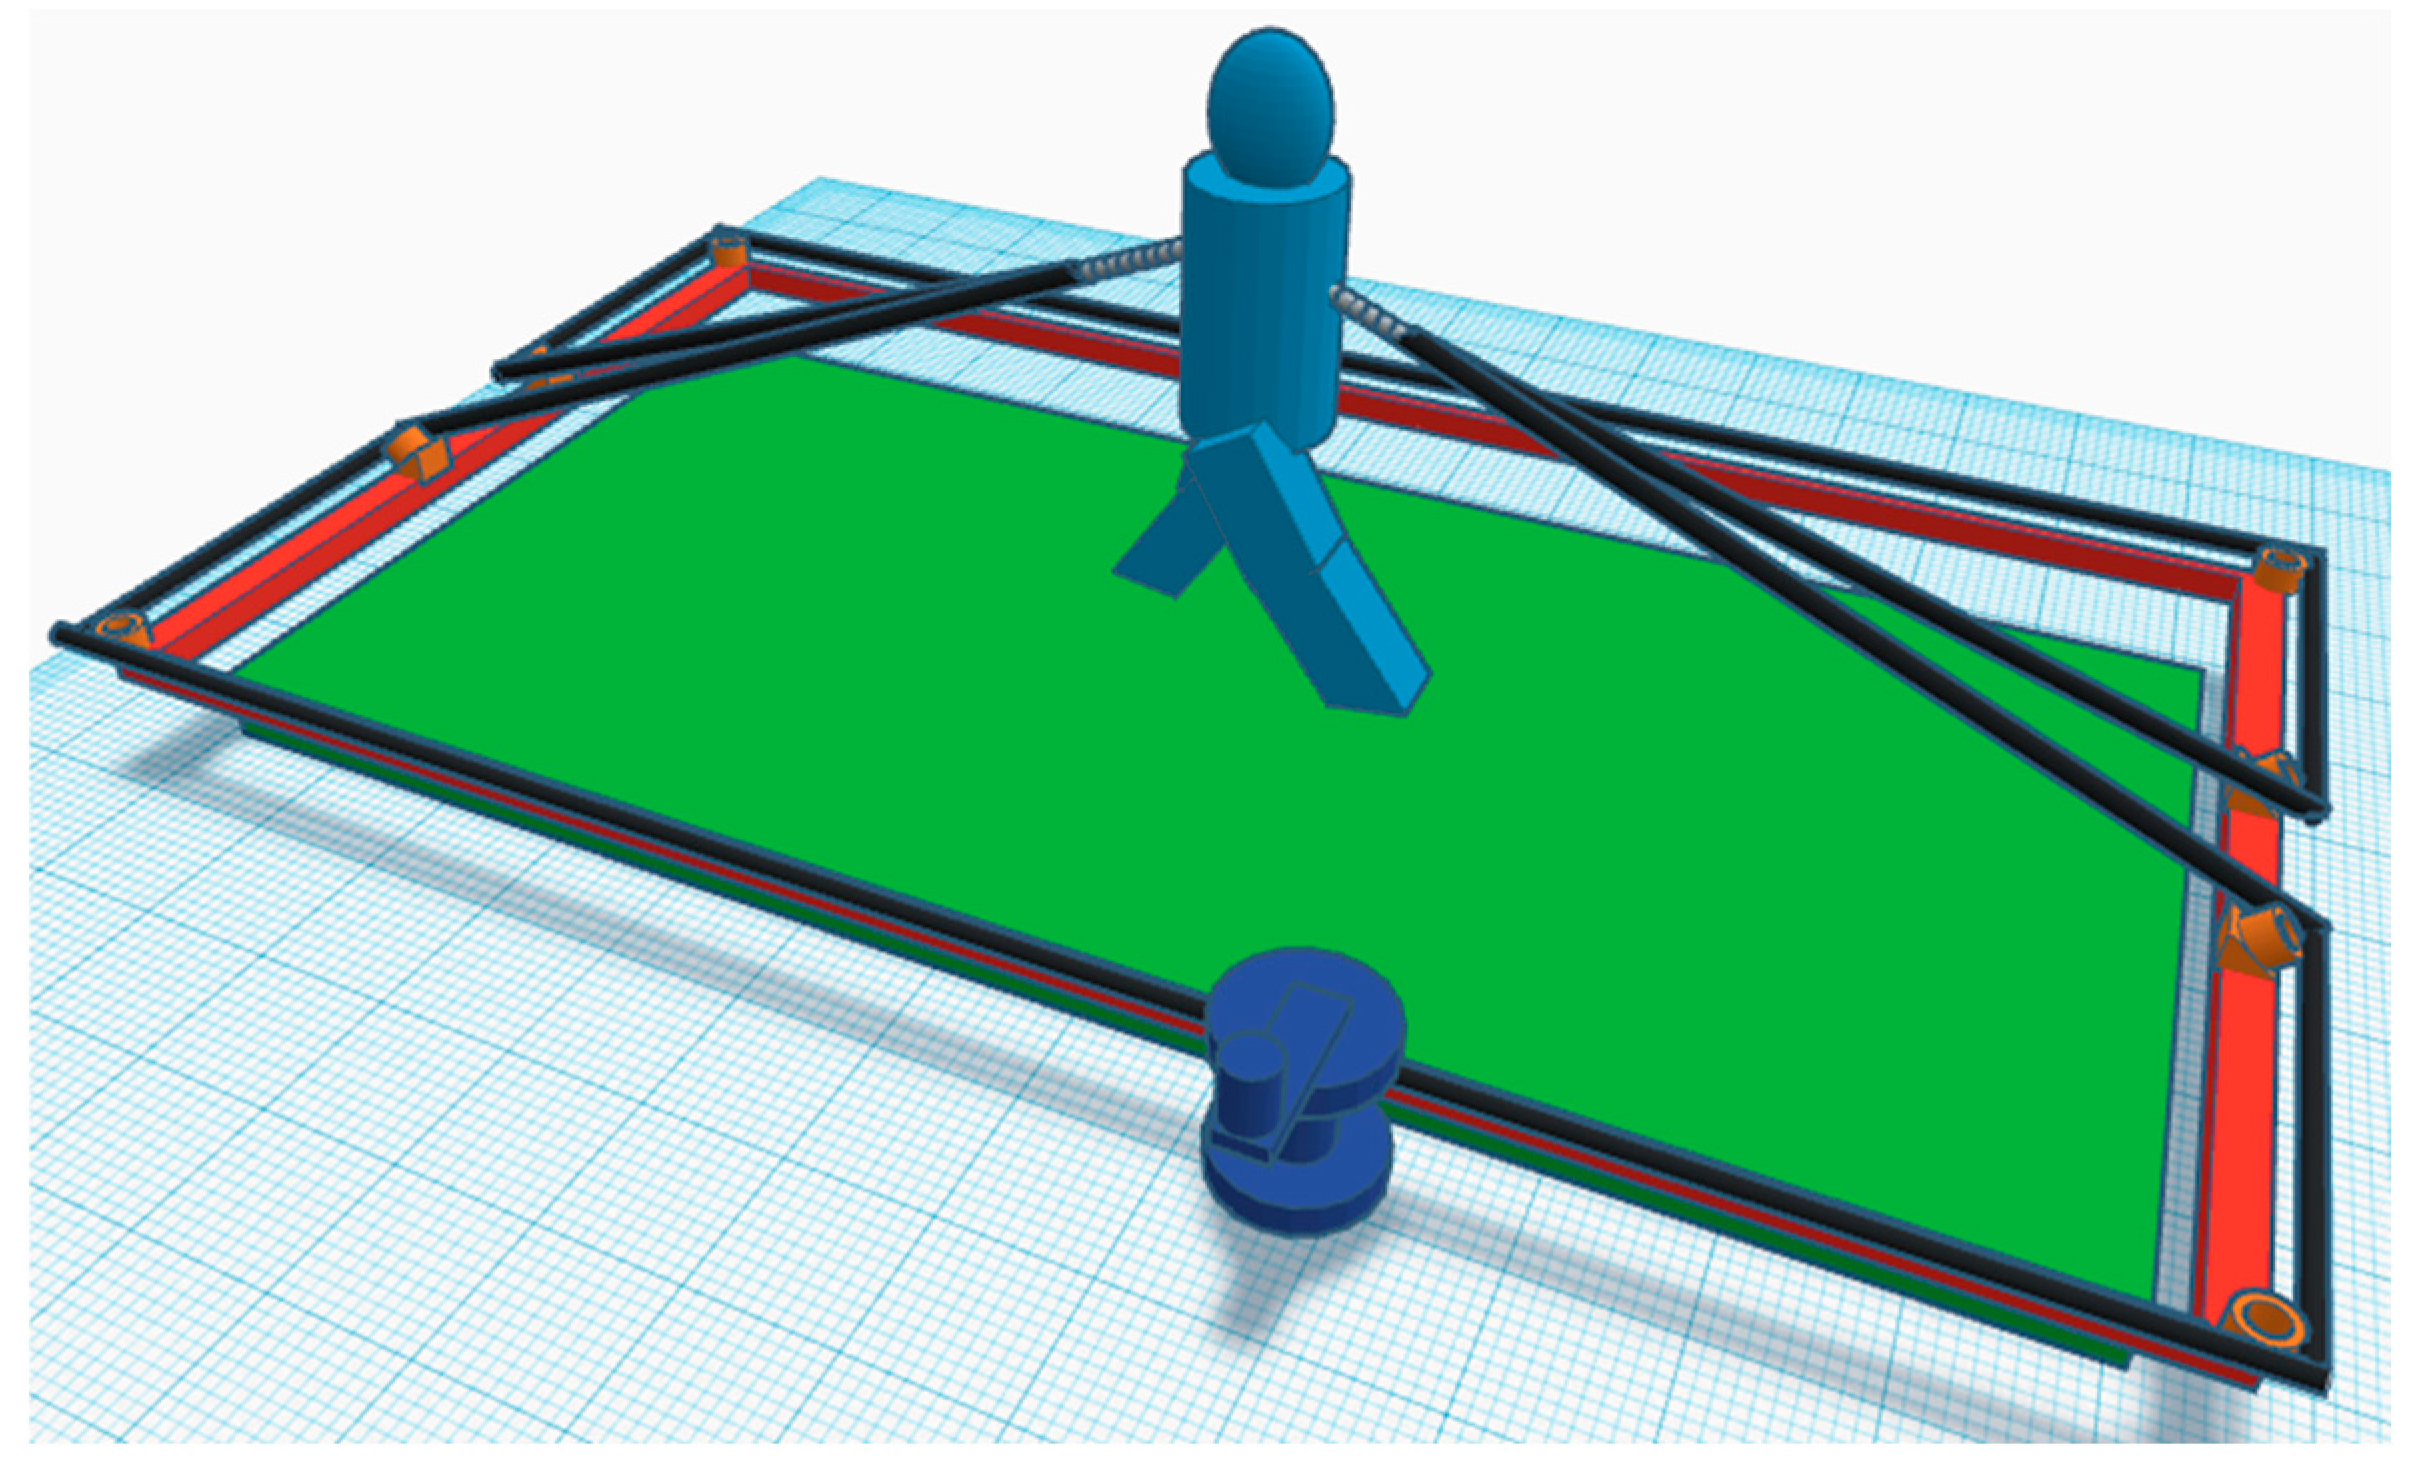
2.4. Loading System and Walking Protocol
2.5. Data Processing
2.6. Statistical Analysis
3. Results
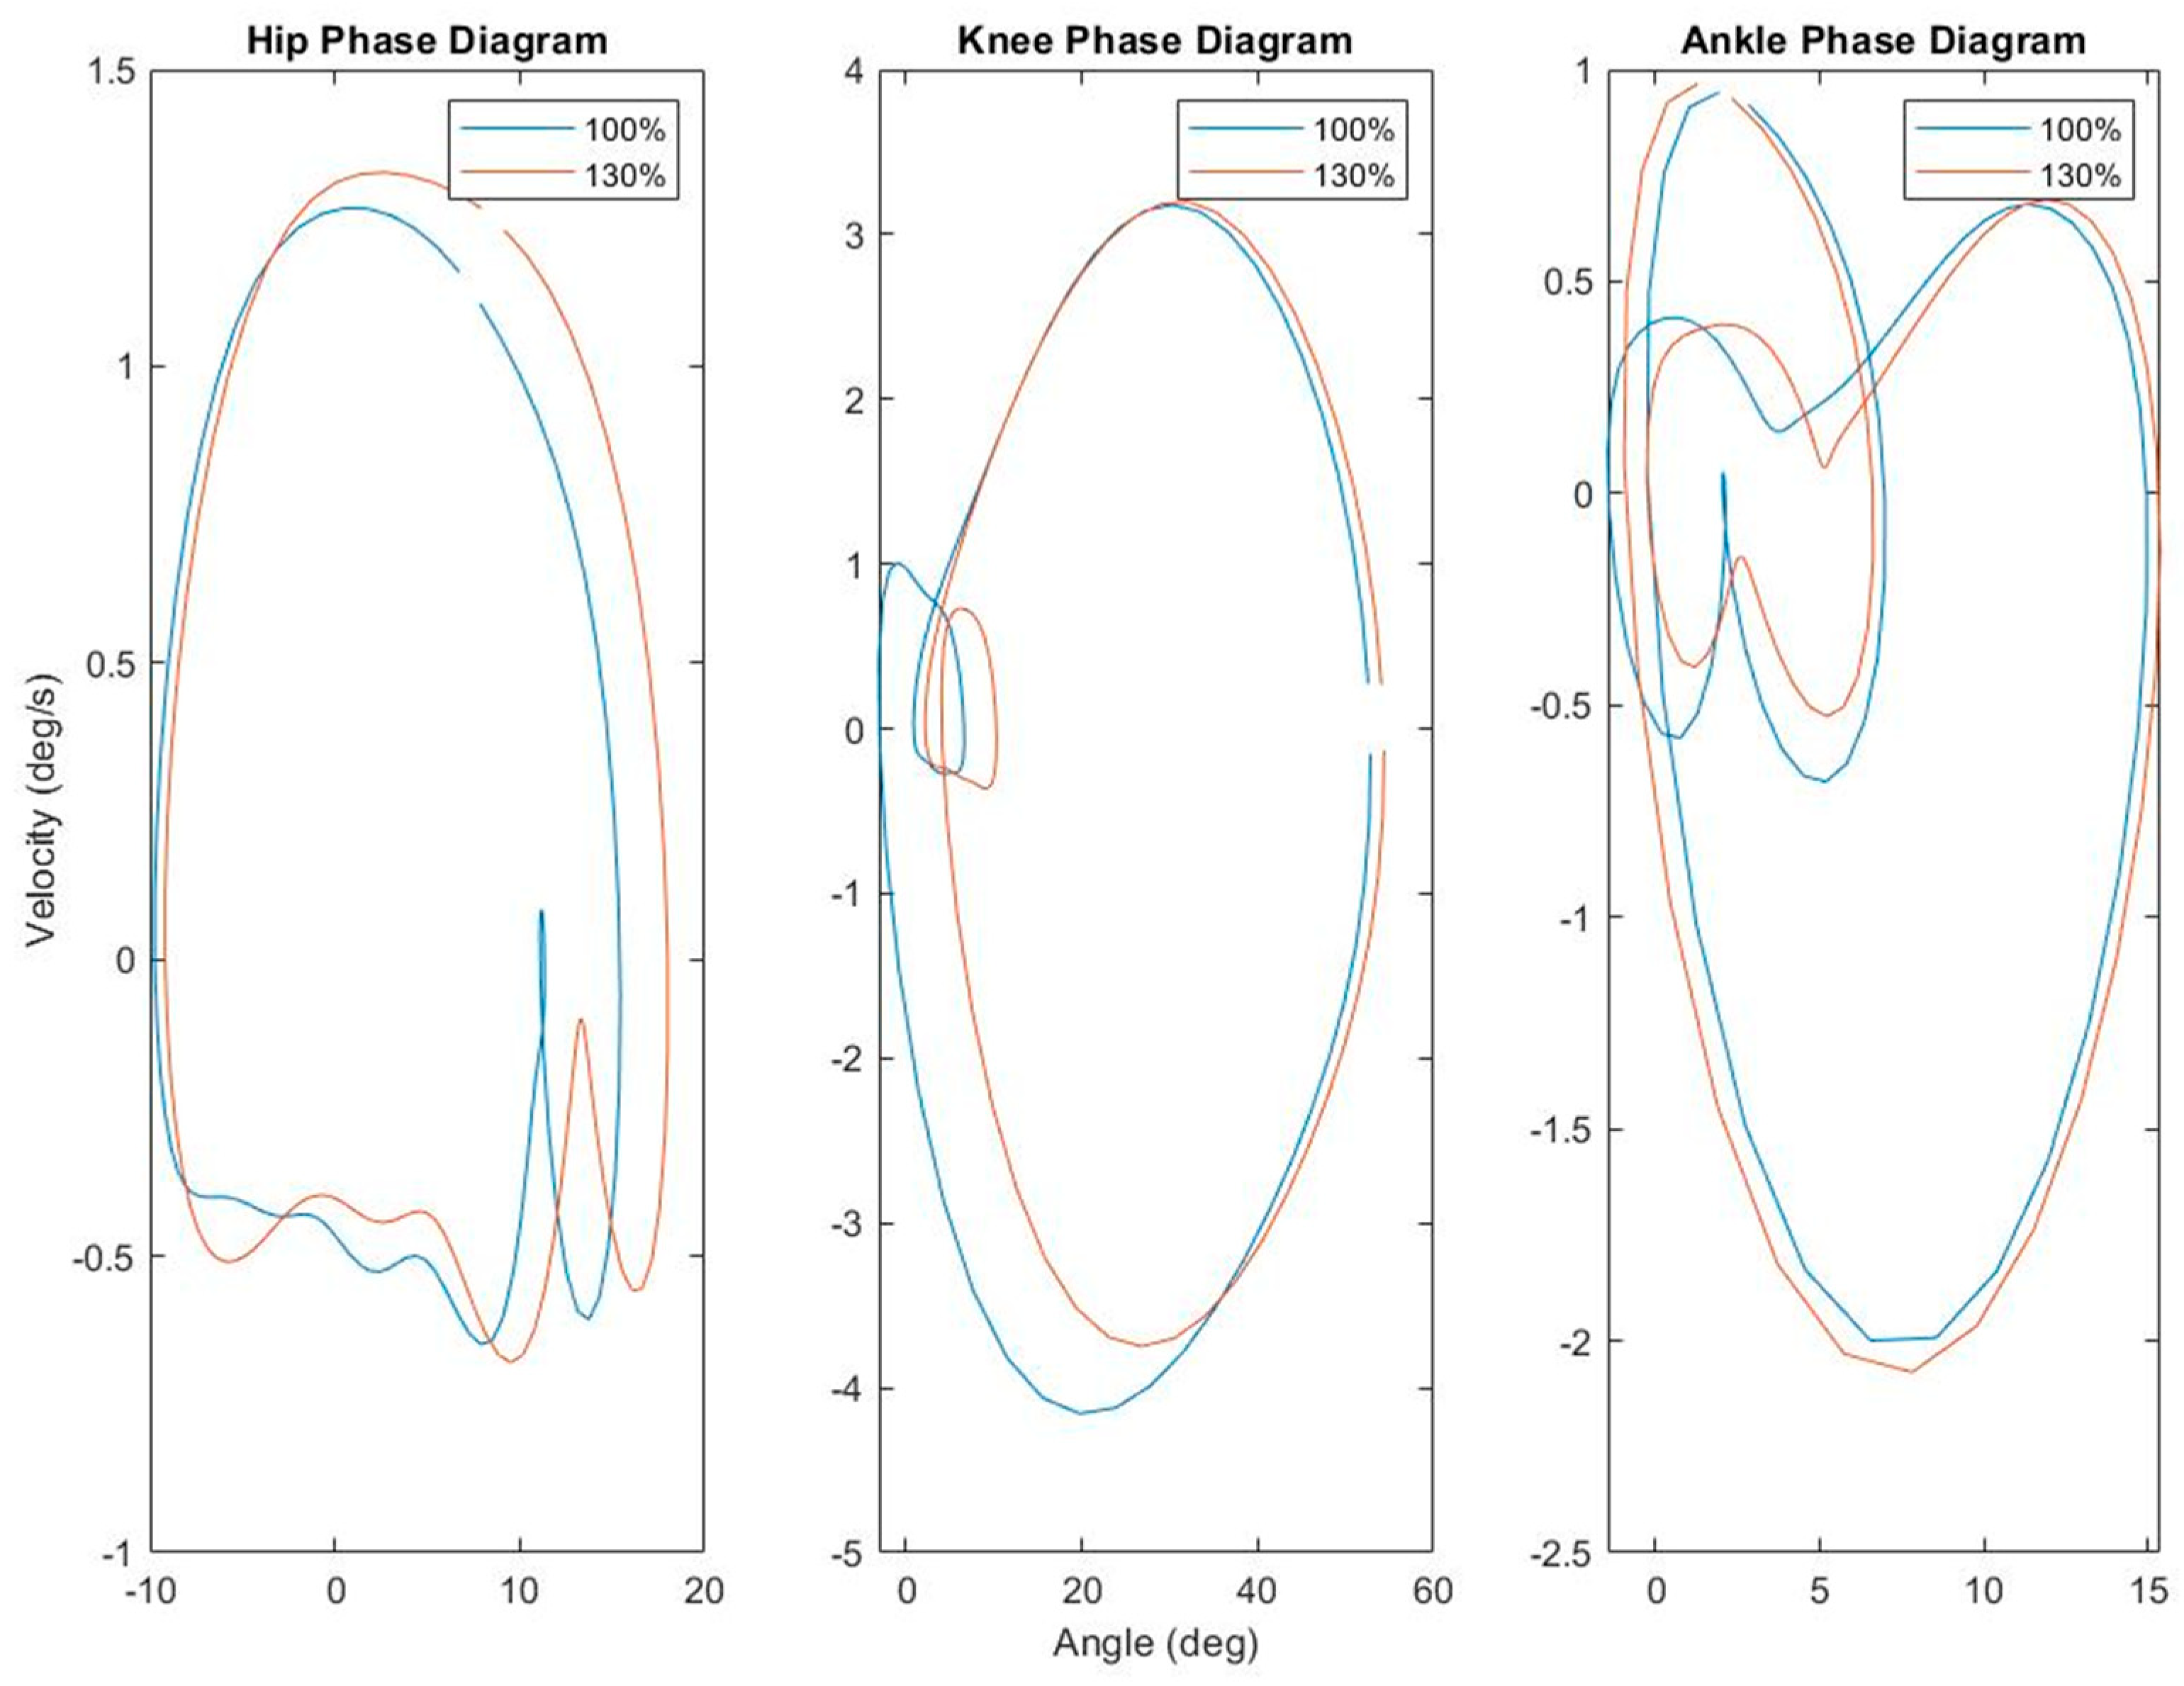
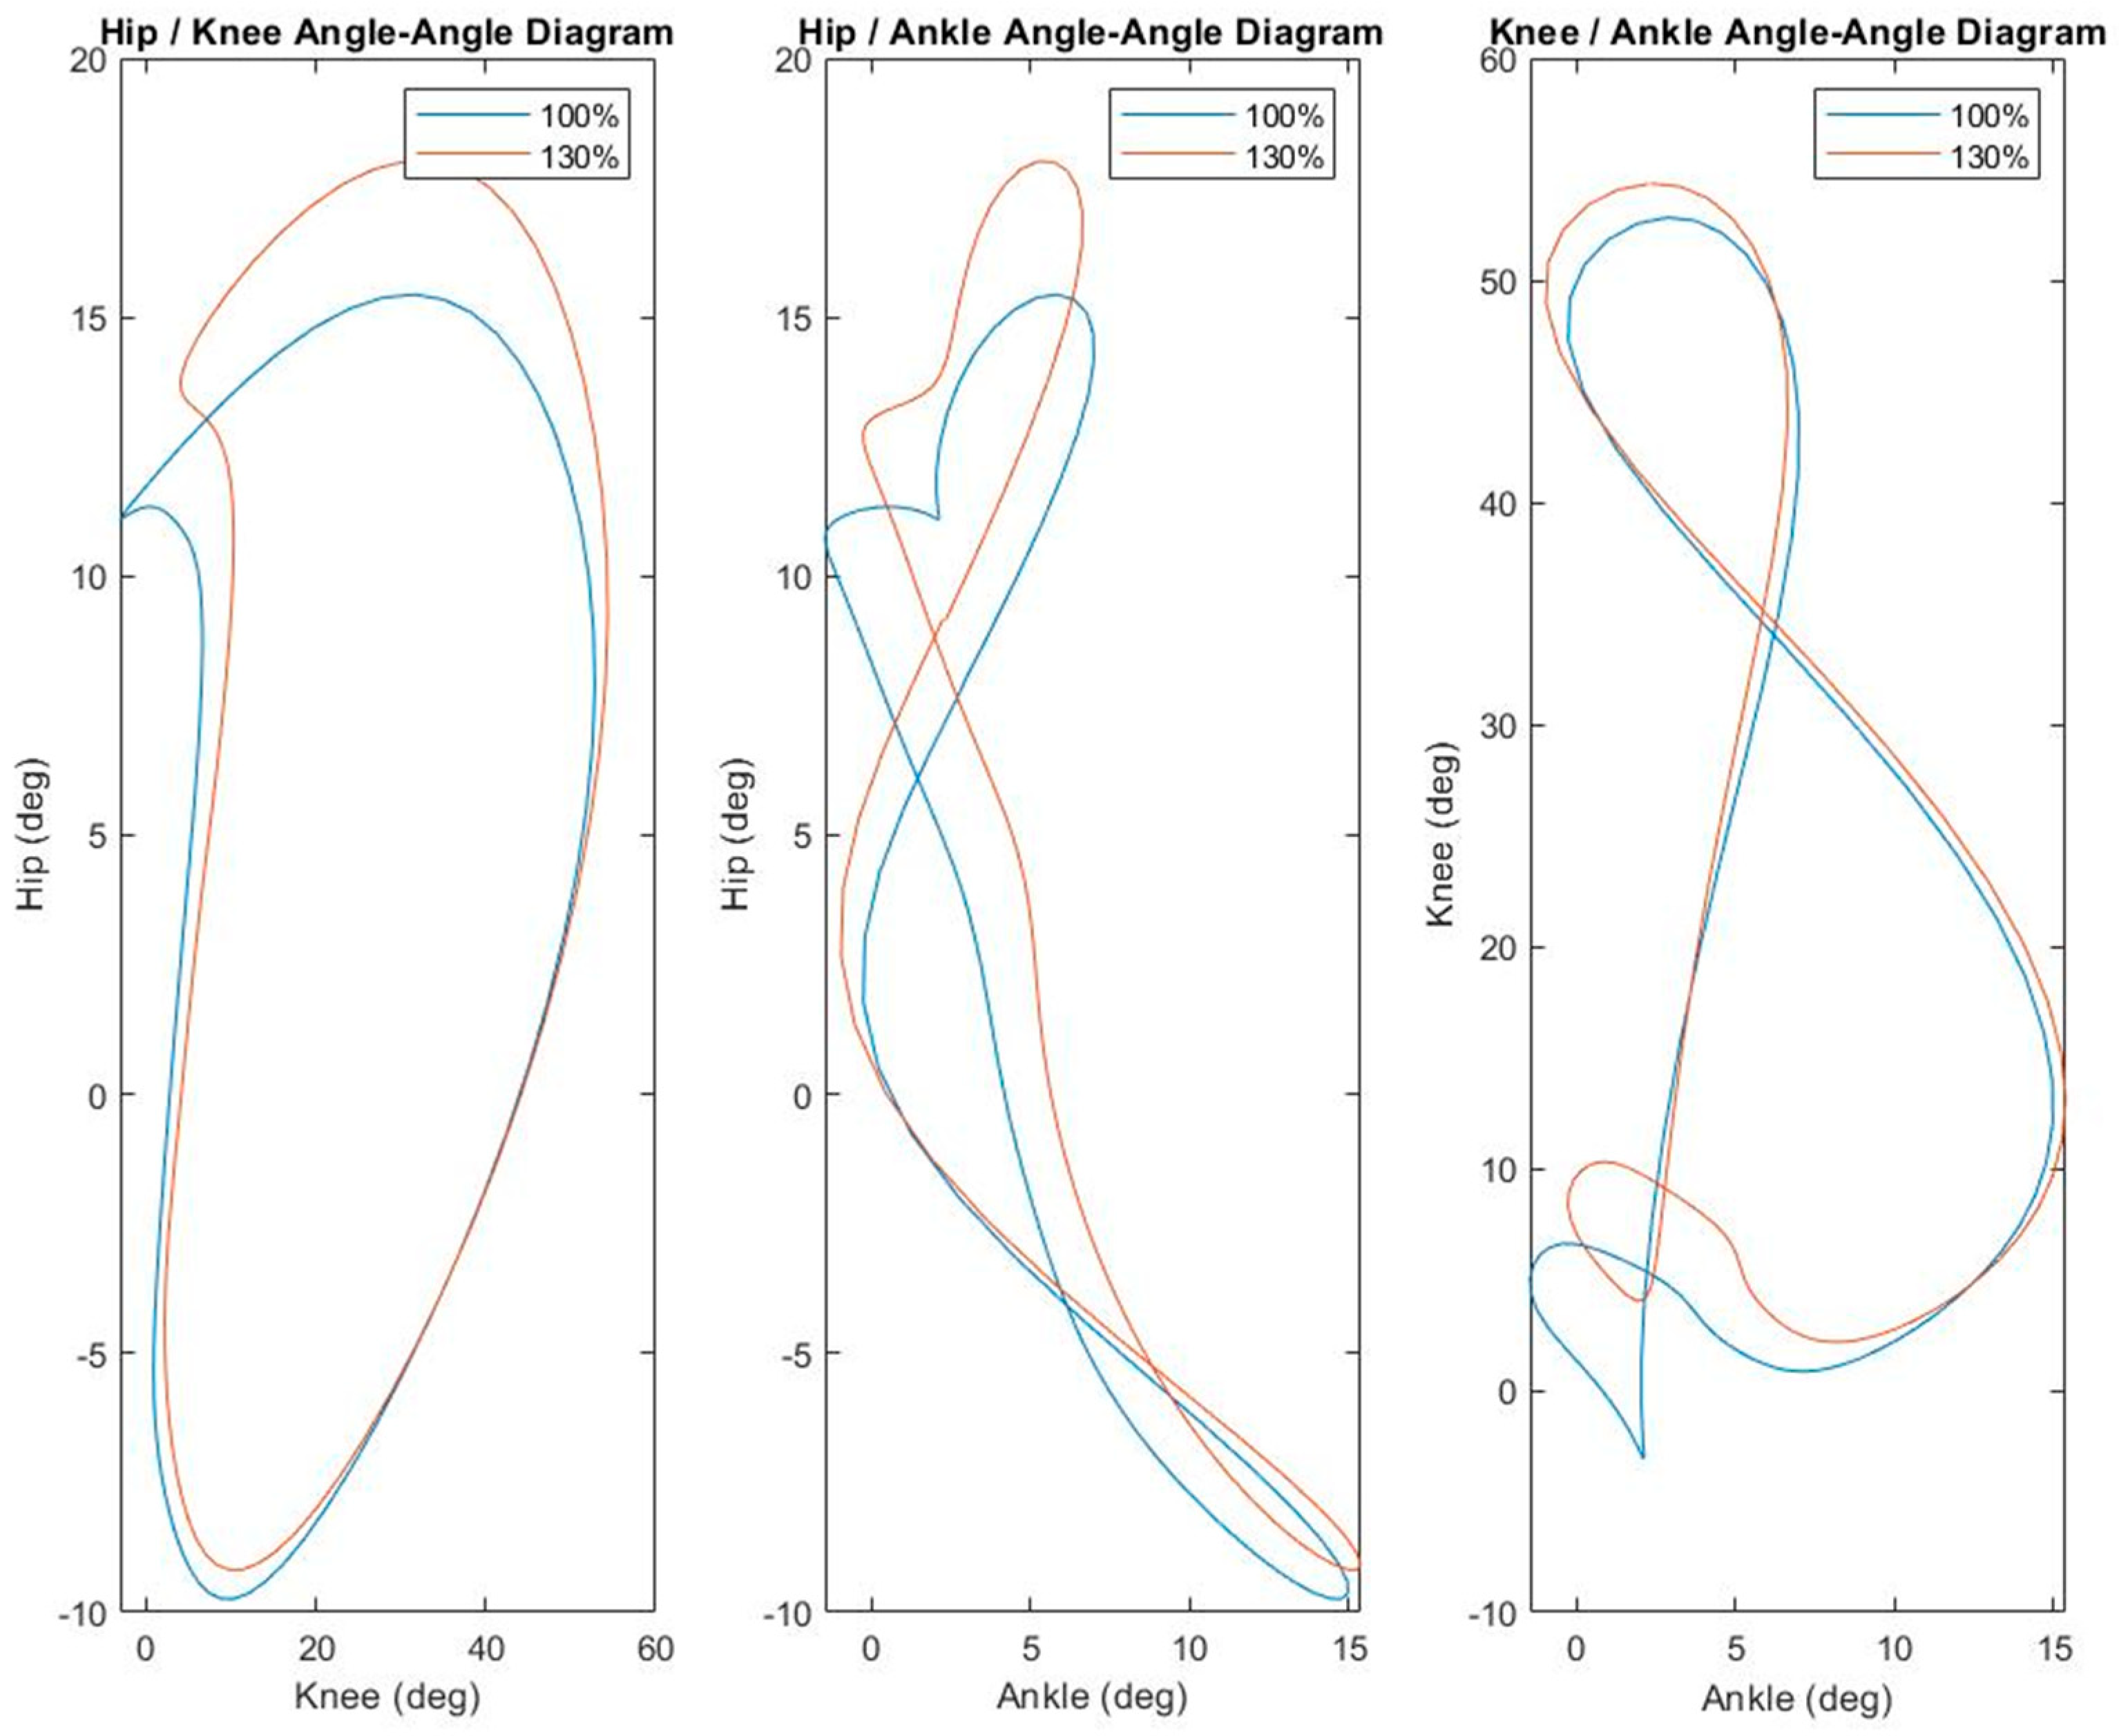
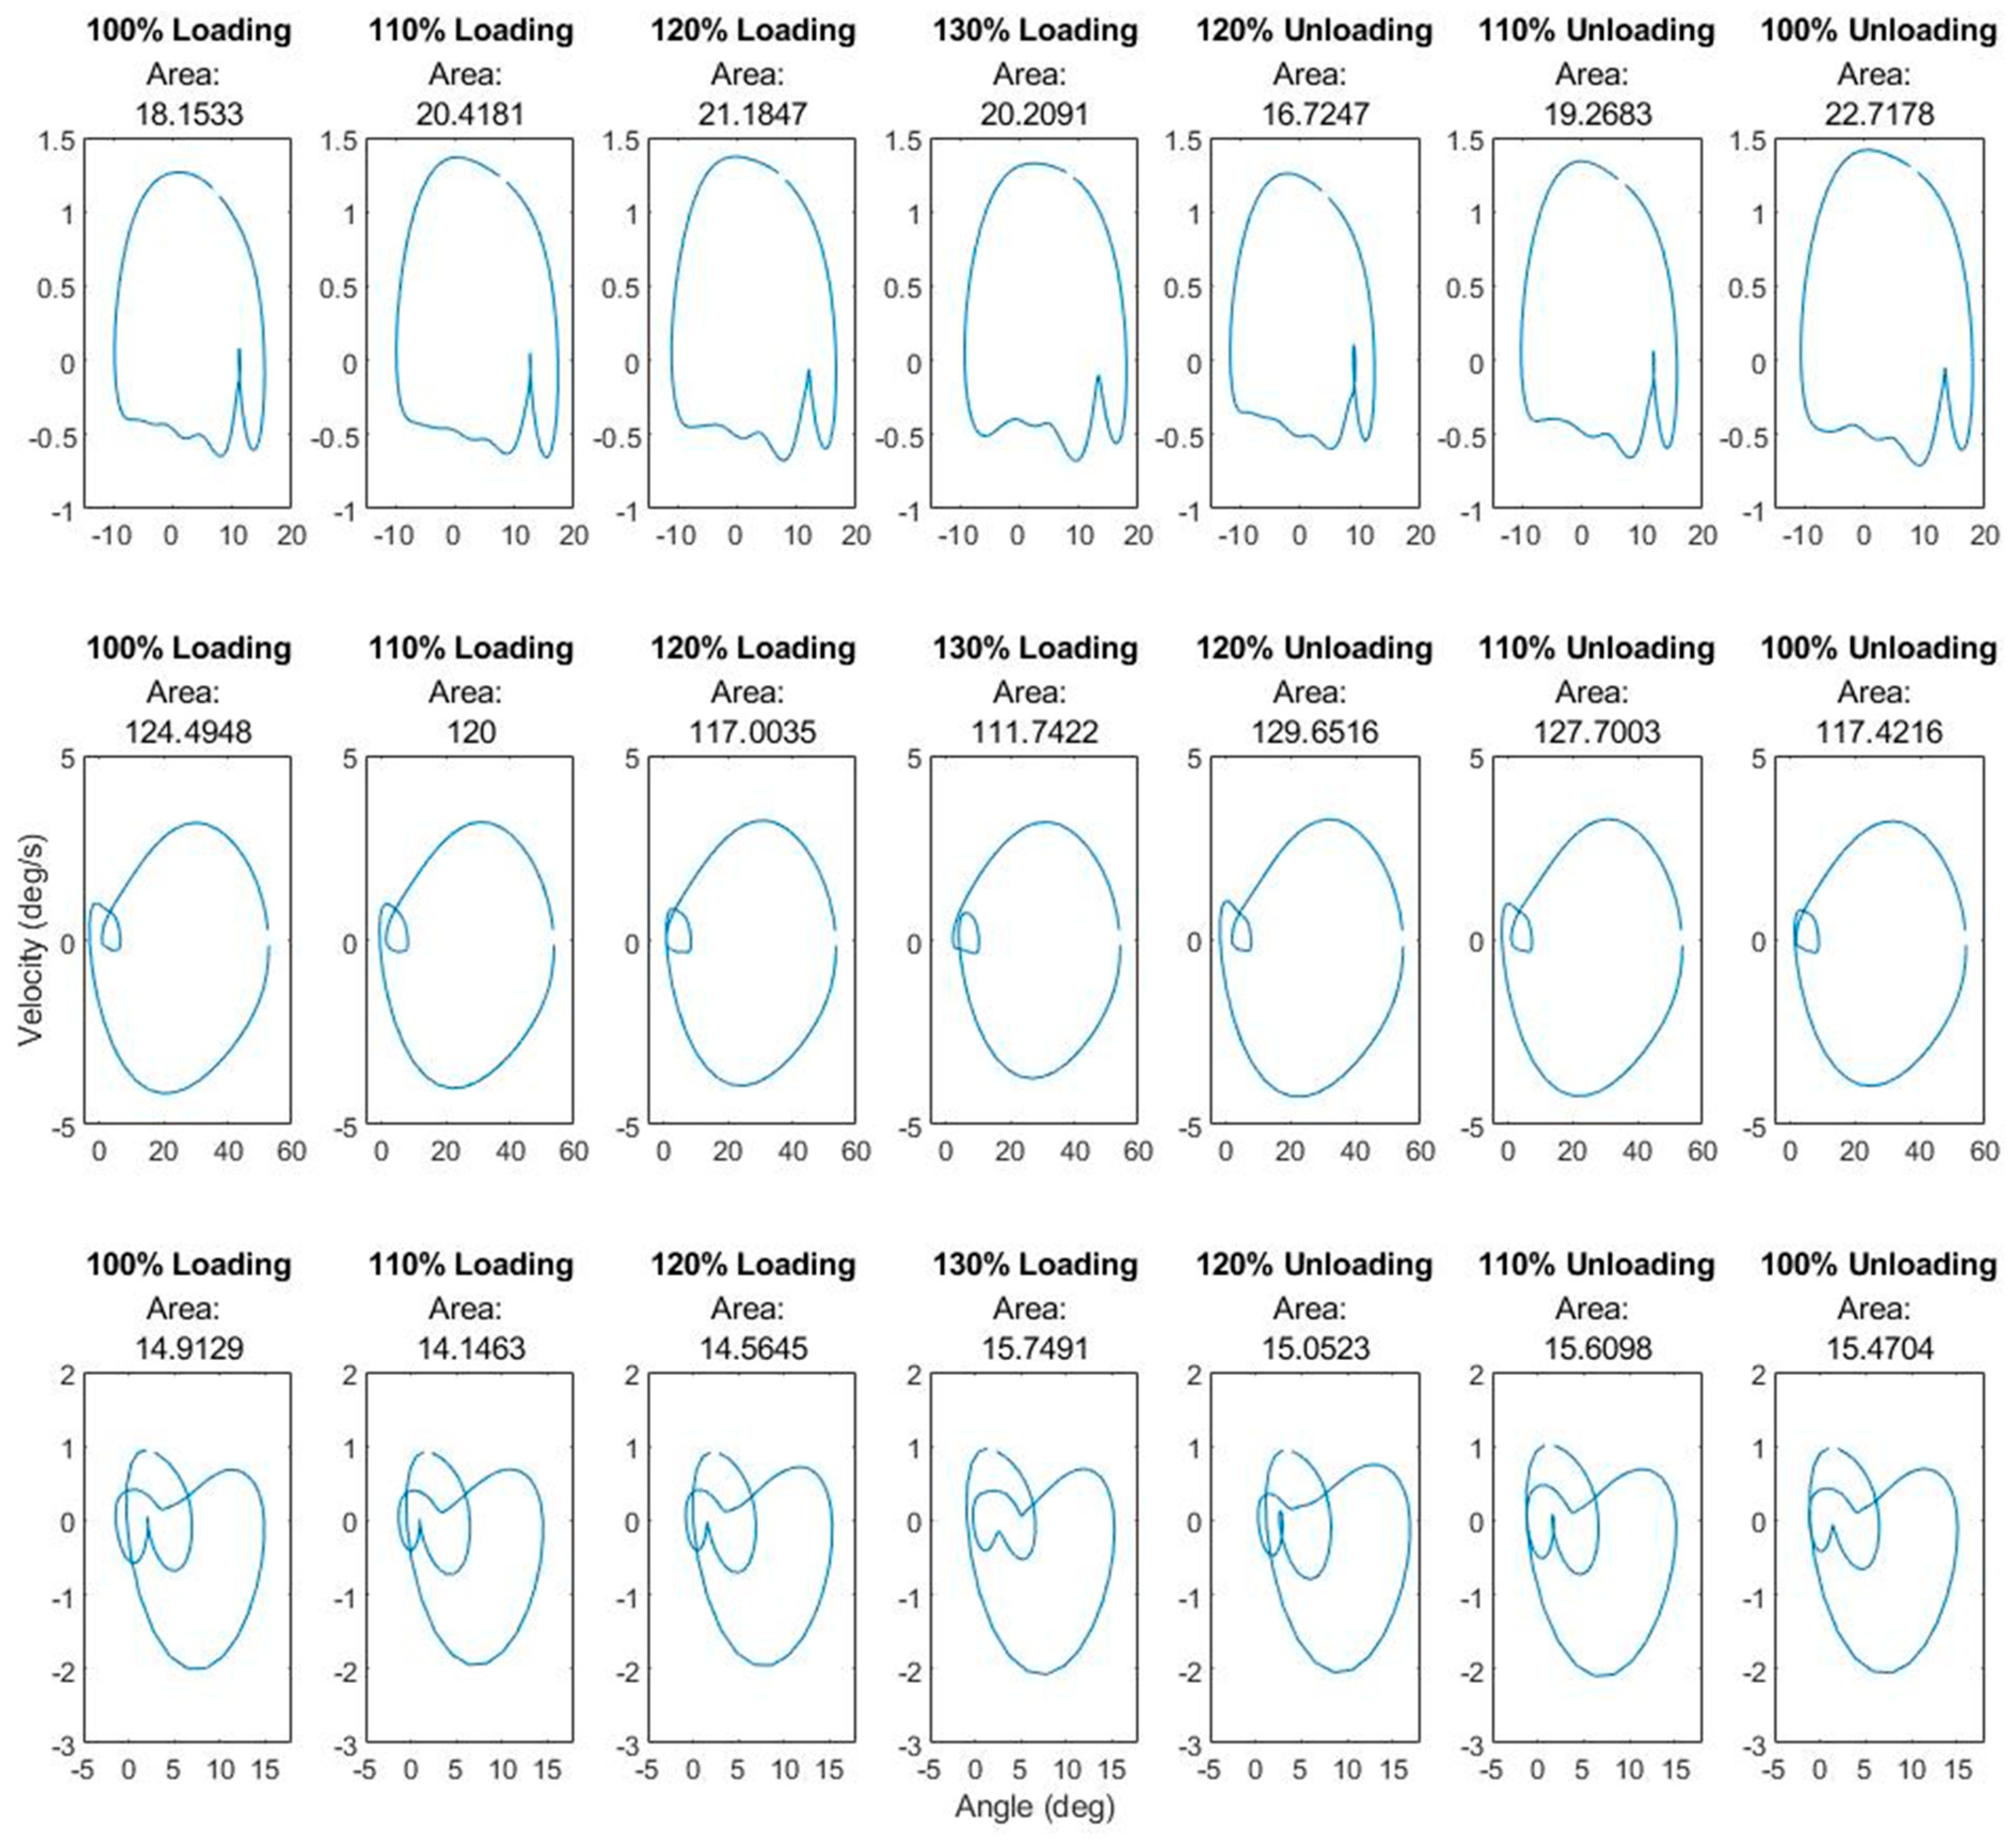
3.1. Kinematics
3.2. Electromyography
4. Discussion
Supplementary Materials
Author Contributions
Funding
Institutional Review Board Statement
Informed Consent Statement
Data Availability Statement
Conflicts of Interest
References
- Hirt, C.; Claessens, S.; Fecher, T.; Kuhn, M.; Pail, R.; Rexer, M. New ultrahigh-resolution picture of Earth’s gravity field. Geophys. Res. Lett. 2013, 40, 4279–4283. [Google Scholar] [CrossRef]
- Wolff, J. Das Gesetz der Transformation der Knochen; Hirchwild: Berlin, Germany, 1892. [Google Scholar]
- Krasnov, I.B. Gravitational neuromorphology. Adv. Space Biol. Med. 1994, 4, 85–110. [Google Scholar] [PubMed]
- Tairbekov, M.G. Kletka kak gravitatsionno-zavisimaia biomekhanicheskaia sistema [The cell as a gravity-dependent biomechanic system]. Aviakosm. Ekolog. Med. 2000, 34, 3–17. [Google Scholar] [PubMed]
- Liew, B.; Morris, S.; Netto, K. The effect of backpack carriage on the biomechanics of walking: A systematic review and preliminary meta-analysis. J. Appl. Biomech. 2016, 32, 614–629. [Google Scholar] [CrossRef] [PubMed]
- Arellano, C.J.; O’Connor, D.P.; Layne, C.; Kurz, M.J. The Independent Effect of Added Mass on the Stability of the Sagittal Plane Leg Kinematics during Steady-State Human Walking. J. Exp. Biol. 2009, 212 Pt 12, 1965–1970. [Google Scholar] [CrossRef] [PubMed]
- Arellano, C.J.; Layne, C.S.; O’Connor, D.P.; Scott-Pandorf, M.; Kurz, M.J. Does Load Carrying Influence Sagittal Plane Locomotive Stability? Med. Sci. Sports Exerc. 2009, 41, 620–627. [Google Scholar] [CrossRef]
- Boffey, D.; Harat, I.; Gepner, Y.; Frosti, C.L.; Funk, S.; Hoffman, J.R. The physiology and biomechanics of load carriage performance. Mil. Med. 2019, 184, e83–e90. [Google Scholar] [CrossRef]
- Singh, T.; Koh, M. Effects of backpack load position on spatiotemporal parameters and trunk forward lean. Gait Posture 2009, 29, 49–53. [Google Scholar] [CrossRef]
- Atwells, R.L.; Birrell, S.A.; Hooper, R.H.; Mansfield, N.J. Influence of carrying heavy loads on soldiers’ posture, movements and gait. Ergonomics 2006, 49, 1527–1537. [Google Scholar] [CrossRef]
- Polcyn, A.F.; Bensel, C.K.; Harman, E.A.; Obusek, J.P. The Effects of Load Weight: A Summary Analysis of Maximal Performance, Physiological, and Biomechanical Results from Four Studies on Load–Carriage Systems; United States Army Research Institute of Environmental Medicine Technical Report: Natick, MA, USA, 2001. [Google Scholar]
- Haddox, A.G.; Hausselle, J.; Azoug, A. Changes in segmental mass and inertia during pregnancy: A musculoskeletal model of the pregnant woman. Gait Posture 2020, 76, 389–395. [Google Scholar] [CrossRef] [PubMed]
- Jensen, R.K.; Nassas, G. Growth of segment principal moments of inertia between four and twenty years. Med. Sci. Sports Exerc. 1988, 20, 594–604. [Google Scholar] [CrossRef] [PubMed]
- Villalba-Galea, C.A. Hysteresis in voltage-gated channels. Channels 2017, 11, 140–155. [Google Scholar] [CrossRef]
- Villalba-Galea, C.A.; Chiem, A.T. Hysteretic Behavior in Voltage-Gated Channels. Front. Pharmacol. 2020, 11, 579596. [Google Scholar] [CrossRef] [PubMed]
- Wei, J.Y.; Simon, J.; Randić, M.; Burgess, P.R. Joint angle signaling by muscle spindle receptors. Brain Res. 1986, 370, 108–118. [Google Scholar] [CrossRef]
- Xiao, Y.-F.; Chandler, N.; Dobrzynski, H.; Richardson, E.S.; TenBroek, E.M.; Wilhelm, J.J.; Sharma, V.; Varghese, A.; Boyett, M.R.; Iaizzo, P.A.; et al. Hysteresis in human HCN4 channels: A crucial feature potentially affecting sinoatrial node pacemaking. Sheng Li Xue Bao 2010, 62, 1–13. [Google Scholar]
- Kim, H.; Moon, J.-Y.; Mashour, G.A.; Lee, U. Mechanisms of hysteresis in human brain networks during transitions of consciousness and unconsciousness: Theoretical principles and empirical evidence. PLoS Comput. Biol. 2018, 14, e1006424. [Google Scholar] [CrossRef]
- Sayal, A.; Sousa, T.; Duarte, J.V.; Costa, G.N.; Martins, R.; Castelo-Branco, M. Identification of competing neural mechanisms underlying positive and negative perceptual hysteresis in the human visual system. Neuroimage 2020, 221, 117153. [Google Scholar] [CrossRef] [PubMed]
- Artz, N.J.; Adams, M.A.; Dolan, P. Sensorimotor function of the cervical spine in healthy volunteers. Clin. Biomech. 2015, 30, 260–268. [Google Scholar] [CrossRef]
- Weiler, H.T.; Awiszus, F. Influence of hysteresis on joint position sense in the human knee joint. Exp. Brain Res. 2000, 135, 215–221. [Google Scholar] [CrossRef]
- Abdolvahab, M.; Carello, C. Functional distance in human gait transition. Acta Psychol. 2015, 161, 170–176. [Google Scholar] [CrossRef]
- Aoi, S.; Yamashita, T.; Tsuchiya, K. Hysteresis in the gait transition of a quadruped investigated using simple body mechanical and oscillator network models. Phys. Rev. E—Stat. Nonlinear Soft Matter Phys. 2011, 83 Pt 1, 061909. [Google Scholar] [CrossRef] [PubMed]
- Aoi, S.; Katayama, D.; Fujiki, S.; Tomita, N.; Funato, T.; Yamashita, T.; Senda, K.; Tsuchiya, K. A stability-based mechanism for hysteresis in the walk-trot transition in quadruped locomotion. J. R. Soc. Interface 2013, 10, 20120908. [Google Scholar] [CrossRef] [PubMed] [PubMed Central]
- Mohler, B.J.; Thompson, W.B.; Creem-Regehr, S.H.; Pick, H.L., Jr.; Warren, W.H., Jr. Visual flow influences gait transition speed and preferred walking speed. Exp. Brain Res. 2007, 181, 221–228. [Google Scholar] [CrossRef]
- Thorstensson, A.; Roberthson, H. Adaptations to changing speed in human locomotion: Speed of transition between walking and running. Acta Physiol. Scand. 1987, 131, 211–214. [Google Scholar] [CrossRef] [PubMed]
- Layne, C.S.; Malaya, C.A.; Young, D.R.; Suter, B.; Holder, J.L., Jr. Comparison of Treadmill Gait Between a Pediatric-Aged Individual with SYNGAP1-Related Intellectual Disability and a Fraternal Twin. Front. Hum. Neurosci. 2022, 16, 918918. [Google Scholar] [CrossRef] [PubMed]
- Layne, C.S.; Malaya, C.A.; Ravindran, A.S.; John, I.; Francisco, G.E.; Contreras-Vidal, J.L. Distinct Kinematic and Neuromuscular Activation Strategies During Quiet Stance and in Response to Postural Perturbations in Healthy Individuals Fitted With and Without a Lower-Limb Exoskeleton. Front. Hum. Neurosci. 2022, 16, 942551. [Google Scholar] [CrossRef]
- Winter, D.A.; Rau, G.; Kadefors, R.; Broman, H.; De Luca, C.J. Units, Terms and Standards in the Reporting of EMG Research. A Report of the Ad Hoc Committee of the International Society of Electrophysiological Kinesiology; Boston University: Boston, MA, USA, 1980. [Google Scholar]
- Cifrek, M.; Medved, V.; Tonković, S.; Ostojić, S. Surface EMG based muscle fatigue evaluation in biomechanics. Clin. Biomech. 2009, 24, 327–340. [Google Scholar] [CrossRef]
- Barton, P.M.; Hayes, K.C. Neck flexor muscle strength, efficiency, and relaxation times in normal subjects and subjects with unilateral neck pain and headache. Arch. Phys. Med. Rehabil. 1996, 77, 680–687. [Google Scholar] [CrossRef]
- Carpentier, A.; Duchateau, J.; Hainaut, K. Motor unit behaviour and contractile changes during fatigue in the human first dorsal interosseus. J. Physiol. 2001, 534 Pt 3, 903–912. [Google Scholar] [CrossRef]
- Linssen, W.H.J.P.; Stegeman, D.F.; Joosten, E.M.G.; Notermans, S.L.H.; van’t Hof, M.A.; Binkhorst, R.A. Variability and interrelationships of surface EMG parameters during local muscle fatigue. Muscle Nerve 1993, 16, 849–856. [Google Scholar] [CrossRef]
- van der Hoeven, J.H.; van Weerden, T.W.; Zwarts, M.J. Long-lasting supernormal conduction velocity after sustained maximal isometric contraction in human muscle. Muscle Nerve 1993, 16, 312–320. [Google Scholar] [CrossRef] [PubMed]
- Bringoux, L.; Blouin, J.; Coyle, T.; Ruget, H.; Mouchnino, L. Effect of gravity-like torque on goal-directed arm movements in microgravity. J. Neurophysiol. 2012, 107, 2541–2548. [Google Scholar] [CrossRef] [PubMed]
- Lackner, J.R.; DiZio, P. Gravitoinertial force level affects the appreciation of limb position during muscle vibration. Brain Res. 1992, 592, 175–180. [Google Scholar] [CrossRef]
- Young, L.R.; Oman, C.M.; Merfeld, D.; Watt, D.; Roy, S.; DeLuca, C.; Balkwill, D.; Christie, J.; Groleau, N.; Jackson, D.K.; et al. Spatial orientation and posture during and following weightlessness: Human experiments on Spacelab Life Sciences 1. J. Vestib. Res. 1993, 3, 231–239. [Google Scholar] [CrossRef]
- Mouchnino, L.; Cincera, M.; Fabre, J.C.; Assaiante, C.; Amblard, B.; Pedotti, A.; Massion, J. Is the regulation of the center of mass maintained during leg movement under microgravity conditions? J. Neurophysiol. 1996, 76, 1212–1223. [Google Scholar] [CrossRef] [PubMed]
- Roll, R.; Gilhodes, J.C.; Roll, J.P.; Popov, K.; Charade, O.; Gurfinkel, V. Proprioceptive information processing in weightlessness. Exp. Brain Res. 1998, 122, 393–402. [Google Scholar] [CrossRef]
- Mouchnino, L.; Lhomond, O.; Morant, C.; Chavet, P. Plantar Sole Unweighting Alters the Sensory Transmission to the Cortical Areas. Front. Hum. Neurosci. 2017, 11, 220. [Google Scholar] [CrossRef]
- Saradjian, A.H.; Tremblay, L.; Perrier, J.; Blouin, J.; Mouchnino, L. Cortical facilitation of proprioceptive inputs related to gravitational balance constraints during step preparation. J. Neurophysiol. 2013, 110, 397–407. [Google Scholar] [CrossRef]
- Thiel, S.D.; Bitzer, S.; Nierhaus, T.; Kalberlah, C.; Preusser, S.; Neumann, J.; Nikulin, V.V.; van der Meer, E.; Villringer, A.; Pleger, B. Hysteresis as an implicit prior in tactile spatial decision making. PLoS ONE 2014, 9, e89802. [Google Scholar] [CrossRef] [PubMed] [PubMed Central]
- Kostyukov, A.I.; Cherkassky, V.L. Interaction of the movement-dependent, extrafusal and fusimotor after-effects in the firing of the primary spindle endings. Neuroscience 1997, 76, 1257–1266. [Google Scholar] [CrossRef]
- Kozlovskaya, I.B.; Sayenko, I.V.; Sayenko, D.G.; Miller, T.F.; Khusnutdinova, D.R.; Melnik, K.A. Role of support afferentation in control of the tonic muscle activity. Acta Astronaut. 2007, 60, 285–294. [Google Scholar] [CrossRef]
- Shenkman, B.S.; Kozlovskaya, I.B. Cellular responses of human postural muscle to dry immersion. Front. Physiol. 2019, 10, 187. [Google Scholar] [CrossRef] [PubMed]
- Shenkman, B.S.; Grigoriev, A.I.; Kozlovskaya, I.B. Gravity mechanisms in tonic motor system. Neurophysiological and Muscle Aspects. Hum. Physiol. 2017, 43, 578–590. [Google Scholar] [CrossRef]
- Saveko, A.; Brykov, V.; Kitov, V.; Shpakov, A.; Tomilovskaya, E. Adaptation in Gait to Lunar and Martian Gravity Unloading During Long-Term Isolation in the Ground-Based Space Station Model. Front. Hum. Neurosci. 2022, 15, 742664. [Google Scholar] [CrossRef]
- Shpakov, A.V.; Artamonov Voronov, A.A.; Melnik, K.A. Influence of immersion hypokinesia on kinematic and electromyographic characteristics of human locomotion. Aviakosm. Ekolog. Med. 2008, 5, 24–29. [Google Scholar]
- Litvinova, K.S.; Vikhlyantsev, I.M.; Kozlovskaya, I.B.; Podlubnaya, Z.A.; Shenkman, B.S. Effects of artificial support stimulation on fiber and molecular characteristics of soleus muscle in men exposed to 7-day dry immersion. J. Gravit. Physiol. 2004, 11, 131–132. [Google Scholar]
- Stergiou, N. Innovative Analyses of Human Movement; Human Kinetics: Champaign, IL, USA, 2004. [Google Scholar]
- Manzano, M.; Serrancolí, G. A factorization-based algorithm to predict EMG data using only kinematics information. Int. J. Numer. Methods Biomed. Eng. 2021, 37, e3463. [Google Scholar] [CrossRef]
- Mauntel, T.C.; Cram, T.R.; Frank, B.S.; Begalle, R.L.; Norcross, M.F.; Blackburn, J.T.; Padua, D.A. Kinematic and neuromuscular relationships between lower extremity clinical movement assessments. Sports Biomech. 2018, 17, 273–284. [Google Scholar] [CrossRef]


| Condition | p Value | |||
|---|---|---|---|---|
| Hip | Mean | 100 | 4.6 ± 7.6 | 0.1241 |
| 110 | 5.2 ± 5.9 | 0.4919 | ||
| 120 | 4.8 ± 8.6 | 0.0647 | ||
| 130 | 6.4 ± 8.5 | |||
| 120 U | 2.6 ± 8.3 | 0.0138 * | ||
| 110 U | 4.5 ± 7.0 | 0.0642 | ||
| 100 U | 5.3 ± 6.5 | 0.3423 | ||
| Max | 100 | 19.3 ± 10.9 | 0.0463 * | |
| 110 | 20.5 ± 10.2 | 0.4931 | ||
| 120 | 20.3 ± 12.1 | 0.1595 | ||
| 130 | 22.0 ± 13.5 | |||
| 120 U | 16.7 ± 12.9 | 0.0311 * | ||
| 110 U | 19.2 ± 11.0 | 0.0488 * | ||
| 100 U | 21.2 ± 9.8 | 0.6390 | ||
| Knee | Mean | 100 | 15.1 ± 5.1 | 0.0001 * |
| 110 | 16.2 ± 4.9 | 0.0068 * | ||
| 120 | 16.4 ± 4.6 | 0.0113 * | ||
| 130 | 17.8 ± 4.9 | |||
| 120 U | 16.1 ± 3.8 | 0.1316 | ||
| 110 U | 15.4 ± 5.1 | 0.0082 * | ||
| 100 U | 16.7 ± 4.7 | 0.1020 | ||
| Min | 100 | −3.1 ± 5.3 | 0.0012 * | |
| 110 | −1.7 ± 4.2 | 0.0055 * | ||
| 120 | −1.1 ± 3.7 | 0.0027 * | ||
| 130 | 1.0 ± 3.9 | |||
| 120 U | −2.2 ± 6.3 | 0.0554 | ||
| 110 U | −2.6 ± 5.6 | 0.0081 * | ||
| 100 U | −0.6 ± 4.8 | 0.0782 |
| Condition | % Load | Summed Areas of Hip, Knee and Ankle Phase Portraits | % Change from Previous Level of Loading |
|---|---|---|---|
| Loading | 100% | 157.561 | |
| 110% | 154.564 | −2% | |
| 120% | 152.753 | −1.1% | |
| 130% | 147.700 | −3.3% | |
| Unloading | 120% | 161.429 | +9.2% |
| 110% | 162.578 | +0.7% | |
| 100% | 155.610 | −4.2% |
Disclaimer/Publisher’s Note: The statements, opinions and data contained in all publications are solely those of the individual author(s) and contributor(s) and not of MDPI and/or the editor(s). MDPI and/or the editor(s) disclaim responsibility for any injury to people or property resulting from any ideas, methods, instructions or products referred to in the content. |
© 2025 by the authors. Licensee MDPI, Basel, Switzerland. This article is an open access article distributed under the terms and conditions of the Creative Commons Attribution (CC BY) license (https://creativecommons.org/licenses/by/4.0/).
Share and Cite
Malaya, C.A.; Parikh, P.J.; Smith, D.L.; Layne, C.S. Effects of Simulated Hyper-Gravity on Lower Limb Kinematics and Electromyography During Walking. Biomechanics 2025, 5, 31. https://doi.org/10.3390/biomechanics5020031
Malaya CA, Parikh PJ, Smith DL, Layne CS. Effects of Simulated Hyper-Gravity on Lower Limb Kinematics and Electromyography During Walking. Biomechanics. 2025; 5(2):31. https://doi.org/10.3390/biomechanics5020031
Chicago/Turabian StyleMalaya, Christopher A., Pranav J. Parikh, Dean L. Smith, and Charles S. Layne. 2025. "Effects of Simulated Hyper-Gravity on Lower Limb Kinematics and Electromyography During Walking" Biomechanics 5, no. 2: 31. https://doi.org/10.3390/biomechanics5020031
APA StyleMalaya, C. A., Parikh, P. J., Smith, D. L., & Layne, C. S. (2025). Effects of Simulated Hyper-Gravity on Lower Limb Kinematics and Electromyography During Walking. Biomechanics, 5(2), 31. https://doi.org/10.3390/biomechanics5020031