Communication

New Hip Adductor Isometric Strength Test on Force Platform Shows Good and Acceptable Intra-Test Reliability for Peak Force Measurement

by
Pablo Merino-Muñoz
1,2,
Felipe Hermosilla-Palma
3,
Nicolás Gómez-Álvarez
1,
Jorge Pérez-Contreras
4,5,
Bianca Miarka
6,
Carlos Gomes de Oliveira
7,
Ciro José Brito
8,
Luciano Luporini Menegaldo
2,
Kristof Kipp
9 and
Esteban Aedo-Muñoz
8,*
1
Núcleo de Investigación en Ciencias de la Motricidad Humana, Universidad Adventista de Chile (UnACH), Chillan 3780000, Chile
2
Biomedical Engineering Program, COPPE, Federal University of Rio de Janeiro, Rio de Janeiro 21941630, RJ, Brazil
3
Pedagogía en Educación Física, Facultad de Educación, Universidad Autónoma de Chile, Talca 3460000, Chile
4
Escuela de Ciencias del Deporte y Actividad Física, Facultad de Salud, Universidad Santo Tómas, Santiago 8370003, Chile
5
Escuela de Doctorado de la Universidad de Las Palmas de Gran Canaria, 35016 Las Palmas, Spain
6
Laboratory of Psychophysiology and Performance in Sports and Combats, Department of Physical Education, Federal University of Rio de Janeiro, Rio de Janeiro 21941630, RJ, Brazil
7
Biomechanics Laboratory, EEFD, Federal University of Rio de Janeiro, Rio de Janeiro 21941630, RJ, Brazil
8
Sciences of Physical Activity, Sports and Health School, Faculty of Medical Sciences, Universidad de Santiago de Chile, Santiago 9170022, Chile
9
Departament of Physical Therapy, Marquette University, Milwaukee, WI 53233, USA
*
Author to whom correspondence should be addressed.
Biomechanics 2025, 5(2), 23; https://doi.org/10.3390/biomechanics5020023
Submission received: 4 March 2025 / Revised: 1 April 2025 / Accepted: 8 April 2025 / Published: 10 April 2025
(This article belongs to the Special Issue Biomechanics in Sport, Exercise and Performance)

Abstract

:
Background/Objectives: Groin and hip injuries are common in sport, and muscle weakness has been identified as an intrinsic risk factor. So, analyzing the strength of the hip musculature becomes important. To date, there are no hip adductor isometric strength tests on force platforms. This study aims to analyze the intra-test reliability of a hip adductor strength test using force platforms. Methods: The study sample comprised 13 male professional soccer players with an average age of 22.3 ± 3 years, body mass of 75.8 ± 5.4 kg, and height of 1.8 ± 0.1 m. Assessments were conducted on a uniaxial force platform. The variables analyzed are peak force (PF), rate of force development (RFD), and impulse. Intra-test reliability was evaluated using the coefficient of variation (CV), intraclass correlation coefficient (ICC), and Bland–Altman plots. Results: Acceptable levels of reliability were identified solely for the variable of peak force, with CV values of D = 5.7% for the dominant profile and ND = 5.4% for the non-dominant profile. Furthermore, moderate and good relative reliability were observed in peak force for the dominant (ICC = 0.706) and non-dominant (ICC = 0.819) profiles, respectively. However, the remaining time-related variables, RFD and impulse, did not achieve acceptable levels of absolute reliability (CV > 10%) and displayed poor to moderate relative reliability. Conclusions: In summary, PF during the hip adductor isometric strength test demonstrated acceptable absolute and commendable relative reliability. Conversely, the time-related variables, specifically RFD and impulse, yielded unsatisfactory absolute and relative reliability levels.

1. Introduction

Groin and hip injuries are common in various team sports like soccer, rugby, and Australian soccer, and are prevalent, particularly among male and younger athletes aged 15–24 [1]. Studies on European soccer teams show that about 14% of all injuries occur in the groin and hip areas, and 63% are linked explicitly to the adductor muscles [2] and these injuries tend to increase when many games are played close together [3]. Studies conducted within the context of the UEFA Champions League indicate an incidence rate of 1.1 injuries per 1000 game hours for this particular type of injury [4]. One major result of such injuries is that players cannot participate in training or matches for an average of 1 to 6.9 weeks [1,5,6] and when surgery is required, this absence period can extend to 14 weeks [6]. This drains the clubs’ financial resources [7] and negatively affects the team’s overall performance [8]. Given the importance of these injuries, it is crucial to regularly check athletes’ health and take preventive steps when needed [9,10].
The muscle weakness of the adductor muscle is a critical factor in predicting the risk of groin and hip injuries [11]. Such measurements are often performed by the hip adductor squeeze test, which is both accurate and reliable [12]. The test involves placing a measurement device between the player’s knees and asking them to squeeze it by bringing their legs together [13] and is widely used to diagnose groin pain [12]. Research has shown that a decrease in adductor muscle strength can indicate that groin pain is about to occur in soccer players [14]. Moreover, players who are already injured tend to have weaker adductor muscles during the preseason than those who are not [9]. This information has led to new ways to monitor players during the season to spot early signs of muscle weakness and start strength training [15], so availability and development of easily implementable tests to determine muscle strength could aid coaches and physical trainers in preventive interventions [16,17].
Various technologies like sphygmomanometers and manual and isokinetic dynamometers have been used to measure adductor strength [9,10,14], where the variable of peak force in an isometric contraction of adductor muscles showed more reliability than other variables, like mean force and rate of force development [18]. However, these methods have limitations, including being dependent on the person administering the test. Recently, force platforms have become more common for various physical tests, and portable versions have been validated [19,20] and various studies have been used to evaluate dynamic tests, such as jumps, and isometric tests, such as squat and posterior chain tests [21,22,23,24]. However, to date, we have not reported their use for measuring adductor strength in the scientific literature, but other research suggests they could be helpful for this purpose. This study aims to check how reliable these platforms are for measuring hip adductor isometric strength in professional soccer players. We hypothesize that the peak force could have good to excellent levels of reliability, since this variable, measured with other technologies, has given these results [13,25] as well as in other physical tests [26].

2. Materials and Methods

2.1. Experimental Protocol

This study adopts a quantitative methodology with a descriptive and cross-sectional design. Assessments were conducted during the morning session on the inaugural day of a preseason microcycle at the club’s training center. Initially, participants provided informed consent through an online form accessed via their mobile phones. The form elaborated on this study’s objectives, procedural steps, potential risks, and data anonymity, adhering to the ethical guidelines outlined in the Declaration of Helsinki [27]. Anthropometric measurements were carried out first, followed by physical evaluations. Two evaluators with prior experience with force platform evaluations conducted adductor strength assessments.
A certified ISAK Level II professional conducted the anthropometric assessments. Participants’ heights were measured utilizing a portable stadiometer (Seca 213, Seca, Chino, CA, USA). A force platform (PS-2141, Roseville, CA, USA) was employed for body mass evaluations. Participants were directed to assume a standardized posture with their hands positioned on their hips and their gaze oriented forward. This stance was maintained for two seconds. Data captured within this temporal window were subsequently averaged to ascertain body weight in Newtons, then divided by the acceleration due to gravity to yield the body mass in kilograms.

2.2. Participants

A convenience sample was used. 20 male professional players were recruited, including two goalkeepers, four central defenders, four side defenders, four midfielders, and six forwards. Their demographic characteristics were as follows: age 22.3 ± 3 years, body mass 75.8 ± 5.4 kg, and height 1.79 ± 0.57 m. Inclusion criteria entailed at least six months of regular training and completing at least two valid attempts per leg. Exclusion criteria encompassed physical discomfort or lower limb injuries before or during evaluation. Ethical clearance was obtained from the local ethics committee (CEC No. 2022-7).

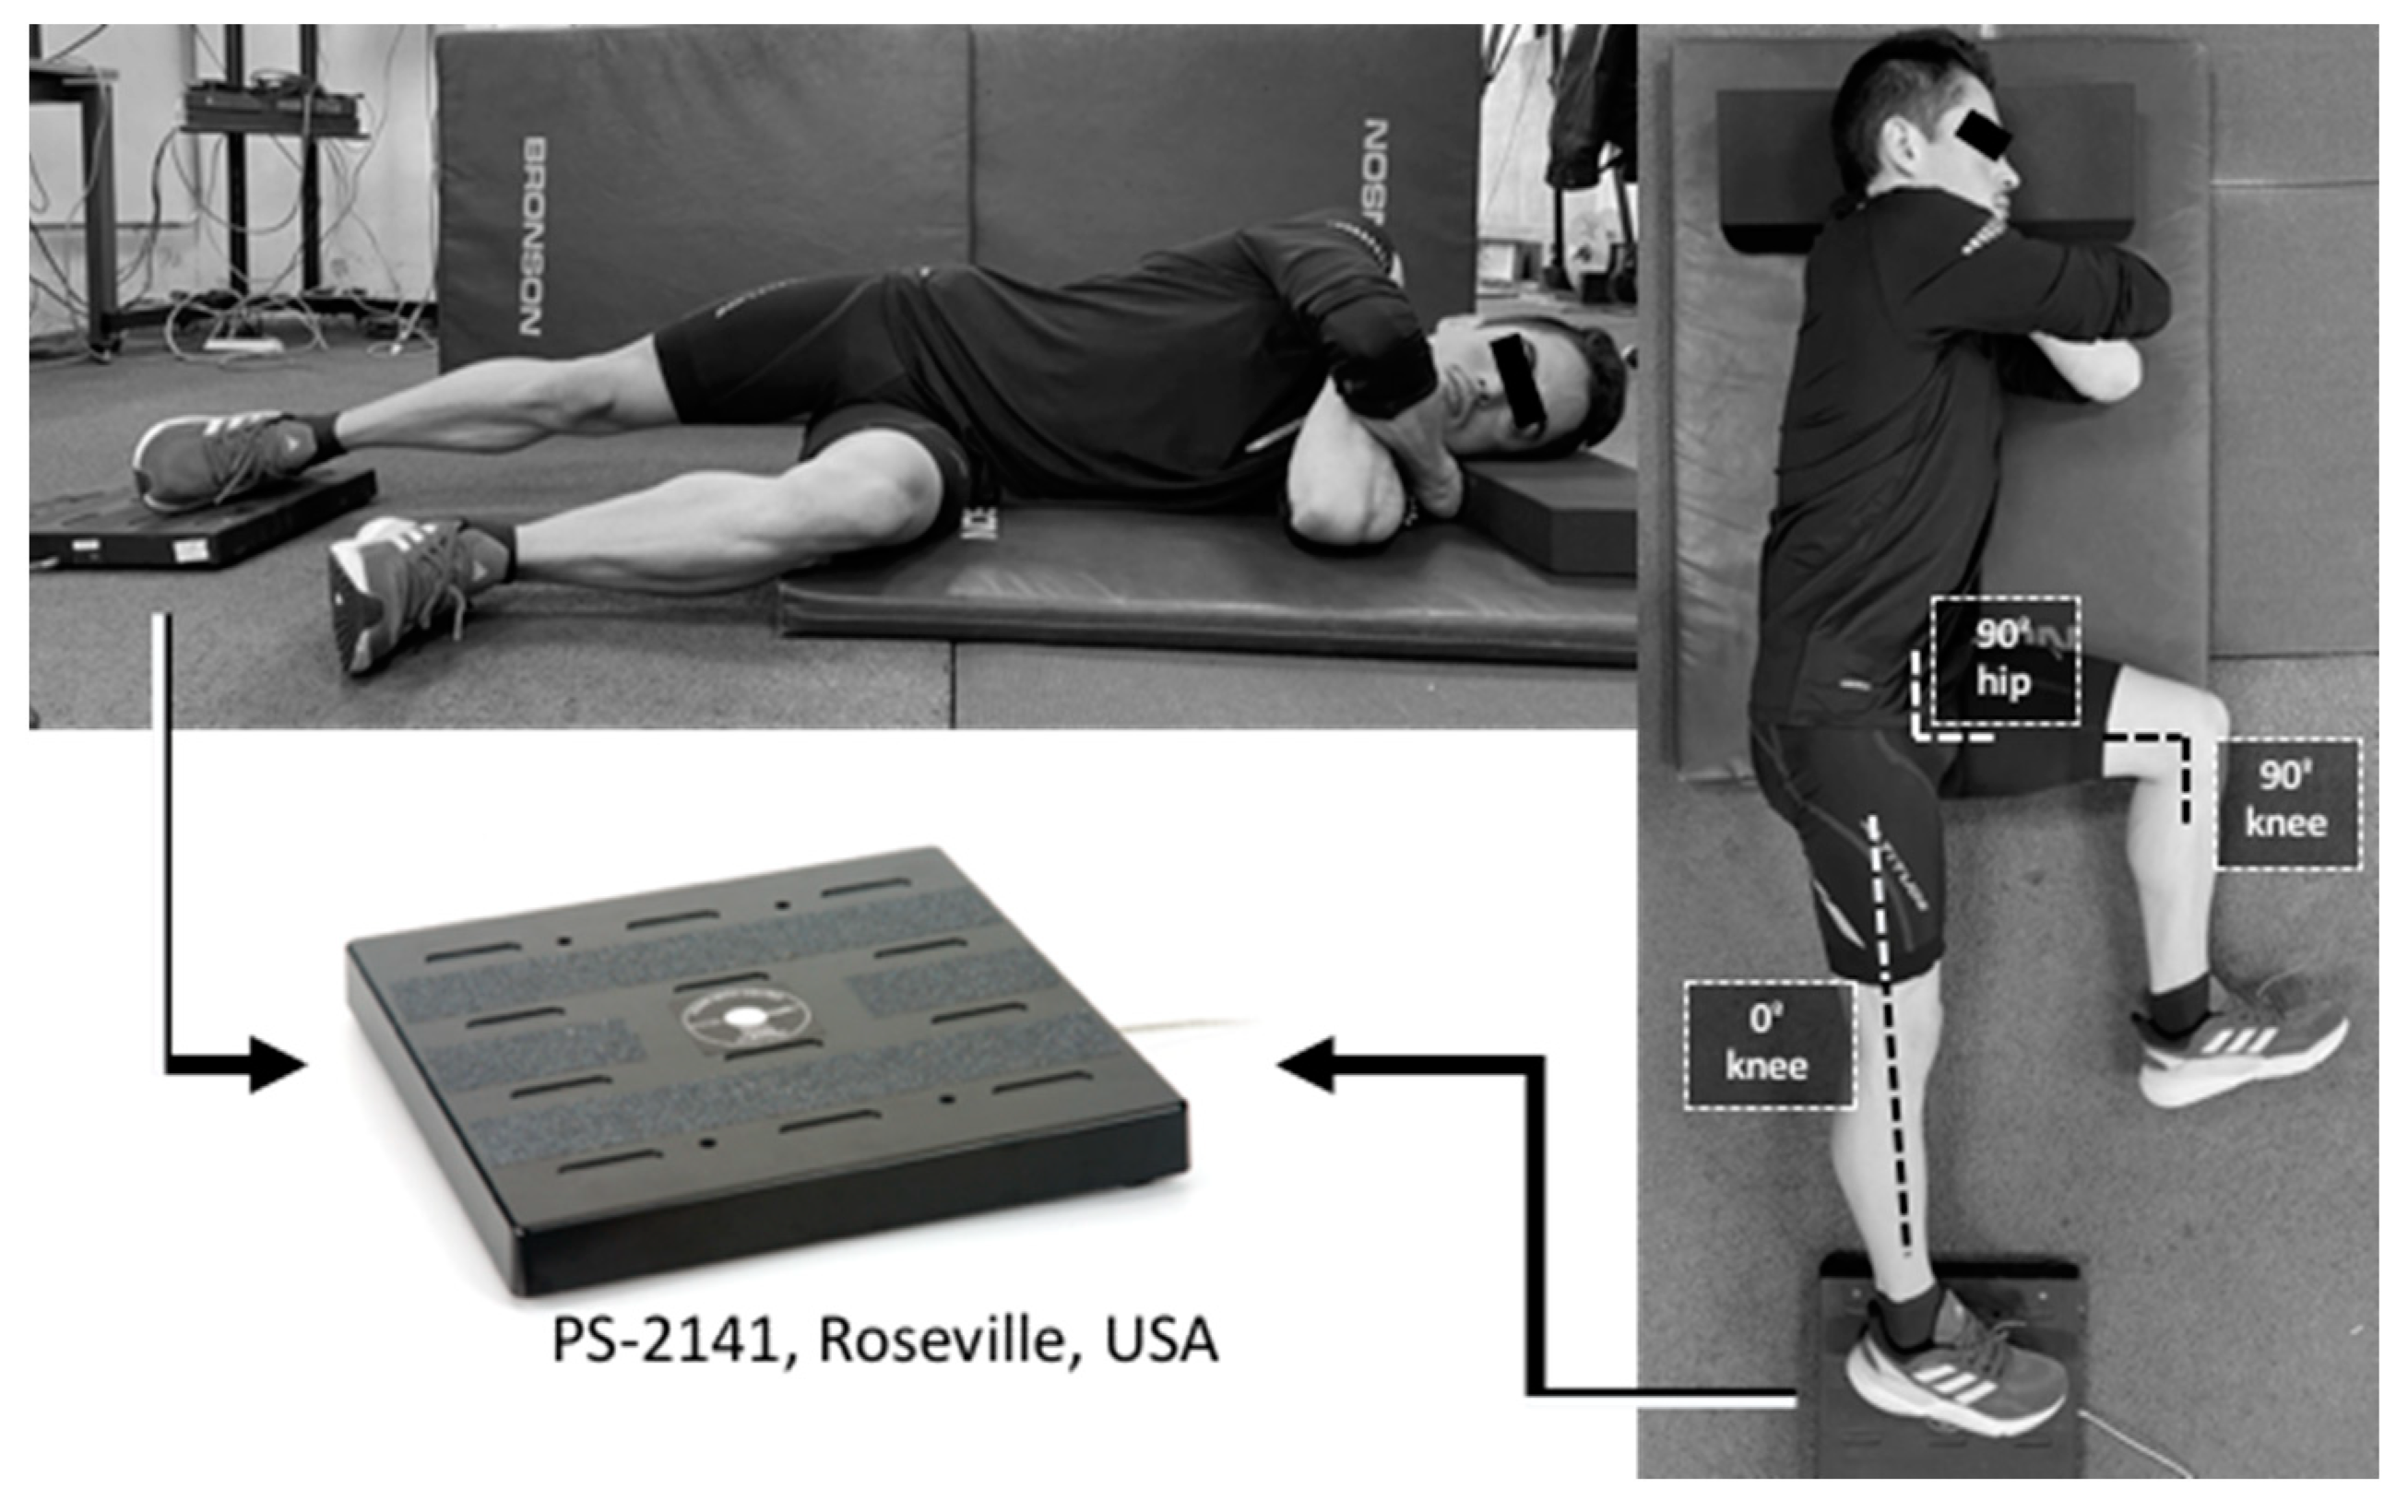
2.3. Hip Adductor Test

We were using a uniaxial force platform (Pasco, model Pasport PS-2141, Roseville, CA, USA). Participants adopted a lateral support position on the platform’s surface, with their hands on the contralateral shoulders. The hip and knee of the lower extremity being assessed were maintained at a 0° angle, while the opposite lower extremity was positioned with the hip and knee at 90° flexion (Figure 1). The position was chosen for various reasons. The first is that higher force values were found in hip 0° compared with other hip angles, and electromyography values of hip adductor muscles (adductor longus, adductor magnus, gracilis, and pectineus) had differences between injured and non-injured subjects [28] and lastly, from a practical point of view, it is easy for the evaluators to position the subjects and inspect the proposed angles.
Before the test, participants engaged in a general warm-up protocol encompassing 10 min of low-intensity continuous running, joint mobility exercises, and static and dynamic stretching focusing on the lower extremities, with particular emphasis on the adductor muscles. A specific warm-up regimen was followed, which included two sets of three coordinative sequences, two sets of 10 squats, and two sets of six lateral lunges for each leg, executed without additional loading. The testing environment was the team’s weight room, and participants wore athletic footwear during the evaluation.
Before the official attempts, participants were instructed to execute two preliminary trials per leg at intensities corresponding to perceived exertion levels of 6 and 9 on a 1–10 scale (with 10 signifying maximum effort). This procedure was designed to confirm the appropriateness of the test positioning and to ensure participant comfort. Each participant then executed three trials of three-second duration per leg, interspersed with 30 s rest intervals. Participants could select the sequence in which they tested their dominant and non-dominant profiles. Upon the evaluators’ signal to “push as fast and hard as possible” [29], the data collection was initiated through a countdown: “3, 2, 1, go”. At the utterance of “go”, participants exerted their force while being verbally encouraged by the evaluators with the command “push”. The two attempts yielding the highest peak forces were selected for reliability analysis.

2.4. Signal Processing

All signal data were captured at a sampling rate of 1000 Hz and subsequently processed using MATLAB 2021a software (Mathworks, Natick, MA, USA) through custom algorithms developed by the authors. The onset of force application was determined using the five standard deviations method. The acquired signals were low-pass filtered with a 10 Hz cutoff frequency. The variables included peak force (N) and rate of force development (RFD) over varying time intervals: 0–50 ms, 0–100 ms, and 0–200 ms (expressed in N/s). These specific time windows were selected to mimic the force application durations commonly observed in the dynamic actions executed by soccer players, such as running, braking, and jumping [22,30,31]. In addition, peak RFD was calculated using a moving window of 20 ms with 1 ms of overlapping based on findings related to the highest reliability in other isometric tests [32]. The signal shapes and variables are in Figure 2.

2.5. Statistical Analysis

The data described how mean and standard deviation. The Coefficient of variation (CV) and Error standard of measurement (SEM) were employed as measures of absolute reliability. Each athlete’s CV was calculated and then averaged across the sample and values less than 10% were deemed acceptable and SEM was calculated how: SD√(1-ICC); where SD is sample standard deviation and ICC is intraclass correlation coefficient, and her unit is the same as that of the variable analyzed, which is useful since the smaller the SEM the more reliable the measurements [33]. The ICC was employed to assess relative reliability using a mixed-effects model with two factors and a form for evaluating absolute agreement in single measurements [34]. The ICC values were categorized according to thresholds: values below 0.49 were considered poor; from 0.5 to 0.74 were classified as moderate; between 0.75 and 0.89 were considered good; and values above 0.9 were deemed excellent [35]. The 95% Confidence Intervals (CI) were presented. Statistical analyses were executed using SPSS version 25, and significance was set at an alpha level of 0.05. Additionally, Bland–Altman plots and statistics were made.

3. Results

Table 1 shows the reliability of the test. Acceptable absolute reliability was observed solely in peak force (CV: D = 5.7% and ND = 5.4%), with moderate and good relative reliability in the peak force in the dominant and non-dominant profiles, respectively (ICC = 0.706 and 0.819). The other variables (time-related) had non-acceptable absolute reliability (CV > 12%) and poor to moderate relative reliability (ICC= 0.18 to 0.66). The Bland–Altman results for peak force can be seen in Figure 3 and Table 2.

4. Discussion

The objective of the current study was to evaluate the intra-test reliability of a hip adductor strength test utilizing a force platform. Our main finding revealed that only peak force demonstrated acceptable absolute reliability and moderate-to-good relative reliability among the variables tested. This finding suggests that the proposed test potentially applies to professional soccer players and athletes engaged in other sports where adductor injuries are common.
Given the significance of this issue, numerous studies have been dedicated to devising tests aimed at mitigating the risk of lower limb adductor injuries among soccer players [9,10,13,16]. One recent proposal by de Queiroz, Frota et al. (2023) is the Brazilian Adductor Performance Test, which measures the risk of hip adductor injury through repetitive contractions of the hip adductors and showed high sensitivity (100%) and moderate specificity (57.2%) when a cutoff point of 33 repetitions was applied [16]. Consistent with our findings, other studies assessing hip adductor strength have reported good-to-excellent relative reliability, with ICCs ranging from 0.76 to 0.92, and acceptable absolute reliability (CV = 4%) [13,25,36,37]. These findings remained consistent across different evaluation instruments (e.g., dynamometer or sphygmomanometer), body positions (i.e., angles of hip and knee), and points of force application (i.e., knee or ankle) [13,25,36,37].
In relation to RFD, conversely to our results, Mesquita, Gonçalves et al. (2018) measured test–retest reliability, finding good to excellent reliability [38]. It should be noted that previous studies provided a familiarization session. This aspect could guide improving intra-test reliability, as described in methodological considerations when assessing RFD [39]. If future studies replicate our protocol, familiarizing the participants would be a beneficial addition. Another study carried out the test–retest evaluation (intra-day) of hip adductor strength, using the maximum value of each occasion for the analysis [40] and found good to excellent reliability in peak force and RFD. These differences may be due to the test–retest design and the statistical treatment, where changes in the intraclass correlation analyses (concordance vs. absolute agreement) produce different ICCs. In our case, we used an absolute agreement type, which produces lower values than when using the concordance type [34]. On the other hand, minor variations in joint angles between attempts could create large variations in RFD [39,40]. Thus, minimizing joint movement between attempts should be ensured to control this confounder.
The present studies present some limitations, first the athletes do not have familiarization session, second the sample size is small, and population is limited to one team sport, more athletes are required to various sport for generalize the results, and lastly the position was visually established for raters, which can increase the angular variability of the joints.
Future inquiries into the test–retest reliability of the newly developed hip adductor strength test should be multi-dimensional. Firstly, evaluating the reliability between days and the impact of familiarization on temporal variables such as RFD and impulse is essential. This would elucidate whether multiple sessions are required to obtain stable and reliable measurements for these metrics. Secondly, investigating the correlation between this novel test and other established adductor strength tests documented in scientific literature could yield valuable comparative data. Moreover, further research could assess the interrelation between the hip adductor strength test and other physical performance tests, such as jump height, sprinting speed, or agility in directional changes. Such analyses could inform tailored training regimens to enhance specific athletic abilities that are pivotal to success in sports.
Establishing cut-off points for acceptable levels of asymmetry between dominant and non-dominant lower limbs is another relevant aspect to investigate. Previous research indicates that such asymmetry can predict injury risk, especially in soccer [41] and these can be performed through retrospective and prospective designs. Therefore, future research on asymmetries in cut-off points, values by age, sex, or other variables could help advance injury risk prevention. Also, for practical settings, is important have a benchmark (i.e., start of pre-season or start of competitive season) adding this test for analyze future change, either in case of injury or decreases in strength, to help guide the processes of rehabilitation and strengthening, also CV and SD of bias (Bland–Altman statistics) can be used as a threshold for minimum substantial change/smallest worthwhile change. Therefore, this test can be used for the purposes mentioned above, having the potential to be reliable to have internal methodological validity in future research as well as in sports environments.

5. Conclusions

To summarize, it can be concluded that the peak force metric in the new hip adductor isometric strength test demonstrates acceptable absolute reliability and good relative reliability. However, time-related variables, RFD and impulse, were found to possess unacceptable absolute and poor relative reliability, possibly due to the need for familiarization sessions.

Author Contributions

Conceptualization, P.M.-M., J.P.-C. and E.A.-M.; methodology P.M.-M., F.H.-P. and N.G.-Á.; formal analysis P.M.-M., B.M. and C.G.d.O.; data curation J.P.-C. and C.J.B.; writing—original draft preparation P.M.-M., E.A.-M., B.M., C.J.B., L.L.M. and K.K.; writing—review and editing P.M.-M., E.A.-M., B.B, C.J.B., L.L.M. and K.K.; visualization, C.G.d.O. and E.A.-M.; funding acquisition P.M.-M. and N.G.-Á. All authors have read and agreed to the published version of the manuscript.

Funding

This research was funded by the Universidad Adventista de Chile, Regular Project number 169.

Institutional Review Board Statement

This study was approved by the ethics committee (CEC No. 2022-7).

Informed Consent Statement

Informed consent was obtained from all subjects involved in this study.

Data Availability Statement

The data that supports the findings of this study are available from the corresponding author (E.A.-M.) upon reasonable request.

Conflicts of Interest

The authors declare no conflicts of interest.

References

  1. Sharma, H.; Athar, S.; Kholiya, K.; Akhtar, S.; Jain, K.; Goyal, B.; Kachhawa, D. Groin Injury in Athletes: A Review. J. Surv. Sci. 2023, 10, 2023. [Google Scholar] [CrossRef]
  2. Waldén, M.; Hägglund, M.; Ekstrand, J. The epidemiology of groin injury in senior football: A systematic review of prospective studies. Br. J. Sports Med. 2015, 49, 792–797. [Google Scholar] [CrossRef] [PubMed]
  3. Harøy, J.; Clarsen, B.; Thorborg, K.; Hölmich, P.; Bahr, R.; Andersen, T.E. Groin Problems in Male Soccer Players Are More Common Than Previously Reported. Am. J. Sports Med. 2017, 45, 1304–1308. [Google Scholar] [CrossRef] [PubMed]
  4. Werner, J.; Hägglund, M.; Waldén, M.; Ekstrand, J. UEFA injury study: A prospective study of hip and groin injuries in professional football over seven consecutive seasons. Br. J. Sports Med. 2009, 43, 1036–1040. [Google Scholar] [CrossRef]
  5. Werner, J.; Hägglund, M.; Ekstrand, J.; Waldén, M. Hip and groin time-loss injuries decreased slightly but injury burden remained constant in men’s professional football: The 15-year prospective UEFA Elite Club Injury Study. Br. J. Sports Med. 2018, 53, 539–546. [Google Scholar] [CrossRef]
  6. Farrell, S.G.; Hatem, M.; Bharam, S. Acute Adductor Muscle Injury: A Systematic Review on Diagnostic Imaging, Treatment, and Prevention. Am. J. Sports Med. 2023, 51, 3591–3603. [Google Scholar] [CrossRef]
  7. Ekstrand, J. Preventing injuries in professional football: Thinking bigger and working together. Br. J. Sports Med. 2016, 50, 709–710. [Google Scholar] [CrossRef]
  8. Hägglund, M.; Waldén, M.; Magnusson, H.; Kristenson, K.; Bengtsson, H.; Ekstrand, J. Injuries affect team performance negatively in professional football: An 11-year follow-up of the UEFA Champions League injury study. Br. J. Sports Med. 2013, 47, 738–742. [Google Scholar] [CrossRef]
  9. Moreno-Pérez, V.; Travassos, B.; Calado, A.; Gonzalo-Skok, O.; Del Coso, J.; Mendez-Villanueva, A. Adductor squeeze test and groin injuries in elite football players: A prospective study. Phys. Ther. Sport 2019, 37, 54–59. [Google Scholar] [CrossRef]
  10. Short, S.M.; MacDonald, C.W.; Strack, D. Hip and Groin Injury Prevention in Elite Athletes and Team Sport—Current Challenges and Opportunities. Int. J. Sports Phys. Ther. 2021, 16, 270–281. [Google Scholar] [CrossRef]
  11. Engebretsen, A.H.; Myklebust, G.; Holme, I.; Engebretsen, L.; Bahr, R. Intrinsic Risk Factors for Groin Injuries among Male Soccer Players. Am. J. Sports Med. 2010, 38, 2051–2057. [Google Scholar] [CrossRef]
  12. Verrall, G.M.; Slavotinek, J.P.; Barnes, P.G.; Fon, G.T. Description of pain provocation tests used for the diagnosis of sports-related chronic groin pain: Relationship of tests to defined clinical (pain and tenderness) and MRI (pubic bone marrow oedema) criteria. Scand. J. Med. Sci. Sports 2005, 15, 36–42. [Google Scholar] [CrossRef] [PubMed]
  13. Fulcher, M.L.; Hanna, C.M.; Elley, C.R. Reliability of handheld dynamometry in assessment of hip strength in adult male football players. J. Sci. Med. Sport 2010, 13, 80–84. [Google Scholar] [CrossRef]
  14. Crow, J.F.; Pearce, A.J.; Veale, J.P.; Vander Westhuizen, D.; Coburn, P.T.; Pizzari, T. Hip adductor muscle strength is reduced preceding and during the onset of groin pain in elite junior Australian football players. J. Sci. Med. Sport 2010, 13, 202–204. [Google Scholar] [CrossRef] [PubMed]
  15. Wollin, M.; Thorborg, K.; Welvaert, M.; Pizzari, T. In-season monitoring of hip and groin strength, health and function in elite youth soccer: Implementing an early detection and management strategy over two consecutive seasons. J. Sci. Med. Sport 2018, 21, 988–993. [Google Scholar] [CrossRef] [PubMed]
  16. de Queiroz, J.H.M.; Frota, J.P.; dos Reis, F.A.; de Oliveira, R.R. Development and Predictive Validation of the Brazilian Adductor Performance Test for Estimating the Chance of Hip Adductor Injuries in Elite Soccer Athletes. Int. J. Sports Physiol. Perform. 2023, 18, 653–659. [Google Scholar] [CrossRef]
  17. Brown, M.; Hader, K.; Guilhem, G.; Simpson, B.M.; Buchheit, M.; Lacome, M. The ballistic hip thrust test: A potential tool to monitor neuromuscular performance. Biol. Sport 2022, 39, 73–77. [Google Scholar] [CrossRef]
  18. Silva, M.R.d.S.; Da Silva, T.K.S.T.; Junior, V.X.D.; Araújo, S.R.S.; Calvo, A.P.C.; Ferreira, J.C. Reliability of an isometric test for measuring the strength of the hip abductors and adductors. Biosci. J. 2020, 36, 1043–1050. [Google Scholar] [CrossRef]
  19. Silveira, R.P.; Stergiou, P.; Carpes, F.P.; Castro, F.A.d.S.; Katz, L.; Stefanyshyn, D.J. Validity of a portable force platform for assessing biomechanical parameters in three different tasks. Sports Biomech. 2016, 16, 177–186. [Google Scholar] [CrossRef]
  20. Sands, W.A.; Bogdanis, G.C.; Penitente, G.; Donti, O.; McNeal, J.R.; Butterfield, C.C.; Poehling, R.A.; Barker, L.A. Reliability and validity of a low-cost portable force platform. Isokinet. Exerc. Sci. 2020, 28, 247–253. [Google Scholar] [CrossRef]
  21. Aedo-Muñoz, E.; Reyes-Galvez, N.; López-Guzmán, C.M.; Argothy-Bucheli, R.; Prat-Luri, A.; Bustamante-Garrido, A.; Miarka, B.; Brito, C.J. A multivariate regression and discriminant canonical analysis of Isometric Mid-Thigh Pull performance in cadet inline speed skaters. Motricidade 2022, 18, 127–133. [Google Scholar] [CrossRef]
  22. Aedo-Muñoz, E.; Pérez-Contreras, J.; Bustamante-Garrido, A.; Arriagada-Tarifeño, D.; Cancino-Jiménez, J.; Retamal-Espinoza, M.; Argothy-Buchelli, R.; Brito, C.; Merino-Muñoz, P. Is Countermovement Jump an Indirect Marker of Neuromuscular Mechanism? Relationship with Isometric Knee Extension Test. J. Funct. Morphol. Kinesiol. 2024, 9, 242. [Google Scholar] [CrossRef]
  23. Merino-Muñoz, P.; Pérez-Contreras, J.; Aedo-Muñoz, E.; Bustamante-Garrido, A. Relationship between jump height and rate of braking force development in professional soccer players. J. Phys. Educ. Sport. 2020, 20, 3614–3621. [Google Scholar] [CrossRef]
  24. Matinlauri, A.; Alcaraz, P.E.; Freitas, T.T.; Mendiguchia, J.; Abedin-Maghanaki, A.; Castillo, A.; Martínez-Ruiz, E.; Carlos-Vivas, J.; Cohen, D.D. A comparison of the isometric force fatigue-recovery profile in two posterior chain lower limb tests following simulated soccer competition. PLoS ONE 2019, 14, e0206561. [Google Scholar] [CrossRef] [PubMed]
  25. Kirwan, E.; Nulty, C.; Browne, D. Intra-day and inter-day reliabilities of the 0° and 45° adductor squeeze tests using hand-held dynamometry. Sport Sci. Health 2022, 19, 783–789. [Google Scholar] [CrossRef]
  26. Grgic, J.; Scapec, B.; Mikulic, P.; Pedisic, Z. Test-retest reliability of isometric mid-thigh pull maximum strength assessment: A systematic review. Biol. Sport 2022, 39, 407–414. [Google Scholar] [CrossRef]
  27. World Medical Association. World Medical Association Declaration of Helsinki: Ethical principles for medical research involving human subjects. J. Am. Med. Assoc. 2013, 310, 2191–2194. [Google Scholar] [CrossRef]
  28. Lovell, G.A.; Blanch, P.D.; Barnes, C.J. EMG of the hip adductor muscles in six clinical examination tests. Phys. Ther. Sport 2012, 13, 134–140. [Google Scholar] [CrossRef]
  29. Barillas, S.R.; Oliver, J.L.; Lloyd, R.S.; Pedley, J.S. Cueing the Youth Athlete During Strength and Conditioning: A Review and Practical Application. Strength Cond. J. 2020, 43, 29–42. [Google Scholar] [CrossRef]
  30. Colyer, S.L.; Nagahara, R.; Takai, Y.; Salo, A.I.T. How sprinters accelerate beyond the velocity plateau of soccer players: Waveform analysis of ground reaction forces. Scand. J. Med. Sci. Sports 2018, 28, 2527–2535. [Google Scholar] [CrossRef]
  31. Buckthorpe, M.; Roi, G. The time has come to incorporate a greater focus on rate of force development training in the sports injury rehabilitation process. Muscle Ligaments Tendons J. 2019, 7, 435. [Google Scholar] [CrossRef]
  32. Haff, G.G.; Ruben, R.P.; Lider, J.; Twine, C.; Cormie, P. A Comparison of Methods for Determining the Rate of Force Development During Isometric Midthigh Clean Pulls. J. Strength Cond. Res. 2015, 29, 386–395. [Google Scholar] [CrossRef] [PubMed]
  33. Atkinson, G.; Nevill, A.M. Statistical Methods For Assessing Measurement Error (Reliability) in Variables Relevant to Sports Medicine. Sports Med. 1998, 26, 217–238. [Google Scholar] [CrossRef]
  34. Trevethan, R. Intraclass correlation coefficients: Clearing the air, extending some cautions, and making some requests. Heal. Serv. Outcomes Res. Methodol. 2016, 17, 127–143. [Google Scholar] [CrossRef]
  35. Koo, T.K.; Li, M.Y. A Guideline of Selecting and Reporting Intraclass Correlation Coefficients for Reliability Research. J. Chiropr. Med. 2016, 15, 155–163, Erratum in J. Chiropr. Med. 2017, 16, 346. [Google Scholar] [CrossRef] [PubMed]
  36. Delahunt, E.; McEntee, B.L.; Kennelly, C.; Green, B.S.; Coughlan, G.F. Intrarater Reliability of the Adductor Squeeze Test in Gaelic Games Athletes. J. Athl. Train. 2011, 46, 241–245. [Google Scholar] [CrossRef] [PubMed]
  37. Casartelli, N.C.; Lepers, R.; Maffiuletti, N.A. Assessment of the rate of force development scaling factor for the hip muscles. Muscle Nerve 2014, 50, 932–938. [Google Scholar] [CrossRef]
  38. Mesquita, R.; Gonçalves, B.; Tavares, F.; Brito, J.; Correia, P.; Santos, P.; Mil-Homens, P. Maximal Strength and Rate of Force Development of Hip Adduction and Abduction: Reliability of Measures from a Portable Dynamometer. 2018, pp. 1–2. Available online: https://www.researchgate.net/profile/Ricardo-Mesquita-3/publication/328137326_Maximal_strength_and_rate_of_force_development_of_hip_adduction_and_abduction_reliability_of_measures_from_a_portable_dynamometer/links/5bfcdcdb92851cbcdd7460f9/Maximal-strength-and-rate-of-force-development-of-hip-adduction-and-abduction-reliability-of-measures-from-a-portable-dynamometer.pdf (accessed on 20 January 2020).
  39. Maffiuletti, N.A.N.; Aagaard, P.; Blazevich, A.; Folland, J.J.; Tillin, N.; Duchateau, J. Rate of force development: Physiological and methodological considerations. Eur. J. Appl. Physiol. 2016, 116, 1091–1116. [Google Scholar] [CrossRef]
  40. Ishøi, L.; Hölmich, P.; Thorborg, K. Measures of hip muscle strength and rate of force development using a fixated handheld dynamometer: Intra-Tester Intra-Day reliability of a clinical set-up. Int. J. Sports Phys. Ther. 2019, 14, 715–723. [Google Scholar] [CrossRef]
  41. Markovic, G.; Šarabon, N.; Pausic, J.; Hadžić, V. Adductor Muscles Strength and Strength Asymmetry as Risk Factors for Groin Injuries among Professional Soccer Players: A Prospective Study. Int. J. Environ. Res. Public Health 2020, 17, 4946. [Google Scholar] [CrossRef]
Figure 1. Test the position and instrument.
Biomechanics 05 00023 g001
Figure 2. Signal shape of force and rate of force development (RFD).
Biomechanics 05 00023 g002
Figure 3. Bland–Altman plots of peak force in both profiles. s standard deviation of bias.
Biomechanics 05 00023 g003
Table 1. Description and reliability of the adductor strength test.
VariableLimbs ProfileM±SDSEMCVICCIL 95%UL 95%
Peak force (N)D17922.212.05.770.7060.4020.871
ND1807.33.115.450.8190.6020.924
RFD 50 ms (N/s)D66664247050.50.4640.0680.742
ND39611182.045.90.4530.0210.742
RFD 100 ms (N/s)D70929318225.40.6120.2580.824
ND60413395.130.80.4880.0620.762
RFD 200 ms (N/s)D112321014813.00.5010.1020.765
ND103215811017.70.5180.1050.778
Peak RFD (N/s)D1781120095532.20.367 *−0.0890.692
ND133026015224.40.6600.3160.85
Impulse 0–50 ms (N *s)D2.830.880.7814.80.219 *−0.2050.586
ND2.620.270.2412.60.253 *−0.2240.624
Impulse 0–100 ms (N *s)D7.552.341.7417.10.4490.0520.733
ND6.800.900.8115.00.183 *−0.2970.578
Impulse 0–200 ms (N *s)D21.24.332.9612.00.5330.1480.782
ND19.92.842.3913.20.291 *−0.1830.648
* p > 0.05; M mean; ±SD—standard deviation; SEM—standard error of the measurement; ICC—intra-class correlation coefficient; IL—lower limit; UL—upper limit; D—dominant; ND—non-dominant; RFD—rate of force development.
Table 2. Results of Bland–Altman statistics.
Peak ForceBiasStandard Deviation of Bias95% Limits of Agreement
Dominant (N)−4.3518.40−40.431.7
No dominant (N)−5.5016.08−37.026.0
Disclaimer/Publisher’s Note: The statements, opinions and data contained in all publications are solely those of the individual author(s) and contributor(s) and not of MDPI and/or the editor(s). MDPI and/or the editor(s) disclaim responsibility for any injury to people or property resulting from any ideas, methods, instructions or products referred to in the content.

