Article

Femoral Bone Strength Prediction Using Isotopological B-Spline-Transformed Meshes

1
Institute of Lightweight Design and Structural Biomechanics, TU-Wien, 1060 Vienna, Austria
2
Division Biomechanics, Karl Landsteiner University of Health Sciences, 3500 Krems an der Donau, Austria
*
Author to whom correspondence should be addressed.
Biomechanics 2022, 2(1), 125-137; https://doi.org/10.3390/biomechanics2010012
Submission received: 8 February 2022 / Revised: 11 March 2022 / Accepted: 14 March 2022 / Published: 16 March 2022

Abstract

:
Finite element (FE) analysis can predict proximal human femoral strength. Automated meshing and identifying subregions with high relevance for strength prediction could reduce the laborious modeling process. Mesh morphing based on free-form registration provides a high level of automation and inherently creates isotopological meshes. The goals of this study were to investigate if FE models based on free-form transformed meshes predict experimental femoral strength as well as manually created FE models and to identify regions and parameters with highest correlation to femoral strength. Subject-specific meshes and FE models were created from a set of quantitative CT images (QCT) using a B-Spline registration-based algorithm. Correlation of FE-predicted bone strength and local parameters with experimental bone strength were investigated. FE models based on transformed meshes closely resembled manually created counterparts, with equally strong correlations with experimental bone strength ( R 2 = 0.81 vs. R 2 = 0.80 ). The regional analysis showed strong correlations ( 0.6 < R 2 < 0.7 ) of experimental strength with local parameters. No subregion or parameter lead to stronger correlation than FE predicted bone strength. B-spline-transformed meshes can be used to create FE models, able to predict femoral bone strength and simplify FE model generation. They can be used to reveal relations of local parameters with failure load.

1. Introduction

The prediction of bone strength has a high potential for bone quality assessment [1]. When it comes to patient health, imaging-based methods remain the best option, with computer tomography-based finite element (FE) simulations showing the highest correlation with experimental bone strength [2]. However, creating such models manually is expensive and requires a lot of expertise. It would therefore be beneficial to reduce the cost and time required for processing. This can be achieved by automating meshing in the model generation.
Mesh morphing methods have already been in use as alternative to manual meshing methods in FE model generation [3,4,5]. Usually, a template mesh from an atlas, a mean model with respect to shape and gray values, or a specimen close to the average, is transformed to fit the respective target specimen. These transformed meshes are inherently isotopological and can therefore be used for comparisons in various subregions of the bone such as the neck, or even element-wise statistical comparisons. While landmark- and surface-based methods for subject-specific mesh morphing are well documented [4,6,7,8,9], they require the implementation of additional algorithms and methods, e.g., to identify landmarks.
Free-form registration-based methods can be applied directly to provided images and have also already been used for mesh morphing and mesh morphing-based FE models [7,10,11,12,13]. However, to our knowledge, no study provided data on the accuracy of FE models based on such transformed meshes with respect to experimental bone strength. In a previous work, free-form registration-based statistical deformation and texture models (SDTMs) of proximal femora were successfully used to generate 3D FE models from 2D projections with high correlation to experimental results [14]. Although the FE models in that study were based on morphed meshes, no direct 3D-3D registrations were used to calculate correspondences.
Several parameters and sections of the femur have been investigated for their ability to predict fracture risk and bone strength [15,16,17,18,19]. Especially the femoral neck has long been of higher interest and is one of the distinct regions examined in dual energy X-ray absorptiometry (DEXA) [20,21]. However, DEXA-based bone mineral density (BMD) is a projected measurement and therefore does not entirely reflect three dimensional properties [22]. The accuracy of the method with respect to fracture-prediction has also been questioned [23]. Three-dimensional methods appear more promising [24]. Other parameters investigated in the past are bone volume to total volume (BV/TV) and stress and strain-related measurements [25,26,27]. However, again, information on their relation to experimentally measured bone strength is scarce.
Therefore, the potential of FE-based and morphometric parameters using isotopological B-spline-transformed meshes to predict experimental bone strength is investigated in this work. For this purpose, experimentally acquired bone strength measurements are correlated, first, with FE-predicted bone strength and, second, with local mechanical and morphological parameters. Conventional, manually created FE models serve as a control to reveal deviations in geometry or precision of the predicted bone strength in the FE models with transformed meshes.
In summary, in this work we would like to review how accurately isotopological meshes can predict femoral strength and if other morphometric surrogates computed based on these isotopological meshes are also able to predict experimental bone strength sufficiently.

2. Materials and Methods
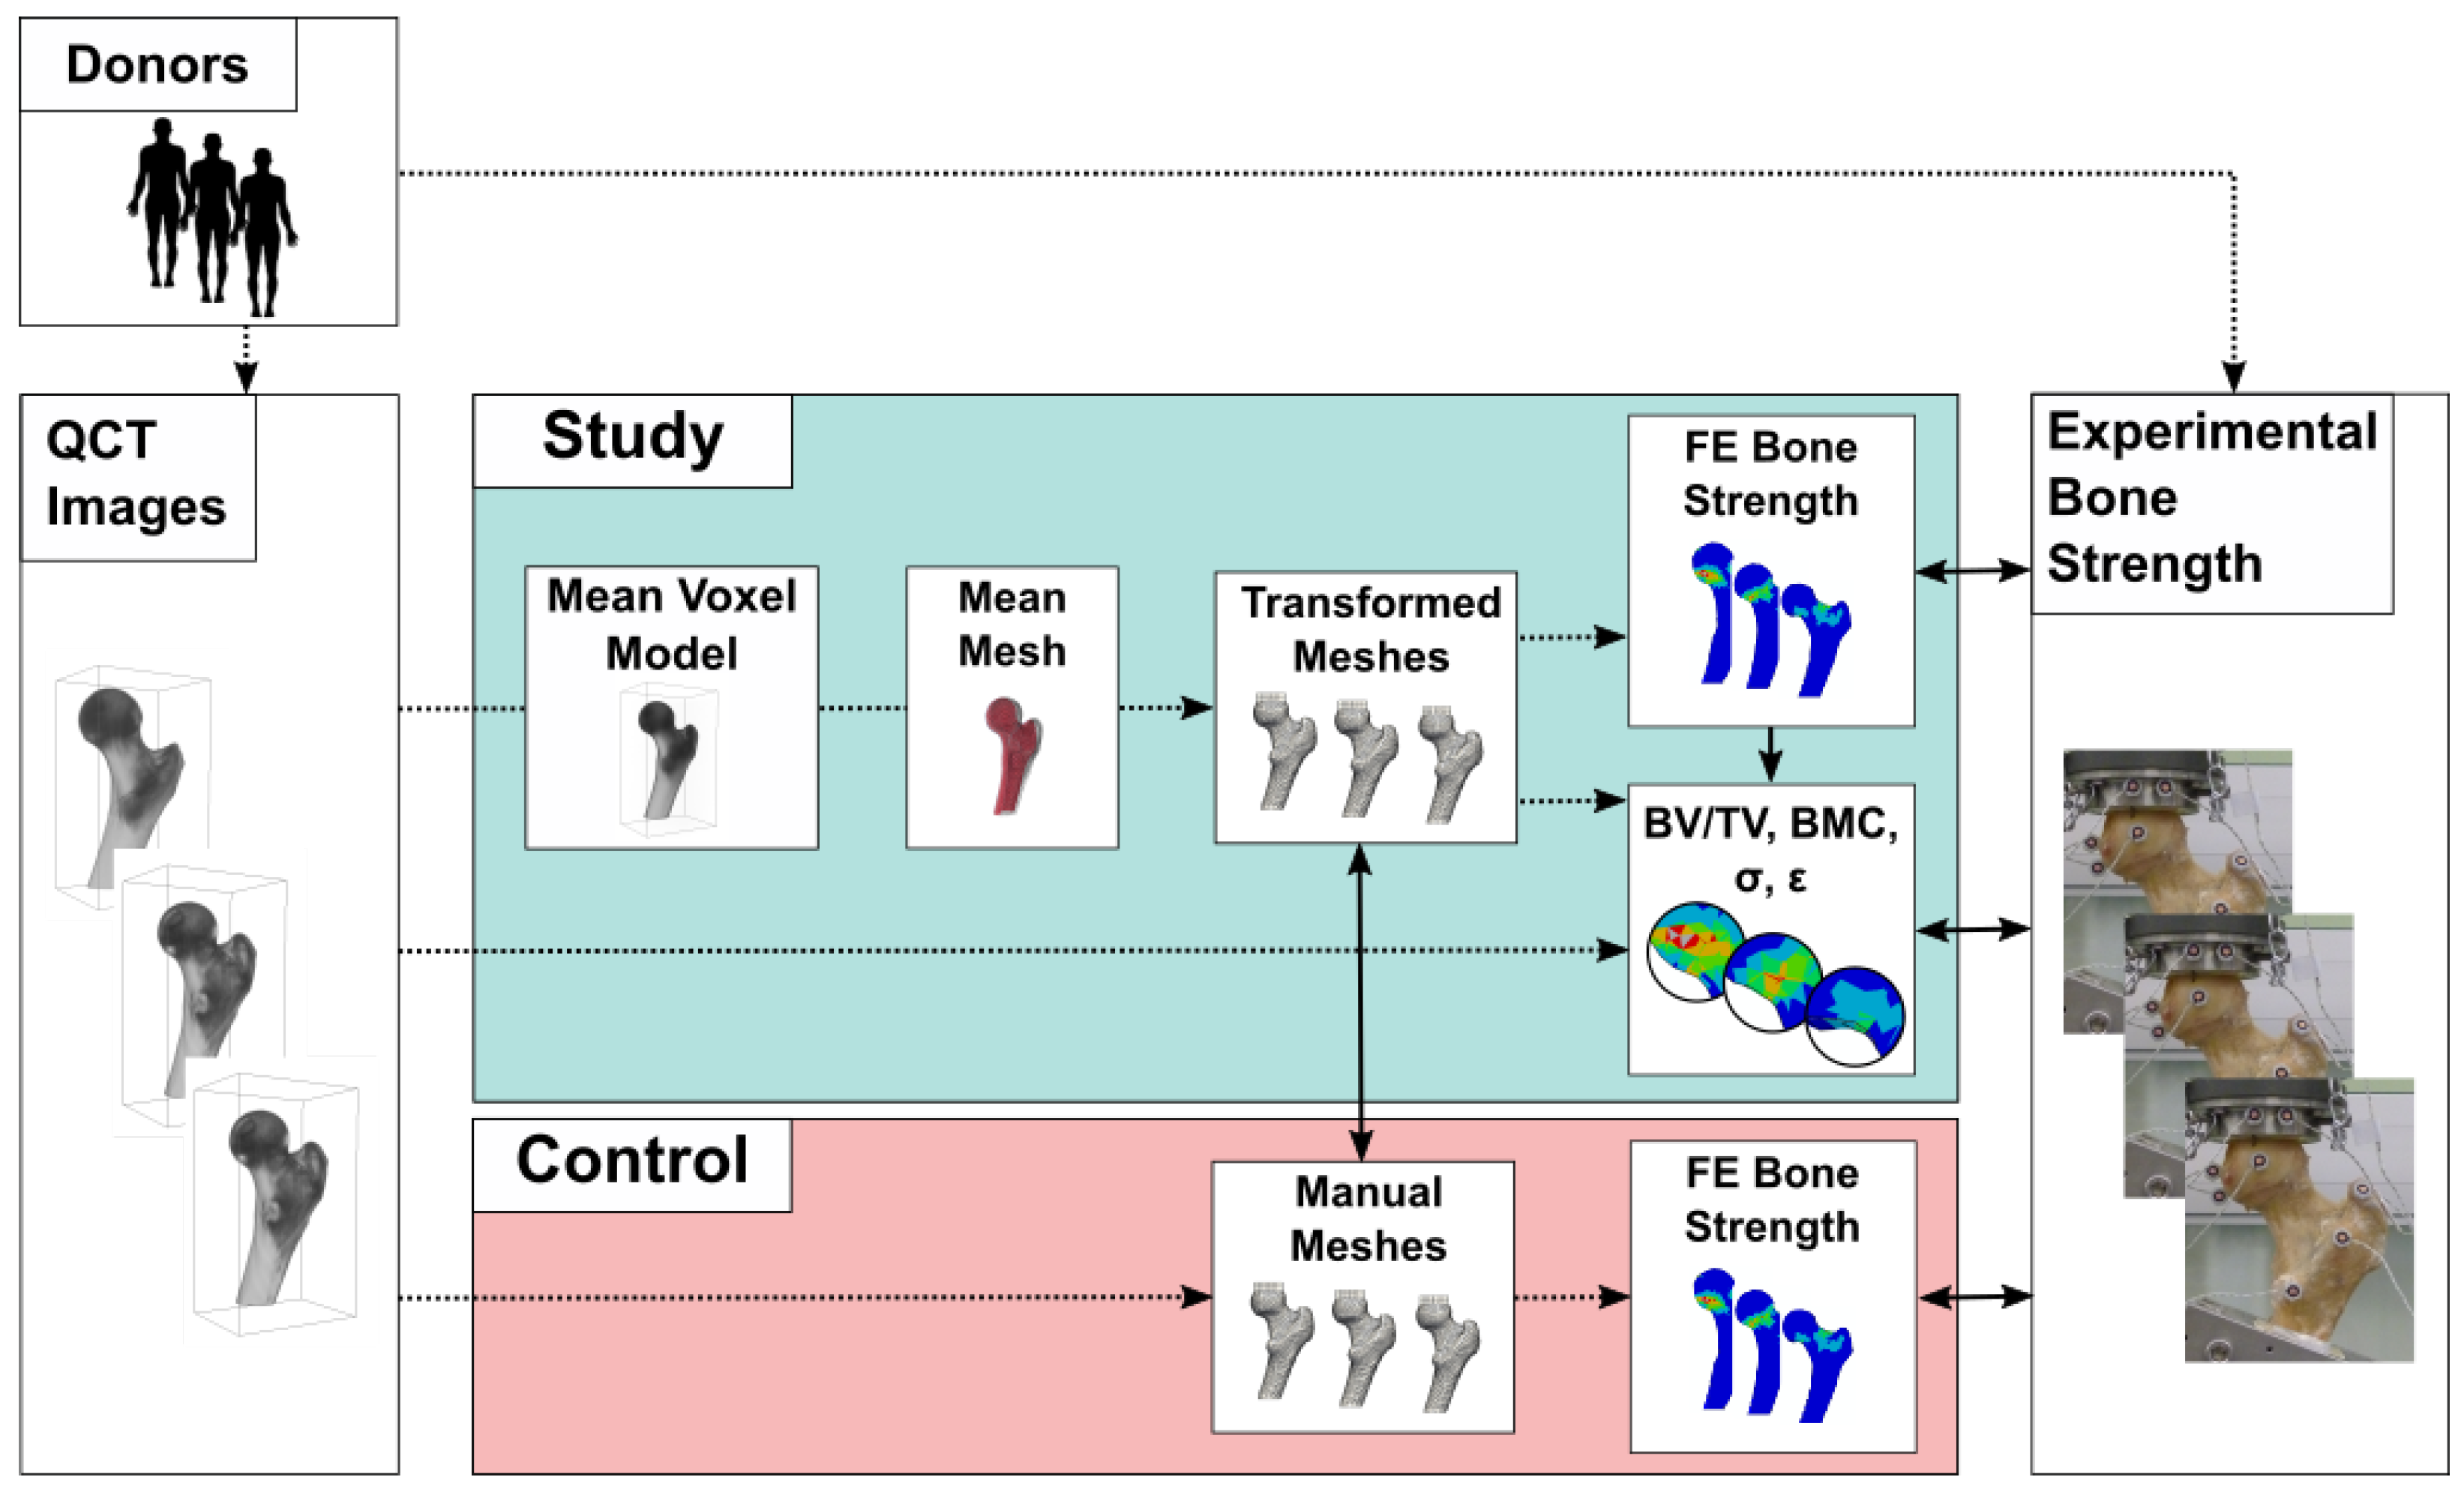
2.1. Overview

A graphical overview of the study can be seen in Figure 1. In a previous study, proximal femora from body donations were scanned to obtain quantitative CT (QCT)-images (Figure 1, left) and the bones afterwards tested in compressive loading until failure for bone strength [28,29]. A set of FE models based on manually created meshes was prepared [28] as control study (Figure 1, red). For the morphed mesh-based study (Figure 1, turquoise), similarity and B-spline-based free-form registrations were used to calculate an averaged image with respect to gray values and shape from the QCT set, called mean gray-level image in the latter. This was subsequently used to create the mean mesh, which was then transformed back to the respective specimens. These isotopological transformed meshes were compared with their manually created counterparts geometrically. Finally, the experimental bone strength was compared to the FE-predicted bone strength (both for the manually created FE models and with transformed meshes), and locally to mechanical parameters from the FE-simulation and morphometric parameters from the QCT images.

2.2. Data

The underlying dataset consisted of 37 QCT scans, corresponding binary masks that mark trabecular and cortical bone regions, and 32 compressive loading test results of proximal human femora from previous studies. Detailed descriptions of the dataset and tests can be found in Dall’Ara et al. [30], Dall’Ara et al. [28] and Steiner et al. [14]. In brief, samples from 19 females and 18 males, aged between 46 and 96 years, were scanned with a voxel size of 0.33 × 0.33 × 1.0 mm 3 with a clinical QCT scanner. Sets of binary masks covering trabecular and cortical bone were available for each scan from another study [29]. The scans and masks were coarsened to 0.66 × 0.66 × 0.66 mm 3 and afterwards equalized to a size of 161 × 118 × 282 voxels. The samples were tested in uniaxial compression in stance-like positions until failure. Only the QCT scans, masks, and the experimental data were used in this study, no additional measurements or experiments were performed on the donor material.

2.3. Finite Element Models

All FE models were created similar to Luisier et al. [31]. Material properties of the smooth mesh elements were assigned based on bone volume to total volume (BV/TV) values, using a user-defined material model (UMAT). All meshes consist of second order tetrahedral elements for trabecular regions and second order wedge elements for cortical regions with element sizes of about 5 mm. BV/TV was calculated from gray values and mapped to the meshes using the respective algorithm in medtool (Dr. Pahr Ingenieurs e.U., Pfaffstaetten, Austria) [32,33]. The UMAT in use has been described in Dall’Ara et al. [28], and in more detail in Schwiedrzik and Zysset [34] and Luisier et al. [31], and consists of a density-based isotropic damage model with exponential hardening and rate-independent viscosity. The assigned parameters of the material model were similar to Dall’Ara et al. [2] and Steiner et al. [14], and are given in Table 1. Additional embedding meshes for load distribution at the femoral head consisted of second order wedge elements with E = 150 MPa and ν = 0.3 . The fixation of distal (bottom) nodes in all directions and a stepwise displacement of a reference node, kinematically coupled to the proximal (top) nodes of the embedding, acted as boundary conditions.

2.4. Mesh Transformation

A mean gray-level image was created from all specimens, which represents the mean 3D image of all registered and transformed QCT images. This mean gray-level image and the corresponding mean mask were calculated as described in Steiner et al. ([14], Appendix A), using all QCT images in a SimpleITK [35] (v1.0.1; http://www.simpleitk.org, (accessed on 11 March 2022)) and Python-based algorithm. In brief, the algorithm to generate the mean gray-level image picks a random image from the given set as initial reference. All images are registered with a free-form B-spline registration and mapped to the respective reference. Then, a mean gray-level image with respect to shape and gray values is calculated. The process is repeated with this gray-level image as new reference to avoid specimen related biases. The mean mask is generated by applying the yielded transformations to the respective masks of the set, calculating the mean and thresholding it at 25%. After meshing the mean gray-level image, the inverses of the acquired B-spline transformations are applied to this mean mesh to attain subject specific meshes. The entire set of 37 images was only used for the calculation of the mean gray-level image. All subsequent steps were performed using those specimens for which experimental data was available.
The agreement of B-spline-based meshes with manually created meshes was controlled qualitatively via visual inspection and quantitatively using average surface distances and volume differences between the mesh types for each specimen. Surface distances were computed using Euclidean distance transforms in SciPy 1.0.0 [36] applied to mesh voxelizations (0.22 mm voxel side length). The distance transforms were used to determine the distances of the voxels of one voxelization boundary to the other, and vice versa. The morphed meshes were finally used to create the corresponding FE models. Agreement of these FE models with the ones based on the manual method were controlled using a qualitative inspection of the damage and BV/TV distribution, and the correlation of simulated bone strength with experimental bone strength.

2.5. Regional Statistics

Regional statistical analyses are straightforward for isotopological meshes, which are comparing local morphometric parameters and local FE outcomes with experimental data. BV/TV, bone mineral content (BMC), von Mises stress and maximum absolute principal strain were selected as representative morphological and mechanical parameters due to their frequent use in literature and clinical environment (BV/TV, BMC) [37,38,39,40,41], and findings regarding their significance in bone quality assessment in other studies (stress, strain [26]).
For this, BV/TV values from all elements were multiplied by the volume of the respective element to calculate BMC. Values for von Mises stress and maximal absolute principal strain were extracted for each mesh element from the first frame of the FE simulations which was still within the linear elastic range of the model. The strain values were normalized by the respective reaction force of the reference points. The isotopology of the transformed meshes then allowed to correlate bone mineral content (BMC), von Mises stress, and maximum absolute principal strain over distinctive regions, and for each element as well, with the experimentally acquired bone strengths. Weighted and unweighted averages were calculated for BV/TV and BMC, respectively, within each region. Maximal regional values were used for von Mises stress and maximum absolute principal strain [42]. The investigated regions included the whole bone, the entire neck section, superior and inferior neck sections, and cortical and trabecular variations of these regions. Finally, the element-wise correlations with the experimental bone strength were evaluated.

2.6. Computational Details

Each B-Spline registration was preceded by a similarity registration, covering translation, rotation, and scaling. The B-spline registrations were executed with a control point grid-size of 5 × 5 × 5 , for a total of ( 5 + 3 ) × ( 5 + 3 ) × ( 5 + 3 ) × 3 = 1536 degrees of freedom. A multi-resolution framework, as provided by SimpleITK, with coarsening factors (4, 2 and 1) and Gaussian filtering ( σ = 2, 1 and 0), was applied. Here, the registration is performed in three subsequent steps with increasing image size and quality. This is done to speed up registration overall and to avoid local minima. Gradient descent line search and correlation were used as optimizer and metric/objective function, respectively. Each registration was initialized with parameter values equal to zero (scaling 1) and the findings from each step in the multi-resolution framework passed as initial values to the next iteration. This registration setup was used in the same way in Steiner et al. [14], where it delivered good and robust results. The non-zero positivity of the Jacobi determinants were continuously controlled throughout the registrations to preserve orientations and bijectivity.
The mean gray-level image was generated on an Intel Xeon CPU E5-2697 v3 with 2.6 GHz, 14 cores, and 28 threads.
All FE models were solved using Abaqus V6R2017x. Computations were performed on Intel(R) Xeon(R) CPU E3-1231 v3 @ 3.40 GHz machines with 4 cores/8 threads.
The correlations were calculated in Python, using Scipy [36].

3. Results

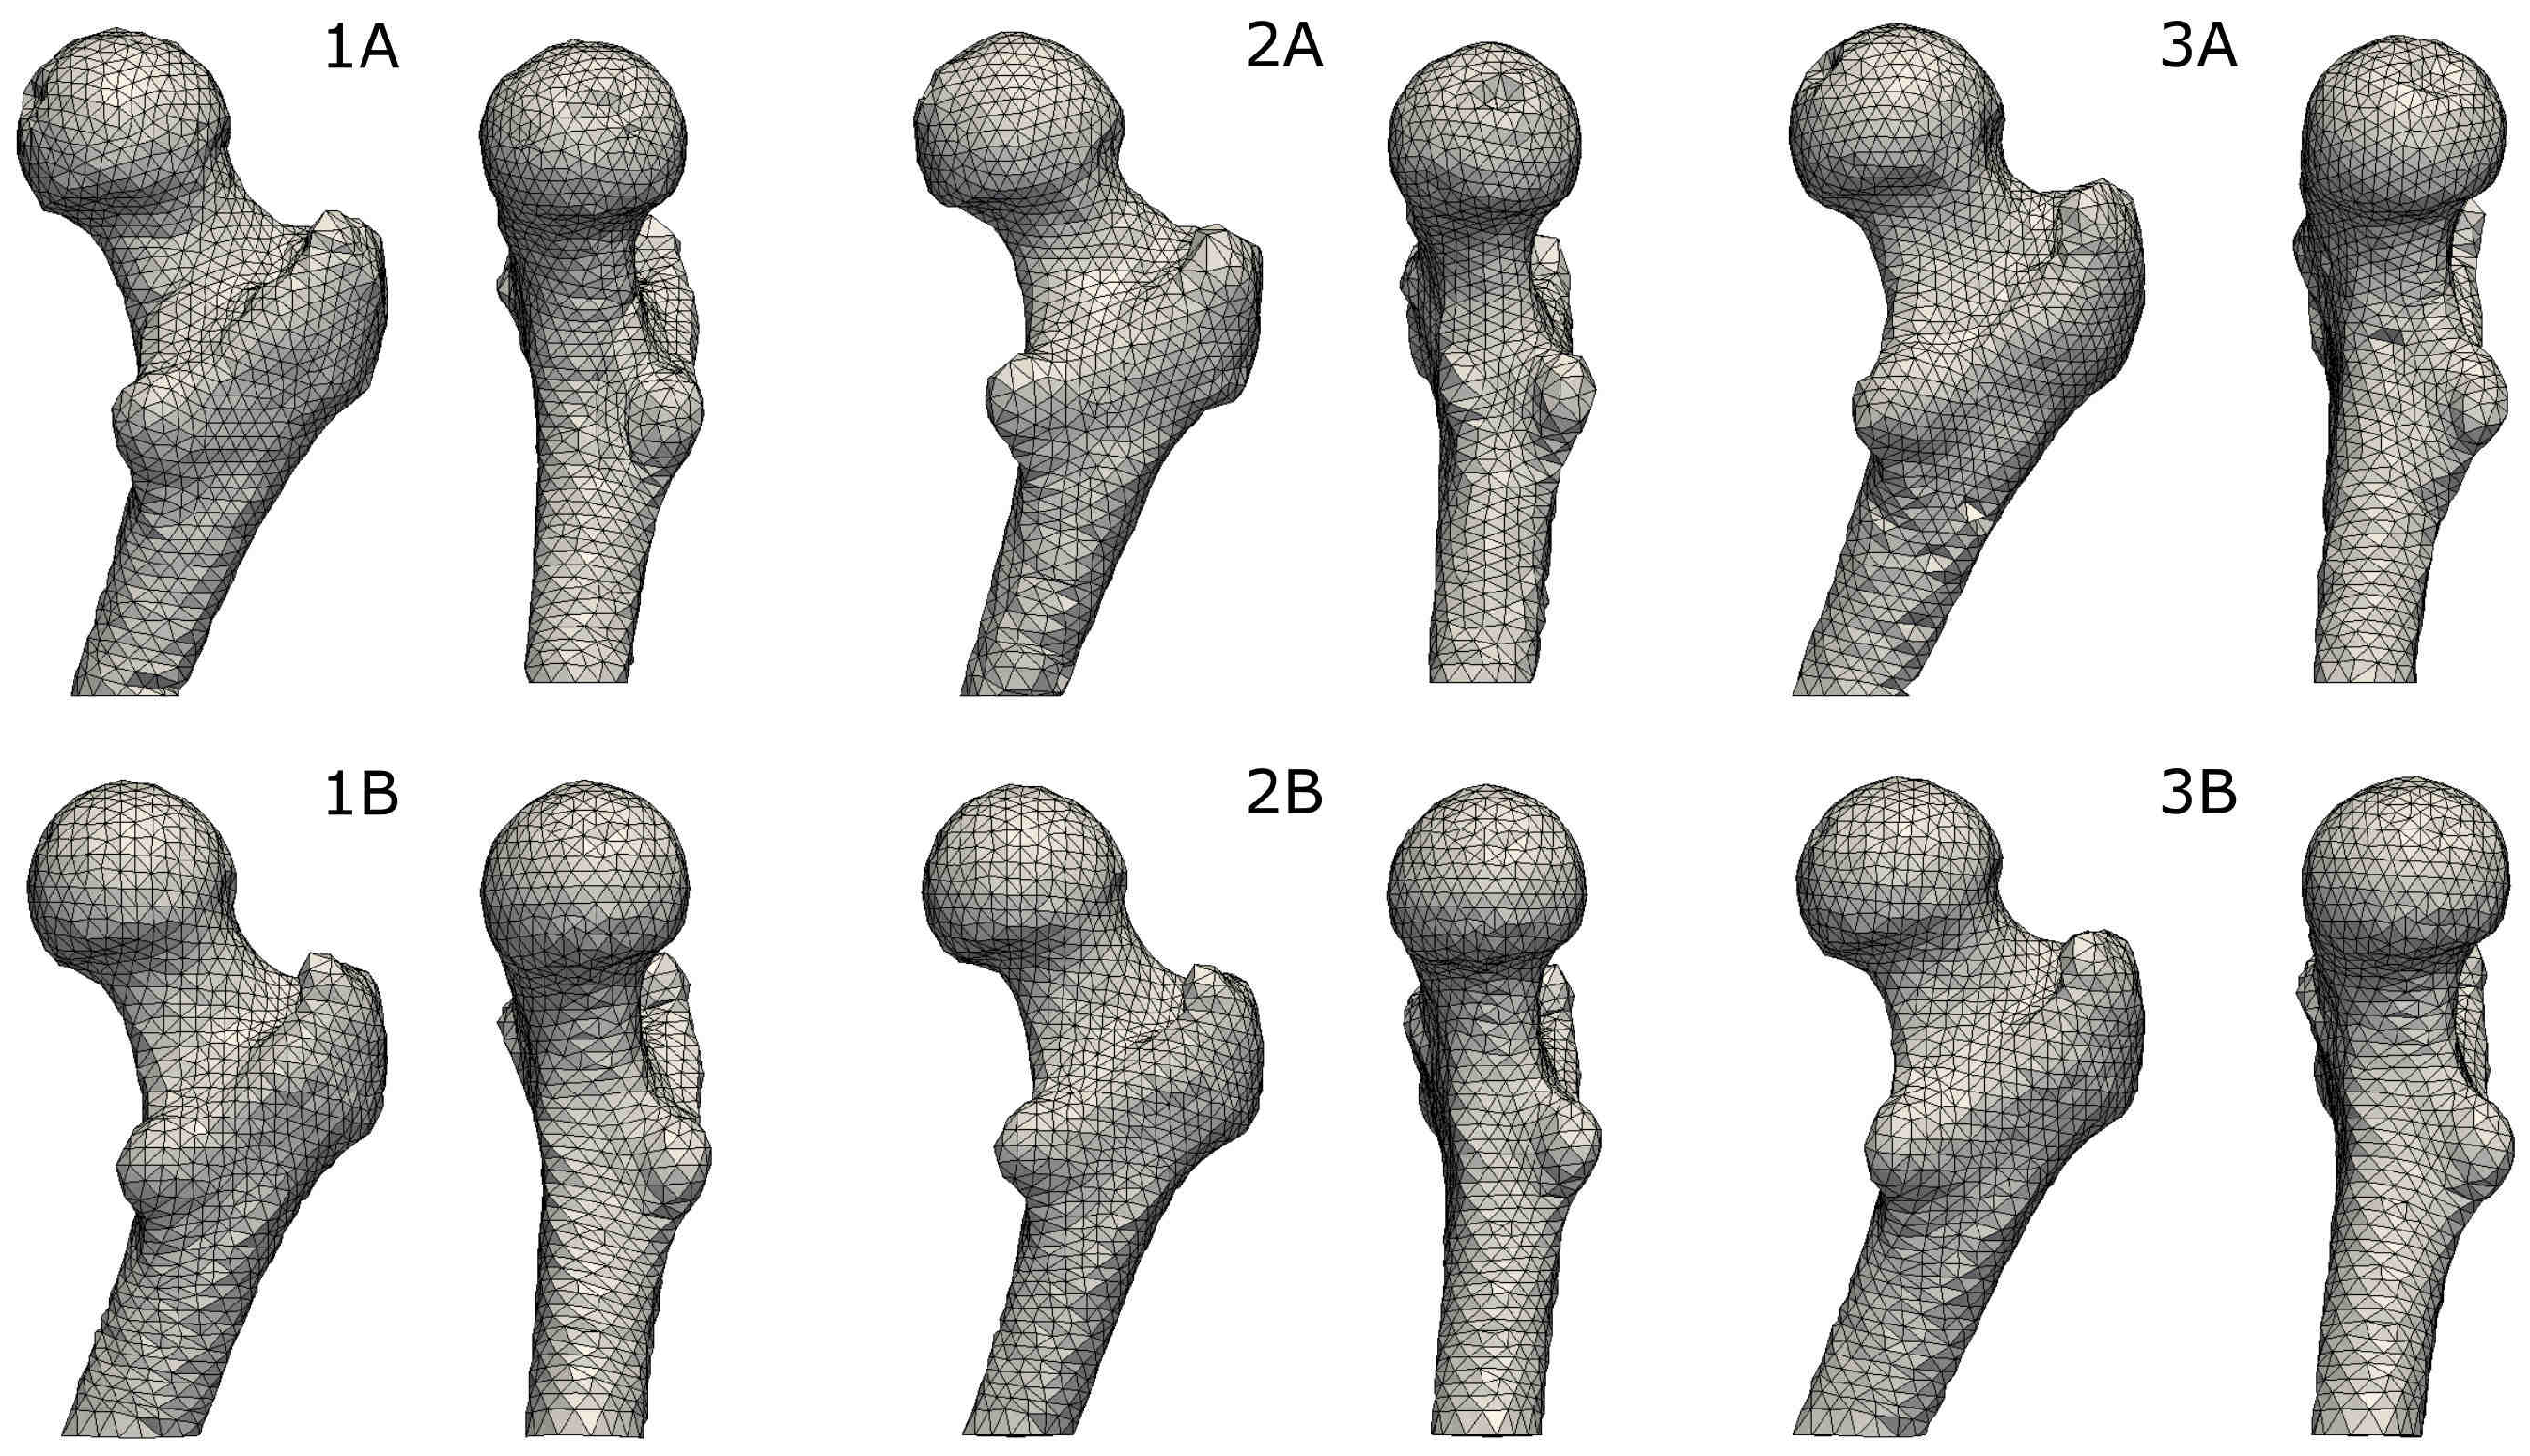
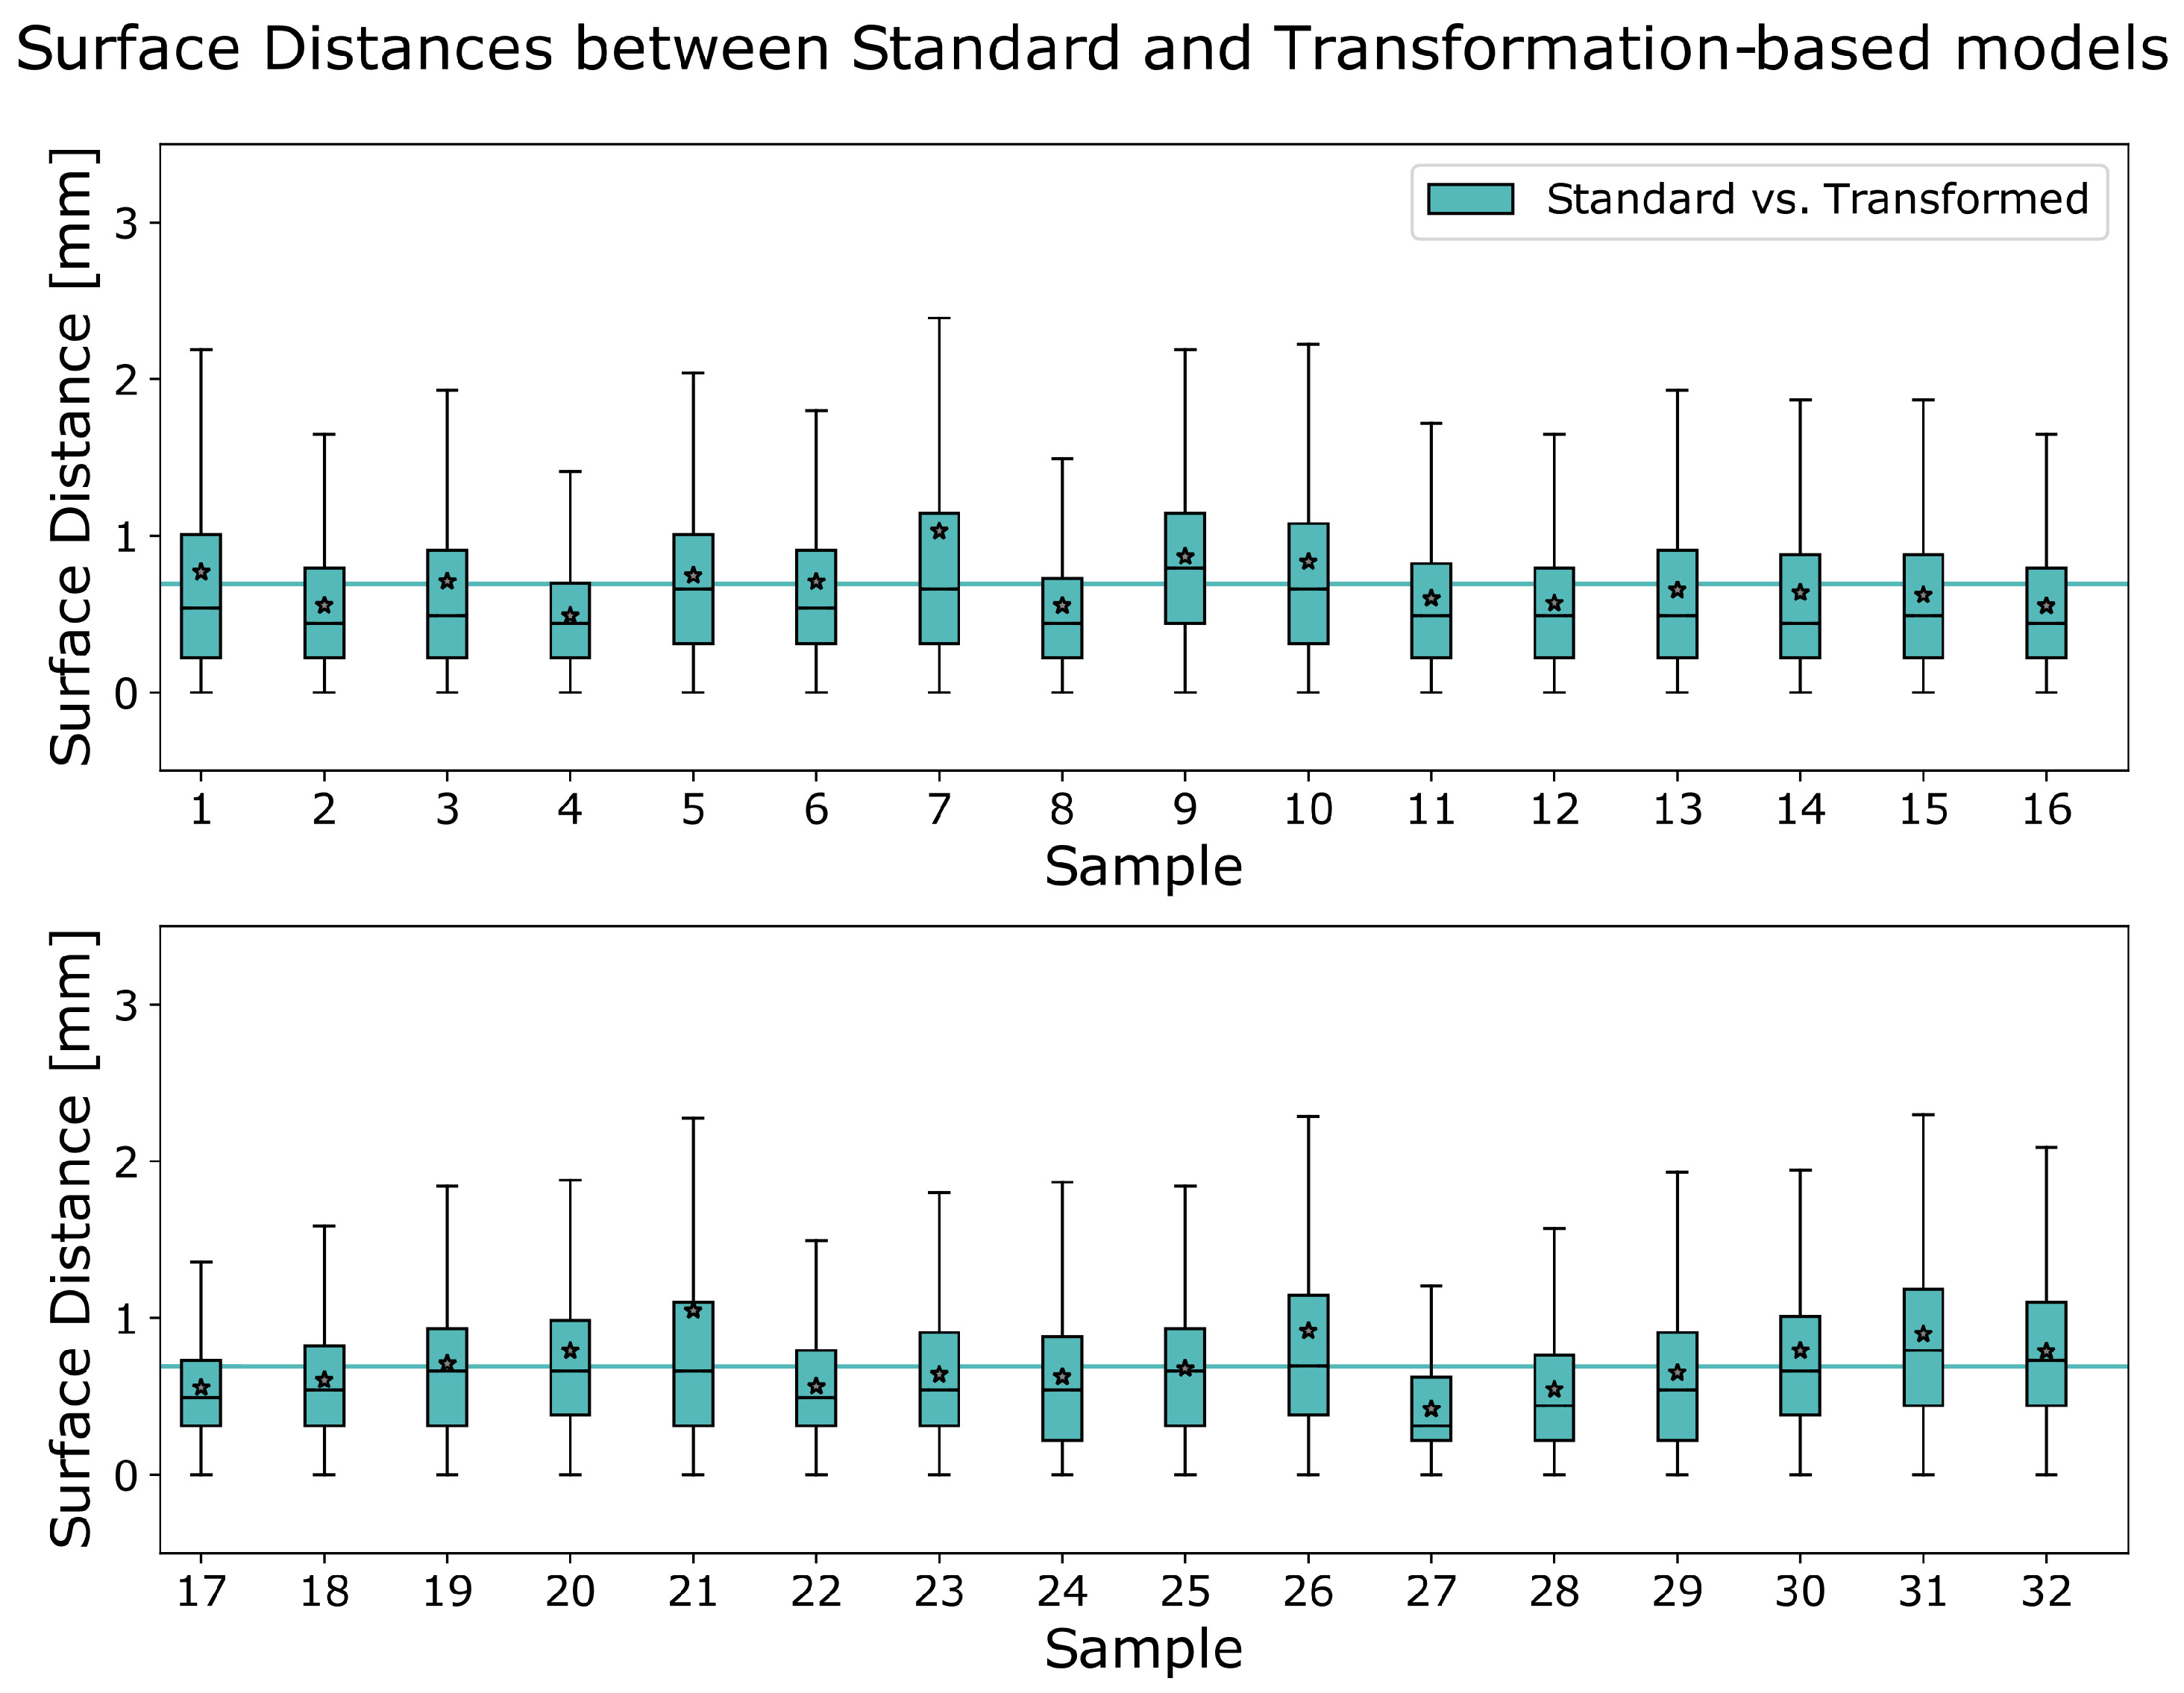
3.1. Accuracy of Transformed Meshes

The mean gray-level image was successfully calculated, requiring about 10 h in real-time. The mean mesh was successfully generated and transformed afterwards. A qualitative visual comparison of meshes created manually with the transformed ones is shown in Figure 2. The transformed meshes were generally very similar to their manually created counterparts while lacking details.
The averaged surface distance between the two mesh types was 0.7 ± 0.6 mm. Boxplots of the surface distances for all specimens are shown in Figure 3.
The average volume difference was 4.1 ± 3.0 % , with the transformed meshes generally showing lower volumes. A Bland–Altman plot comparing the volumes is given in Figure 4. There, the relative difference with respect to the mean between the volumes of each specimen are plotted. The even distribution of the datapoints, parallel to the average difference, indicates that the differences between the respective volumes are independent of their size.

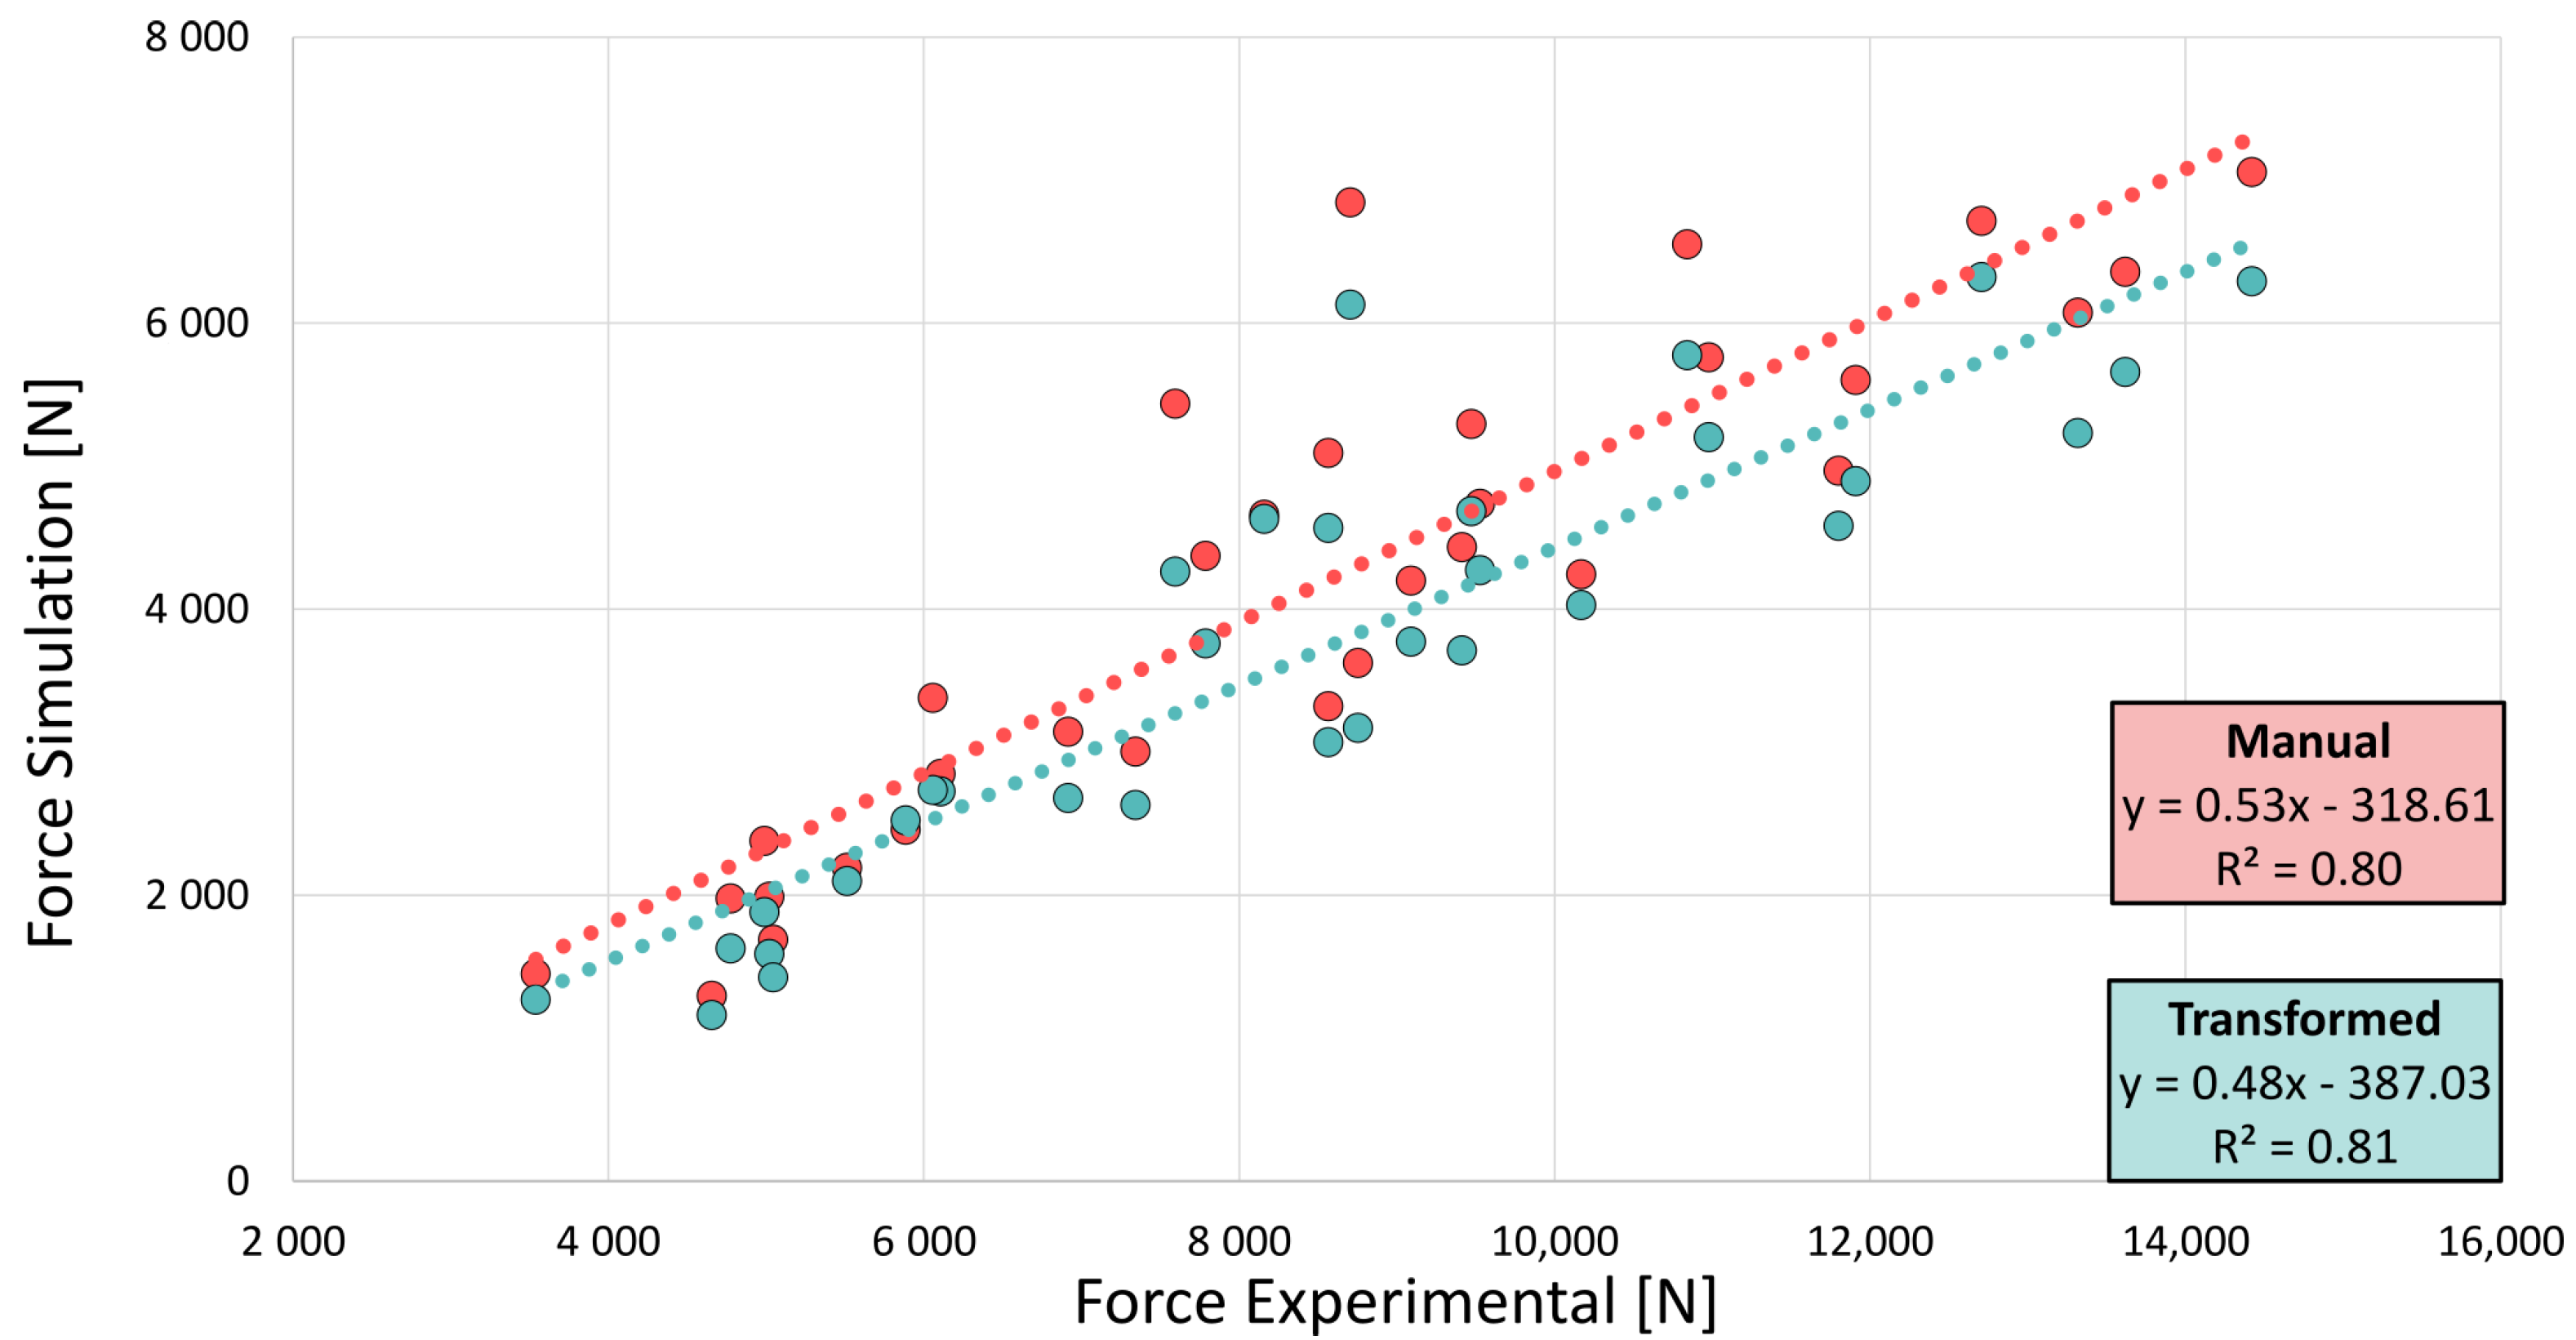
3.2. FE-Predicted Bone Strength

All FE models could be created and solved. Solving required about 10 min for each model. Figure 5 and Figure 6 show comparisons of both modeling strategies with respect to BV/TV and damage, respectively. The outcomes look visually very similar to the ones based on manual meshing with respect to the spatial distribution of BV/TV and damage.
Figure 7 shows the scatter plots of simulated ultimate forces against experimental ultimate forces. The average simulated bone strength and correlation with respect to experimental force were 4159 ± 1731 N and R 2 = 0.80 for models based on manually created meshes, and 3697 ± 1567 N and R 2 = 0.81 for those with transformed meshes. A two-tailed paired t-test yielded p = 7 × 10 11 , rejecting the null-hypothesis of equal means for a significance level of α = 0.05 .

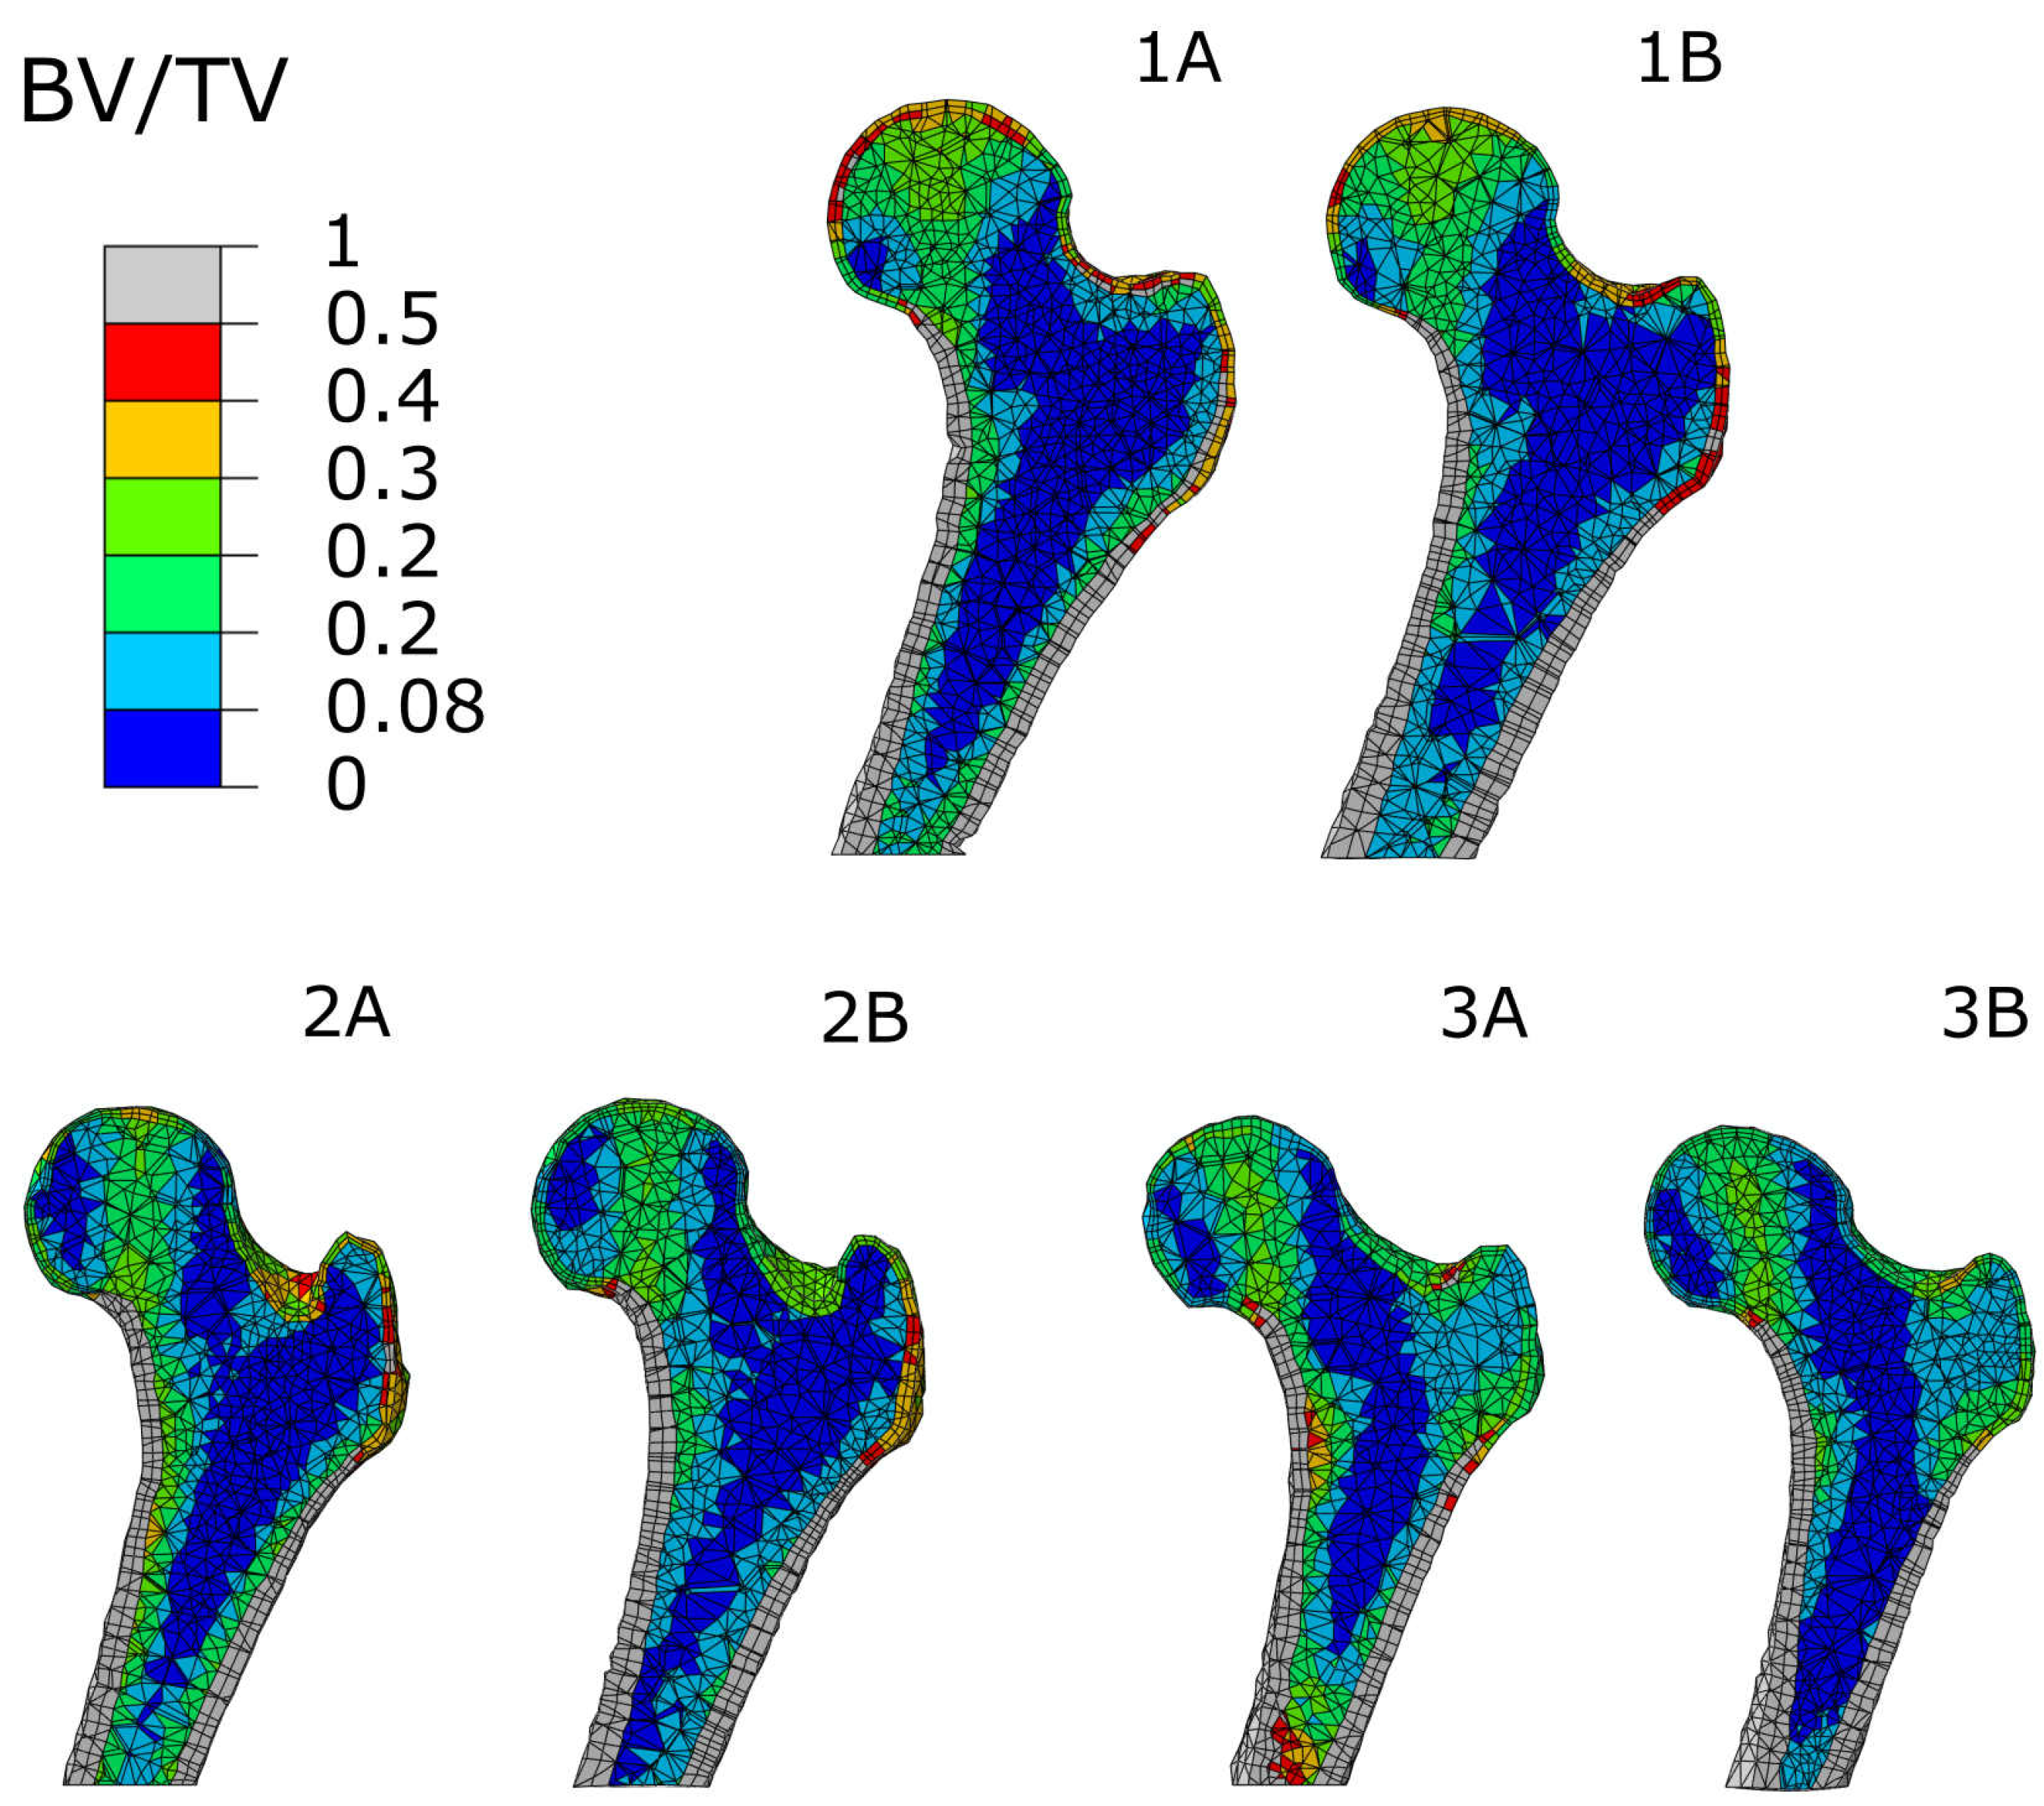
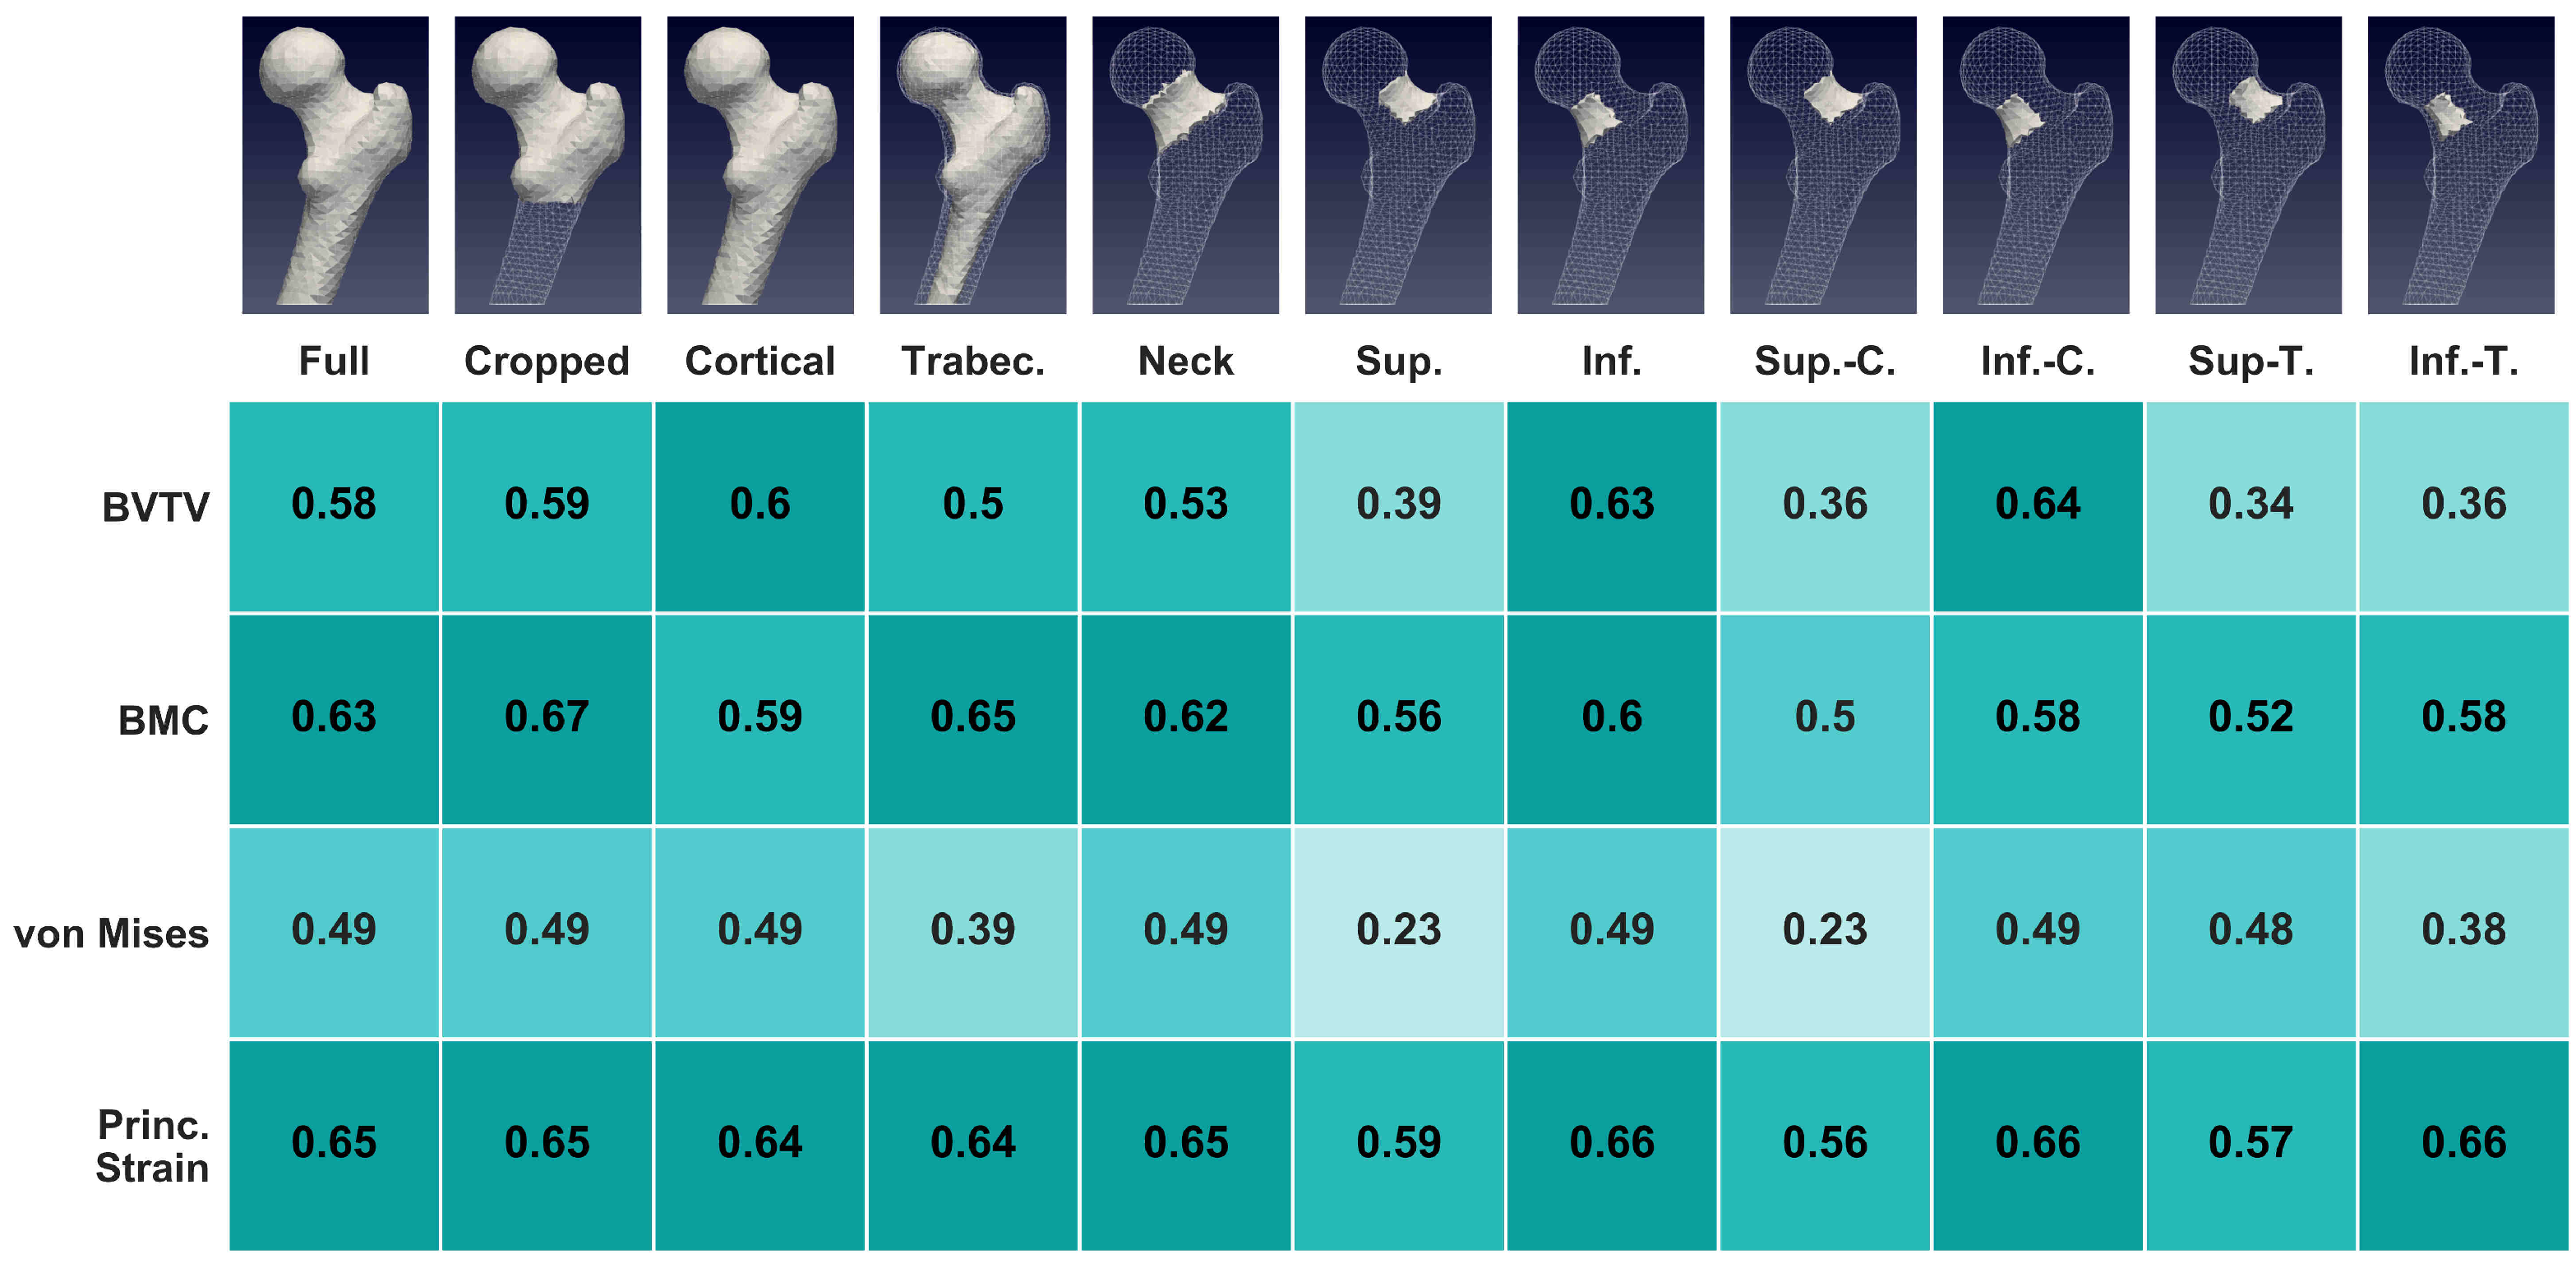
3.3. Regional Statistics

An overview of regional correlations with experimental ultimate forces is given in Figure 8. The bone is generally divided into trabecular (“T.”) and cortical (“C.”) sections, as well as whole, superior (“Sup.”) and inferior (“Inf.”) neck. A cropped section of the bone without shaft was also analyzed. Higher correlations ( R 2 0.65 ) were found for BMC and maximum absolute principal strain and in the inferior neck region.
Regional statistics based on single element-level results can be seen in Figure 9, showing mean, standard deviation (std), and correlation with experimental ultimate forces, per element, in the first three columns. The last column shows the 10% of all elements which have the highest correlation with experimental ultimate force. Again, generally high correlations ( R 2 > 0.6 ) were found for BMC and maximum absolute principal strain, and in the inferior neck region. Additionally, high correlations can be seen in the head region for BMC and maximum absolute principal strain, and in the shaft cortex for BV/TV and von Mises stress. Higher correlations were also found in the greater trochanter region.

4. Discussion

This study demonstrated the potential of FE models, based on meshes morphed with B-Spline transformations, to predict bone strength in the proximal human femur. After a one-time creation of the mean gray-level image, this approach allows a fully automated and robust creation of QCT FE models. Such models show practically the same predictability as classical, manually created FE models. Furthermore, the isotopological meshes allow the analysis of local morphological and simulated mechanical parameters within similar anatomical regions without any further effort.
FE models based on transformed meshes closely matched those based on manually created meshes, both in terms of the mesh and mechanical predictions. The correlation with experimental bone strength was similarly high with both model versions. The average ultimate loads were slightly lower for the models based on transformed meshes, as seen in Figure 7. This could be attributed to their generally lower volumes. However, correlation between differences in ultimate loads and differences in volume was found to be R 2 = 0.207 in a subsequent test. The experimental bone strengths were consistently higher than the FE model predictions, which is similar to previous studies on the same dataset [28,31,43]. We found a similarly high correlation in our previous study on the same dataset [14] when estimating models from 2D projections ( R 2 = 0.835 ). For comparison, Grassi et al. [8] found higher correlations ( R 2 > 0.9 ) using manual selection of landmarks and radial basis functions to transform meshes for femoral FE models. However, instead of experimental and simulated bone strength, they compared strains, and had a smaller sample size of eight, limiting the comparability to this work. The similarity of manually created and transformed meshes is apparent in the low values for average surface distance and volumetric difference, with 0.7 ± 0.5 mm and 4.1 %. Similar results were found by Baldwin et al. [44] who reported a root mean square distance of 0.9 ± 0.5 mm between manually created and surface-based transformed meshes on femora. The findings suggest that this method can be used for the automatic creation of meshes for FE models with a similarly high quality as manually created ones. In contrast to the landmark-based methods of, e.g., Grassi et al. [8], the B-Spline registration-based method can be applied directly to the QCT images and might therefore further accelerate and ease model creation.
In case of local parameters, none of the investigated parameters or subregions showed higher correlation with experimental bone strength than that of QCT FE-based bone strength. However, the regional statistical analysis demonstrates the potential of this method and gives further insights into the distribution of morphometrical parameters in the femur. Correlation results for BV/TV and BMC in the neck regions ( R 2 = 0.53 and R 2 = 0.62 ) were comparable to those found by Dall’Ara et al. [30] for dual-energy X-ray absorptiometry (DEXA)-based femoral neck BMD and BMC on the same dataset ( R 2 = 0.66 and R 2 = 0.67 ). The differences in the results could be attributed to slight deviations of the evaluated regions and to differences in their calculation. This is especially the case for BMD, which is calculated as an areal density value using DXA, in contrast to the volumetric parameter BV/TV. Variations in the preparation of the images could contribute to the differences too. In general, the regional and elemental results showed higher correlations for BMC and maximal absolute principal strain. Higher correlations were also found in the inferior neck region. Iori et al. [27] contrarily found higher values in the superior part, however, their study was conducted on femora in a sideways fall loading scenario. Additionally, with respect to the prediction of femoral fractures, Poole et al. [45] found that women with femoral neck fractures had focal osteoporosis in the superior neck region when compared to healthy controls. This could indicate a central role of structures in compressive load for ultimate load prediction, while the condition of the superior neck region reflects the actual fracture risk. Finally, high correlations were also found in the greater trochanter region. These could be attributed to a general adaptation of the bone to its use, given that the trochanter is, among others, the onset of most gluteal muscles. DXA BMD of the greater trochanter also showed the highest correlation with femoral strength in a study by Cheng et al. [46] in a sideways-fall test.
The study has some limitations. The QCT images were already masked and preprocessed. Although in principle using unprocessed images would be possible, noise and unevenly cropped and oriented bones constitute additional challenges which were not investigated in this study. Furthermore, only proximal human femora were used. The applicability of the method to other bones needs to be proven. The femora were tested and analyzed in a stance-like loading scenario. For more general statements with respect to the relevance of parameters in different regions, several additional loading scenarios should be examined, especially those simulating sideways fall. Finally, the used boundary conditions primarily reflect the experimental conditions, but not necessarily the physiological loading conditions. Especially the regional statistical analysis of the mechanical parameters must therefore be interpreted under careful consideration of this limitation.
In summary, B-spline-transformed meshes can be used to further automate FE model generation while preserving precision in femoral strength prediction. While the investigated local parameters in various subregions of the bone could not reach the precision of FE models of the entire femur to predict bone strength, the isotopology of the transformed meshes still allowed to highlight anatomical regions of strongest correlation.

Author Contributions

Conceptualization, L.S., A.S. and D.H.P.; methodology, L.S.; software, L.S.; validation, L.S., A.S. and D.H.P.; formal analysis, L.S., A.S. and D.H.P.; investigation, L.S.; resources, L.S., A.S. and D.H.P.; data curation, L.S.; writing—original draft preparation, L.S.; writing—review and editing, A.S. and D.H.P.; visualization, L.S.; supervision, D.H.P.; project administration, D.H.P.; funding acquisition, D.H.P. All authors have read and agreed to the published version of the manuscript.

Funding

This research was funded by the Austrian Forschungsförderungsgesellschaft (FFG) for the BRIDGE 1 project “Computersimulationsmodelle zur Osteoporose-Früherkennung” (OsteoSIM) under contract [FFG: 850746].

Institutional Review Board Statement

The data for this work was collected by Dall’Ara et al. [30], which was approved by the ethical committee of the Medical University Vienna (EK Nr 175/2011). No additional experiments were carried out for the present study.

Informed Consent Statement

Not applicable.

Data Availability Statement

Not applicable.

Conflicts of Interest

Dieter H. Pahr is the owner of Pahr Ingenieurs e.U., which develops and sells the software medtool.

References

  1. Torres-Del-Pliego, E.; Vilaplana, L.; Güerri-Fernández, R.; Diez-Pérez, A. Measuring bone quality. Curr. Rheumatol. Rep. 2013, 15, 373. [Google Scholar] [CrossRef] [PubMed]
  2. Dall’Ara, E.; Pahr, D.; Varga, P.; Kainberger, F.; Zysset, P. QCT-based finite element models predict human vertebral strength in vitro significantly better than simulated DEXA. Osteoporos. Int. 2012, 23, 563–572. [Google Scholar] [CrossRef] [PubMed]
  3. Vincent, L.; Yohan, P.; Beatrice, C.; Pascal, S. Automatic 3D Finite Element Mesh Generation: Data Fitting from an Atlas. Available online: http://membres-timc.imag.fr/Yohan.Payan/papers/BBE01_Luboz.pdf (accessed on 30 July 2021).
  4. Sigal, I.A.; Hardisty, M.R.; Whyne, C.M. Mesh-morphing algorithms for specimen-specific finite element modeling. J. Biomech. 2008, 41, 1381–1389. [Google Scholar] [CrossRef] [PubMed]
  5. Ji, S.; Ford, J.C.; Greenwald, R.M.; Beckwith, J.G.; Paulsen, K.D.; Flashman, L.A.; McAllister, T.W. Automated subject-specific, hexahedral mesh generation via image registration. Finite Elem. Anal. Des. 2011, 47, 1178–1185. [Google Scholar] [CrossRef] [PubMed] [Green Version]
  6. Dai, Y.; Niebur, G.L. A semi-automated method for hexahedral mesh construction of human vertebrae from CT scans. Comput. Methods Biomech. Biomed. Eng. 2009, 12, 599–606. [Google Scholar] [CrossRef] [PubMed] [Green Version]
  7. Bucki, M.; Lobos, C.; Payan, Y. A fast and robust patient specific Finite Element mesh registration technique: Application to 60 clinical cases. Med. Image Anal. 2010, 14, 303–317. [Google Scholar] [CrossRef] [PubMed] [Green Version]
  8. Grassi, L.; Hraiech, N.; Schileo, E.; Ansaloni, M.; Rochette, M.; Viceconti, M. Evaluation of the generality and accuracy of a new mesh morphing procedure for the human femur. Med. Eng. Phys. 2011, 33, 112–120. [Google Scholar] [CrossRef] [PubMed] [Green Version]
  9. Qasim, M.; Farinella, G.; Zhang, J.; Li, X.; Yang, L.; Eastell, R.; Viceconti, M. Patient-specific finite element estimated femur strength as a predictor of the risk of hip fracture: The effect of methodological determinants. Osteoporos. Int. 2016, 27, 2815–2822. [Google Scholar] [CrossRef] [PubMed] [Green Version]
  10. Slagmolen, P.; Elen, A.; Seghers, D.; Loeckx, D.; Maes, F.; Haustermans, K. Atlas Based Liver Segmentation Using Nonrigid Registration with a B-Spline Transformation Model. In 3D Segmentation in The Clinic: A Grand Challenge; Heimann, T., Styner, M., van Ginneken, B., Eds.; Springer: Berlin/Heidelberg, Germany, 2007; pp. 197–206. [Google Scholar]
  11. Castellano-Smith, A.D.; Hartkens, T.; Schnabel, J.A.; Hose, R.; Liu, H.; Hall, W.; Truwit, C.; Hawkes, D.J.; Hill, D.L. A Registration Based Mesh Construction Technique for Finite Element Models of Brains. In Proceedings of the Medical Imaging 2002: Image Processing, San Diego, CA, USA, 9 May 2002; pp. 538–549. [Google Scholar]
  12. Bijar, A.; Rohan, P.Y.; Perrier, P.; Payan, Y. Atlas-Based Automatic Generation of Subject-Specific Finite Element Tongue Meshes. Ann. Biomed. Eng. 2016, 44, 16–34. [Google Scholar] [CrossRef] [Green Version]
  13. Fougeron, N.; Rohan, P.Y.; Macron, A.; Travert, C.; Pillet, H.; Skalli, W. Subject specific finite element mesh generation of the pelvis from biplanar x-ray images: Application to 120 clinical cases. Comput. Methods Biomech. Biomed. Eng. 2018, 21, 408–412. [Google Scholar] [CrossRef]
  14. Steiner, L.; Synek, A.; Pahr, D.H. Femoral strength can be predicted from 2D projections using a 3D statistical deformation and texture model with finite element analysis. Med. Eng. Phys. 2021. [Google Scholar] [CrossRef] [PubMed]
  15. Crabtree, N.J.; Kroger, H.; Martin, A.; Pols, H.A.; Lorenc, R.; Nijs, J.; Stepan, J.J.; Falch, J.A.; Miazgowski, T.; Grazio, S.; et al. Improving risk assessment: Hip geometry, bone mineral distribution and bone strength in hip fracture cases and controls. The EPOS study. Osteoporos. Int. 2002, 13, 48–54. [Google Scholar] [CrossRef] [PubMed]
  16. Wachter, N.J.; Krischak, G.D.; Mentzel, M.; Sarkar, M.R.; Ebinger, T.; Kinzl, L.; Claes, L.; Augat, P. Correlation of bone mineral density with strength and microstructural parameters of cortical bone in vitro. Bone 2002, 31, 90–95. [Google Scholar] [CrossRef]
  17. Augat, P.; Schorlemmer, S. The role of cortical bone and its microstructure in bone strength. Age Ageing 2006, 35, ii27–ii31. [Google Scholar] [CrossRef] [PubMed] [Green Version]
  18. Davison, K.S.; Siminoski, K.; Adachi, J.D.; Hanley, D.A.; Goltzman, D.; Hodsman, A.B.; Josse, R.; Kaiser, S.; Olszynski, W.P.; Papaioannou, A.; et al. Bone Strength: The Whole Is Greater Than the Sum of Its Parts. Semin. Arthritis Rheum. 2006, 36, 22–31. [Google Scholar] [CrossRef] [PubMed]
  19. Bouxsein, M.L.; Seeman, E. Quantifying the material and structural determinants of bone strength. Best Pract. Res. Clin. Rheumatol. 2009, 23, 741–753. [Google Scholar] [CrossRef] [PubMed]
  20. Beck, T.J.; Ruff, C.B.; Warden, K.E.; Scott, W.W.; Rao, G.U. Predicting femoral neck strength from bone mineral data: A structural approach. Investig. Radiol. 1990, 25, 6–18. [Google Scholar] [CrossRef]
  21. Beck, T. Measuring the structural strength of bones with dual-energy X-ray absorptiometry: Principles, technical limitations, and future possibilities. Osteoporos. Int. 2003, 14, 81–88. [Google Scholar] [CrossRef]
  22. Ammann, P.; Rizzoli, R. Bone strength and its determinants. Osteoporos. Int. 2003, 14, 13–18. [Google Scholar] [CrossRef]
  23. Humadi, A.; Alhadithi, R.; Alkudiari, S. Validity of the DEXA diagnosis of involutional osteoporosis in patients with femoral neck fractures. Indian J. Orthop. 2010, 44. [Google Scholar] [CrossRef]
  24. Sapthagirivasan, V.; Anburajan, M.; Janarthanam, S. Extraction of 3D femur neck trabecular bone architecture from clinical CT images in osteoporotic evaluation: A novel framework. J. Med. Syst. 2015, 39. [Google Scholar] [CrossRef] [PubMed]
  25. Keyak, J.H.; Rossi, S.A. Prediction of femoral fracture load using finite element models: An examination of stress- and strain-based failure theories. J. Biomech. 2000, 33, 209–214. [Google Scholar] [CrossRef]
  26. Schileo, E.; Taddei, F.; Cristofolini, L.; Viceconti, M. Subject-specific finite element models implementing a maximum principal strain criterion are able to estimate failure risk and fracture location on human femurs tested in vitro. J. Biomech. 2008, 41, 356–367. [Google Scholar] [CrossRef] [PubMed]
  27. Iori, G.; Schneider, J.; Reisinger, A.; Heyer, F.; Peralta, L.; Wyers, C.; Glüer, C.C.; van den Bergh, J.P.; Pahr, D.; Raum, K. Cortical thinning and accumulation of large cortical pores in the tibia reflect local structural deterioration of the femoral neck. Bone 2020, 137, 115446. [Google Scholar] [CrossRef] [PubMed]
  28. Dall’Ara, E.; Luisier, B.; Schmidt, R.; Kainberger, F.; Zysset, P.; Pahr, D. A nonlinear QCT-based finite element model validation study for the human femur tested in two configurations in vitro. Bone 2013, 52, 27–38. [Google Scholar] [CrossRef] [PubMed]
  29. Zysset, P.; Pahr, D.; Engelke, K.; Genant, H.K.; McClung, M.R.; Kendler, D.L.; Recknor, C.; Kinzl, M.; Schwiedrzik, J.; Museyko, O.; et al. Comparison of proximal femur and vertebral body strength improvements in the FREEDOM trial using an alternative finite element methodology. Bone 2015, 81, 122–130. [Google Scholar] [CrossRef] [PubMed]
  30. Dall’Ara, E.; Luisier, B.; Schmidt, R.; Pretterklieber, M.; Kainberger, F.; Zysset, P.; Pahr, D. DXA predictions of human femoral mechanical properties depend on the load configuration. Med. Eng. Phys. 2013, 35, 1564–1572. [Google Scholar] [CrossRef] [PubMed]
  31. Luisier, B.; Ara, E.D.; Pahr, D.H. Orthotropic HR-pQCT-based FE models improve strength predictions for stance but not for side-way fall loading compared to isotropic QCT-based FE models of human femurs. J. Mech. Behav. Biomed. Mater. 2014, 32, 287–299. [Google Scholar] [CrossRef] [PubMed]
  32. Pahr, D.H.; Zysset, P.K. A comparison of enhanced continuum FE with micro FE models of human vertebral bodies. J. Biomech. 2009, 42, 455–462. [Google Scholar] [CrossRef] [PubMed]
  33. Gross, T.; Kivell, T.L.; Skinner, M.M.; Nguyen, N.H.; Pahr, D.H. A CT-image-based framework for the holistic analysis of cortical and trabecular bone morphology. Palaeontol. Electron. 2014, 17, 1–13. [Google Scholar] [CrossRef]
  34. Schwiedrzik, J.J.; Zysset, P.K. An anisotropic elastic-viscoplastic damage model for bone tissue. Biomech. Model. Mechanobiol. 2013, 12, 201–213. [Google Scholar] [CrossRef] [PubMed]
  35. Lowekamp, B.C.; Chen, D.T.; Ibáñez, L.; Blezek, D.; Johnson, H.J. The Design of SimpleITK. Front. Neuroinform. 2013. [Google Scholar] [CrossRef] [Green Version]
  36. Virtanen, P.; Gommers, R.; Oliphant, T.E.; Haberland, M.; Reddy, T.; Cournapeau, D.; Burovski, E.; Peterson, P.; Weckesser, W.; Bright, J.; et al. SciPy 1.0: Fundamental algorithms for scientific computing in Python. Nat. Methods 2020, 17, 261–272. [Google Scholar] [CrossRef] [PubMed] [Green Version]
  37. Schulte, F.A.; Zwahlen, A.; Lambers, F.M.; Kuhn, G.; Ruffoni, D.; Betts, D.; Webster, D.J.; Müller, R. Strain-adaptive in silico modeling of bone adaptation - A computer simulation validated by in vivo micro-computed tomography data. Bone 2013, 52, 485–492. [Google Scholar] [CrossRef] [PubMed]
  38. Zysset, P.K.; Dall’ara, E.; Varga, P.; Pahr, D.H. Finite element analysis for prediction of bone strength. BoneKey Rep. 2013, 2, 386. [Google Scholar] [CrossRef] [PubMed] [Green Version]
  39. Maquer, G.; Musy, S.N.; Wandel, J.; Gross, T.; Zysset, P.K. Bone volume fraction and fabric anisotropy are better determinants of trabecular bone stiffness than other morphological variables. J. Bone Miner. Res. 2015, 30, 1000–1008. [Google Scholar] [CrossRef] [PubMed] [Green Version]
  40. Pauly, H.M.; Larson, B.E.; Coatney, G.A.; Button, K.D.; DeCamp, C.E.; Fajardo, R.S.; Haut, R.C.; Haut Donahue, T.L. Assessment of cortical and trabecular bone changes in two models of post-traumatic osteoarthritis. J. Orthop. Res. 2015, 33, 1835–1845. [Google Scholar] [CrossRef] [PubMed] [Green Version]
  41. Musy, S.N.; Maquer, G.; Panyasantisuk, J.; Wandel, J.; Zysset, P.K. Not only stiffness, but also yield strength of the trabecular structure determined by non-linear μFE is best predicted by bone volume fraction and fabric tensor. J. Mech. Behav. Biomed. Mater. 2017, 65, 808–813. [Google Scholar] [CrossRef] [PubMed] [Green Version]
  42. Schileo, E.; Taddei, F.; Malandrino, A.; Cristofolini, L.; Viceconti, M. Subject-specific finite element models can accurately predict strain levels in long bones. J. Biomech. 2007, 40, 2982–2989. [Google Scholar] [CrossRef] [PubMed]
  43. Dall’Ara, E.; Eastell, R.; Viceconti, M.; Pahr, D.; Yang, L. Experimental validation of DXA-based finite element models for prediction of femoral strength. J. Mech. Behav. Biomed. Mater. 2016, 63, 17–25. [Google Scholar] [CrossRef] [PubMed] [Green Version]
  44. Baldwin, M.A.; Langenderfer, J.E.; Rullkoetter, P.J.; Laz, P.J. Development of subject-specific and statistical shape models of the knee using an efficient segmentation and mesh-morphing approach. Comput. Methods Programs Biomed. 2010, 97, 232–240. [Google Scholar] [CrossRef] [PubMed]
  45. Poole, K.E.; Skingle, L.; Gee, A.H.; Turmezei, T.D.; Johannesdottir, F.; Blesic, K.; Rose, C.; Vindlacheruvu, M.; Donell, S.; Vaculik, J.; et al. Focal osteoporosis defects play a key role in hip fracture. Bone 2017, 94, 124–134. [Google Scholar] [CrossRef] [PubMed] [Green Version]
  46. Cheng, X.G.; Lowet, G.; Boonen, S.; Nicholson, P.H.; Brys, P.; Nijs, J.; Dequeker, J. Assessment of the strength of proximal femur in vitro: Relationship to femoral bone mineral density and femoral geometry. Bone 1997, 20, 213–218. [Google Scholar] [CrossRef]
Figure 1. Graphical abstract: Experimental data and quantitative CT (QCT)-images (left) were obtained from proximal human femora. “Study”—B-spline transformations were used to create a mean gray-level image and subsequently subject-specific QCT finite element (FE) models. FE models and local parameters were correlated with experimental bone strength. “Control”—manually created QCT FE models are compared to results from transformed meshes and corresponding FE models.
Biomechanics 02 00012 g001
Figure 2. Exemplary renderings of three femora (1, 2, 3) in side and frontal view of the original (A), and transformed meshes (B). The transformed meshes were all similar in appearance compared to the standard, manually created models.
Biomechanics 02 00012 g002
Figure 3. Boxplots of surface distances between standard- and transformation-based meshes for each sample. Medians are displayed as black lines and means as stars in each box. The turquoise horizontal line shows the mean of means. Whiskers show minimal and maximal values not considered being outliers. Outliers are not shown.
Biomechanics 02 00012 g003
Figure 4. Bland–Altman plots of mesh volumes: mesh volumes of the standard and transformation-based models are compared by plotting their means against their relative differences. No dependencies are apparent.
Biomechanics 02 00012 g004
Figure 5. Bone volume to total volume (BV/TV) distribution in three exemplary samples (1–3) of the set. Left models were generated individually (A), right models were created with transformed meshes (B).
Biomechanics 02 00012 g005
Figure 6. Damage distribution at peak loading in three exemplary samples (1–3) of the set. Left models were generated individually (A), right models were created with transformed meshes (B).
Biomechanics 02 00012 g006
Figure 7. Experimental vs. simulated bone strength based on manually created (red) and transformation-based meshes (turquoise).
Biomechanics 02 00012 g007
Figure 8. Correlations of the respective averaged (BV/TV and bone mineral content (BMC)) and maximal (von Mises and maximum absolute principal strain) values of each specified region with experimental ultimate force. Higher values were found for BMC, and maximum absolute principal strain especially in the inferior neck region. The abbreviations Sup., Inf., C., and T. indicate superior, inferior, cortical, and trabecular sections, respectively, as well as combinations thereof.
Biomechanics 02 00012 g008
Figure 9. Elemental means, standard deviations, and correlations with experimental ultimate force of—from top to bottom—BV/TV, BMC, von Mises stress, and maximal absolute strain. Note that mean and standard deviation values exceed the respective color bar limits for better visualization.
Biomechanics 02 00012 g009
Table 1. Elasticity and strength parameters of the material model.
Elasticity Yield/Strength
ϵ 0 [GPa] ν 0 μ 0 [GPa]k [-] σ 0 [MPa] χ 0 [-] τ 0 [MPa]
Tension6.6140.2462.6541.33354.8−0.24640.55
Compression 72.90.333
Publisher’s Note: MDPI stays neutral with regard to jurisdictional claims in published maps and institutional affiliations.

