Article

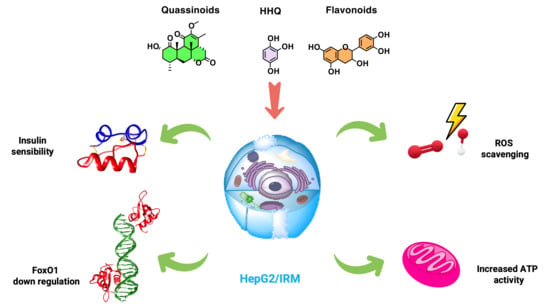
Hydroxyhydroquinone and Quassinoids as Promising Compounds with Hypoglycemic Activity through Redox Balance

by
Paulo R. dos Santos
1,
Sidinéia Danetti
1,
A. Joseph Rastegar
2,
Wellington V. de Souza
2,
Rafaele Frassini
2,
Fernando J. Scariot
3,
Sidnei Moura
1 and
Mariana Roesch-Ely
3,4,*
1
Laboratory of Biotechnology of Natural and Synthetics Products, University of Caxias do Sul, Caxias do Sul 95070-560, Brazil
2
Laboratory of Applied Toxicology and Bioproducts, University of Caxias do Sul, Caxias do Sul 95070-560, Brazil
3
Laboratory of Applied Microbiology, University of Caxias do Sul, Caxias do Sul 95070-560, Brazil
4
Institute of Biotechnology, University of Caxias do Sul, Caxias do Sul 95070-560, Brazil
*
Author to whom correspondence should be addressed.
Compounds 2024, 4(1), 17-36; https://doi.org/10.3390/compounds4010002
Submission received: 25 July 2023 / Revised: 14 November 2023 / Accepted: 27 December 2023 / Published: 3 January 2024

Abstract

:
In the present study, an insulin-resistant cell model (human hepatocellular carcinoma cell line: HepG2) was chosen to investigate the efficacy of two compound classes and their common molecular motif for glycemic control and insulin sensitization. The two compounds’ classes were flavonoid extracts from Rourea cuspidata and quassinoid extracts from Picrasma crenata. The flavonoid-like hydroxyhydroquinone (HHQ) was synthesized. HepG2 cells were tested in a high-glucose environment (HepG2/IRM) by monitoring ROS activity, the concentration of adenosine triphosphate (ATP), and the measurement of mitochondrial membrane potential (MMP). The expression of forkhead box O1 (FOXO1) protein, which mediates gluconeogenesis and insulin resistance, was also investigated using indirect immunocytochemistry and Western blot techniques. A significant increase in glucose uptake and well-regulated ATP concentrations were observed in the treated cells. The downregulation of FOXO1 expression was seen in cells treated with HHQ and quassinoids in comparison to cells treated with flavonoids. This study provides a pharmacological basis for the application of HHQ, quassinoids from P. crenata, and flavonoids from R. cuspidata in the treatment of metabolic diseases such as type 2 diabetes mellitus.

Graphical Abstract

1. Introduction

All living organisms produce reactive oxygen species (ROS) because of cellular metabolism. The compartmentalization of ROS production within cells, however, elicits redox signaling or oxidative damage in specific organelles [1]. There are several intracellular compartments that are sources of ROS and present different effects in metabolism [2]. Despite the existence of a variety of ROS origins, mitochondria and nicotinamide adenine dinucleotide phosphate (NADPH) oxidase (NOX) are listed as major sites of ROS balance [3]. NADPH and mitochondria oxidase processes interact, which contributes to the gradual progression of oxidative stress, as suggested by Daiber [4].
ROS are found in mitochondria within most mammalian cells and are therefore highly involved in oxidative stress. Increased production might contribute to mitochondrial damage in a range of pathologies. They also play a significant role in a redox signaling system from the organelle to the rest of the cell, which leads to mild uncoupling, resulting in augmented ROS production [1]. Imbalance between energy intake and expenditure drives mitochondrial dysfunction, characterized by a reduced ratio of energy production (lower ATP concentration) [5]. It is theorized that the mitochondria of diabetic cells, when exposed to high glucose and fatty acid concentrations, may lead toward greater oxygen use and higher oxidation potential, thereby forming more ROS. Mitochondrial dysfunction in insulin-sensitive tissues, including the muscle, heart, and liver, may also contribute to deterioration in the diabetic state over time [5,6]. However, whether defects in mitochondria are primary or secondary, more investigation is needed. Even if mitochondrial dysfunction was secondary to insulin resistance, mitochondrial defects exacerbate hyperglycemia once the insulin resistance has taken effect, which leads to a progressive state of the diabetic condition [6].
To ameliorate hepatic insulin resistance and increase sensitivity, various synthetic pharmaceuticals have been discovered, and looking for new pharmacological activities for existing candidates is imperative. Some of these compounds result in drug resistance and show various side effects following long-term use. Metformin, the active compound in Galeca officinalis (Goat’s rue), is a good example. Metformin is used as a first-line therapeutic drug to prevent hepatic glucose generation [7].
The identification of additional natural active compounds that can potentially improve hepatic insulin sensitivity with minimal side effects is mandatory. Hydroxyhydroquinone (HHQ), or 1,2,4-trihydroxy benzene, is a simple aromatic molecule with redox potential, which can bind or release electrons according to the environment and metabolic demand. Likewise, auto-oxidized flavonoids are capable of producing oxygen radicals presenting lower oxidation potentials than those that do not undergo auto-oxidation. Their low redox potential and ability to oxidate homologous hydroxybenzoquinone make them good flavonoid analogs to test phenolic activities in order to improve cell insulin sensitivity [8]. According to Kargl et al. (2017) [9], phenolic compounds such as flavonoids can increase serum cortisol via the inhibition of 11b-hydroxysteroid dehydrogenase type 2 enzyme. In this sense, some phenolic compounds present in plants used for the treatment of type II diabetes, such as Rourea cuspidata, miraruira, tend to act on 11b-hydroxysteroid dehydrogenase type 1 as enzyme inhibitors to mitigate non-adrenal cortisol production [10]. Resveratrol is an example of an active polyphenol known for anti-diabetic effects in both animals and humans. Resveratrol has been shown to be involved in maintaining glucose homeostasis, decreasing insulin resistance, protecting pancreatic b-cells, promoting insulin secretion, and relieving metabolic disorders [7].
Quassinoid compounds obtained from the Brazilian quassia tree (Picrama crenata) have been used as antidiabetic phytotherapy. Their activity is not clear, but the major compounds present in quassia stems and barks, named quassinoids, may be the active compounds, since their structure is similar to that of the steroid molecular skeleton. The quassinoids can act like glucocorticoids and mineral corticoids and can reduce glycemia by cortisol inhibition in the liver and by inducing glycosuria [11].
It is known that insulin resistance and gluconeogenesis are complementary biochemical phenomena mediated by forkhead box O1 (FOXO1), a nuclear protein in hepatocytes that acts as a signal for glucose metabolism [12]. Once activated, insulin receptors in the liver modulate downstream insulin signaling, including phosphatidylinositol 3-kinase (PI3K) and protein kinase B (PKB/AKT). AKT phosphorylates several substrates such as FOXO1, controlling the transcription of genes encoding gluconeogenic enzymes and glycogen synthase kinase [13].
In the present study, a HepG2 insulin-resistant cell model was chosen to investigate the efficacy of hydroxyhydroquinone and quassinoid extracts as promising compounds with hypoglycemic activity through redox balance. Hydroxyhydroquinone was synthetized and a series of quassinoids from P. crenata extracts and flavonoids from R. cuspidata extracts were identified and tested in HepG2 cells, which were evaluated through cytotoxic activity, levels of ROS and ATP, mitochondrial membrane potential (MMP), and FOXO1 expression in a high-glucose environment.

2. Materials and Methods

2.1. Synthesis of Hydroxyhydroquinone (HHQ) (Figure 1)

HHQ was prepared according to Humbarger et al. (2018) [14]. In the first step, 30.0 g of 1,4-hydroquinone (HQ) (272 mmol, 1.0 eq) was suspended on 200 mL of ethyl acetate/aqueous H2SO4 3% 80/20 v/v with 0.5 g of iodine as catalyst (3.9 mmol, 0.014 eq) on a glass half-liter round bottle flask. To the stirred solution was added 50.0 mL of H2O2 30% (489 mmol, 1.8 eq) dropwise to maintain the temperature at around 45 °C by 3 h. After cooling overnight in a freezer, brownish yellow crystals of 1,4-benzoquinone (BQ) were filtered out by vacuum, washed with cooled water/methanol, and dried in air for 24 h. The yield of BQ was 20.55 g, approximately 70%.
Figure 1. Scheme of the synthetic HHQ route.
Compounds 04 00002 g001
In the second step, a solution of 43.0 g of acetic anhydride (421 mmol, 2.2 eq), 22.8 g of acetic acid (379 mmol, 2.0 eq), and 4.0 g of H2SO4 98% (41 mmol, 0.2 eq) was prepared in a glass half-liter two-neck round bottle flask with vigorous stirring. An amount of 20.55 g of BQ (190 mmol, 1.0 eq) was added portion wise in order to maintain the temperature at around 45 °C (exothermic reaction). After complete addition of BQ, the reaction was allowed to cool to room temperature and stirring maintained over 30 min until white solids were formed. To the reacted moisture was added 200 mL of ice water, before it was filtered by vacuum and washed with an excess of ice water. The white solids were dried on freeze drier for 24 h. Yield of 1,2,4-AcBz was 47.3 g, ~99%.
In the third step, 47.3 g of 1,2,4-AcBz (187 mmol, 1.0 eq) was suspended in 180 mL of methanol, 100 mL of water, and 1.55 mL of HCl 37%. The moisture was refluxed for 7 h and maintained at room temperature for 14 h. The solvents were removed by vacuum evaporator and the brownish solids were suspended in 140 mL of hot ethyl acetate. Sodium hydrogen carbonate (14 g) and 1.4 g of active charcoal was added under vigorous stirring while the system was refluxed for 30 min. The solids were removed in a vacuum filter and the solvent was removed by vacuum evaporator. The HHQ crystallizes in an orange semisolid form, yielding 23.35 g (99%). All reagents used in the synthesis were obtained from Sigma-Aldrich. The product was stored under an inert atmosphere (N2) in dark conditions at room temperature. All chemicals used were of analytical grade and were used as received without any further modification.

2.2. Vegetable Material

2.2.1. Extracts of P. crenata

The vegetable material (P. crenata) was collected from Marques de Souza City, RS, Brazil (29°14′38″ S 52°11′18″ W). Stem parts without bark were dried over a dry oven (7 days) and crushed on a Willey®-type mill (1 mm mesh). Extracts were prepared according to Cardoso et al. (2009) [15]. In total, 10 g of powder was extracted with 100 mL of ethanol:water 50:50% v/v by reflux for 2 h. Solvent was removed on a rotavapor.

2.2.2. Chromatographic Assay of P. crenata

The chromatographic method was used to determine the chemical composition of P. crenata extract. It was performed according to Cardoso et al. (2009) [15]. The chromatographic system was composed of UFLC Shimadzu compounded with two LC 20A pumps, DGU 20A degasser, SIL20A HT auto injector, CTO 20A column oven, and CBM 20A controller. The separation process was performed with RP 18 column (Agilent Zorbax 250 mm × 4.7 mm, 5 mm particle size) at 25 °C. Gradient system was composed of water (A) and methanol (B): 0–2 min (90%A:10%B), 2–10 min (60%A:40%B), 10–20 min (50%A: 50%B), 20–25 min (50%A:50%B), 25–30 min (90%A:10%B). Total flow was 1.0 mL min−1 and sample volume injection was 20 mL. HRMS detection system was composed of Micro TOF-Q II (Bruker Scientific, Billerica, MA, USA) with electrospray (ESI) source operated at 200 °C, dry gas flow (N2) 10 L·min−1, and gas capillary pressure 5 bar. Spectrometer configuration: spectral window 50 to 2200 m/z, data record rate: 2 scans·s−1, controlled by Compass Hystar interface software (version 3.2). The runs were recorded with mode positive and negative ions. Data analysis was performed in Compass Data Analysis 4.3. A mass spectrum report after the direct infusion of P. crenata using an electrospray source in positive mode is visualized in the supplementary material (Figure S4).

2.2.3. Extracts of R. cuspidata

R. cuspidata extracts (Miraruira) were prepared according Laikowski et al. (2017) [10]. The plant material (lianas) was dried in an air oven at 45 °C. The powdered material (10 g) was extracted in ethanol:H2O 50:50 (100 mL) by reflux for 2 h, the solution was filtered, and the solvent was removed by vacuum. Crude solids were resuspended in water and extracted with hexane to remove fatty acids and greasy compounds. The aqueous fraction was dried by vacuum and used in our experiments. Chemical composition was determined by electrospray ionization quadrupole time-of-flight mass spectrometry (ESI-TOF-MS) with direct infusion using the same device settings used in Section 2.2.2.

2.3. Cell Culture and Cytotoxic Assay

The established human HepG2 hepatoma cell line was obtained from the American Type Culture Collection (Maryland, San Jose, CA, USA). HepG2 cells were between the third and fifth passages and grown in Dulbecco’s modified Eagle’s medium (DMEM; D5648, Sigma-Aldrich, St. Louis, MO, USA) supplemented with 10% fetal bovine serum (FBS; F7524, Sigma-Aldrich) under standard cell culture conditions, with a humidified atmosphere, 5% CO2, and at 37 °C. Cell viability of HepG2 against different treatments was measured using the MTT (3-[4,5-dimethylthiazol-2-yl]-2,5 diphenyl tetrazolium bromide) assay. Briefly, cells were seeded into the 96-well plates at a density of 8.0 × 10⁴ cells/mL. After 24 h, cells were treated with different concentrations of extracts and incubated for 24 h. Negative controls were treated with the same amounts of solution for 24 h. The medium was removed and 1 mg/mL MTT (M2128, Sigma-Aldrich) dye in serum-free medium was added to the wells. Plates were incubated at 37 °C for 2 h in a humidified 5% CO2 atmosphere. Subsequently, the MTT solution was removed, and the obtained formazan violet product was dissolved in 100 mL DMSO. Absorbance was measured using a microplate reader (Spectra Max M2e, Molecular Devices, San Jose, CA, USA) at 570 nm. All readings were compared with the control, which represented 100% viability. Each experiment was performed in triplicate and independently repeated at least four times.

2.4. Insulin Resistance Model (HepG2/IRM) and Glucose Uptake

HepG2 cell lines have been used as insulin resistance model in several studies. This protocol was adapted from Kheirollahzadeh et al. (2022) [16]. To establish an insulin-resistant cell model (HepG2/IRM), a gradient of insulin at different concentrations was initially tested for viability through MTT and further glucose quantification was performed. Therefore, cells were seeded in 96-well plates at 8.0 × 10⁴ cells/mL in DMEM supplemented with a high glucose concentration (25 mmol/L). After 24 h incubation, cells were treated with recombinant insulin (12585014; Invitrogen Life Technologies, Carlsbad, CA, USA) at concentrations of 10−4 mol/L to 10−7 mol/L. The best parameters for insulin concentration were selected for the IR model and further experiments were processed with insulin at 5 μM for 24 h. At the end of the incubation period, glucose concentrations were determined using the glucose oxidase method through glucometer measurements (Accu-Chek®Guide; Roche, South San Francisco, CA, USA). According to the manufacturer’s instructions, the glucose dehydrogenase present in the strip converts the glucose in the culture media sample to gluconolactone, generating a reaction that liberates two electrons that react with a coenzyme (PQQ) electron acceptor. Glucose was assayed in 50 μL of the media and the edges of the stripes were immersed in solution for measurement. The percentage of cellular glucose in media was determined as the difference between the glucose concentration before and after insulin treatment relative to control non-insulin-treated cells. After 24 h of exposition to insulin at 5 μM, cells were treated with the highest non-cytotoxic concentration of different extracts for 24 h.

2.5. Mitochondria Membrane Potential (MMP) Assay and ROS Activity

Mitochondria membrane potential was evaluated using a mitochondria membrane potential kit (MAK 159, Sigma-Aldrich). HepG2 and HepG2/IRM cells were plated in 6-well plates at 3.0 × 10⁵ cells/mL and exposed to different treatments. After adherence, cells were treated with the highest non-cytotoxic concentration of different extracts for 24 h. The protocol was modified from the manufacturer’s instructions to 6-well plates, and 300 μL of dye loading solution of JC-10 was diluted in buffer A (1:100) and loaded in each well. After 1 h of incubation, 300 μL of loading solution B was added to each well and cells were monitored using a microscope with fluorescent filters (Olympus, BX43, San Jose, CA, USA). JC-10 is a cationic lipophilic dye that generates red-fluorescent aggregates (λex = 540 nm/λem = 590 nm) in polarized mitochondrial membrane. Failure to retain JC-10 in the mitochondria leads to a collapse in membrane potential and the dye returns to its monomeric green form (λex = 490 nm/λem = 525 nm).
Mitochondria activity was also monitored through the incubation of 3,3′-dihexyloxacarbocyanine iodide DiOC6 stain (318426, Sigma-Aldrich). HepG2 and HepG2/IRM cells were plated in 6-well plates at 3.0 × 10⁵ cells/mL and exposed to the highest non-cytotoxic concentration of different extracts for 24 h. DiO6 at a final concentration of 40 nM was incubated in each treated media well during the 40 min before analysis using a microscope with fluorescent filters (λex = 481 nm/λem = 501 nm, Olympus, BX43).
Reactive oxygen species (ROS) activity was processed using the 2′,7′-dichlorodihydrofluorescein diacetate (DCFH-DA) (35845, Sigma-Aldrich) protocol in HepG2 and HepG2/IRM in 6-well plates at 3.0 × 10⁵ cells/mL, exposed to the highest non-cytotoxic concentration of different extracts for 24 h. DCPH-DA at a final concentration of 10 μM was applied to each treated media well and cells were incubated during the 40 min before analysis using a microscope with fluorescent filters (λex = 485 nm/λem = 530 nm, Olympus, BX43).
Mitochondrial membrane potential and reactive oxygen species were measured by flow cytometry. HepG2 and HepG2/IRM cells were plated in 6-well plates at 3.0 × 10⁵ cells/mL and exposed to different treatments. After 24 h, cells were exposed to the highest non-cytotoxic concentration of different extracts for 24 h. The negative control groups were treated with the same amount of aqueous solution used for the extracts. The intensity of fluorescence from 10,000 cells was quantified with a BD FACSCalibur four colors flow cytometer (Becton Dickinson, Franklin Lakes, NJ, USA). Data were collected with the CellQuest Pro software (BD Biosciences, San Jose, CA, USA) and analyzed using FlowJo v.10 (TreeStar, Inc., Woodburn, OR, USA). Experimental procedures were performed at least in duplicate. Changes in the MMP as a result of mitochondrial depolarization were measured using the method of incorporation of 3,3′-dihexyloxacarbocyanine iodide (DioC6(3)) according to Frozza et al. (2017) [17]. Briefly, treated and untreated cells were harvested by trypsin, washed once in PBS, and then stained with DioC6(3) (175 nM) for 30 min and analyzed by flow cytometry using an FL1 (488/533) filter. For the measurement of intracellular levels of ROS, cells were stained by 2′,7′-dichlorofluorescein diacetate with modifications. DCFH-DA penetrates the intracellular matrix of cells, being oxidized by ROS to fluorescent dichlorofluorescein (DCF). Fluorescent dye solutions (10 μM) were added to the cells and incubated for 30 min at 37 °C in the dark. The levels of ROS were analyzed at an excitation of 488 nm and emission of 533 nm.

2.6. Adenosine Triphosphate (ATP) Activity

ATP activity was monitored through the CellTiter-Glo® Luminescent Cell Viability Assay (G7570, Promega, Fitchburg, WI, USA). This protocol allows determining the number of viable cells in culture based on the quantitation of ATP through the addition of a thermostable luciferase, generating a luminescent signal. Therefore, HepG2 and HepG2/IRM cells were plated in 6-well plates at 3.0 × 10⁵ cells/mL and exposed to different treatments. After adherence, cells were treated with the highest non-cytotoxic concentration of different extracts for 24 h. A single reagent was added directly to cell culture treatments, generating cell lysis and a luminescent signal proportional to the amount of ATP present in samples.

2.7. FOXO1 Expression through Western Blot and Indirect Immunofluorescence Assay

To evaluate the expression of FOX01 through Western blot, HepG2 and HepG2/IRM cells were plated in 6-well plates at 3.0 × 10⁵ cells/mL and exposed to different treatments for 24 h. For the isolation of total protein fractions, the cells were collected, washed twice with ice-cold PBS, and lysed using cell lysis buffer (NP40, 20 mM Tris pH 7.5, 150 mM NaCl, 1% Triton X-100, 2.5 mM sodium pyrophosphate, 1 mM EDTA, protease inhibitor). All reagents were obtained by Sigma-Aldrich. The lysates were collected by scraping from the plates and then centrifuged at 14,000 rpm at 4 °C for 5 min. Total protein was measured by taking 10 μL of each sample and using a fluorometer system (Q33216 Qubit, Invitrogen, Invitrogen Life Technologies, Carlsbad, CA, USA), and an equal quantity of samples was loaded onto 12% of SDS polyacrylamide for gel electrophoresis and transferred onto a polyvinylidene fluoride (PVDF) membrane (IPVH00010, Millipore, Billerica, MA, USA) for 1 h. Membranes were blocked at room temperature for 1 h with blocking solution (5% power milk in TBST). After blocking, primary monoclonal antibody FOXO1 (MA5-17078, Invitrogen) was incubated at 1:1000 overnight at 4 °C, followed by the incubation of secondary anti-mouse IgG (A5278, Sigma-Aldrich) for 1 h at room temperature. For internal control, primary anti-human actin mouse Ab (MA532540, Invitrogen) was used. After washing, the membranes were incubated for 1 h at room temperature with horseradish peroxidase (HRP)-linked anti-mouse IgG and immunoblots were performed using an ECL prime WB detection kit (28980926, Amersham ECL Prime, GE Healthcare life sciences, Marlborough, MA, USA). Chemiluminescence visualization and detection were performed using ImageQuant LAS 500 (GE Healthcare life sciences, Marlborough, MA, USA).
For indirect immunofluorescence assay, cells were seeded into 6-well plates at 3.0 × 10⁵ cells/mL. After 24 h incubation, cells were treated with different compounds for 24 h, fixed with 2.5% glutaraldehyde for 20 min, permeabilized with 0.1% triton X for 15 min, blocked with 3% BSA for 30 min, and incubated with the primary monoclonal anti-FOX01 antibody with 5 μg/mL (MA5-17078, Invitrogen) for 1 h at room temperature, followed by incubation with secondary anti-mouse fluorescein isothiocyanate (F0257, Anti-mouse IgG, Sigma Aldrich, 1:150 v/v) for 1 h. The slides were mounted with a coverslip and analyzed with a fluorescence light microscope.

2.8. Statistical Analysis

The results are expressed as the mean ± standard deviation (SD) of three independent experiments performed in triplicate, used to assess normal distribution data. One-way analysis of variance (ANOVA) was applied, followed by a Tukey post hoc test. The statistical significance of mean differences was accepted at a level of p ≤ 0.05.

3. Results and Discussion

3.1. Synthesis of Hydroxyhydroquinone

The 1H and 13C RMN and HRMS spectra of hydroxyhydroquinone can be found in the supplementary material in Figures S1–S3. The product was stored under an inert atmosphere (N2) in dark conditions at room temperature to reduce hydroxy benzoquinone (HBQ) formation by air contact. 1HNMR (D2O, 300.18 MHz): δ (ppm) 6.21 (dd, 1H, J1 = 8.7 Hz, J2 = 3.0 Hz); 6.37 (d, 1H, J = 3.7 Hz); 6.67 (d, 1H, J = 8.4 Hz); 13CNMR (D2O, 75.49 MHz): 103.68 (CH), 106.62 (CH), 116.78 (CH), 137.14 (COH), 144.70 (COH), 149.26 (COH); HRMS negative ions: m/z, relative intensity (%): 123.0084, 10.9%, (C6H3O3), [HBQ − H], error 2.9 ppm; 125.0250, 100%, (C6H5O6), [M − H], error 4.9 ppm; 167.0365, 9.2%, (C8H7O4), [M + CH3CO − H], error 9.1 ppm; 247.0263, 10.8%, (C12H7O6), [2HBQ − H], error 3.0 ppm; 249.0409, 21% (C12H9O6), [M + HBQ − H], error 1.9 ppm; 499.0936, 3.9% (C24H19O12), [2HHQ + 2HBQ − H], error 10.9 ppm. 1H and 13C NMR spectra confirm the data obtained by Humbarger et al. (2018) [14]. HRMS data show HBQ formation (oxidized form) as well as stable forms of clusters containing HHQ and HBQ formed in the spectrometer source environment, once this compound was not present in the NMR spectra. This characteristic of the hydroquinone–benzoquinone redox pair is known as quinhydrone.

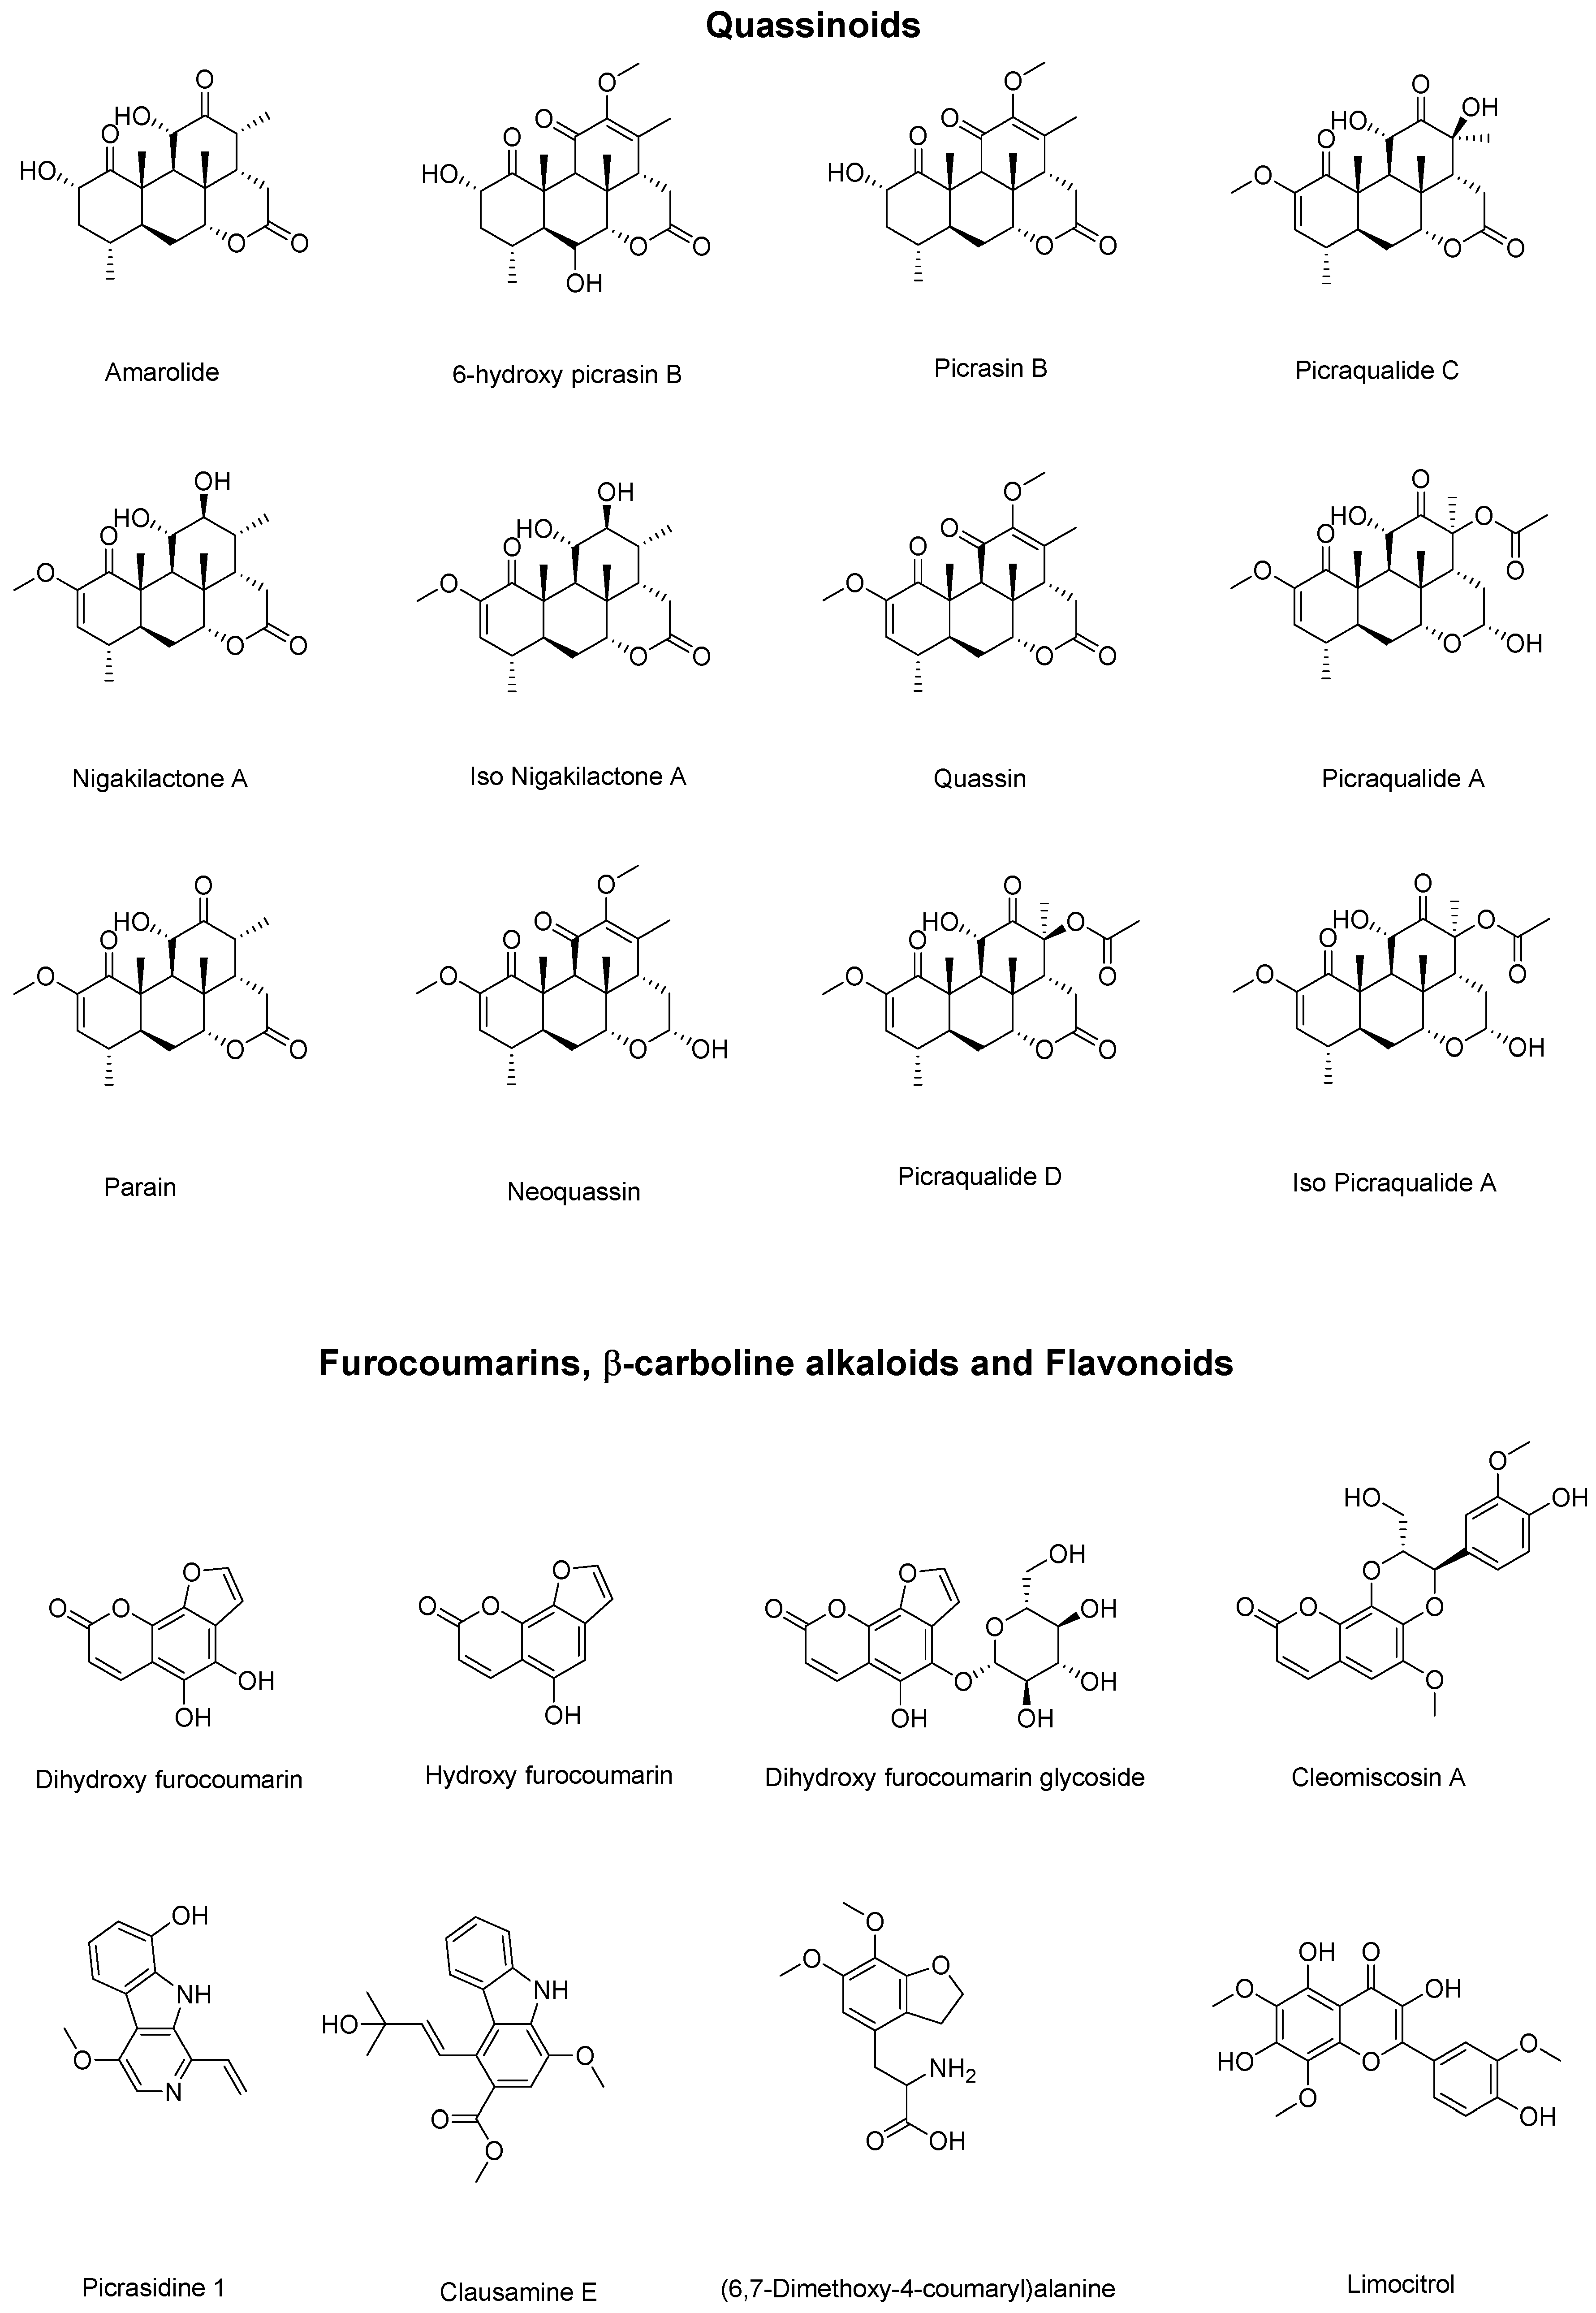
3.2. P. crenata Extract Characterization

The results obtained by LCMS analysis (Table 1 and Figure 2) highlight that hydro-ethanolic extracts of P. crenata have quassinoids as the major chemical class, with 12 compounds and an integrated area of 87.5%. The minor percentual areas are compounded by furocoumarins (6.12%), β-carboline alkaloids (6.10%), and one flavonoid (0.23%). The results corroborate Cardoso et al. (2009) [15].
Among the quassinoids identified in the P. crenata extract, the major compounds are picrasin B (22.5%), nigakilactone A (18.3%), iso nigakilactone A (19.7%), and quassin (5.6%), comprising 66% of the total chromatographic area. The data show that P. crenata has a selective metabolic route for the biosynthesis of quassinoids, as well as a large storage capacity for these compounds in the woody part of the stem and branches. Our method proved to be robust and capable of detecting a series of quassinoids, b-carboline alkaloids, and furocoumarins in the same analysis. Cardoso et al. (2009) [15] were able to determine parain α-dihydro-norneoquassin, quassin, and a mixture of α-neoquassin and β-neoquassin using authentic standards with UV-Vis detection.
Lower-concentration constituents, such as furocoumarins and β-carboline alkaloids, are not mentioned in the literature for P. crenata. Zhao et al. (2016) [18] described the identification of these classes of compounds isolated from P. quassinoids obtained in China. Along with quassinoids, β-carboline alkaloids and furocoumarins can be considered as chemical markers of plants of the genus Picrasma (Figure 3).

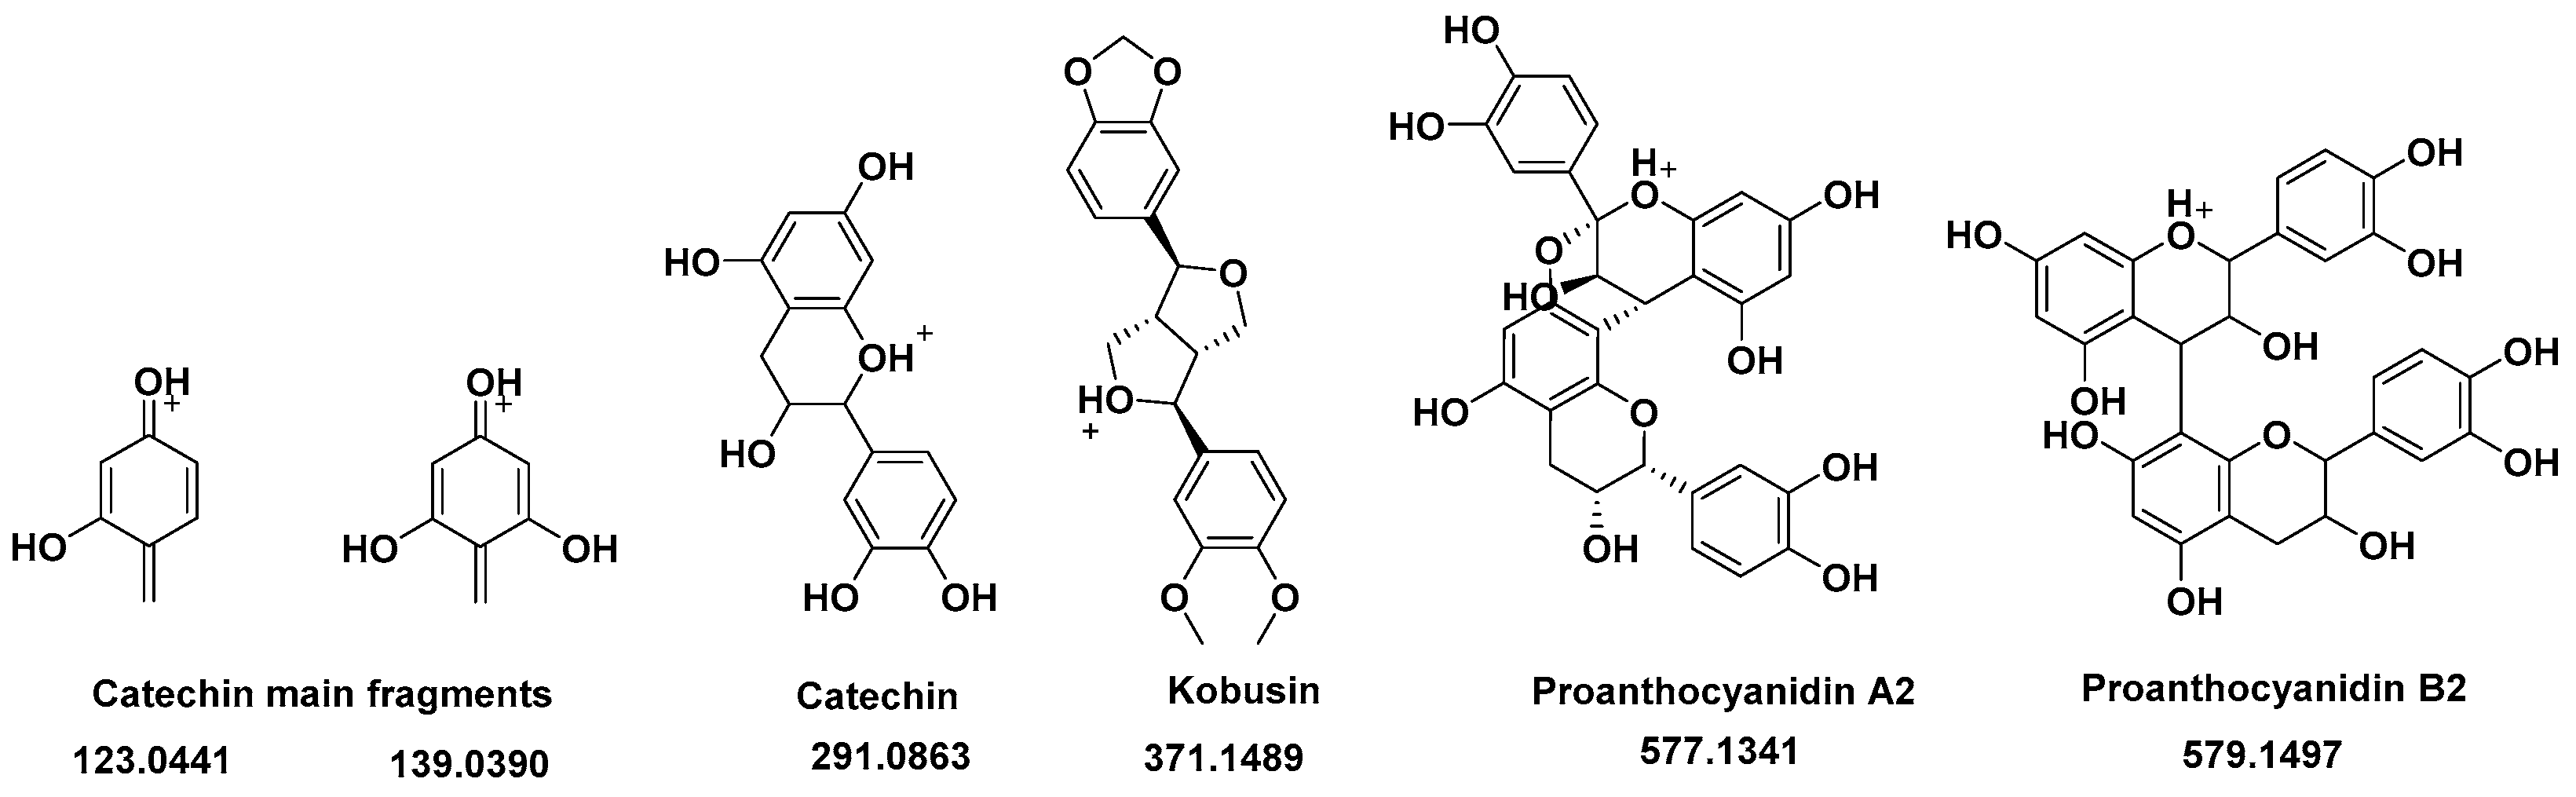
3.3. R. cuspidata Extract Characterization

Rourea cuspidata extract was analyzed by ESI-TOF-MS by direct infusion with mode positive ions (Figure 4).
According to Laskowski et al. (2017) [10], the mass spectrum shows only polyphenolic compounds as proton adduct ions [M + H]+ (Figure 5). Catechins are presented as the base peak (m/z 291.0801, error 3.9 ppm) with two minor fragments at m/z 123.0445 (error 10.5 ppm) and m/z 139.0337 (error 2.3 ppm). Kobusin was detected at m/z 371.1422 (error 0.6 ppm) and two proanthocyanidins (A2 and B2) were detected at m/z 577.1278 (error 1.0 ppm) and 579.1466 (error 2.7 ppm). A study from Paim et al. (2022) [19] revealed that catechin, quercetin, and proanthocyanidins comprise the highest concentration of phenolic compounds in plants of the genus Connaraceae. The pharmacological properties of these plants for the treatment of diseases are associated with different species. Rourea cuspidata Benth. ex Baker is used for type II diabetes, Rourea induta Planch. is traditionally used in rheumatic disease, and Connarus angustifolius (Radlk.) G. Schellenb. is used for the treatment of inflammation. According to Hussain et al. (2020) [8], diabetes mellitus type 2 is a type of metabolic disorder. It develops due to the overproduction of free radicals, which results in increased oxidative stress. Some known types of damage caused by oxidative stress are defective insulin signals, glucose oxidation, and the degradation of glycated proteins, as well as alterations in glutathione metabolism, which induces hyperglycemia. Oxidative stress can be modulated by flavonoid ingestion.

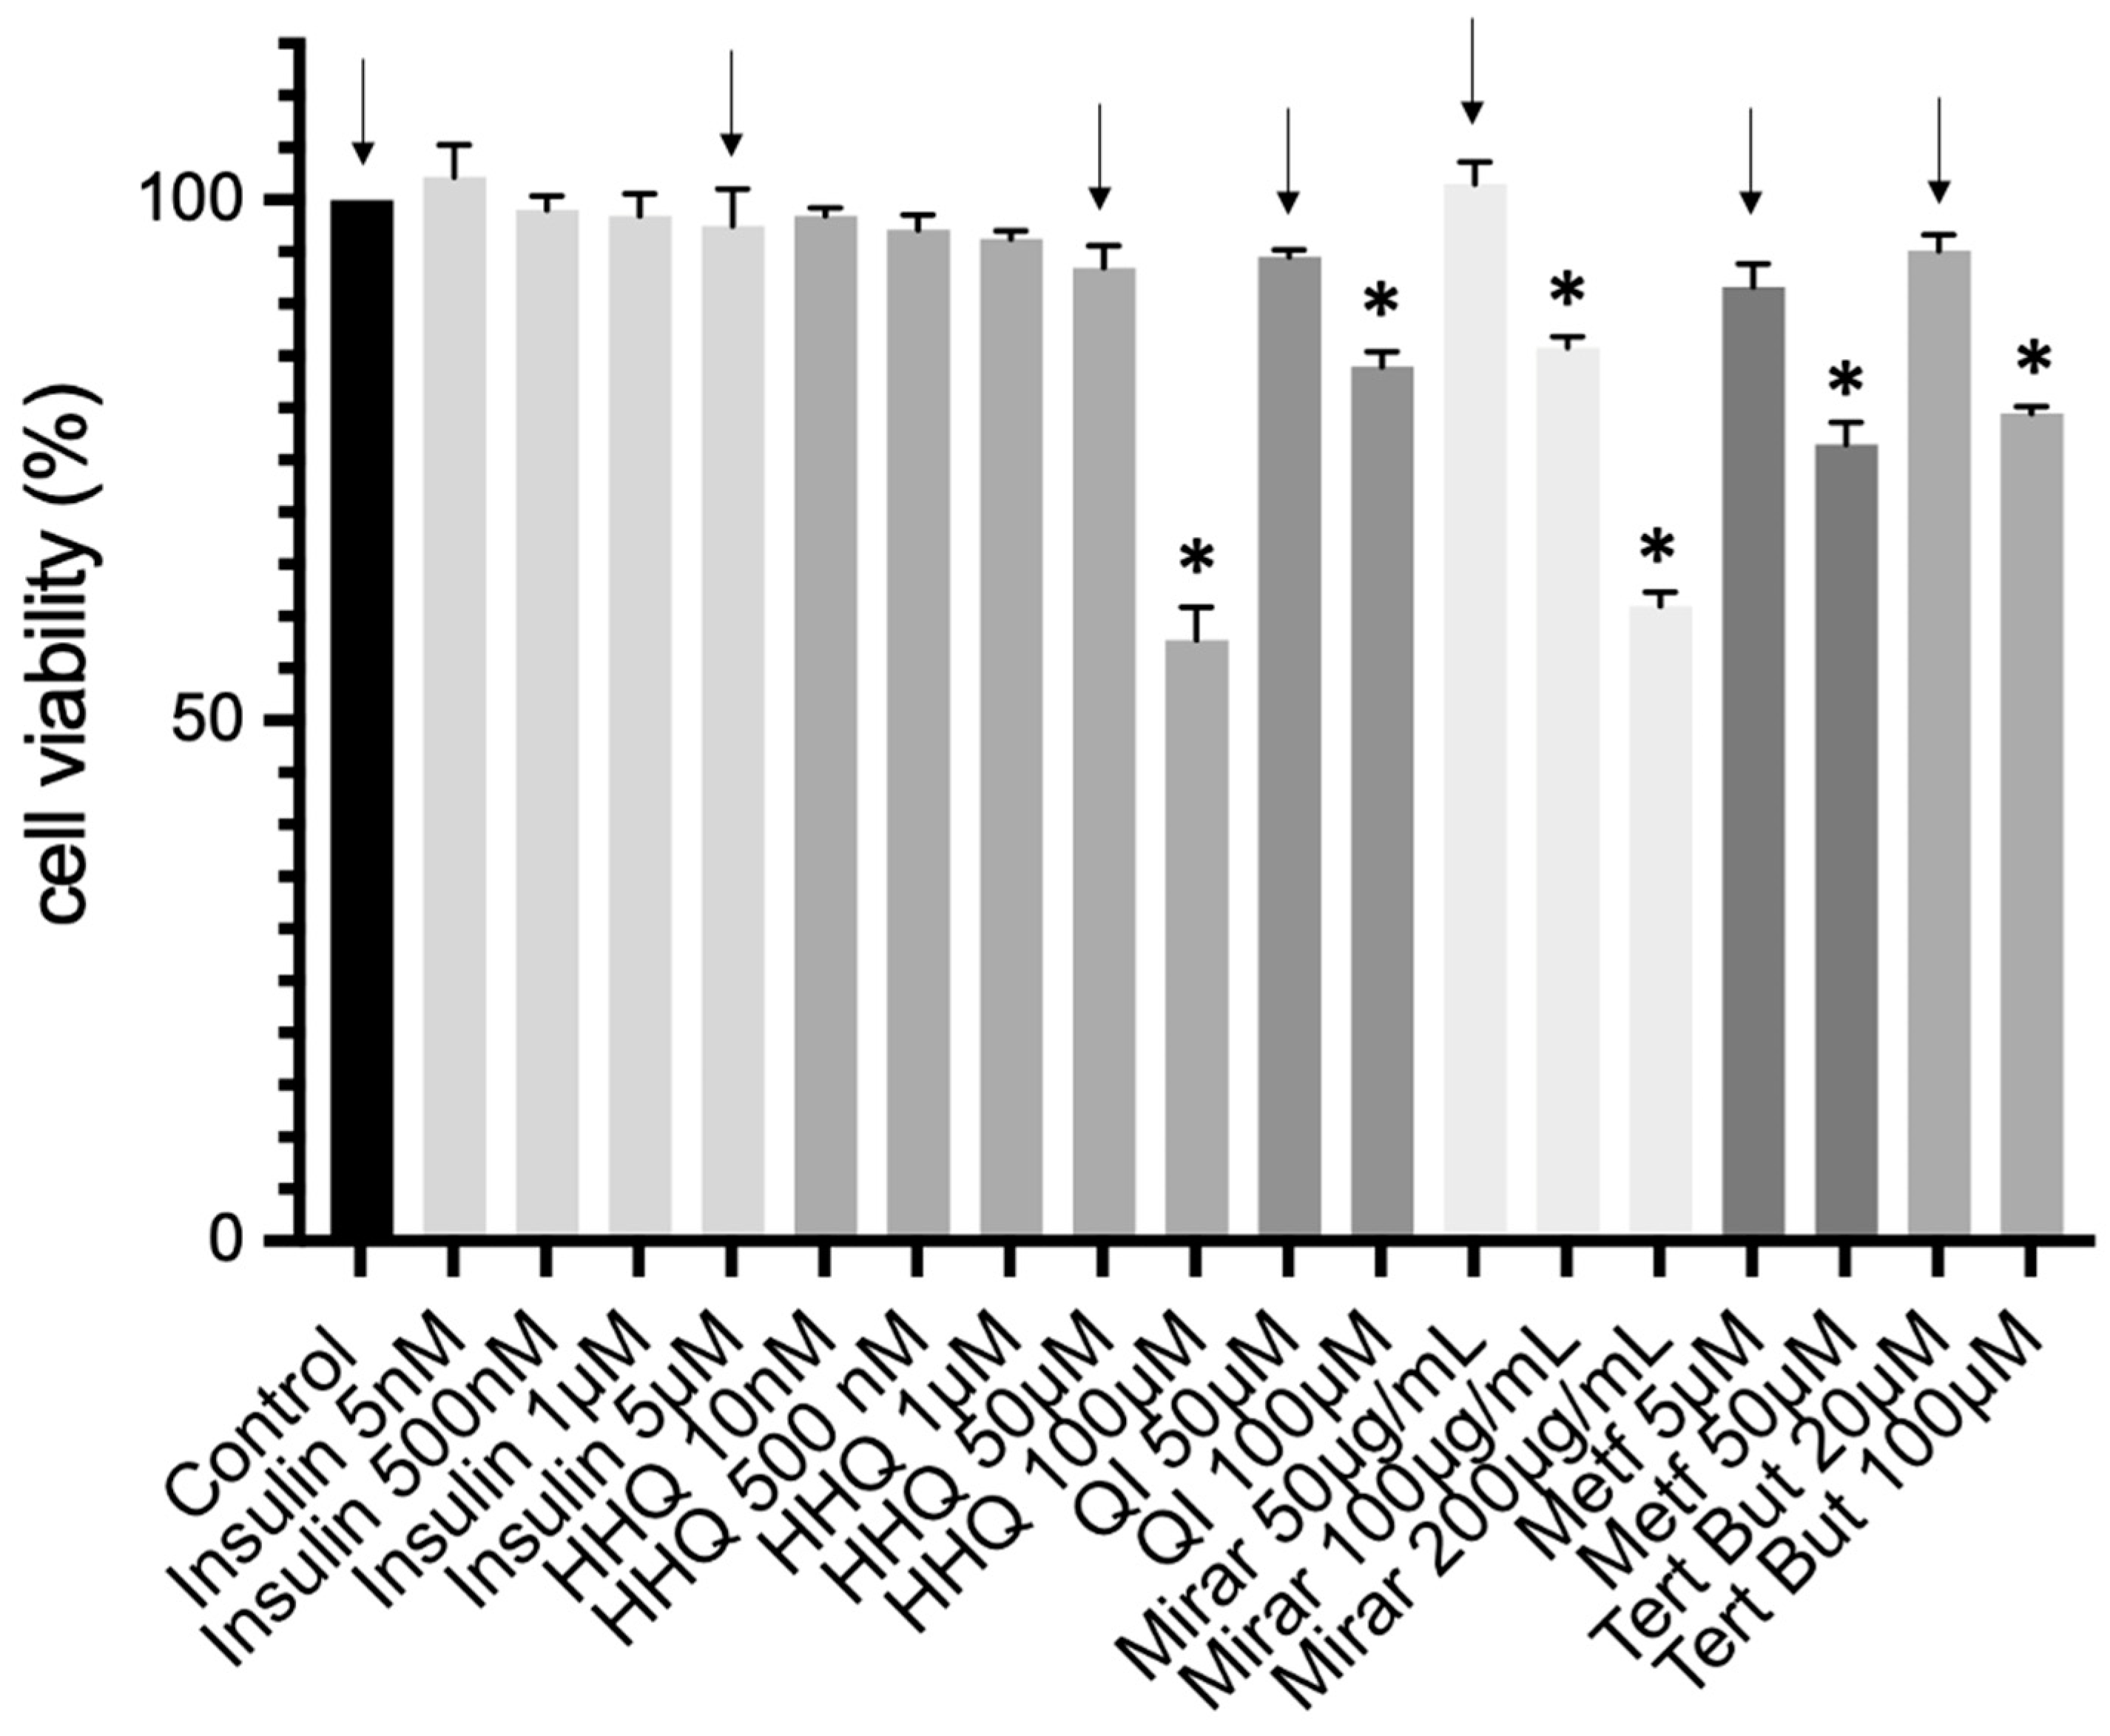
3.4. Cell Culture and Cytotoxic Assay

Hepatoma-derived cell lines show specific hepatocyte morphological characteristics and express hepatocyte-specific markers. The HepG2 cell line has been explored extensively for in vitro investigations of diabetes and insulin resistance [20].
The cytotoxic activity of all compounds was first monitored by MTT assay and compared to the control group without treatment through the HepG2 and HepG2/IRM cell lines. A selection of the highest non-cytotoxic concentration of different extracts was obtained before establishing an insulin resistance model.
A selection of compounds to be tested in further experiments was made based upon the MTT results, considering the highest non-cytotoxic concentration. The arrows in Figure 6 indicate the selected molecules and concentrations, as follows: insulin (INS, 5 μM); hydroxyhydroquinone (HHQ, 50 μM); isolated compounds from quassia extract (QI, 50 μM); miraruira extract (Mirar, 50 μg/mL); metformin (Met, 5 μM); and tert-butyl hydroperoxide (t-BHP; Tert But, 20 μM).
The hydroxyhydroquinone was synthetized as presented in Section 2.1, and together with the quassinoid compounds (shown in Section 2.2) is the focus of this study. Miraruira is the common name of R. cuspidata Benth ex. Baker, a shrub of the Connaraceae family, common in the Amazon region of Brazil, which is used for diabetes treatment in folk medicine. The hypoglycemic activity of miraruira stem extracts has been explored in normal and streptozotocin-induced diabetic rats [10]. Metformin was selected as a positive control compound, which has been used as medication for type 2 diabetes mellitus (T2DM) in recent decades. Research suggests that metformin stimulates peripheral glucose uptake while reducing hepatic glucose production [21] and attenuates triglyceride accumulation in HepG2 cells [22].
Other molecules explored in the literature were also tested through MTT, such as resveratrol (Resv—10 μM), rapamycin (Rapa—100 nM), and Myo inositol and Chiro inositol (Myo Ino and Chiro Ino—100 μM). Resveratrol is known as an active polyphenol and its effects have mainly been shown to be triggered due to its ability to activate AMP-activated protein kinase and sirtuin 1 in the peripheral tissues of diabetic subjects [7]. Rapamycin plays an important role in the insulin resistance model as an inhibitor of the mTOR regulation pathway [23]. Two types of inositol were also tested in this study, since they have been reported to promote glucose intake in high-glucose environments. Chiro inositol (especially D-chiro) enhanced glucose consumption in high-glucose-stimulating cells and increased the expression of insulin receptor substrate 2 (IRS2) protein in HepG2 cells [24].

3.5. Insulin Resistance Model (HepG2/IRM) and Glucose Uptake

The administration of inducers that can disrupt the insulin signaling pathway triggers insulin resistance in HepG2 cells. High glucose concentrations are known to induce cellular damage, leading to glucose toxicity. Ultimately, high glucose concentrations lead to insulin resistance [20]. The exposure to high glucose triggers glucose production while suppressing glucose uptake in HepG2 [25]. High glucose levels interact with proteins and trigger the formation of excessive advanced glycation end products, which enhance oxidative stress. These conditions are conducive to establishing a phenotype of glucose toxicity, ROS accumulation, oxidative stress, and cell dysfunction, which triggers the progression of insulin resistance [26].
Before measuring glucose in media, a gradient of insulin at different concentrations (5 nM–5 µM) was initially tested for viability through MTT. The insulin range corroborates published data [7]. The highest non-cytotoxic concentrations are represented in Figure 6, and insulin at 5 µM was selected according to the lower glucose consumption. The selection of compounds (HHQ 50 µM; QI 50 µM; Mirar 50 µg/mL; Metf 5 µM; Tert But, 20 µM) was carried out according to the non-cytotoxic parameters to be tested. The viability of insulin-resistant HepG2 cells was examined in the presence of different concentrations of compounds through MTT (Figure 7).
Glucose concentration was determined using the glucose oxidase method through glucometer measurements. After 24 h of exposition to insulin at 5 μM, cells were treated with the highest non-cytotoxic concentration of different extracts for 24 h, and glucose was measured after 24 h of compound incubation (Figure 8). All experiments were carried out with at least three replicates. The supernatant of the cells incubated with 5 μM of insulin showed the highest concentration of glucose left in media compared to controls without insulin. The amount of glucose uptake in cells treated with insulin and further exposed to HHQ 50 µM (5.68 ± 0.60 mmol/L) showed statistically significant levels compared to the remaining groups (Figure 8).
Tert-butyl hydroperoxide (t-BHP) was applied as a pro-oxidant in the positive control group (Tert But, 20 µM) and presented a statistical difference in the HepG2/IRM model. t-BHP is known to induce oxidative stress and cell injury, which result from an intracellular increase in the production of ROS, as confirmed by flow cytometry in this study (Figure 9). t-BHP has been used in hepatocyte cultures and liver tissues, and its activity is metabolized to free radical intermediates, resulting in the initiation of lipid peroxidation, a decrease in mitochondrial membrane potential, and changes in mitochondrial membrane integrity [27]. Free radical intermediates generated by t-BHP can subsequently lead to oxidative stress-induced hepatocyte damage. Therefore, t-BHP has often been used to cause oxidative stress injury to in vitro cells, in order to identify antioxidant molecules from natural products [28].

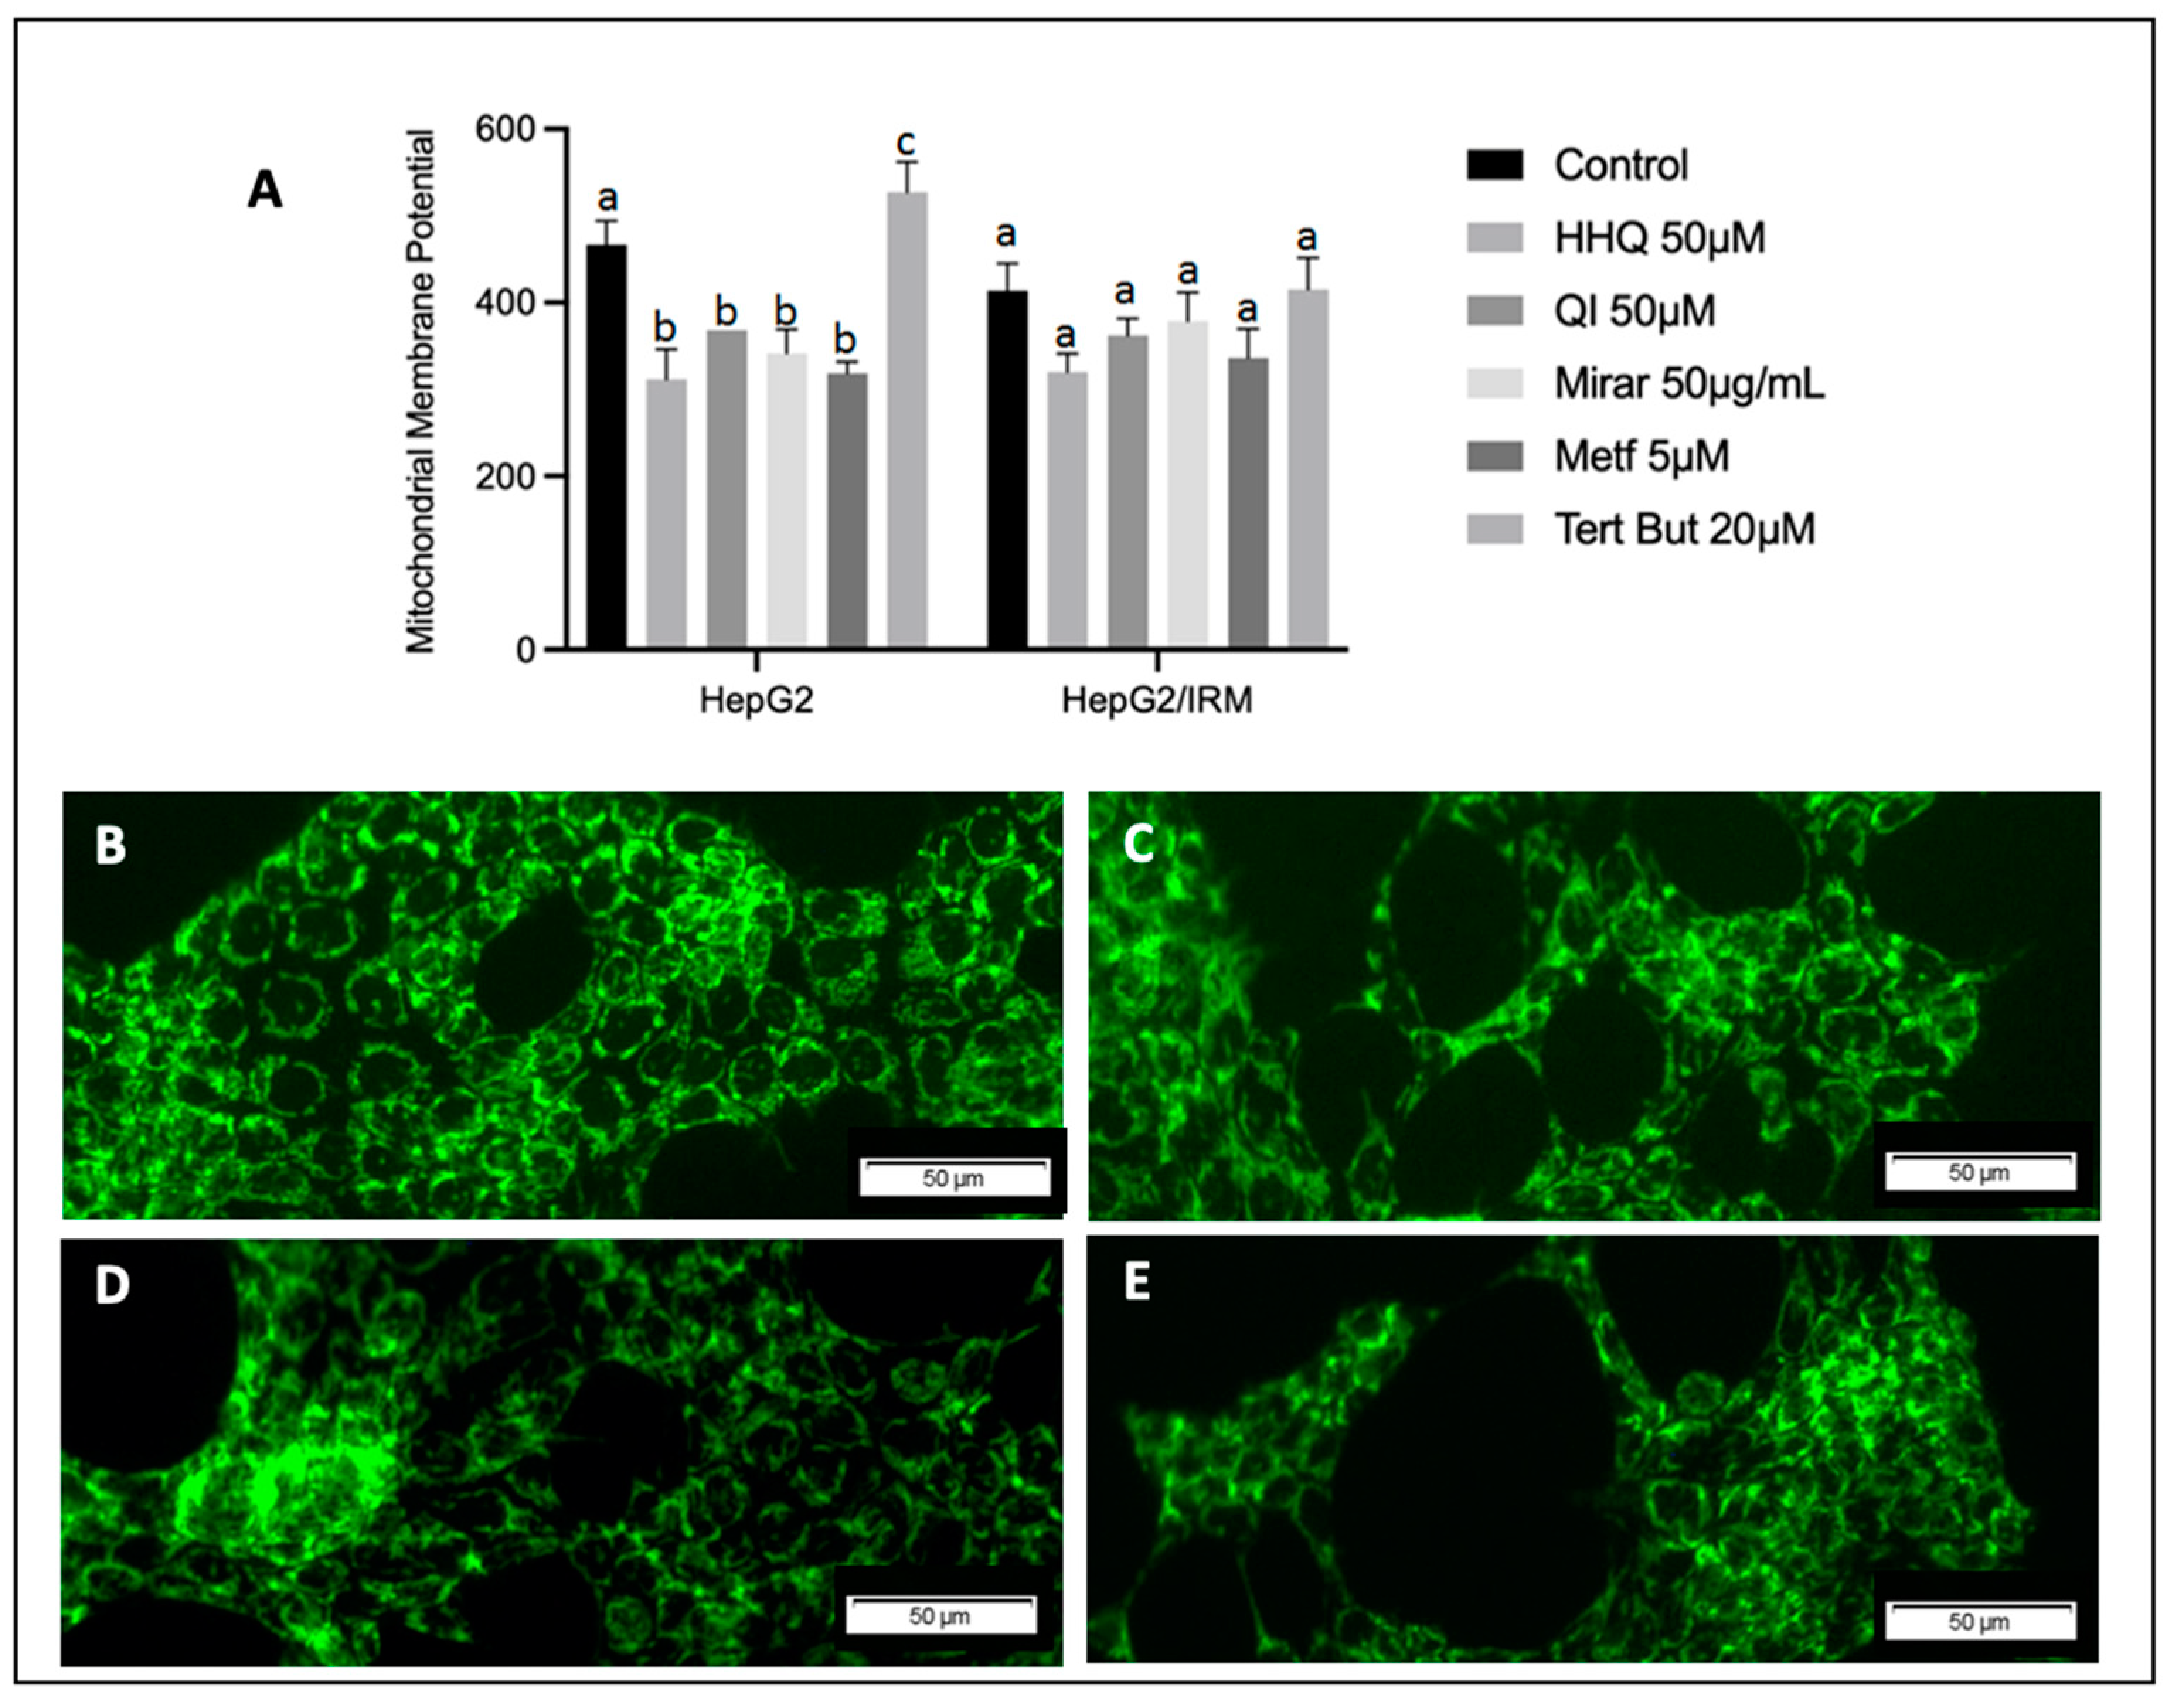
3.6. ROS Activity, Mitochondria Membrane Potential Assay, and ATP Balance

Oxidative stress has been recently recognized as a key mechanism in insulin resistance and is defined by excess endogenous oxidative species. ROS damage plays direct roles in the development and progression of many chronic diseases, including the pathogenesis of insulin resistance and type 2 diabetes [29]. t-BHP was able to induce oxidative stress and significantly increase the production of ROS in both HepG2 and HepG2/IRM groups (Figure 9). As expected, ROS levels were increased in all treatments after insulin exposure. Most importantly, in the HepG2/IRM model, the cells that were exposed to HHQ (50 µM) and QI (50 µM) showed a statistical difference in ROS levels compared to controls.
The redox state of cells is crucial in health and disease equilibrium and is involved in redox-based prevention and therapeutic procedures in metabolic diseases such as inflammatory syndromes, obesity, aging, cardiovascular disease, metabolic syndrome, and diabetes [1,3,30,31]. In this context, cells treated with insulin and further exposed to HHQ (50 µM) and QI (50 µM) were those that showed a higher amount of glucose uptake in cells (Figure 8), and maintained ROS levels lower than those observed in the control group (Figure 9). Mitochondria are one of the main sources of ROS and the major site of ATP production. When levels of glucose are high, mitochondria enhance ROS production and induce oxidative stress and tissue damage as a result [32]. Despite the existence of a variety of origins of ROS, such as nitric oxide synthase, cytochrome p450, xanthine oxidase (XO), endoplasmic reticulum, peroxidases, and cyclooxygenases, mitochondria and NADPH oxidases (NOX) are listed as major sites for ROS production [3].
The assessment of mitochondrial membrane potential in cells can yield the information necessary for the evaluation of their physio-pathological conditions. Type 2 diabetes has been characterized by mitochondrial dysfunction, high production of reactive oxygen species (ROS), and low levels of ATP [33]. The loss of mitochondrial membrane potential often takes place during the imbalance of cell signaling and induction of several diseases [34].
The HepG2 cell line and HepG2/IRM were treated with the positive control t-BHP 20 μM, which showed the highest depolarization rate in mitochondria, compared to other extracts like Mirar 50 μg/mL, HHQ 50 μM, QI 50 μM, and Metf 5 μM. HepG2 and HepG2/IRM cells were stained with DiOC6 dye and the change in fluorescent intensity was assessed by flow cytometry. Statistically significant values were observed after treatment. Cells were also stained with a cationic dye, JC-10, used in the mitochondria membrane potential assay, as shown with green fluorescence (Figure 10). JC-10 is predominately localized in the mitochondria and represents a fluorescent probe for mitochondrial ∆Ψ. This dye exhibits fluorescence emission at two wavelengths and shows cells excited at 488 nm, green fluorescent J-monomers, indicating lost membrane potential after insulin exposition.
Mitochondrial membrane potential is generated as protons are pumped outward from the matrix, a process that depends on substrate utilization and electron transport. Loss of MMP will result from any process wherein protons move back toward the matrix, generating nonspecific proton leaks and interactions with drug or chemical action [6]. In this process, HHQ and other phenolic compounds can act as ubiquinol and help transport electrons in the respiratory chain via the HHQ–HBQ redox pair in the mitochondrial membrane.
Insulin-resistant conditions represent a higher risk of developing type 2 diabetes mellitus (T2DM) and cardiovascular disease compared with subjects with normal insulin sensitivity. The literature points out that metabolic regulation is largely dependent on mitochondria, which play an important role in energy homeostasis by metabolizing nutrients and producing ATP and heat [6]. According to our data, it is possible to observe that ATP values decreased in the insulin resistance model. Importantly, the cells that were exposed to HHQ (50 µM) and QI (50 µM) in the HepG2/IRM model were grouped together with the control, showing no tendency towards a decrease in ATP levels (Figure 11).
Clinical evidence indicates that defects in mitochondrial function may be a primary cause of insulin resistance. Hence, it is difficult to clearly ascertain whether defects in mitochondria occur before or after the onset of insulin resistance [6].
Glucose and lipid metabolism are largely dependent on mitochondria to generate energy in cells. Thereby, when nutrient oxidation is inefficient, the ratio of ATP production/oxygen consumption is low, leading to an increased production of superoxide anions [5]. Our results show a decrease in ATP on HepG2/IRM treated with metformin (5 µM), which may indicate that the extra availability of glucose promoted by metformin can induce less profitable ATP pathways (Figure 11). A possible pathway is promoting anaerobic glycolysis instead of cellular respiration, which explains the reduction in ATP production by the mitochondria. According to Zang et al. (2004) [35], there is biochemical evidence that the effects of metformin on the lipid content of HepG2 cells depend on the activation of AMPK, as the principal mediator of the effects of metformin on lipid biosynthesis, and the elevation of lipids associated with an insulin-resistant state. These statements also corroborate a study from Dykens et al. (2008) [36], suggesting that HepG2 cells accelerate glycolytic flux in a compensatory way, which correspondingly increases lactate efflux. This mechanism requires tissue glucose uptake, so that the desired clinical goal for these drugs of reducing hyperglycemia is achieved.
The molecular and cellular mechanisms of insulin resistance are relevant to understanding the pathogenesis of various diseases. Insulin resistance is characterized by a diminished ability of cells or tissues to respond to physiological levels of insulin [5]. Impaired insulin signaling not only affects insulin-stimulated glucose metabolism in skeletal muscle, but also damages other forms of insulin regulation in diverse tissues, including the liver, the in vitro model used in this study [5].
It has been stated that diabetes and mitochondrial function in non-insulin-sensitive tissues present a glucose uptake metabolism independent of circulating insulin, but that is highly affected by the blood glucose concentration [5]. Hyperglycemia in these insulin-independent tissues appears to generate increased amounts of mitochondrial substrates and increase the propensity for ROS production.

3.7. FOXO1 Expression through Western Blot and Indirect Immunofluorescence Assay

Forkhead box class O (FOXO) proteins are nuclear transcription factors that participate in the regulation of various cellular processes [37]. They have been reported as major intracellular targets of insulin action and contribute to the regulation of gluconeogenic and glycolytic gene expression and nutrient metabolism in the liver [38,39]. One of these proteins, FOXO1, has been shown to interact directly with the DNA binding sites involved in gluconeogenesis and promote glucose production, both in isolated hepatocytes [40] and in transgenic mouse models [39].
The activity of FOXO1 is suppressed by insulin, which could be seen in the control group from the Western blot and immunofluorescence experiments conducted in this study (Figure 12). After insulin incubation and exposure to different treatments, FOXO1 expression significantly decreased in cells treated with hydroxyhydroquinone (HHQ 50 µM), and cells exposed to quassinoid (QI 50 µM) compounds maintained lower expression compared to cells without insulin treatment. Cells treated with miraruira extract (Mirar 50 µg/mL) maintained high levels of FOXO1, despite presenting promising levels of glucose cell uptake (Figure 8) and the lowest levels of ROS from all compounds tested after insulin cell exposure (Figure 9).
Once insulin is presented to cells, it binds to the insulin receptor (IR), and activates serine/threonine kinase (Akt) and phosphorylates FOXO1 proteins, resulting in their translocation from the nucleus to the cytoplasmic compartment [41]. Recent studies have pointed out that the insulin/PI3K/Akt signaling pathway is activated through insulin uptake in cells; this mechanism stimulates glycogen synthesis and inhibits gluconeogenesis in the liver, leading to a reduction in plasma glucose levels [42]. This demonstrates that hepatocytes play a crucial role in the pathogenesis of insulin resistance. Consequently, the HepG2 cell line could provide a valuable tool for identifying drug candidates that target the insulin/PI3K/Akt pathway in the liver [20].
Glucose restoration after the suppression of FOXO1 in HepG2/IRM models has also been reported through in vitro studies, which corroborates our findings [13,43,44,45]. In fact, the cells treated with hydroxyhydroquinone and quassinoid compounds were those that presented a decreased FOXO1 expression and higher levels of glucose cell uptake after treatment (Figure 8). Furthermore, flow cytometry analysis revealed that regular levels of ROS and MMP were maintained for these two groups of compounds in the HepG2/IRM model (Figure 9 and Figure 10). In an interesting way, the same compounds, HHQ and QI, were able to retain ATP levels comparable to the control after insulin exposure (Figure 11). In fact, the reduction in FOXO1 expression for the cells treated with quassinoids (QIs) seems to occur via the inhibition of the cortisol nuclear receptor, since the compound activates the FOXO1 expression cascade to direct the metabolism towards gluconeogenesis.
It has been stated that the insulin-mediated suppression of liver FOXO1 activity plays a critical role in glucose homeostasis and is crucial for the inhibition of hepatic glucose production by insulin [12]. In the literature, it has also been pointed out through in vivo studies that the disruption of FOXO1 restores glucose tolerance in mice [46,47] and that FOXO1 inhibition may even reactivate the ability of insulin to suppress hepatic glucose production in mice in which Akt signaling has been disrupted [15]. This finding suggests that FOXO1 not only mediates the metabolic consequences of liver insulin resistance, but also that hepatic glucose metabolism can be controlled via other insulin signaling pathways when the activity of FoxO1 is disrupted [48].
FOXO1 levels are also shown to be increased and involved in lipid metabolism. The expression of FOXO1 is also activated by cortisol and its binding to the nuclear glucocorticoid receptor, which is the main mechanism of the induction of insulin resistance initiated by stress [49]. Therefore, steroidal compounds with glucocorticoid action, such as the quassinoids presented in this study, can act by competing with the nuclear glucocorticoid receptor to inhibit the production of FOXO1 and induce cellular sensitivity to insulin. These findings offer a novel mechanistic understanding of the beneficial effects of hydroxyhydroquinone and quassinoids on hepatic insulin resistance, to assist in the treatment of insulin resistance and diabetes in the future.

4. Conclusions

The findings presented in this work offer a novel understanding of the beneficial effects of hydroxyhydroquinone and quassinoid compounds against an in vitro hepatic insulin resistance model. Hydroxyhydroquinone was first synthetized for applications unrelated to animal and human health and its effects in the HepG2/IR model are extremely promising. HHQ has a strong redox potential and can act as an ROS scavenger to ameliorate mitochondria activity and modulate ATP generation. The amount of glucose uptake in cells treated with insulin and further exposed to HHQ increased compared to the other conditions tested. Most importantly, ROS and ATP were maintained at relatively stable levels after hydroxyhydroquinone exposition to HepG2/IRM. From the results presented here, HHQ reveals a very favorable metabolic cell response in HepG2/IRM. Next steps will include in vivo studies to evaluate the effects of HHQ on an insulin resistance model, which is associated with metabolic syndrome, type 2 diabetes, and obesity.
The activity of FOXO1 is suppressed by insulin, which could be seen in the control group of the Western blot and immunofluorescence experiments conducted in this study. FOXO1 is reported as a major intracellular target of insulin action and contributes to the regulation of gluconeogenic and glycolytic gene expression and nutrient metabolism in the liver. After insulin incubation and exposure to different treatments, FOXO1 expression significantly decreased in cells treated with hydroxyhydroquinone and cells exposed to quassinoids.
Quassinoids deserve special attention, given their similarities to glucocorticoids, which can act by competing with the nuclear glucocorticoid receptor and inhibit the production of FOXO1. Due to their chemical structure, it is hypothesized that quassinoids may act on a different mechanism than the insulin/PI3K/Akt signaling pathway. Perhaps the mechanism involves nuclear glucocorticoid receptors, inhibiting FOXO1 expression by competing with cortisol. Further investigations are necessary for the validation of such hypotheses.
It is important to understand the mechanisms involved in the activation of FOXO1 and how its function integrally affects the liver and the organism. It is also crucial to track FOXO1 for insulin-regulated signals elsewhere from the hepatic region, as these may interfere with the regulation of hepatic glucose metabolism. Suppressing FOXO1 in the liver is stated to be required for the extrahepatic effects of insulin to be effective in regulating hepatic glucose metabolism [12]. Therefore, in vivo studies with rodents are essential to continue investigating the molecular mechanisms underlying these promising compounds that may contribute to assisting in the treatment of insulin resistance, diabetes, and metabolic syndrome in the future.

Supplementary Materials

The following supporting information can be downloaded at https://www.mdpi.com/article/10.3390/compounds4010002/s1: Figure S1: HRMS spectrum for HHQ compound obtained by ESI-TOF-MS with mode negative ions. Figure S2: 1HNMR spectrum for HHQ obtained in D2O at 300.18 MHz. Figure S3: 13CNMR spectrum for HHQ obtained in D2O at 75.49 MHz. Figure S4: Mass spectrum of P. crenata extract obtained by direct infusion on ESI-TOF MS.

Author Contributions

P.R.d.S. and S.D. carried out the gutting, processing, and extraction of plant material from P. crenata and R. cuspidata, and processed the chemical analysis and treatment of LCMS and HRMS data. P.R.d.S. carried out the synthesis, isolation, and chemical characterization of the HHQ and helped with the writing of the paper. M.R.-E. coordinated and carried out all the biochemical experiments, processing, graph plotting, bibliographic search, and writing of the paper. W.V.d.S., R.F. and F.J.S. helped in the elaboration of the biochemical experiments and in the production and statistical analysis of data. S.M. assisted in granting the material and providing laboratory instrumentation for chemical analyses. A.J.R. assisted in granting research material. All authors have read and agreed to the published version of the manuscript.

Funding

This research received no external funding.

Data Availability Statement

The data presented in this study are available on request from the corresponding author.

Conflicts of Interest

The authors declare no conflicts of interest.

References

  1. Magnani, N.D.; Marchini, T.; Calabró, V.; Alvarez, S.; Evelson, P. Role of Mitochondria in the Redox Signaling Network and Its Outcomes in High Impact Inflammatory Syndromes. Front. Endocrinol. 2020, 11, 568305. [Google Scholar] [CrossRef] [PubMed]
  2. Holmström, K.; Finkel, T. Cellular mechanisms and physiological consequences of redox-dependent signalling. Nat. Rev. Mol. Cell Biol. 2014, 15, 411–421. [Google Scholar] [CrossRef] [PubMed]
  3. Cervantes, G.K.; Llanas-Cornejo, D.; Husi, H. CVD and Oxidative Stress. J. Clin. Med. 2017, 6, 22. [Google Scholar] [CrossRef] [PubMed]
  4. Daiber, A.; Di Lisa, F.; Oelze, M.; Kröller-Schön, S.; Steven, S.; Schulz, E.; Münzel, T. Crosstalk of mitochondria with NADPH oxidase via reactive oxygen and nitrogen species signalling and its role for vascular function. Br. J. Pharmacol. 2017, 174, 1670–1689. [Google Scholar] [CrossRef] [PubMed]
  5. Kim, J.A.; Wei, Y.; Sowers, J.R. Role of mitochondrial dysfunction in insulin resistance. Circ. Res. 2008, 102, 401–414. [Google Scholar] [CrossRef] [PubMed]
  6. Sivitz, W.I.; Yorek, M.A. Mitochondrial dysfunction in diabetes: From molecular mechanisms to functional significance and therapeutic opportunities. Antioxid. Redox Signal. 2010, 12, 537–577. [Google Scholar] [CrossRef]
  7. Teng, W.; Yin, W.; Zhao, L.; Ma, C.; Huang, J.; Ren, F. Resveratrol metabolites ameliorate insulin resistance in HepG2 hepatocytes by modulating IRS-1/AMPK. RSC Adv. 2018, 8, 36034–36042. [Google Scholar] [CrossRef]
  8. Hussain, T.; Tan, B.; Murtaza, G.; Liu, G.; Rahu, N.; Kalhoro, M.S.; Kalhoro, D.H.; Adebowale, T.O.; Mazhar, M.U.; Rehman, Z.U.; et al. Flavonoids and type 2 diabetes: Evidence of efficacy in clinical and animal studies and delivery strategies to enhance their therapeutic efficacy. Pharmacol. Res. 2020, 152, 104629. [Google Scholar] [CrossRef]
  9. Kargl, C.; Arshad, M.; Salman, F.; Schurman, R.C.; Del Corral, P. 11β-hydroxysteroid dehydrogenase type-II activity is affected by grapefruit juice and intense muscular work. Arch. Endocrinol. Metab. 2017, 61, 556–561. [Google Scholar] [CrossRef]
  10. Laikowski, M.M.; Santos, P.R.; Souza, D.M.; Minetto, L.; Girondi, N.; Pires, C.; Alano, G.; Roesch-Ely, M.; Tasso, L.; Moura, S. Rourea cuspidata: Chemical composition and hypoglycemic activity. Asian Pac. J. Trop. Biomed. 2017, 7, 712–718. [Google Scholar] [CrossRef]
  11. Mauro, A.L.Q.S. Study of the hypoglicemic activity of the tea of the wood of Quassia-do-Brasil, Picrasma crenata (Vell.) Engl. in mice and rats. Vig. Sanit. Debate 2015, 3, 116–122. [Google Scholar]
  12. Sullivan, I.; Zhang, W.; Wasserman, D.; Liew, C.W.; Liu, J.; Paik, J.; DePinho, R.A.; Stolz, D.B.; Kahn, C.R.; Schwartz, M.W.; et al. FoxO1 integrates direct and indirect effects of insulin on hepatic glucose production and glucose utilization. Nat. Commun. 2015, 6, 7079. [Google Scholar] [CrossRef] [PubMed]
  13. Zhang, H.; Ge, Z.; Tang, S.; Meng, R.; Bi, Y.; Zhu, D. Erythropoietin ameliorates PA-induced insulin resistance through the IRS/AKT/FOXO1 and GSK-3β signaling pathway, and inhibits the inflammatory response in HepG2 cells. Mol. Med. Rep. 2017, 16, 2295–2301. [Google Scholar] [CrossRef] [PubMed]
  14. Humbarger; Thomas, S.; Matthew, M. United States Patent. US Patent 10,065,977 B2, 4 September 2018.
  15. Cardoso, M.L.C.; Kamei, M.S.; Nunes, R.F.; Lazeri, N.S.; Neto, J.R.S.; Novello, C.R.; Bruschi, M.L. Development and Validation of an HPLC Method for Analysis of Picrasma crenata. J. Liq. Chromatogr. Relat. Technol. 2008, 1, 72–79. [Google Scholar] [CrossRef]
  16. Kheirollahzadeh, F.; Eftekhari, E.; Ghollasi, M.; Behzadi, P. Anti-hyperglycemic effects of Eryngium billardierei F. Delaroche extract on insulin-resistance HepG2 cells in vitro. Mol. Bio. Rep. 2022, 49, 3401–3411. [Google Scholar] [CrossRef] [PubMed]
  17. Frozza, C.O.D.S.; Santos, D.A.; Rufatto, L.C.; Minetto, L.; Scariot, F.J.; Echeverrigaray, S.; Pich, C.T.; Moura, S.; Padilha, F.F.; Borsuk, S.; et al. Antitumor activity of Brazilian red propolis fractions against Hep-2 cancer cell line. Biomed. Pharmacother. 2017, 91, 951–963. [Google Scholar] [CrossRef] [PubMed]
  18. Zhao, S.; Kanno, Y.; Li, W.; Sasaki, T.; Zhang, X.; Wang, J.; Cheng, M.; Koike, K.; Nemoto, K.; Li, H. Identification of Picrasidine C as a Subtype-Selective PPARα Agonist. J. Nat. Prod. 2016, 79, 3127–3133. [Google Scholar] [CrossRef] [PubMed]
  19. Paim, L.F.N.A.; Santos, P.R.; Toledo, C.A.P.; Minello, L.; Paz, J.R.L.; Souza, V.C.; Salvador, M.; Moura, S. Four almost unexplored species of Brazilian Connarus (Connaraceae): Chemical composition by ESI-QTof-MS/MS-GNPS and a pharmacologic potential. Phytochem. Anal. 2022, 33, 286–302. [Google Scholar] [CrossRef]
  20. Yudhani, R.D.; Sari, Y.; Nugrahaningsih, D.A.A.; Sholikhah, E.N.; Rochmanti, M.; Purba, A.K.R.; Khotimah, H.; Nugrahenny, D.; Mustofa, M. In Vitro Insulin Resistance Model: A Recent Update. J. Obes. 2023, 2023, 1964732. [Google Scholar] [CrossRef]
  21. Azimian, L.; Weerasuriya, N.M.; Munasinghe, R.; Song, S.; Lin, C.Y.; You, L. Investigating the effects of Ceylon cinnamon water extract on HepG2 cells for Type 2 diabetes therapy. Cell Biochem. Funct. 2023, 41, 254–267. [Google Scholar] [CrossRef]
  22. Zhu, X.; Yan, H.; Xia, M.; Chang, X.; Xu, X.; Wang, L.; Sun, X.; Lu, Y.; Bian, H.; Li, X.; et al. Metformin attenuates triglyceride accumulation in HepG2 cells through decreasing stearyl-coenzyme A desaturase 1 expression. Lipids Health Dis. 2018, 17, 114. [Google Scholar] [CrossRef] [PubMed]
  23. Jiang, H.; Ma, Y.; Yan, J.; Liu, J.; Li, L. Geniposide promotes autophagy to inhibit insulin resistance in HepG2 cells via P62/NF-κB/GLUT-4. Mol. Med. Rep. 2017, 16, 7237–7244. [Google Scholar] [CrossRef] [PubMed]
  24. Fan, C.; Liang, W.; Wei, M.; Gou, X.; Han, S.; Bai, J. Effects of D-Chiro-Inositol on Glucose Metabolism in db/db Mice and the Associated Underlying Mechanisms. Front. Pharmacol. 2020, 11, 354. [Google Scholar] [CrossRef] [PubMed]
  25. Zhu, Y.X.; Hu, H.Q.; Zuo, M.L.; Mao, L.; Song, G.L.; Li, T.M.; Dong, L.C.; Yang, Z.B.; Ali Sheikh, M.S. Effect of oxymatrine on liver gluconeogenesis is associated with the regulation of PEPCK and G6Pase expression and AKT phosphorylation. Biomed. Rep. 2021, 1, 56. [Google Scholar] [CrossRef] [PubMed]
  26. Giri, B.; Dey, S.; Das, T.; Sarkar, M.; Banerjee, J.; Dash, S.K. Chronic hyperglycemia mediated physiological alteration and metabolic distortion leads to organ dysfunction, infection, cancer progression and other pathophysiological consequences: An update on glucose toxicity. Biomed. Pharmacother. 2018, 107, 306–328. [Google Scholar] [CrossRef] [PubMed]
  27. Tsai, T.H.; Yu, C.H.; Chang, Y.P.; Lin, Y.T.; Huang, C.J.; Kuo, Y.H.; Tsai, P.J. Protective Effect of Caffeic Acid Derivatives on tert-Butyl Hydroperoxide-Induced Oxidative Hepato-Toxicity and Mitochondrial Dysfunction in HepG2 Cells. Molecules 2017, 22, 702. [Google Scholar] [CrossRef] [PubMed]
  28. Park, C.L.; Kim, J.H.; Jeon, J.S.; Lee, J.H.; Zhang, K.; Guo, S.; Lee, D.H.; Gao, E.M.; Son, R.H.; Kim, Y.M.; et al. Protective Effect of Alpinia oxyphylla Fruit against tert-Butyl Hydroperoxide-Induced Toxicity in HepG2 Cells via Nrf2 Activation and Free Radical Scavenging and Its Active Molecules. Antioxidants 2022, 11, 1032. [Google Scholar] [CrossRef]
  29. Hurrle, S.; Hsu, W.H. The etiology of oxidative stress in insulin resistance. Biomed. J. 2017, 40, 257–262. [Google Scholar] [CrossRef]
  30. Almeida, C.; Monteiro, C.; Silvestre, S. Inhibitors of 11β-Hydroxysteroid Dehydrogenase Type 1 as Potential Drugs for Type 2 Diabetes Mellitus—A Systematic Review of Clinical and In Vivo Preclinical Studies. Sci. Pharm. 2021, 89, 5. [Google Scholar] [CrossRef]
  31. Korac, B.; Kalezic, A.; Pekovic-Vaughan, V.; Korac, A.; Jankovic, A. Redox changes in obesity, metabolic syndrome, and diabetes. Redox Biol. 2021, 42, 101887. [Google Scholar] [CrossRef]
  32. Szendroedi, J.; Phielix, E.; Roden, M. The role of mitochondria in insulin resistance and type 2 diabetes mellitus. Nat. Rev. Endocrinol. 2011, 8, 92–103. [Google Scholar] [CrossRef]
  33. Rovira-Llopis, S.; Bañuls, C.; Diaz-Morales, N.; Hernandez-Mijares, A.; Rocha, M.; Victor, V.M. Mitochondrial dynamics in type 2 diabetes: Pathophysiological implications. Redox Biol. 2017, 11, 637–645. [Google Scholar] [CrossRef]
  34. Elefantova, K.; Lakatos, B.; Kubickova, J.; Sulova, Z.; Breier, A. Detection of the Mitochondrial Membrane Potential by the Cationic Dye JC-1 in L1210 Cells with Massive Overexpression of the Plasma Membrane ABCB1Drug Transporter. Int. J. Mol. Sci. 2018, 19, 1985. [Google Scholar] [CrossRef]
  35. Zang, M.; Zuccollo, A.; Hou, X.; Nagata, D.; Walsh, K.; Herscovitz, H.; PBrecher, P.; Ruderman, N.B.; Cohen, R.A. AMP-activated Protein Kinase Is Required for the Lipid-lowering Effect of Metformin in Insulin-resistant Human HepG2 Cells. J. Biol. Chem. 2004, 279, 47898–47905. [Google Scholar] [CrossRef]
  36. Dykens, J.A.; Jamieson, J.; Marroquin, L.; Nadanaciva, S.; Billis, P.A.; Will, Y. Biguanide-induced mitochondrial dysfunction yields increased lactate production and cytotoxicity of aerobically-poised HepG2 cells and human hepatocytes in vitro. Toxicol. Appl. Pharmacol. 2008, 233, 203–210. [Google Scholar] [CrossRef]
  37. Bielka, W.; Przezak, A. The role of FOXO transcription factors in the development of type 2 diabetes and related potential therapeutic possibilities. Clin. Diabetol. 2021, 10, 290–298. [Google Scholar] [CrossRef]
  38. Zhang, W.; Patil, S.; Chauhan, B.; Guo, S.; Powell, D.R.; Le, J.; Klotsas, A.; Matika, R.; Xiao, X.; Franks, R.; et al. FoxO1 regulates multiple metabolic pathways in the liver: Effects on gluconeogenic, glycolytic, and lipogenic gene expression. J. Biol. Chem. 2006, 281, 10105–10117. [Google Scholar] [CrossRef]
  39. Zhang, K.; Li, L.; Qi, Y.; Zhu, X.; Gan, B.; DePinho, R.A.; Averitt, T.; Guo, S. Hepatic suppression of Foxo1 and Foxo3 causes hypoglycemia and hyperlipidemia in mice. Endocrinology 2012, 153, 631–646. [Google Scholar] [CrossRef]
  40. Puigserver, P.; Rhee, J.; Donovan, J.; Walkey, C.J.; Yoon, J.C.; Oriente, F.; Kitamura, Y.; Altomonte, J.; Dong, H.; Accili, D.; et al. Insulin-regulated hepatic gluconeogenesis through FOXO1–PGC-1α interaction. Nature 2003, 423, 550–555. [Google Scholar] [CrossRef]
  41. Brunet, A.; Bonni, A.; Zigmond, M.J.; Lin, M.Z.; Juo, P.; Hu, L.S.; Anderson, M.J.; Arden, K.C.; Blenis, J.; Greenberg, M.E. Akt promotes cell survival by phosphorylating and inhibiting a Forkhead transcription factor. Cell 1999, 96, 857–868. [Google Scholar] [CrossRef]
  42. Dou, Z.; Liu, C.; Feng, X.; Xie, Y.; Yue, H.; Dong, J.; Zhao, Z.; Chen, G.; Yang, J. Camel whey protein (CWP) ameliorates liver injury in type 2 diabetes mellitus rats and insulin resistance (IR) in HepG2 cells via activation of the PI3K/Akt signaling pathway. Food Funct. 2022, 13, 255–269. [Google Scholar] [CrossRef] [PubMed]
  43. Zhang, Y.; Yan, L.S.; Ding, Y.; Cheng, B.C.Y.; Luo, G.; Kong, J.; Liu, T.H.; Zhang, S.F. Edgeworthia gardneri (Wall.) Meisn. Water Extract Ameliorates Palmitate Induced Insulin Resistance by Regulating IRS1/GSK3β/FoxO1 Signaling Pathway in Human HepG2 Hepatocytes. Front. Pharmacol. 2020, 10, 1666. [Google Scholar] [CrossRef] [PubMed]
  44. Chen, L.; Sun, X.; Xiao, H.; Xu, F.; Yang, Y.; Lin, Z.; Chen, Z.; Quan, S.; Huang, H. PAQR3 regulates phosphorylation of FoxO1 in insulin-resistant HepG2 cells via NF-κB signaling pathway. Exp. Cell Res. 2019, 381, 301–310. [Google Scholar] [CrossRef] [PubMed]
  45. Rong Guo, X.; Li Wang, X.; Chen, Y.; Hong Yuan, Y.; Mei Chen, Y.; Ding, Y.; Fang, J.; Jiao Bian, L.; Sheng Li, D. ANGPTL8/betatrophin alleviates insulin resistance via the Akt-GSK3β or Akt-FoxO1 pathway in HepG2 cells. Exp. Cell Res. 2016, 345, 158–167. [Google Scholar] [CrossRef] [PubMed]
  46. Dong, X.C.; Copps, K.D.; Guo, S.; Li, Y.; Kollipara, R.; DePinho, R.A.; White, M.F. Inactivation of hepatic Foxo1 by insulin signaling is required for adaptive nutrient homeostasis and endocrine growth regulation. Cell Metab. 2008, 8, 65–76. [Google Scholar] [CrossRef] [PubMed]
  47. Lu, M.; Wan, M.; Leavens, K.F.; Chu, Q.; Monks, B.R.; Fernandez, S.; Ahima, R.S.; Ueki, K.; Kahn, C.R.; Birnbaum, M.J. Insulin regulates liver metabolism in vivo in the absence of hepatic Akt and Foxo1. Nat. Med. 2012, 18, 388–395. [Google Scholar] [CrossRef]
  48. Cheng, Z.; White, M.F. The AKTion in non-canonical insulin signaling. Nat. Med. 2012, 18, 351–353. [Google Scholar] [CrossRef]
  49. Liu, Y.Z.; Peng, W.; Chen, J.K.; Su, W.J.; Yan, W.J.; Wang, Y.X.; Jiang, C.L. FoxO1 is a critical regulator of hepatocyte lipid deposition in chronic stress mice. PeerJ 2019, 7, 7668. [Google Scholar] [CrossRef]
Figure 2. Extracted chromatograms of quassia extract analysis by LC-MS. Furocoumarins are highlighted in red, flavonoid in black, β-carboline alkaloids in green, quassinoids in blue, and integral base peak chromatogram in dashed orange.
Compounds 04 00002 g002
Figure 3. Chemical compounds detected in P. crenata extract by HPLC-ESI-MS.
Compounds 04 00002 g003
Figure 4. ESI-TOF-MS spectrum of R. cuspidate for positive ions.
Compounds 04 00002 g004
Figure 5. Main compounds obtained from ESI-TOF-MS analysis of R. cuspidata.
Compounds 04 00002 g005
Figure 6. MTT assay: Activity of isolated compounds and extracts against HepG2 cell line incubated for 24 h. A selection of the highest non-cytotoxic concentrations of different extracts was performed. Arrows indicate the selection of compounds used for further experiments. The data are presented as mean ± SD (n = 3). One-way analysis of variance (ANOVA) test was used for multiple comparisons. * p ≤ 0.05 vs. control group.
Compounds 04 00002 g006
Figure 7. MTT assay: activity of isolated compounds and extracts against HepG2 and HepG2/IRM cell line incubated for 24 h. A selection of the highest non-cytotoxic concentrations of different extracts was performed. The data are presented as mean ± SD (n = 3). One-way analysis of variance (ANOVA) test was used for multiple comparisons, followed by Tukey. p ≤ 0.05; letters represent differences between groups.
Compounds 04 00002 g007
Figure 8. Glucose uptake concentration after treatment of HepG2/IRM cells with different extracts exposed for 24 h compared to untreated HepG2/IRM cells. A decrease in glucose levels in the medium (mmol/L) is reflected in the statistically significant increase in glucose uptake in cells with 5 μM of insulin in samples exposed to 50 μM of HHQ. One-way analysis of variance (ANOVA) test was used for multiple comparisons, followed by Tukey. p ≤ 0.05; letters represent differences between groups.
Compounds 04 00002 g008
Figure 9. Effects of different ROS level treatments on HepG2 and HepG2/IRM cells. (A) Cells were analyzed by flow cytometry using the redox-sensitive fluorescent dye DCFH-DA as a marker of ROS production. Note that the insulin-resistant cell model (HepG2/IRM) increased ROS levels in most of the analyzed conditions compared to HepG2 without insulin induction. Images of DCFH-DA fluorescence on HepG2 (B) and HepG2/IRM (C) control groups. The data are presented as mean ± SD (n = 2). One-way analysis of variance (ANOVA) test was used for multiple comparisons, followed by Tukey. p ≤ 0.05; letters represent differences between groups.
Compounds 04 00002 g009
Figure 10. Mitochondria membrane potential assay. (A) Mitochondria activity was monitored through the incubation of 3,3′-dihexyloxacarbocyanine iodide DiOC6 stain through flow cytometry. (BE) Representative images of HepG2 cell line excited at 488 nm, green fluorescent J-monomers, using a mitochondria membrane potential kit with JC-10 dye through in situ evaluation. (B,D) Control samples at the left side of the figure, without insulin (B) and with insulin (D); HepG2 cells treated with t-BHP 100 μM at the right side of the figure, without insulin (C) and with insulin (E). Note that the insulin-resistant cell model presents a higher depolarization pattern in both control (D) and t-BHP-treated cells (E) HepG2/IRM) compared to HepG2 without insulin induction (B,C). One-way analysis of variance (ANOVA) test was used for multiple comparisons, followed by Tukey. p ≤ 0.05; letters represent differences between groups.
Compounds 04 00002 g010
Figure 11. Effects of different compounds on adenosine triphosphate (ATP) levels using Luminescent system after 24 h treatment. Results given in relative light units (RLU). All samples presented a decrease in ATP after insulin exposure. One-way analysis of variance (ANOVA) test was used for multiple comparisons, followed by Tukey. p ≤ 0.05; letters represent differences between groups.
Compounds 04 00002 g011
Figure 12. FOX01 expression through Western blot and indirect immunofluorescence assay in HepG2 and HepG2/IRM cells. (A) Western blot analysis of FOXO1 and b-actin; (B) densitometric analysis of Western blot normalized to b-actin of control using Image J 1.53t; (C) indirect immunofluorescence using anti-FOXO1. One-way analysis of variance (ANOVA) test was used for multiple comparisons, followed by Tukey. p ≤ 0.05; letters represent differences between groups.
Compounds 04 00002 g012
Table 1. Chromatographic and chemical characterization data of hydro ethanolic extract of P. crenata stem.
Peak (min)ExperimentalTheoretical MassError (ppm)Compound
2.6219.0250219.028817.35Dihydroxy furocoumarin
2.6203.0504203.033981.27Hydroxy furocoumarin
2.7381.0775381.081610.76Dihydroxy furocoumarin glycoside
8.7268.0991268.117970.12(6,7-Dimethoxy-4-coumaryl) alanine
10.9377.0805377.086716.44Limocitrol
13.1365.1899365.195916.43Amarolide
13.8393.1879393.19087.376-hydroxy picrasin B
14.9377.1932377.19597.16Picrasin B
15.7393.1878393.19087.63Picraqualide C
16.3435.1976435.20138.5Picraqualide D
16.6241.0935241.097215.34Picrasidine 1
18.6379.2090379.21156.59Nigakilactone A
19.0379.2090379.21156.59Iso Nigakilactone A
19.5389.1932389.19596.94Quassin
20.0437.2120437.217011.43Picraqualide A
20.9437.2121437.217011.21Iso Picraqualide A
22.5387.1038387.10749.30Cleomiscosin A
23.1340.1597340.154315.87Clausamine E
25.1377.1878377.195921.47Parain
25.4413.1892413.193510.4Neoquassin
Disclaimer/Publisher’s Note: The statements, opinions and data contained in all publications are solely those of the individual author(s) and contributor(s) and not of MDPI and/or the editor(s). MDPI and/or the editor(s) disclaim responsibility for any injury to people or property resulting from any ideas, methods, instructions or products referred to in the content.

