Article

Sodium-Doped Carbon Dots as Fluorescent Sensor for Highly Selective Detection of TNP Explosives in the Environment

Shaanxi Key Laboratory of Chemical Reaction Engineering, College of Chemistry and Chemical Engineering, Yan’an University, Yan’an 716000, China
*
Author to whom correspondence should be addressed.
Nanomanufacturing 2025, 5(4), 16; https://doi.org/10.3390/nanomanufacturing5040016
Submission received: 30 July 2025 / Revised: 11 October 2025 / Accepted: 16 October 2025 / Published: 23 October 2025

Abstract

Given the environmental hazards of 2,4,6-trinitrophenol (TNP) and the limitations of existing detection methods, sodium-doped fluorescent carbon dots (Na-CDs) were successfully synthesized via a one-step hydrothermal method using citric acid and ascorbic acid as carbon sources. Compared with undoped carbon quantum dots, Na-CDs exhibited nearly identical surface functional groups but significantly enhanced fluorescence stability and markedly improved selective responsiveness toward TNP. Accordingly, a Na-CD-based fluorescent probe was developed for the highly selective detection of TNP. Results demonstrated a good linear relationship between the relative fluorescence intensity change (F0F)/F0 and TNP concentration ranging from 7 × 10⁻⁷ to 2 × 10⁻⁵ mol/L, with a detection limit of 3.5 × 10⁻⁸ mol/L. When applied to detect TNP in local river water samples, the method achieved recoveries of 95.40–104.0%, confirming its reliability for real-world environmental sample analysis. This study develops a novel, sensitive, and highly selective approach for monitoring TNP in environmental systems.

1. Introduction

With the rapid advancement of industrialization, the variety and complexity of synthetic organic compounds continue to increase. These chemicals enter aquatic systems through multiple pathways during production, transportation, and usage, leading to increasingly complex compositions of water pollutants. Recent monitoring data reveal the widespread presence of various organic contaminants in surface waters, including phenolic compounds, petroleum hydrocarbons, aromatic hydrocarbons, nitrobenzene derivatives, organic pesticides, and surfactants. The pervasive existence of these substances poses emerging environmental challenges to aquatic ecosystems and human health.
TNP, also known as picric acid, is a highly explosive and toxic nitroaromatic compound widely used in military explosives, fireworks, dyes, and the pharmaceutical industry. Due to its environmental persistence and potential carcinogenicity, TNP poses significant risks to aquatic ecosystems and human health, even at trace concentrations [1,2,3]. Consequently, the development of sensitive and selective methods for TNP detection in water systems is of great importance for environmental monitoring and public safety.
Traditional analytical techniques for TNP detection, such as high-performance liquid chromatography (HPLC) [4] and electrochemical methods [5], often suffer from limitations including expensive instrumentation, time-consuming procedures, and complex sample pretreatment. In contrast, fluorescence analysis has emerged as a promising alternative due to its high sensitivity, rapid response, cost-effectiveness, and suitability for real-time monitoring [6,7,8]. Compared with other fluorescent probes (such as organic small molecules or polymers), carbon dots (CDs) have attracted extensive attention due to their excellent photostability, low toxicity, fluorescence tunability, and high biocompatibility [9,10,11]. These advantages make CDs an ideal choice for constructing highly efficient fluorescent probes for the detection of nitrobenzene derivatives. For instance, N-CQDs selectively detect 2,4, 6-trinitrotoluene (TNT), with a detection limit of up to 30 nM [12]. The carbon dots based on pomegranate leaves selectively detect TNP through the internal rate effect, with a detection limit of 0.0620 μM [13]. A novel luminescent sensor based on amine-functionalized CdSe CQD polymerization and pairing has been successfully applied to the detection of dinitrotoluene (DNT) and TNT in solution, with LODs of 30.1 and 40.7 μM, respectively [14]. However, most existing fluorescent sensors for TNP still face challenges, including interference from similar nitroaromatic compounds and insufficient sensitivity in complex environmental matrices.
To address these issues, this study proposes a novel Na-CD-based fluorescent probe with enhanced selectivity and sensitivity for TNP detection in aqueous environments. The designed probe takes advantage of the strong electron-withdrawing property of TNP and promotes effective fluorescence dynamic quenching through the electron transfer mechanism, as shown in Figure 1. This approach not only improves detection accuracy but also offers a simple, rapid, and eco-friendly solution for monitoring TNP contamination in water systems.

2. Experimental Procedure

2.1. Materials and Instruments

Materials: The citric acid and sodium nitrate used in the experiment were purchased from Tianjin Beilian Fine Chemicals Company (Tianjin, China). The ascorbic acid was obtained from Tianjin Jindong Tianzheng Fine Chemical Reagent Factory (Tianjin, China). Ethanol and 2,4,6-trinitrophenylphenol were sourced from Shanghai Aladdin Reagent Company (Shanghai, China). All reagents were of analytical grade, and ultrapure water was used throughout the experiments.
Instruments: To characterize the structure and properties of the synthesized Na-CDs, we employed multiple analytical techniques. Optical absorption properties were analyzed using a UV-2550 UV-Vis spectrophotometer (Shimadzu, Kyoto, Japan). Fluorescence spectra were measured with an LS-55 fluorescence spectrophotometer (PerkinElmer, Waltham, MA, USA). Surface chemistry was investigated through FTIR spectroscopy (IR Prestige-21, Shimadzu, Kyoto, Japan) and X-ray photoelectron spectroscopy (ESCALAB 250XI, Thermo Fisher Scientific, Waltham, MA, USA). Crystalline structures were examined by X-ray diffraction (XRD-7000, Shimadzu, Kyoto, Japan). Morphology and microstructure were characterized using transmission electron microscopy (JEM-F200 TEM, JEOL, Tokyo, Japan).

2.2. Preparation of Na-CDs

The Na-CDs were synthesized via a one-step hydrothermal method. In a typical procedure, 0.60 g of citric acid, 0.50 g of ascorbic acid, and 0.12 g of sodium nitrate were precisely weighed and dissolved in 30 mL of deionized water in a beaker. The homogeneous solution was then transferred into a 50 mL Teflon-lined autoclave and maintained at 180 °C for 8 h. After cooling to room temperature naturally, the resulting solution was centrifuged at 12,000 rpm for 10 min to remove precipitates. The supernatant was further filtered through a 0.22 μm membrane filter, and the filtrate was stored at 4 °C for subsequent use. The Na-CDs used in the experiment were all in solution and diluted 400 times. For characterization purposes, solid samples were obtained by freeze-drying the filtered solution under vacuum.

2.3. Study on the Fluorescence Sensing of TNP

When quantitatively detecting TNP, 0.40 mL of the Na-CD solution diluted 400 times was first accurately transferred into a 10.00 mL colorimetric tube. Then, TNP solutions of different concentrations (or a certain volume of water sample) were added. Finally, the solution was diluted to the 10 mL mark using a 1:1 (V/V) ethanol/water mixture and shaken well. After the solution reacted at room temperature for 10 min, the fluorescence intensity of the system at the maximum emission wavelength of 427 nm was measured at the optimal excitation wavelength of 350 nm. The observed relative change in fluorescence intensity, expressed as (F0F)/F0, showed a good linear relationship with the concentration of TNP.

3. Results and Discussion

3.1. Characterization of Na-CDs

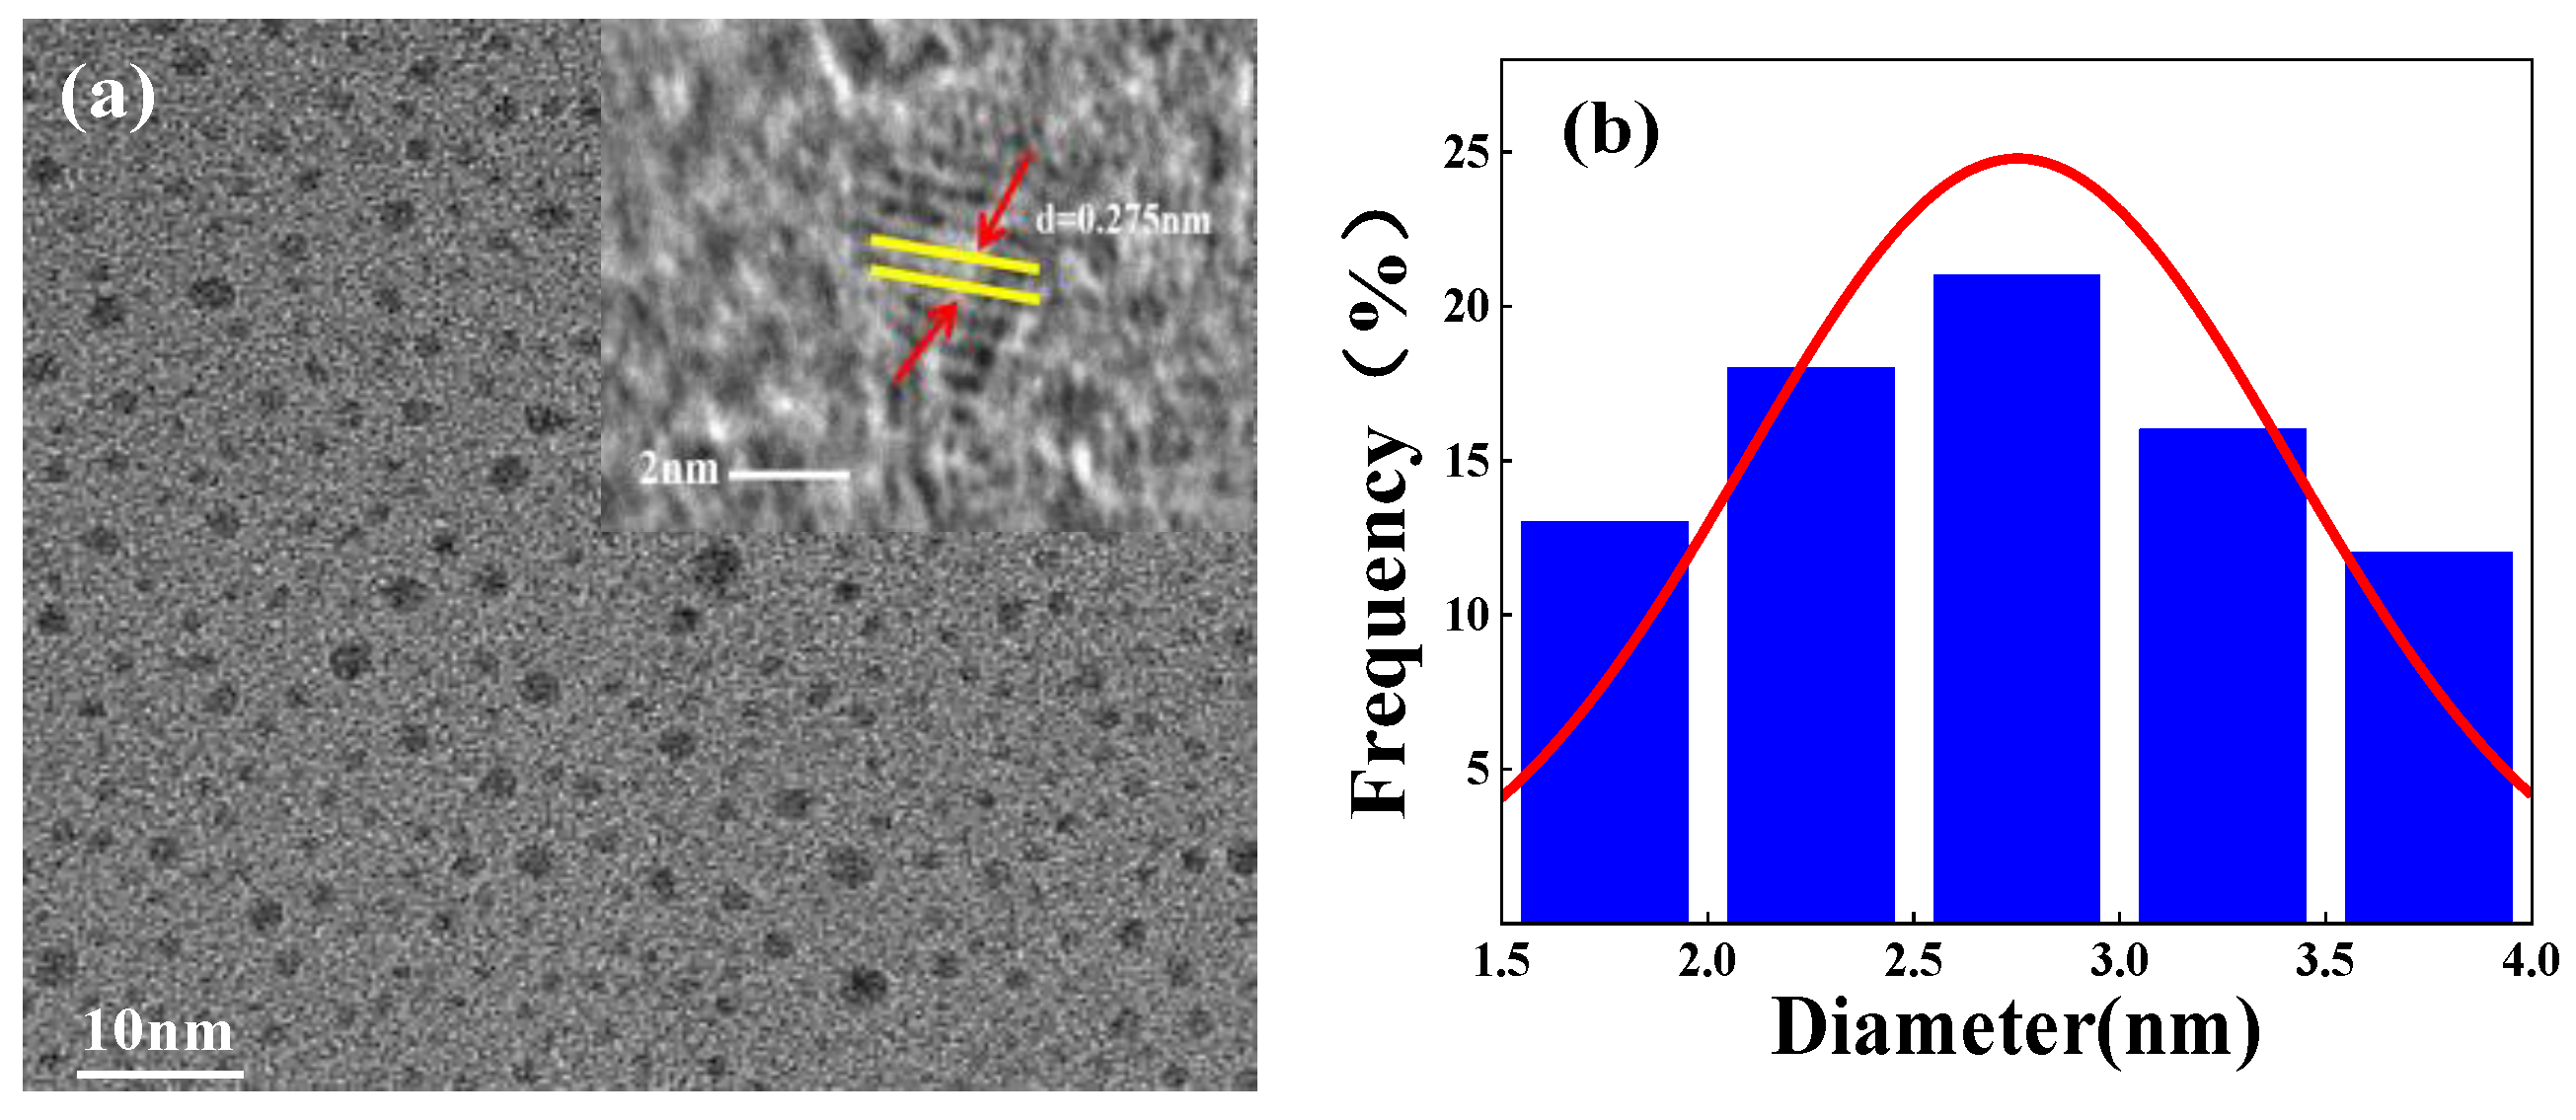
The morphology and microstructure of the as-synthesized Na-CDs were characterized using TEM, as shown in Figure 2a. The TEM images reveal that the Na-CDs exhibit a quasi-spherical nanoparticle morphology with a relatively uniform size distribution. The particle diameters predominantly range from 1.5 to 4.0 nm, with an average size of approximately 2.7 nm (Figure 2b). Furthermore, well-defined lattice fringes with an interplanar spacing of about 0.275 nm are clearly observed in the high-resolution TEM images (insets: Figure 2a). This value corresponds to the typical d-spacing of the (002) plane of graphene or graphitic carbon, indicating that the synthesized Na-CDs possess good crystallinity and share the graphitic structure commonly found in carbon-based quantum dots [15].
The broad diffraction peak observed in the XRD pattern within the 20–40° range corroborates the TEM results, collectively revealing the nanocrystalline/amorphous composite structure of the Na-CDs. This broad feature indicates that the material possesses short-range ordering originating from sp2 carbon clusters (corresponding to the graphite (002) plane), while the long-range periodicity is disrupted due to the ultra-small nanocrystalline size and the presence of surface functional groups or a disordered carbon matrix, which is characteristic of typical carbon quantum dots [16].
The surface functional groups of Na-CDs and undoped CDs were analyzed by Fourier-transform infrared (FTIR) spectroscopy. As illustrated in Figure S2, the types of surface functional groups remained consistent after doping. The characteristic absorption peaks at 1084 cm−1, 1399 cm−1, 1673 cm−1, and 3428 cm−1 were assigned to the stretching vibrations of C-O-C, C-C, C=O, and O-H bonds [17], respectively. These results demonstrate that sodium doping did not alter the diversity of surface functional groups on the CDs, implying that sodium ions were likely embedded within the carbon core structure rather than interacting with surface groups [18]. This observation supports the hypothesis that sodium incorporation primarily occurs through structural integration rather than surface modification.
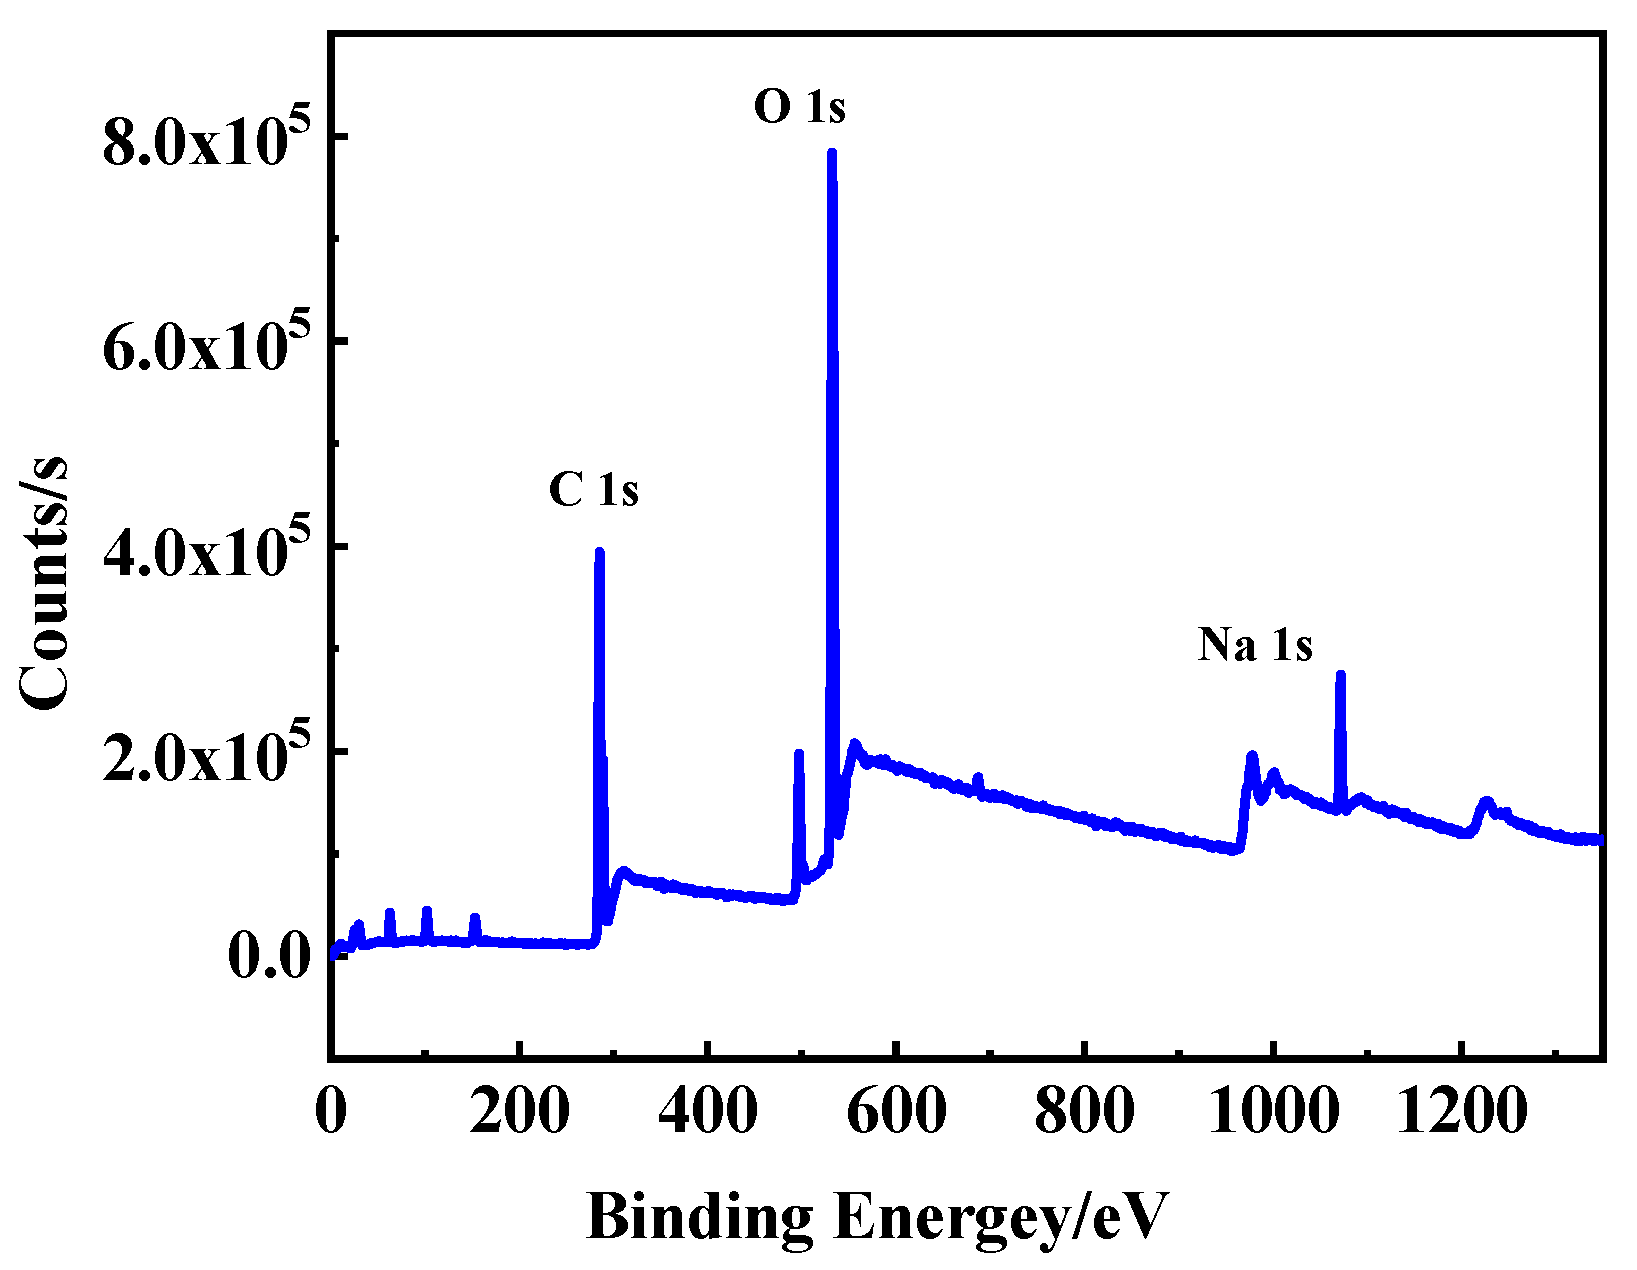
The composition of Na-CDs was analyzed using X-ray photoelectron spectroscopy (XPS). Figure 3 displays the XPS survey spectrum of Na-CDs, revealing the predominant elements as carbon (C, 58.39%), oxygen (O, 37.86%), and sodium (Na, 3.10%). The high-resolution C1s spectrum in Figure S3a exhibits three characteristic peaks at 284.54 eV, 286.21 eV, and 288.63 eV, corresponding to C-C, C-O, and C=O bonds, respectively [11]. Figure S3b presents the O1s spectrum with two resolved peaks at 531.88 eV and 533.05 eV, attributed to C=O and C-OH/C-O-C groups [19]. Notably, distinct peaks observed in the Na1s (1071.54 eV) spectra (Figure S3c) confirm the successful incorporation of sodium into the Na-CD structure [20]. These XPS findings corroborate the FTIR results, collectively demonstrating that Na-CDs consist of C, O, and Na elements with surface functional groups primarily including C-O-C, C-C, C=O, and hydrophilic O-H moieties. This unique composition endows Na-CDs with excellent water solubility.

3.2. Optical Properties of Na-CQDs

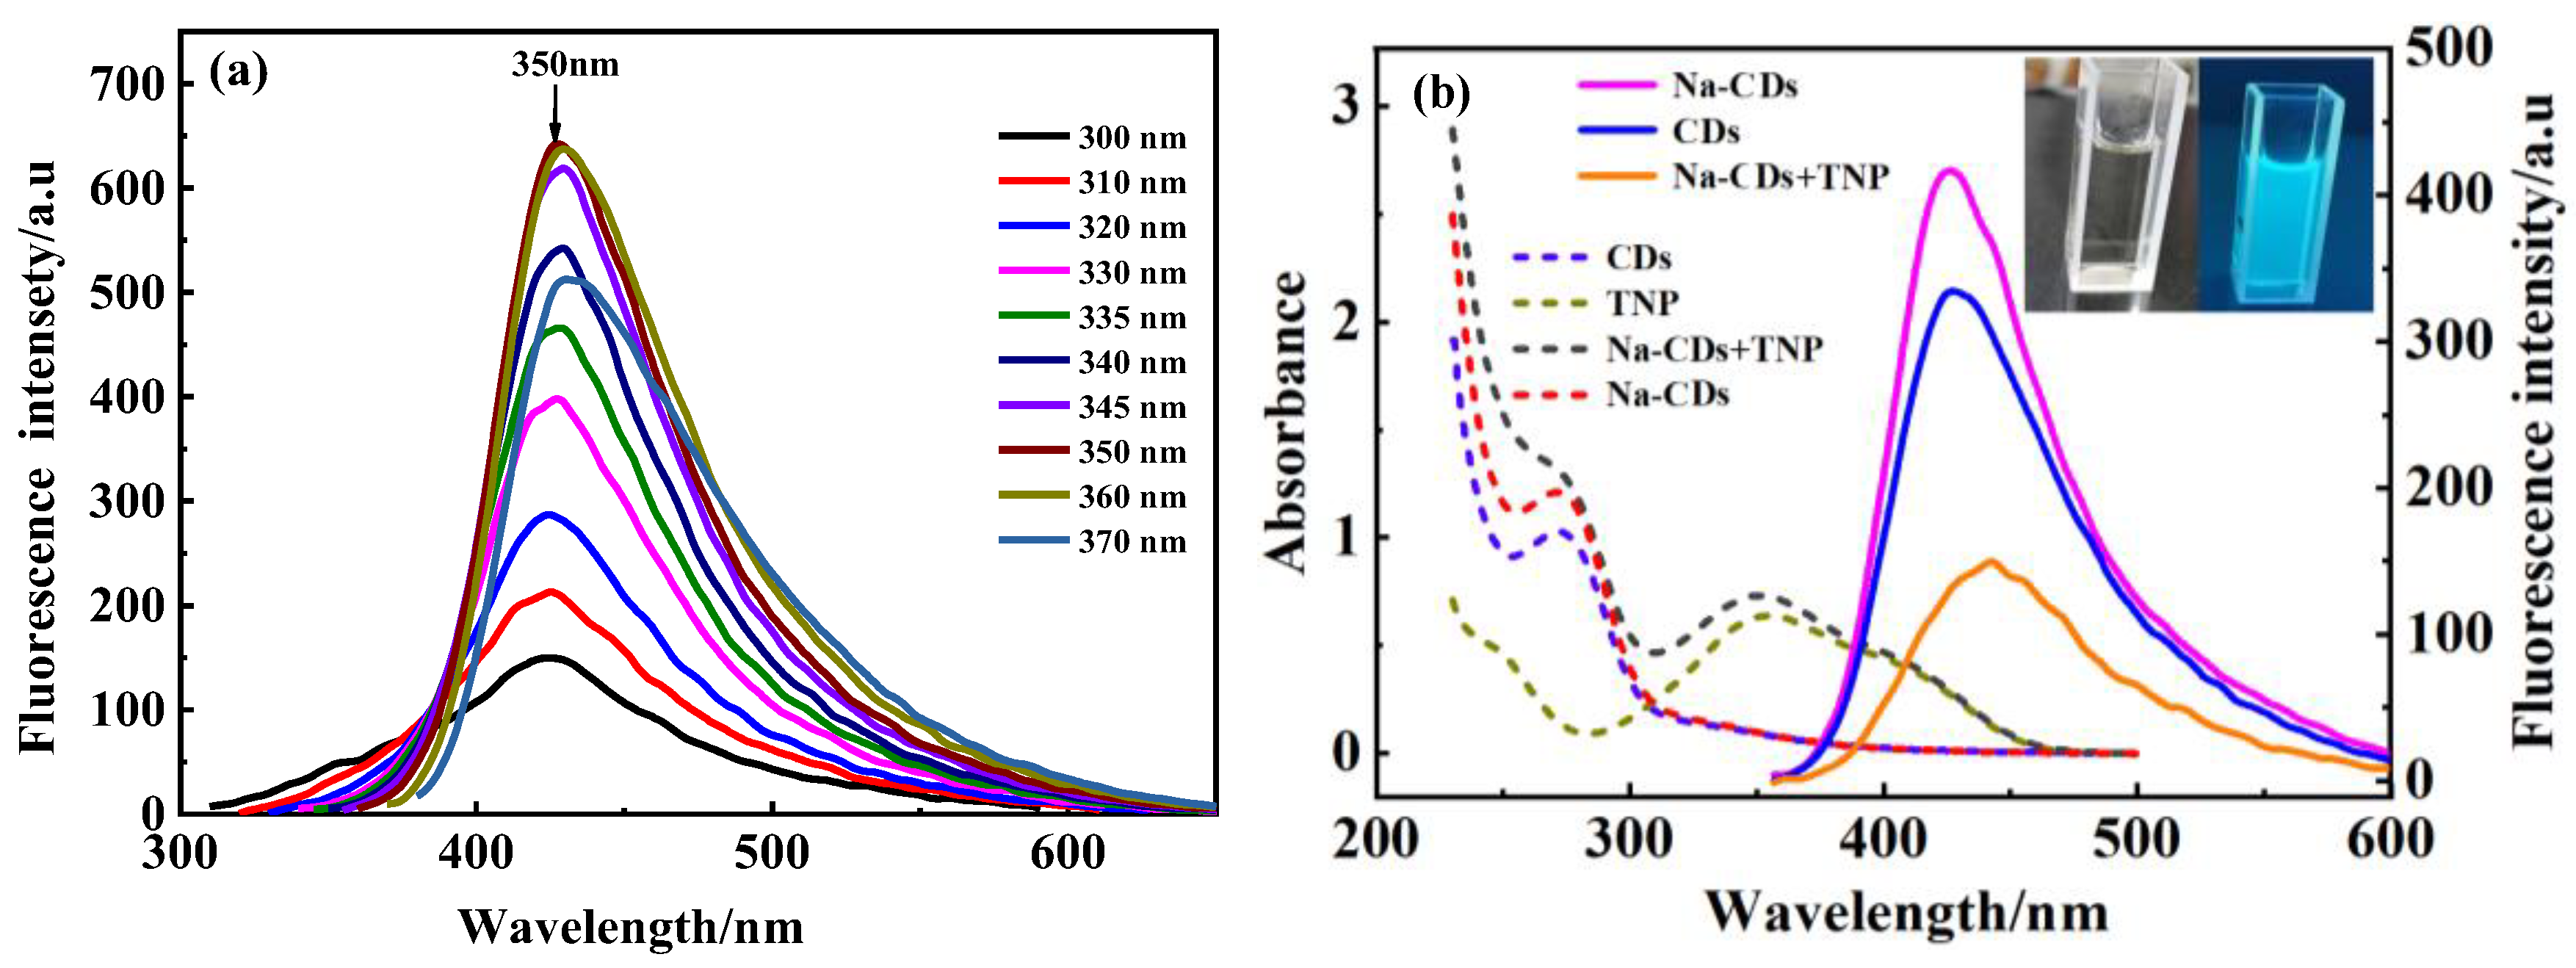
The incorporation of heteroatoms and metal doping represents an effective strategy for modulating the optical and electronic properties of carbon quantum dots. As shown in Figure 4a, when the excitation wavelength increases from 300 nm to 370 nm, the emission peak position of Na-CDs remains constant at 427 nm. However, the fluorescence intensity gradually increases with the excitation wavelength, reaching a maximum at 350 nm before declining. This emission behavior, independent of the excitation wavelength, can be attributed to the synergistic effect of the surface passivation effect of Na doping and structural integration, making its surface ‘inert’ and achieving the homogenization of the surface state [21]. Figure 4b reveals that the absorption spectra of undoped CDs and Na-CDs exhibit no significant shift in peak positions. Nevertheless, a pronounced enhancement in absorption intensity is observed at 275 nm (corresponding to the σ-π* transition of C-C bonds) after Na doping. Additionally, a slight increase in the absorption peak near 350 nm (associated with the n-π* transition of C=O groups) is detected. Notably, this wavelength coincides with the optimal excitation wavelength of Na-CDs, suggesting that the electronic transitions in this region likely serve as the primary source of fluorescence emission. Importantly, under excitation at this wavelength (350 nm), Na-CDs exhibit significantly stronger fluorescence emission intensity at 427 nm compared to undoped CDs. Furthermore, Na-CDs emit bright blue fluorescence under ultraviolet light excitation (inset of Figure 4b), demonstrating that sodium doping effectively enhances the fluorescence quantum yield. These results highlight the critical role of sodium doping in optimizing the photophysical performance of CDs through surface state engineering and electronic structure modulation.
Furthermore, compared to undoped CDs (as shown in Figure S4a), Na-CDs exhibited minimal variation in fluorescence intensity across a broad pH range (2.0–12.0), demonstrating remarkable resistance to environmental pH fluctuations. Additionally, both Na-CDs and undoped CDs maintained stable fluorescence intensity under ambient light conditions for at least 10 days (Figure S4b), indicating their excellent photostability. These results highlight the robustness of Na-CDs in diverse environments and their potential for practical applications requiring stable optical properties.

3.3. Fluorescence Quantum Yield

The fluorescence quantum yield of Na-CDs was determined using quinine sulfate as the reference standard [22]. Under identical excitation at 350 nm, the fluorescence intensities and absorbance values of the sample (u, Na-CDs) and reference (s, quinine sulfate) were measured. Based on Equation (1), the calculated fluorescence quantum yield value for Na-CDs was 2.0%, compared to 0.98% for undoped CDs (Table S1). These results indicate that sodium doping effectively enhanced the fluorescence quantum yield by over twofold.
Y u = Y s F u F s A s A u
In the formula, Yu represents the fluorescence quantum yield of the substance to be tested, Fu represents the integral fluorescence intensity of the substance to be tested, Au represents the absorbance of the substance to be tested, and Ys, Fs, and As represent the fluorescence quantum yield, integral fluorescence intensity, and absorbance of the reference substance.

3.4. Sensing Mechanism

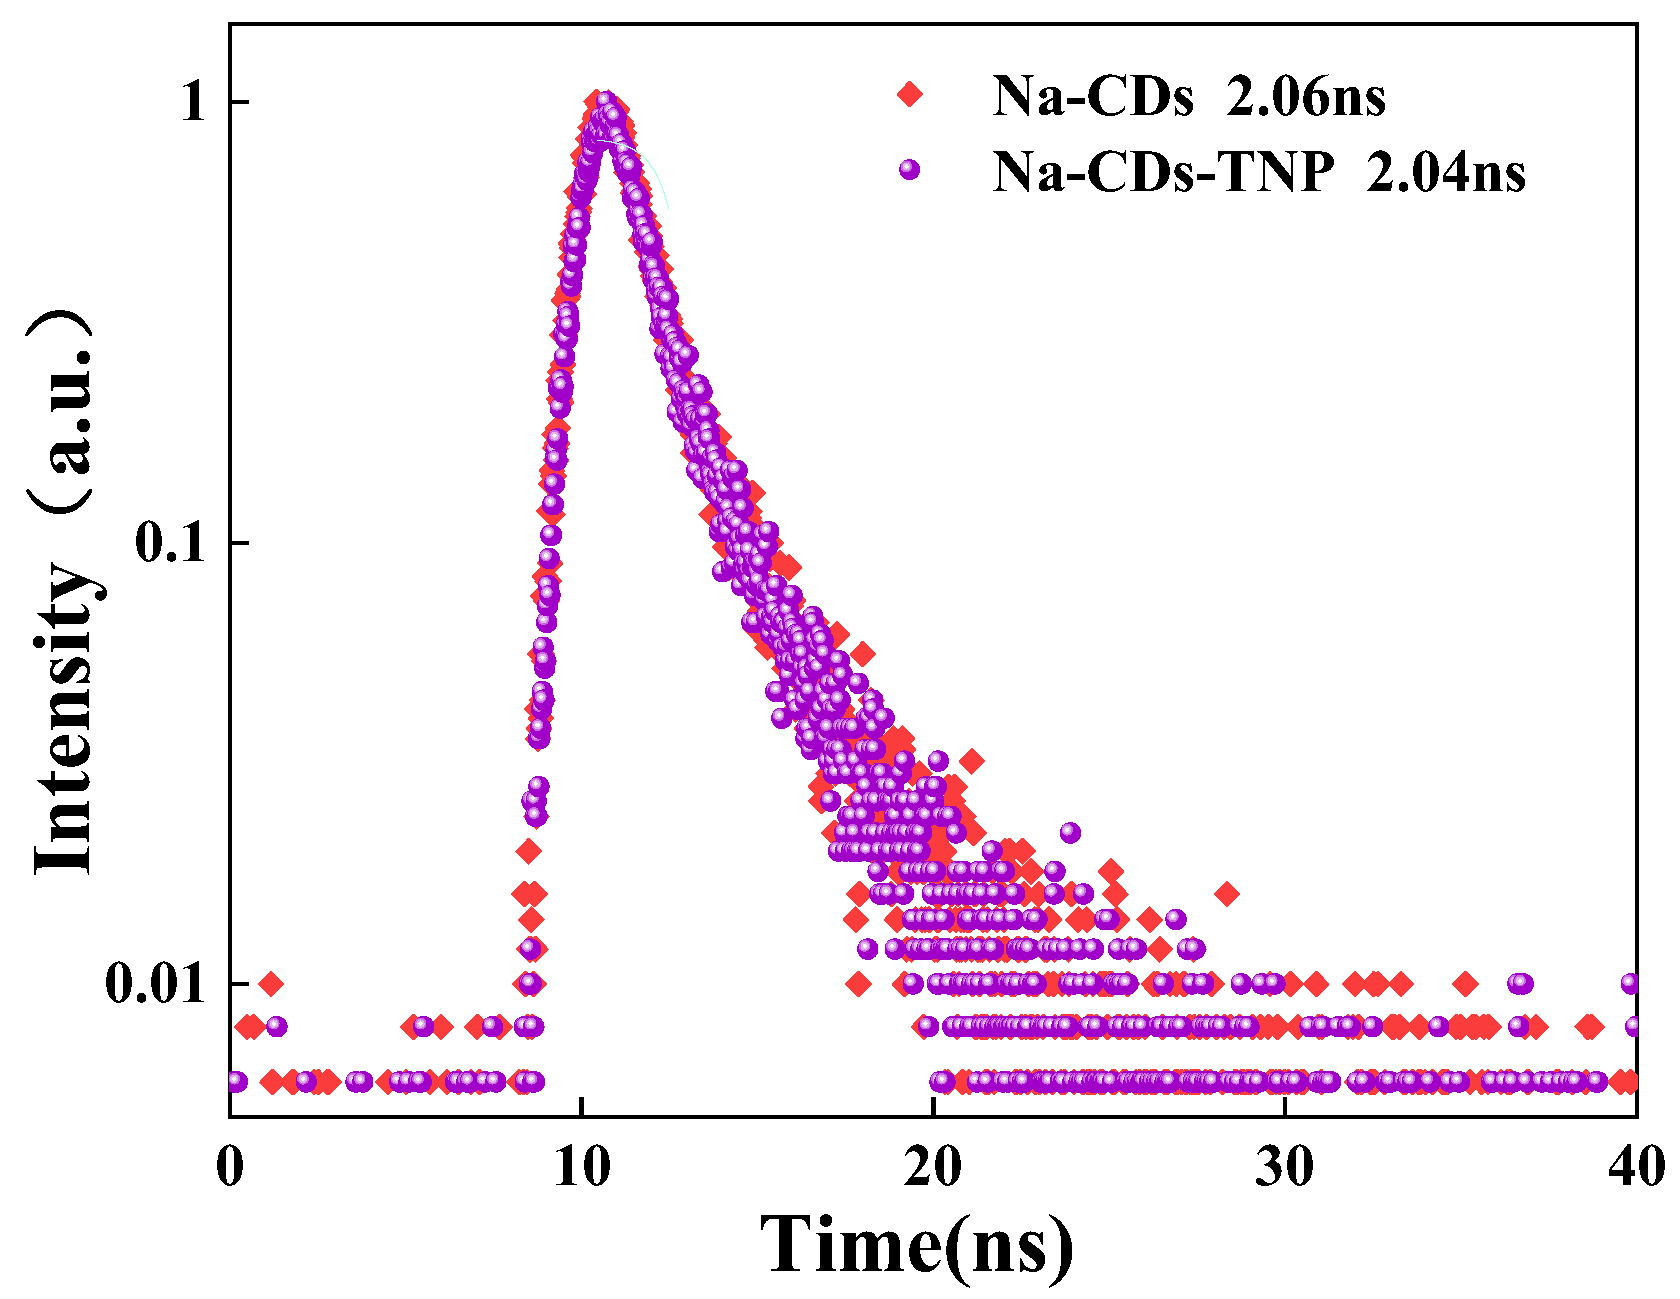
To investigate the sensing mechanism between the Na-CDs fluorescent probe and TNP, we conducted analyses from three perspectives: UV-Vis absorption spectroscopy, Stern–Volmer analysis, and fluorescence lifetime. The UV-Vis absorption spectrum (Figure 4b) shows that the mixed solution of TNP and Na-CDs retains the characteristic absorption peaks of both Na-CDs and TNP. The absorbance at 350 nm is consistent with the sum of the individual absorbances of Na-CDs and TNP, indicating no significant ground-state interaction between them. However, after the addition of TNP (10−5 mol/L), significant fluorescence quenching of Na-CDs is observed. This is likely due to weak π-π stacking and electrostatic attraction between TNP and Na-CDs in the ground state, leading to the rapid and reversible formation of a transient “contact pair.” The binding force is weak and insufficient to produce observable changes in the UV-Vis spectrum, but the binding rate is extremely fast. When excitation light is applied, the excited-state electrons of Na-CDs in the “contact pair” state undergo a highly efficient photoinduced electron transfer (PET) process to the LUMO energy level of TNP, resulting in complete fluorescence quenching of these Na-CDs, i.e., “static” quenching [23,24]. In contrast, the free Na-CDs that are not bound to TNP emit fluorescence normally, and their lifetime remains unchanged. As shown in Figure 5 and Table S2, the fluorescence lifetimes of the Na-CD solution before and after the addition of TNP are 2.06 ns and 2.04 ns, respectively, indicating no change. The reduction in fluorescence intensity is not due to a change in the lifetime of all molecules but rather to a decrease in the proportion of molecules capable of emitting light. This also confirms that this mechanism is static quenching.
To further explore its quenching mechanism, the Stern–Volmer equation was adopted for the analysis of the quenching mechanism:
F 0 / F = 1 + K S V Q
In this formula, F0 represents the fluorescence intensity without the addition of the quenching agent, F represents the fluorescence intensity after the addition of the quenching agent, KSV is the quenching constant, and [Q] is the concentration of the quenching agent.
The results are shown in Table S3. At 20 °C, 30 °C, and 40 °C, the fluorescence quenching constant KSV gradually increases with the rise in temperature. Based on the analysis of ultraviolet absorption spectra and fluorescence lifetime, the root cause is not the intensification of molecular collisions, but it may be that the increase in temperature promotes the adsorption equilibrium of TNP on the surface of Na-CDs to shift towards the binding direction (i.e., the binding constant K increases), and increases the rate of electron transfer itself, thereby leading to an enhanced quenching efficiency, manifested as an increase in the KSV value [25,26].

3.5. Optimization of Experimental Conditions

In order to better understand the response behavior of the Na-CD fluorescent probe, the experiment studied the influence of Na-CD dosage, solvent type, etc., by tracking the fluorescence changes.
According to the test experiment method, the effect of changing the dosage of Na-CDs on fluorescence is shown in Figure S5. It was found that at room temperature, when 0.4 mL of Na-CDs was added to 10 mL of the system, the fluorescence quenching of the system rapidly reached the optimum. Perhaps, this is because the fluorescence intensity of low-concentration Na-CDs is inherently low and high-concentration Na-CDs are prone to agglomeration, both of which lead to a narrowing of the quenchable range of the system and a decrease in the quenching rate.
The solvent type significantly influenced the fluorescence quenching efficiency of the system (Figure S6a). The highest quenching rate was achieved in anhydrous ethanol, while trichloromethane showed the lowest quenching effect. To balance sensitivity (optimal quenching in ethanol) and cost-effectiveness, a mixed ethanol/water solvent was selected for further experiments. The volume ratio of ethanol to water was systematically investigated (Figure S6b). Results indicated that a 1:1 (V/V) ethanol/water mixture provided the optimal fluorescence response. Therefore, this ratio was adopted as the standard solvent for the system.
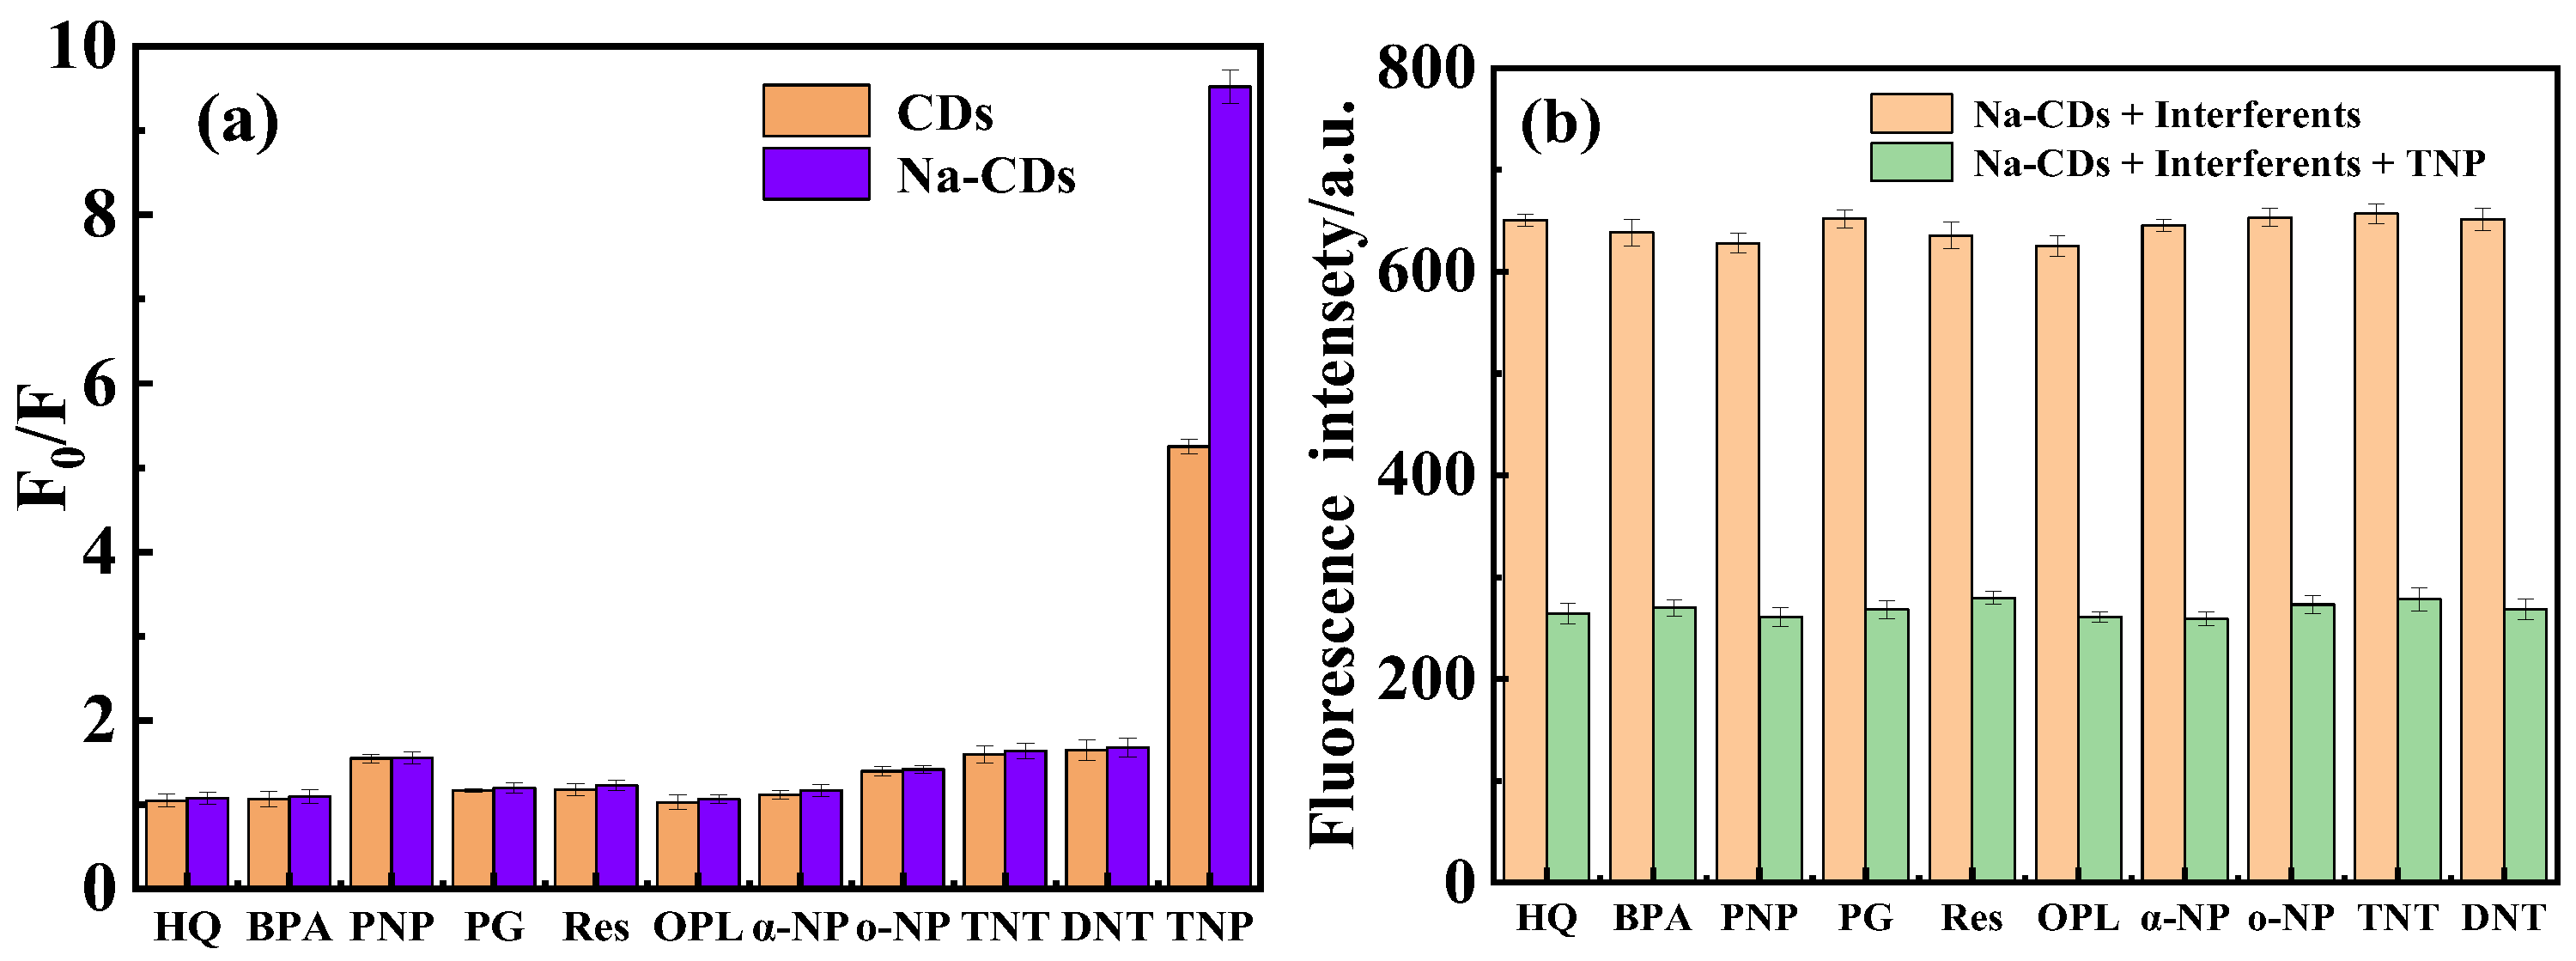
To confirm the high selectivity of Na-CDs as a fluorescent probe for TNP, we tested the fluorescence response of Na-CDs and CDs in the presence of various phenolic compounds (10−5 mol/L), including Hydroquinone (HQ), Bisphenol A (BTNP), p-Nitrophenol (PNP), Phloroglucinol (PG), Resorcinol (Res), Octyl Phenol (OPL), 1-Naphthol (α-NP), o-Nitrophenol (o-NP), TNT, DNT, and TNP (Figure 6a). The results demonstrate that among all the phenolic and nitroaromatic compounds tested, only TNP caused significant changes in the fluorescence intensity of the Na-CD/CD system. Notably, the F0/F ratio reached 9.73 in the Na-CD system and 6.23 in the CD system upon TNP addition. Compared with other phenolic compounds, the Na-CD probe exhibited higher sensitivity and selectivity toward TNP, indicating its potential for specific TNP detection. This might be due to the extremely low LUMO energy level of TNP, making it an excellent electron acceptor, quenching fluorescence through an efficient PET mechanism. Competitive experiments showed (Figure 6b) that even in the presence of interfering substances, Na-CDs still exhibited significant fluorescence changes after the addition of TNP, proving that this probe had excellent selectivity and anti-interference ability, and was suitable for the detection of actual water samples.

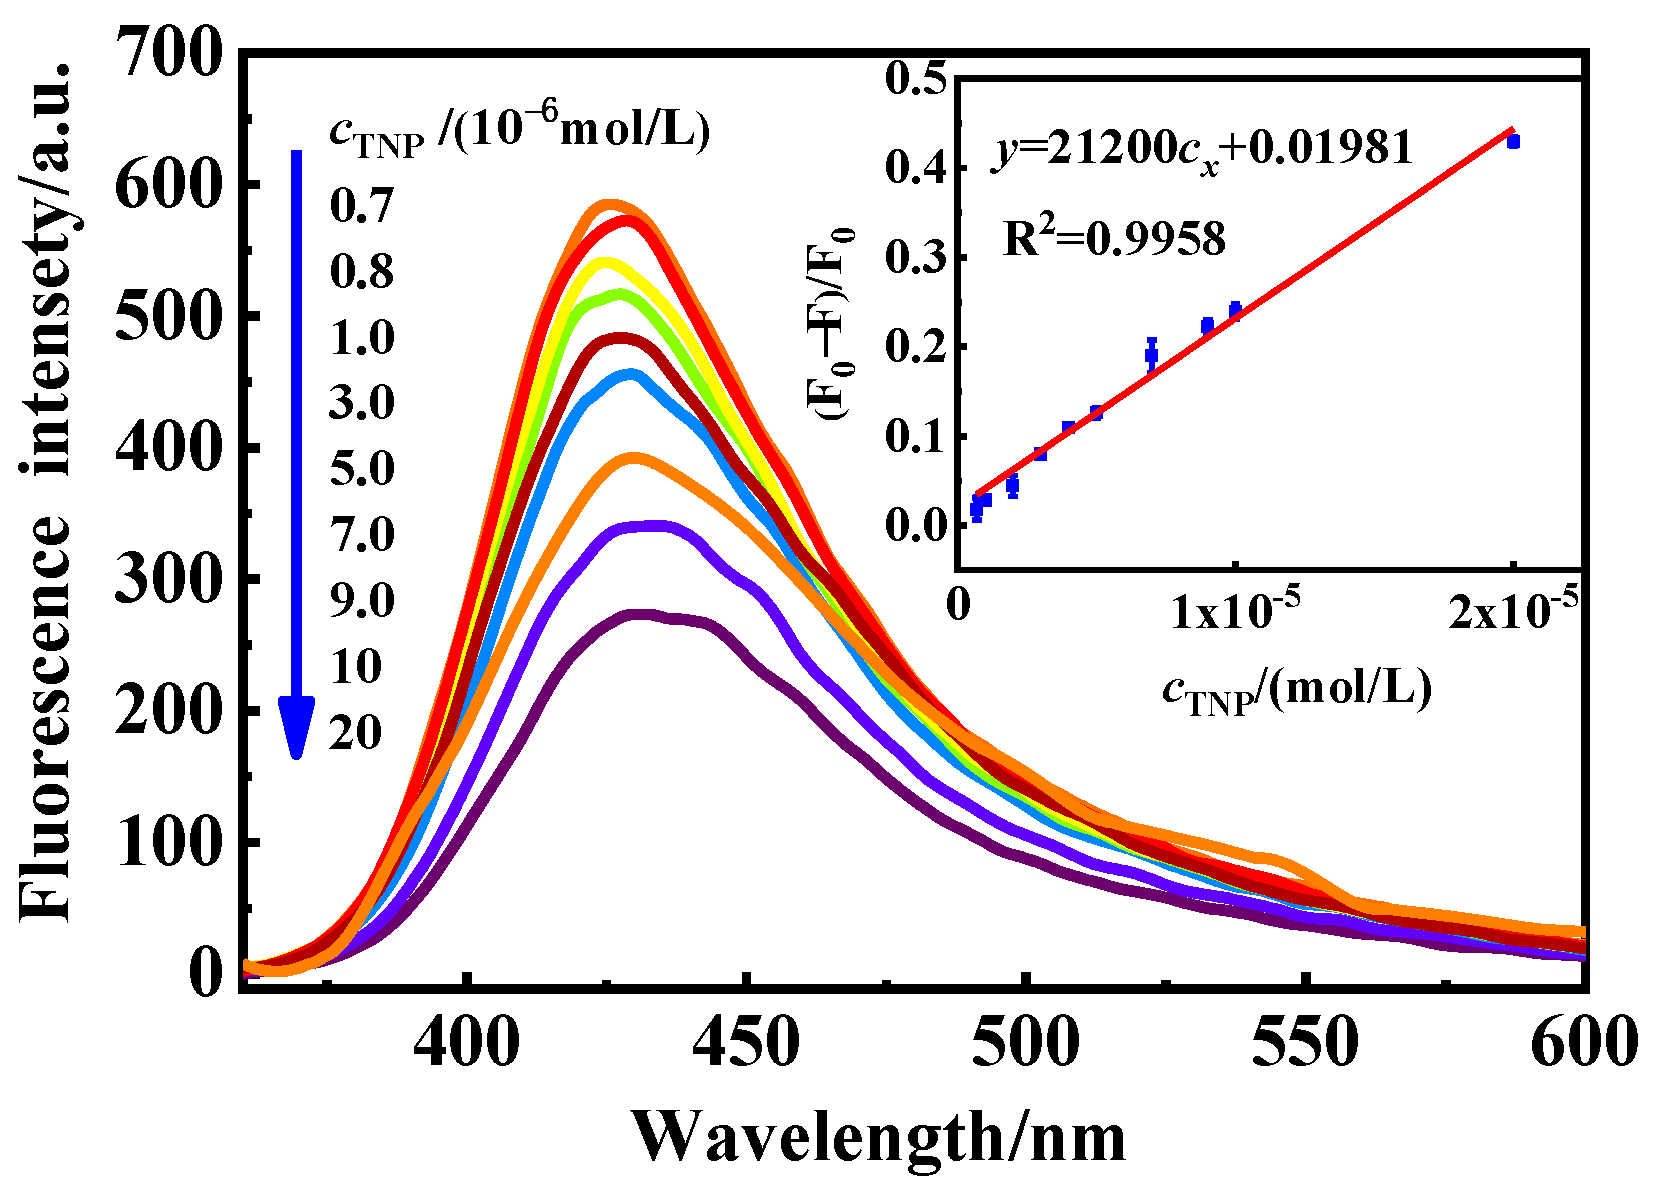
3.6. Standard Curve

As shown in Figure 7, the fluorescence response of the system was measured at varying TNP concentrations. A good linear relationship was observed between (F0F)/F0 and TNP concentration in the range of 7.0 × 10⁻⁷ to 2.0 × 10⁻⁵ mol/L. The linear equation is y = 21,200cx + 0.001981, R2 = 0.9958, and the detection limit is 3.5 × 10⁻⁸ mol/L.
The linear range and detection limit of this method were compared with the data of other methods for determining TNP (Table 1). The results showed that this experimental method has a lower detection limit, and the results were relatively satisfactory.

3.7. Real Sample Analysis

In order to investigate the practicability of the TNP system in environmental water, river water was taken and filtered. Under the optimal experimental optimization conditions, the detection was carried out, and the spiked recovery experiment was conducted. The results are shown in Table 2. The recovery rate of TNP ranged from 95.40% to 104.0%.

4. Conclusions

This study successfully developed a novel fluorescent probe based on sodium-doped carbon dots (Na-CDs) for the highly selective detection of the environmental pollutant TNP. The results demonstrate that the simple strategy of sodium doping effectively enhanced the fluorescence stability and recognition specificity of the CDs while maintaining their fundamental structure, likely by modulating the surface state energy levels. The constructed sensing method not only exhibited excellent sensitivity and a wide linear range but also achieved satisfactory recovery rates in real water sample analysis, confirming its reliability in dealing with complex environmental matrices. However, the current probe is limited to a solution-based system, which is not conducive to on-site rapid detection. Future work could focus on developing portable devices for field use, thereby promoting the transition of this material from laboratory analysis to practical environmental monitoring.

Supplementary Materials

The following supporting information can be downloaded at https://www.mdpi.com/article/10.3390/nanomanufacturing5040016/s1, Figure S1. The XRD spectrum of Na-CDs. Figure S2. FTIR spectra of Na-CDs and CDs. Figure S3. XPS spectrum of Na-CD C1s spectrum (a), O1s spectrum (b), and Na1s spectrum (c). Figure S4. pH and photostability of Na-CDs and CDs. Table S1. Fluorescence quantum yield of Na-CDs. Table S2. Data analysis of fluorescence lifetime. Table S3. The results of the Stern–Volmer equation at different temperatures. Figure S5. Effect of the Na-CD dosage. Figure S6. The influence of solvent selection on the fluorescence intensity of the system.

Author Contributions

Methodology, data curation, and writing—original draft preparation, T.G.; formal analysis, writing—review and editing, and project administration, X.S.; supervision and investigation, H.C. All authors have read and agreed to the published version of the manuscript.

Funding

This research was funded by the Science and Technology Project of Shaanxi Provincial Department of Science and Technology (2025SF-YBXM-277) and the Science and Technology Plan Project of Yan’an City (2024-CYL-078).

Data Availability Statement

The original contributions presented in this study are included in the article/Supplementary Materials. Further inquiries can be directed to the corresponding authors.

Conflicts of Interest

The authors declare no competing financial interests.

References

  1. Fu, Z.H.; Wang, Y.W.; Peng, Y. Two Fluorescein-Based Chemosensors for the Fast Detection of 2,4,6-Trinitrophenol (TNP) in Water. Chem. Commun. 2017, 53, 10524–10527. [Google Scholar] [CrossRef]
  2. Nagarkar, S.S.; Desai, A.V.; Ghosh, S.K. Engineering Metal—Organic Frameworks for Aqueous Phase 2,4,6-Trinitrophenol (TNP) Sensing. CrystEngComm 2016, 18, 2994–3007. [Google Scholar] [CrossRef]
  3. An, H.; Shangguan, M.Q.; Guo, B.G.; Yang, H.J.; Hou, L.X. A Water-Soluble Fluorescent Probe for Selective Detection of 2,4,6-Trinitrophenol (TNP) in Real Samples. Microchem. J. 2020, 157, 10511. [Google Scholar] [CrossRef]
  4. Moore, D.S. Instrumentation for Trace Detection of Highexplosives. Rev. Sci. Instrum. 2004, 75, 2499–2512. [Google Scholar] [CrossRef]
  5. Khezri, B.; Mousavi, S.M.B.; Sofer, Z.; Pumera, M. Recyclable Nanographene-Based Micromachines for the on-the-Fly Capture of Nitroaromatic Explosives. Nanoscale 2019, 11, 8825–8834. [Google Scholar] [CrossRef]
  6. Gou, Z.M.; Wang, A.J.; Tian, M.G.; Zuo, Y.J. Pyrene-Based Monomer-Excimer Dual Response Organosilicon Polymer for the Selective Detection of 2,4,6-Trinitrotoluene (TNT) and 2,4,6-Trinitrophenol (TNP). Mater. Chem. Front. 2022, 6, 607–612. [Google Scholar] [CrossRef]
  7. Xu, H.; Pan, Z.-R.; Qi, Z.-P.; Sun, J. Three Luminescent Zn-MOFs Based on V-Shaped Ligands for Fluorescence Sensing of 2,4,6-Trinitrophenol and Fe3+ in Aqueous Solution. Chin. J. Inorg. Chem. 2022, 38, 2479–2490. [Google Scholar]
  8. Sharma, I.; Sinha, R.K.; Shil, S.; Rani, S.; Anil Kumar, N.V. Novel Coumarin-Substituted Cyclophosphazene as a Fluorescent Probe for Highly Selective Detection of 2,4,6-Trinitrophenol. ACS Omega 2025, 10, 5312–5323. [Google Scholar] [CrossRef]
  9. Ye, J.Q.; Cheng, B.; Bu, Y.F.; Qian, J.F.; Liang, Q.; He, M.Y.; Chen, Q. Carbon Dots as Electron Acceptors Modified NH2-MIL-125 (Ti)/Cu2O Heterojunction for Highly Efficient Photocatalytic H2 Production. Int. J. Hydrogen Energy 2025, 127, 189–201. [Google Scholar] [CrossRef]
  10. Mehrabi, F.; Hosseini, M.; Sadeghi, N.; Mohammadi, J.; Ganjali, M.R.; Ranjbar, B. Green Emitting Carbon Dots-Immunosensor on Magnetic Nanoparticles for Detection of Nanog Antigen as a Cancer Stem Cell Biomarker. Anal. Chim. Acta 2025, 1353, 343960. [Google Scholar] [CrossRef]
  11. Sun, X.H.; Ma, M.; Liu, J.T.; Tian, R.; Chai, H.M.; Cui, H.L.; Gao, L.J. Pr/N Co-Doped Biomass Carbon Dots with Enhanced Fluorescence for Efficient Detection of 2,4-Dinitrophenylhydrazine. Chin. J. Inorg. Chem. 2025, 41, 561–573. [Google Scholar]
  12. Koc, O.K.; Üzer, A.; Apak, R. High Quantum Yield Nitrogen-Doped Carbon Quantum Dot-Based Fluorescent Probes for Selective Sensing of 2,4,6-Trinitrotoluene. ACS Appl. Nano Mater. 2022, 5, 5868–5881. [Google Scholar] [CrossRef]
  13. Kadian, S.; Kalkal, A.; Jain, V.; Shukla, S.; Narayan, R.J. Pomegranate leaf extract-based carbon dots for the selective detection of 2,4,6-trinitrophenol. MRS Commun. 2023, 13, 885–891. [Google Scholar] [CrossRef]
  14. Iacovo, A.D.; Mitri, F.; Santis, S.D.; Giansante, C.; Colace, L. Colloidal Quantum Dots for Explosive Detection: Trends and Perspectives. ACS Sens. 2024, 9, 555–576. [Google Scholar] [CrossRef]
  15. Liu, H.L.; Zheng, Y.X.; Moon, K.S.; Chen, Y.; Shi, D.C.; Chen, X.; Wong, C.P. Ambient-air in situ fabrication of high-surface-area, superhydrophilic, and microporous few-layer activated graphene films by ultrafast ultraviolet laser for enhanced energy storage. Nano Energy 2022, 94, 106902. [Google Scholar] [CrossRef]
  16. Sun, X.H.; Ma, M.; Tian, R.; Chai, H.M.; Wang, J.W.; Gao, L.J. One-Pot Hydrothermal Method Preparation of Cerium—Nitrogen Codoped Carbon Quantum Dots from Waste Longan Nucleus as a Fluorescent Sensor for Sensing Drug Rifampicin. ACS Omega 2023, 8, 34859–34867. [Google Scholar] [CrossRef]
  17. Zhang, Z.; Fan, Z.F. Application of cerium—Nitrogen co-doped carbon quantum dots to the detection of tetracyclines residues and bioimaging. Microchem. J. 2021, 165, 106139. [Google Scholar] [CrossRef]
  18. Yang, Z.; Xu, M.H.; Liu, Y.; He, F.J.; Gao, F.; Su, Y.J.; Wei, H.; Zhang, Y.F. Nitrogen-Doped, Carbon-Rich, Highly Photoluminescent Carbon Dots from Ammonium Citrate. Nanoscale 2014, 6, 1890–1895. [Google Scholar] [CrossRef] [PubMed]
  19. Walekar, L.S.; Zheng, M.D.; Zheng, L.H.; Long, M.C. Selenium and nitrogen co-doped carbon quantum dots as a fluorescent probe for perfluorooctanoic acid. Microchim. Acta 2019, 186, 218. [Google Scholar] [CrossRef]
  20. He, Y.R.; Zhao, D.L.; Chung, T.S. Na+ functionalized carbon quantum dot incorporated thin-film nanocomposite membranes for selenium and arsenic removal. J. Membrane Sci. 2018, 564, 483–491. [Google Scholar] [CrossRef]
  21. Gao, H.B.; Chen, D.Q.; Fang, G.L.; Yuan, S.; Chen, X.; Zhong, J.S. Excellent Luminescence Films of Excitation-Independent Carbon Quantum Dots Toward Non-Rare-Earth Phosphor-Based White Light-Emitting Diodes. J. Alloys Compd. 2018, 764, 17–23. [Google Scholar] [CrossRef]
  22. Li, J.L.; He, M.Y.; Yan, X.Y.; Xiang, G.Q.; Jiang, X.M.; He, L.J. Preparation of Boron-Doped Carbon Dots with High Fluorescence Quantum Yield and Its Application for Determination of 2,4,6-Trinitrophenol in Water. J. Inst. Anal. 2023, 42, 1127–1133. [Google Scholar]
  23. Huang, J.Y.; Long, C.C.; Zhang, L.; Qing, T.P.; Zhang, P.; Qing, Z.H.; Feng, B. Carbon Dots for All-in-One Detection and Degradation: The Role of Photoinduced Electron Transfer. J. Environ. Chem. Eng. 2022, 10, 108951. [Google Scholar] [CrossRef]
  24. Wang, Q.; Zhang, H.Y.; Yu, D.M.; Qin, W.; Wu, X.H. Ultra-Sensitive and Stable N-Doped Carbon Dots for Selective Detection of Uranium Through Electron Transfer Induced UO2+(V) Sensing Mechanism. Carbon 2022, 198, 162–170. [Google Scholar] [CrossRef]
  25. Deshmukh, A.; Bandyopadhyay, S.; Jamesa, A.; Patra, A. Trace Level Detection of Nitroanilines Using a Solution Processable Fluorescent Porous Organic Polymer. J. Mater. Chem. C 2016, 4, 4427–4433. [Google Scholar] [CrossRef]
  26. Nayak, S.R.; Patel, S.; Vaidyanathan, S. Imidazole-Based Fluorescent Probes: Concomitant Effects of N1 Substitution and Lone Pair on Selective Recognition of Picric Acid. New J. Chem. 2023, 47, 3524–3534. [Google Scholar] [CrossRef]
  27. Lin, Q.; Chu, H.T.; Chen, J.Q.; Gao, L.D.; Zong, W.; Han, S.; Li, J.L. Dual-Emission Ratiometric Fluorescence Probe Based on Copper Nanoclusters for the Detection of Rutin and Picric Acid. Spectrochim. Acta Part A Mol. Biomol. Spectrosc. 2022, 270, 120829–120841. [Google Scholar] [CrossRef]
  28. Venkatappa, L.; Ture, S.A.; Yelamaggad, C.V.; Sundaram, V.N.N.; Martínez-Máñez, R.; Abbaraju, V. Mechanistic Insight into the Turn-off Sensing of Nitroaromatic Compounds Employing Functionalized Polyaniline. Chemistryselect 2020, 5, 6321–6330. [Google Scholar] [CrossRef]
  29. Deng, X.; Huang, X.M.; Chen, W.; Zhao, H.L. Preparation Novel Fluorescent Carbon Dots and Its Application in 2,4,6-Trinitrophenol Detection. Laser Optoelectron. Prog. 2022, 59, 2130002. [Google Scholar]
  30. Huang, C.; Wang, J.Y.; Lin, J.R.L.; Huang, W.; He, Y. Improved colorimetric detection of 2,4,6-trinitrotoluene through γ-cyclodextrin complexation. Forensic Chem. 2022, 30, 100444. [Google Scholar] [CrossRef]
  31. Luo, W.Q.; Zheng, F.R.; Zou, Y.J.; Yang, Y.J.; Zhang, J.; Li, D.P.; Li, Y.X. Crown-like Cd(II) metallocycle as effective fluorescent sensor for detection of 2,4,6-trinitrophenol. Inorg. Chim. Acta 2025, 582, 122653. [Google Scholar] [CrossRef]
  32. Yin, R.H.; Bu, Y.M.; Zhu, H.J.; Su, P.C.; Ye, E.Y.; Li, Z.B.; Loh, X.J.; Yuan, C.; Wang, S.H. Simultaneous detection and removal of 2,4,6-trinitrophenyl phenol and dichromate by metal-organic framework. Spectrochim. Acta Part A Mol. Biomol. Spectrosc. 2023, 297, 122735. [Google Scholar] [CrossRef] [PubMed]
  33. Ahmad, K.; Khan, M.Q.; Khan, R.A.; Kim, H. Preparation of Mo-doped WO3 as Catalyst for Electrochemical Sensing of 2,4,6-Trinitrophenol. Top. Catal. 2025, 68, 307–317. [Google Scholar] [CrossRef]
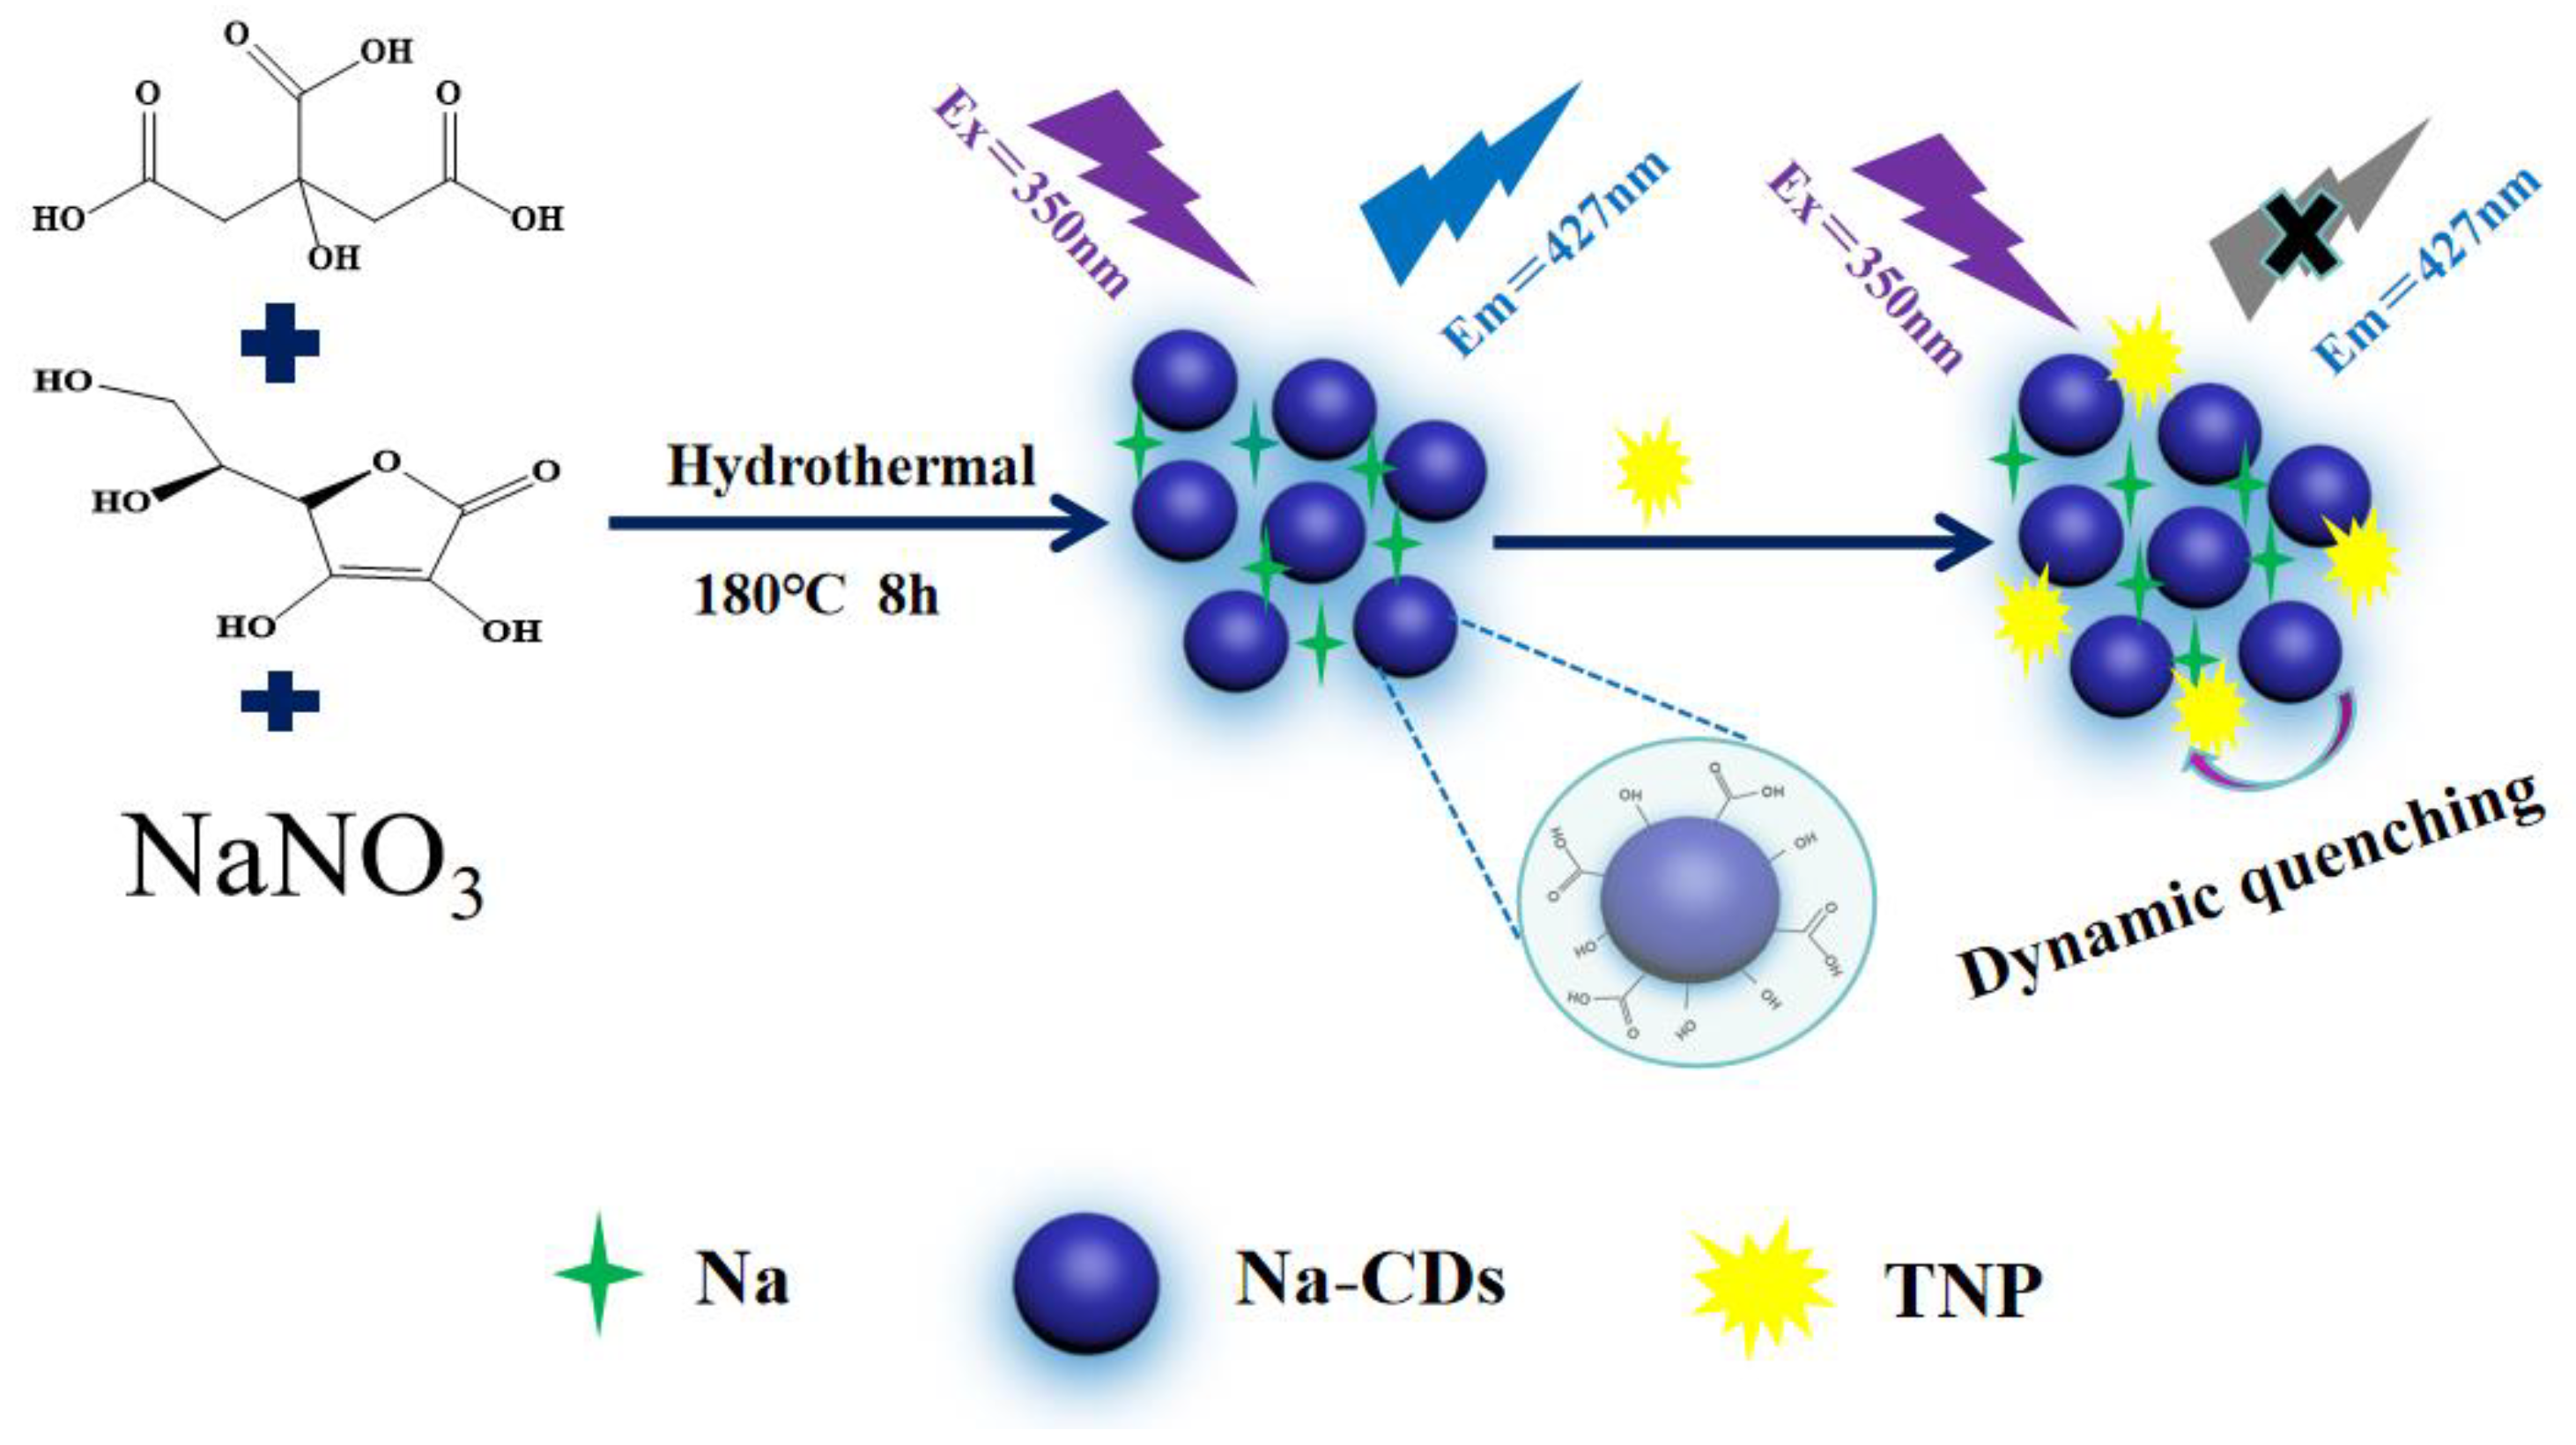
Figure 1. Mechanism of TNP detection by Na-CDs.
Nanomanufacturing 05 00016 g001
Figure 2. (a) The TEM images of Na-CDs (insets: HRTEM image) and (b) the particle size distribution map of Na-CDs.
Nanomanufacturing 05 00016 g002
Figure 3. Full XPS spectrum of Na-CDs.
Nanomanufacturing 05 00016 g003
Figure 4. The fluorescence spectra of Na-CDs at different excitation wavelengths (a) and UV-vis absorption spectra and fluorescence spectra schematic diagrams (insets: photos of Na-CDs under UV light and natural light) (b).
Nanomanufacturing 05 00016 g004
Figure 5. Fluorescence attenuation curves of Na-CDs and Na-CDs + TNP.
Nanomanufacturing 05 00016 g005
Figure 6. (a) The effects of different phenolic compounds on the Na-CD fluorescent probe and (b) fluorescent intensity of probe Na-CDs toward various competing species in response to TNP.
Nanomanufacturing 05 00016 g006
Figure 7. The linear curve of TNP and the corresponding fluorescence spectrum.
Nanomanufacturing 05 00016 g007
Table 1. Nanostructured material-based sensor probes for TNP sensing.
Fluorescent ProbeDetection MethodDetection Range
(μmol/L)
Detection Limit (μmol/L)References
CuNCsFluorescence5–500.27[27]
Functionalized polyanilineFluorescence0.6–2.20.61[28]
New fluorescent carbon quantum dotsFluorescence0.8–800.16[29]
γ-cyclodextrin complexationColorimetry0–2000.80[30]
MetallocycleFluorescence0–250.91[31]
Metal–organic frameworkFluorescence0–150.68[32]
Mo@WO3Electrochemical Sensing0.3–2000.30[33]
Na-CDsFluorescence0.7–200.035This paper
Table 2. Determination result of samples and recovery of the method (n = 5).
SamplesDetermination
Result (µmol/L)
Added
(µmol/L)
Found
(µmol/L)
Recovery
(%)
RSD
(%)
River water015.014.5297.601.22
10.010.13102.01.63
5.005.22104.01.50
Industrial wastewater015.015.26101.71.40
10.09.5495.401.14
5.005.19103.82.02
Disclaimer/Publisher’s Note: The statements, opinions and data contained in all publications are solely those of the individual author(s) and contributor(s) and not of MDPI and/or the editor(s). MDPI and/or the editor(s) disclaim responsibility for any injury to people or property resulting from any ideas, methods, instructions or products referred to in the content.