Article

MgO–C Refractories with Al2O3 and TiO2 Nano-Additives: Insights from X-Ray Micro-Computed Tomography and Conventional Techniques for Assessing Corrosion and Oxidation

by
Sevastia Gkiouzel
,
Vasileios Ioannou
,
Christina Gioti
,
Konstantinos C. Vasilopoulos
,
Angelos Ntaflos
,
Alkiviadis S. Paipetis
,
Constantinos E. Salmas
* and
Michael A. Karakassides
*
Department of Materials Science and Engineering, University of Ioannina, GR-451 10 Ioannina, Greece
*
Authors to whom correspondence should be addressed.
Nanomanufacturing 2025, 5(3), 10; https://doi.org/10.3390/nanomanufacturing5030010
Submission received: 3 May 2025 / Revised: 5 June 2025 / Accepted: 3 July 2025 / Published: 9 July 2025

Abstract

MgO–C refractory materials were developed by incorporating different ratios of alumina/titania nano-additives which were synthesized chemically. Their physical and mechanical properties, oxidation resistance, slag wettability, bulk density, apparent porosity, cold crushing strength, oxidation index, and closed porosity were tested, evaluated, and compared using conventional techniques as well as X-ray micro-computed tomography (µCT). This investigation indicated a slight degradation of physical properties and mechanical strengthening which was stronger for samples with increased alumina content. Oxidation and corrosion extent were tested both with X-ray tomography and conventional methods. The first method allowed for the calculation of the oxidation index, the detection of closed porosity, and an improved analysis of the internal corrosion, avoiding the sectioning of the materials. This result confirms the supremacy of the first technique. On the contrary, although conventional methods such as the Archimedes procedure cannot detect close porosity, they provide more accurate measurements of the physical properties of refractories. This study shows that conventional methods exhibit superiority in investigations of the pore structures of refractories for pore sizes in the range 1–2 μm, while the use of the μCT system is limited for pore sizes equal to or larger than 20 μm.

1. Introduction

X-ray micro-computed tomography (μCT) is a powerful non-destructive imaging technique used to study the internal structure of materials under high resolution [1,2,3]. The internal structure of materials, as well as their microstructure, plays a crucial role in defining their mechanical and physical properties. As a result, visualizing the internal structure and morphological characteristics of materials is essential in material design and engineering. Especially in refractory materials, this method enables researchers to visualize and analyze porosity, crack distribution, and phase composition in three dimensions without altering their integrity [4,5,6].
By providing detailed insights into microstructural features, μCT helps in understanding degradation mechanisms, optimizing material properties, and improving the performance of refractories in high-temperature industrial applications. Furthermore, computer tomography enables before-and-after analysis, capturing the evolution of pore structures, cracks, and phase transformations due to corrosion or oxidation. This method can reveal the 3D infiltration pathways of corrosive agents, such as molten slag, alkalis, and acidic gases, as they penetrate pores and grain boundaries, exposing their depth and extent of damage. In addition, the oxidation of refractories leads to a decrease in their density due to the burning of graphite and amorphous carbon, which can be captured in tomographic images, providing a detailed record of the degree of oxidation of refractories [6,7]. This technique offers several advantages over traditional methods used for studying refractories, such as optical microscopy, scanning electron microscopy (SEM), and mercury intrusion porosimetry [5,8].
Earlier research on the microstructure of magnesia refractories has primarily relied on conventional techniques, such as the Archimedes method for assessing apparent porosity and mercury intrusion porosimetry for analyzing the pore size distribution of interconnected pores. However, these approaches present several drawbacks. Firstly, they lack precision and may introduce measurement errors. Secondly, the vacuuming process involved can alter or damage the original internal structure of the sample. Thirdly, these methods provide only a macroscopic evaluation of porosity and pore size, making it difficult to accurately or visually examine the material’s characteristics. Additionally, liquid-based methods cannot penetrate sealed internal pores, leaving them undetected [9].
In addition, commonly used microscopy methods, such as optical microscopy and SEM, are limited to analyzing the surface morphology of a sample, because they produce only two-dimensional images, making it impossible to observe the three-dimensional pore distribution, chemical composition, and structure of the entire sample. As a result, the detection outcomes may lack comprehensiveness, leading to a restricted understanding of the refractory’s structure and performance [1,5]. In contrast, computed tomography enables non-destructive, volumetric imaging, allowing for a comprehensive visualization and analysis of the entire sample in three dimensions.
On the other hand, it has not been confirmed whether the results of X-ray tomography can accurately yield measurable properties of refractory materials, such as their density, oxidation index, and total porosity, which are determined using classical methods. The reason for this is that the results of the tomography technique largely depend on the available resolution of the equipment used, which must be high enough to accurately capture the fine details of refractory materials, especially those with small pores or complex internal structures [10]. Furthermore, refractory materials, especially those with similar densities or compositions, may have limited contrast in X-ray imaging. This makes it difficult to distinguish between different phases or materials, potentially reducing the accuracy of the analysis, whereas large refractory samples might be difficult to analyze due to the limited sample size capacity of commercial μCT equipment. This could restrict its use in industrial-scale applications where larger pieces need to be studied [11].
Magnesia–carbon refractories belong to the category of basic refractories and are used in many steelmaking applications, such as converters, electric arc furnaces, and steel ladles. Their main properties are high refractoriness, high thermal conductivity, high resistance to thermal shock, high corrosion resistance, and a low modulus of elasticity, resulting in the absorption of stresses with minimal deformation [12,13].
The amount of graphite, the type of resin used, and the particle size distribution of the magnesia raw materials, as well as the firing temperature, duration, and furnace atmosphere, play a crucial role in developing the desired properties of refractory materials.
Nanopowders, due to their small size and high surface-area-to-volume ratio, have generated enormous technological interest in recent years due to their unusual properties (magnetic, electrical, optical, and mechanical) and the significant changes they cause in the materials they are added to, enhancing their microstructure and properties [14,15,16]. In refractories, they act as additives by filling tiny pores during molding, aiding densification [15,17], serving as colloidal binders, strengthening the ceramic structure [15,17], lowering reaction temperatures, accelerating sintering, and enabling in situ microstructure development with superior properties [15].
Concerning MgO-C refractories, it has been found that replacing micrometer-sized magnesia with 0.25–1.5% TiO2 nanoparticles improves refractory properties due to the formation of TiC, TiN, and TiCN phases [18]. On the other hand, small amounts of 0.3 μm TiO2 were observed to increase density and reduce porosity, while concentrations greater than 10% led to property degradation [19]. Additionally, nanoparticles have been shown to enhance refractory performance by forming non-oxide ceramic phases, although excessive amounts can cause aggregation and expansion issues. Furthermore, the addition of 1 μm TiO2 and 45–75 μm Al to magnesia–carbon refractories leads to the formation of TiCN, TiC, Al4C3, Al2OC, and Al4O4C phases, improving oxidation and thermal shock resistance [20]. Finally, nano-iron has been found to enhance the mechanical strength and corrosion resistance of a pure magnesia refractory matrix, while nano-alumina forms MgAl2O4 spinel, causing microcracks and reducing mechanical performance [21].
This study explores the application of μCT for the quantitative characterization of magnesia-based refractory materials containing Al2O3 and TiO2 nanoparticles as additives. Specifically, compared with those obtained via commonly used methods such as the Archimedes method and optical microscopy, the values of physical properties such as density and pore volume were calculated, along with characteristic properties such as the oxidation index, depth, and degree of corrosion after corrosion and oxidation experiments.

2. Materials and Methods

2.1. Materials

Raw materials for preparing magnesia–carbon refractories included fused magnesia (3–5 mm, 1–3 mm, 0.5–1 mm, 0–0.5 mm, and 200 mesh, Mathios refractories factory, Athens, Greece), flake graphite, fine-grained graphite, granular aluminum (<1 mm, ≥99.7 wt% trace metal basis, Sigma Aldrich 15123 Marousi Athens, Greece), and boron carbide (<10 Micron powder, 99+%, Alfa Aesar, Karlsruhe, Germany). The used binders were thermosetting phenolic resins, of which one was in solid form and the other in liquid form. Aluminum nitrate and ammonia were used to prepare γ-alumina nanoparticles, while nitric acid and titanium (IV) isopropoxide were used to prepare TiO2-anatase nanoparticles.

2.1.1. Preparation of Alumina and Titania Nanoparticles

Aluminum nitrate (375.13 g) was stirred with 594 mL distilled water at 80 °C until the precursor dissolved. Ammonia 25% (375.13 g) was added dropwise, and the solution was stirred with a mechanical stirrer for one hour and then dried at 110 °C for 24 h. The dried material was calcined at 600 °C (2 °C/min) for 2 h. After calcination, ball milling took place for 40 min (Figure 1). Distilled water (36 mL) and nitric acid (2 mL) were stirred while 30.33 mL of titanium (IV) isopropoxide was added dropwise. The solution was stirred continuously at 700 rpm for 30 min and then transferred to a 100 mL sealed Teflon vessel placed in a microwave reactor (Milestone flexiWAVE, Via Fatebenefratelli 1/5—24010 Sorisole (BG)—Italy). The heating ramp was set in 10 min with holding times of 20 min at 180 °C. After cooling at room temperature, the obtained powders were carefully washed at least three times with deionized water, centrifuged, and dried at room temperature.

2.1.2. Preparation of Magnesia–Carbon Bricks

Magnesia (supplied by Mathios Refractories S.A., Athens, Greece) in the range of 53, 31, 10.5, 0.50 mm, and 200 mesh and fine-grained and flake graphite (also supplied by Mathios Refractories S.A., Greece) were utilized as the main starting materials. Novolac liquid and powder resin were used as binders. All investigated compositions of magnesia–carbon bricks are listed in Table 1. The mixing sequence of raw materials is listed in Table 2. The mixture of raw materials was compacted under an applied pressure of 200 MPa using a Specac Hydraulic Press (15 tons) into specimens of cylindrical (diameters of 30 mm and 13 mm) and rectangular (40 mm × 6 mm × 7.5 mm) shapes and subsequently heat-treated at 200 °C for one hour. Finally, the samples were heated at 1400 °C (5 °C/min) for 3 h, fully covered with coal.

2.2. Methods

The phase composition of Al2O3 and TiO2 nanoparticles was investigated using X-ray diffraction analysis (XRD instrumental D8 advance, Bruker, Germany, monochromatic beam with CuKα 40 kV, 40 mA, λ = 1.54178 Å). The crystal size of the prepared nanoparticles was calculated from the XRD patterns using the following Scherrer equation:
d = (K λ)/(β cosθ)
where d is the average crystallite size of the phase under investigation, K is a constant (K = 0.9), β is the full-width half maximum (FWHM) expressed in radians, θ is Bragg’s angle, and λ is the wavelength of the X-ray beam used.
Archimedes’ immersion method was used for porosity and density calculations following the ASTM C20-00 standard [22]. Refractories were dried until their weight became constant, and such weight (D) was measured. Right after, the samples were immersed into boiling distilled water and kept under such conditions for two hours to fill pores with water. Sequentially, the refractories were cooled to room temperature and suspended in water. Samples were weighed while they were suspended in water (S) and when out of water (W) after water drops were removed from their surface using a cotton cloth. Equations (2)–(6) were used for the determination of specimens’ Exterior Volume (V), apparent porosity (P), Water Absorption (A), Apparent Specific Gravity (T), and bulk density (B). Measurements were carried out in triplicate, and the average of the three repeated measurements was adopted to ensure accuracy and reproducibility.
V (cm3) = W(g) − S(g)
P(%) = [(W(g) − D(g))/V(cm3)] × 100
A(%) = [(W(g) − D(g))/D(g)] × 100
T = D(g)/[D(g) − S(g)]
B(g/cm3) = D(g)/V(cm3)
After the common corrosion and oxidation treatment of samples, the internal microstructure of MgO-C refractories was illustrated using an X-ray computed microtomography (μCT) instrument. Images were developed employing a radiographic imaging Bruker SkyScan 1275 (USA) scanner equipped with a distortion-free 3 Mp active flat-panel detector. An accelerating voltage of 90 kV and a current of 110 μA were applied, while a 1 mm thick Cu filter was used with a pixel size of 20 μm. A 360° scan was performed with a 0.20° rotation step corresponding approximately to a 25 min scan duration. The reconstruction was performed on Bruker’s NRecon V2 software. CTAN version 2.0 and Dataviewer version 2.1 were used for image analysis. Specifically, the CTAn application was employed to calculate the porosity characteristics of the samples. Scans of the samples were acquired and processed using a custom routine. Initially, a Gaussian filter with a radius of 1 was applied to reduce noise and enhance image quality. Subsequently, automatic global thresholding was used to segment the void regions of interest from the rest of the sample. Following segmentation, a three-dimensional analysis was performed to quantify the structural properties of the samples.
Mechanical characterization in terms of cold crushing strength (CCS) was carried out for each composition, using specimens measuring 13 mm in diameter and 13 mm in height, according to ASTM C-133-97 [23], employing an Autograph AGS-H testing machine (Shimadzu, Kyoto, Japan). Five specimens were used for each measurement, and the average values obtained were employed for the analysis and comparison of the results. The CCS of refractory materials is evaluated by positioning a suitably prepared specimen on a flat, rigid surface and applying a uniformly distributed load through a bearing block, using a calibrated mechanical or hydraulic compression testing machine. The load is increased steadily until the first visible crack occurs in the specimen, at which point the maximum load is recorded as the cold crushing strength. Throughout the test, the specimen must remain in a flat orientation to ensure uniform stress distribution. The cold crushing strength is typically reported in megapascals (MPa). The CCS is calculated according to the following relationship:
CCS = Load/Area
where Load is the maximum applied force at failure, and Area refers to the loaded surface area of the specimen.
Oxidation and corrosion tests took place at the same time. The specimens (with a hole in the middle) filled with synthetic slag were placed in a furnace and heated at 1500 °C (10 °C/min) for 30 min. The synthetic slag consisted of 56% CaO, 11% SiO2, and 33% Al2O3, according to Jansson et al.’s work [24]. The specimens were subsequently sectioned longitudinally through the central hole to reveal the internal structure for optical inspection or tomographic analysis.

3. Results and Discussion

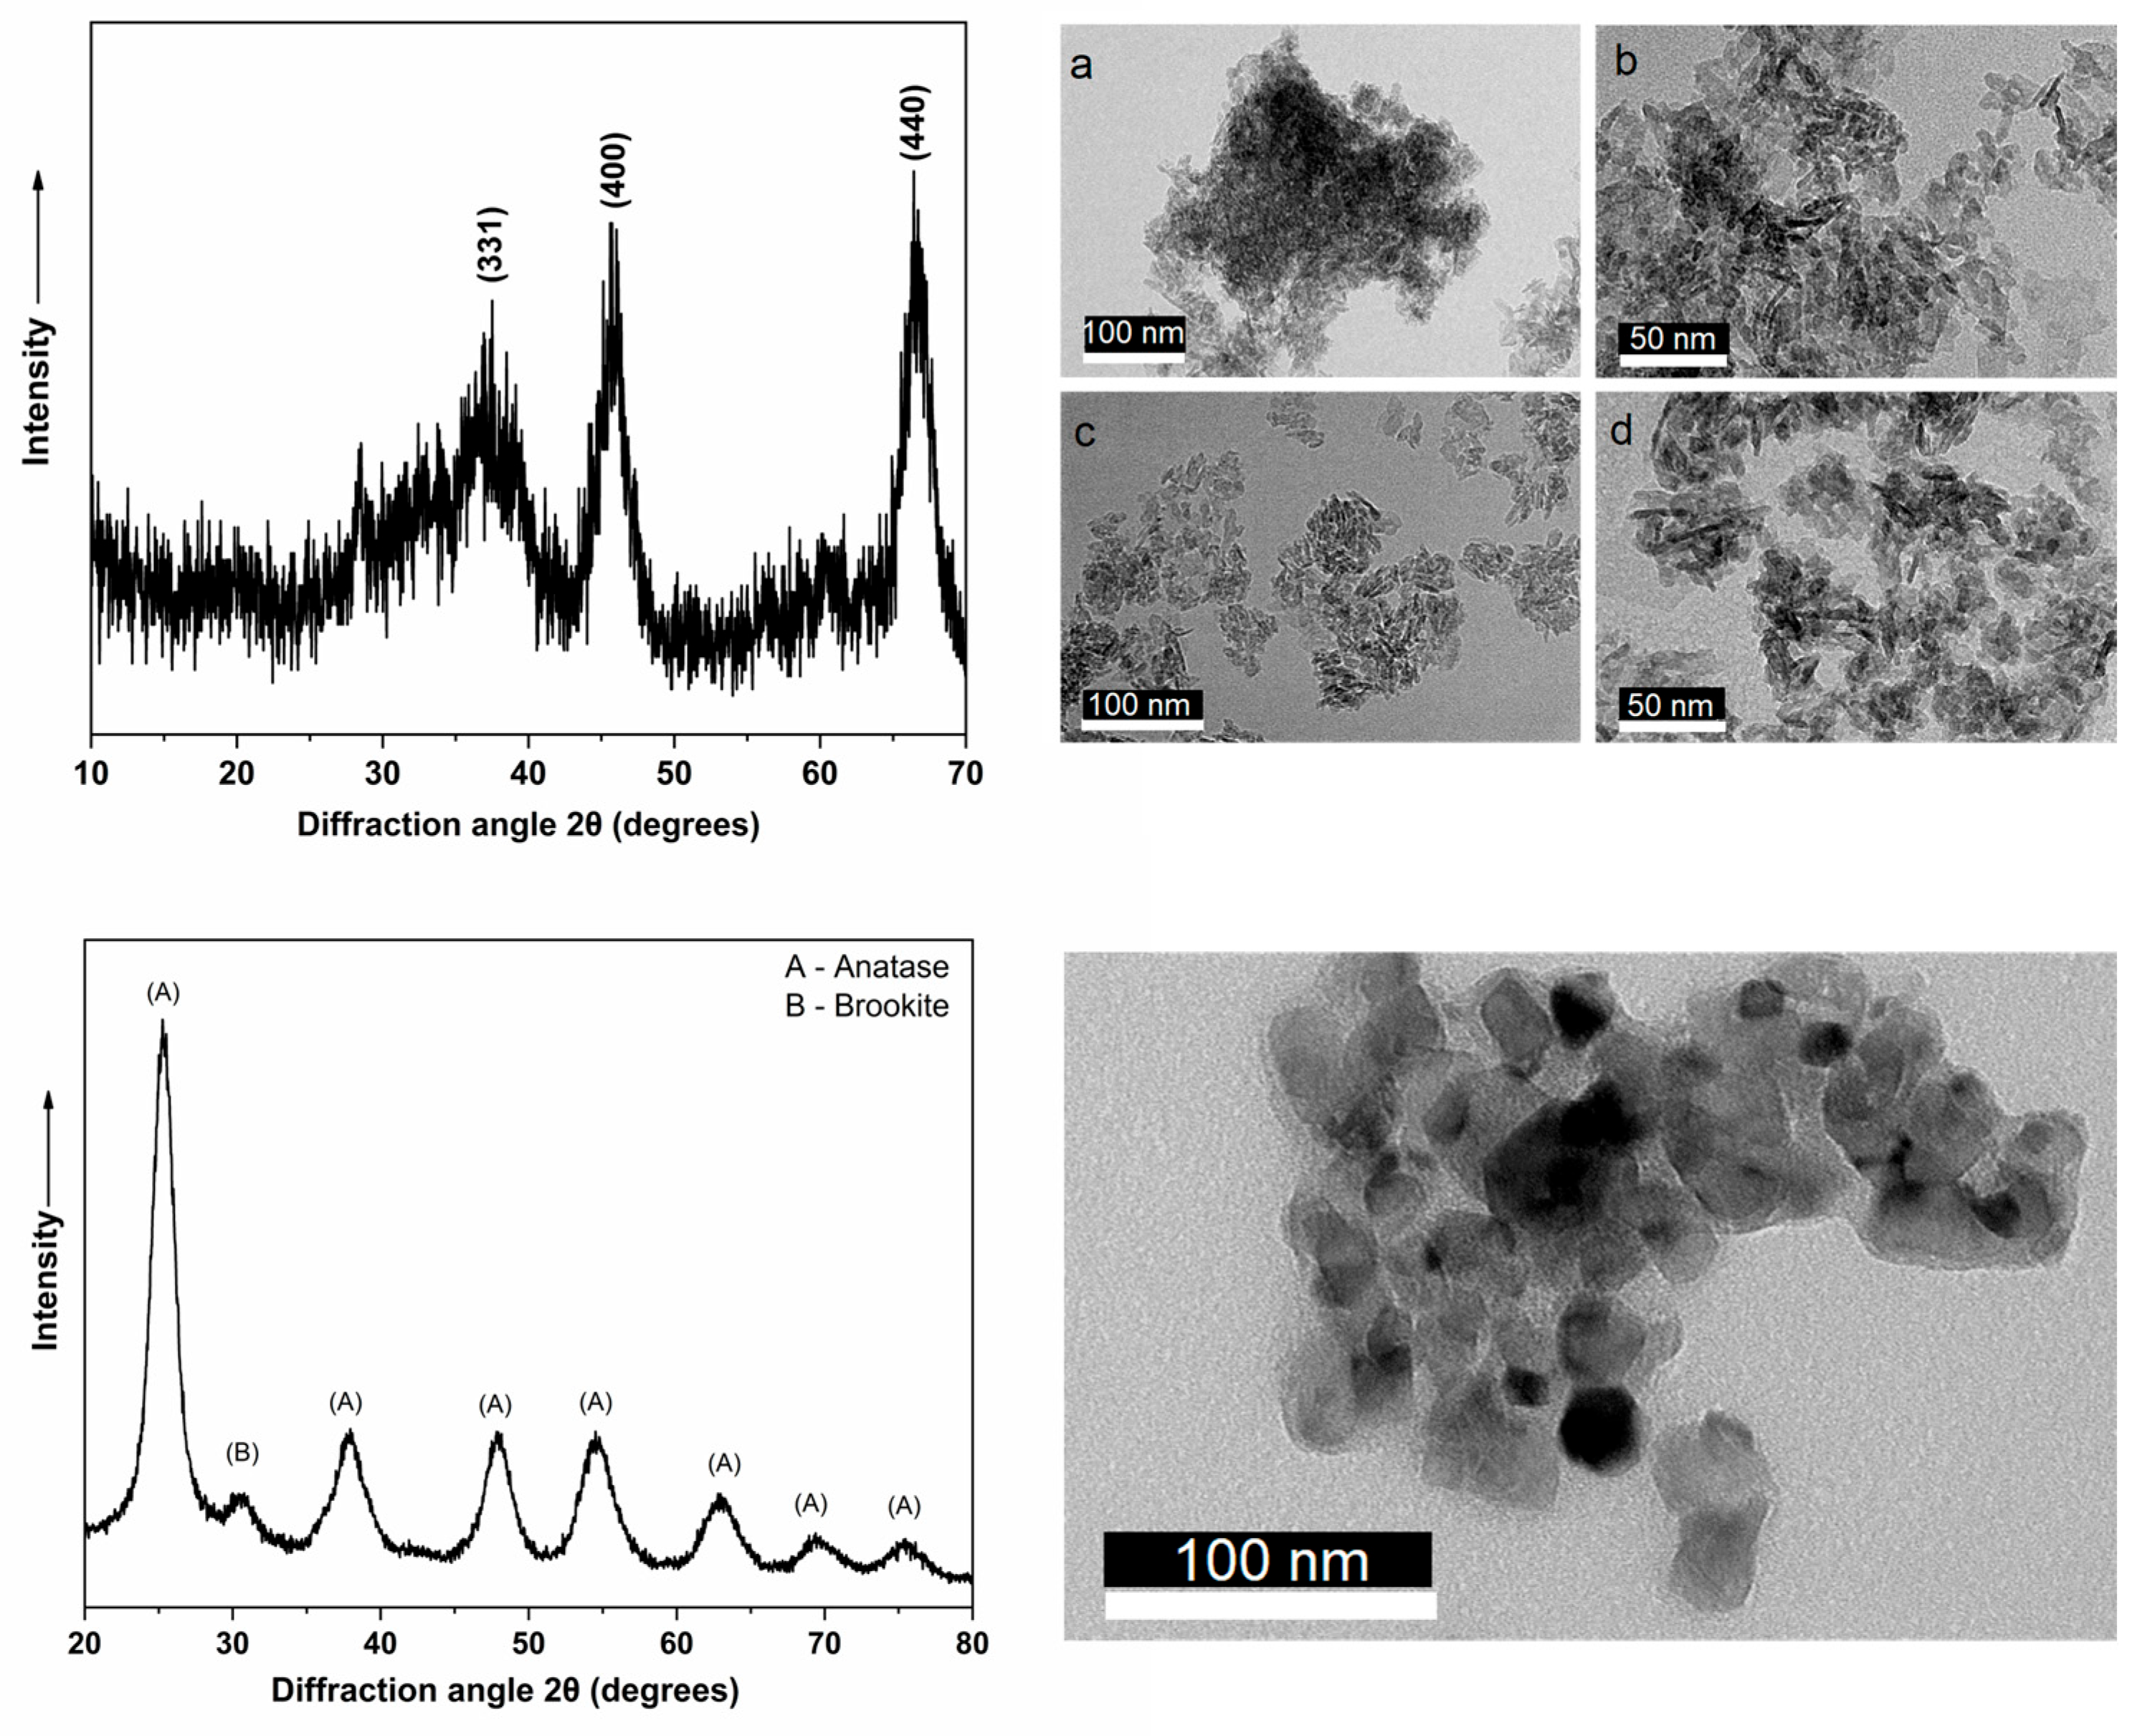
3.1. Characterization of Nanoparticles

The X-ray diffraction pattern of Al2O3 nanoparticles after firing at 600 °C is shown in Figure 1 (top). The sample diffraction intensity is measured in the Bragg angle (2θ) range between 10 and 80°. It becomes clear that the peaks are broad, which is due to the small size of the crystallites [25] and indicates the weak crystalline phase of the material [26]. It is observed that the only phase detected is that of γ-alumina (JCPDS No. 10-425), where the characteristic peaks at angles 2θ = 20, 34, 38, 46, 60, and 67° correspond to the reflections (111), (220), (331), (222), (400), (511), and (440) [27,28]. The crystallite size was calculated using the Scherrer equation at the (400) and (440) planes with the highest diffraction intensity. The average grain size was found to be 5 nm. Figure 1, top, right, a,b present the TEM images of γ-alumina before treatment with dry ball milling, while Figure 1 top, right, c,d display the nanoparticles after treatment. As observed in the first case, the alumina nanoparticles exhibit significant agglomeration, with an average size of 10 nm, leading to clusters of approximately 300 nm. However, in the case where the powder has undergone ball milling, the agglomerate size is noticeably reduced, with an average size of approximately 150 nm.
Figure 1 (bottom) shows the X-ray diffraction pattern at angles of 20–80° of titanium oxide nanoparticles after being washed and dried at room temperature. The hydrothermal method without a further thermal treatment of the sample led to the successful crystallization of titania with well-defined reflections characteristic of anatase-TiO2 (JCPDS No. 01-071-1166). However, for 2θ = 30° there is a low-intensity peak, indicating the presence of brookite (JCPDS No. 01-076-1936) [29]. The crystallite size was determined using the Scherrer equation applied to the (101) plane [30], which exhibited the highest diffraction intensity. The calculated value for the crystallite size was found to be 4.3 nm. In addition, the TEM image of the TiO2 nanoparticles (right) shows a cluster of irregularly shaped particles with varying sizes, ranging from a few nanometers to around 20–30 nanometers in diameter. The particles are mostly spherical or slightly elongated, with some appearing darker due to higher electron density or overlapping.

3.2. Physical Properties of MgO-C Refractories

Figure 2 shows the determined physical properties of the fired bodies containing different contents of the nano-alumina/titania powders. It can be observed that the bulk density of batch B-1, which contains specimens with no nanoparticles, exhibited the highest density value of 2.88 g/cm3. With the addition of alumina/titania nanoparticles, a drop in density was observed, and there was a corresponding increase in porosity without any difference in the values of the different ratios. The only batch of samples that stood out with a slightly increased density was B-3 (75% Al2O3 - 25% TiO2) from 2.66 g/cm3 to 2.78 g/cm3, and simultaneous apparent porosity diminished from ~20% to 16.76%. In previous studies on graphite percentages, it seems that the density values were higher, and the porosity was correspondingly lower. This behavior at first is attributed to the use of a type of magnesia for the composition of the samples, as well as their larger size. Also, the difference in heat treatment played an important role [31,32,33].
In Table 3 the physical properties of MgO-C refractories in relation to Al2O3/TiO2 content are presented.
According to the literature, the addition of alumina/titania nanoparticles to the ceramic structure improved the physical properties of the specimens. However, the formation methods differ in terms of the granulometry of the raw materials, the crystalline phase and size of the specimens, the firing temperature, and even the choice of the percentage of nanoparticles and their crystalline phases, to avoid the appearance of agglomerates [18,19,21,34,35]. Along these lines, the addition of thermally untreated γ-alumina and titania nanoparticles to magnesia–carbon refractories leads to a noticeable reduction in bulk density, likely due to several interconnected factors. For instance, γ-alumina, a metastable phase with a high surface area and low bulk density, does not sinter effectively until it transforms into the stable α-phase at elevated temperatures [36]. Similarly, untreated titania, typically in the anatase or amorphous form, exhibits poor sintering behavior and lower density compared to the rutile phase [37,38]. These untreated nanoparticles tend to agglomerate due to surface hydroxylation and moisture adsorption, resulting in pores and reduced packing efficiency. Additionally, phase transitions such as the γ-to-α transformation in alumina and the anatase-to-rutile transformation in titania can induce microcracking and structural disruptions during firing.

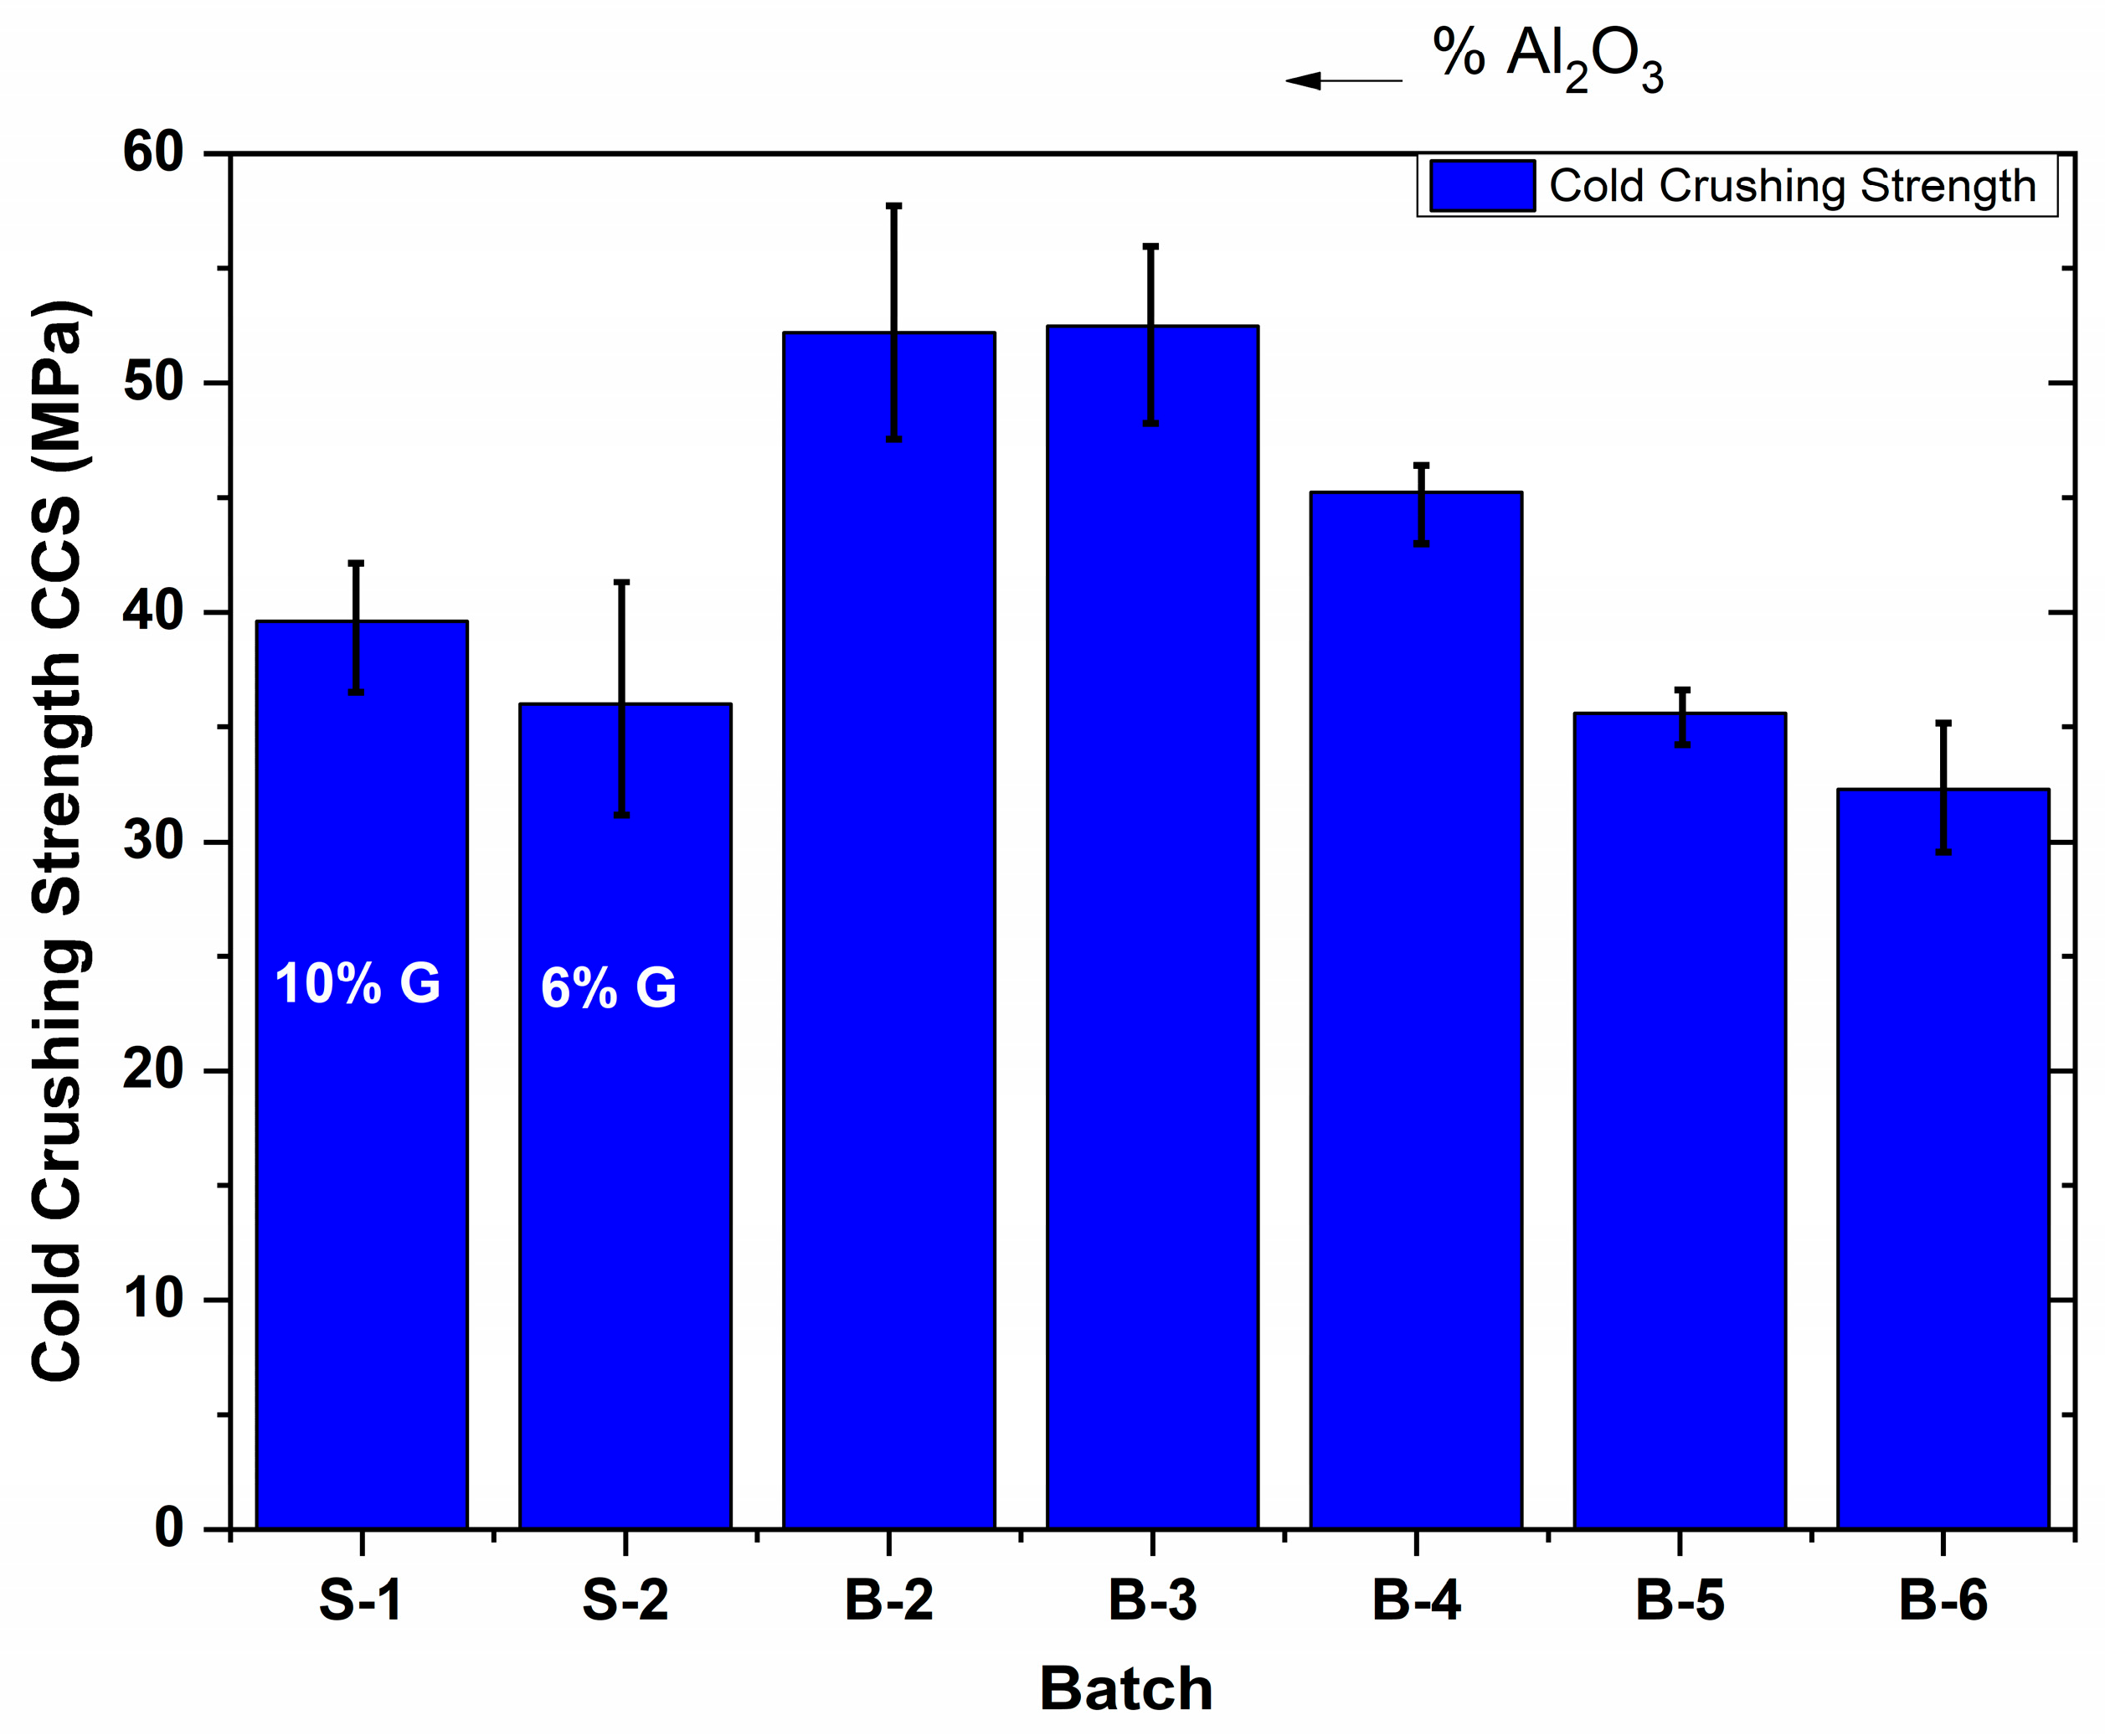
3.3. Mechanical Properties of MgO-C Refractories
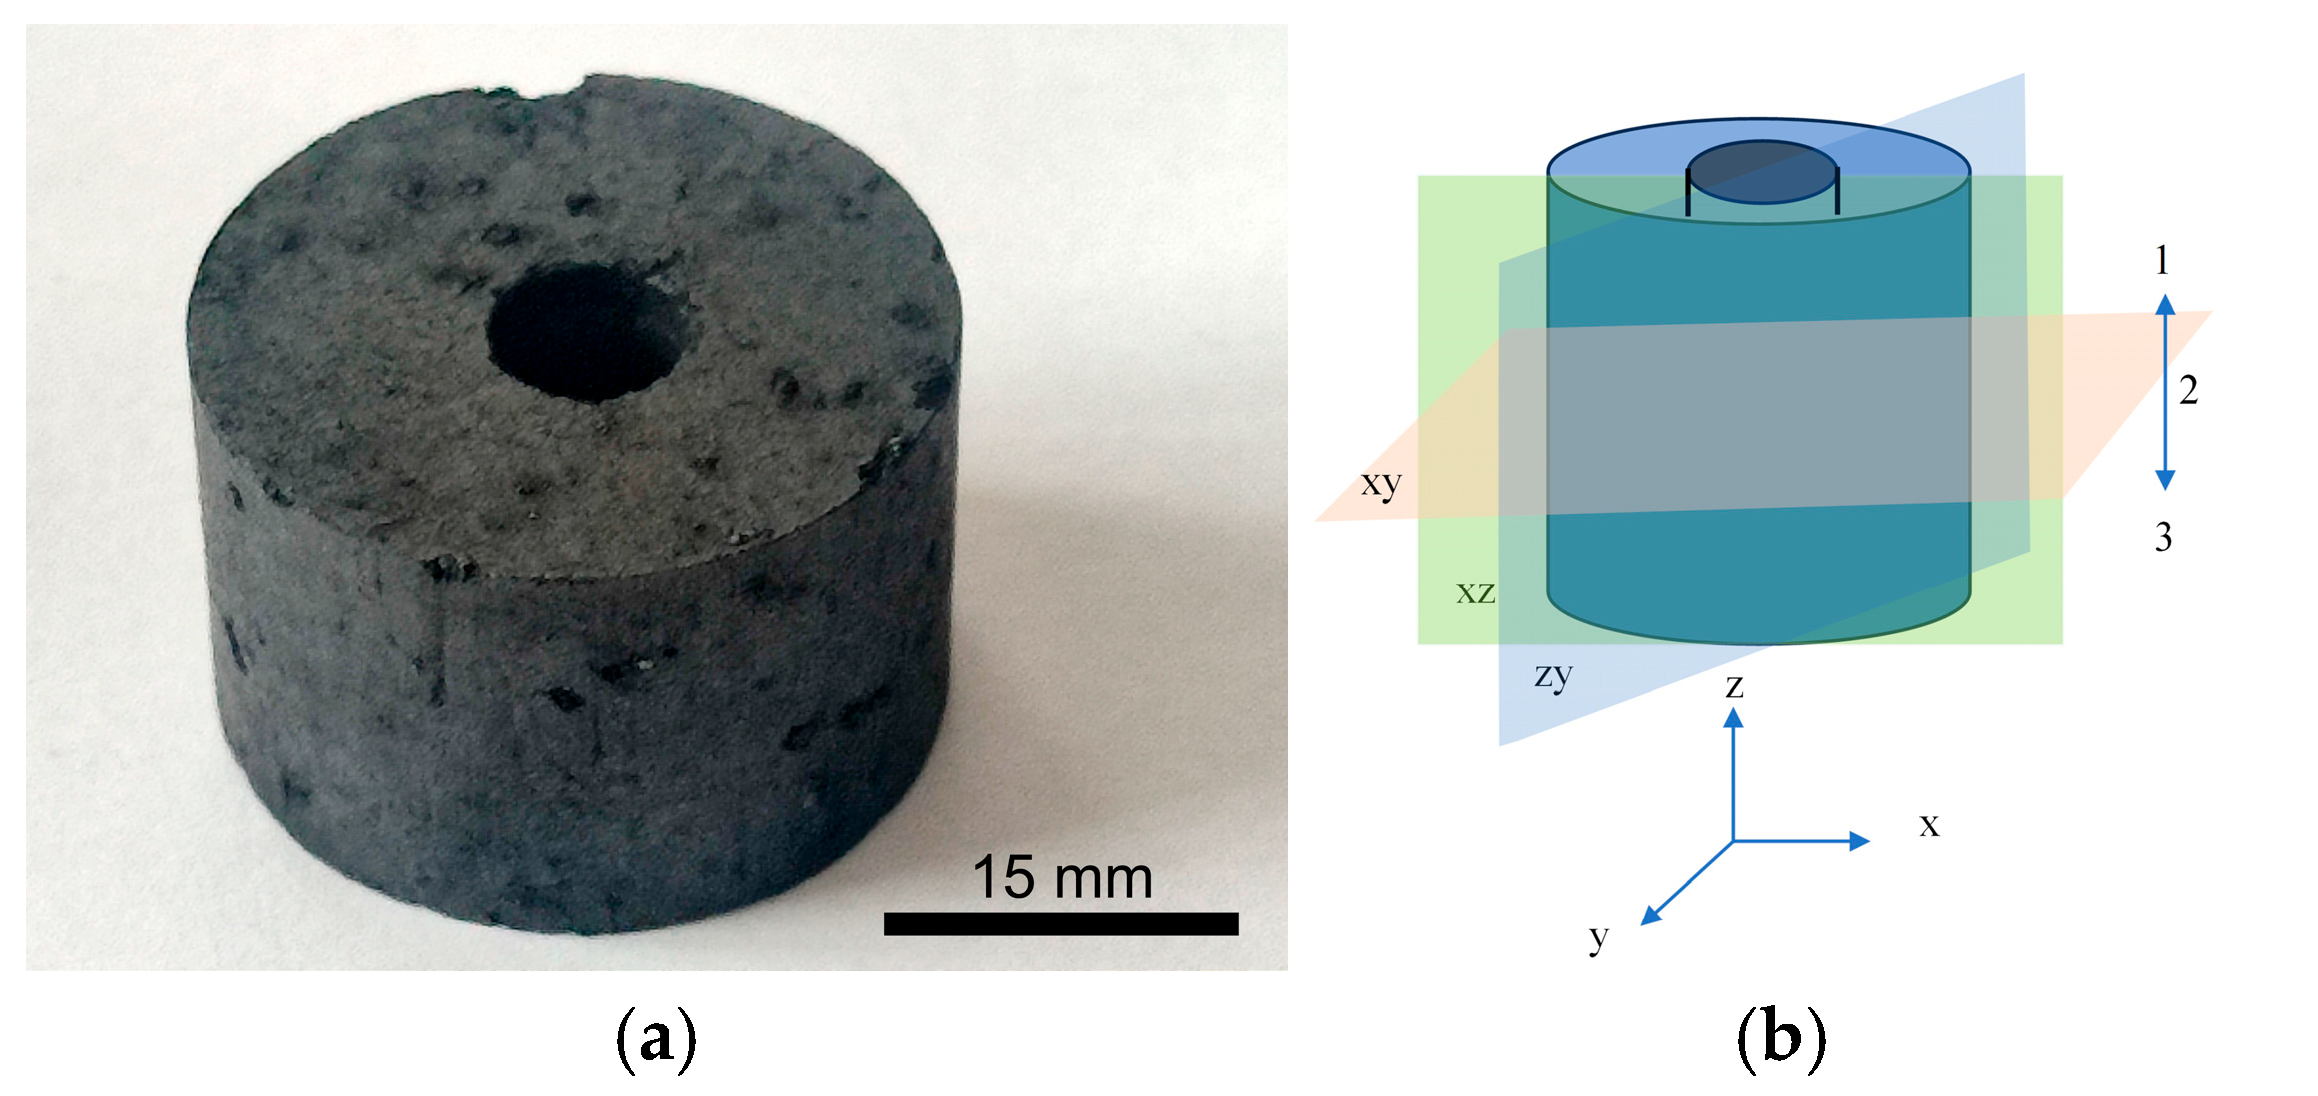
Figure 3 illustrates the cold crushing strength (CCS) of magnesia–carbon specimens from different batches as a function of the ratio R = Al2O3/TiO2. Regarding the incorporation of nano-additives, it is observed that the addition of nano-alumina, along with a reduction in the proportion of nano-titania, leads to an improvement in the compressive strength of the specimens, surpassing that of specimens without nano-additives.
This enhancement is also observed in specimen B-4, beyond which the cold crushing strength of subsequent specimens shows a decreasing trend with increasing TiO2 content, initially approaching the values of the reference samples S1 and S2 (specimen B-5) and ultimately exhibiting even lower strength values (specimen B-6). These results suggest that the presence of alumina enhances the mechanical strength of the specimens. The separate addition of aluminum oxide and titanium oxide nanoparticles to magnesia–carbon refractory composites has been reported to result in compressive strength values ranging from 35 MPa to 38 MPa for micro-alumina and from 35 MPa to 41 MPa for nano-alumina when incorporated at levels of 2–8% [18,34]. On the other hand, when only alumina or alumina–titanium nanoparticles were incorporated, the compressive strength of the reference refractory material increased from approximately 35 MPa to 40 MPa with an increase in nano-titania content from 0 to 1.5 wt% [18]. In our case, it appears that the use of alumina nanoparticles or a combination of alumina and titania nanoparticles (up to 6.5 wt%) leads to a significant improvement in the compressive strength of refractories, exceeding 50 MPa. These findings are in agreement with the existing literature. On the other hand, as mentioned in the Introduction, the addition of alumina nanoparticles has been reported to reduce the cold crushing strength (CCS) in pure MgO matrices [21]. This phenomenon can be attributed primarily to the absence of carbon in the system. In MgO-C refractories, carbon creates a weak matrix but also enables beneficial chemical reactions: alumina nanoparticles can interact with carbon and trace amounts of oxygen or slag components at elevated temperatures to form spinel (MgAl2O4) or alumina-rich complex phases [34,39]. These secondary phases strengthen the bonding between MgO grains and improve the overall mechanical integrity of the composite. In contrast, in carbon-free pure MgO matrices, although the addition of nano-Al2O3 may still promote spinel formation, it also tends to induce microcracking and may lead to the segregation of nanoparticles at grain boundaries, where they can act as structural discontinuities or weak inclusions, ultimately compromising the mechanical strength.
With regard to the observed deviation from the general trend of higher density correlating with improved mechanical properties in magnesia–carbon specimens, this behavior may be attributed to the complex role of nanoparticles within the microstructure. When properly dispersed, alumina nanoparticles can function not only as crack arresters but also as fillers that occupy intergranular voids and bridge microcracks. This bridging effect can interrupt crack propagation pathways, redistribute localized stress concentrations, and thereby enhance the overall fracture resistance of the composite, even in cases where the bulk density is not significantly increased. Moreover, nanoparticles may promote the formation of secondary phases at grain boundaries, enhancing bonding between MgO grains and the carbon matrix. These microstructural improvements can counteract the negative effects of lower density, resulting in mechanical properties that exceed expectations based on density alone. Thus, the mechanical behavior of such systems depends not only on density but also on phase distribution, particle dispersion, and crack-bridging mechanisms.

3.4. μCT Study

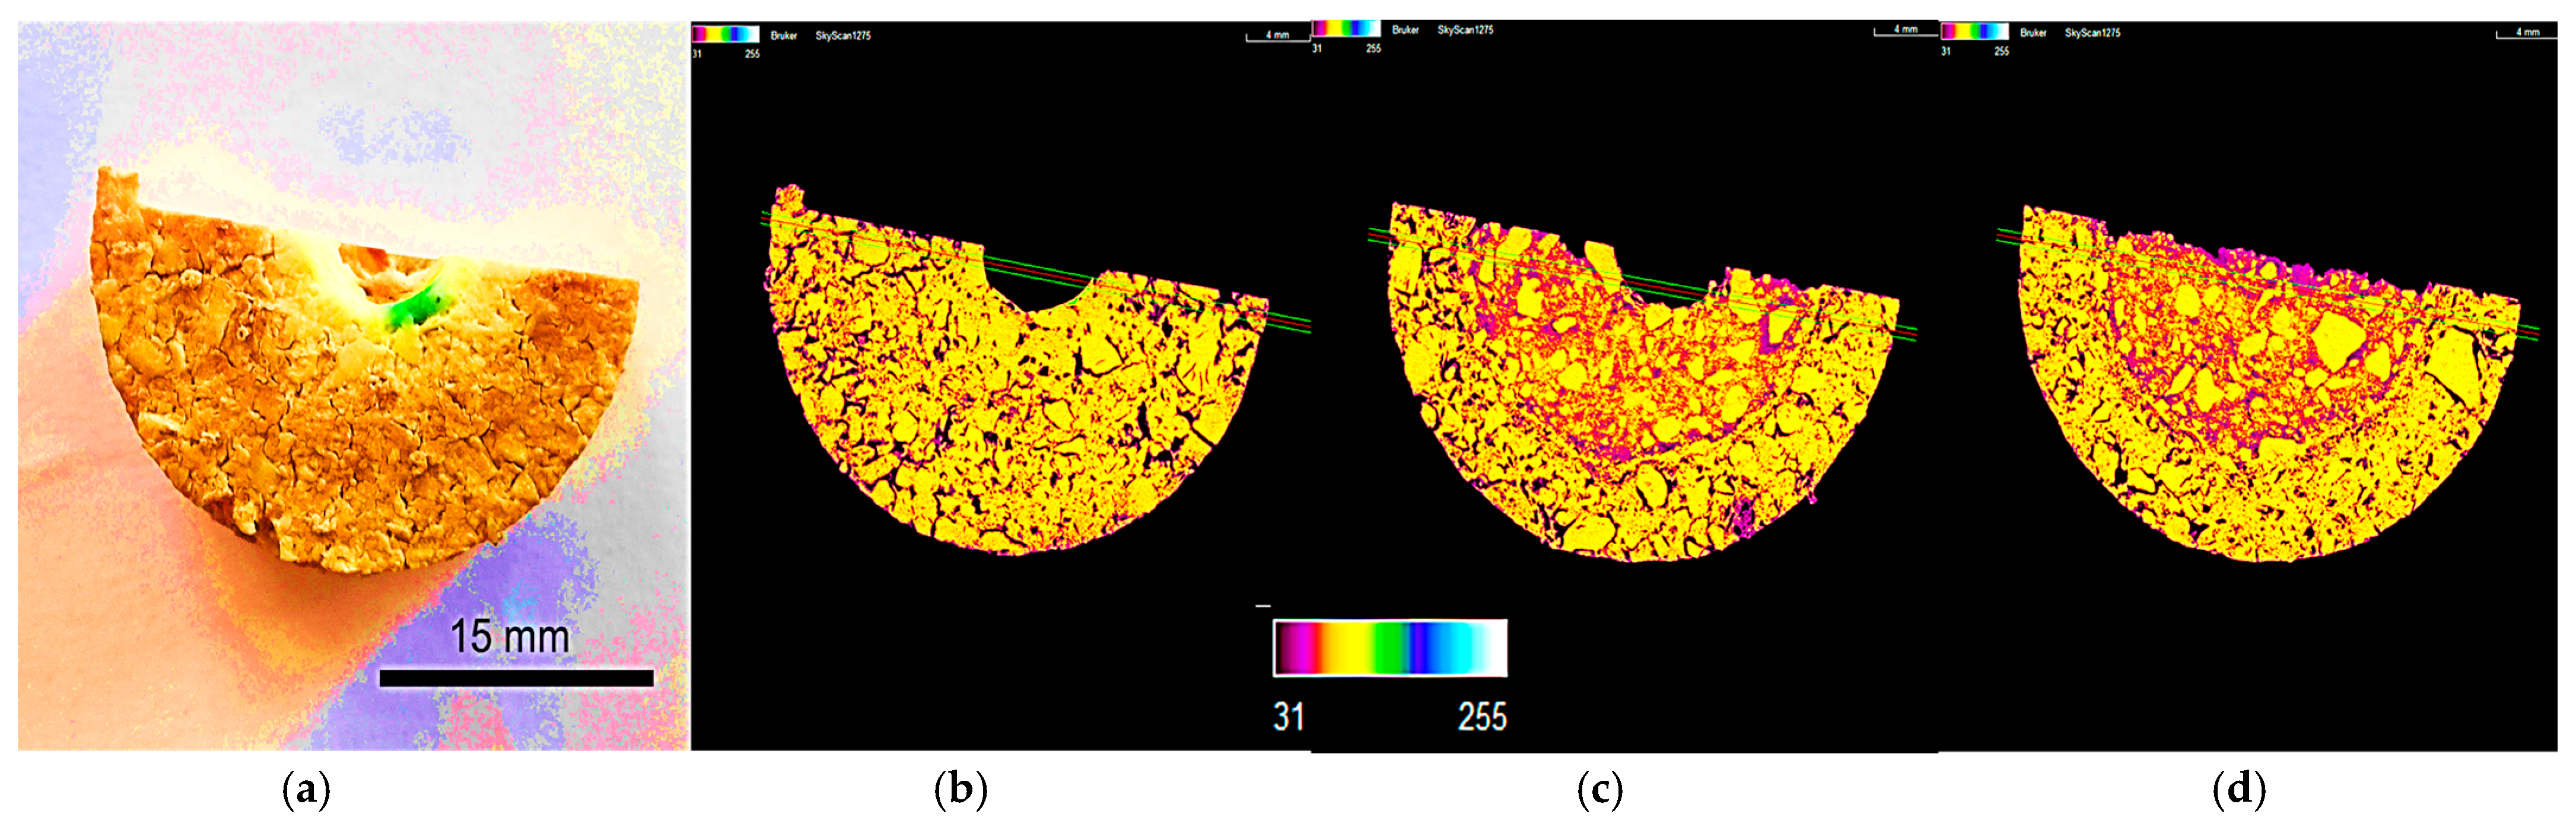
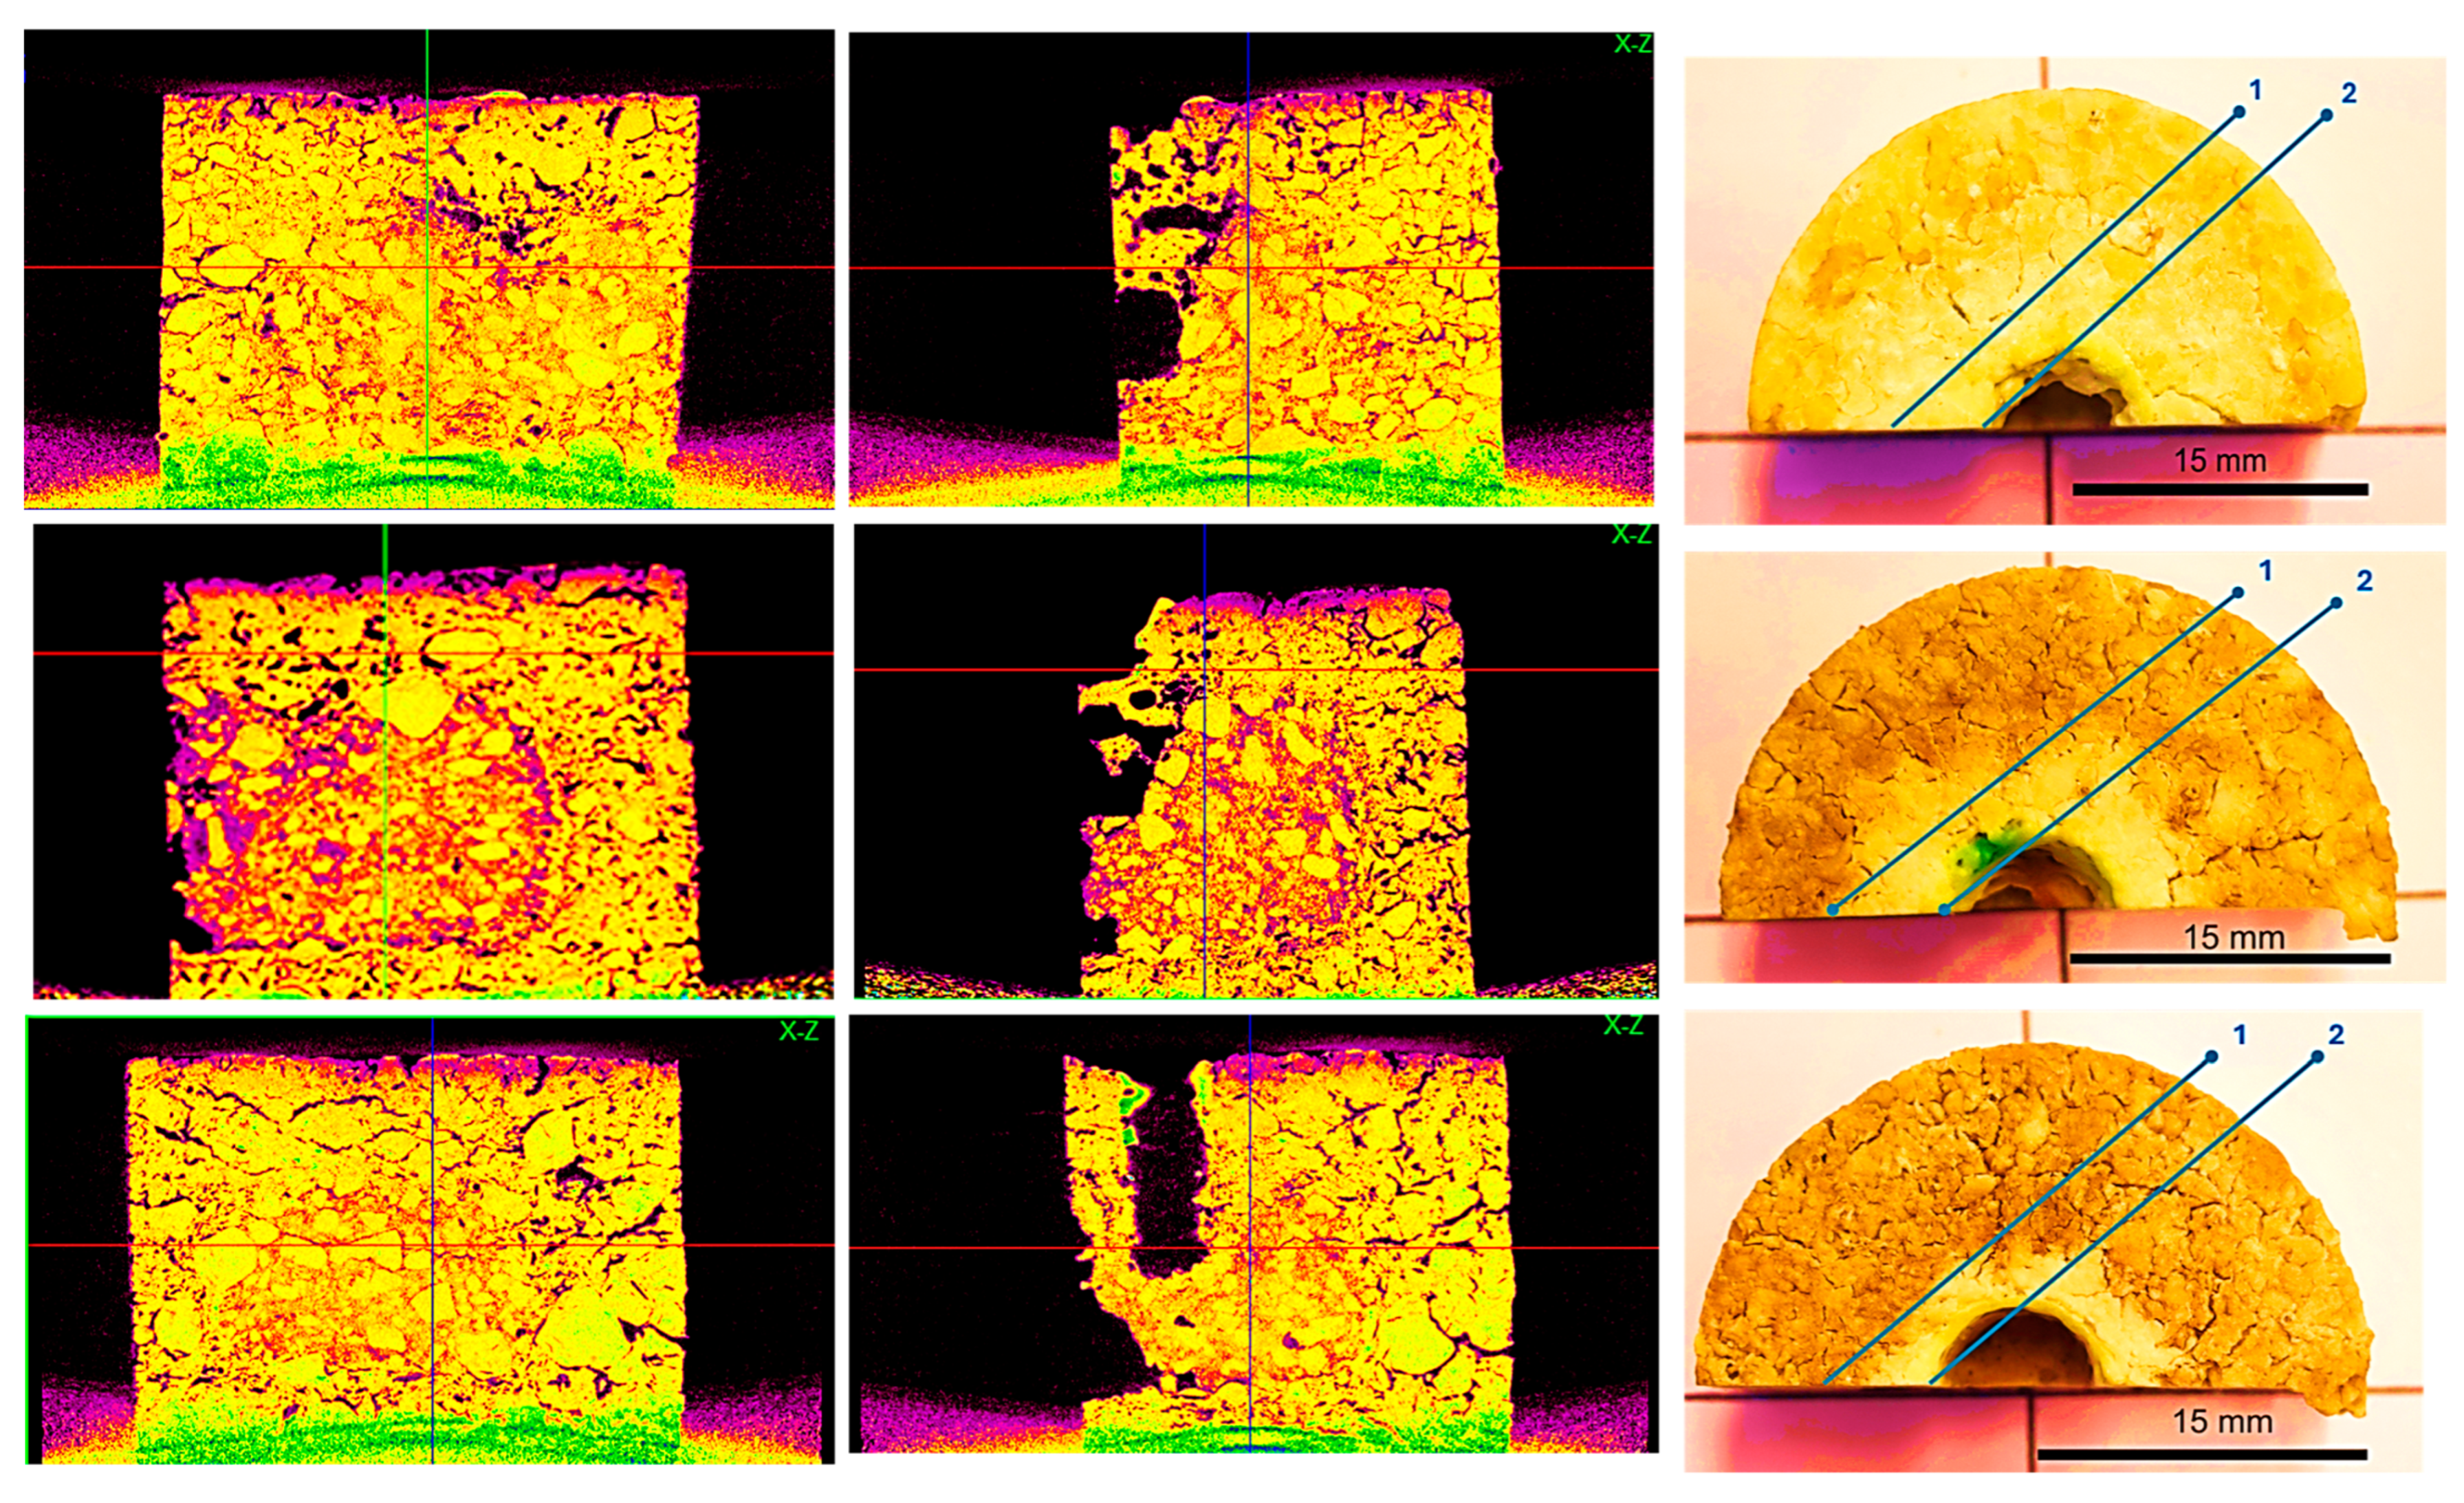
3.4.1. Density Color Mapping

X-ray micro-computed tomography (μCT) can provide a high-resolution 3D visualization of the internal structure of magnesia–c refractories without the destruction of samples as takes place in microstructure studies using optical microscopy. It allows for the assessment of porosity, pore size distribution, and crack formation, which are crucial for understanding refractory performance and durability [1]. Additionally, μCT enables the visualization of phase distribution, including MgO grains, carbon, and secondary phases, while also providing insights into degradation mechanisms such as carbon oxidation and slag penetration. Below, we conduct a parallel study using optical microscopy and X-ray microtomography on magnesia–carbon refractories containing 7 wt% alumina and titania nanoparticles in various ratios, aiming to investigate the accuracy and effectiveness of μCT for oxidation and corrosion studies of these refractories.
Figure 4 shows a representative cylindrical specimen of the prepared refractory (a), along with a schematic representation of its possible cross-sections (b). The specimen (a) has not undergone any processing, except for the addition of a small cylindrical hole that is visible at its center, which was created for the corrosion experiments. After the corrosion and oxidation experiments, the specimens were cut vertically along the zx-plane (Figure 1b), producing rectangular cross-sections to study the samples by visual observation.
Virtual sections of the specimens were generated from the X-ray tomography data. Two types of sections were created: (1) vertical sections in the zy-plane, where the cuts pass through the small cylindrical holes and produce rectangular cross-sections defined by chords across the semicircular profiles (Figure 4b), and (2) horizontal sections in the xy-plane, taken at different vertical positions (labeled 1, 2, and 3 in Figure 4b), where the cylindrical holes appear as circular or semicircular cross-sections.
The refractory samples contain MgO particles with different grain sizes; amorphous carbon produced from the pyrolysis of resin, graphite, alumina, and titania nanoparticles; and small amounts of aluminum and boron carbide. These materials have different densities, such as MgO (3.58 g/cm3), carbon (2 g/cm3), graphite (2.2 g/cm3), Al2O3 (3.98 g/cm3), TiO2 (4.5 g/cm3), and Al (2.7 g/cm3), which significantly affects the distribution of colors in the cross-sections obtained from μCT, in refractory samples. The colors in the context of the μCT colorbar correlate to an “Index”; each voxel within the reconstructed volume is assigned an intensity value, which typically corresponds to the material’s X-ray attenuation coefficient, and is related to physical properties such as sample density and composition. The colorbar provides a visual mapping between these intensity y values and specific colors. Lower index values generally represent lower attenuation and are assigned darker colors, while higher index values represent higher attenuation materials and are mapped to brighter or warmer colors. Thus, the colorbar index serves as a reference that links voxel intensity to material properties within the scanned object. For example, pores and cracks are usually shown in black. However, it should be noted that what a sample cross-section reveals largely depends on the resolution of the instrument, or the so-called voxel size of the tomograph, which refers to the 3D pixel resolution of the scanned volume. Thus, structures smaller than 20 µm cannot be reliably resolved, and features approximately the size of or smaller than the pixel size may not be visualized.
Figure 5b shows the tomographic circular cross-section recorded at the midpoint-2 of specimen B-1. A large number of particles corresponding to magnesia grains depicted as yellow and neon green-colored areas (density of 3.58 g/cm3) with a broad size distribution can be observed, which are attributed to their high density and the initial batch formulation, which included three distinct magnesia grain sizes. These small and large magnesia grains appear embedded within a continuous matrix exhibiting lower-intensity colors such as orange and purple, corresponding to regions of lower density. Additionally, a few black spots are present, representing empty pores or cracks.
The orange-colored matrix is likely associated with amorphous or graphitic carbon, whose typical densities are approximately 2.2 g/cm3, and may also contain small, dispersed inorganic particles, primarily magnesia. The purple-colored areas can be attributed to densities <2 g/cm3, due to the poor sintering of the raw materials or the oxidation of carbon during the pyrolysis of the resin. The circular cross-section (Figure 5c) of the same sample, recorded near the base–point 3—appears to be similar to the cross-section at point 2, with no apparent differences, suggesting the same microstructure.
In contrast, the circular cross-section (Figure 5a), recorded near the surface of the sample—point 1—shows an intensity shift in the continuous phase towards purple, while the areas corresponding to voids (black areas) are present at a higher frequency. The observed difference suggests a lower density of the continuous phase, which can be attributed to the oxidation of carbon during the preparation of the specimen. Cross-section 5a is near the sample surface, which comes with the consequence of a larger possibility for oxidation from the furnace atmosphere. It is also noted that at the center of the cross-section, a black circle is formed by the empty cylindrical space created for the corrosion tests and intersects with the tomographic section.

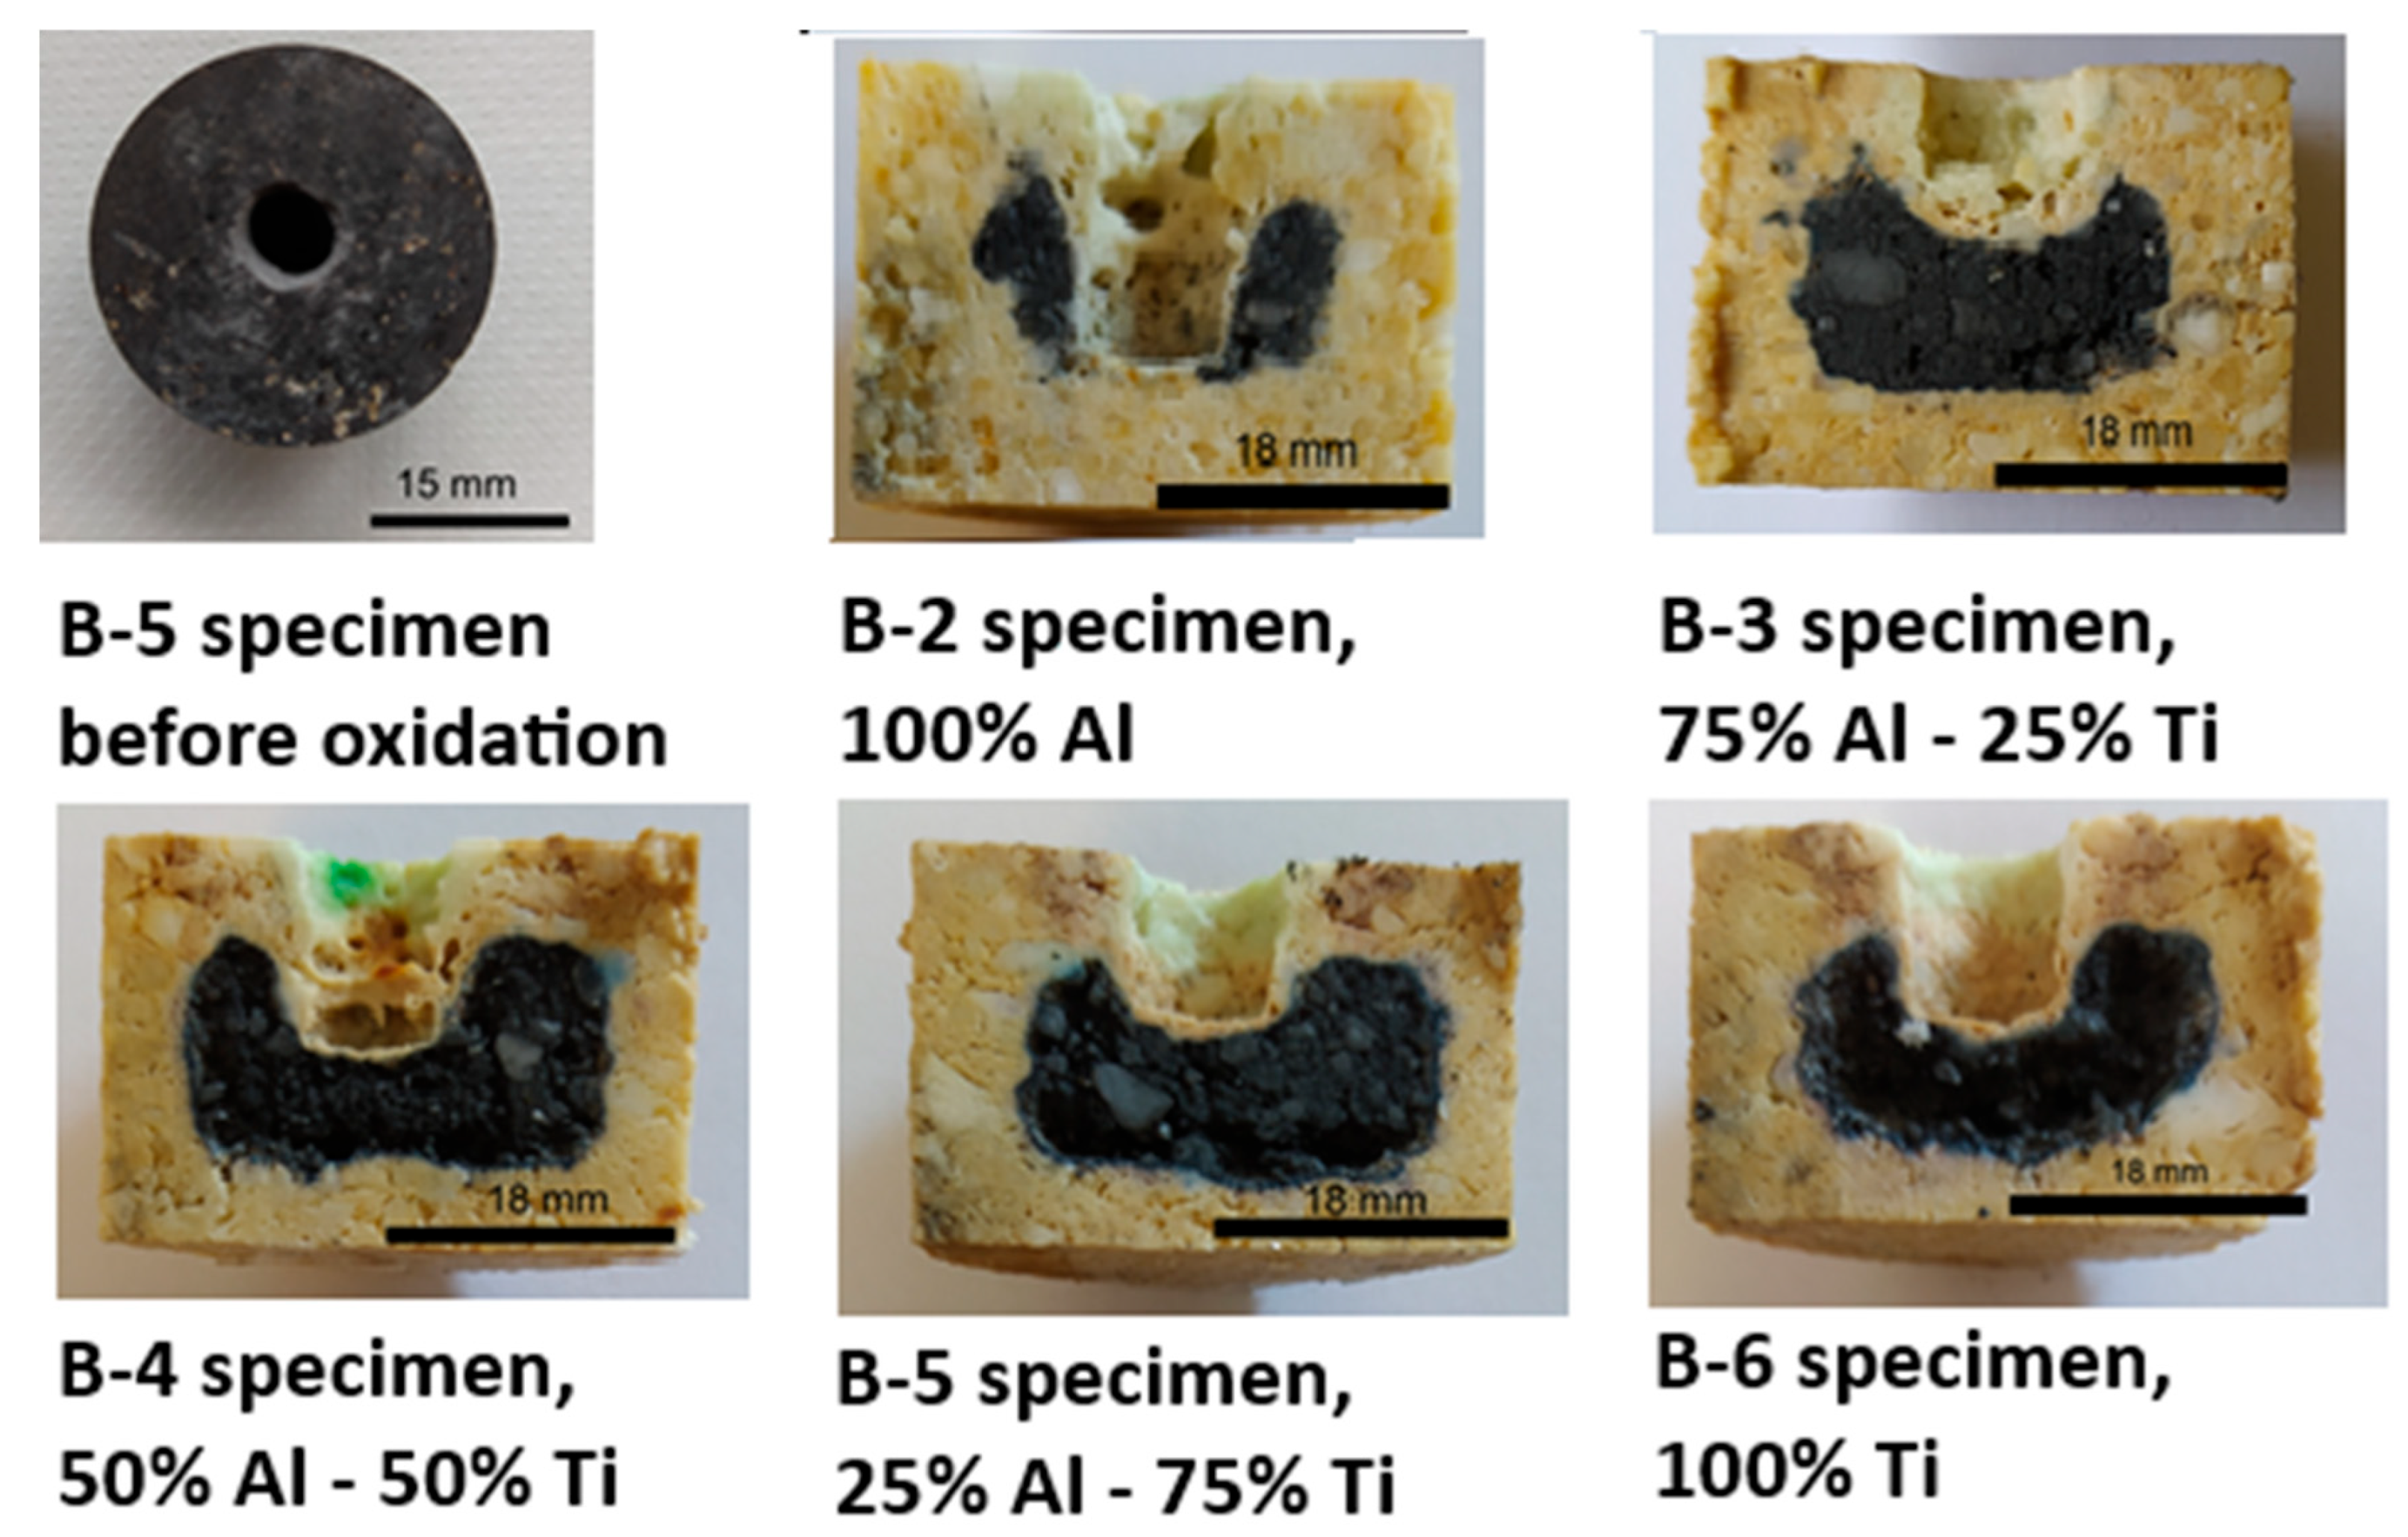
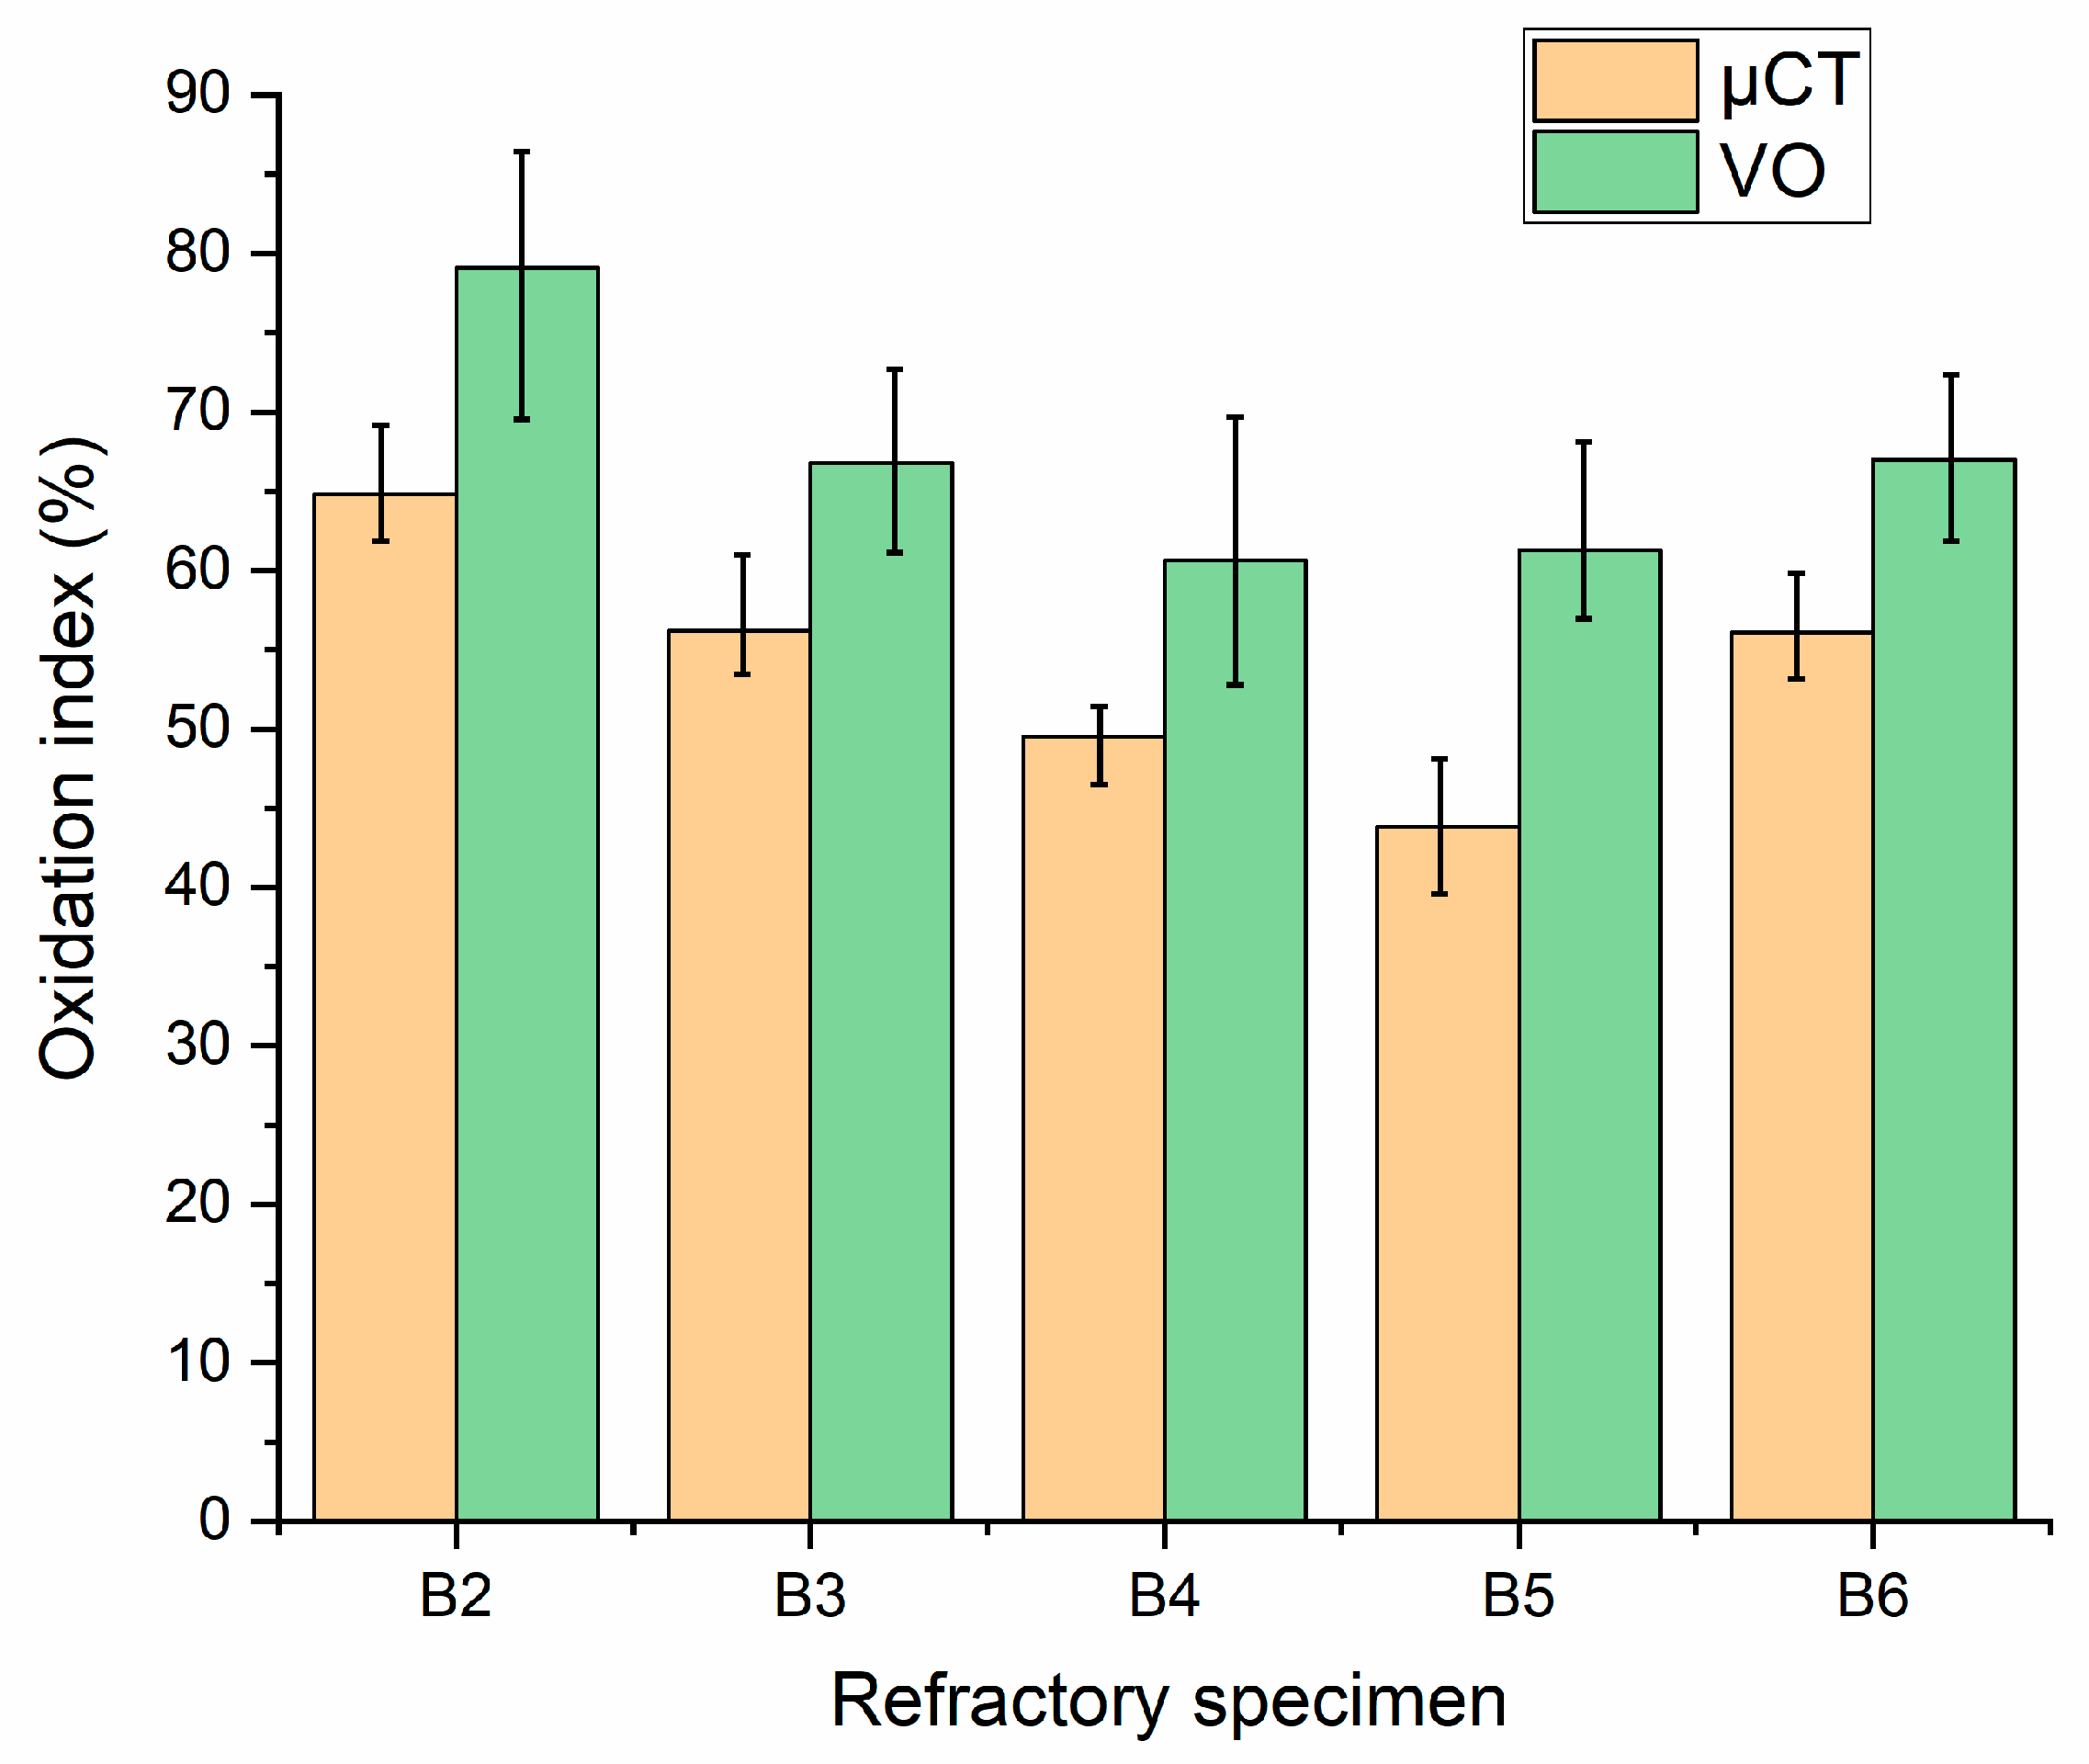
3.4.2. Oxidation Resistance

The determination of the oxidized areas in the computed tomography (CT) slices was analyzed by density “color” mapping and texture variations. Oxidation alters the material’s density, which in turn changes its appearance in the CT images. The regions that previously contained carbon exhibit lower-density areas, visible as continuous purple zones in the CT images. After oxidation, carbon undergoes significant degradation that leads to pores and cracks appearing in the microstructure, which can be observed in CT scans (Figure 6b–d). Figure 6a shows a photograph of sample B-4 (MgO-C refractory with the addition of titania and alumina NPs in a 1:1 ratio) after oxidation and corrosion tests. The specimen was cut in half vertically (xz-plane), and photographs were taken in the z direction above the sample surface (xy-plane according to Figure 4b). A rough surface with cracks is observed, while at the center, the corroded area with a white color or greenish tint has penetrated in a circular arc toward the interior of the sample.
On the other hand, the tomographic semicircular cross-section (Figure 6b), recorded near the surface of the sample—point 1—shows the presence of mainly two distinct phases, depicted in yellow and black, suggesting the complete oxidation of carbon and the formation of numerous voids that appear as pores and cracks. Only the corroded area appears to lack dark spots due to the phase of the corrosive agent. In contrast, the semicircular cross-sections (Figure 6c,d) of the same sample, recorded near the base, point 3, and at the middle, point 2, appear to have undergone the same oxidation only within a semicircular ring that starts from the perimeter of the sample and extends up to one-third of the ring’s radius. This section appears very similar, with a high degree of oxidation, as also indicated by the tomography cross-section in point 1. In the remaining area, the cross-sections of both samples exhibit a distinctively different microstructure region in the form of a semicircular inner disk, where a nearly continuous phase with a purple hue dominates. Within this phase, magnesia particles are observed. Simultaneously, a reduced number of void regions (corresponding to black areas) are present; this behavior is attributed to the partial oxidation of carbon, which decreases the density of the continuous phase (typical orange hue) but does not yet allow for the formation of voids.
Figure 7 shows rectangular cross-sections of the MgO-C samples, obtained by cutting them perpendicularly along the zx-plane (see Figure 4b). The samples had been previously used in corrosion and oxidation experiments. This procedure was carried out to facilitate the study of their oxidation through direct visual observation. Based on the ratio of the areas of the two regions—black and beige colors—in the samples, the percentage of the non-oxidized refractory material [40,41] was calculated and compared with the corresponding tomography results. To compare the accuracy of tomography measurements, the oxidation index (OΙ) was calculated based on the tomographic slices for point 3 (Figure 4b, xy-plane) and compared with the values obtained through visual observation (VO). The oxidation index is used as an indicator to evaluate the oxidation resistance of MgO-C refractories. The calculation of the OI involves the measurement of the oxidized area of the refractory sample after heat treatment and the total area, as depicted in the following equation:
OI = (area of oxidized zone/total area) × 100%
Figure 8 compares the oxidation index calculated after cross-sectional analysis using μCT data and visual observation (VO). Assuming the absence of a hole—experimental slag—and thus uniform oxidation, an attempt was made to determine the size of the non-oxidized area using ImageJ version 1.151n software. Specifically, appropriate brightness and contrast adjustments were applied to optimize the visual distinction between the oxidized and non-oxidized regions. Subsequently, by selecting an appropriate threshold value, the two regions were defined. Based on this distinction, the surface areas of both the oxidized and non-oxidized zones were calculated, providing quantitative data on the extent of oxidation. The OI was subsequently estimated using Equation (8). In parallel, the same index was also calculated using μCT measurements and ImageJ software, based on horizontal circular tomographic slices at point-3 (Figure 4b, xy-plane). ImageJ was employed to segment two distinct regions within each slice and to quantify their respective areas, which were then used in the calculation of the index according to Equation (8). The results were compared with the values obtained through visual observation (VO) for each corresponding specimen.
The oxidation index calculated by both methods follows the same trend. The OI values obtained through visual observation are higher, which is justified by the fact that the sections for visual observation include the holes created for the corrosion tests. These holes reduce the distance between the interior of the refractory material and the oxidizing atmosphere, increasing OI values. It is evident that, according to the results of both methods, when the refractories contain alumina and titania nanoparticles together as additives, the OI systematically decreases with increasing titania content.

3.4.3. Corrosion Evaluation

X-ray microtomography was also utilized to investigate the corrosion of MgO-C refractories. The μCT scans revealed distinct regions of reduced density and microstructural discontinuities, particularly along the slag–refractory interface. These features correspond to areas where corrosion had progressed, including the dissolution of magnesia grains and the oxidation or removal of carbon. The slag penetrated through interconnected pores and cracks, leading to localized damage and the formation of corroded channels. The corrosion front was clearly delineated in the tomographic slices, allowing for an accurate assessment of corrosion depth and volume loss. Figure 9 (left, middle) displays the tomography image from the vertical cross-section of samples B-2 (xz), B-4 (xz), and B-6 (xz), taken in directions 1 and 2 (Figure 9—right). We observe that the tomographic images reveal the porous structure of the refractories after the slag attack (Figure 9, middle, direction 2), while the length and depth of the corrosion can also be accurately determined without the need to cut the specimens. On the contrary, the cross-sections in direction 1 (Figure 9, left), i.e., in the non-corroded section, do not exhibit significant porosity but only show traces of oxidation that alter the microstructure of the section. In general, however, a more thorough analysis of the distinct corrosion behavior among the specimens would require combined information, particularly from scanning electron microscopy (SEM) data, which was beyond the scope of the present study.

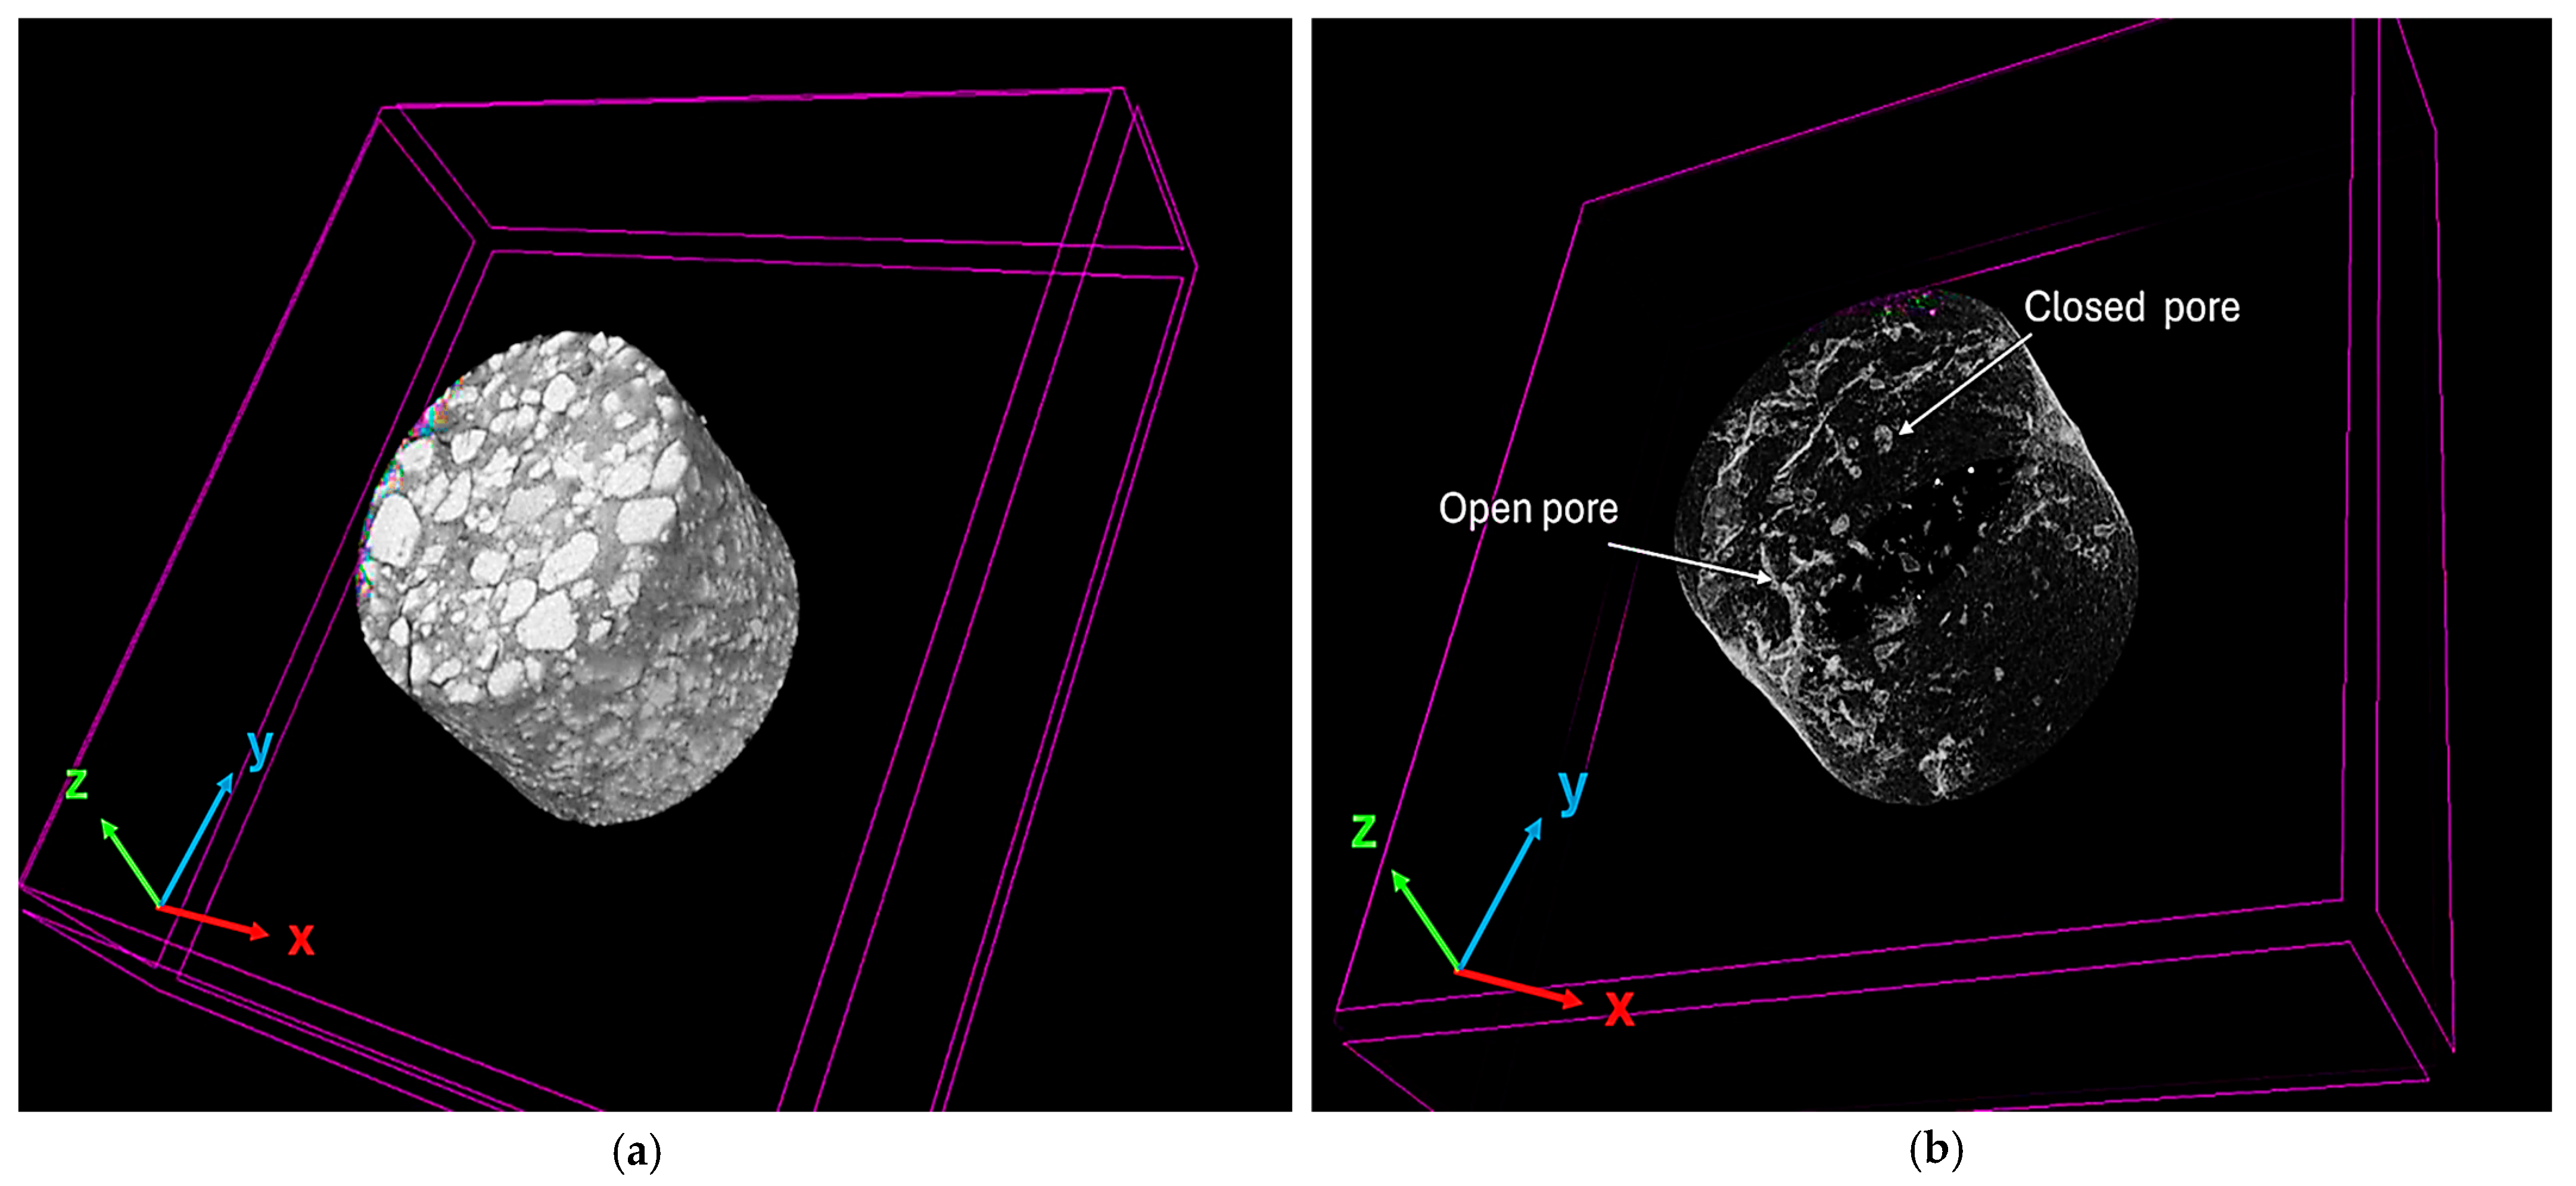
3.4.4. Calculation of Closed Porosity

As already mentioned, the ability of X-ray microtomography to precisely identify and examine closed pores, which are otherwise challenging to view using conventional techniques, is one of its main advantages. The size, distribution, and morphology of closed pores—all of which have a significant impact on the mechanical strength, thermal insulation, and general performance of refractories—can be revealed by high-resolution imaging using μCT. Thus, open and closed porosities of 2.8, 6.3, and 6.0% and 1.3, 2.1, and 1.46% for samples B-2, B-4, and B-6 were calculated, respectively. Figure 10a shows a representative 3D image of the B-4 specimen obtained by μCT through CTVox v.3.3 software, whereas Figure 10b provides a visual representation of the calculated open and closed porosities of the sample (shown in light shading). The arrows in Figure 10b highlight areas with closed and open pores. Τhese values exhibit a significant deviation from the apparent porosity values of the same samples as calculated using the Archimedes method. It is important to note, however, that the Archimedes method exhibits significantly greater sensitivity, being capable of detecting pores as small as 1–2 μm. In contrast, the tomography system used in the present study is limited to resolving pores approximately 20 μm and larger. Despite this limitation, μCT measurements can capture both open and closed porosities, leading to the conclusion that the total porosity of the refractories—as measured by Archimedes (i.e., the apparent porosity)—should, by comparison, be considered at least 4–6% higher to account for the undetected closed pores.
4. Conclusions
In this study, Al2O3 and TiO2 nanoparticles were synthesized and incorporated into low-carbon MgO-C refractories to evaluate their effects on physical, mechanical, and corrosion-related properties. The nanoparticles, with an average size of 10–20 nm and forming aggregates of 100–300 nm, resulted in a deterioration of physical properties, as evidenced by a 3.5–8.0% decrease in bulk density, an associated increase in porosity, and reduced compactness. However, the incorporation of up to 6.5 wt% alumina nanoparticles, or a combination of alumina and titania nanoparticles (with titania content up to 1.5 wt%), significantly enhanced the compressive strength, exceeding 50 MPa. This improvement is primarily attributed to beneficial chemical reactions between the alumina nanoparticles and carbon and oxygen at elevated temperatures, leading to the formation of spinel (MgAl2O4) or alumina-rich complex phases. X-ray micro-computed tomography (μCT) effectively visualized material distribution, pores, and oxidation zones, confirming oxidation indices (OΙ) of 45–65% in agreement with visual inspection. μCT also revealed slag-induced porosity and showed that closed pores contributed 4–6% more to total porosity than detected by the Archimedes method. Despite its advantages, realizing the full potential of μCT requires higher-resolution imaging—on the order of 1 μm or less—to serve as a viable replacement for conventional techniques.

Author Contributions

Conceptualization, M.A.K.; methodology, M.A.K., S.G. and C.E.S.; formal analysis, S.G., K.C.V., M.A.K., A.N., V.I. and A.S.P.; investigation, S.G., K.C.V., C.G., A.N., V.I. and M.A.K.; resources, M.A.K., C.E.S. and A.S.P.; data curation, S.G., M.A.K., C.E.S., C.G., K.C.V., V.I., A.N. and A.S.P.; writing—original draft preparation, S.G., A.N. and M.A.K.; writing—review and editing, S.G., M.A.K., A.N. and C.E.S.; supervision, M.A.K.; project administration, M.A.K. and C.E.S.; funding acquisition, M.A.K. All authors have read and agreed to the published version of the manuscript.

Funding

This work was carried out in the framework of the project “Advanced Aluminosilicate Refractories and Magnesia Refractories of High Efficiency using Nanotechnology” that is co-financed by the European Regional Development Fund in the context of the special action “Industrial Materials” of the Operational Programme “Competitiveness, Entrepreneurship & Innovation (EPAnEK)”, ΕΣΠA 2014-2020 (acronym: NanoRefraMat; project code: T6YBP-00386).

Data Availability Statement

The data presented in this study are available upon request from the corresponding author.

Acknowledgments

We would like to thank the company MATHIOS REFRACTORIES S.A. (Athens, Greece) for supplying us with raw materials for the production of refractories.

Conflicts of Interest

The authors declare no conflicts of interest.

References

  1. Vásárhelyi, L.; Kónya, Z.; Kukovecz, Á.; Vajtai, R. Microcomputed tomography–based characterization of advanced materials: A review. Mater. Today Adv. 2020, 8, 100084. [Google Scholar] [CrossRef]
  2. Kong, Y.; Kato, M.; Kurumisawa, K. Recent Advances in X-ray Computed Tomography for Alkali-Activated Materials: A Review. J. Adv. Concr. Technol. 2023, 21, 573–595. [Google Scholar] [CrossRef]
  3. Cengiz, I.F.; Oliveira, J.M.; Reis, R.L. Micro-CT—A digital 3D microstructural voyage into scaffolds: A systematic review of the reported methods and results. Biomater. Res. 2018, 22, 26. [Google Scholar] [CrossRef] [PubMed]
  4. Fan, J.; Li, Y.; Gao, Y.; Zhang, X.; Jiang, P. Evaluation of the morphology and pore characteristics of silica refractory using X-ray computed tomography. Ceram. Int. 2021, 47, 18084–18093. [Google Scholar] [CrossRef]
  5. Razavi, A.; Hopp, V.; Hahn, D.; Sax, A.; Quirmbach, P. Microstructural X-Ray Computed Tomography Investigation of the Defect Evolution in Refractory Castings Based on Andalusite. Ceramics 2024, 7, 1867–1879. [Google Scholar] [CrossRef]
  6. Stec, J.; Tarasiuk, J.; Wroński, S.; Kubica, P.; Tomala, J.; Filipek, R. Investigation of Molten Metal Infiltration into Micropore Carbon Refractory Materials Using X-ray Computed Tomography. Materials 2021, 14, 3148. [Google Scholar] [CrossRef] [PubMed]
  7. Pankka, I.; Ahmed, M.S.; Tammela, J.; Taskinen, P.; Lindberg, D. Investigation of End-of-Life Chrome-Magnesia Refractories Using X-Ray Computed Tomography. JOM 2024, 76, 6650–6659. [Google Scholar] [CrossRef]
  8. Razavi, A.; Stein, A.; Quirmbach, P. Tomographic Imaging of Bauxite Grains Leached Using Hydrochloric Acid. Minerals 2023, 13, 884. [Google Scholar] [CrossRef]
  9. Weber, E.; Fernandez, M.; Wapner, P.; Hoffman, W. Comparison of X-ray micro-tomography measurements of densities and porosity principally to values measured by mercury porosimetry for carbon–carbon composites. Carbon 2009, 48, 2151–2158. [Google Scholar] [CrossRef]
  10. Galvez-Hernandez, P.; Smith, R.; Gaska, K.; Mavrogordato, M.; Sinclair, I.; Kratz, J. The effect of X-ray computed tomography scan parameters on porosity assessment of carbon fibre reinfored plastics laminates. J. Compos. Mater. 2023, 57, 4535–4548. [Google Scholar] [CrossRef]
  11. Rashidi, A.; Olfatbakhsh, T.; Crawford, B.; Milani, A.S. A Review of Current Challenges and Case Study toward Optimizing Micro-Computed X-Ray Tomography of Carbon Fabric Composites. Materials 2020, 13, 3606. [Google Scholar] [CrossRef] [PubMed]
  12. Behera, S.; Sarkar, R. Nano carbon containing low carbon magnesia carbon refractory: An overview. Prot. Met. Phys. Chem. Surf. 2016, 52, 467–474. [Google Scholar] [CrossRef]
  13. Kundu, R.; Sarkar, R. MgO-C Refractories: A Detailed Review of These Irreplaceable Refractories in Steelmaking. Interceram Int. Ceram. Rev. 2021, 70, 46–55. [Google Scholar] [CrossRef]
  14. Rauta, P.R.; Sahoo, N. Properties enhancement of refractory bricks by incorporation of nano materials. In Proceedings of the 2015 International Conference on Nascent Technologies in the Engineering Field (ICNTE), Navi Mumbai, India, 9–10 January 2015; pp. 1–6. [Google Scholar]
  15. Salomão, R.; Souza, A.; Fernandes, L.; Arruda, C. Advances in nanotechnology for refractories: When very small meets hot, heavy, and large. Am. Ceram. Soc. Bull. 2013, 92, 22–27b. [Google Scholar]
  16. Sobolev, K. How Nanotechnology Can Change the Concrete World Part Two of a Two-Part Series. Am. Ceram. Soc. Bull. 2005, 84, 5. [Google Scholar]
  17. Antonovič, V.; Pundiene, I.; Stonys, R.; Česniene, J.; Keriene, J. A review of the possible applications of nanotechnology in refractory concrete. J. Civ. Eng. Manag. 2010, 16, 595–602. [Google Scholar] [CrossRef]
  18. Ghasemi-Kahrizsangi, S.; Dehsheikh, H.G.; Karamian, E. Impact of Titania nanoparticles addition on the microstructure and properties of MgO-C refractories. Ceram. Int. 2017, 43, 15472–15477. [Google Scholar] [CrossRef]
  19. Kusiorowski, R. Effect of titanium oxide addition on magnesia refractories. J. Aust. Ceram. Soc. 2020, 56, 1583–1593. [Google Scholar] [CrossRef]
  20. Aneziris, C.G.; Hubálková, J.; Barabás, R. Microstructure evaluation of MgO–C refractories with TiO2- and Al-additions. J. Eur. Ceram. Soc. 2007, 27, 73–78. [Google Scholar] [CrossRef]
  21. Gómez Rodríguez, C.; Das Roy, T.K.; Shaji, S.; Castillo Rodríguez, G.A.; García Quiñonez, L.; Rodríguez, E.; González, J.O.; Aguilar-Martínez, J.A. Effect of addition of Al2O3 and Fe2O3 nanoparticles on the microstructural and physico-chemical evolution of dense magnesia composite. Ceram. Int. 2015, 41, 7751–7758. [Google Scholar] [CrossRef]
  22. ASTM C20-00; Standard Test Methods for Apparent Porosity, Water Absorption, Apparent Specific Gravity, and Bulk Density of Burned Refractory Brick and Shapes by Boiling Water. ASTM International: West Conshohocken, PA, USA, 2022; p. 19428–2959. [CrossRef]
  23. ASTM-C133-97-2015; Standard Test Methods for Cold Crushing Strength and Modulus of Rupture of Refractories. ASTM International: West Conshohocken, PA, USA, 2024.
  24. Jansson, S.; Brabie, V.; Jönsson, P. Corrosion mechanism and kinetic behaviour of MgO–C refractory material in contact with CaO–Al2O3–SiO2–MgO slag. Scand. J. Metall. 2005, 34, 283–292. [Google Scholar] [CrossRef]
  25. Siahpoosh, S.M.; Salahi, E.; Hessari, F.A.; Mobasherpour, I. Facile Synthesis of γ-Alumina Nanoparticles via the Sol-Gel Method in Presence of Various Solvents. Sigma J. Eng. Nat. Sci. 2017, 35, 441–456. [Google Scholar]
  26. Siahpoosh, S.M.; Salahi, E.; Hessari, F.A.; Mobasherpour, I. Synthesis of γ-Alumina Nanoparticles with High-Surface-Area via Sol-Gel Method and their Performance for the Removal of Nickel from Aqueous Solution. Bull. Société R. Sci. Liège 2016, 85, 812–934. [Google Scholar] [CrossRef]
  27. Singh, I.B.; Gupta, A.; Dubey, S.; Shafeeq, M.; Banerjee, P.; Sinha, A.S.K. Sol–gel synthesis of nanoparticles of gamma alumina and their application in defluoridation of water. J. Sol-Gel Sci. Technol. 2016, 77, 416–422. [Google Scholar] [CrossRef]
  28. Wang, Z.; Wu, W.; Bian, X.; Wu, Y. Synthesis and characterization of amorphous Al2O3 and γ-Al2O3 by spray pyrolysis. Green Process. Synth. 2016, 5, 305–310. [Google Scholar] [CrossRef]
  29. Falk, G.S.; Borlaf, M.; López-Muñoz, M.J.; Fariñas, J.C.; Rodrigues Neto, J.B.; Moreno, R. Microwave-assisted synthesis of TiO2 nanoparticles: Photocatalytic activity of powders and thin films. J. Nanoparticle Res. 2018, 20, 23. [Google Scholar] [CrossRef]
  30. Ghadiry, M.; Gholami, M.; Lai, C.; Ahmad, H.; Chong, W. Ultra-Sensitive Humidity Sensor Based on Optical Properties of Graphene Oxide and Nano-Anatase TiO2. PLoS ONE 2016, 11, e0153949. [Google Scholar] [CrossRef]
  31. Bag, M.; Adak, S.; Sarkar, R. Study on low carbon containing MgO-C refractory: Use of nano carbon. Ceram. Int. 2012, 38, 2339–2346. [Google Scholar] [CrossRef]
  32. Bag, M.; Adak, S.; Sarkar, R. Nano carbon containing MgO-C refractory: Effect of graphite content. Ceram. Int. 2012, 38, 4909–4914. [Google Scholar] [CrossRef]
  33. Zhu, T.; Li, Y.; Sang, S.; Jin, S. The influence of Al and Si additives on the microstructure and mechanical properties of low-carbon MgO-C refractories. J. Ceram. Sci. Technol. 2016, 7, 127–134. [Google Scholar]
  34. Ghasemi-Kahrizsangi, S.; Gheisari Dehsheikh, H.; Boroujerdnia, M. Effect of micro and nano-Al2O3 addition on the microstructure and properties of MgO-C refractory ceramic composite. Mater. Chem. Phys. 2017, 189, 230–236. [Google Scholar] [CrossRef]
  35. Su, K.; Zhang, Q.; Tian, X.; Ouyang, D.; Liu, X.; Cui, J. Role of nano-Al2O3 particles in improving the properties of MgO–C slide plate materials. Ceram. Int. 2023, 49, 23696–23703. Available online: https://www.sciencedirect.com/science/article/pii/S0272884223011720 (accessed on 25 April 2023). [CrossRef]
  36. Lee, W.E.; Rainforth, W.M. Ceramic Microstructures: Property Control by Processing; Chapman and Hall: London, UK, 1994; pp. 299–311. [Google Scholar]
  37. Tripathi, A.K.; Singh, M.K.; Mathpal, M.C.; Mishra, S.K.; Agarwal, A.; Study of structural transformation in TiO2 nanoparticles and its optical properties. 2013, 549, 114–120. Available online: https://www.researchgate.net/publication/232815014_Study_of_structural_transformation_in_TiO2_nanoparticles_and_its_optical_properties (accessed on 2 May 2025).
  38. Koparde, V.N.; Cummings, P.T. Phase transformations during sintering of titania nanoparticles. ACS Nano 2008, 2, 1620–1624. [Google Scholar] [CrossRef] [PubMed]
  39. Bavand-Vandchali, M.; Golestani-Fard, F.; Sarpoolaky, H.; Rezaie, H.R.; Aneziris, C.G. The influence of in situ spinel formation on microstructure and phase evolution of MgO–C refractories. J. Eur. Ceram. Soc. 2008, 28, 563–569. [Google Scholar] [CrossRef]
  40. Mahato, S.; Behera, S.K. Oxidation resistance and microstructural evolution in MgO–C refractories with expanded graphite. Ceram. Int. 2016, 42, 7611–7619. [Google Scholar] [CrossRef]
  41. Nanda, S.; Choudhury, A.; Chandra, K.S.; Sarkar, D. Raw materials, microstructure, and properties of MgO–C refractories: Directions for refractory recipe development. J. Eur. Ceram. Soc. 2023, 43, 14–36. [Google Scholar] [CrossRef]
Figure 1. X-ray diffraction patterns and TEM images of synthesized alumina (top) and titania (bottom) nanoparticles. Top, right a,b present the TEM images of γ-alumina in different scale before treatment with dry ball milling, while top, right c,d display the nanoparticles after treatment in different scale.
Nanomanufacturing 05 00010 g001
Figure 2. Bulk densities and apparent porosities of MgO-C refractories as function of Al2O3/TiO2 ratio. Reference sample B-1 includes average values of S1 and S2, two compositions containing 6% and 10% graphite, respectively.
Nanomanufacturing 05 00010 g002
Figure 3. Variation in cold crushing strength with variation in Al2O3/TiO2 ratio. S1 and S2 correspond to two compositions of reference sample Β-1 containing 6% and 10% graphite, respectively.
Nanomanufacturing 05 00010 g003
Figure 4. Cylindrical specimen B-1 (a) and its possible sections for optical observations and tomography measurements (b).
Nanomanufacturing 05 00010 g004
Figure 5. Circular cross-sections of MgO-C refractory B-1, produced through horizontal cuts at various heights 1 (a), 2 (b), and 3 (c) using X-ray microtomography. Numbers 1, 2, and 3 correspond to cross-sections taken at heights shown in Figure 4b.
Nanomanufacturing 05 00010 g005
Figure 6. Photograph of B-4 sample cut in half along its vertical axis (a) and its semicircular cross-sections produced through horizontal cuts at various heights 1 (b), 2 (c), and 3 (d) using X-ray microtomography. Numbers 1, 2, and 3 correspond to cross-sections taken at heights shown in Figure 4b.
Nanomanufacturing 05 00010 g006
Figure 7. Cross-sections of MgO-C specimens after oxidation and corrosion tests. Areas that appear black indicate presence of non-oxidized carbon (Al: Al2O3 NPs; Ti: TiO2 NPs).
Nanomanufacturing 05 00010 g007
Figure 8. Oxidation index of MgO-C samples obtained from cross-sectional analysis using μCT data and visual observation (VO).
Nanomanufacturing 05 00010 g008
Figure 9. Rectangular cross-section tomography images of MgO-C refractories B-2, B-4, and B-6, produced through a vertical cut in directions 1 (left) and 2 (middle). The (right) column of this figure indicates the cutting layers.
Nanomanufacturing 05 00010 g009
Figure 10. (a) Representative 3D image obtained by μCT of reconstruction of MgO-C refractory (B-4 specimen). (b) Visual representation of isolated open and closed porosities of sample (shown in light shading).
Nanomanufacturing 05 00010 g010
Table 1. Batch composition.
Raw Materials/BatchB-1B-2B-3B-4B-5B-6
MgO (3–5 mm)3.683.683.683.683.683.68
MgO (1–3 mm)31.5831.5831.5831.5831.5831.58
MgO (0.5–1 mm)14.7414.7414.7414.7414.7414.74
MgO (0–0.5 mm)21.0521.0521.0521.0521.0521.05
MgO (200 mesh)23.723.723.723.723.723.7
Fine-grained graphite333333
Coarse graphite333333
Novolac resin1.51.51.51.51.51.5
Resol resin555555
γ-alumina nanoparticles-75.253.51.75-
Anatase nanoparticles--1.753.55.257
Al metal powder0.50.50.50.50.50.5
Boron carbide powder0.50.50.50.50.50.5
Table 2. Mixing sequence of MgO-C specimens.
StepsMixing SequenceMixing Time (min)
1Coarse and medium magnesia1.0
2Addition of graphite, aluminum metal powder, boron carbide powder, novolak resin, and a part of resol5.0
3Addition of magnesia 0–0.5 mm, fine magnesia powder, and the remaining resol resin10.0
Table 3. Physical properties of MgO-C refractories concerning ratio of Al2O3 and TiO2 nano-additives.
BatchR
(Al2O3/TiO2)
B
(g/cm3)
P
(%)
W
(%)
T
B-1-2.8810.653.703.22
B-21002.6719.717.393.32
B-375/252.7816.766.033.34
B-450/502.6620.017.543.32
B-525/752.6419.877.542.39
B-602.6619.797.463.31
R: the ratio of Al2O3/TiO2 nanoparticles equal to 7% wt of the initial batch. V: Exterior Volume; B: Bulk Density; P: Apparent Porosity; W: Water Absorption; T: Apparent Specific Gravity.
Disclaimer/Publisher’s Note: The statements, opinions and data contained in all publications are solely those of the individual author(s) and contributor(s) and not of MDPI and/or the editor(s). MDPI and/or the editor(s) disclaim responsibility for any injury to people or property resulting from any ideas, methods, instructions or products referred to in the content.

