Article

Processing and Characterization of Nickel Matrix Nanocomposites Reinforced with Layered Nickel Aluminide Intermetallics Using Mechanical Alloying and Spark Plasma Sintering

by
Zary Adabavazeh
1,*,†,
Amir Hossein Shiranibidabadi
2,†,
Mohammad Hossein Enayati
2 and
Fathallah Karimzadeh
2
1
Ph.D. Program, Graduate Institute of Precision Manufacturing, National Chin-Yi University of Technology, Taichung 411030, Taiwan
2
Department of Materials Engineering, Isfahan University of Technology, Isfahan 8415683111, Iran
*
Author to whom correspondence should be addressed.
These authors contributed equally to this work.
Nanomanufacturing 2025, 5(1), 1; https://doi.org/10.3390/nanomanufacturing5010001
Submission received: 20 October 2024 / Revised: 16 December 2024 / Accepted: 26 December 2024 / Published: 10 January 2025

Abstract

:
This research discusses the fabrication of a nickel matrix nanocomposite reinforced with in situ synthesized layered Ni3Al intermetallics using mechanical alloying (MA) and spark plasma sintering (SPS). In contrast to ex situ methods that frequently produce weak interfaces, the in situ approach enhances bonding and mechanical performance by using layered Ni3Al reinforcements with excellent deformation resistance and load-bearing potential. Twenty-hour milled Ni-Al powders were annealed at 700 °C and consolidated using SPS, achieving approximately 96% theoretical density. The nanocomposite showed exceptional mechanical properties, with a hardness of 350 ± 15 HV in contrast to 200 ± 5 HV for pure Ni, along with higher wear resistance and reduced wear track depth. These improvements resulted from microstructural refinement and the development of hard intermetallic phases. X-ray diffraction (XRD) and transmission electron microscopy (TEM) confirmed the formation of a homogeneous layered Ni3Al structure inside the matrix, showing a crystallite size of around 40 nm post-milling. Layered reinforcements enhanced matrix–reinforcement interactions, thereby minimizing common challenges in traditional composites. This innovative production technique highlights the future potential of Ni3Al-reinforced nanocomposites as high-performance materials for advanced engineering applications, combining outstanding mechanical and tribological properties with strong structural integrity.

1. Introduction

In recent decades, metal matrix composites (MMCs) have been receiving significant attention due to their exceptional physical and mechanical properties, including increased hardness, strength, fatigue resistance, thermal stability, and wear-resistant properties. MMCs are in high demand for an extensive range of applications, such as aerospace, automotive, and structural engineering, due to their outstanding properties [1]. MMCs can be classified into two main types, ex situ and in situ, based on the method employed to include reinforcement in the matrix [2]. The in situ strategy involves the formation of reinforcement particles within the matrix through reactions or processes, while the ex situ approach integrates externally created reinforcement particles into the metal matrix [2]. Several factors, including the volume fractions, shape, distribution, size, and type of reinforcement, determine the ultimate properties of metal matrix composites (MMCs) [3]. It is crucial to optimize these properties in order to customize MMCs for unique application needs. While there has been a significant amount of study conducted on metal composites made from iron (Fe) and aluminum (Al), there has been comparatively little research conducted on composites with a nickel (Ni) matrix [4]. Nickel in its pure form has a low level of hardness, measuring at 200 HV. This limits its suitability for applications that demand high levels of strength [1]. The addition of more robust components, such as Ni3Al, TiN, and SiC, can enhance the reinforcement and strength of nickel-based composites. Ni3Al has outstanding resistance to corrosion, creep, fatigue, increased temperature, and wear, even at temperatures exceeding 600 °C [1,5,6]. Ni3Al possesses distinctive attributes that make it an optimal substance for bolstering the mechanical properties of nickel-based composites. The in situ production of the Ni3Al phase within the nickel matrix facilitates advantageous interactions between the phases, leading to a composite material that exhibits improved strength and durability [7,8]. The Ni-Ni3Al composite shows potential as a structural material for high-temperature situations due to its exceptional corrosion resistance and strength properties [9]. Overall, the Ni-Ni3Al composite successfully combines the high strengths of Ni3Al with the ductility and toughness of nickel, making it an outstanding choice for structural applications [10]. Among various techniques for synthesizing MMCs, mechanical alloying, or mechanical milling (MM), is a well-established method for creating uniform products from mixtures of powders. The development of Ni-based superalloys for gas turbine applications has been thoroughly investigated through significant research [11,12].
Mechanical alloying encompasses the processes of particle fracturing and cold welding, which have a significant impact on the ultimate microstructure and characteristics of the alloy [13,14]. Process control agents (PCAs) are commonly employed to enhance dispersion and mitigate excessive welding during mechanical milling [7,15]. The ball-to-powder ratio (BPR), milling time, and velocity are three ball mill parameters that significantly affect the alloying process. Milling duration must be carefully considered in order to produce a gradual reduction in layer thickness during the cold welding and fracturing stages [12]. On the other hand, extended milling may result in greater contamination from the vial and ball wear, causing undesired phases to form in the substance [11,16]. Spark plasma sintering (SPS), sometimes referred to as electric current sintering, is one of the sintering techniques that has drawn the most interest [17]. SPS rapidly sinters a variety of powders by combining electric current and uniaxial external pressure [18]. Using conductive punches, the powder sample is compressed in a conductive mold throughout this procedure. A strong current flows through the sample simultaneously, heating the powder to the appropriate temperature [2,17]. Compared to conventional sintering techniques, like hot pressing, SPS has a number of advantages. The process can be conducted at lower temperatures and for shorter durations, which reduces the risk of crystallite formation and reduces the duration of storage. SPS is capable of producing crystals with smaller sizes than previous solid-state compression techniques [1,4,6]. High compaction and welding are made possible by the tiny discharge of a direct pulsed current between particles during SPS under uniaxial pressure [17]. The production of almost pure metal components, alloys, and metal matrix composites can be achieved through the use of both mechanical alloying and SPS [1,18]. Prior research on Ni matrix nanocomposites has mostly examined the role of particle reinforcements; however, the impact of reinforcement in the form of sheets or layers has not been investigated. Furthermore, the majority of studies conducted on nickel composites have created reinforcements inside the matrices ex situ [2,4,6,19,20]. As a result, the properties of reinforcements frequently diverge greatly from the Ni matrix, resulting in the creation of undesired interfaces.
Research on nickel (Ni) matrix composites with in situ layered intermetallic reinforcements, particularly Ni3Al, is limited. Ex situ methods often produce weak matrix–reinforcement interfaces, hindering load transfer and reducing mechanical performance. This study focuses on the in situ production of layered Ni3Al within the Ni matrix using mechanical alloying and SPS consolidation, optimizing bonding and enhancing mechanical properties. The novelty is in the utilization of stratified Ni3Al reinforcements, which offer higher deformation resistance, higher load-bearing capacity, and stronger interfaces than particle-reinforced composites. Through a novel fabrication method, this work provides significant improvements in Ni-based MMCs, thereby establishing a foundation for superior structural materials.

2. Materials and Methods

2.1. Mechanical Alloying

The Ni powder (75–90 μm, >99.9% purity, Merck, Darmstadt, Germany) and Al powder (80–100 μm, 99% purity, Khorasan Powder Metallurgy Company, Mashhad, Iran) were subjected to mechanical milling using a low-energy ball mill (Tak Company, Isfahan, Iran). Mechanical milling was conducted for 10 and 20 h in a chromium steel vial (320 mL volume) under an argon atmosphere to prevent oxidation. All powder handling procedures were carried out in an argon-filled glove box. The milling process employed five 10 mm-diameter balls, five 15 mm-diameter balls, and five 20 mm-diameter balls, with a ball-to-powder weight ratio of 10:1 (Table 1).
The purpose of selecting various ball diameter sizes (10, 15, and 20 mm) was to achieve the optimal equilibrium between particle size reduction and impact energy. The impact energy is higher for larger balls, while the mixing and homogenization are improved by smaller balls. The milling powder mixture consisted of 19 g of Ni powder and 1 g of Al powder. The milling speed was set to 200 rpm. The milling process was performed in two stages to prevent overheating the milling machine: forty minutes of milling followed by twenty minutes of resting. For the purpose of preventing excessive cold welding during the milling process, 1 wt. % stearic acid was added as a PCA. Following this, the PCA was eliminated using the vacuum-induced SPS procedure. The optimal amount of intermetallic phase is given by the composition of 5 weight percent Al, as indicated by the Ni-Al phase diagram. As a result of excessive intermetallic phase development, an Al concentration increase above 5% can reduce the ductility of the nanocomposite. In contrast, a composition that is mostly made of Ni would arise from lowering the Al component below 5%. The ideal amount of Al for the nanocomposite samples in this investigation was therefore determined to be 5 wt. %.

2.2. Spark Plasma Sintering and Annealing Process

The as-milled Ni-5% Al powder was subjected to the SPS process to prepare the bulk sample. In an alternative approach aimed at mitigating the effects of work hardening and improving compressibility, the as-milled powder was first annealed at 700 °C for 1 h with a heating rate of 11.7 °C/min, followed by SPS under identical conditions with a heating rate of 60 °C/min. The bulk samples produced via these routes were labeled as milling + SPS (MS) and milling + annealing + SPS (MAS), respectively. The sintering operation was carried out using an SPS device (KPFVT model, KPF Company, Tehran, Iran) at temperatures of 1000 °C and 1200 °C under a vacuum atmosphere and a uniaxial pressure of 40 MPa. According to the Ni-Al phase diagram, the Ni-5%Al mixture undergoes an Al-Ni reaction during SPS or annealing, resulting in the formation of a Ni-17% Ni3Al nanocomposite. The as-milled powder was put in a sealed quartz tube under vacuum for the annealing procedure. After annealing, the quartz tube was cooled at ambient temperature, with a cooling rate of 130 °C per minute, outside the furnace. The resultant bulk samples weighed around 20 g each and were cylindrical in shape, with a diameter of 40 mm and a thickness of 5 mm. The samples were ground using 600, 800, and 1200 grit sandpaper in order to remove the layer of graphite foil after being cooled to room temperature at a rate of 120 °C per minute. By employing the Archimedes method in pure water at room temperature, the density of the bulk samples was determined.

2.3. Electron Microscopy and X-Ray Diffraction

A scanning electron microscope (SEM) (Philips, model XL30SERIES, made in Amsterdam, The Netherlands) was used to analyze the microstructure of every sample. The average particle size was calculated by taking SEM pictures and utilizing the ImageJ software (1.4g) for analysis. An X-ray diffraction instrument (Philips, XPERT-MPD type) was used to analyze the phases of the samples. Data were obtained within the 2θ range of 20–90° using CuKα radiation with a wavelength of 0.154 nm. The step size was set at 0.02 degrees, and the time interval for each step was 2 s. The crystallite size and internal strain of the samples were ascertained using the Williamson–Hall method. Using the Williamson–Hall equation, as follows, it was possible to determine the average crystallite size and whether internal strain was present in the ground powder [21]:
β cos θ = 0.9 λ d + 2 ε sin θ
where the Bragg diffraction angle is represented by θ, the crystallite size is represented by d, the average internal strain is represented by ε, the wavelength of the applied radiation is indicated by λ, and the width of the diffraction peak at half strength is indicated by β. Using a strain-free coarse grain sample of pure annealed Ni as a reference allowed us to account for instrumental peak broadening effects. A Gaussian distribution was presumed for both the refinement and strain contributions. For further investigation of microstructure, a transmission electron microscope (JEM-2100 CS-Scanning Transmission Electron Microscope (STEM), Japan JEOL Company, Tokyo, Japan) operating at 200 kV equipped with energy-dispersive X-ray spectroscopy (EDS), commonly referred to as TEM-EDS, was used. The goal was to combine the imaging capabilities of TEM with the elemental analysis capabilities of EDS. This combination allows for the detailed characterization of materials at the atomic and nanoscale levels while simultaneously providing information about the chemical composition of the sample. The powder sample is directly distributed on the spider web (Lacey carbon film grid) and directly observed using TEM.

2.4. Microhardness and Tribological Testing

A Vickers microhardness apparatus (Koopa MH3 model, Tehran, Iran) was used to measure the microhardness of the bulk samples, with a dwell time of 15 s and a load of 1 N. To quantify the microhardness of each sample, an average of five points was taken. The pin-on-disk device was used to perform a dry wear test in accordance with ASTM G99 standard test parameters [22]. At room temperature, the tribometer disk was examined. The test pin had a diameter of 5 mm and a radius of curvature of 10 mm and was constructed of 52,100 steel with a hardness of 838 HV. A number of trial loads, ranging from 1 N to 5 N, were applied to the disk over a 100 m distance in order to find the ideal load for the wear test. Based on the results shown in Figure 1, a load of 2 N was selected as it provided sufficient test duration to observe weight changes while avoiding excessive wear that could lead to unreliable data. The wear test was conducted under dry atmospheric conditions with humidity of 15% using a load of 2 N, an angular velocity of 80 rpm, and a track width of 1 mm. The test was performed over a distance of 1000 m. The wear mechanism and topography of the wear tracks were analyzed using scanning electron microscopy (SEM) and energy-dispersive X-ray spectroscopy (EDS).
A flowchart depicting the overall methodology is presented in Figure 2.

3. Results

3.1. Structural Changes

A combination of Ni and Al powders with a stoichiometric ratio of Ni95Al5 was mechanically milled using MA to create a layered structure. To find the ideal milling time, two different milling times (10 and 20 h) were used. X-ray diffraction (XRD) was used to evaluate the milled samples. Figure 3 presents the XRD diffraction patterns of the Ni95Al5 powder mixture before and after milling, with the ICCD codes 01-087-0712 and 96-431-3218 assigned to Ni and Al, respectively. It is important to note that the XRD peaks corresponding to the (111) plane of Ni (FCC) overlapped with those from the (200) plane of Al (FCC). Additionally, due to the low Al content (5%), only the Al (111) peak at 2θ = 38 degrees was visible, while all Ni peaks, including those from the (111), (200), and (220) planes, were detected. The placements of Ni-Al peaks did not change after ten hours of milling, but their intensities did. The Al (111) peak vanished when the milling time was extended to 20 h, and the intensity of the Ni peaks also decreased. After 20 h of mechanical milling, no intermetallic phases, such as Ni3Al or NiAl, were seen in the XRD pattern, suggesting that there was no in situ reaction between pure Ni and Al during the milling process. Al was not dissolved in Ni this can be concluded as a result.
The crystalline diffraction peaks showed peak broadening and decreased peak strength over the 20 h milling operation, suggesting the presence of amplified lattice defects, such as dislocations, as well as a refinement in the grain/crystallite size. Yazdani et al. [23] reported that the duration of milling can result in an increase in lattice strain and defect density, which may subsequently lead to the formation of intermetallic phases. Restricting milling to duration of 20 h facilitates a reduction in particle size, promotes uniform mixing, and minimizes the risk of premature intermetallic formation. This approach allows for better control over microstructural evolution in the subsequent annealing process. After 20 h of mechanical milling and an internal strain of roughly 0.4%, the size of the Ni crystals was calculated using the Williamson–Hall method to be about 40 nm. To reduce the work-hardening effects caused by the mechanical milling, the 20 h-milled powder was then annealed for 1 h at 700 °C. Figure 4 and Figure 5 illustrate the appearance of the Ni3Al intermetallic compound peak in the XRD pattern after the annealing process, with the ICDD code 00-050-1294 assigned to it. To provide a more detailed evaluation of the peak intensity and the intermetallic compound, the peaks within the range of 42 to 46 degrees were magnified in Figure 5.
The mechanical milling procedure causes a rise in lattice defects [13], which promotes the intermetallic phase to develop during annealing more quickly [24]. As the powder was milled and then annealed, Al dissolved in Ni, increasing the Ni lattice parameters during the spark plasma sintering (SPS) process. The broadening of the XRD peak can be attributed to the reduction of particle size and lattice strain that is caused by mechanical milling. The peaks moved to smaller angles as a result, shifting the XRD graph to the left (Figure 3) in accordance with Bragg’s equation (nλ = 2dsinθ).

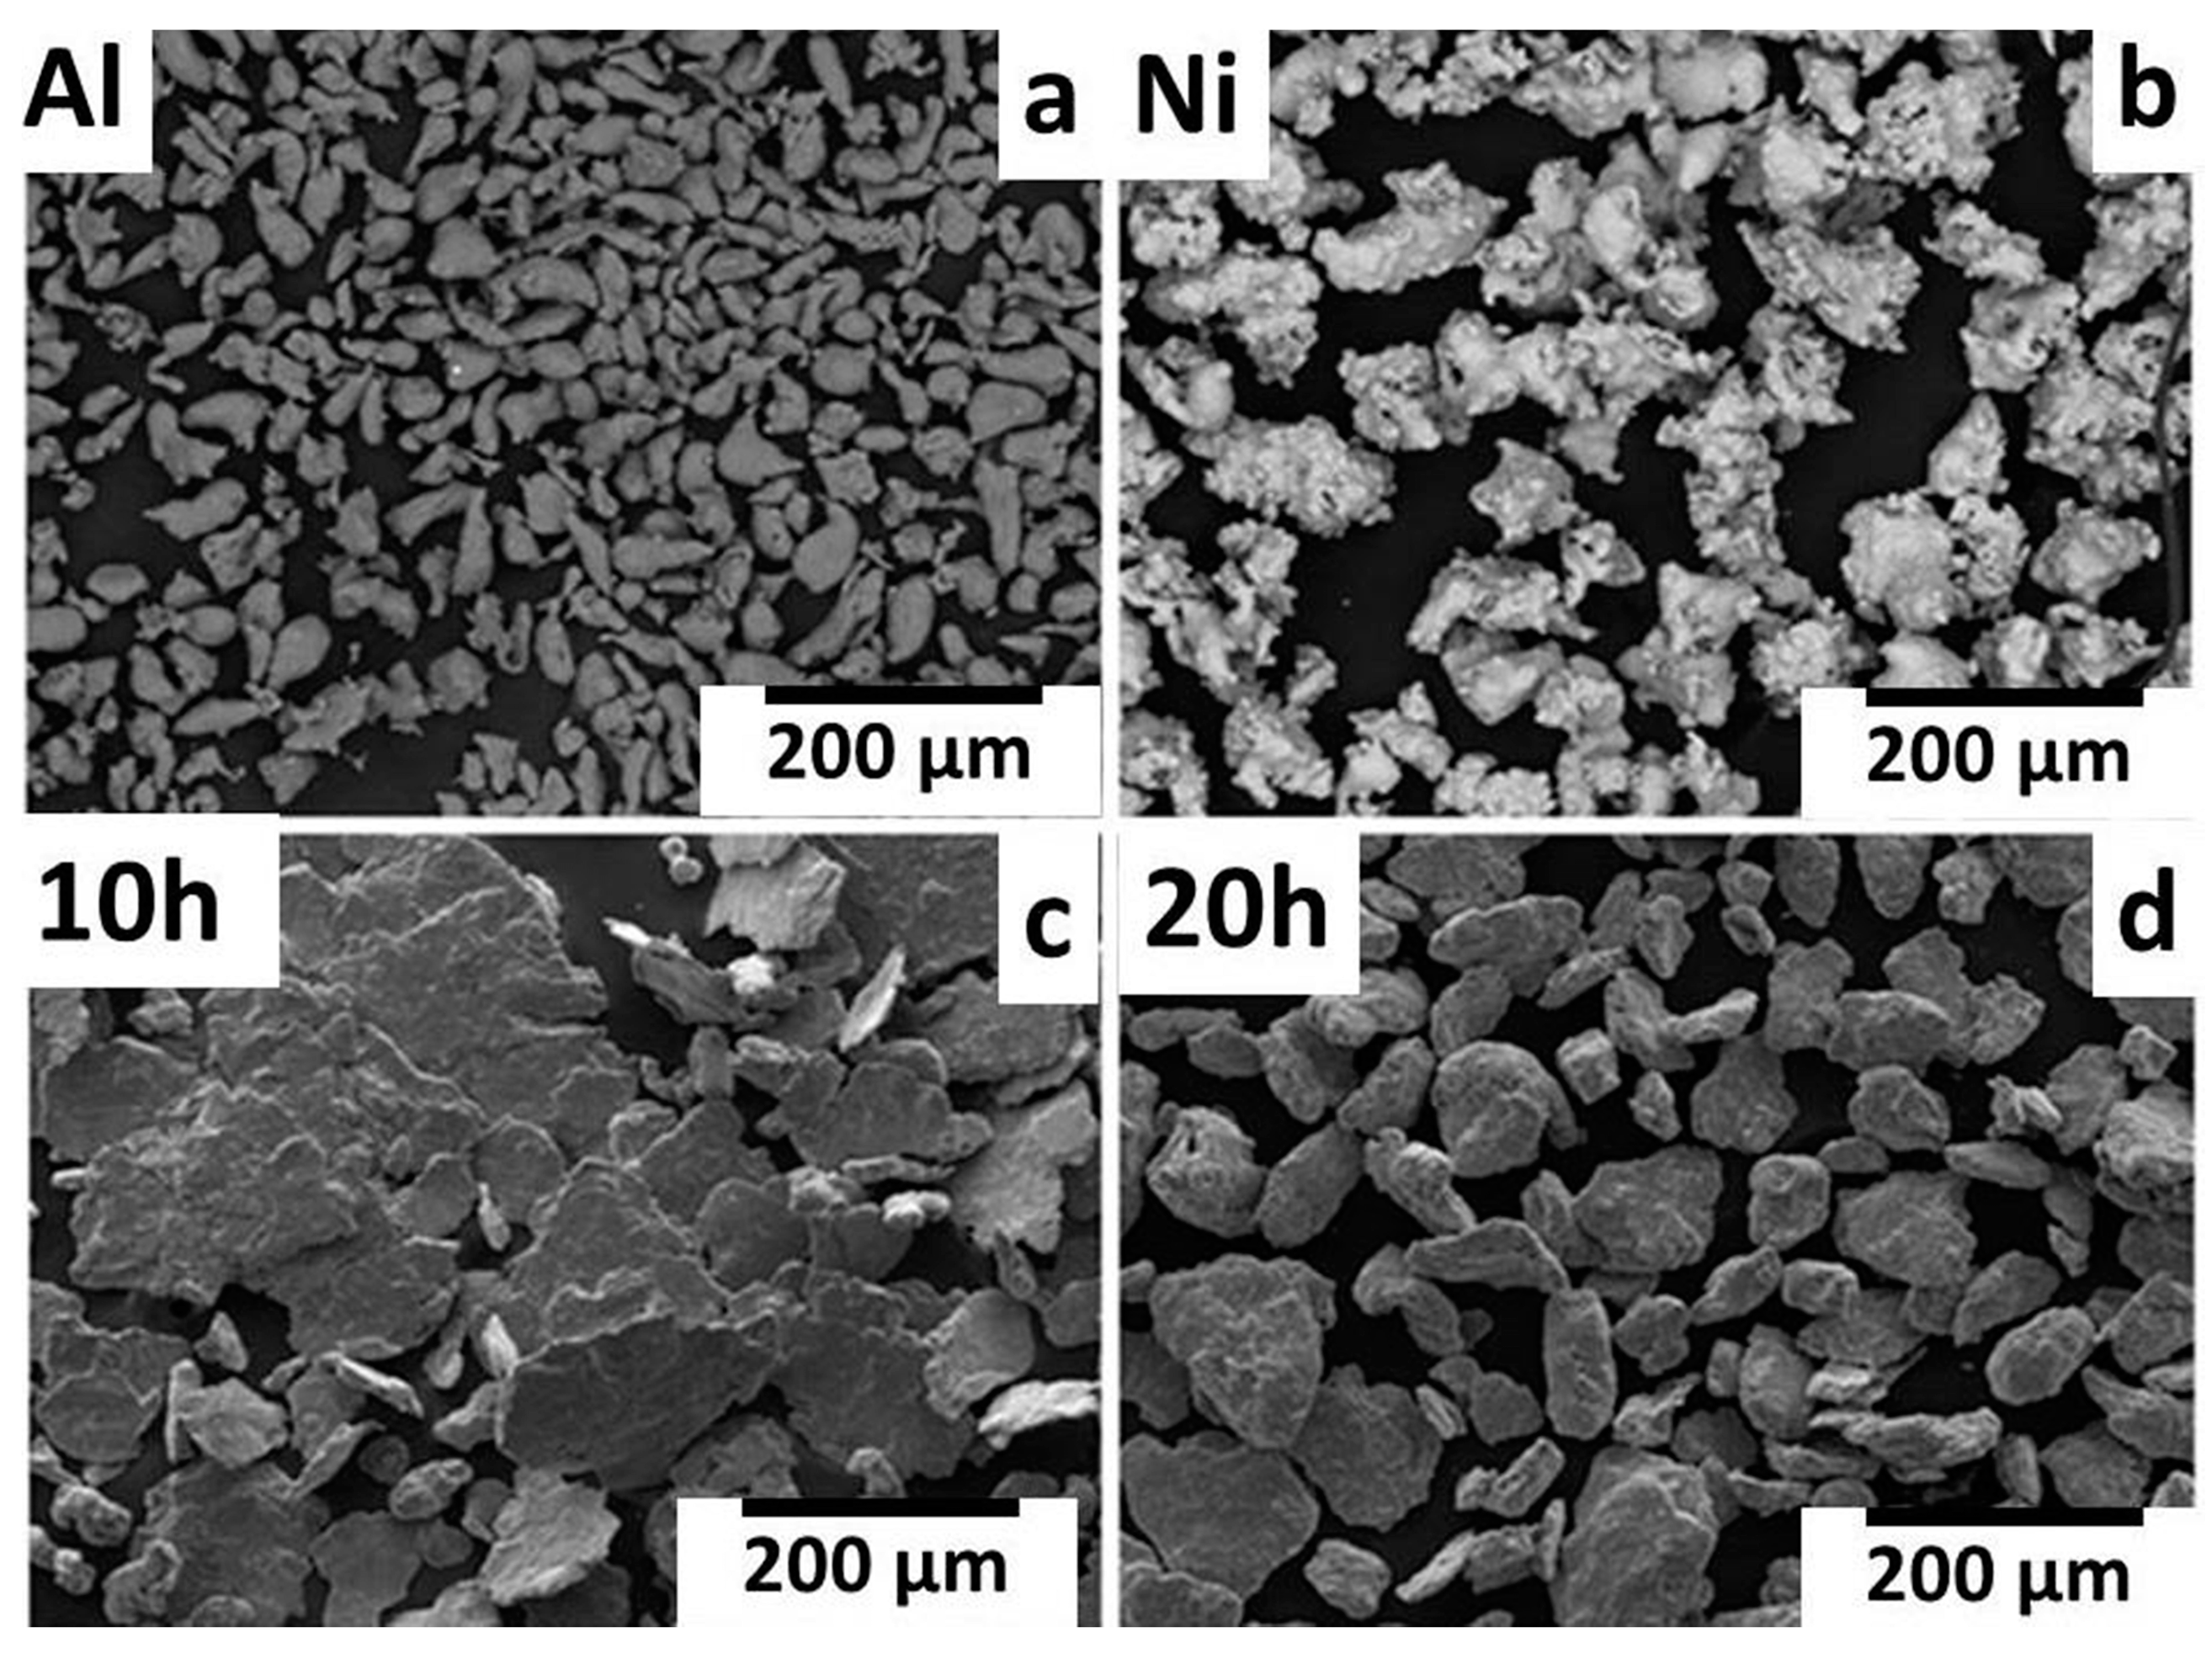
3.2. Morphological Investigation

Figure 6 shows the morphology of the Ni and Al powders as received and the Ni95Al5 mixture following varying times of mechanical milling. Particle coarsening and the predominance of the cold welding mechanism at this stage of the milling process were shown by the average particle size increasing to 350 ± 30 μm after 10 h of mechanical milling [25]. The powder particles are severely deformed while they are caught between colliding balls during the mechanical milling process. Particles flattening with a broad size distribution are the outcome of this deformation. Additionally, the flattening process fractures the surface oxide layers [14], resulting in the cold welding of the powder particles. The size of the crystallites decreases concurrently with the repeated deformation of the particles. The reduction of the particle size to 95 ± 15 μm occurs when the milling period is increased to 20 h, as shown in Figure 6. Extended milling times lead to a notable rise in work hardening, which in turn fractures the particles by forming cracks. The mechanical characteristics of powder, such as ductility, yield stress, and hardness, affect how quickly it may be fused together and fractured [11,25]. As the milling duration increases, the particles tend to take on a more spherical shape. The conflicting rates of fracture and cold-welding lead to changes in particle shape.
The distribution of Ni and Al in the powder particles following 20 h of mechanical milling is shown in Figure 7. After twenty hours of mechanical milling, the EDS analysis verifies that Al is evenly distributed throughout the Ni matrix.

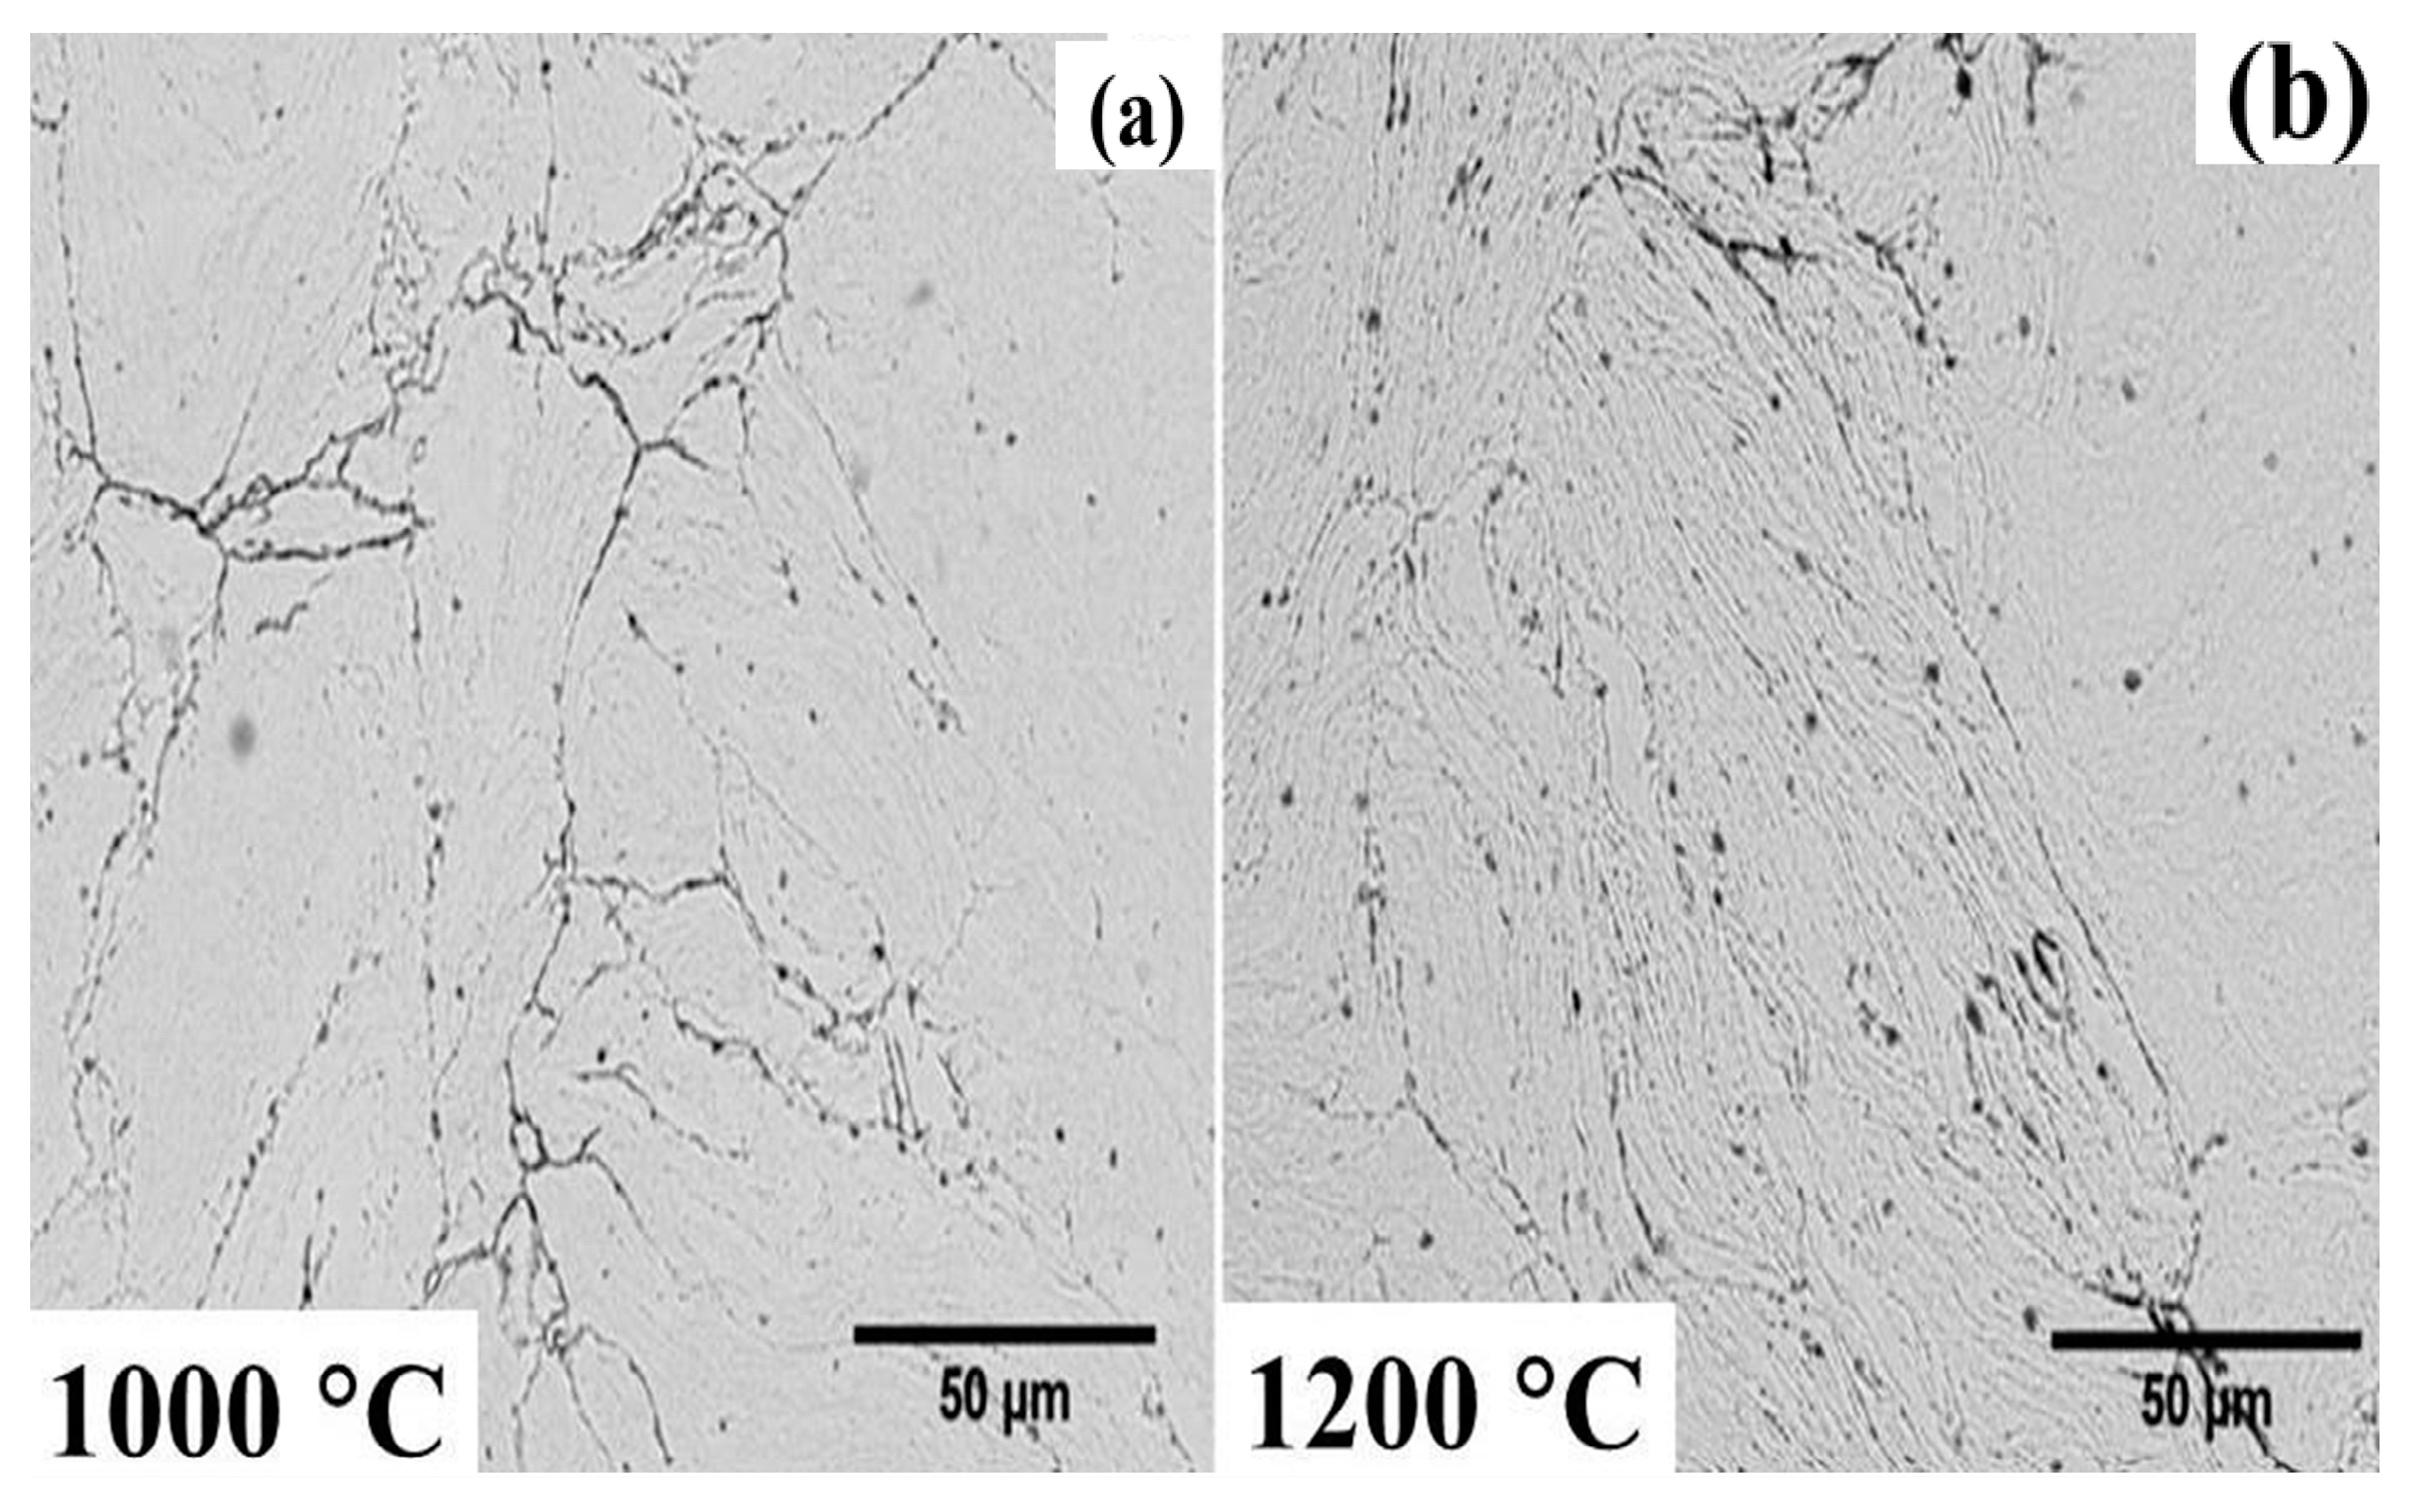
3.3. Microstructural Evolution

SEM pictures of the cross-sections of Ni95Al5 powder particles at various mechanical milling times are shown in Figure 8. During MM, a layered structure made of cold-welded layers of Al (darker area) and Ni (brighter region) is seen. This layered structure is frequently seen when ductile powders are mechanically milled [25]. After 10 h of mechanical milling, the thickness of the formed layers is non-uniform, with an average value of 4 ± 1 μm. The layered structure becomes thinner and more uniform as the mechanical milling period is increased to 20 h (Figure 8).
After 20 h of milling, the thickness of layers is measured to be about 330 ± 50 nm. The presence of cracks in the powder particles (shown by red arrows in Figure 8b) confirms the occurrence of the particle fracturing mechanism during the last 10 h of milling. Extended milling times of more than 20 h lead to harder powder particles, which complicate the compaction and sintering procedures [1]. The Ni-Al phase diagram indicates that intermetallic compounds are a common occurrence for Ni-Al alloys. As a result, prolonged mechanical milling may cause an intermetallic phase to develop at the Ni/Al interface. Alternatively, short milling time can form a thin Ni-Al layered structure, followed by heating (annealing or SPS) to accelerate the Ni-Al diffusion necessary for intermetallic production at the Ni/Al interfaces. The cross-sectional pictures of the sample after it was annealed differently are shown in Figure 9a. The microstructure consists of layers of the NiAl intermetallic complex within the Ni matrix, as is evident. Similarly, Figure 9b shows the SEM image of the bulk sample following the SPS procedure. The SPS procedure produces a NiAl intermetallic compound, known as the MS sample, which exhibits a better-defined and well-distributed structure than the modified annealing sample (MAS). Annealing promotes atomic diffusion and recrystallization, resulting in grain growth and the formation of coarser microstructures. Mechanical milling, in contrast, promotes plastic deformation, resulting in a high density of defects that refine the grain structure. During annealing, defects release stored energy, promoting recrystallization and the development of new, strain-free grains that gradually grow, thereby decreasing grain boundary area and leading to coarser grains compared to the finer structure of as-milled materials.
Table 2 shows that raising the temperature during the SPS process lowers the porosity of bulk samples, which is important since the porosity content affects the mechanical and wear qualities [18]. As a result, for the wear and hardness tests that followed, the MAS and MS samples with the highest densities (96% and 95% of the theoretical density, respectively) were chosen. Density measurements were made using the Archimedes method. Figure 9a,b further display the SEM images of the MS samples that underwent SPS processing at 1000 °C and 1200 °C, respectively. In comparison to the sample prepared at 1200 °C, the Ni particle size in the MS sample prepared at 1000 °C is lower, but its porosity is larger. Higher sintering temperatures lead to better bulk density and bonding. Approximately 96% of the relative density is achieved by the MAS sample generated at 1200 °C, demonstrating the importance of temperature control in the SPS process to reach the ideal density while preventing excessive grain development. Therefore, it is crucial to use the right temperature and time parameters in order to achieve the highest density and prevent overgrowth of the grains. After 20 h of milling, the thickness of layers is measured to be about 330 ± 50 nm. The dark spots in Figure 9b show that the material has holes in it, and the lines show the edges of the layered Ni-3Al intermetallic structures that form during the SPS process (or Annealing). EDS analysis verifies the distribution of Ni and Al within the matrix, as confirmed by the presence of these features. Porosity is a result of incomplete densification, whereas the layered lines indicate the successful creation of reinforcement structures. Extended milling times of more than 20 h lead to harder powder particles, which complicate the compaction and sintering procedures [1]. The formation of intermetallic compounds is a tendency of Ni-Al alloys, as indicated by the Ni-Al phase diagram. As such, intermetallic phase(s) may occur at the Ni/Al contacts as a result of prolonged mechanical milling.
Figure 10a reveals a unique stratified structure due to the variation in Ni and Al concentrations in the ground powder. This result implies that there is not a homogeneous distribution of composition in the ground powder. Figure 10b shows that the interdiffusion of Ni and Al inside the structure of the MS sample, on the other hand, makes the amount of Ni and Al in the material almost constant.
Transmission electron microscopy (TEM) was employed to examine the microstructure of a nickel matrix nanocomposite reinforced with Ni3Al intermetallic compounds (Figure 11). The analysis revealed a distinct layered structure with uniform thickness and well-defined interfaces, indicating the successful integration of the reinforcements as confirmed by energy-dispersive X-ray spectroscopy (EDS) (Figure 12). Based on these TEM results, the fact that Ni is the most common element suggests the formation of a Ni matrix composite that may include nickel aluminide (Ni-Al) intermetallic phases such as Ni3Al or NiAl. This is supported by XRD and SEM results. The absence of aluminum oxide (Al2O3) detection in the XRD data further substantiates the formation of nickel aluminide intermetallic, affirming the reaction between Ni and Al under the given processing conditions. Nickel aluminide intermetallic phases play a crucial role in enhancing mechanical properties [26,27], including increased hardness and wear resistance within the nickel matrix [28], along with improved strength and stability, particularly at elevated temperatures [29], which are attributed to the finely dispersed nickel aluminides. The TEM analysis showed strong bonding and excellent load transfer between the nickel matrix and Ni3Al reinforcement layers. This made the nanocomposite stronger and better at keeping its shape. Other researchers also found that the formation of multilayered structures can improve mechanical properties. Mardiha et al. [30] and his team also focused on the development of a high-strength and ductile Ni/Ni3Al/Ni multilayer composite using spark plasma sintering (SPS) techniques. They also came to the conclusion that the multilayer composite they made had a good balance of strength and ductility, with a much higher shear strength than Ni3Al and about the same ductility as pure Ni [30]. This layered architecture improves performance by using smaller grains, even distribution, and strong connections, as shown by later mechanical tests. Overall, the TEM results show that the nickel matrix nanocomposite was successfully made with layered Ni3Al intermetallic compounds to make it stronger.
TEM-EDS results are presented in Figure 12. The TEM images clearly show the formation of a layered structure within the material, as shown in Figure 11 (shown by red circles). The presence of distinct layers suggests a controlled arrangement of different phases or compositions. Ni and Al are the primary constituents, consistent with the expected formation of Ni3Al intermetallic layers. Oxygen (O) and carbon (C) are likely contaminants; C that possibly originated from the TEM grid as a spider web (Lacey carbon film grid) was used. Oxygen contamination can be due to contamination during the ball milling process.

3.4. Mechanical Properties

3.4.1. Microhardness

Table 3 displays the Vickers microhardness values of the pure Ni, MS, and MAS samples. The consolidated pure Ni sample exhibits a microhardness of 200 HV, which is significantly lower than that of the nanocomposite samples. The hardness values of 350 ± 15 HV and 310 ± 15 HV, respectively, that the MS and MAS samples display are roughly 1.5 times more than that of pure Ni. Table 3 contains information on the crystal sizes of the samples following the SPS procedure. It is clear that the impact of raising the SPS temperature on hardness is greater than that of lowering crystal size.
Because the Ni3Al reinforcing phase prevents grain formation, the nanocomposite samples have higher hardnesses. The production of the Ni3Al reinforcement and the development of a nanostructured matrix during the mechanical milling process are the two reasons for the high hardness of the nanocomposite samples. Figure 13 shows that raising the SPS temperature from 1000 °C to 1200 °C causes the porosity of the sample to decrease, which in turn raises the hardness. Researchers documented similar findings for Ni-TiC composites [4]. The annealing process causes grain development, which results in reduced hardness.
The SEM images in Figure 14 show that the reinforcing layers of the MAS sample are thicker [31]. As a result, the MAS sample has a lower hardness value since there are fewer barriers to dislocation movement. Additionally, grain development is encouraged by an hour of annealing at 700 °C. The hardness of the intermetallic combination Ni3Al is roughly 570 HV [9]. The hardness value of the Ni-Al nanocomposite is raised to 350 HV upon the addition of the Ni3Al hard phase to the Ni matrix. Given that the TiC-reinforcing phase, which has a hardness of 2400 HV, only produces a hardness value of roughly 300 HV for Ni-5%TiC nanocomposites [4] and 390 HV for Ni-10Ti-5C nanocomposites [6], this hardness is very important. Furthermore, a much better contact is formed by the Ni3Al reinforcement in the Ni matrix [25].

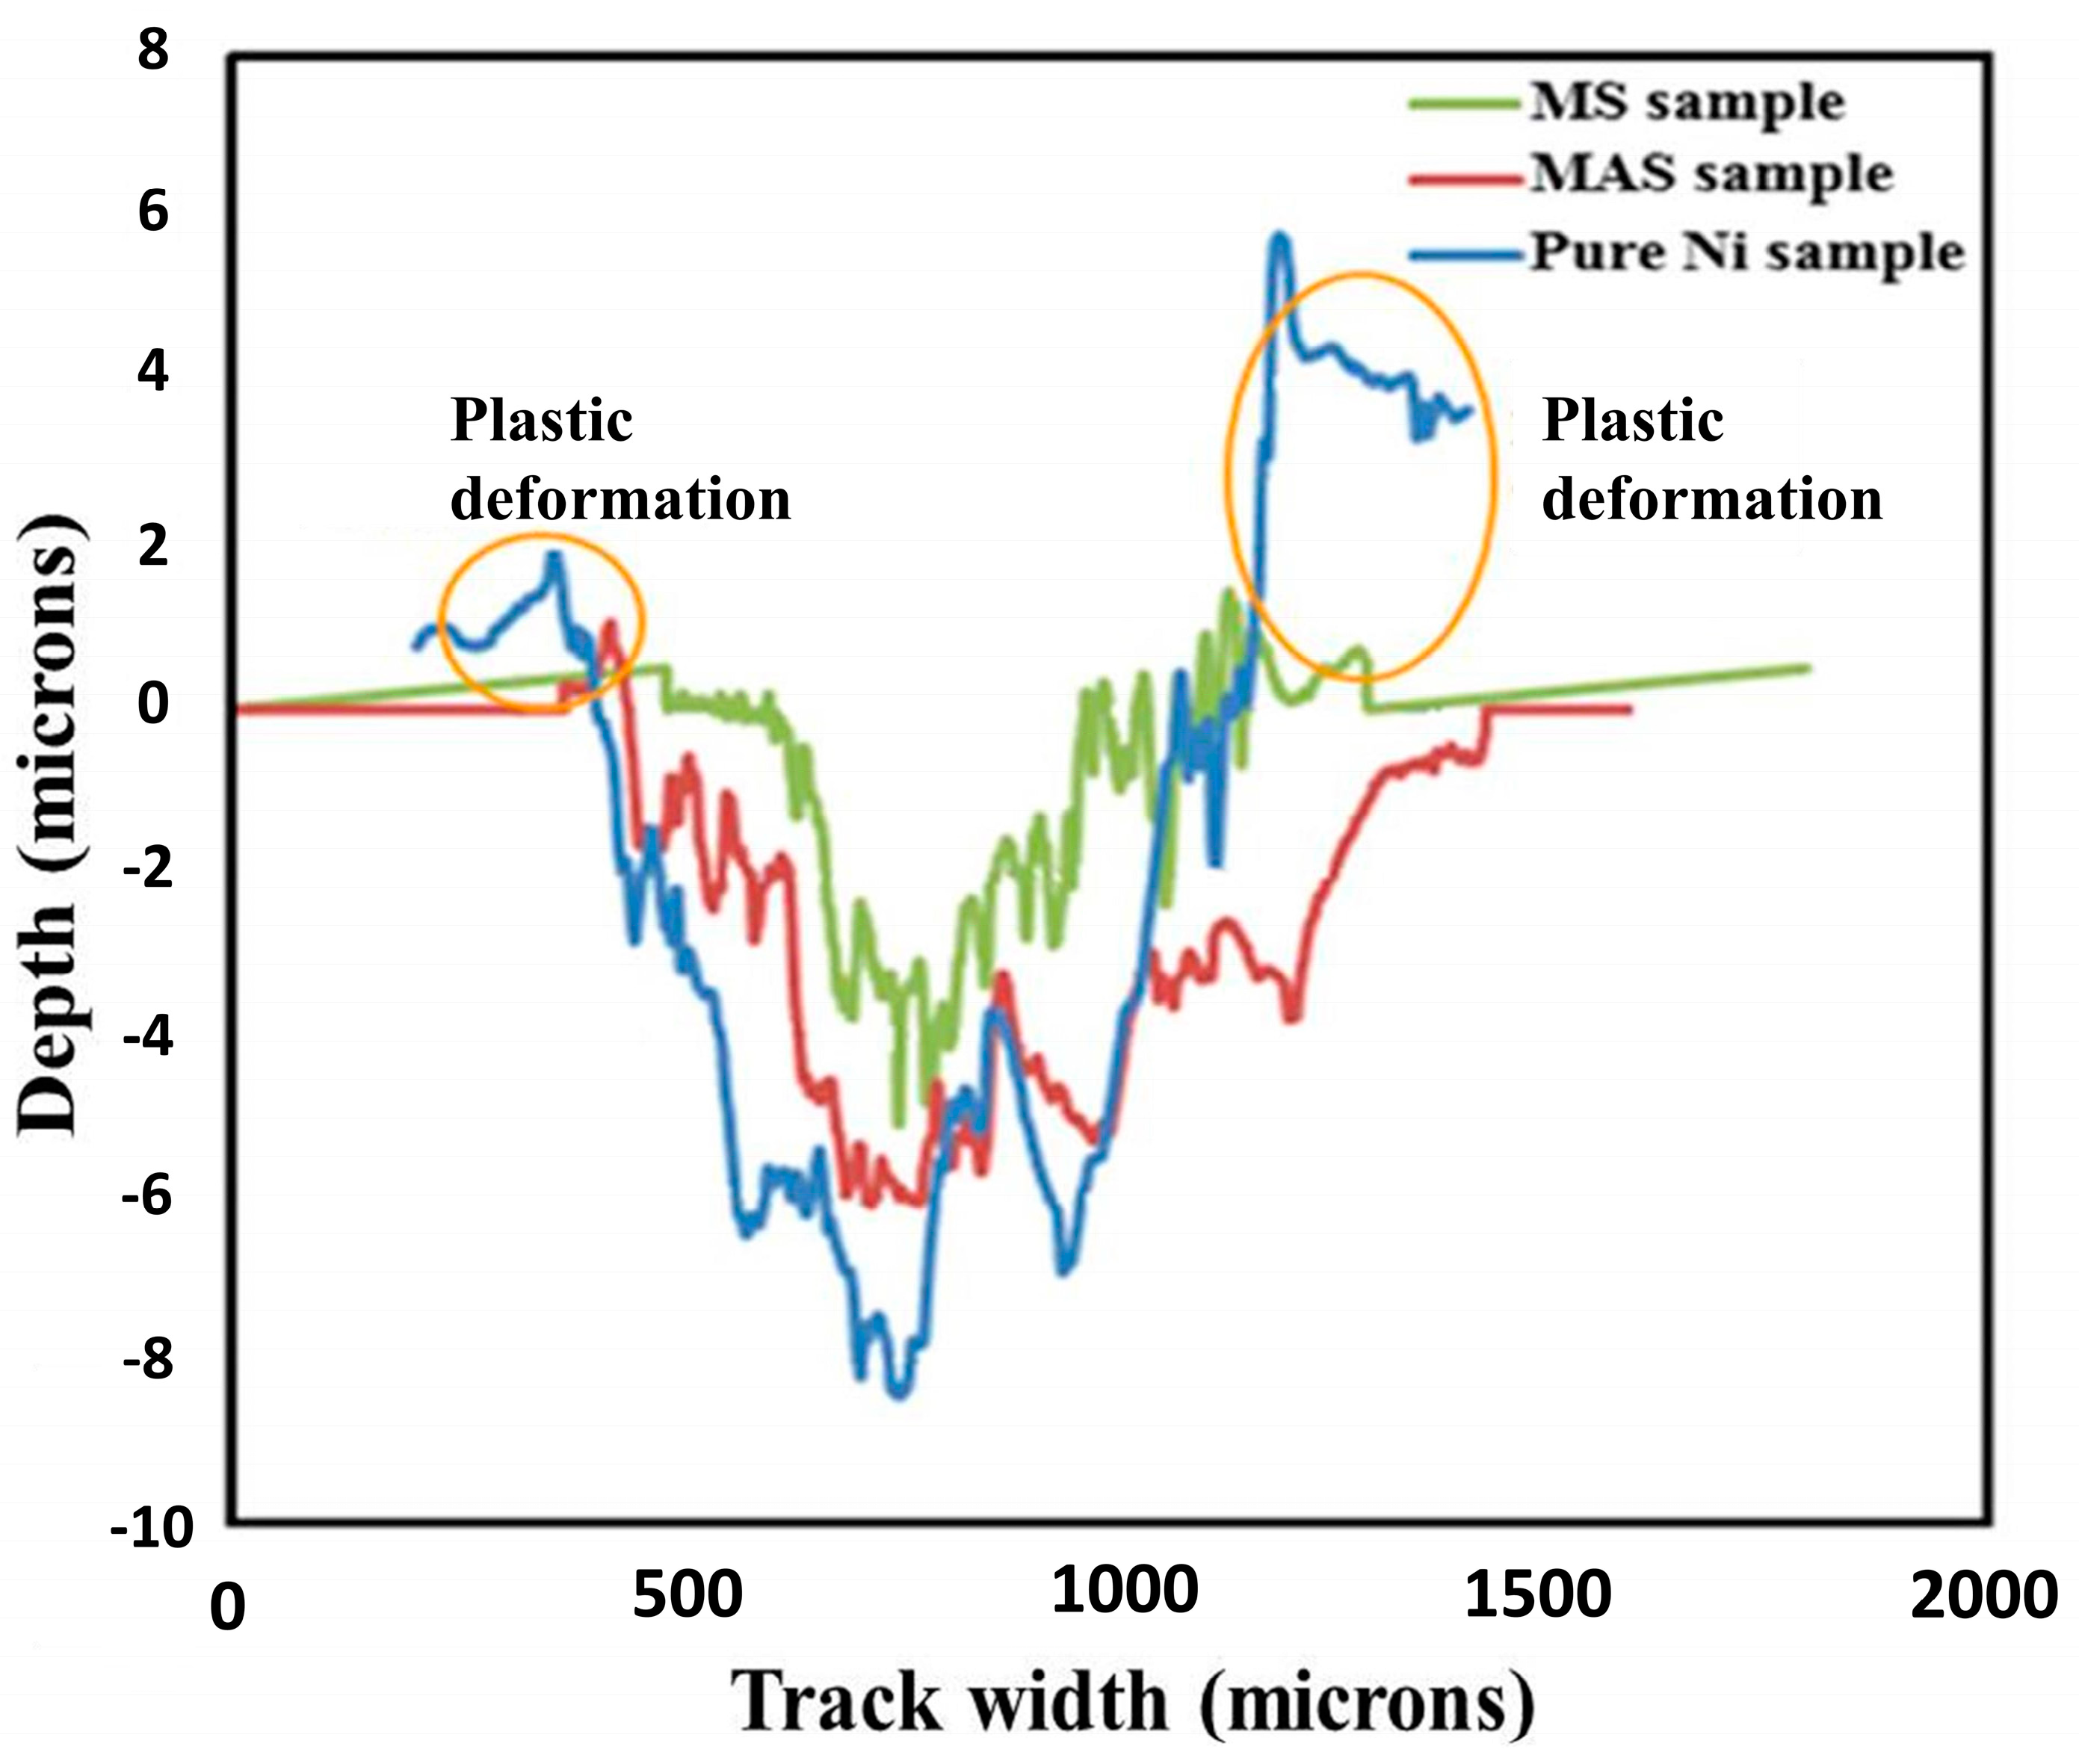
3.4.2. Tribological Properties

Figure 15 illustrates the relationship between the coefficient of friction (COF) and distance for three distinct samples—pure Ni, MAS, and MS (Samples 1, 2, and 3 in Table 3). Since fresh surfaces wear quickly, all samples initially showed a peak COF value within the first 50 m. The COF of the pure Ni sample was 0.6, which was comparable to that of the MS sample. The COF of the pure Ni and MS samples dropped with increasing sliding distance, while the COF of the Ni-5%TiC sample increased with distance [4]. On the other hand, the COF of the MAS sample remained consistent during the test. As seen in Figure 15, fluctuations in COF imply that the contact surface splits into layers throughout the wear test. The MS samples were harder than the pure Ni sample, but their COF was not appreciably different [32]. The COF of the MAS sample was larger than that of the pure Ni sample (0.7). There are various reasons for the differences in COF across related research.
Firstly, compared to the pure Ni sample, the porosity of the MS and MAS samples was higher. The porosity between the reinforcing layers in the MAS sample is the reason for the increased COF. As a result, when force was applied from the matrix to the reinforcement during the wear test, the tribofilm tore more quickly because of poor bonding. The MS sample was found to have higher wear resistance than the MAS sample due to its increased porosity in the grain boundaries (Figure 15). Second, because there were more reinforcements in the MS sample than in the MAS sample, the thinner reinforcement that formed there improved the stability of the tribofilm and obstructed the movement of dislocations. Intermetallic compound production in the Ni matrix was correlated with porosity. Due to the excellent ductility of Ni and its comparatively low hardness, porosity in the pure Ni sample was mainly removed by the pressure applied throughout the SPS procedure. On the other hand, the intermetallic phase production in the MAS and MS samples resulted in partially eliminated porosity, which hindered a strong bond between the intermetallic reinforcement and the Ni matrix.
Figure 16 shows the EDS maps and SEM micrographs of the pure Ni, MAS, and MS samples following the wear test. Abrasion wear was shown by the wear track with cracks and scratches in the pure Ni sample (Figure 16a).
The entire wear track showed evidence of a large layered delamination [33], with wear products and debris visible outside the edges of the wear track. Additionally, the EDS maps revealed iron in the wear track, suggesting an abrasive wear mechanism and pin wear during the tribotest [34,35]. On the other hand, the MAS and MS samples showed indications of adhesive wear, which were identified by variations in plastic deformation, wear debris that resembled flaking, and scratches on the wear surface. Delamination wear was seen in the pure Ni sample, which is noteworthy. The unwanted movement and adherence of wear products and materials from the pin surface to the sample surface caused scratches on the surface. Figure 15 shows that no tribolayer formed on the surface of the bulk Ni sample, in contrast to the MAS and MS samples. This can be explained by the variations in sample hardness.
The research studied the wear properties of Ni3Al-reinforced nanocomposites, revealing unique mechanisms across various samples. The pure Ni sample primarily showed abrasive wear, characterized by material removal via micro-cutting and plowing actions of hard asperities or particles, which is typical for materials with lower hardnesses sliding against a harder counterface. The mechanically alloyed and sintered (MAS) and mechanically sintered (MS) samples exhibited adhesive wear. This mechanism occurs when surfaces adhere at asperities, resulting in material transfer or debris formation due to the rupture of asperity junctions, which is commonly observed in harder materials with smoother surfaces. The wear behavior was additionally affected by residual porosity and the interfacial bonding between the Ni matrix and Ni3Al reinforcements. Porosity functioned as a stress concentrator, facilitating crack initiation and propagation, whereas weak bonding led to reinforcement detachment during sliding. In the MAS and MS samples, these factors worsened wear, resulting in a greater amount of adhesive wear, where adhered material was easily pulled away during movement [36]. The surface of the pure Ni sample experienced abrasive and delamination wear due to its lower hardness than the steel pin, which has a hardness value of 820 HV. On the other hand, the high hardness of MAS and MS samples promoted the development of a tribolayer and slight abrasion wear on their surfaces. Increased hardness generally leads to better wear resistance; however, microstructural elements can influence this relationship. This study reveals that although hardness levels were increased, the wear resistance was reduced as a result of residual porosity and inadequate bonding between the Ni matrix and Ni3Al reinforcements. Porosity leads to stress concentration and cracking, whereas inadequate bonding results in reinforcement debonding, both of which compromise wear performance. Enhancing microstructural integrity through the reduction of porosity and the strengthening of interfaces is essential. Similar studies [37] further emphasize the significant effect of these factors on wear behavior, even under conditions of increased hardness.
In the SEM micrographs, the darker regions correspond to oxidized pieces, such as NiO, which have a lower density, while the brighter phase corresponds to Ni with a higher density [38]. The cross-sectional profile of wear scars under a 2 N load is depicted in Figure 17.
The wear profile of each sample directly correlates with the wear rate. Adhesive wear in metals and alloys is typically associated with their soft nature, making it the predominant wear mechanism in most cases. Consequently, increasing the load results in more severe plastic deformation [34]. The deformation caused by wear is expected to be layered and non-uniform on the surface [32]. As the load on the sample surface increases, the weight loss, depth, and width of the wear area also increase. A wider and deeper wear track indicates more significant wear [33]. Figure 17 illustrates that the wear width was nearly identical for MAS and MS samples, while the pure Ni sample exhibited the greatest wear depth. The wear profile of MAS and MS samples displayed lumps and a smaller roughness value compared to the pure Ni samples due to their higher hardness. Note that there can be substantial plastic distortion in the ridges at the beginning and end of the wear track width. Although a tribolayer has formed on the surfaces of the MS and MAS samples, it seems to be fragile and to have deteriorated, especially in the MAS sample case. As a result, wear rose in comparison to the pure Ni sample. The wear seen in the MAS and MS samples was caused in part by porosity and insufficient bonding between the reinforcement and matrix. However, because of the finer and thinner Ni3Al reinforcement, the MS sample showed less wear even with porosity. As shown in Figure 17, adhesive wear resulted in higher surface roughness and the formation of lumps, which is referred to as galling. The EDS maps of debris from the MAS and MS samples indicate the presence of an intermetallic compound in the debris. The Ni3Al intermetallic compound, with its high hardness (approximately 560 HV) compared to the low hardness of the Ni matrix (approximately 200 HV), acts as abrasive particles during wear. As a result, the bulk Ni sample experienced two-body wear, while the MAS and MS samples exhibited three-body wear. A tribofilm forms in the wear track as a result of debris getting caught between the pin and sample surfaces during the three-body wear phenomenon. The EDS pictures in Figure 16 show that the abrasive products of the pure Ni sample (Figure 16a) had less oxygen than those of the MAS and MS samples (Figure 16b,c), suggesting that the MAS and MS samples had undergone severe oxidation. Therefore, abrasion and delamination were the primary wear mechanisms for the pure Ni samples, whereas adhesive wear was more common in the MAS and MS samples.
The notable increase in the hardness of the nanocomposite can be attributed to three key factors [39]. Initially, grain boundary strengthening takes place as grains are refined to the nanometer scale, resulting in an increased grain boundary area that hinders dislocation movement. This process enhances the hardness, which is consistent with the Hall–Petch relationship, indicating that smaller grain sizes contribute to greater strength and hardness. Additionally, the development of hard intermetallic phases, like Ni3Al, within the matrix enhances overall hardness by serving as strong barriers to dislocation movement. The high hardness and strength of these intermetallic phases significantly enhance the composite material. Eventually, mechanical alloying leads to the introduction of residual stresses and work hardening, resulting in an increased dislocation density that enhances hardness. The energy accumulated from these defects contributes to improved resistance against deformation. The combined effects lead to the outstanding hardness seen in the nanocomposite, matching with results in comparable mechanically alloyed systems [39]. The mechanical and tribological properties of the samples are significantly influenced by porosity. The MAS sample had a porosity of 4% and a hardness of 310 ± 15 HV, whereas the MS sample, with a lower porosity of 2%, had a higher hardness of 350 ± 15 HV. This shows that higher porosity reduces hardness by decreasing the ability of material to bear loads effectively. Furthermore, the higher porosity in the MAS sample facilitated crack initiation, leading to increased wear rates. In contrast, the reduced porosity in the MS sample enhanced wear resistance by limiting crack propagation and material removal during sliding [40].

4. Conclusions

This work aims to create a strengthened nickel matrix nanocomposite through the use of layered NiAl intermetallic compounds. This will be achieved by the processes of mechanical alloying (MA) and spark plasma sintering (SPS). One new thing about this study is that it uses nanoscale, layered Ni-Al reinforcement during production. This is different from the particle-type reinforcement that was commonly used in earlier Ni-based composites. The layered reinforcement that is made in situ not only improves the mechanical properties but also makes the interface between the reinforcement and the matrix better. This fixes a lot of problems that happen with composites that do not have in situ reinforcement. After 20 h of mechanical milling, the Al layers inside the Ni matrix created an ultra-fine layered structure. Using mechanical milling in conjunction with annealing or the SPS method will yield the Ni3Al intermetallic complex faster. The SPS procedure generated a bulk sample (1200 °C, 5 min, 40 MPa) with a hardness value of 350 HV and a relative density of approximately 95%. Under a 2 N load, the wear behavior of the MS sample seemed comparable to that of the pure Ni sample. The low wear resistance in the hard Ni3Al phase is due to the powder particles not sticking together well enough and the bulk sample still having some holes in it. SEM micrographs demonstrated that adhesive wear primarily caused the bulk nanocomposite sample’s wear. Unfortunately, early degradation and breaking occurred to the tribolayer that had formed during wear. Therefore, increased hardness does not always correlate with greater wear resistance. The bonding between the reinforcement and matrix impacted the samples’ wear resistance, but it did not significantly affect their hardness. The sample’s density was below the theoretical limit, resulting in less resistance to wear.

Author Contributions

Conceptualization, M.H.E. and F.K.; Methodology, Z.A., M.H.E. and F.K.; Validation, Z.A. and A.H.S.; Formal analysis, Z.A. and A.H.S.; Investigation, A.H.S.; Data curation, A.H.S.; Writing—original draft, A.H.S.; Writing—review & editing, Z.A.; Supervision, M.H.E. and F.K.; Project administration, M.H.E.; Funding acquisition, M.H.E. and F.K. All authors have read and agreed to the published version of the manuscript.

Funding

This research received no external funding.

Data Availability Statement

The data used to support the findings of this study are included within the article.

Conflicts of Interest

The authors declare they have no conflicts of interest.

Abbreviation

Original NameAbbreviation
mechanical alloyingMA
spark plasma sinteringSPS
nickel matrix nanocompositeNMN
metal matrix compositesMMCs
process control agentPCA
ball-to-powder ratioBPR
milling + annealing + SPSMAS
milling + SPSMS
scanning electron microscopySEM
energy-dispersive X-ray spectroscopyEDS
face-centered cubicFCC
body-centered cubicBCC

References

  1. Cavaliere, P.; Sadeghi, B.; Shabani, A. Spark plasma sintering: Process fundamentals. In Spark Plasma Sintering of Materials Advances in Processing and Applications; Springer: Berlin/Heidelberg, Germany, 2019; pp. 3–20. [Google Scholar]
  2. Zohari, S.; Sadeghian, Z.; Lotfi, B.; Broeckmann, C. Application of spark plasma sintering (SPS) for the fabrication of in situ Ni–TiC nanocomposite clad layer. J. Alloys Compd. 2015, 633, 479–483. [Google Scholar] [CrossRef]
  3. Malaki, M.; Xu, W.; Kasar, A.K.; Menezes, P.L.; Dieringa, H.; Varma, R.S.; Gupta, M. Advanced metal matrix nanocomposites. Metals 2019, 9, 330. [Google Scholar] [CrossRef]
  4. Walunj, G.; Bearden, A.; Patil, A.; Larimian, T.; Christudasjustus, J.; Gupta, R.K.; Borkar, T. Mechanical and tribological behavior of mechanically alloyed Ni-TiC composites processed via spark plasma sintering. Materials 2020, 13, 5306. [Google Scholar] [CrossRef] [PubMed]
  5. Chawla, K.K. Composite Materials: Science and Engineering, 4th ed.; Springer: Cham, Switzerland, 2019. [Google Scholar]
  6. Patil, A.; Walunj, G.; Torgerson, T.B.; Koricherla, M.V.; Khan, M.U.; Scharf, T.W.; Gupta, R.; Borkar, T. Tribological behavior of in situ processed NI-Ti-C nanocomposites. Tribol. Trans. 2021, 64, 53–64. [Google Scholar] [CrossRef]
  7. El-Eskandarany, M.S. Mechanical Alloying: Energy Storage, Protective Coatings, and Medical Applications; William Andrew: Oxford, UK; Cambridge, MA, USA, 2020. [Google Scholar]
  8. Enayati, M.; Sadeghian, Z.; Salehi, M.; Saidi, A. The effect of milling parameters on the synthesis of Ni3Al intermetallic compound by mechanical alloying. Mater. Sci. Eng. A 2004, 375, 809–811. [Google Scholar] [CrossRef]
  9. Talaş, Ş. Nickel aluminides. In Intermetallic Matrix Composites; Elsevier: Amsterdam, The Netherlands, 2018; pp. 37–69. [Google Scholar]
  10. Shevtsova, L.; Mali, V.; Bataev, A.; Anisimov, A.; Dudina, D. Microstructure and mechanical properties of materials obtained by spark plasma sintering of Ni3Al–Ni powder mixtures. Mater. Sci. Eng. A 2020, 773, 138882. [Google Scholar] [CrossRef]
  11. Suryanarayana, C. Mechanical alloying: A novel technique to synthesize advanced materials. Research 2019, 2019, 4219812. [Google Scholar] [CrossRef]
  12. Enayati, M.; Mohamed, F. Application of mechanical alloying/milling for synthesis of nanocrystalline and amorphous materials. Int. Mater. Rev. 2014, 59, 394–416. [Google Scholar] [CrossRef]
  13. Awotunde, M.A.; Ayodele, O.O.; Adegbenjo, A.O.; Okoro, A.M.; Shongwe, M.B.; Olubambi, P.A. NiAl intermetallic composites—A review of processing methods, reinforcements and mechanical properties. Int. J. Adv. Manuf. Technol. 2019, 104, 1733–1747. [Google Scholar] [CrossRef]
  14. Simões, S.; Viana, F.; Reis, M.A.; Vieira, M.F. Aluminum and nickel matrix composites reinforced by CNTs: Dispersion/mixture by ultrasonication. Metals 2017, 7, 279. [Google Scholar] [CrossRef]
  15. Dutel, G.; Tingaud, D.; Langlois, P.; Dirras, G. Nickel with multimodal grain size distribution achieved by SPS: Microstructure and mechanical properties. J. Mater. Sci. 2012, 47, 7926–7931. [Google Scholar] [CrossRef]
  16. Goudarzi, A.; Lalianpour, A.; Mehrizi, M.Z.; Beygi, R. Fabrication of NiAl–Al2O3-WC nanocomposite by mechanical alloying and subsequent heat treatment. Ceram. Int. 2019, 45, 19049–19054. [Google Scholar] [CrossRef]
  17. Anselmi-Tamburini, U.; Gennari, S.; Garay, J.; Munir, Z. Fundamental investigations on the spark plasma sintering/synthesis process: II. Modeling of current and temperature distributions. Mater. Sci. Eng. A 2005, 394, 139–148. [Google Scholar] [CrossRef]
  18. Laszkiewicz-Łukasik, J.; Putyra, P.; Klimczyk, P.; Podsiadło, M.; Bednarczyk, K. Spark plasma sintering/field assisted sintering technique as a universal method for the synthesis, densification and bonding processes for metal, ceramic and composite materials. J. Appl. Mater. Eng. 2020, 60, 53–69. [Google Scholar] [CrossRef]
  19. Azarmi, F.; Tangpong, X.; Chandanayaka, T. Investigation on mechanical properties of cold sprayed Ni–Ni3Al composites. Surf. Eng. 2015, 31, 832–839. [Google Scholar] [CrossRef]
  20. Udhayabanu, V.; Ravi, K.; Murugan, K.; Sivaprahasam, D.; Murty, B. Development of Ni-Al2O3 in-situ nanocomposite by reactive milling and spark plasma sintering. Metall. Mater. Trans. A 2011, 42, 2085–2093. [Google Scholar] [CrossRef]
  21. Anvari, S.; Karimzadeh, F.; Enayati, M. Synthesis and characterization of NiAl–Al2O3 nanocomposite powder by mechanical alloying. J. Alloys Compd. 2009, 477, 178–181. [Google Scholar] [CrossRef]
  22. Blau, P.J.; Budinski, K.G. Development and use of ASTM standards for wear testing. Wear 1999, 225, 1159–1170. [Google Scholar] [CrossRef]
  23. Yazdani, N.; Toroghinejad, M.R.; Shabani, A.; Cavaliere, P. Effects of process control agent amount, milling time, and annealing heat treatment on the microstructure of alcrcufeni high-entropy alloy synthesized through mechanical alloying. Metals 2021, 11, 1493. [Google Scholar] [CrossRef]
  24. Chaira, D. Powder metallurgy routes for composite materials production. Encycl. Mater. Compos. 2021, 2, 588–604. [Google Scholar]
  25. Enayati, M.H. Formation of nanoscale layered structures and subsequent transformations during mechanical alloying of Ni60Nb40 powder mixture in a low energy ball mill. Kona Powder Part. J. 2015, 32, 196–206. [Google Scholar] [CrossRef]
  26. Azhagarsamy, P.; Sekar, K.; Murali, K. Nickel Aluminide intermetallic composites fabricated by various processing routes—A review. Mater. Sci. Technol. 2022, 38, 556–571. [Google Scholar] [CrossRef]
  27. Paul, A.R.; Mukherjee, M.; Singh, D. A critical review on the properties of intermetallic compounds and their application in the modern manufacturing. Cryst. Res. Technol. 2022, 57, 2100159. [Google Scholar] [CrossRef]
  28. Munroe, P.; George, M.; Baker, I.; Kennedy, F. Microstructure, mechanical properties and wear of Ni–Al–Fe alloys. Mater. Sci. Eng. A 2002, 325, 1–8. [Google Scholar] [CrossRef]
  29. Bochenek, K.; Basista, M. Advances in processing of NiAl intermetallic alloys and composites for high temperature aerospace applications. Prog. Aerosp. Sci. 2015, 79, 136–146. [Google Scholar] [CrossRef]
  30. Mardiha, P.; Bahrami, A.; Mohammadnejad, A. Towards a high strength ductile Ni/Ni3Al/Ni multilayer composite using spark plasma sintering. Sci. Sinter. 2019, 51, 401–408. [Google Scholar] [CrossRef]
  31. Saba, F.; Zhang, F.; Liu, S.; Liu, T. Reinforcement size dependence of mechanical properties and strengthening mechanisms in diamond reinforced titanium metal matrix composites. Compos. Part B Eng. 2019, 167, 7–19. [Google Scholar] [CrossRef]
  32. Pan, S.; Jin, K.; Wang, T.; Zhang, Z.; Zheng, L.; Umehara, N. Metal matrix nanocomposites in tribology: Manufacturing, performance, and mechanisms. Friction 2022, 10, 1596–1634. [Google Scholar] [CrossRef]
  33. Sajjadnejad, M.; Abadeh, H.K.; Omidvar, H.; Hosseinpour, S. Assessment of Tribological behavior of nickel-nano Si3N4 composite coatings fabricated by pulsed electroplating process. Surf. Topogr. Metrol. Prop. 2020, 8, 025009. [Google Scholar] [CrossRef]
  34. Wang, L.; Dong, B.; Qiu, F.; Geng, R.; Zou, Q.; Yang, H.; Li, Q.; Xu, Z.; Zhao, Q.; Jiang, Q. Dry sliding friction and wear characterization of in situ TiC/Al-Cu3.7-Mg1.3 nanocomposites with nacre-like structures. J. Mater. Res. Technol. 2020, 9, 641–653. [Google Scholar] [CrossRef]
  35. Rivero, L.E.H.S.; Pizzatto, A.; Teixeira, M.F.; Rabelo, A.; Falcade, T.; Scheid, A. Effect of Laser Power and Substrate on the Hastelloy C276 TM Coatings Features Deposited by Laser Cladding. Mater. Res. 2020, 23, e20200067. [Google Scholar] [CrossRef]
  36. Choudhury, Y.; Gupta, P. Wear behavior of composites and nanocomposites: A new approach. Recent Trends Nanomater. Synth. Prop. 2017, 29–48. [Google Scholar]
  37. Zhu, H.-W.; Yu, B.-Y.; Zhang, H.; Yu, B.-N.; Lv, S.-N.; Zheng, L.; Li, R.-X. Effect of annealing treatment on microstructure and mechanical properties of Al/Ni multilayer composites during accumulative roll bonding (ARB) process. J. Iron Steel Res. Int. 2020, 27, 96–104. [Google Scholar] [CrossRef]
  38. Mishra, S.; Chandra, K.; Prakash, S. Dry sliding wear behaviour of nickel-, iron-and cobalt-based superalloys. Tribol.-Mater. Surf. Interfaces 2013, 7, 122–128. [Google Scholar] [CrossRef]
  39. Yakovtseva, O.; Mochugovskii, A.; Emelina, N.; Zanaeva, E.; Prosviryakov, A.; Mikhaylovskaya, A. Strenghthening features of mechanically alloyed Al-Mn-Cu alloy. Metallurgist 2024, 68, 672–682. [Google Scholar] [CrossRef]
  40. Pinate, S.; Ghassemali, E.; Zanella, C. Strengthening mechanisms and wear behavior of electrodeposited Ni–SiC nanocomposite coatings. J. Mater. Sci. 2022, 57, 16632–16648. [Google Scholar] [CrossRef]
Figure 1. Weight reduction vs. load from 1 N to 5 N.
Nanomanufacturing 05 00001 g001
Figure 2. Flowchart depicting the characterization process of bulk samples, including XRD, SEM, TEM and OM analyses, followed by the evaluation of hardness, density, and tribological properties.
Nanomanufacturing 05 00001 g002
Figure 3. XRD patterns of the Ni95Al5 powder as received and after different milling times.
Nanomanufacturing 05 00001 g003
Figure 4. XRD patterns of the Ni95Al5 powder mixture after (a) 20 h of mechanical milling (b) annealing at 700 °C for 1 h (c) SPS at 1200 °C for 5 min-MS sample.
Nanomanufacturing 05 00001 g004
Figure 5. Change in intensity and angle of the XRD peak located at 42–46° at different conditions.
Nanomanufacturing 05 00001 g005
Figure 6. SEM images of the as-received powder particles (a) aluminum, (b) nickel, and (c,d) Ni95Al5 powder particles after 10 and 20 milling times, respectively.
Nanomanufacturing 05 00001 g006
Figure 7. (a) SEM images of the Ni95Al5 powder after 20 h of milling, (b,c) elemental maps of Ni and Al taken from the same area, and (d) X-ray energy spectroscopy analysis (EDS) of powder particles.
Nanomanufacturing 05 00001 g007
Figure 8. Cross-sectional SEM micrographs of the Ni95Al5 powder after milling for (a) 10 h and (b) 20 h (etched).
Nanomanufacturing 05 00001 g008
Figure 9. Cross-sectional SEM micrographs of the Ni95Al5 powder showing formation of layers of Ni3Al intermetallic compound in (a) MAS and (b) MS samples (etched).
Nanomanufacturing 05 00001 g009
Figure 10. EDS line scanning analysis at (a) milled powder sample, and (b) MS sample.
Nanomanufacturing 05 00001 g010
Figure 11. TEM images showing the formation of the layered structure in the MAS sample at different magnifications (ac).
Nanomanufacturing 05 00001 g011
Figure 12. TEM images and EDS analysis of the MAS sample, confirming the layered structure and providing elemental composition (ac).
Nanomanufacturing 05 00001 g012
Figure 13. Microhardness of the pure Ni, MAS, and MS samples.
Nanomanufacturing 05 00001 g013
Figure 14. SEM images of (a) MAS sample and (b) MS sample, with SPS at 1200 °C.
Nanomanufacturing 05 00001 g014
Figure 15. Coefficient of friction vs. 1000 m distance for pure Ni, MAS, and MS sample after wear test under a load of 2 N.
Nanomanufacturing 05 00001 g015
Figure 16. Cross-sectional SEM micrographs/EDS analysis of (a) pure Ni bulk sample, (b) MAS sample, and (c) MS sample after wear test under a load of 2 N.
Nanomanufacturing 05 00001 g016
Figure 17. Roughness profile of the pure Ni, MAS, and MS samples after wear test under a load of 2 N.
Nanomanufacturing 05 00001 g017
Table 1. Specifications of balls used in MM.
Weight (g)Diameter (mm)Number of Balls
4510
12515
24520
Table 2. Porosity and density of the pure Ni, MAS, and MS samples.
No.SpecimenMMAnnealingSPS
Time
(h)
Time
(h)
Tem
(°C)
Time
(min)
Tem (°C)Pressure
(MPa)
Porosity
(%)
Theoretical Density (%)
1Pure Ni20 51200401.798.2
2MAS2017005120040496
3MS20 5120040595.2
4MS20 5100040694
5MAS20170051000407.692.5
Table 3. Microhardness and grain size (measured with the Williamson–Hall method) of the pure Ni, MAS, and MS samples.
No.SpecimenMAAnnealingSPS
Time
(h)
Time
(h)
Temp
(°C)
Time
(min)
Temp
(°C)
Pressure
(MPa)
Grain Size
(nm)
Hardness
(HV)
1Pure Ni20 512004090200 ± 5
2MAS201700512004085310 ± 15
3MS20 512004065350 ± 15
4MS20 512004034250 ± 20
5MAS201700512004048280 ± 20
Disclaimer/Publisher’s Note: The statements, opinions and data contained in all publications are solely those of the individual author(s) and contributor(s) and not of MDPI and/or the editor(s). MDPI and/or the editor(s) disclaim responsibility for any injury to people or property resulting from any ideas, methods, instructions or products referred to in the content.

