1. Introduction
Breast cancer has been the most common cancer among women in recent years. Breast cancer accounts for about 115 million new cases in women and 22.7 percent of total cases in 23 different types of cancer. Early diagnosis of breast cancer is the key to high potential, easy, inexpensive, and most effective treatment [
1]. Clinical and physical tests, imaging mammography, ultrasonic magnetic resonance imaging, and histopathology are all traditional diagnostic methods for breast cancer diagnosis. Clinical and physical examination, which directs patients to mammography or ultrasound studies, is insufficient [
2]. Furthermore, limited sensitivity in mammography results in a high rate of positive results. This strategy can also result in increased radiation exposure, which is regarded as an additional and important risk factor [
3]. While ultrasound is a non-invasive and safe method, it cannot be used in place of mammograms and scans for many cancers, especially in women over the age of 40. Histopathology is an approach that is used extensively when the disease begins. For this reason, studies to find biological markers that will enable breast cancer screening/diagnosis, even diagnosing cancer before their symptoms appear, and simple and low-risk determination methods for these markers have accelerated. There is a strong need to present Point of Care (POC) testing due to the high incidence of cancer diseases and the high frequency of analysis to be done in the clinical context [
4,
5] Studies to monitor serum biomarkers as early cancer diagnosis are currently being developed [
6,
7]. By measuring the expression levels of MicroRNAs (miRNAs) associated with cancer types at different levels in normal and cancerous tissue, miRNAs can be used as cancer biomarkers by providing information on cancer diagnosis [
8]. miRNAs are endogenous small RNA molecules of 19–25 base lengths that are not encoded and have significant regulatory effect on gene expression [
9]. The fact that miRNA is more than normal in cancer shows that it acts as an oncogene and plays a role in cancer formation and development by negatively regulating apoptosis-controlling genes and tumor suppressor genes [
10].
Numerous investigations have revealed that miRNA-155 is expressed abnormally in breast cancer patients [
8]. miR-155 overexpression is linked to aggressive metastatic traits, tumor subtype, inadequate survival rates, and clinical pathological breast cancer indicators. Additionally, it has been linked to a higher chance of developing breast cancer [
8,
11]. MiR-155 is involved in the regulation of several pathways, including cell survival, cell proliferation, and radio/chemo resistance, through inhibiting target genes such FOXO3A, RhoA, and SOCS1 [
8,
12,
13]. The promise of a quick serological test for breast cancer prediction, diagnosis, and follow-up is shown using miRNA-155 as a possible biomarker in breast cancer.
In breast cancer, overexpression of miR-155 is associated with increased tumorigenesis and its concentration in the serum of breast cancer patients compared to normal controls, and miR-155, a decreased trend after surgery and chemotherapy, is an indicator of treatment response and prognostic trends in breast cancer patients, which increases the likelihood of its implementation. After treatment, the decrease in serum levels of miR-155 in particular was noticed earlier than other biomarkers [
14]. Early detection and prognosis of breast cancer is based on precise, sensitive, and selective quantification of miR-155 in serum/plasma [
8,
15,
16] In addition, over-expression of miR-155 is seen in tumors including breast cancer and its mechanisms of action have been reported in many studies [
17,
18,
19]. A major barrier to improving breast cancer management is the lack of tumor markers with sufficient sensitivity and specificity. Developed evidence demonstrates the diagnostic potential of circulating miRNAs in cancer detection. MiR-155 plays an important role in the pathogenesis of breast cancer. However, the circulating level of miR-155 has still not been fully determined [
15]. Kong et al., in 2008, demonstrated the oncogenic properties of miR-155 in breast cancer cells. Upregulation of MIR-155PHG has been associated with activation of the TGFβ/Smad signaling cascade and consequent cell migration and invasion [
20]. miR-155-5p is described as the most effective miRNA in the ability of miRNAs to suppress apoptosis in MDA-MB-453 human breast cancer cells and to regulate Caspase-9 blockade [
21].
The detection of many tumor markers with high selectivity and sensitivity will be needed for widespread use of tumor markers in the health sector. Modern electrochemical bioaffinity sensors, such as geno or immuno sensors, have the sensitivity that is needed for early cancer detection. The superior characteristics of electrochemical devices hold great promise for improving the accuracy of cancer diagnosis and therapy monitoring. Such portable devices are supposed to speed up cancer diagnosis with further development and resources, and analytical results will be available in a matter of minutes in the patient’s bed or doctor’s office [
22,
23].
Nanopolymers containing various functional groups developed using the thiol affinity technique were synthesized using the mini-emulsion polymerization method to be used as a biologically active layer on the sensor surface based on miRNA detection in this study. Scanning Electron Microscope (SEM), Atomic Force Microscopy (AFM), Fourier Transform Infrared Spectrometer (FTIR), X-ray photoelectron spectroscopy (XPS), ellipsometer, contact angle measurements, zeta size and potential analysis, conductivity measurements, dry-mass analysis, and specific surface area calculations were used to conduct advanced characterization studies of nanopolymers that are integrated on electrochemical biosensor electrodes. The electrochemical nanobiosensor system’s operating conditions were optimized. Validation experiments were conducted after the analytical measurement characteristics were determined. Analyses of commercial blood serum samples were performed. The potential of the developed electrochemical biosensor to be used as a medical diagnostic kit was elucidated in the study’s final section by comparing it to commercial kits for miR-155 detection.
2. Materials and Methods
2.1. Materials
In the synthesis of Cys-graft-p (HEMA) nanopolymers, HEMA (2 Hydroxyethylmethacrylate), PVA (Poly vinyl alcohol), SDS (sodium dodecyl sulfate), NaHCO3 (sodium bicarbonate), EGDMA (Ethyleneglycol dimethacrylate), NAHSO3 (sodium bi sulfide), APS (Ammonium persulfate), Ethanol, Methanol, NaH and tetrahydrofuran, L-Cysteine were used.
In the preparation of the solution used in sensor studies, potassium chloride (KCl) potassium hexocyanoferrate (III) K3[Fe(CN)6] and potassium hexocyanoferrate (II) trihydrate K4[Fe(CN)6], potassium dihydrogen phosphate (KH2PO4), MUC 1, BSA (Bovine Serum Albumin), MCA-125, 1-ethyl-3-(dimethyl-aminopropyl) carbodiimide hydrochloride (EDC), N-hydroxyl succinimide (NHS), HUMAN SERUM, P2918. All chemicals were supplied from Merck (Darmstadt, Germany) and Sigma-Aldrich (Saint Louis, MI, USA). Alumina (0.05 micron) used in the electrode cleaning process was obtained from Basi Company. Ultrapure water was used in the preparation of solutions, cleaning of electrodes, and preparation processes in all processes.
For comparison with the reference method, the Qbit miRNA Assay Kit was used, obtained from Thermo Fisher Scientific, Massachusetts, ABD
miR-155 and conjugate probe arrays used within the scope of the method are as follows:
miRNA-155, 5′-UUA AUG CUA AUC GUG AUA GGG GU-3′.
anti-miRNA-155, 5′-AC CCC UAU CAC GAU UAG CAU UAA-3′
Thiolated anti-miRNA-155, 5′-HS-AC CCC UAU CAC GAU UAG CAU UAA-3′
2.2. Devices
In preparing nanopolymers, shaking water bath (Memmert, Wise Bath), magnetic stirrer (Wisd Laboratory Instrument, Wertheim, Germany) and multiple magnetic stirrer (Wisd Laboratory Instrument), microcentrifuge (Eppendorf Mini Spin Plus, Munich, Germany), oven Hereaus (Function Line), vortex (Dragon Lab MX-F), pH meter Neomet İSTEK (pH 240-L), 0.1 mg sensitive scale (Kern ABS), sonic bath (Bandelin Sonorex RK255H), and shaker (IKA KS 125 Basic) were used. PalmSens potentiostat (Houten, The Netherlands) was the device with which all measurements were taken as sensor device, gold electrode (Basi Bioanalytical System Inc., West Lafayette, IN, USA) as working electrode, Ag/AgCI (containing internal solution 3 M KCI) as reference electrode, and platinum wire as counter electrode (Basi Bioanalytical System Inc., West Lafayette, IN, USA). Fluorescence Spectrophotometer (Varian, Cary, NC, USA) was used for comparison with the reference method. PsTrace software was used for sensor measurements, ChemBio Draw software was used for molecular interaction drawings, Edraw software was used for other schematic drawings, and Microsoft Excel and GraphPad Prism software were used for analysis of calculations.
2.3. Methods
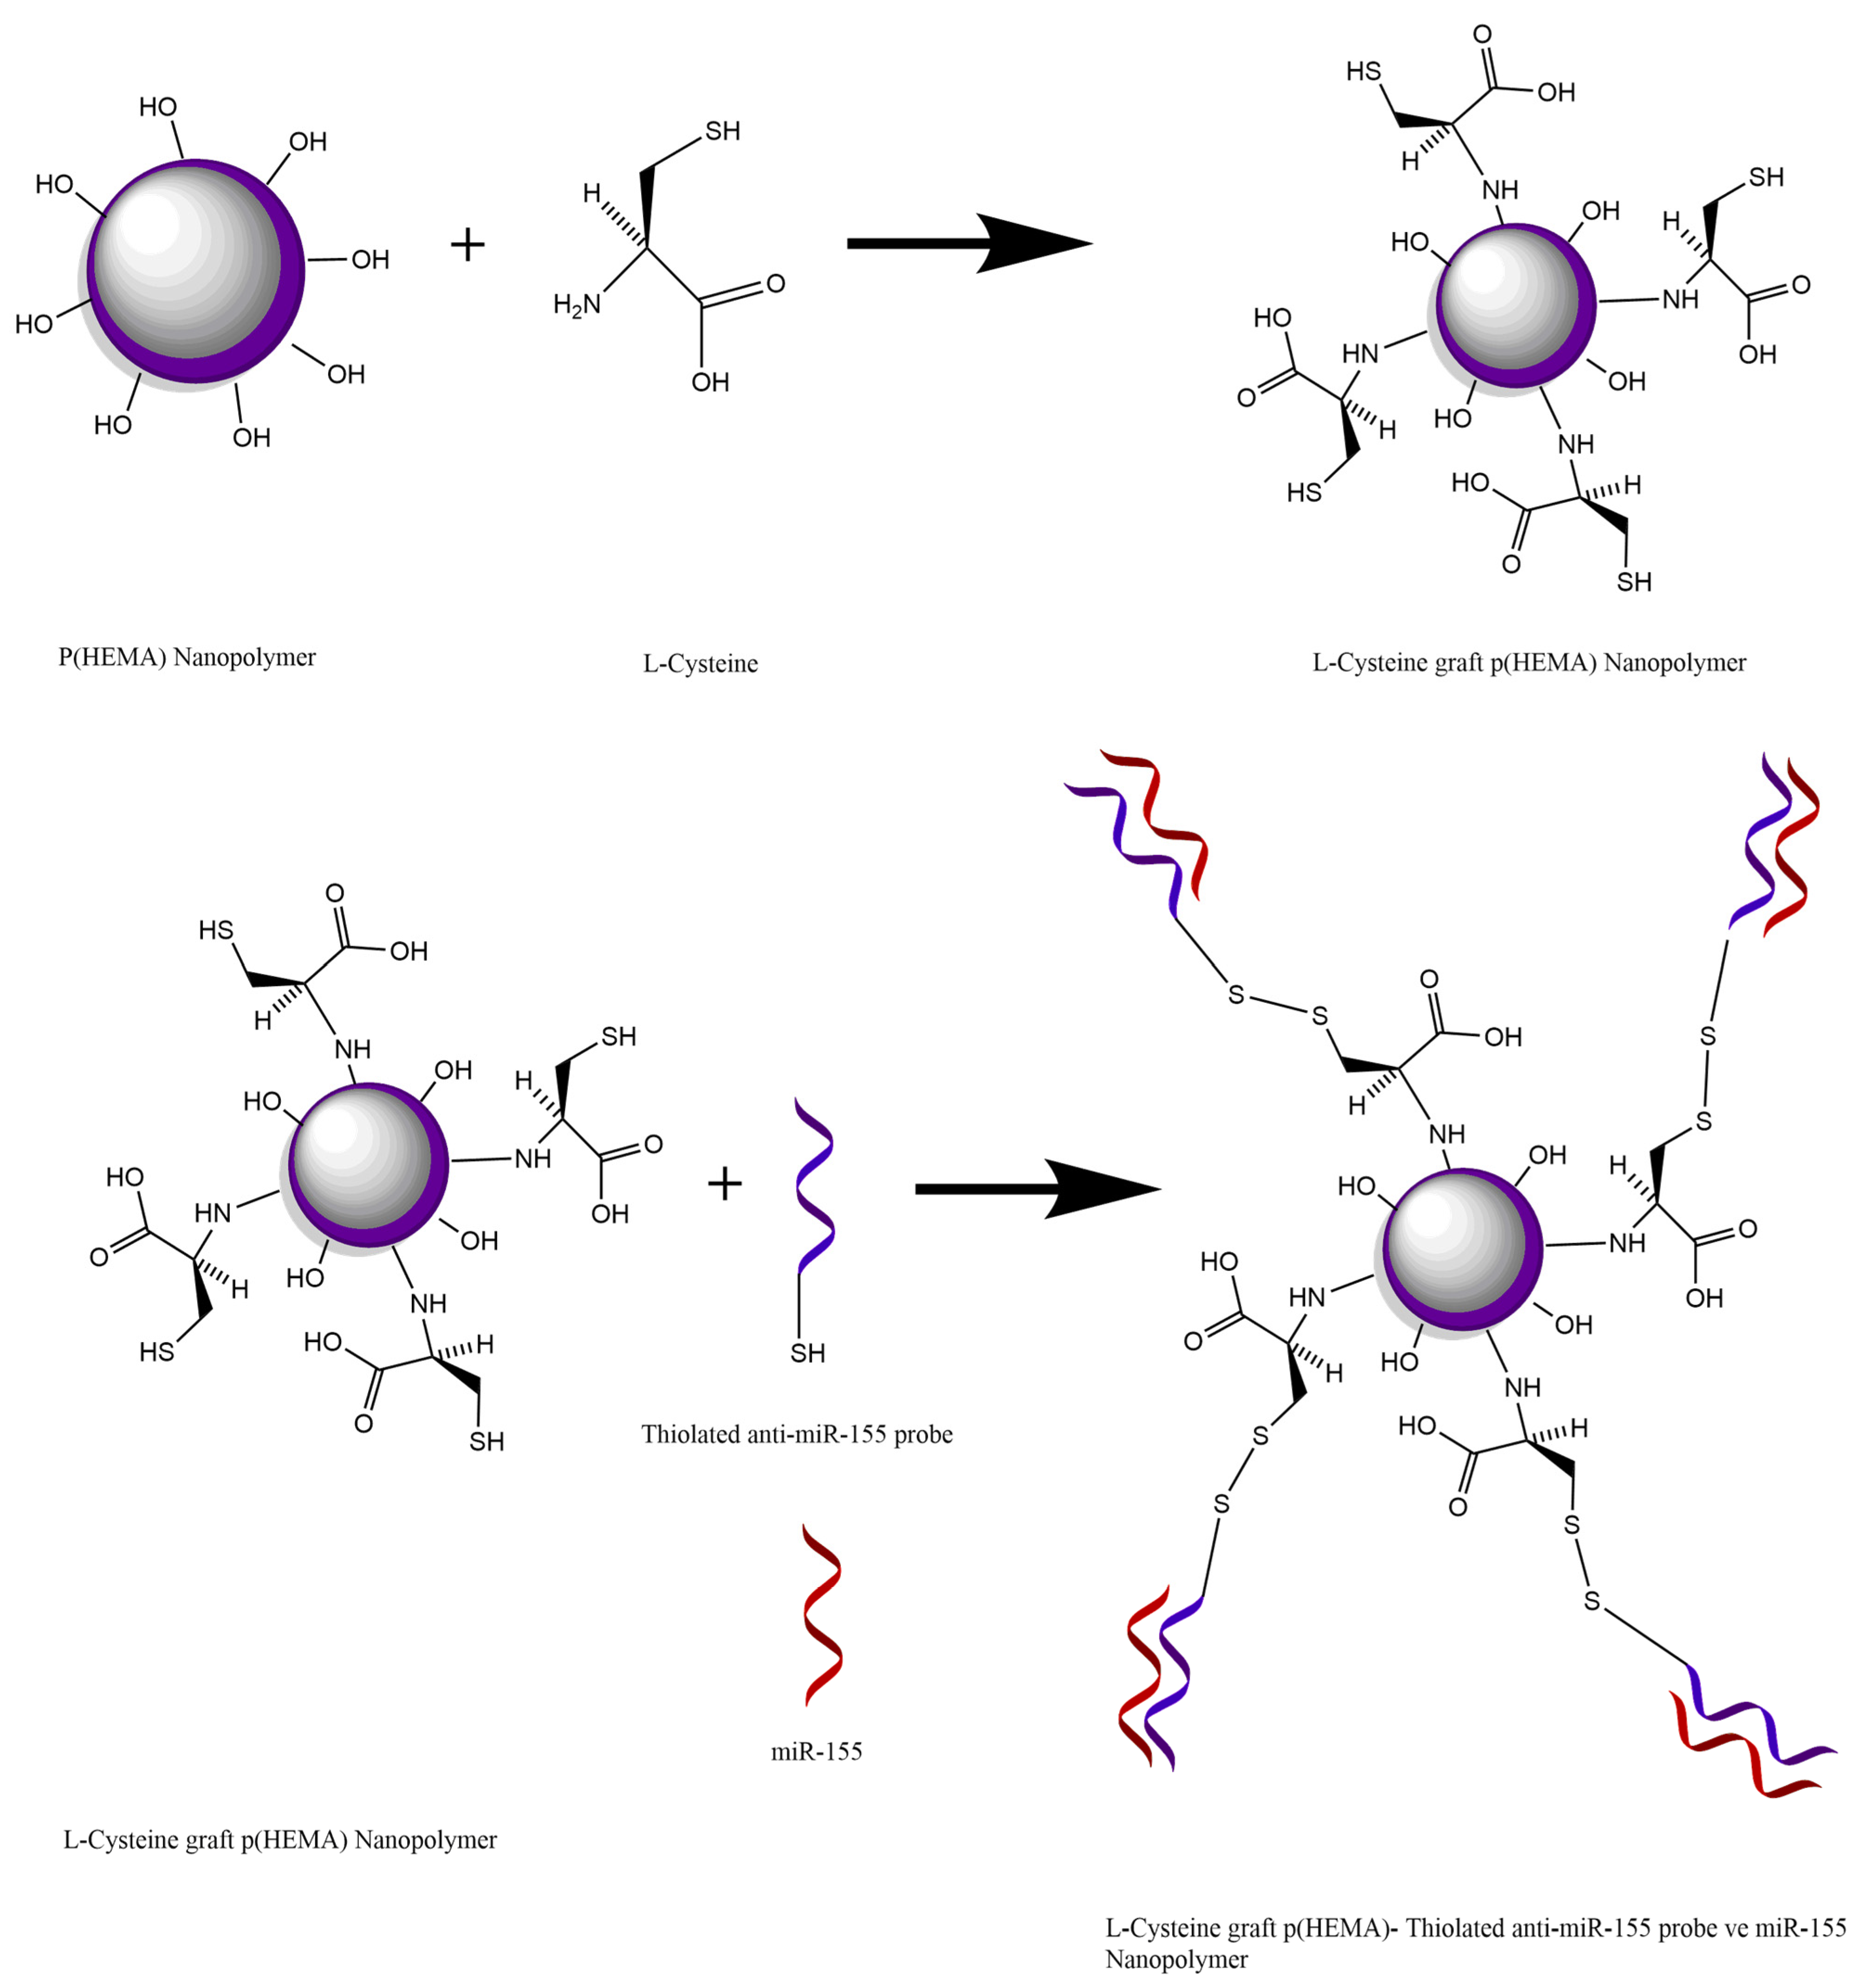
Within the scope of the study, the binding of miR-155 to the synthesized Cys-graft-p (HEMA) nanopolymer was achieved with the disulfide bond (S-S) formed between the thiol group originating from the cysteine amino acid in the nanopolymer and the thiol group in the conjugate probe of the thylated miR-155. The analysis was performed by making use of signal difference as a result of hybridization reaction to occur between miR-155 with the conjugate probe attached to the nanopolymer coated on the sensor chip (
Figure 1).
2.4. Preparation of p (HEMA) Nanopolymers
The mini emulsion method for the preparation of p(HEMA) nanopolymer was performed as follows: A triple phase system was used to synthesize p (HEMA) nanopolymers. Phase 1 (aqueous phase) was prepared by dissolving 0.4 g PVA, 57.7 mg SDS, and 46.9 mg NaHCO
3 in 200 mL d.water. To this phase, Phase 2 was added as the oil phase (monomer phase): 0.8 mL of HEMA and 4.2 mL of EGDMA. The prepared mixture was homogenized by mixing in a homogenizer for 15 min at 800 rpm. The new mixture formed after homogenization was passed through nitrogen gas for 2–3 min. As the 3rd phase, 0.2 g NaHSO
3 and 0.3 g APS were added to the other phases and the volume was completed to 250 mL. This prepared polymerization medium was taken into the reactor where the polymerization will take place and left to stir at 40 °C, 500 rpm for 24 h. At the end of the period, the white nanopolymers were removed from the reactor. After the nanopolymer preparation stage, settling, washing, and preparation processes were done. Ethanol-water washing was performed in nanopolymers. The prepared p (HEMA) nanopolymer was stored at +4 °C until use [
24].
2.5. Preparation of Cys-Graft-p (HEMA) Nanopolymers
For the preparation of the Cys-graft-P (HEMA) nanopolymer, 20 g p (HEMA) was taken into a reactor and 1.4 g NaH as catalyst and 3 g of L-Cys dissolved in 50 cm
3 tetrahydrofuran were added into the mixture. Inoculation reaction was carried out by mixing at 40 °C for 24 h. At the end of 24 h, the mixture was washed with ethanol and distilled water. When the washing processes were finished, Cys-graft-p (HEMA) nanopolymers were then dried at 37 °C in the oven to be prepared at the desired concentration and stored dry at 4 °C in the refrigerator [
25].
Graft yield is calculated using the formula below [
26,
27].
W1 = Initial mass of nanopolymer
W2 = Nanopolymer mass after graft procedure
2.6. Characterization of Synthesized Nanopolymers
In the study, physical and chemical properties of p (HEMA) and Cys-graft-p (HEMA) nanopolymers, which are synthesized to use as a sensor bioactive layer for the diagnosis of breast cancer biomarker miR-155, were characterized by advanced characterization techniques. Within the scope of these techniques, Scanning Electron Microscopy (SEM), Energy Distribution Spectrometry (EDS), Zeta Size and Potential Analysis, Conductivity Analysis, Atomic Force Microscopy (AFM), Fourier Transform Infrared Spectroscopy (FTIR), X-Ray Photoelectron Spectrometry (XPS), Dry Mass Graph, and Specific Surface Area Calculation.
In order to determine the dry nanopolymer mass of p (HEMA) and Cys-graft-p (HEMA) nanopolymer, the amount of mg polymer per unit volume (mL) was calculated by obtaining the mass-volume graph.
SEM analysis was performed within the scope of characterization studies of nanopolymers. The dilute solution of nanopolymers was distributed to the surface of the coverslip and dried in the oven during the sample preparation phase for SEM analysis. SEM analysis of nanopolymers was performed using scanning electron microscopy (Carl Zeiss 300VP) [
28].
Energy Distribution Spectrometry (EDS) (Carl Zeiss 300VP) was used to determine the chemical content and cysteine graft procedure of synthesized and modified nanopolymers. After SEM analysis in nanopolymers, % S (Sulfur) analysis was performed due to the grafting of the cysteine amino acid.
To calculate the specific surface areas of the synthesized p (HEMA) and Cys-graft-p (HEMA) nanopolymers, the following equation giving the number of particles in 1 mL of suspension was used [
29].
Here N is the number of nanopolymers in 1 mL suspension; S, % solid; d, diameter (µm); ρs refers to the polymer density (g/mL).
Using the plot-volume standard plot of nanopolymers, the amount of mg nanopolymer in ml suspension was calculated theoretically. The surface area equation of the sphere was also used, and the specific surface area of the synthesized p (HEMA) and Cys-graft-p (HEMA) nanopolymers was calculated in m
2/g.
For the FTIR analysis of nanopolymers, nanopolymers were dried in the oven during the sample preparation phase. FTIR analysis of nanopolymers was performed using Fourier Transform Infrared Spectroscopy (Perkin Elmer/Spectrum Two, Waltham, MA, USA).
The zeta size analysis of the synthesized p (HEMA) and Cys-graft-p (HEMA) nanopolymers were analyzed with Nano Zetasizer (NanoS, Malvern Instruments, Izmir, Turkey) using a dilute solution of nanopolymers. The zeta potential analysis of the synthesized p (HEMA) and Cys-graft-p (HEMA) nanopolymers was analyzed with Nano Zetasizer (NanoS, Malvern Instruments, Izmir, Turkey) using dilute solution (5×) of nanopolymers. Zeta potential analysis of the synthesized p (HEMA) and Cys-graft-p (HEMA) nanopolymers were also analyzed using the dilute solution (5×) in buffers.
Conductivity analysis of the synthesized p(HEMA) and Cys-graft-p (HEMA) nanopolymers was conducted with Nano Zetasizer (NanoS, Malvern Instruments, Ege University Institute of Nuclear Sciences, Izmir, Turkey) using a dilute solution of nanopolymers.
For the AFM analysis of nanopolymers, the dilute solution of the nanopolymers was dispensed onto the coverslip surface and dried in the oven. AFM analyses of nanopolymers were carried out using Atomic Force Microscopy (BRUKER Dimension Edge with ScanAsyst, Ege University Central Research Test and Analysis Laboratory Application and Research Center, Izmir, Turkey).
For the XPS analysis of nanopolymers, nanopolymers were dried in the oven during the sample preparation phase. XPS analysis of nanopolymers was performed using Angle Resolution X-Ray Photoelectron Spectrometry (Thermo Scientific K-Alpha, Ege University Central Research Test and Analysis Laboratory Application and Research Center, Izmir, Turkey).
2.7. Preparation and Characterization of Nanobiosensor Surface
Using an ellipsometer and a contact angle analyzer, the surface that will serve as the active layer of a nanobiosensor was characterized. The nanopolymers to be utilized as a bioactive layer in the sample preparation phase were dropped on a silicon pad cleansed in oxygen plasma for 5 min to analyze the nanobiosensor surface. After the surface had cured, analysis was done. The ellipsometer gadget was used to conduct the ellipsometer analysis (Gartner, Stamford, CT, USA). The nanopolymers to be utilized as a bioactive layer in the sample preparation phase were dropped on a coverslip and dried in the oven for the analysis of the nanobiosensor surface. Analyses of the contact angle (Attension Theta, Izmir Katip Çelebi University Central Research Laboratories Application and Research Center, Izmir, Turkey) were carried out.
2.8. Nanobiosensor Development Studies
Within the scope of nanobiosensor development, PalmSens potentiostat (Houten, The Netherlands) was used for electrochemical analysis, gold electrode as working electrode, Ag/AgCI (containing internal solution 3M KCI), and platinum wire (Basi Bioanalytical System Inc., West Lafayette, IN, USA) as counter electrode. Differential pulse voltammetry (DPV) and cyclic voltammetry (CV) methods were used as electrochemical methods in the studies conducted to develop electrochemical nanobiosensors. Ferri-ferro solution was prepared and used to obtain information about the fullness of the surface by making use of the reduction and oxidation reaction of iron in the solution for electrochemical determination. Then, 745 mg KCI (0.1 M), 680.5 mg KH
2PO
4, 211.2 mg K
4[Fe(CN)
6], and 165 mg K
3[Fe(CN)
6] 5 mM (1:1) were weighed and dissolved in 100 mL of ultrapure water. Before and after all experiments, the electrode surface was cleaned by rubbing on the surface of the felt with alumina. After cleaning, DPV and CV measurements were taken and compared with the clean electrode signal [
30].
In differential pulse voltammetry, measurements were made in the potential range of −0.4 to 0.6 volts, at a rate of 0.005 volts per second. In the cyclic voltammetry method, the measurement method was performed by taking three cycles to apply 0.005 volts per second in the potential range of −0.4 to 0.8 volts. The measurements were made with three replicates.
For starting optimization studies, preparation of miRNA solutions was performed. For the antimiR-155 probe and miR-155, 100 µM stock solutions was prepared and dilutions were made to prepare solutions of different concentrations (10; 5; 1; 0.5; 0.1 µM). In the preparation of the stock solution, the antimiR-155 and miR-155 sequences were the most stable and were prepared in water with 10 mM Tris HCl and 1 mM EDTA pH = 8 0.1% DEPC due to its protective effect from nuclease inhibition.
2.9. Optimization Studies of Nanobiosensor
For optimization of nanopolymer volume, 2.5; 5; 7.5; 10; 12.5 µL Cys-graft-p (HEMA) nanopolymer was added to the gold electrode surface and ellipsometer analysis thickness results were used for optimization. Bonding time to electrode surface was investigated as 30, 45, 60, 90, and 120 min. At the end of the period, current changes were recorded with DPV measurements. In the optimization studies of antimiR-155 probe time and concentration, the same preparation procedure was performed in all optimization studies. After the cleaning processes detailed in the heading of the sensor work on the gold electrode surfaces, the empty DPV and CV were taken under the determined measurement conditions and the optimum nanopolymer amount (5 µL) was dried on the electrode surface in the optimum time (90 min). At the end of the period, the DPV and CV of the nanopolymer covered electrodes were taken under the determined measurement conditions. For optimization of antimiR-155 probe binding time to Cys-graft p(HEMA) nanopolymer 5 µL, 5 µM antimiR-155 probe solution was dropped on nanopolymer covered electrode surfaces, and measurements were taken at 5, 15, 30, 45, 60, and 90 min. For optimization of antimiR-155 probe concentration to Cys-graft p(HEMA) nanopolymer, measurements were taken at the end of 45 min by dropping 5 µL, 0.1; 0.5; 1; 2.5; 5; 7.5; 10 µM antimiR-155 probe solution on the nanopolymer covered electrode surfaces. Measurements were taken at the end of 30 min by dropping 5 µL, 5 µM miR-155 solution onto the antimiR-155 probe bound nanopolymers on the gold electrode. Graphics were obtained from the current differences obtained as a result of DPV measurements. Within the scope of the experiments, washing steps with ultrapure water was carried out at each stage in order to prevent non-specific interactions.
After the cleaning, Cys-graft p(HEMA) nanopolymer covering and antimiR-155 probe bounding studies, for optimization of miR-155 binding time to antimiR-155 probe bounded Cys-graft p(HEMA) nanopolymer, measurements were taken at the end of 5, 15, 30, 45, and 60 min by dropping 5 µL, 5 µM miR-155 solution on the antimiR-155 probe bound nanopolymers on the gold electrode. For optimization of hybridization temperature of interaction between Cys-graft p(HEMA) nanopolymer with antimiR-155 probe and miR-155, the antimiR-155 probe-bound nanopolymers on the gold electrode were dropped in 5µL, 5 µM miR-155 solution at different temperatures (4, 25, and 45 °C) and DPV measurements were taken at 30 min. For investigating of effect of EDC/NHS activation to interaction between antimiR-155 probe-bound Cys-graft-p (HEMA) nanopolymer and miR-155, nanopolymer bound electrode surfaces were treated with 0.2 M EDC/0.05 M NHS activation solution for 30 min. Then, 5 µL, 5 µM antimiR-155 probe array solution was dropped on nanopolymer-bonded electrode surfaces, and measurements were taken at the end of 45 min. On the gold electrode, 5 µL, 5 µM miR-155 solution was dropped on the antimiR-155 probe-bound nanopolymers and measurements were taken at the end of 30 min.
2.10. Nanobiosensor Characteristics/Method Validation
In order to determine the characteristics of the developed nanobiosensor, calibration curve, specificity, selectivity, reproducibility, and storage stability studies were carried out. Using the prepared miR-155 calibration graph, parameters such as linearity, detection limit, determination limit, accuracy, and precision were calculated.
For obtaining miR-155 calibration curve, 5 µL, 0.1; 0.25; 0.5; 1; 2.5; 5; 7.5; 10; 25; 50; 75; 100 µM miR-155 solution (in water with 10 mM Tris HCl and 1 mM EDTA pH = 8 0.1% DEPC) was dropped on antimiR-155 probe bound nanopolymers on gold electrode and measurements were taken after 30 min. Graphics were obtained from the current differences obtained as a result of DPV measurements.
In order to calculate the reproducibility characteristic, the cleaning processes detailed in the heading of the sensor work on the gold electrode surfaces were applied and nanobiosensors were prepared and measurements were taken with optimum conditions which were determined with previous studies. These studies were repeated seven times.
The specificity was made to evaluate the success of the modification made to ensure the specificity of the Cys-graft-p (HEMA) nanopolymers to be used in the active layer of the developed nanobiosensor to antimiR-155. Within the scope of measurement of specificity characteristic, miR-155 diagnostic properties of (HEMA) and Cys-graft-p (HEMA) nanopolymers were evaluated. Additionally, the specificity parameter was investigated in absence and presence of miR-155.
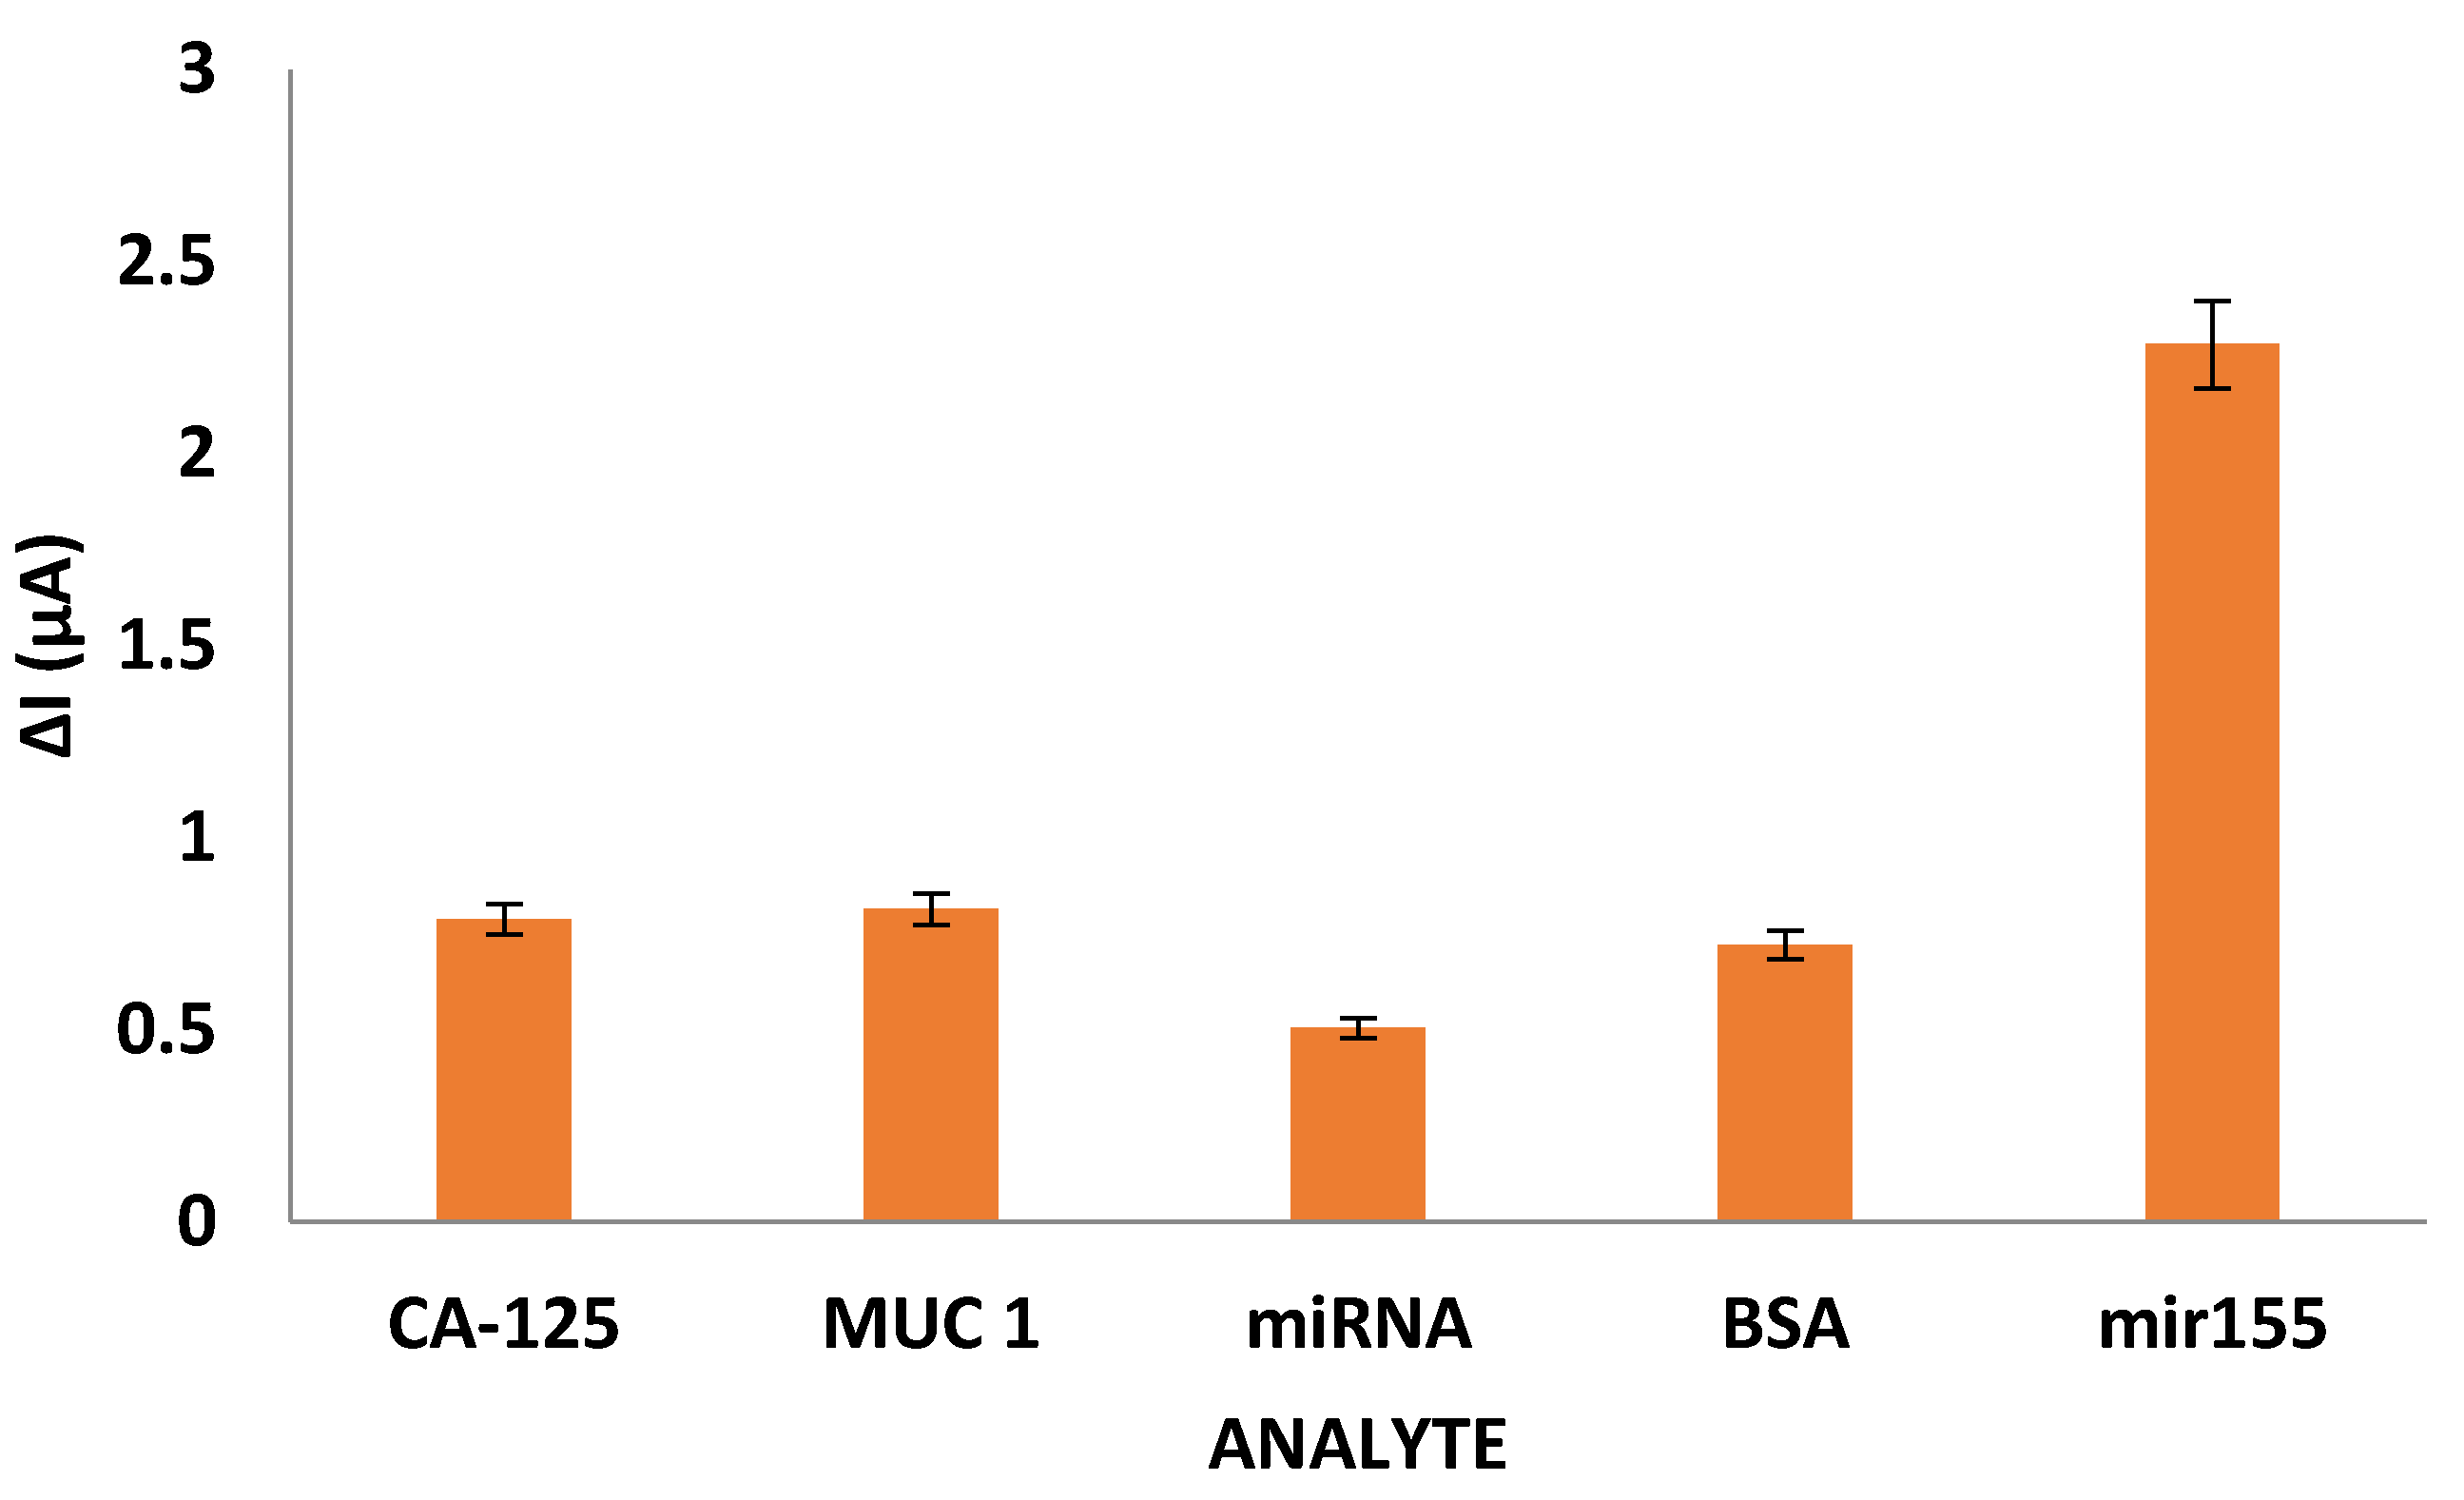
Within the scope of measuring the selectivity characteristic, the diagnostic capacities of Cys-graft-p (HEMA) nanopolymer as well as 5U CA-125, 5U MUC 1, 5 mg/mL BSA (Bovine Serum Albumin) and 5 µM miRNA were compared with 5 µM miR-155.
The storage stability characteristic was evaluated to measure the stability of the miR-155 recognition activity of the developed nanobiosensor product over time. Within the scope of the warehouse stability measurement, the miR-155 diagnostic capacity of the anti-miR-155 probe-bound Cys-graft-p (HEMA) nanopolymer was examined by taking a post-stand by measurement. The electrodes prepared probe bound were kept at +4 °C for 5, 10, 20, 30, and 60 days, and at the end of the period, measurements were taken at the end of 30 min by adding 5 µL, 5 µM miR-155 on the nanopolymers attached to the antimiR-155 probe.
Linearity is defined as the direct proportion of the test results obtained by analyzing the target analyte in a certain concentration range. R2 value of the miR-155 calibration graph was taken as the basis for measuring the linearity characteristic.
Precision is one of the most important characteristics for the validation of an improved analysis method. The working range of a developed method is the result range with acceptable uncertainty [
31]. The calibration curve of the target analyte is used to calculate the sensitivity. The linear calibration curve equation is expressed in a model such as y = a + bx, where b is defined as precision. Within the scope of measuring the sensitivity characteristic, b value in miR-155 calibration graph equation was taken as basis.
The accuracy of a method is the ability to repeat any value or the closeness of the analysis results received (In this context, using the following formulas, recovery, relative standard deviation (%RSD), and confidence limit were calculated and Grubbs test was applied.
where
C = known concentration of analyte,
Cref = average of analyte concentrations found as a result of reproducibility testing [
32].
% Relative Standard Deviation (%RSD) value was calculated with the formula below.
Confidence limit (CL) calculation is another way of determining the accuracy of an analysis [
33]. The following formula is used for confidence limit calculation.
To determine the accuracy of the method, Grubbs test was calculated using GraphPad with the formula below
Using the Grubb table, the critical Z value determined for the number of samples is compared with the calculated Z value with the formula. If the calculated Z value is less than the critical Z value, it is stated that the precision of the analysis is high.
The calibration curve of the target analyte is used to calculate the Limit of Detection (LOD) and the Limit of Quantification (LOQ). By calculating the linear calibration curve equation in a model such as y =
a +
b x, these calculations are carried out as follows.
In these equations,
Sa is the standard deviation of the response received and
b is the slope of the calibration curve [
34].
Reproducibility test results are used to calculate this characteristic. Reality parameter is determined by systematic error calculation (
t).
where
Xcalculated, average of analyte concentrations obtained as a result of reproducibility testing,
XCRM = known concentration of analyte,
n = number of repetitions,
S = standard deviation
The reality is calculated by examining whether there is a significant difference between the systematic error value calculated with the formula above and the actual value calculated by doing t tests [
35].
2.11. Commercial Blood Serum Sample Experiment
The cleaning processes detailed in the heading of the sensor work on the gold electrode surfaces were applied and nanobiosensors were prepared and measurements were taken with optimum conditions which are determined with previous studies. Then, 5 µL miR-155 in different concentrations (0.5, 1, 5, 10, 50, and 100 µM) were prepared in the blood serum (HUMAN SERUM, P2918, SIGMA ALDRICH, ABD, Saint Louis, MO, USA) used as the commercial blood serum example of antimiR-155 probe-bound nanopolymers on the gold electrode. Sequence solution was dropped and measurements were taken after 30 min of waiting.
2.12. Comparison with Reference Method Qbit miRNA Assay Kit
As a reference method, performance and correlation comparisons were made with the Qbit miRNA Assay Kit (Thermo Fisher Scientific, ABD, Waltham, MA, USA). All procedures were performed according to Qbit miRNA Assay Kit assay. Fluorescence Spectrophotometer (260 nm) was used for comparison with the reference method. Calibration graph was prepared with standard solutions prepared at 0–10 ng/µL concentration. miR-155 in different concentrations (0.1; 0.5; 1; 5; 10; 50; and 100 µM) were prepared in the blood serum (Human Serum, P2918, SIGMA ALDRICH, ABD, Saint Louis, MO, USA) and used for comparison test. The results obtained within the scope of the comparison study with the reference method were checked for accuracy by performing t-test. For this purpose, a comparison was made with the t test calculated using the formula below [
35].
s: standard deviation value n: number of samples
3. Results
3.1. Characterization of p(HEMA) and Cys-graft p(HEMA) Nanopolymers
In the scope of the study, physical and chemical properties, modification and modification techniques of p(HEMA) and Cys-graft-p (HEMA) nanopolymers, which are synthesized to use as a sensor bioactive layer for the diagnosis of breast cancer biomarker miR-155, are characterized by advanced characterization techniques. The scope of these techniques includes Scanning Electron Microscopy (SEM), Energy Distribution Spectrometry (EDS), Zeta Size and Potential Analysis, Conductivity Analysis, Atomic Force Microscopy (AFM), Fourier Transform Infrared Spectroscopy (FTIR), X-Ray Photoelectron Spectrometry (XPS), Dry Mass Graph, and Specific Surface Area Calculation.
3.2. Dry Mass Graph
The mass-volume graph was drawn as a result of the values obtained and the amount of mg polymer per unit volume (mL) was calculated. Using the volume-mass graph obtained, it was calculated that the amount of mg polymer per unit volume (mL) is 0.00685 g polymer/mL for p(HEMA); 0.00575 g polymer/mL for Cys-graft-p (HEMA) (
Supplementary Figure S1).
3.3. Scanning Electron Microscope (SEM) Analysis
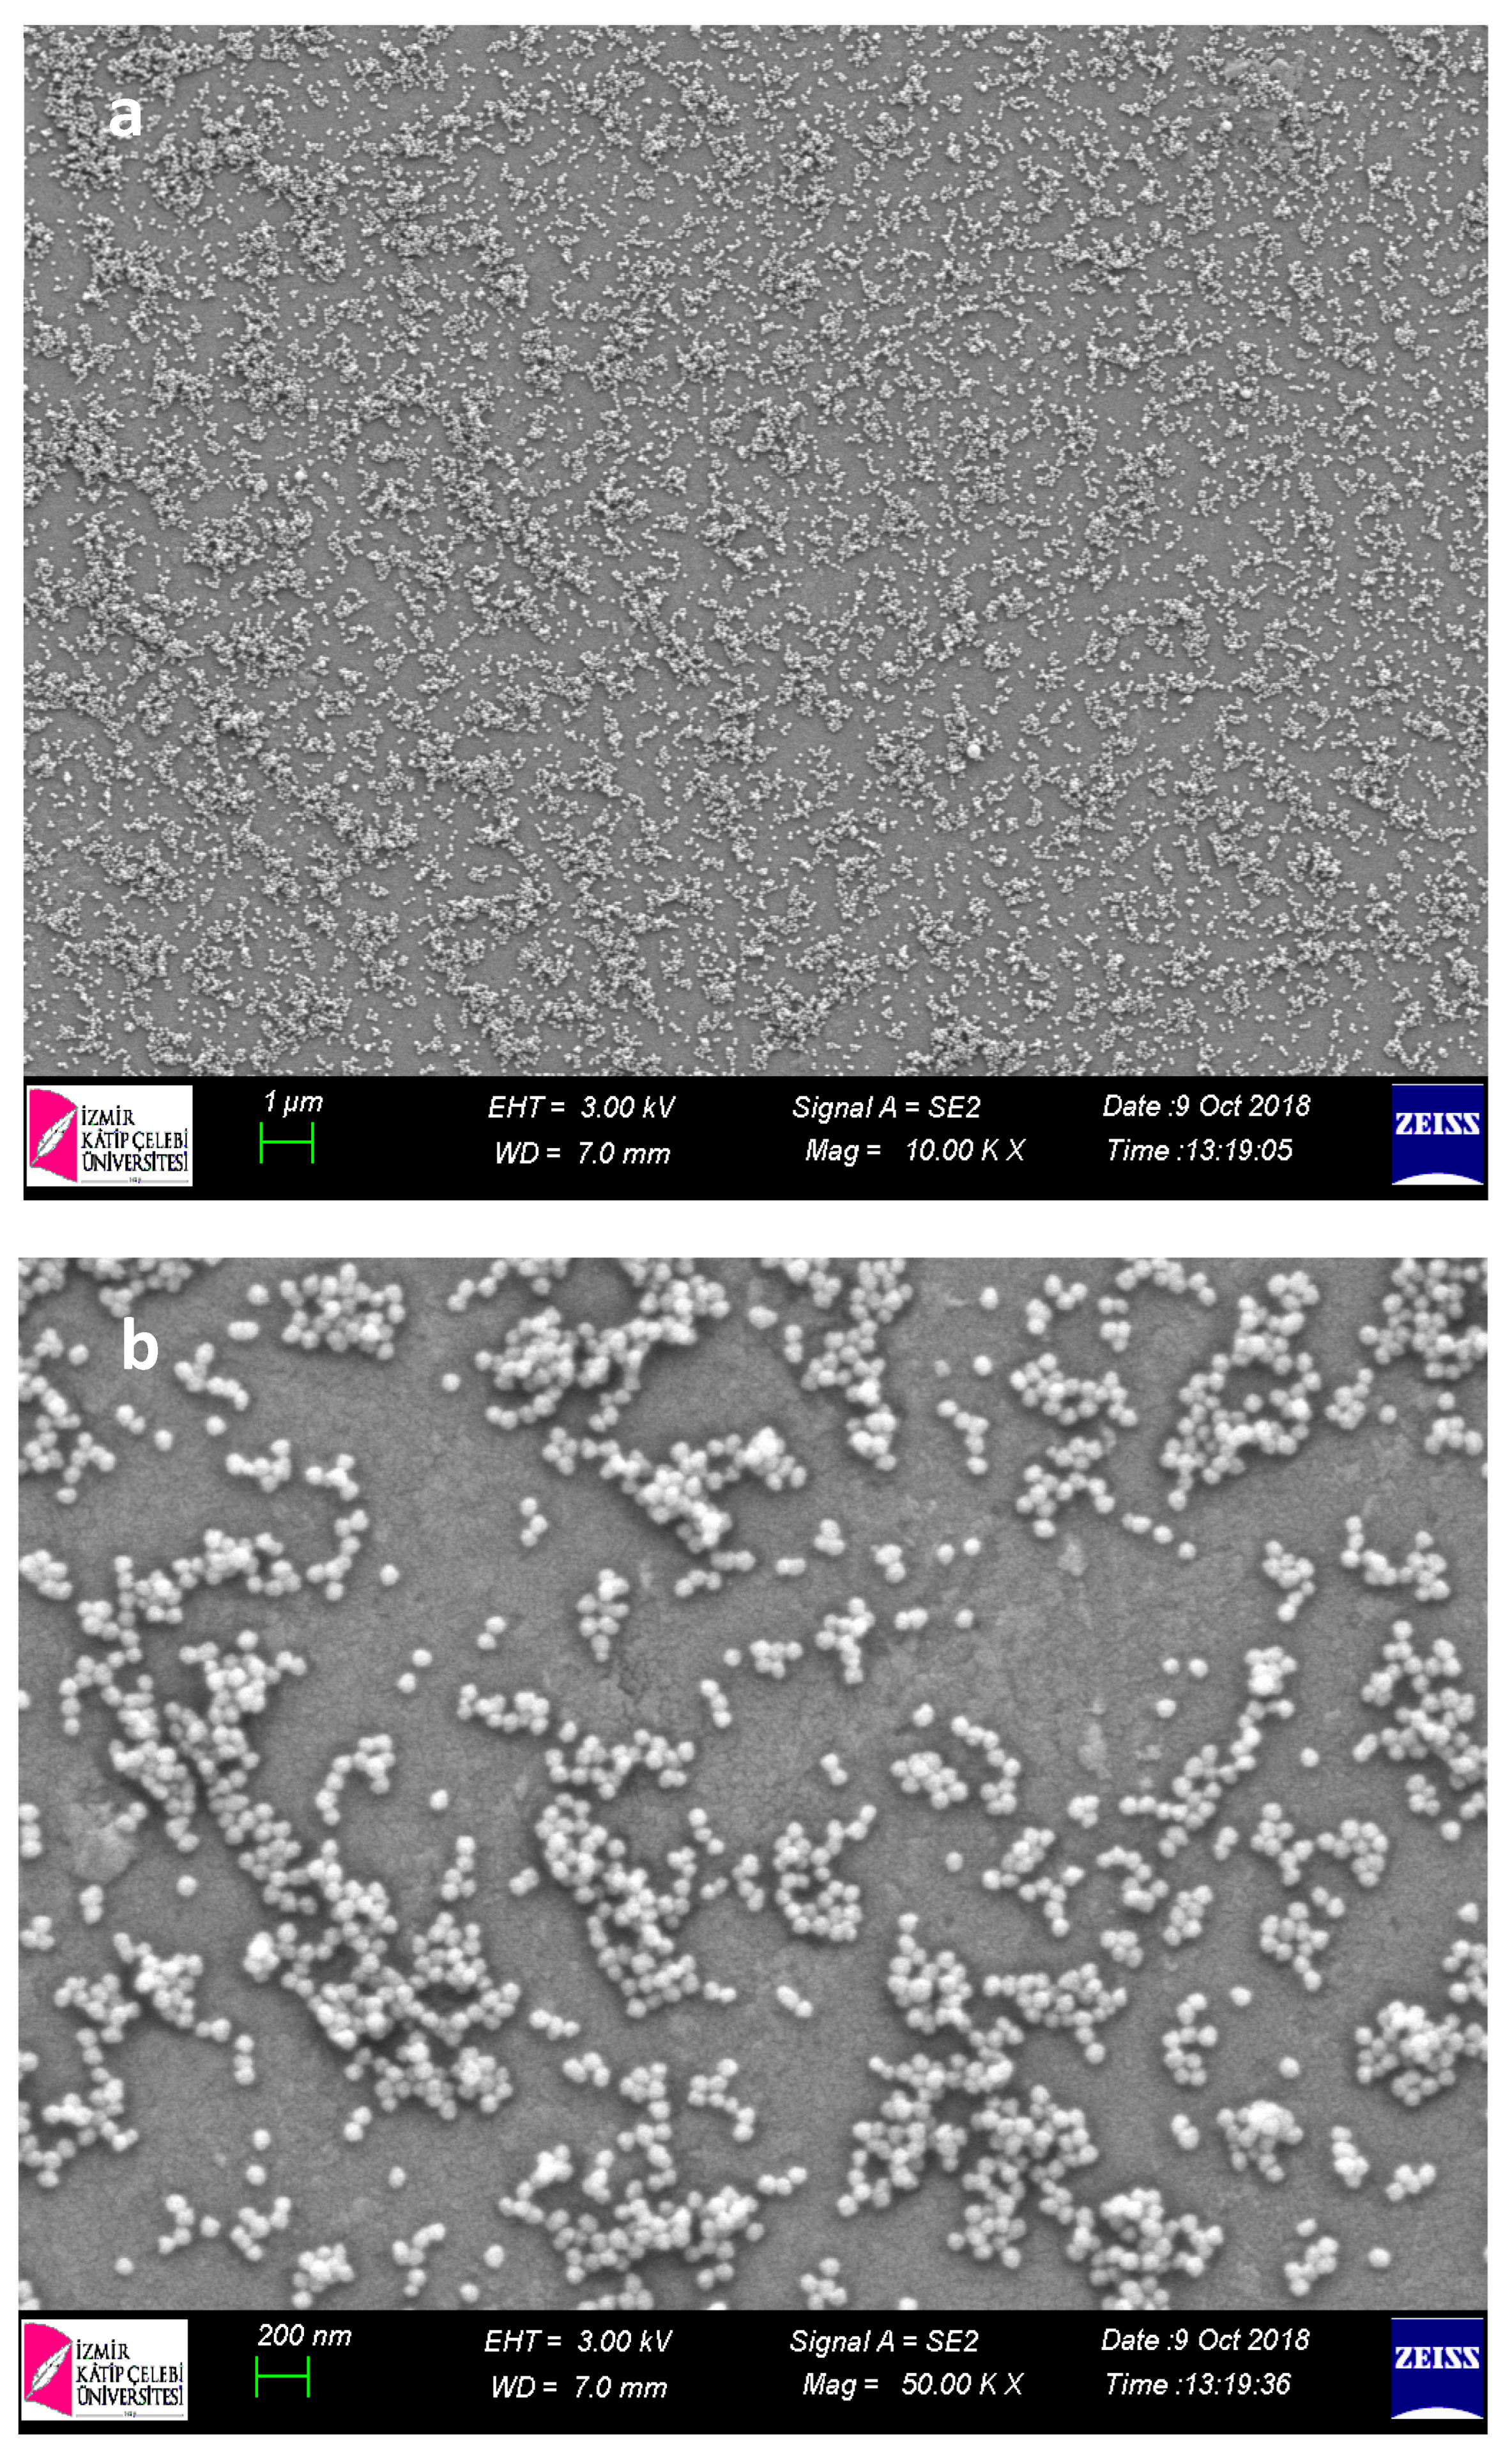
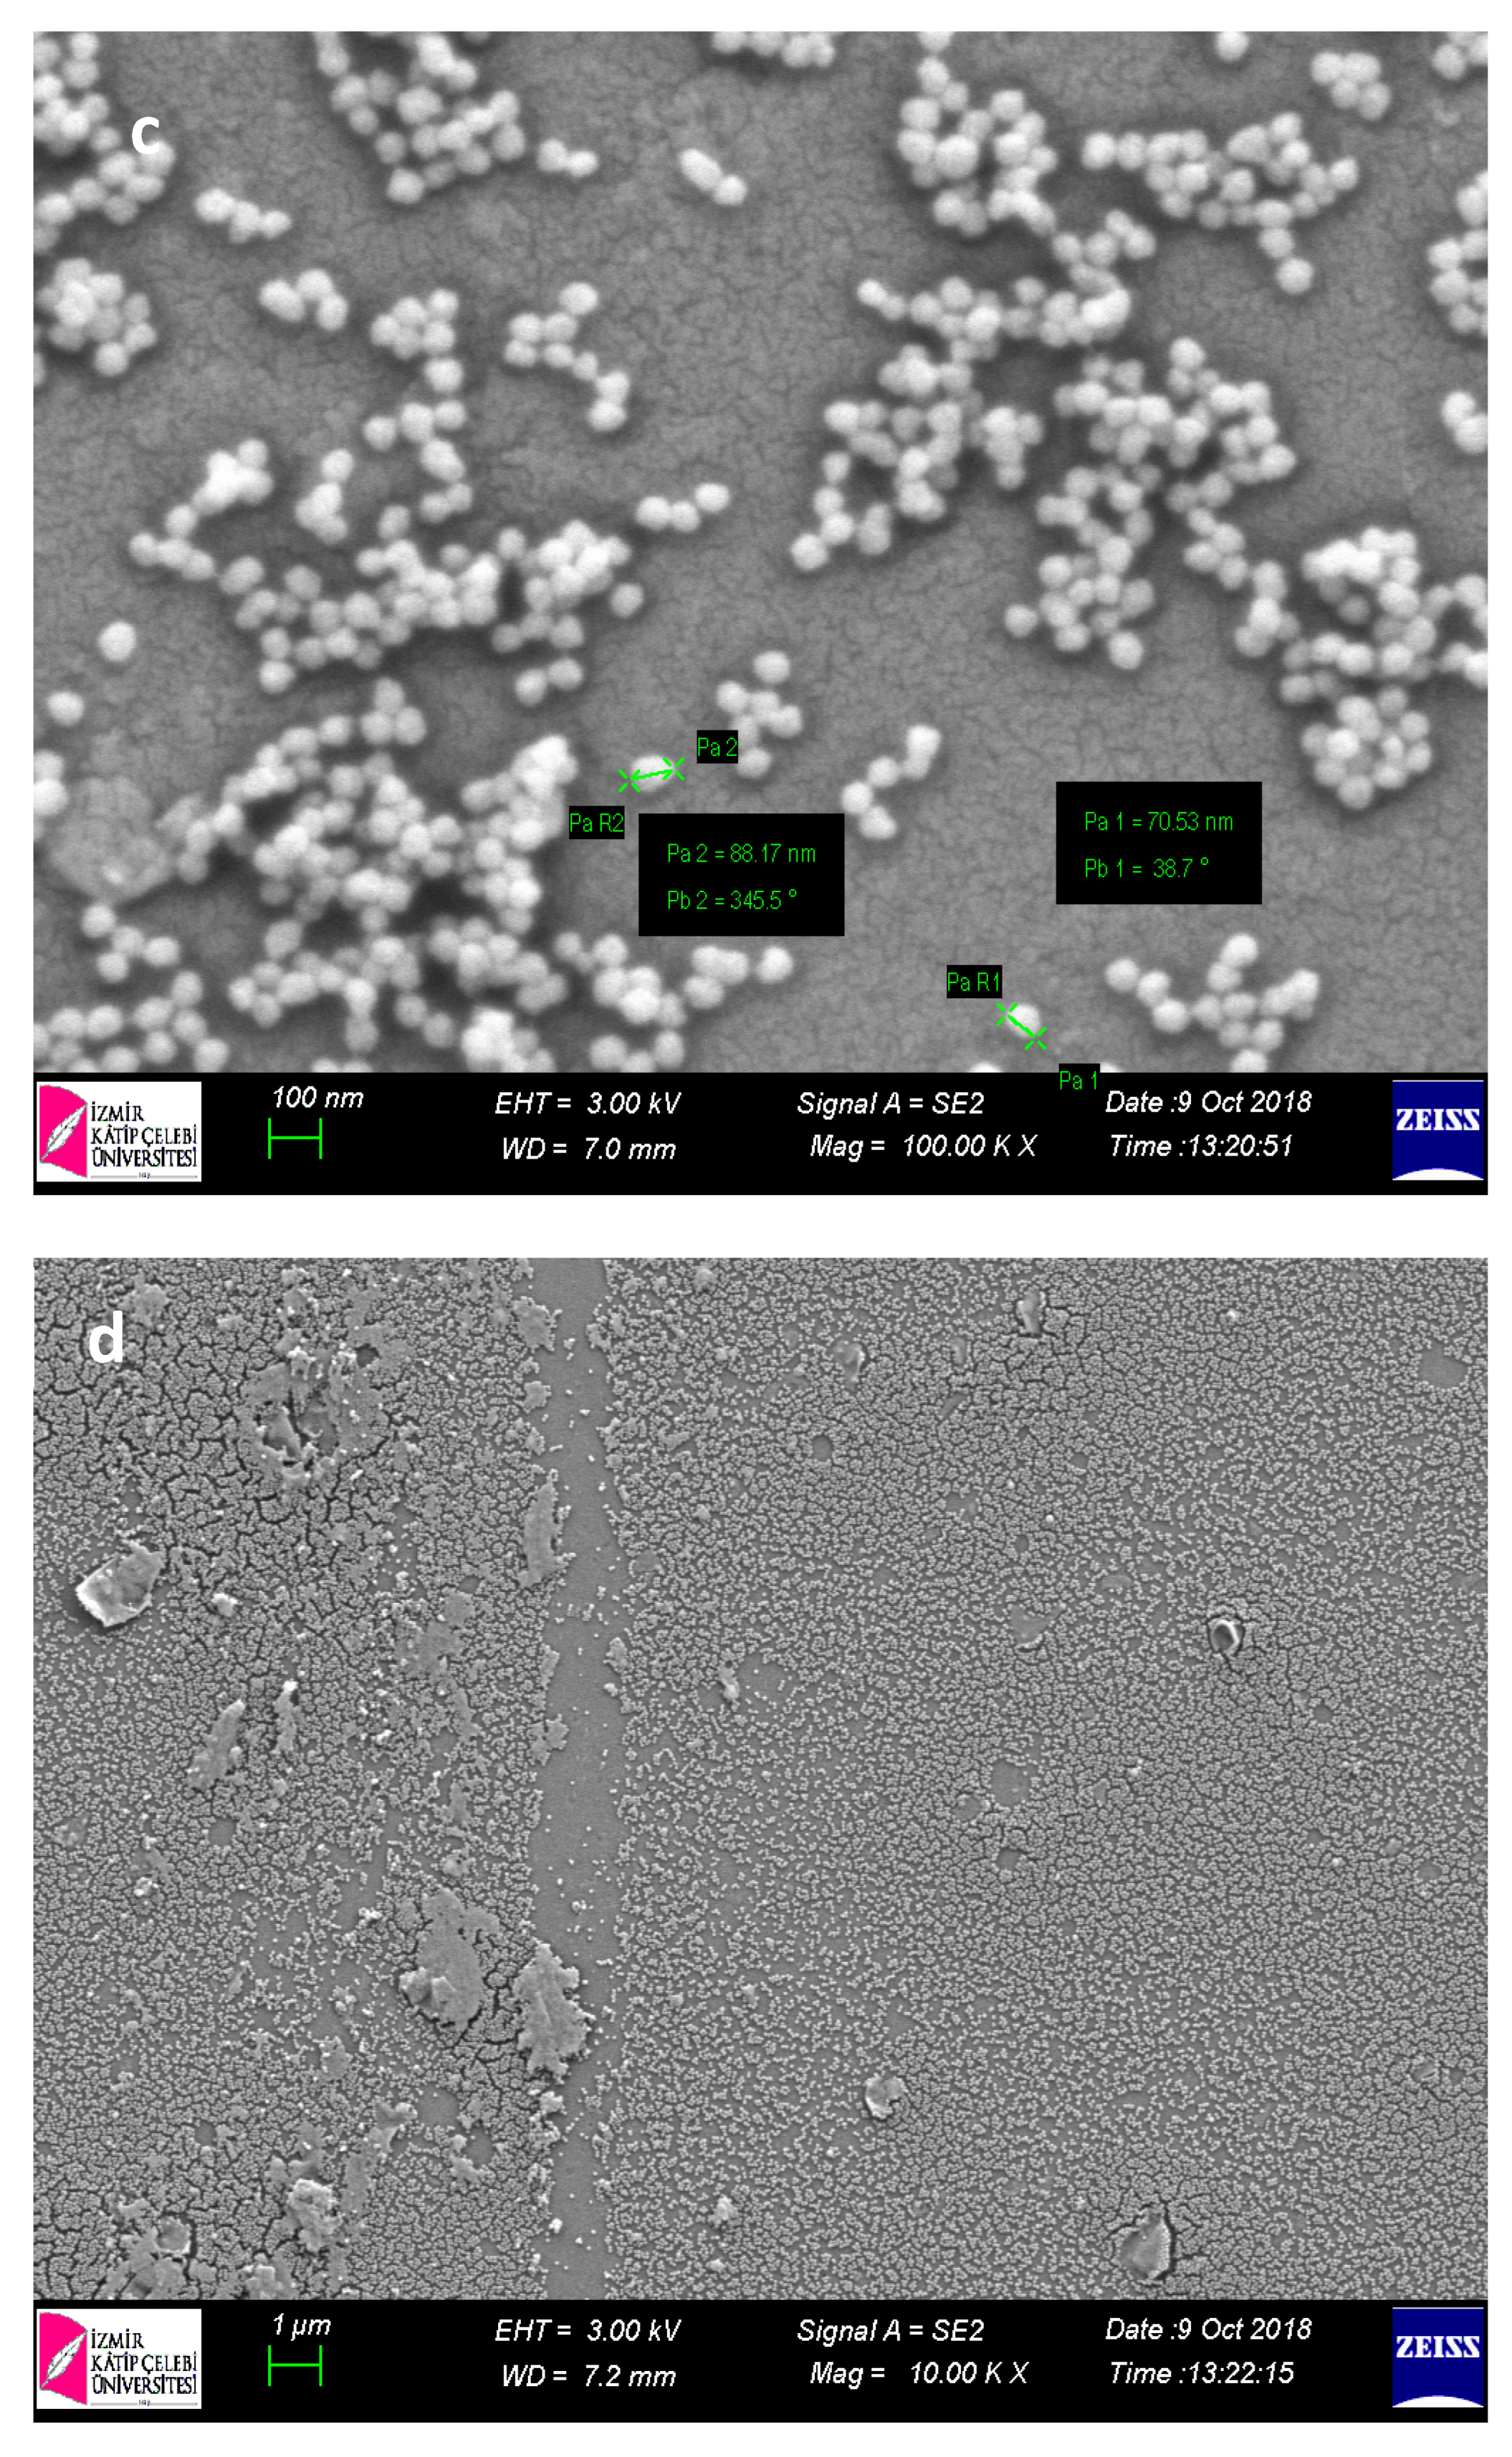
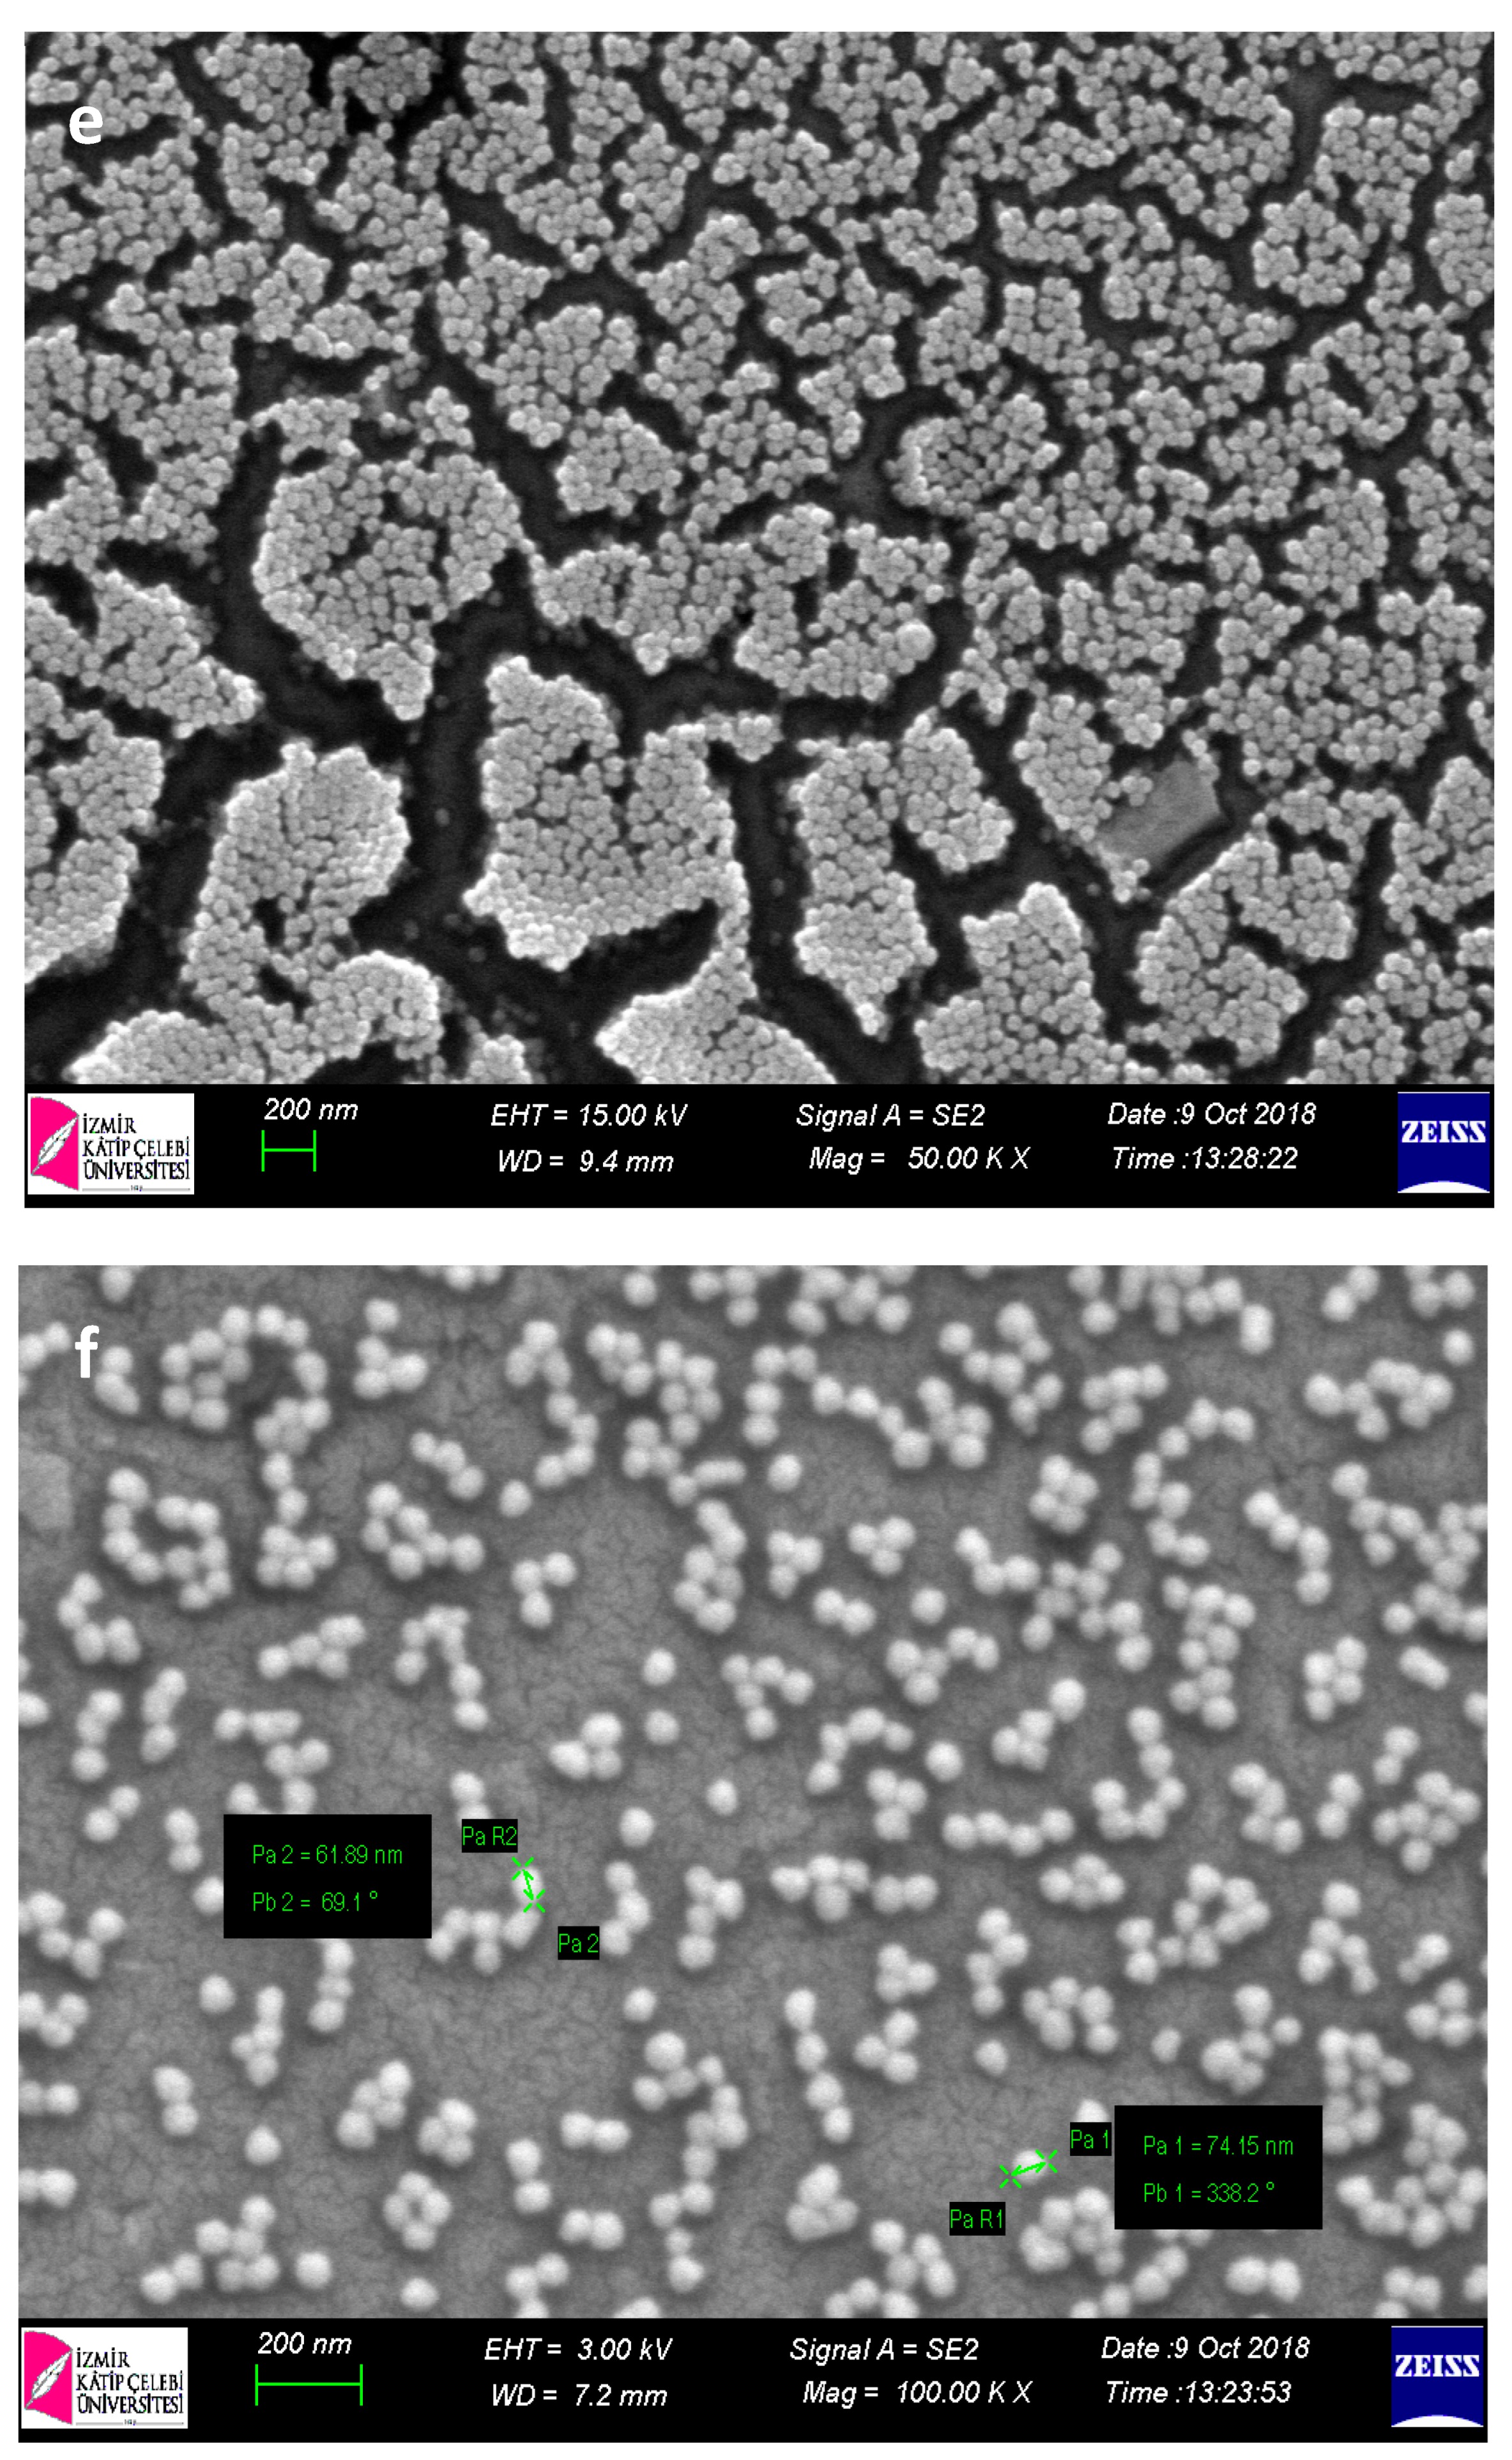
Within the scope of characterization studies of nanopolymers, SEM analysis was performed in order to determine the size and morphological structures (
Figure 2).
When SEM images of nanopolymers were examined, their sizes were 70–90 nm for p(HEMA); it was determined that for Cys-graft-p (HEMA) it ranged from 60–70 nm and showed a homogeneous size distribution with very close sizes. It was also seen that nanopolymers were obtained in spherical morphology.
3.4. Energy Distribution Spectrometry (EDS) Analysis
EDS was applied as elemental analysis to determine the chemical content of nanopolymers and to prove the cysteine graft procedure. When EDS analysis results of Cys-graft-p (HEMA) nanopolymers were examined, the % S content was determined as 1.67 and it was proved that the presence of sulfur in the structure and the graft process was successful and the cysteine amino acid was added to the structure. Graft yield was calculated as 78% (
Supplementary Figure S2).
3.5. Specific Surface Area Calculation
p(HEMA) nanopolymers: According to SEM analysis, the average nanopolymer size was 79.35 nm, and from the dry mass graph, the amount of mg polymer per unit volume (mL) was taken as 0.00685 g polymer/mL for p(HEMA). Using these data and the calculations above, the p(HEMA) nanopolymers surface area was calculated as a specific surface area of 1141.53 m2/g.
According to SEM analysis Cys-graft-p(HEMA) nanopolymers, the average size of the nanopolymer was 68.02 nm, and the amount of mg polymer per unit volume (mL) was taken as 0.00575 g polymer/mL for Cys-graft-p(HEMA). Using these data and the calculations above, the p(HEMA) nanopolymers surface area was calculated as a specific surface area of 1586.43 m2/g.
3.6. Fourier Transform Infrared Spectroscopy (FTIR) Analysis
FTIR analysis was performed to examine the chemical bond structure of the nanopolymers and to prove the polymerization and graft procedure. When the FTIR spectrum is examined, p(HEMA) nanopolymer -OH bonds at 3500 cm
−1, CH alkyl bonds at 3000 cm
−1, C=O bonds at 1718 cm
−1, and peaks of 1500 cm
−1 C=C bonds are seen. In the Cys-graft p(HEMA) spectrum at 1516 cm
−1 and 1566 cm
−1, it is interpreted that the newly formed shoulders belong to the C=N and H-N bonds, which belong to the L-Cysteine amino acid, which is added to the structure by grafting. The vibration bands belonging to the S-H group at 970 cm
−1 and 1130 cm
−1, which is thought to belong to the L-Cysteine amino acid, were interpreted to indicate that the cysteine amino acid may have been incorporated into the structure [
36] (
Supplementary Figures S3 and S4).
3.7. Zeta Size Analysis
Zeta size analysis was applied to determine the size of nanopolymers.
As a result of zeta size analysis of nanopolymers, average polymer sizes are 125.86 nm for p(HEMA) and 119.83 nm for Cys-graft-p(HEMA); polydispertise (PDI) values were determined as 0.303 nm for p(HEMA) and 0.312 nm for Cys-graft-p(HEMA) (
Table 1 and
Supplementary Figure S5).
The Zeta Sizer device has a working principle based on the Brownian motion of the particles in the liquid. In order to determine the particle size, the ability of the particles to move the liquid is used. Small particles move faster, while large particles move more slowly. Based on this principle, dynamic light is sent to the sample environment by the device and information about its size is obtained by looking at the size of the motion of the particles. Accordingly, it was evaluated that the size was larger than the dimensions obtained from SEM images, due to the particles exhibiting Brownian motion in the liquid medium and some swelling behavior in the liquid medium.
3.8. Zeta Potential Analysis
Zeta potential analysis was applied to determine the potential/charges of nanopolymers.
As a result of zeta potential measurement of nanopolymers, it is seen that it gives a potential of −30.06 mV for p(HEMA) and −50.3 mV for Cys-graft-p (HEMA). The addition of cysteine amino acid to the structure with the graft procedure caused a change in surface charge (
Table 2 and
Supplementary Figure S6).
3.9. Atomic Force Microscope (AFM) Analysis
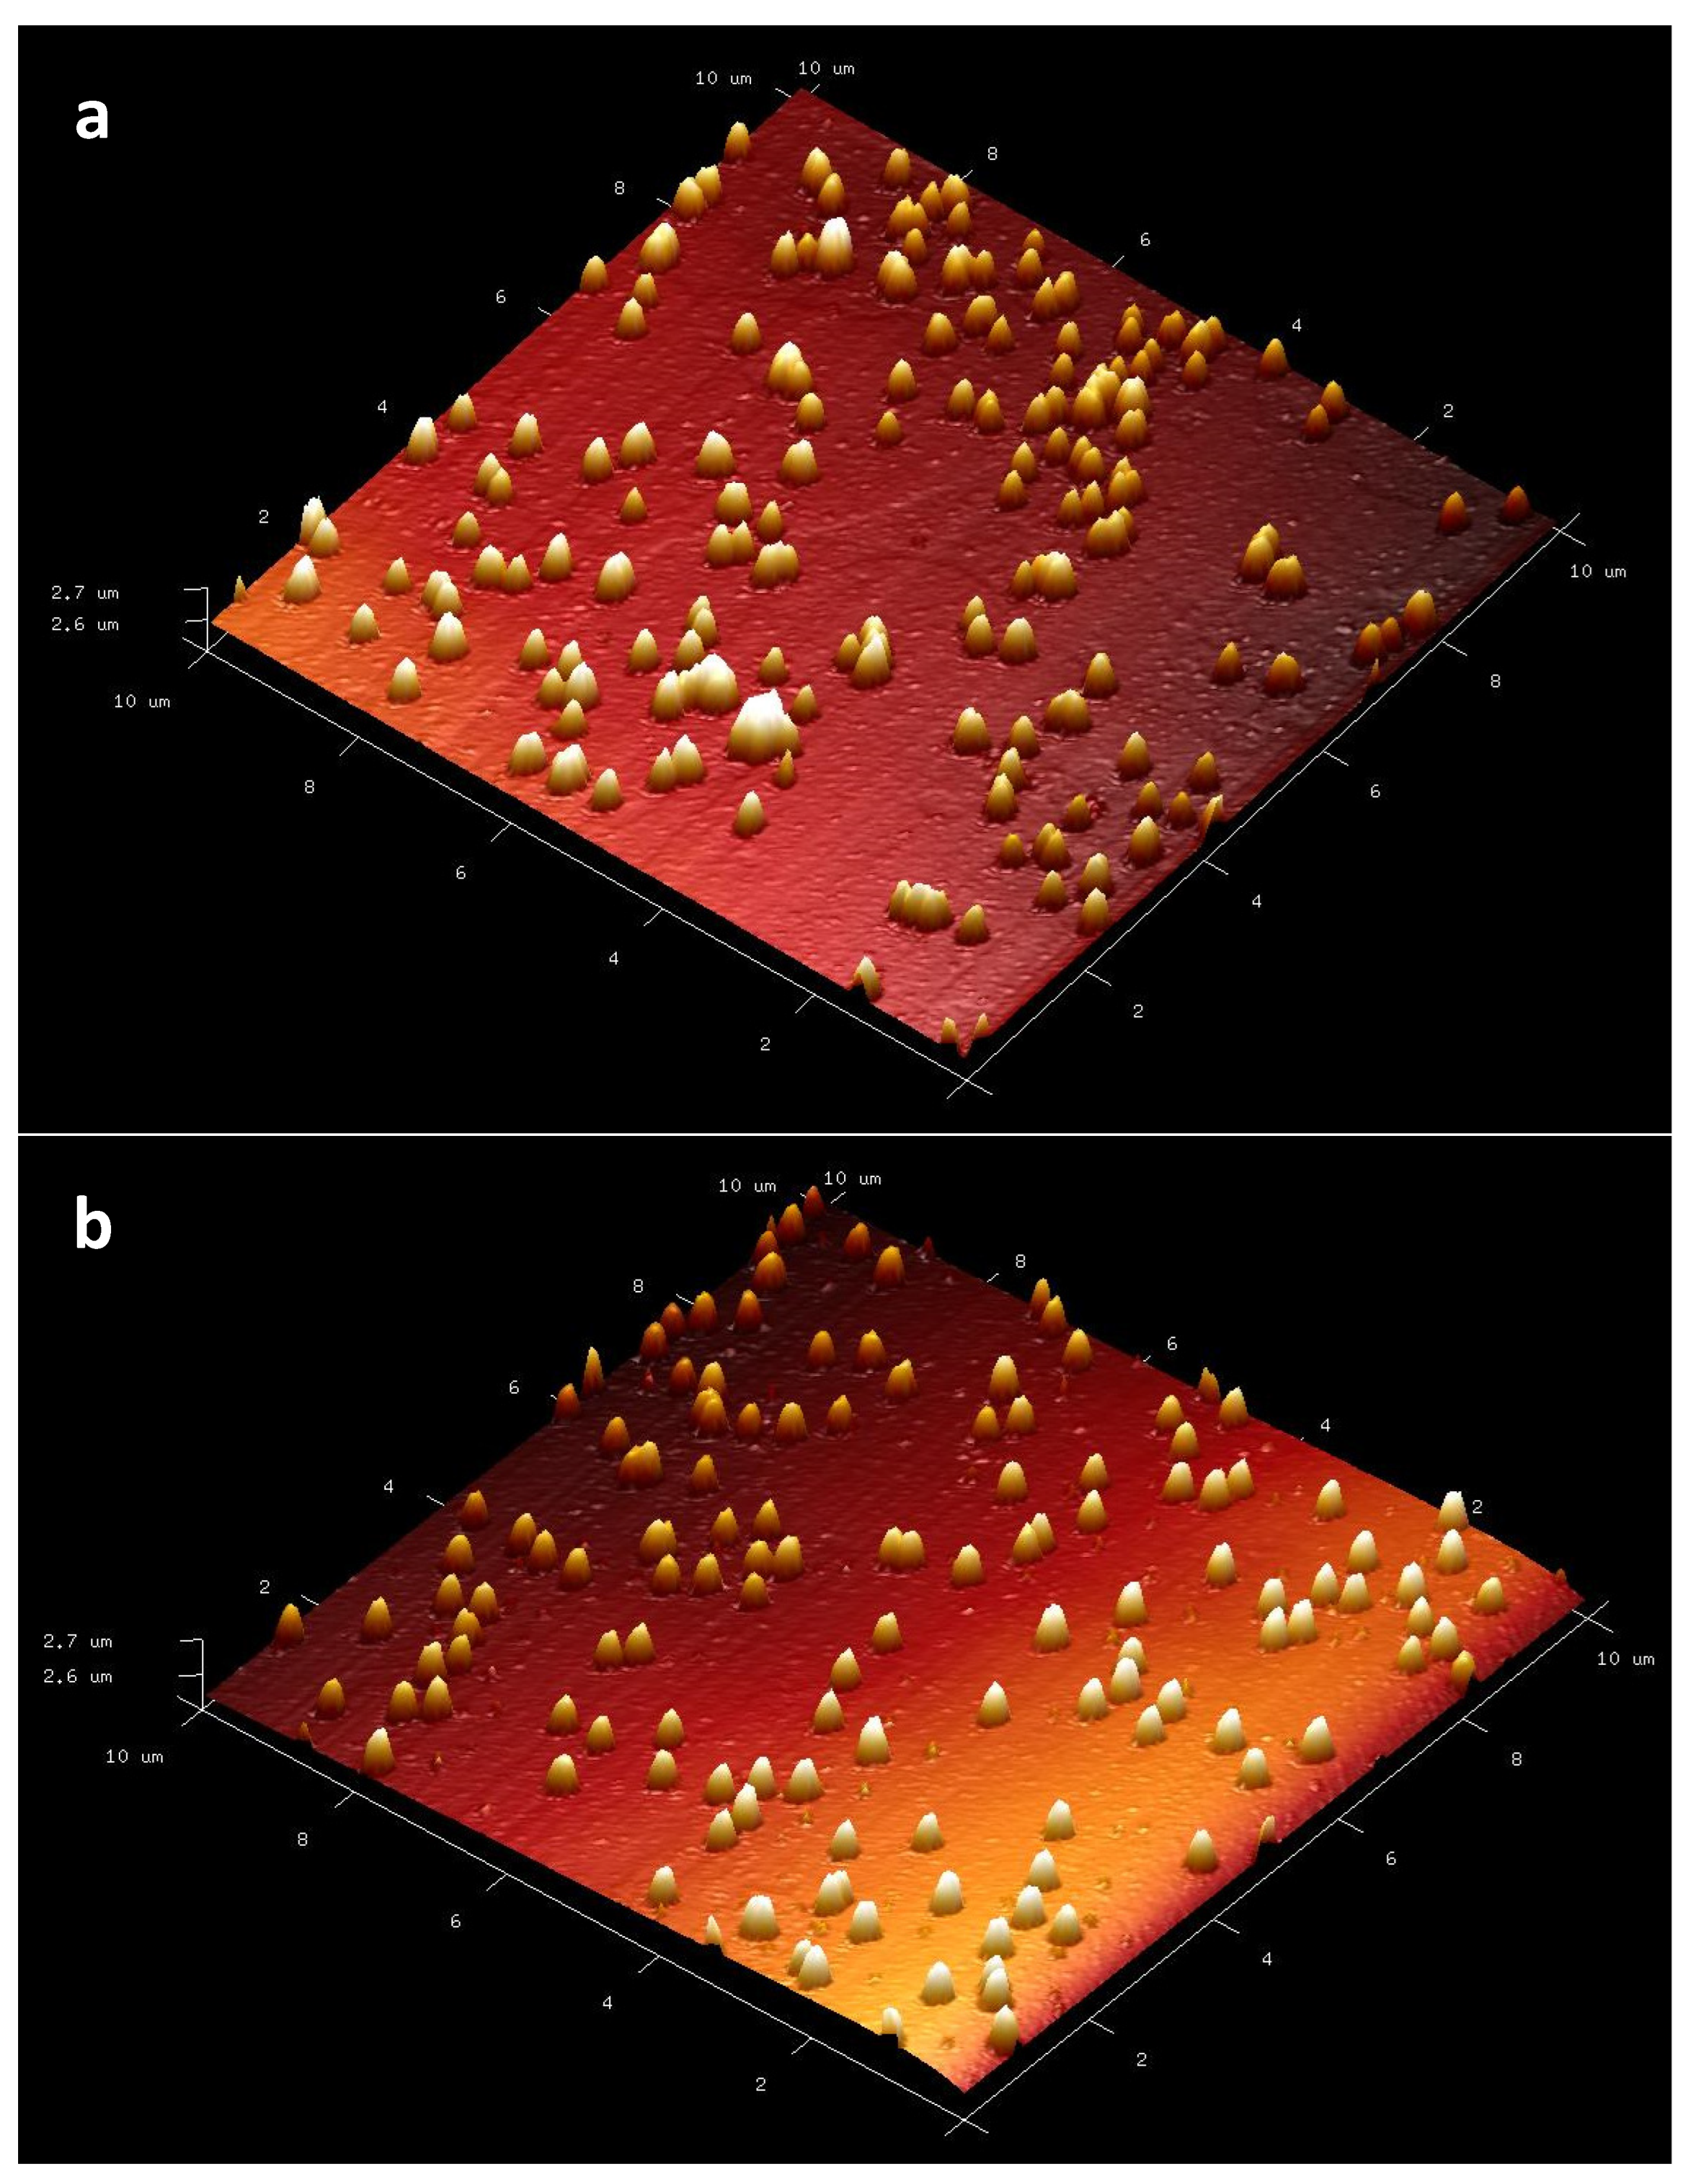
AFM analysis was applied to determine the surface topography of nanopolymers.
Information about the surface topography of the buildings is obtained with the AFM technique (
Figure 3). When the AFM results of p(HEMA) and Cys-graft-p (HEMA) nanopolymers were examined, data on p(HEMA) nanopolymer were as follows: the average roughness (Ra) was 7.14 nm and the square root of the average roughness squares (Rq) was determined as 14.7 nm. Ra value of Cys-graft-p (HEMA) nanopolymer was determined as 6.03 nm and Rq value as 12.5 nm. Ra value is obtained in the sampling size by taking the average of the absolute values of the elevation and pit dimensions in the plus and minus directions from the average line. As the Ra value increases, the surface roughness increases. In this case, grafting cysteine amino acid to p(HEMA) nanopolymer reduced the surface roughness. Rq value is more sensitive to high hills and valleys depending on the square of the amplitude in calculating according to Ra value [
37]. The decrease in Rq value after grafting also supports the change in morphological structure with the grafting procedure.
3.10. X-ray Photoelectron Spectrometer (XPS)
XPS analysis was performed to determine the chemical content of nanopolymers and to prove the graft procedure. Electron spectroscopy is based on measuring the kinetic energy of the scattered electron during X-ray bombardment of atoms or molecules. These scattered electrons are stimulated ions, as they come out of the inner shells of atoms. X-ray photoelectron spectroscopy (XPS), which is electron spectroscopy performed with X-rays, is a technique used to determine the chemical content of structures. When XPS analysis results of Cys-graft-p (HEMA) nanopolymers were examined, %N content was determined as 0.08. The total amount of nitrogen in the structure was also calculated as 0.057 mmol/g. With the presence of nitrogen in the structure, it was proved that the graft process was successful and the cysteine amino acid was added to the structure.
3.11. Characterization of the Surface to Be Used as Nanobiosensor Active Layer
In order to characterize the surface that will be used as nanobiosensor active layer, ellipsometer analysis and contact angle analysis were performed.
3.12. Ellipsometer Analysis
For the analysis of the nanobiosensor surface, ellipsometer analysis was performed with nanopolymers to be used as a bioactive layer. Ellipsometry is a precise optical method used to determine the surface properties of thin films. It is based on the measurement of the reflection effect on the polarization status of light. When the analysis results are examined, “Fixed” measurements are the thickness measurements taken by keeping the nf (refractive index as 1.45) fixed. In “Fitted” measurements, both thickness and nf value are modeled with the modeling algorithm in the program’s own feature, and thickness and nf values are obtained. The thickness values of p(HEMA) and Cys-graft-p(HEMA) nanobiosensor surfaces increased with cysteine grafting. In contrast, the Cys-graft-p(HEMA) surface refractive index is lower than the p(HEMA) surface. Psi and Delta are representations of the ellipsometer’s raw measurement that shows how the interaction between the measuring beam and the sample surface alters the polarization. While PSI values are 12.4° ± 0.02 for p(HEMA), it is 20.00° ± 0.004 for Cys-graft-p (HEMA). Delta values were 136.7° ± 0.1 for p(HEMA) and 103.5° ± 0.2 for Cys-graft-p (HEMA). While the PSI value increased after grafting, Delta values decreased. The PSI value is the amplitude ratio of the electric field components in the reflected planes, and the Delta is their phase difference. The decrease in PSI value supports the increase of reflection from the surface by grafting, meaning a smoother surface was formed. This situation is supported by the decrease in refractive index and Ra and Rq values in AFM analysis. Roughness increases and conductivity decreases as agglomeration increases on surfaces consisting of nanostructures. As the surface roughness decreases, conductivity will increase. This shows that the conductivity of Cys-graft-p (HEMA) nanopolymers will be higher, which supports conductivity analysis.
3.13. Contact Angle Analysis
To analyze the hydrophilic/hydrophobic character of the nanobiosensor surface, contact angle analysis with nanopolymers to be used as bioactive layer was applied.
When the contact angle results were examined, the contact angle for p (HEMA) was determined as 39.53°. The contact angle for Cys-graft p (HEMA) was 26.15° (
Table 3). Structures whose contact angle values are generally ˃90° are considered hydrophobic. Considering these values, it can be seen that the synthesized nanopolymers have hydrophilic structure. It can be interpreted that grafting application increases the wetting ability of the surface. In other words, cysteine grafting made p(HEMA) nanopolymers more hydrophilic. It is meaningful that the structure becomes more hydrophilic by cysteine grafting in relation to the SH group in the cysteine amino acid having weak polar properties. Hydrophilic molecules dissolve in water by forming a hydrogen bond with water thanks to their polar groups. It can be said that the surface properties of the p (HEMA) nanopolymer change with the grafting procedure.
3.14. Nanobiosensor Optimization Studies
Volume and Bonding Time Optimization of Nanopolymer on Electrode Surface
Cys-graft-p (HEMA) nanopolymers were kept for 30, 45, 60, 90, and 120 min in order to determine the optimum binding time of nanopolymers to the gold electrode surface. At the end of the period, current changes were recorded with DPV measurements. Optimum time for the binding of the Cys-graft-p (HEMA) nanopolymer to the gold electrode surface was determined as 90 min (
Supplementary Figure S7).
When the data obtained as a result of the ellipsometer analysis were examined, the optimum volume was determined as 5 µL for the Cys-graft-p (HEMA) nanopolymer to bond to the gold electrode surface, considering the low standard deviation and full coating of the surface. Using the dry mass graph (0.00575 g polymer/mL) of the Cys-graft-p (HEMA) nanopolymer, it was seen that 0.029 mg of nanopolymer corresponding to a volume of 5 µL has a thickness of 584.11 Å (20.14 Å / g) (
Table 4 and
Supplementary Figure S8).
3.15. Optimization of antimiR-155 Probe Time and Concentration to Cys-Graft p(HEMA) Nanopolymer
Optimization of antimiR-155 Probe Binding Time to Cys-graft p (HEMA) Nanopolymer
DPV measurements were taken at 5, 15, 30, 45, 60, and 90 min by dropping the antimiR-155 probe to optimize the antimiR-155 probe binding time to the nanopolymer-bound gold electrode surface.
As a result of the graphic obtained from the current differences obtained as a result of DPV measurements, the optimum antimR-155 probe binding time was determined as 45 min (
Supplementary Figure S9).
3.16. Optimization of antimiR-155 Probe Concentration to Cys-Graft p (HEMA) Nanopolymer
DPV measurements were taken by adding 0.1; 0.5; 1; 2.5; 5; 7.5; 10 µM antimiR-155 probe to the nanopolymer bound gold electrode surface for optimization of antimiR-155 probe binding time.
The optimum antimiR-155 probe concentration was determined as 5 µM as a result of the graphic obtained from the current differences obtained as a result of DPV measurements (
Supplementary Figure S10).
3.17. Optimization of miR-155 Binding to antimiR-155 Probe Bounded Cys-Graft p(HEMA) Nanopolymer
Optimization of the miR-155 Binding on Different Concentrations of antimiR-155 Probe Bounded Cys-Graft p(HEMA) Nanopolymer
DPV measurements were taken by dropping 0.1; 0.5; 1; 2.5; 5; 7.5; 10 µM antimiR-155 probes and 5 µM miR-155 for the optimization of antimiR-155 binding to nanopolymer-bound gold electrode surface at different concentrations.
As a result of the graphic obtained from the current differences obtained as a result of DPV measurements, it was determined that 5 µM concentration among different concentrations of antimiR-155 probe was optimal for the binding of miR-155 (
Supplementary Figure S11).
3.18. Optimization of miR-155 Binding Time to antimiR-155 Probe-Bound Cys-Graft p (HEMA) Nanopolymer
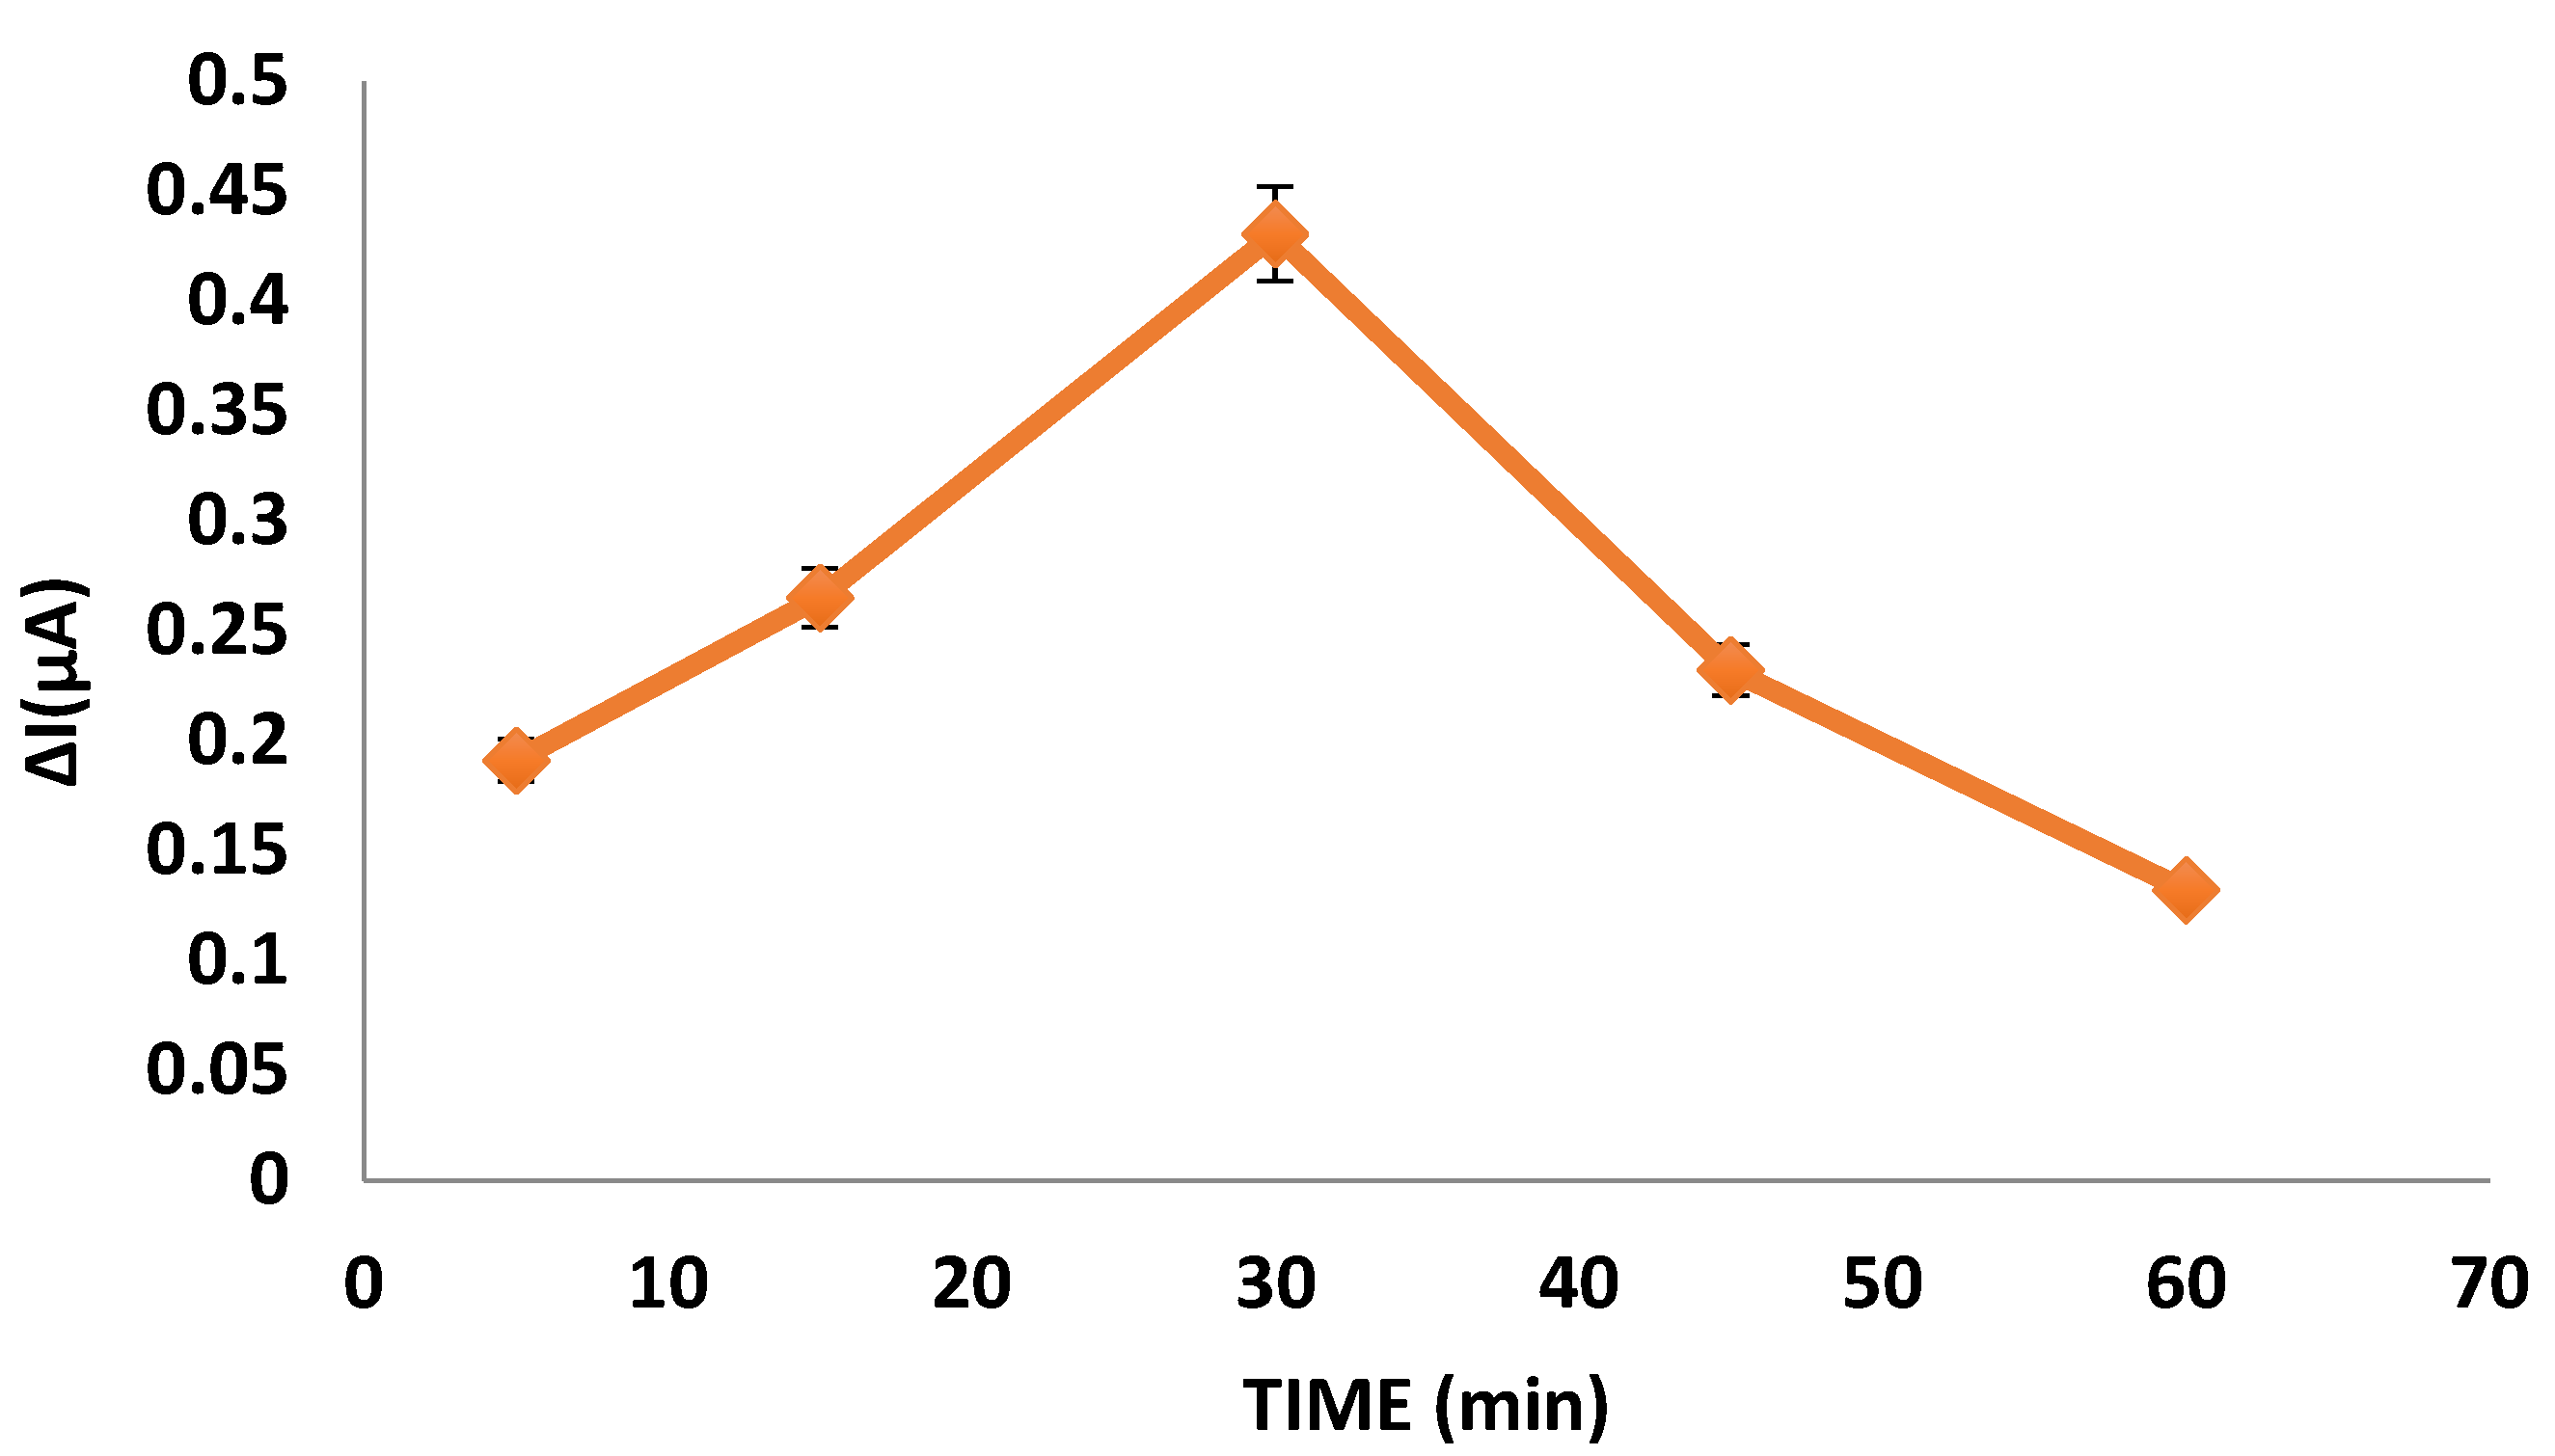
DPV measurements were taken at 5, 15, 30, 45, and 60 min by dropping the miR-155 (in water with 10 mM Tris HCl and 1 mM EDTA Ph = 8 0.1% DEPC) to the nanopolymer and antimiR-155 bound gold electrode to optimize the miR-155 binding time.
As a result of the graphic obtained from the current differences obtained as a result of DPV measurements, the optimum miR-155 binding time was determined as 30 min (
Figure 4). The nanopolymer surface, which is the miR-155 recognition surface and derivatized so that the hybridization reaction takes place, reached saturation by showing the maximum amount of binding in a short time of about 30 min. The response time for the detected nanobiosensor miR-155 detection is as short as 30 min. This will bring great advantage by using nanobiosensors in routine analysis to be performed for clinical purposes. It can be interpreted that the response time received is short, and the miR-155 determination of the developed nanobiosensor system depends on the specific hybridization reaction between the nanopolymer surface probe array and miR-155.
Compared with the developed electrochemical sensor studies, miR-155 detection was performed in the literature by Majd et al., in a study carried out in 2018. The detection time for miR 155 was 40 min. Azimzadeh et al. carried out a study in 2016, and the detection time for miR 155 was 60 min. Zhang et al. found in 2015 that the detection time for miR 155 was 120 min. Wu et al., in 2014, determined the detection time for miR 155 as 120 min, and Kong et al. in 2016 determined the detection time for miR 155 as 50 min. It can be said that the nanobiosensor system developed within the study shows superiority to the literature in terms of response time for the detection of miR-155.
3.19. Optimization of miR-155 Concentration to antimiR-155 Probe Bound Cys-Graft p(HEMA) Nanopolymer
Hybridization Temperature Optimization of AntimiR-155 Probe-Bound Cys-Graft p(HEMA) Nanopolymer and miR-155 Interaction
DPV measurements were taken by dropping miR-155 at different temperature (4, 25, 45 °C) medium on nanopolymer and antimiR-155 probe-bound electrode surfaces. As a result of DPV measurements, the optimum hybridization temperature was determined as 25 °C. Tm (melting temperature) is the degree of temperature to match the regions where the sequences are complementary and to form the hydrogen bonds, and varies according to the base content of the sequences. It has been reported that the hybridization specificity increases as the temperature decreases [
38]. If the temperature is too high during hybridization of the sequences, hybridization cannot occur; on the contrary, the sequences prefer to stay in the environment separately. When the temperature is too low, mismatched hybrids can be seen that do not match the correct base pairs ([
39]. When the studies in the literature examining the hybridization temperature are investigated, it is seen that the electrochemical signal received after the hybridization reaction is higher at the temperature values below the melting temperature (Tm) of the probe array. It is known that the melting temperature of the miR-155 series used in the study is Tm = 50.7 °C and the melting temperature of the probe array anti-miR-155 Tm = 48.2 °C. In fact, in the study developed by Kloosterman et al., they stated that they obtained the optimum hybridization temperature for miRNA detection at 20–25 °C below the Tm value of the probe array [
22] (
Supplementary Figure S12).
3.20. Effect of EDC/NHS Activation on antimiR-155 Probe-Bound Cys-Graft p(HEMA) Nanopolymer and miR-155 Interaction
In order to examine the effect of EDC/NHS activation, activation was applied before binding antimiR-155 probe and miR-155 to nanopolymer-bound gold electrode surfaces, then the procedure was completed and DPV measurements were performed. As a result of DPV measurements, it was determined that activation of EDC (1-ethyl-3-(3-dimethyl amino propyl) -carbodiimide), NHS (N-Hydroxysuccinimide) did not have a positive effect on anti-miR-155 probe binding, and even reduced the amount of binding. When the effect of miR-155 binding on this analysis was examined, it was seen that miR-155 binding increased slightly in the presence of activation. However, considering that the negative effect of anti-miR-155 probe binding was more significant, activation was not performed in the trials.
When the EDC NHS activation is examined, it is seen that this activation is aimed to increase the covalent bonds performed through these groups by activating the carboxyl (-COOH) groups on the nanopolymer surface. Due to the unstable structure of the NHS attached to the nanopolymer surface, it is aimed to increase the amount of binding by preferring to connect to the place where the NHS is separated over an analyte containing the amino group with a higher affinity of the nanopolymer. In the scope of the study, the binding of miR-155 to the synthesized Cys-graft-p (HEMA) nanopolymer was achieved by the disulfide bond (S-S) formed between the thiol group originating from the cysteine amino acid in the nanopolymer and the thiol group in the conjugate probe of the thiolated miR-155. Analysis will be carried out by making use of signal difference as a result of hybridization reaction between the conjugate probe attached to the nanopolymer coated on the sensor chip and miR-155. Therefore, analysis can be performed without any additional activation process in the developed nanobiosensor system (
Supplementary Figures S13 and S14).
3.21. CV Analysis
The CV measurements taken at each stage of the trials (Empty, Cys-graft-p (HEMA) nanopolymer, anti-miR-155, and miR-155 binding) were superimposed under optimum conditions obtained as a result of the trials.
When the anodic potentials are compared in the graphic obtained, 31.42 µA of empty electrode, 30.49 µA when Cys-graft-p (HEMA) nanopolymer is added, 29.96 µA when anti-miR155 probe is added, and 28.82 µA when miR155 is added. In cathodic potentials, empty electrode −30.46 µA, Cys-graft-p (HEMA) nanopolymer is added −29.44 µA, anti-miR155 probe is added −26.81 µA and miR155 are added and −25.06 µA values are obtained. With increasing thickness of the material on the surface, conductivity decreases, and current decreases [
40].
As can be seen from the graph, as miR-155 concentrations are changed, the flow values from the CV analysis change proportionally. It can be said that the developed nanobiosensor system responds sensitively to miR-155 at different concentrations (
Supplementary Figure S15).
3.22. Nanobiosensor Characteristics/Method Validation
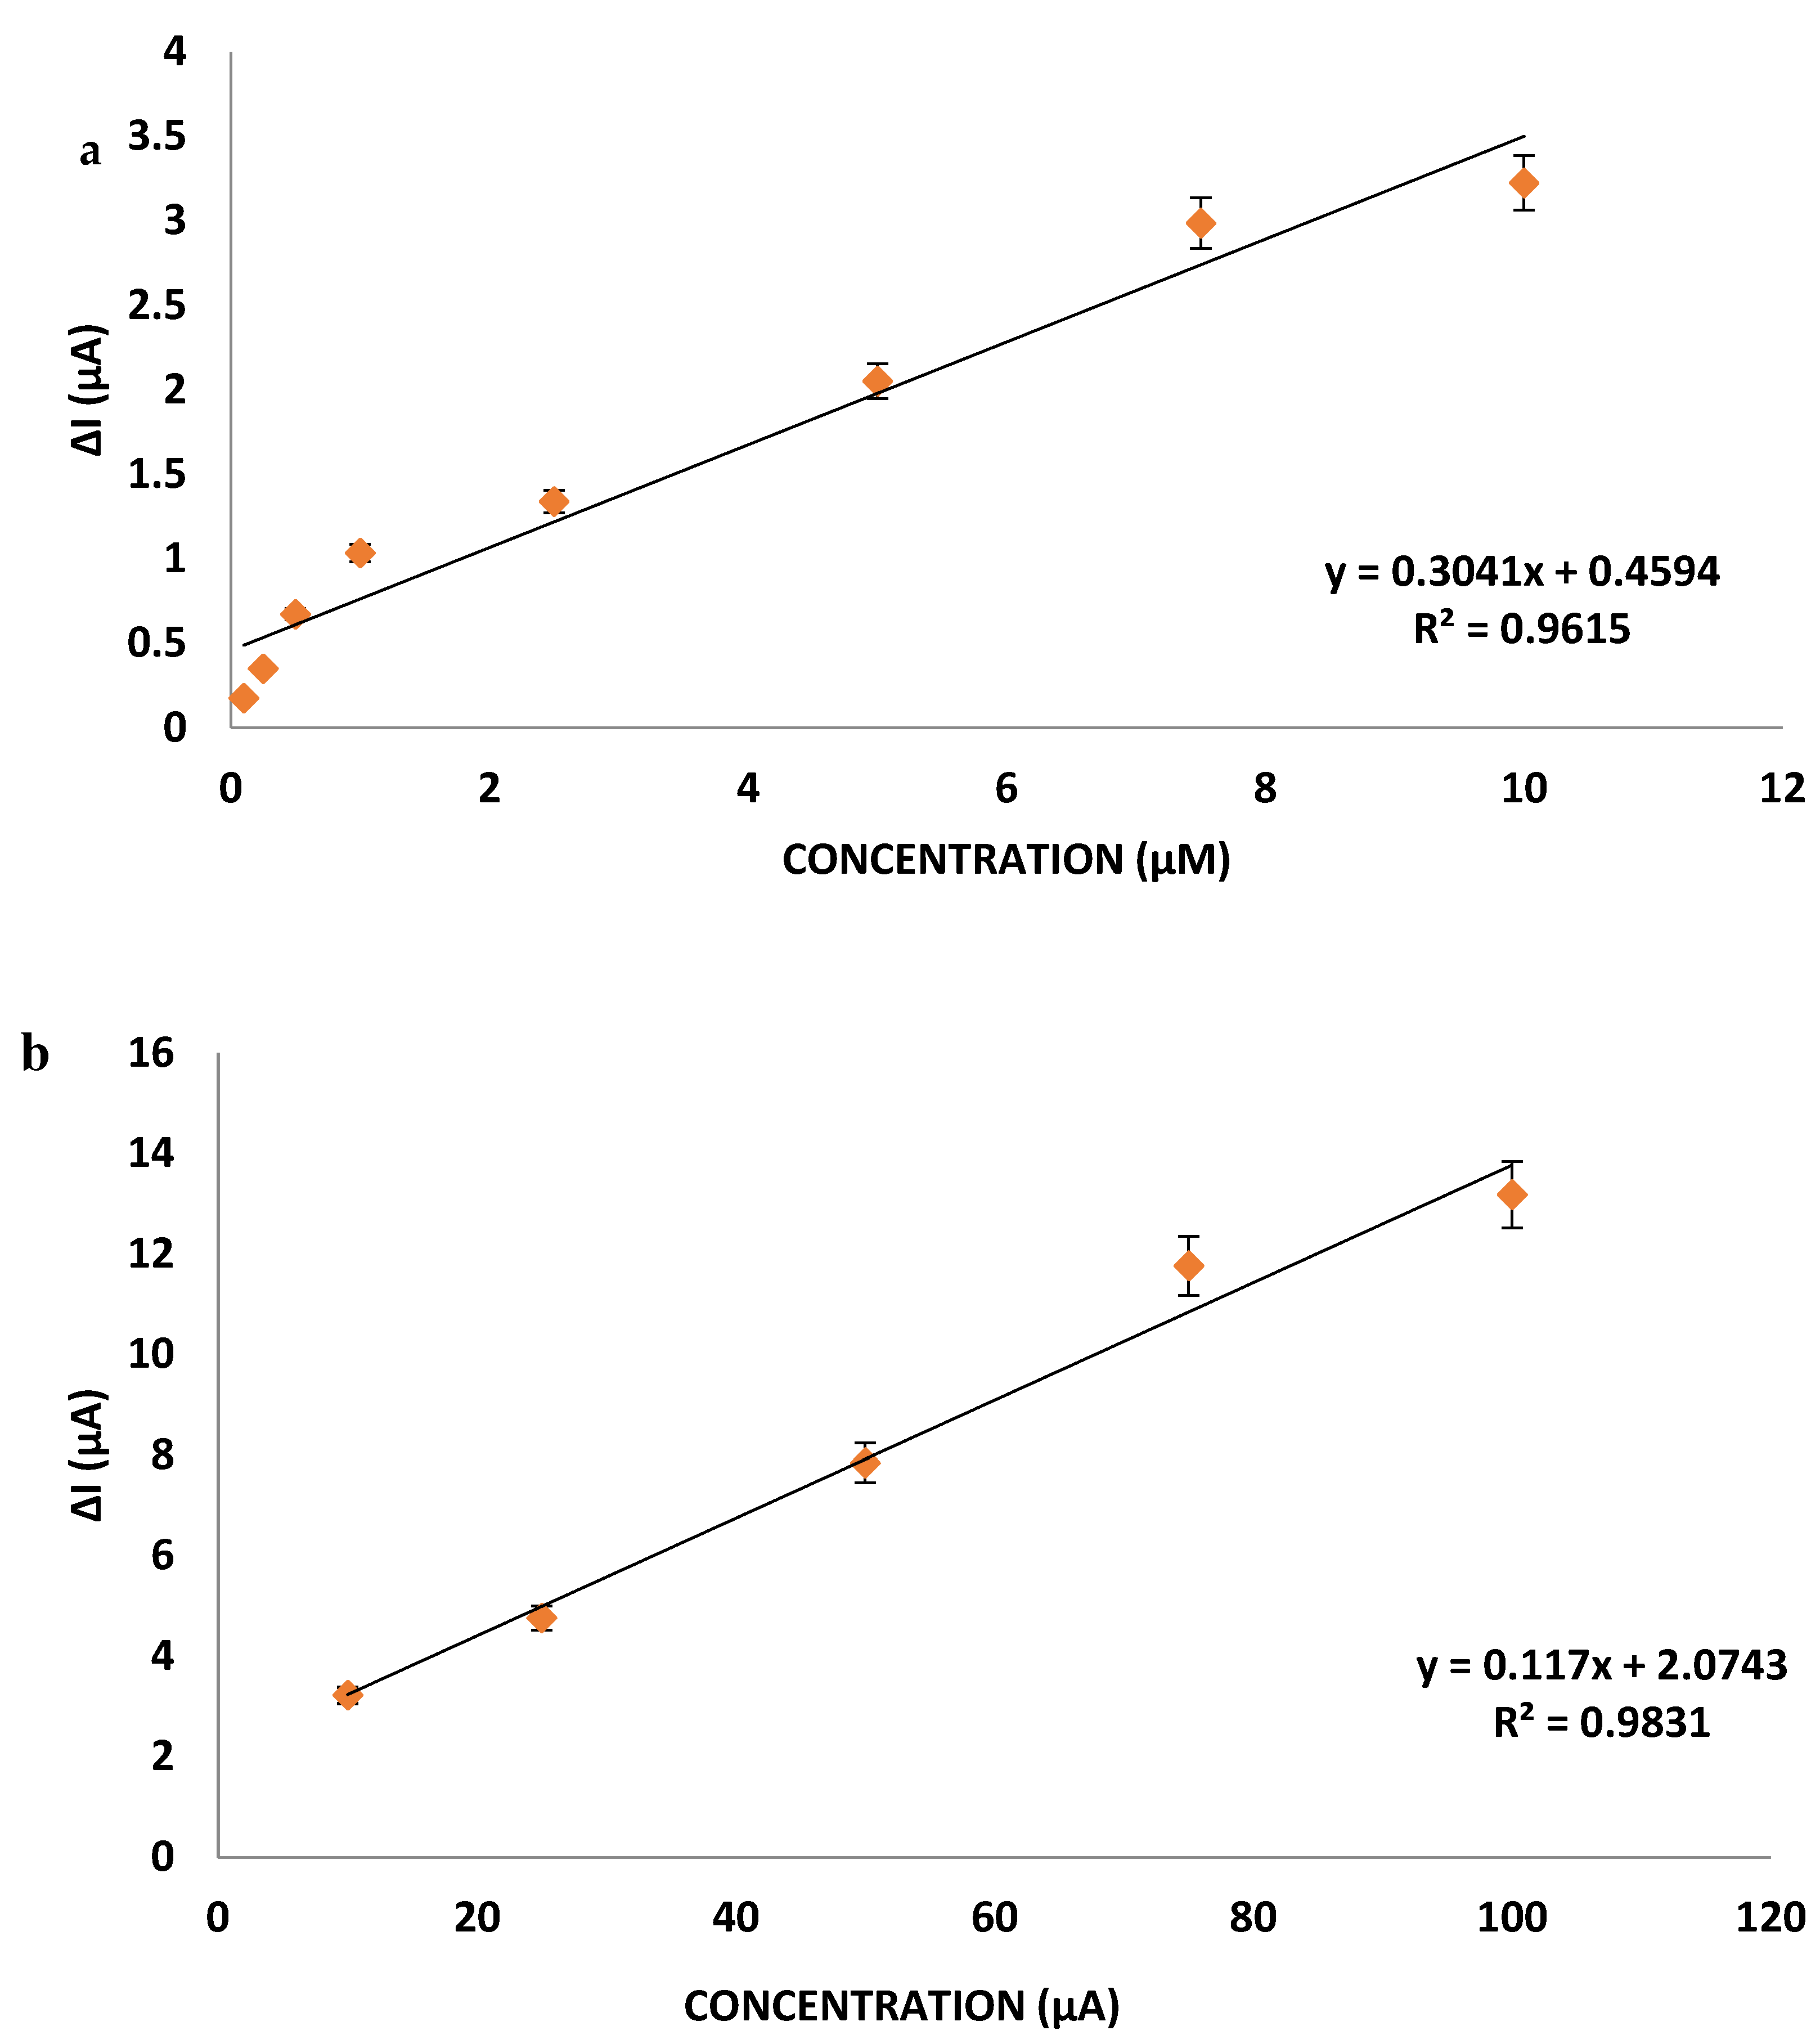
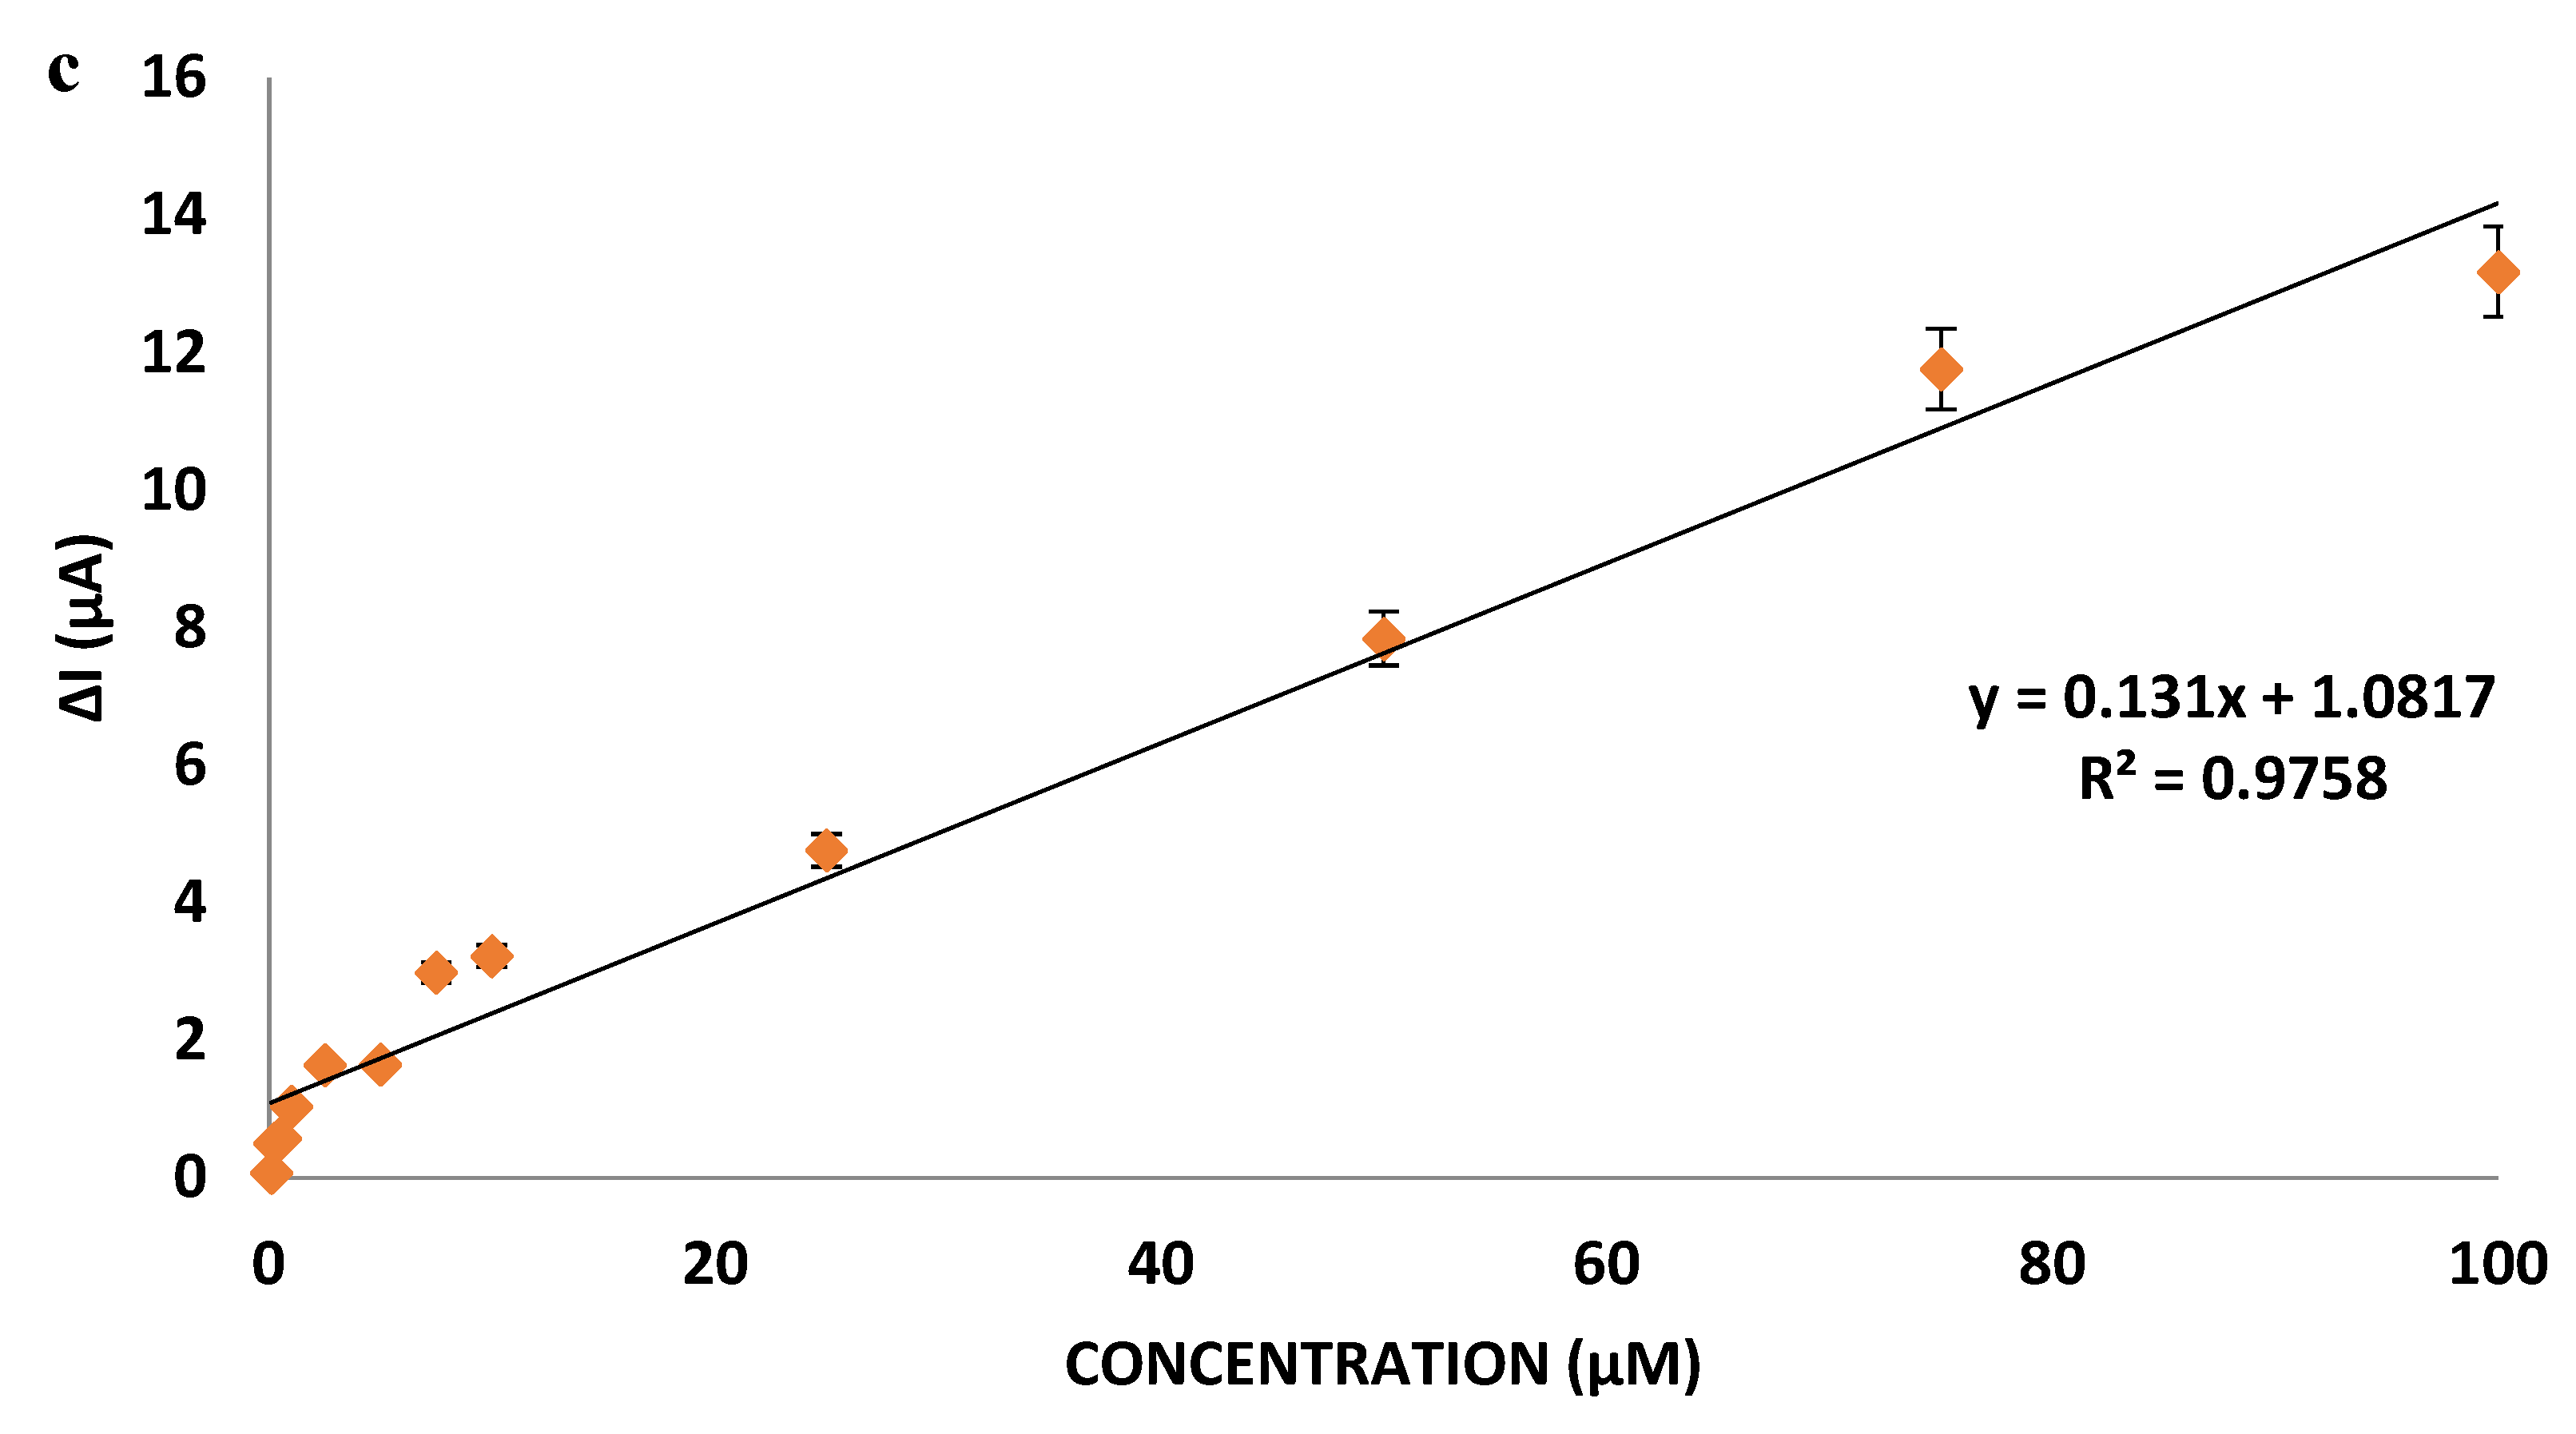
miR-155 Calibration Curve
For the optimization of miR-155 concentration, nanopolymer and antimiR-155 bound gold electrode to the surface, 0.1; 0.25; 0.5; 1; 2.5; 5; 7.5; 10; 25; 50; 75; 100 µM miR-155 were dropped on the surface and DPV measurements were taken (
Figure 5).
As seen in the calibration graph obtained from the current differences obtained as a result of DPV measurements, the developed nanobiosensor can determine the miR-155 linearly in the 0.1–100 µM concentration determination range, with low error and high R
2 value of 0.97. Circulating miRNA levels in serum are estimated to range from 200 aM to 20 pM. In the case of breast cancer, this may increase 100–50,000 times with ovarian expression of miR-155 [
41,
42,
43]. The nanobiosensor developed has the capacity to determine the difference in these levels in the presence of breast cancer.
3.23. Reproducibility
Using the DPV and CV measurements taken as a result of reproducibility trials and the miR-155 calibration graph, the amount of miR-155 corresponding to peak current heights (µM) was calculated. According to the reproducibility measurement results repeated seven times at a concentration of 5 µM miR-155, it was calculated as 5.09 µM, respectively; 5.45 µM; 5.64 µM; 5.19 µM; 5.42 µM; 5.2 µM; and 5.26 µM. According to these calculations, the average value was calculated as 5.32 µM, the recovery value was 93.98% and the RSD value was 3.59%, and the standard deviation value was 0.19. Considering that the values are quite close to the real value of 5 µM, it can be said that the nanobiosensor developed has a high reproducibility (
Supplementary Figure S16).
3.24. Specificity
Within the scope of the specification measurement, the anti-miR-155 binding and miR-155 diagnostic properties of (HEMA) and Cys graft-p (HEMA) nanopolymers were evaluated. As a result of DPV measurements, it was determined that Cys-graft-p (HEMA) nanopolymers were 2.5 times more specific in anti-miR-155 binding. It was interpreted that this was due to thiol interaction between the cysteine amino acid in the Cys-graft-p (HEMA) nanopolymer and the anti-miR-155 probe sequence. As a result of DPV measurements, it was determined that Cys-graft-p (HEMA) nanopolymers were four times more specific in miR-155 binding. It was interpreted that this was due to the cysteine amino acid in the Cys-graft-p (HEMA) nanopolymer, so that the binding of the anti-miR-155 probe sequence, which provides miR-155 binding by hybridization reaction, is due to the cysteine amino acid in the nanopolymer. In absence and presence of miR-155, an 11-fold difference between antimiR-155 and miR-155 binding is shown (
Supplementary Figures S17–S19).
3.25. Selectivity
Within the scope of measurement of selectivity characteristic, the diagnostic capacities of Cys-graft-p (HEMA) nanopolymer as well as CA-125, MUC 1, miRNA, and BSA were compared.
As a result of DPV measurements, it was determined that the anti-miR-155 bound Cys-graft-p(HEMA) nanopolymer was approximately three times more selective than miR-155 compared to other cancer biomarkers (
Figure 6). It was interpreted that this was due to the hybridization reaction, which is a very specific interaction.
3.26. Storage Stability
Within the scope of storage stability measurement, the miR-155 diagnostic capacity of the anti-miR-155 probe-bound Cys-graft-p (HEMA) nanopolymer was examined by taking a post-standby measurement for 5, 10, 20, 30, and 60 days. When the storage stability of these prepared electrodes is examined for 60 days, when the value taken on the first day is accepted as 100%, the measurement value taken on the 5th day is 93%, 88% on the 10th day, 82% on the 20th day, and 62% on the 60th day. It can be seen that it can be used with 58% efficiency on the 30th day. The fact that the electrodes prepared with anti-miR-155 bound Cys-graft-p (HEMA) can be used in the diagnosis of miR-155 with 58% efficiency even on the 60th day shows the high activity of the developed nanobiosensor and reduces the cost (
Supplementary Figure S20).
3.27. Linearity
Within the scope of measuring the linearity characteristic, the R2 value of the miR-155 calibration curve was determined as the linearity of the method was 97.6%.
3.28. Precision
Within the scope of measuring the sensitivity characteristic, the slope value of the miR-155 calibration graph equation was used, and the sensitivity of the method was determined as 0.131 µM.
3.29. Limit of Detection—LOD and Limit of Quantification—LOQ
The calculated limit of detection—LOD and limit of quantification—LOQ values of the developed method are given in
Table 5.
The detection limit of the method was calculated as 2.44 µM. The quantification limit of the developed method was calculated as 8.12 µM.
3.30. Accuracy
Reproducibility test results were used for reality parameter calculation. T value was calculated as 1.97. The degree of freedom (n−1), t
critical value for 6 was determined from the table (
p = 0.05) = 2.44. Since the calculated t value is lower than the critical value, it can be interpreted that the measurements are real. Recovery (R), relative standard deviation (% RSD), and confidence limit were calculated. R value was calculated as 93.98 and %RSD was calculated as 3.59. The low % RSD calculated shows the sensitivity of the method [
44]. Confidence limit (CL) was calculated 5.32
0.17. To determine the accuracy of the method, Grubbs test was calculated using GraphPad. When the Grubbs test is examined, it can be said within the certainty limit of the analysis results since the calculated values are smaller than the critical value.
3.31. Commercial Blood Serum Sample Experiment
miR-155 solution in different concentrations (0.5; 1; 5; 10; 50; 100 µM) prepared in the blood serum (HUMAN SERUM, P2918, SIGMA ALDRICH, ABD, Saint Louis, MO, USA) medium used as the commercial blood serum example was dropped onto the antimiR-155 probe bound nanopolymers covered gold electrode and measurements were taken (
Supplementary Figure S21).
In the DPV measurement results, it was determined that the developed nanbobiosensor can be used in a wide concentration range in the samples prepared in the blood sample, which was the commercial blood serum sample.
From miR-155 values measured in the actual sample blood serum given in
Table 6 and values with known concentrations, when the error amounts and % error rates are examined, it can be seen that the developed nanobiosensor system can be used for clinical diagnosis within the commercial blood serum sample with low errors.
3.32. Comparison with Qbit miRNA Assay Kit
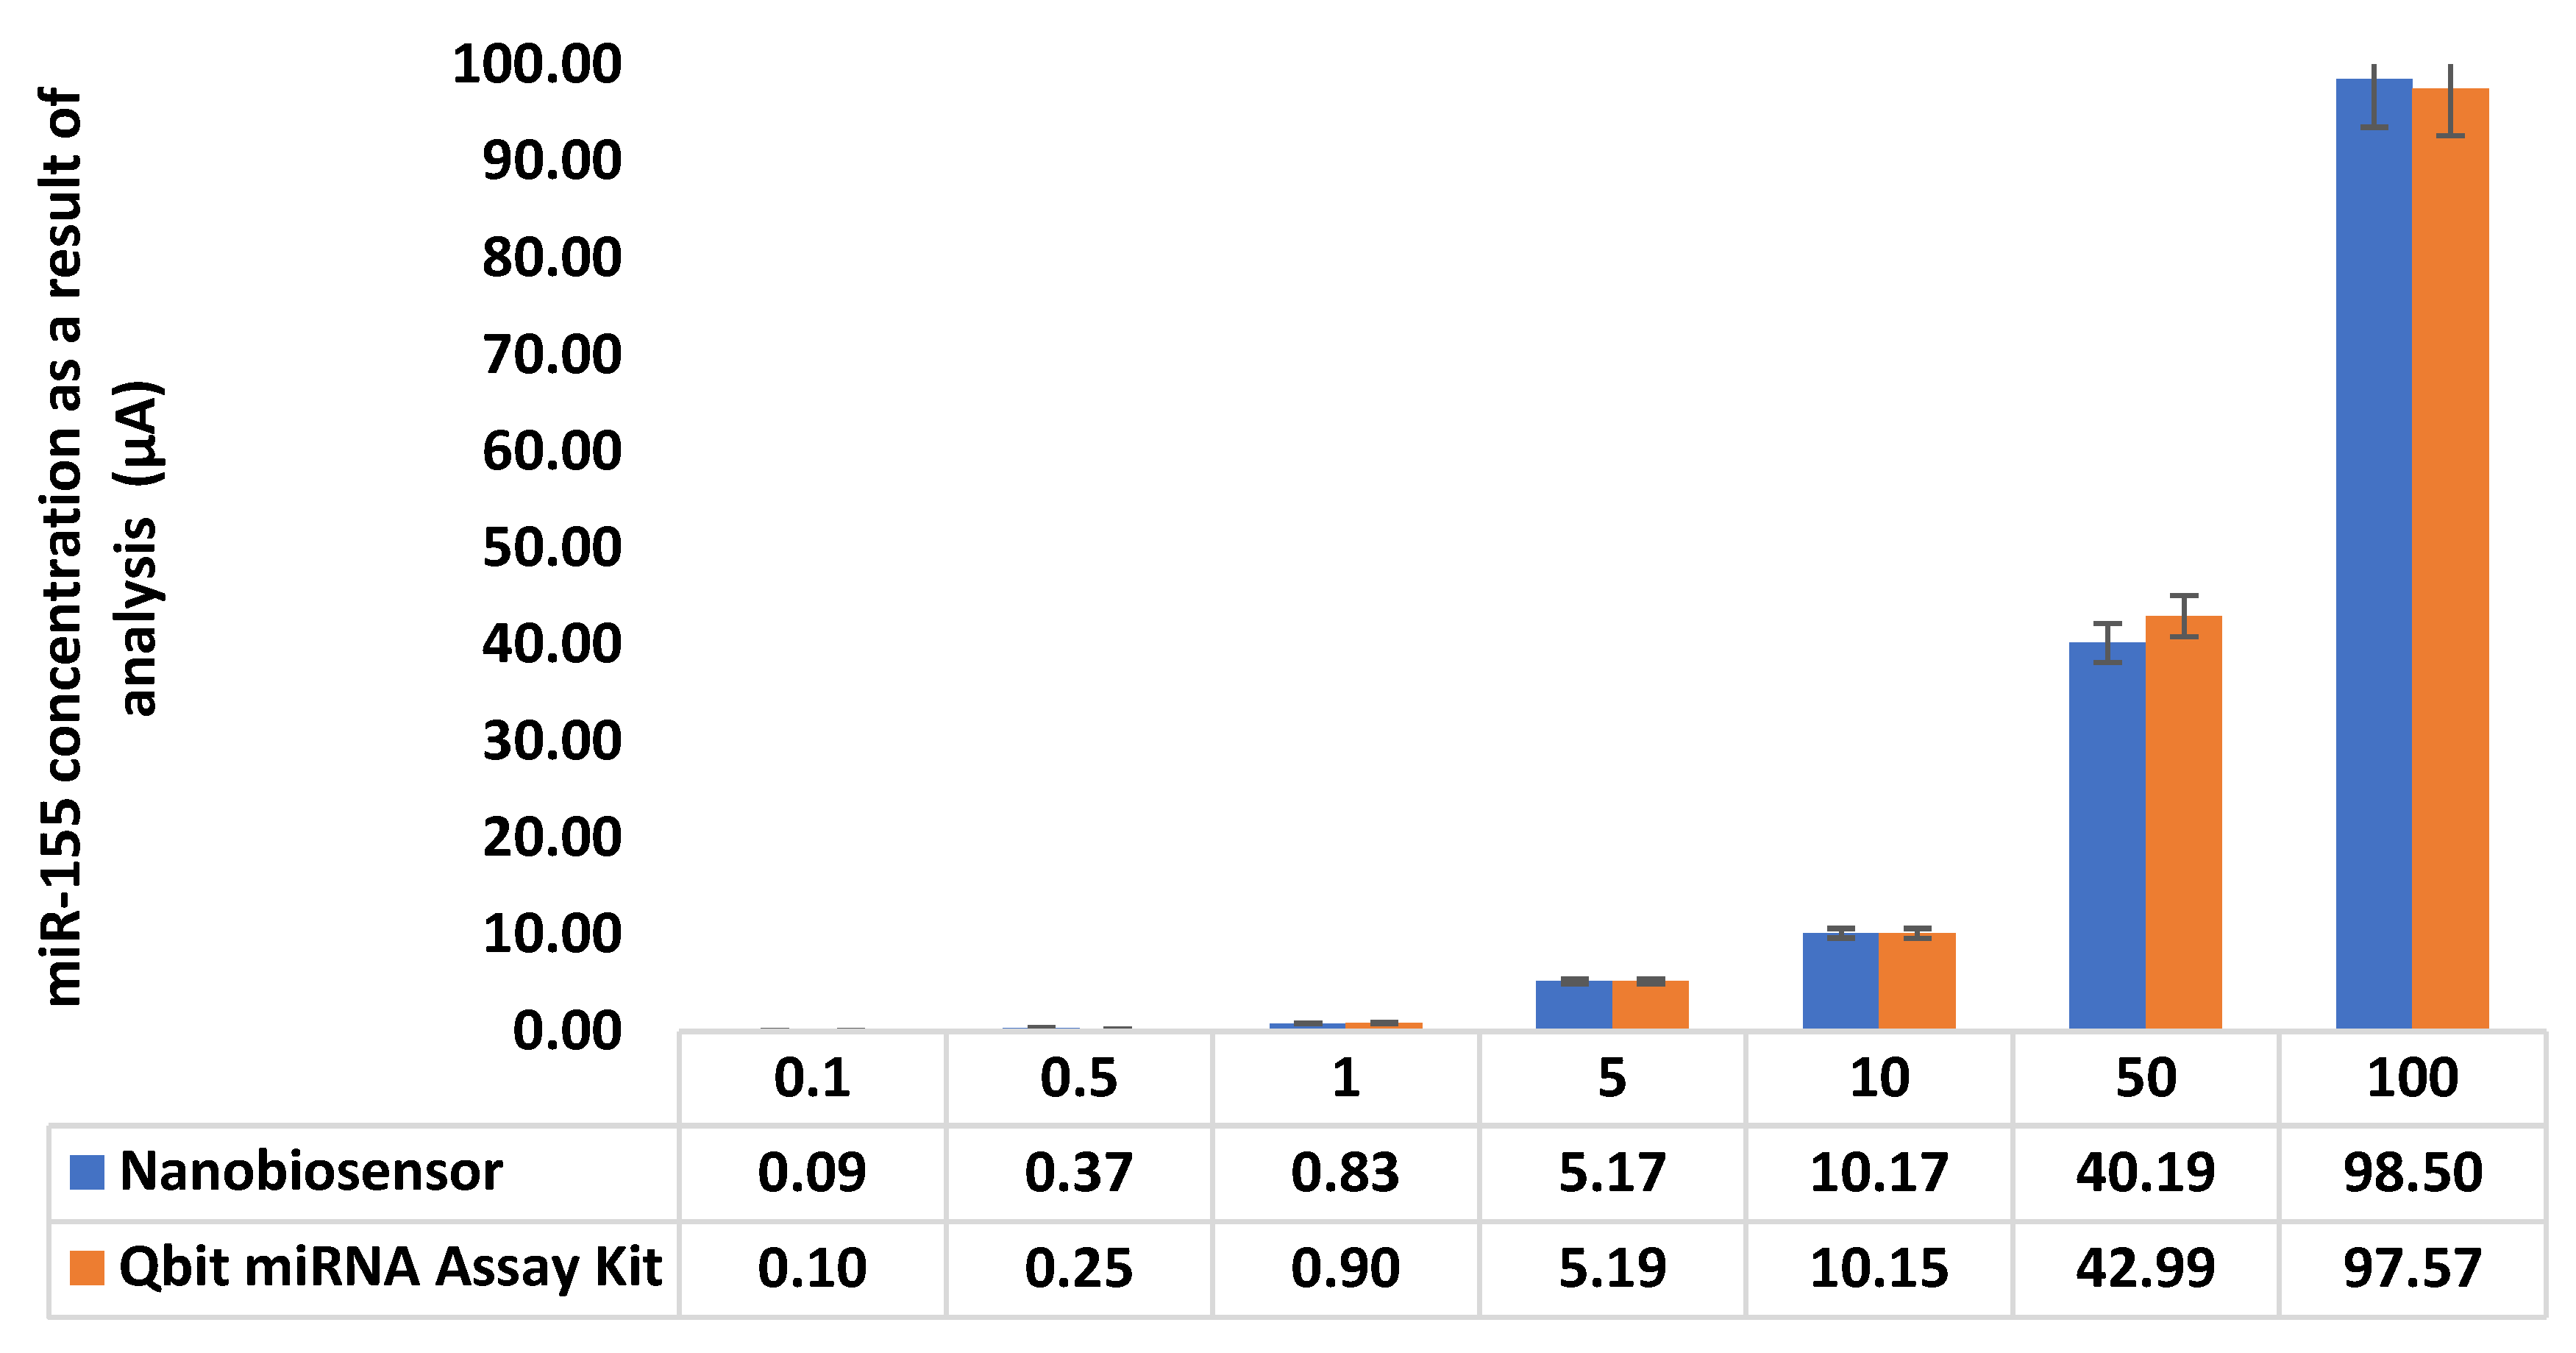
Calibration graph was prepared with standard solutions prepared at 0–10 ng/µL concentration range in commercial blood serum (Human Serum, P2918, SIGMA ALDRICH, ABD, Saint Louis, MO, USA) (
Supplementary Figure S22).
When the graphic and standard deviations are examined, it is seen that there is a correlation between the results obtained with the developed nanobiosensor and the results obtained with the Qbit miRNA assay kit (
Figure 7 and
Table 7). Statistical analysis was also performed between the results obtained with both the developed nanobiosensor and the Qbit miRNA assay kit in samples prepared in commercial blood sample (Human Serum, P2918, SIGMA ALDRICH, ABD, Saint Louis, MO, USA). The t value calculated in the t test for the purpose of determining accuracy is equal to or less than the critical t value, indicating that there is no significant difference between the methods [
35]. For the t test (n
total = 7) performed using the reference method and the values obtained according to the measurements taken with the nanobiosensor system, the calculated value was 0.53. (n
total−1) t critical value was taken as 2.447 from the t test table. Since the results obtained were also critical, the accuracy of the measurements between the two methods was interpreted to be consistent with each other [
35]. Considering that the sensitivity of the nanobiosensor system is 0.131 µM and its linear range is 0.1–100 µM, it can be said that it can be used for the correct detection of miR-155 in this range. In addition, the sensor system excels in reference methods thanks to its 30-min response time, low cost, specific analysis for miR-155, and easy handling.
4. Discussion
Within the scope of the study, it was aimed to develop a nanobiosensor for the use of miRNA-155, which shows an abnormal expression in breast cancer, in the diagnosis of this cancer. In this context, first of all, p(HEMA) and Cys-graft-p(HEMA) nanopolymers, which will form the bioactive surface of the nanobiosensor system to be developed, were prepared and the physical and chemical properties and modification of the nanopolymers were characterized by advanced characterization techniques. Within the scope of these techniques, scanning electron microscopy (SEM), Energy Dispersion Spectrometer (EDS), Zeta Dimension and Potential Analysis, conductivity analysis, Atomic Force Microscope (AFM), Fourier Transform Infrared Spectroscopy (FTIR), Energy Dispersive X-ray Fluorescence Spectrometer (XRD), X-Ray Photoelectron Spectrometer (XPS), Differential Scanning Calorimetry (DSC), Dry Mass Graph, and Specific Surface Area Calculation were used. The nanobiosensor surface, which was prepared using nanomaterials that were synthesized and characterized by advanced characterization methods, was also characterized using ellipsometry and contact angle analysis. The developed nanobiosensor surface was optimized by examining the nanopolymer amount, binding time, probe sequence anti-miR-155 concentration, binding time, miR-155 concentration, binding time, hybridization temperature, and EDC/NHS activation parameters. While these sensor studies were carried out, DPV and CV measurements were taken in the electrochemical sensor system. Within the scope of sensor characteristics and method validation, precision, reproducibility, specificity, selectivity, storage stability, linearity, sensitivity, detection limit and detection limit, accuracy parameters were examined. Finally, the miR-155 detection capacity of the nanobiosensor in the blood serum medium, which is a commercial blood serum sample, was examined, and its performance was compared with the commercially available Qbit miRNA Assay kit.
While preparing Cys-graft-p(HEMA) nanopolymers used in the developed nanobiosensor system, p(HEMA) nanopolymers were synthesized by mini-emulsion polymerization method and Cys-graft-p(HEMA) nanopolymers were prepared by adding cysteine amino acid to the structure with a 78% yield by grafting procedure. Within the scope of the study, the binding of miR-155 to the synthesized Cys-graft-p(HEMA) nanopolymer was achieved by a disulfide bond (S-S) formed between the thiol group originating from the cysteine amino acid in the nanopolymer and the thiol group in the conjugate probe of thiolated miR-155. Analysis was carried out by utilizing the signal differentiation as a result of the hybridization reaction between miR-155 and the conjugate probe attached to the nanopolymer coated on the sensor chip.
When the characterization data of the prepared Cys-graft-p (HEMA) nanopolymers are examined, it is seen that Cys-graft-p(HEMA) nanopolymers were obtained in spherical morphology between 60–70 nm in the SEM analysis. Nanopolymer sizes and surface charges were determined by zeta size and potential analysis, and the degree of conductivity was examined. When the EDS analysis results of Cys-graft-p(HEMA) nanopolymers were examined, the % S content was determined as 1.67%, and with the support of the FTIR analysis, it was proven that the grafting process was successful with the presence of sulfur in the structure, and that the cysteine amino acid was added to the structure. When the XPS analysis results of Cys-graft-p(HEMA) nanopolymers were examined, the %N content was determined as 0.08, and it was proved that the grafting process was successful with the presence of nitrogen in the structure, and that the cysteine amino acid was added to the structure. The total nitrogen amount in the structure was calculated as 0.057 mmol/g. Supporting these analyses, changes in the morphological structure of nanopolymers were proved by AFM analysis. The thermal characteristics of nanopolymers were determined by DSC and TGA analyses, and the changes in the structure were proved. The specific surface area of Cys-graft-p(HEMA) nanopolymers was determined as 1,586,428 m2/g. The nanobiosensor surfaces prepared with the use of synthesized and characterized nanopolymers as sensor bioactive layer were characterized by ellipsometry and contact angle analysis; it was shown that the modifications made cause differences in the morphological, chemical, and physical properties of the nanopolymers.
Nanopolymers were synthesized by mini-emulsion polymerization method, which is a controlled polymerization system in order to achieve size control and small nanometer sizes. Obtaining nanopolymers in small sizes, in an optimized and spherical form, provides a very large surface area of the surface to be used as the active layer of the nanobiosensor. In this case, the miR-155 recognition efficiency of the surface, which is the active layer and is made specific to the target molecule, increases.
In the optimizations made within the scope of examining the miR-155 recognition capacity of the developed nanobiosensor, the optimum time for the binding of the Cys-graft-p(HEMA) nanopolymer to the gold electrode surface was determined as 90 min, and the optimum volume was 5 µL, as a result of the graphs obtained from the current differences obtained as a result of the DPV measurements. Optimum antimiR-155 probe binding time was determined as 45 min. The optimum antimiR-155 probe concentration was determined as 5 µM. The optimum temperature value for MiR-155 binding was determined to be 25 °C. For the miR-155 diagnosis of the developed nanobiosensor system, the response time was determined as 30 min and the linear measurement range was 0.1–100 µM. Within the scope of the specificity study, Cys-graft-p (HEMA) nanopolymers were determined to be 2.5 times more specific in anti-miR-155 binding. Cys-graft-p (HEMA) nanopolymers were determined to be four times more specific for miR-155 binding. It was determined that the anti-miR-155 bound Cys-graft-p(HEMA) nanopolymer was approximately three times more selective to miR-155 than other cancer biomarkers (MUC-1, CA-125, and other miRNA) in the context of the selectivity characteristic.
When the miR-155 values measured in the commercial blood serum are examined, it can be seen that the developed, characterized, and optimized nanobiosensor system can be used for diagnostic purposes in the commercial blood serum sample with low errors. The characteristics and method validation of the nanobiosensor system are summarized in the
Table 8. As a reference method, performance comparisons were made with the Qbit miRNA Assay Kit, and there is a correlation between the results. It seems that the developed nanobiosensor can be used for miR-155 detection for breast cancer diagnosis/prognosis and follow up with the advantage of 30 min response time. The fact that the electrodes prepared with anti-miR-155 bound Cys-graft-p (HEMA) can be used in the diagnosis of miR-155 with 58% efficiency even on the 60th day shows the high activity of the developed nanobiosensor and reduces the cost. The nanobiosensor system is suitable for routine laboratory analysis and point of care testing, and has a worldwide patent potential, enabling low cost, rapid and specific analysis, and has the potential to be a product that will contribute to the economy.
The patent search for the study was conducted using “
http://www.espacenet.com” (accessed on 19 June 2022) as the database and “
http://www.patBASE.com” (accessed on 19 June 2022) as the patent information service. The research type was determined as “innovation research” and the research title was named “nanobiosensor system”. During the patent scanning, “biosensor for breast cancer based on miRNA, miR155” was used as key words.
In the patent numbered US2007065954A, a biosensor system was developed to detect the presence of cancer tumor-related antigens from cancer patient samples. In the patent numbered CN103743802A, gold-doped nano titanium dioxide electrodes for DNA determination were prepared for the detection of breast cancer genes, and an electrochemical sensor system was created. In the presented study, a nanobiosensor system that can detect breast cancer-specific microRNAs and provides real-time measurement is developed.
Within the scope of patent number CN104531880A, fluorescence biosensors have been developed for the determination of vascular endothelial growth factor for breast cancer diagnosis. The study is quite different from the current study in terms of using nanosized materials: specific miRNA-based biomarkers for breast cancer.
In the content of patent number CN104714012A, breast cancer gene sensors based on nano silver and nano copper structures have been developed. Within the scope of the study, an easy-to-prepare breast cancer diagnosis kit based on nanopolymeric structure and affinity techniques, which can detect breast cancer at an early stage and enable real-time and point-of-care applications, is developed.
When the literature (
Table 9) and the patent research examined, the originality of the developed nanobiosensor system is seen. In accordance with all of these characteristics, the current study uses cost-effective products and can compete with examples from the literature in terms of response time (30 min) and cost. The nanobiosensor system developed for the diagnosis/prognosis and follow-up of diseases, especially breast cancer, which is one of the most important health problems of today, is suitable for routine laboratory analyses and bedside applications, provides low cost, rapid and specific analysis, has a worldwide patent potential, and has the potential to be a product that will contribute to the economy.


