2.1. Materials
2-Hydroxyethylmethacrylate (HEMA), Sodium dodecyl sulfate (SDS), Sodium bicarbonate (NaHCO3), Ethylene dimethacrylate (EGDMA), Sodium bisulfite (NaHSO3), Ammonium persulfate (APS), Polyvinylalcohol (PVA), triethoxy-3-(2-imidazolin-1 yl) propylsilane (IMEO), Concanavalin A Type 4 (Con A) were used in the synthesis of polymeric nanomaterials. They were obtained from Sigma-Aldrich (St. Louis, MO, USA). In prepation of nanopolymers shaking water bath (Memmert, Wise Bath, Germany), magnetic magnetic stirrer (Witeg Labortechnik Wisd Laboratory Instrument, Wertheim, Germany) and multiple magnetic stirrer (Witeg Labortechnik Wisd Laboratory Instrument, Wertheim, Germany), refrigerated centrifuge (Centurion K2015 R, Doncester, England) microcentrifuge (Eppendorf Mini Spin Plus, Munich, Germany), oven Hereaus (Function Line), vortex (Dragon Lab MX-F), pH meter Neomet İSTEK (pH 240-L, Seoul, Korea), 0.1 mg sensitive scale (Kern ABS, Ballingen, Germany), sonic bath (Bandelin Sonorex RK255H, Berlin, Germany, shaker (IKA KS 125 Basic, Zevenhuizen, The Netherlands) were used as equipment.
Potassium hexocyanoferrate (III) K3[Fe(CN)6] and potassium hexocyanoferrate (II) trihydrate K4[Fe(CN)6], potassium dihydrogen phosphate (KH2PO4) used for electrolyte solution of biosensor were obtained from Merck (Darmstadt, Germany). Deionized ultrapure Merck Millipore Simplicity® (18.2 MΩ cm, Darmstadt, Germany) water was used in the sensor experiments. The MUC1 antigen and commercial MUC1 ELISA kit were obtained from Mybiosource (Catalog No: YLA1050HU, San Diego, CA, USA). Human serum, P2918 was purchased from Sigma-Aldrich (St. Louis, MO, USA). Alumina (0.05 micron) was used in electrode cleaning process, Ag/AgCl (containing 3M KCl in internal solution) as the reference electrode and counting electrode was platinum wire from Basi Bioanalytical System Inc. (West Lafayette, IN, USA). Basi Bioanalytical System Inc glassy carbon electrodes (West Lafayette, IN, USA) were used as working electrodes. PalmSens potentiostat (Houten, The Netherlands) as the device for which all measurements are taken. PsTrace software (Houten, The Netherlands) was used for sensor measurements, ChemBio Draw software (Perkin Elmer, MA, USA) was used for molecular interaction drawings, Edraw Max software (Shenzhen, China) was used for other schematic drawings, OriginPro (OriginLab, Northampton, MA, USA) and GraphPad Prism software (San Diego, CA, USA) were used for statistical analysis and graphs.
2.2. Methods
2.2.1. Preparation of Nanopolymers (Synthesis, Silanization and Modification Steps)
p(HEMA) nanopolymers were synthesized with the mini-emulsion polymerization method. For synthesis, three phase system was used. First phase (aqueous phase) includes PVA, SDS, NaHCO
3 in 200 mL distilled water. Then, 0.8 mL HEMA and 4.2 mL EGDMA were added to this phase as 2nd phase. The mixture was homogenized in 800–1000 rpm for 15–30 min. The 3rd phase added to the mixture was NaHSO
3 and APS, then the volume was completed in 250 mL [
25]. Polymerization medium was transferred to a bioreactor and the process was maintained in 40 °C, 500–700 rpm and 24 h. After 24 h, washing processes were carried out with ethanol and water for 5 times. Prepared nanopolymers were stored at +4 °C until use.
p(HEMA) nanopolymer was modified with minor changes according to [
26]. In order to modify the p(HEMA) nanoparticle with IMEO, 70 mL of the p(HEMA) nanoparticle was precipitated. After separating the supernatant, it was dispersed in 15 mL of water. p(HEMA) nanoparticles in flask, 600 mL ethanol and 360 µL IMEO distributed in 9 mL distilled water was added. It was stirred at 30 °C for 1–7 day at 200–400 rpm [
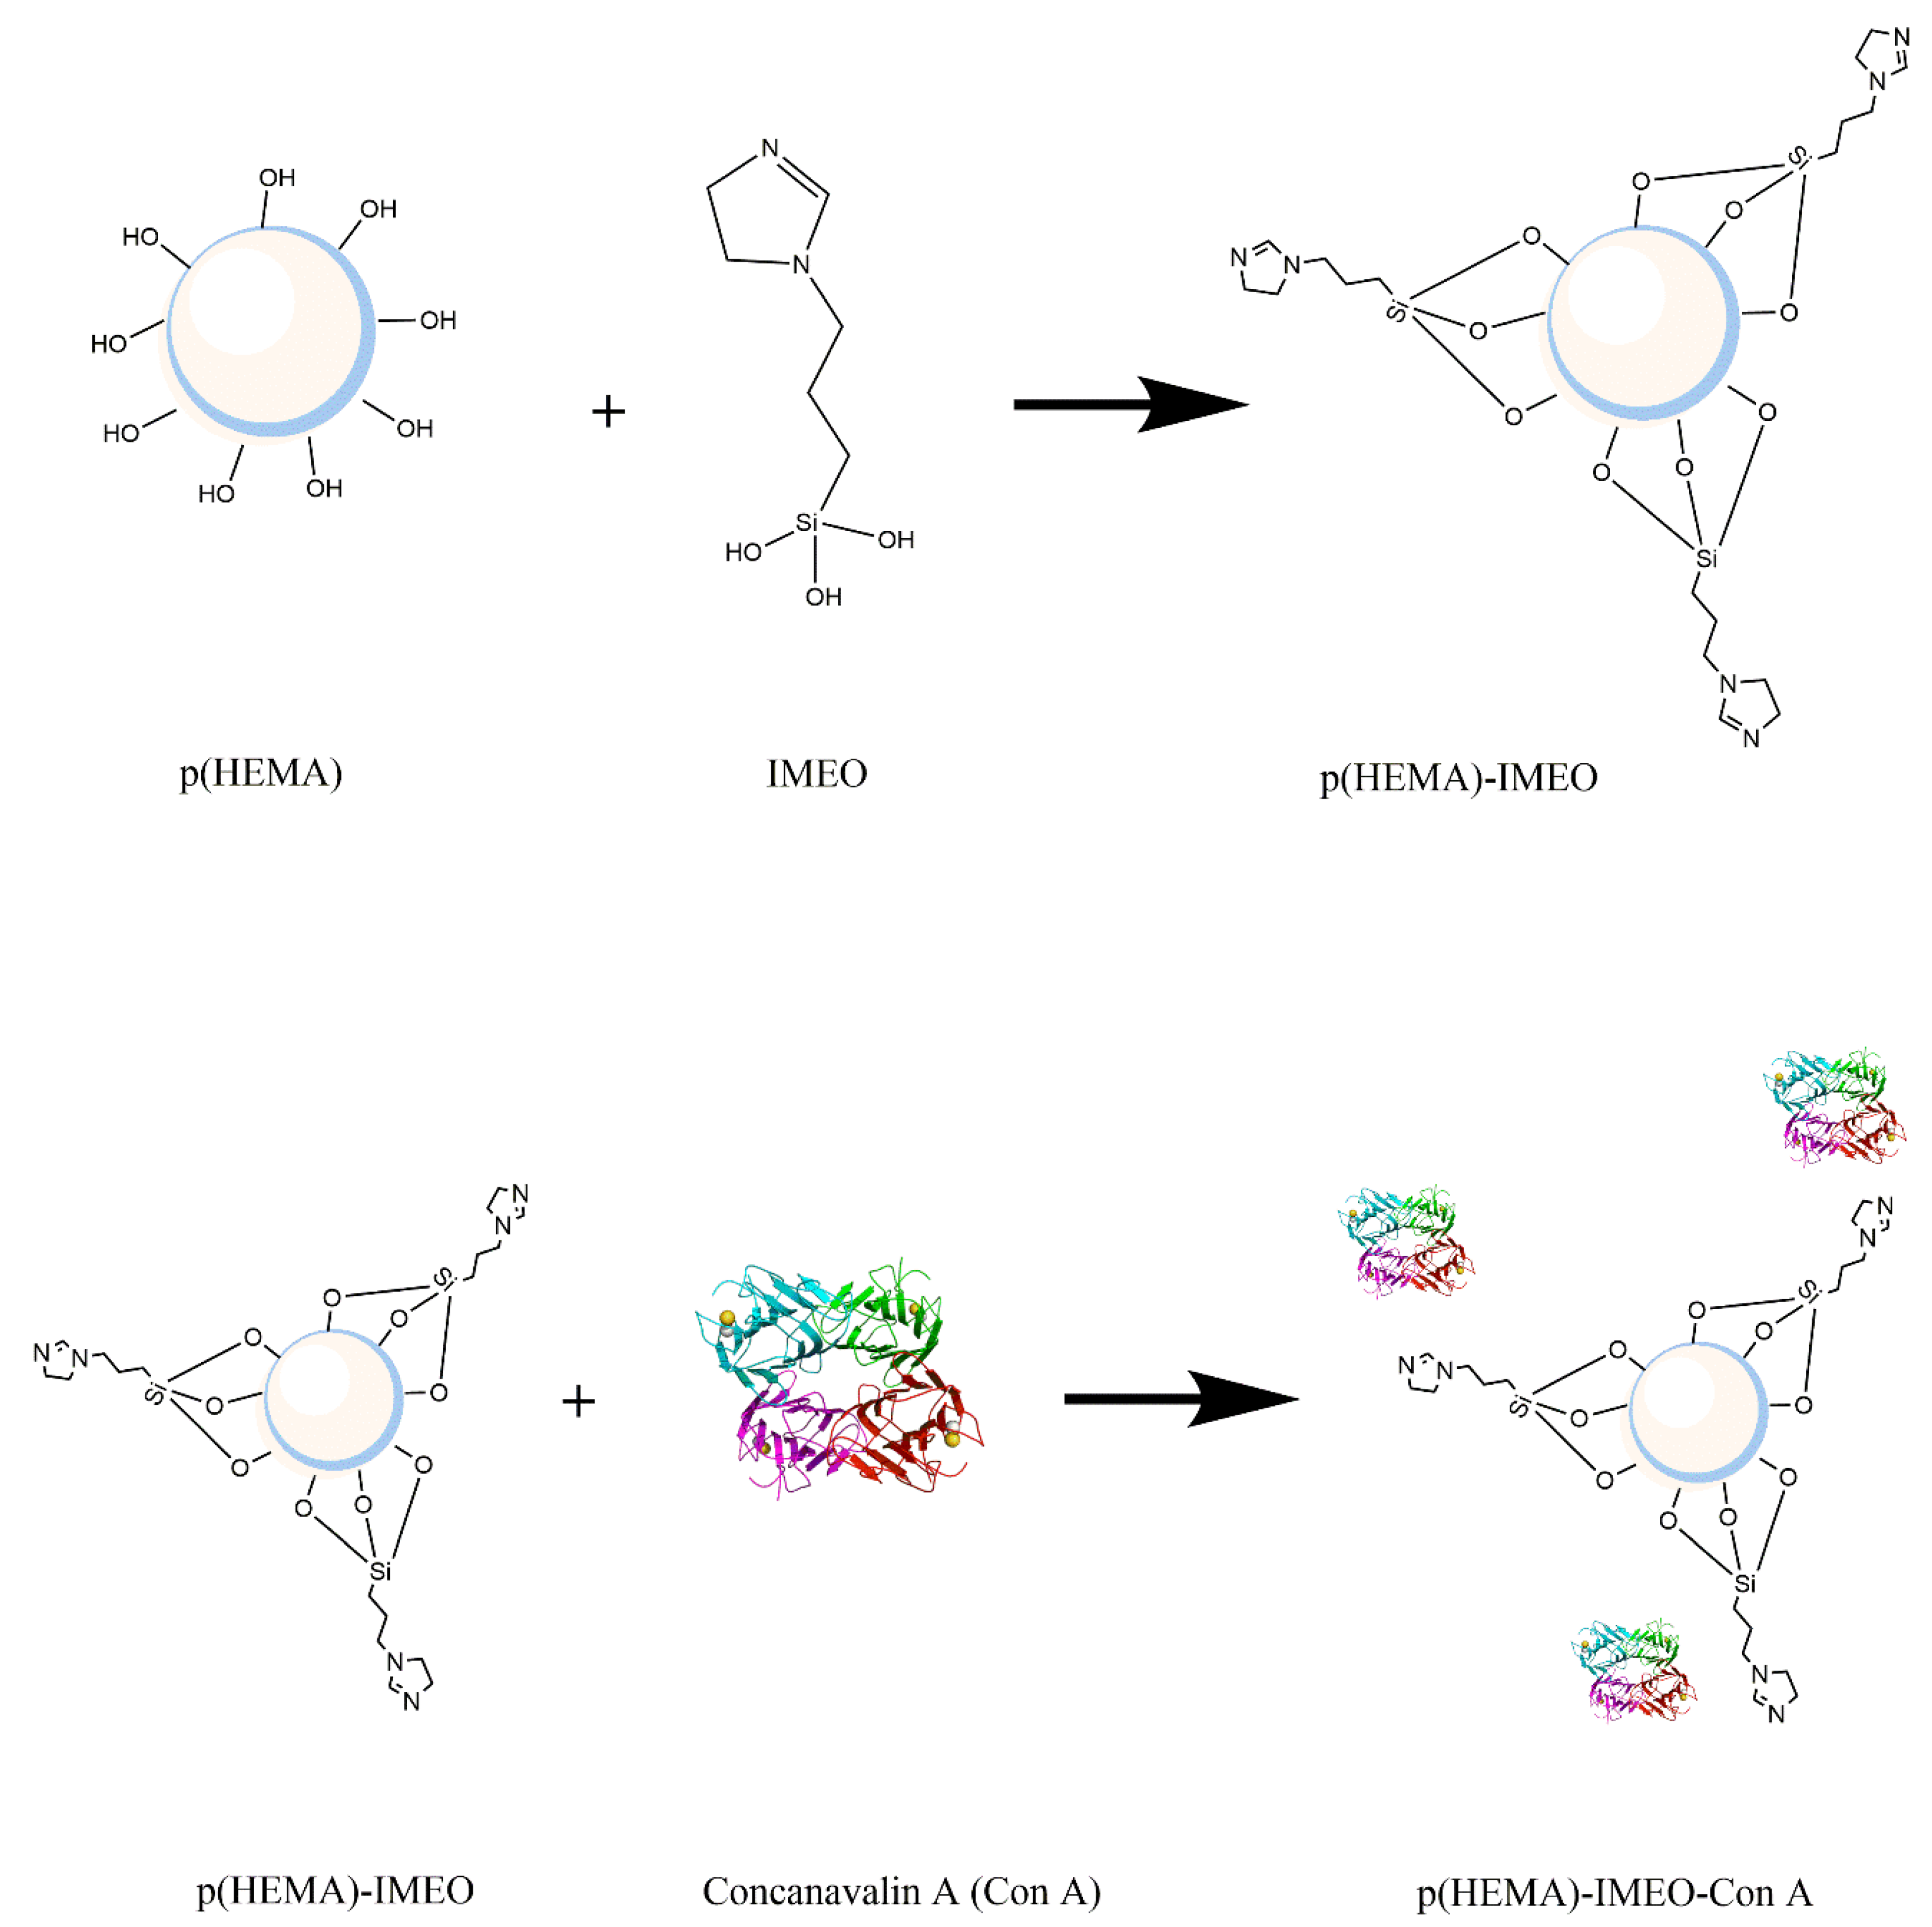
26]. IMEO binds to the hydroxyl ends of p(HEMA) polymer to form p(HEMA)-IMEO modification with silane ends out. Then, washing processes were carried out with ethanol and water for 5 times.
Derivation of the prepared p(HEMA)-IMEO nanopolymers with lectin affinity chromatography ligand ConA was performed to make MUC1 specific. For this purpose, ConA would be covalently bonded to the nanopolymer surface via amino groups of IMEO.
Figure 1 shows the synthesis of p(HEMA)-IMEO-ConA with the interaction between p(HEMA) and IMEO, then p(HEMA)-IMEO and ConA lectin.
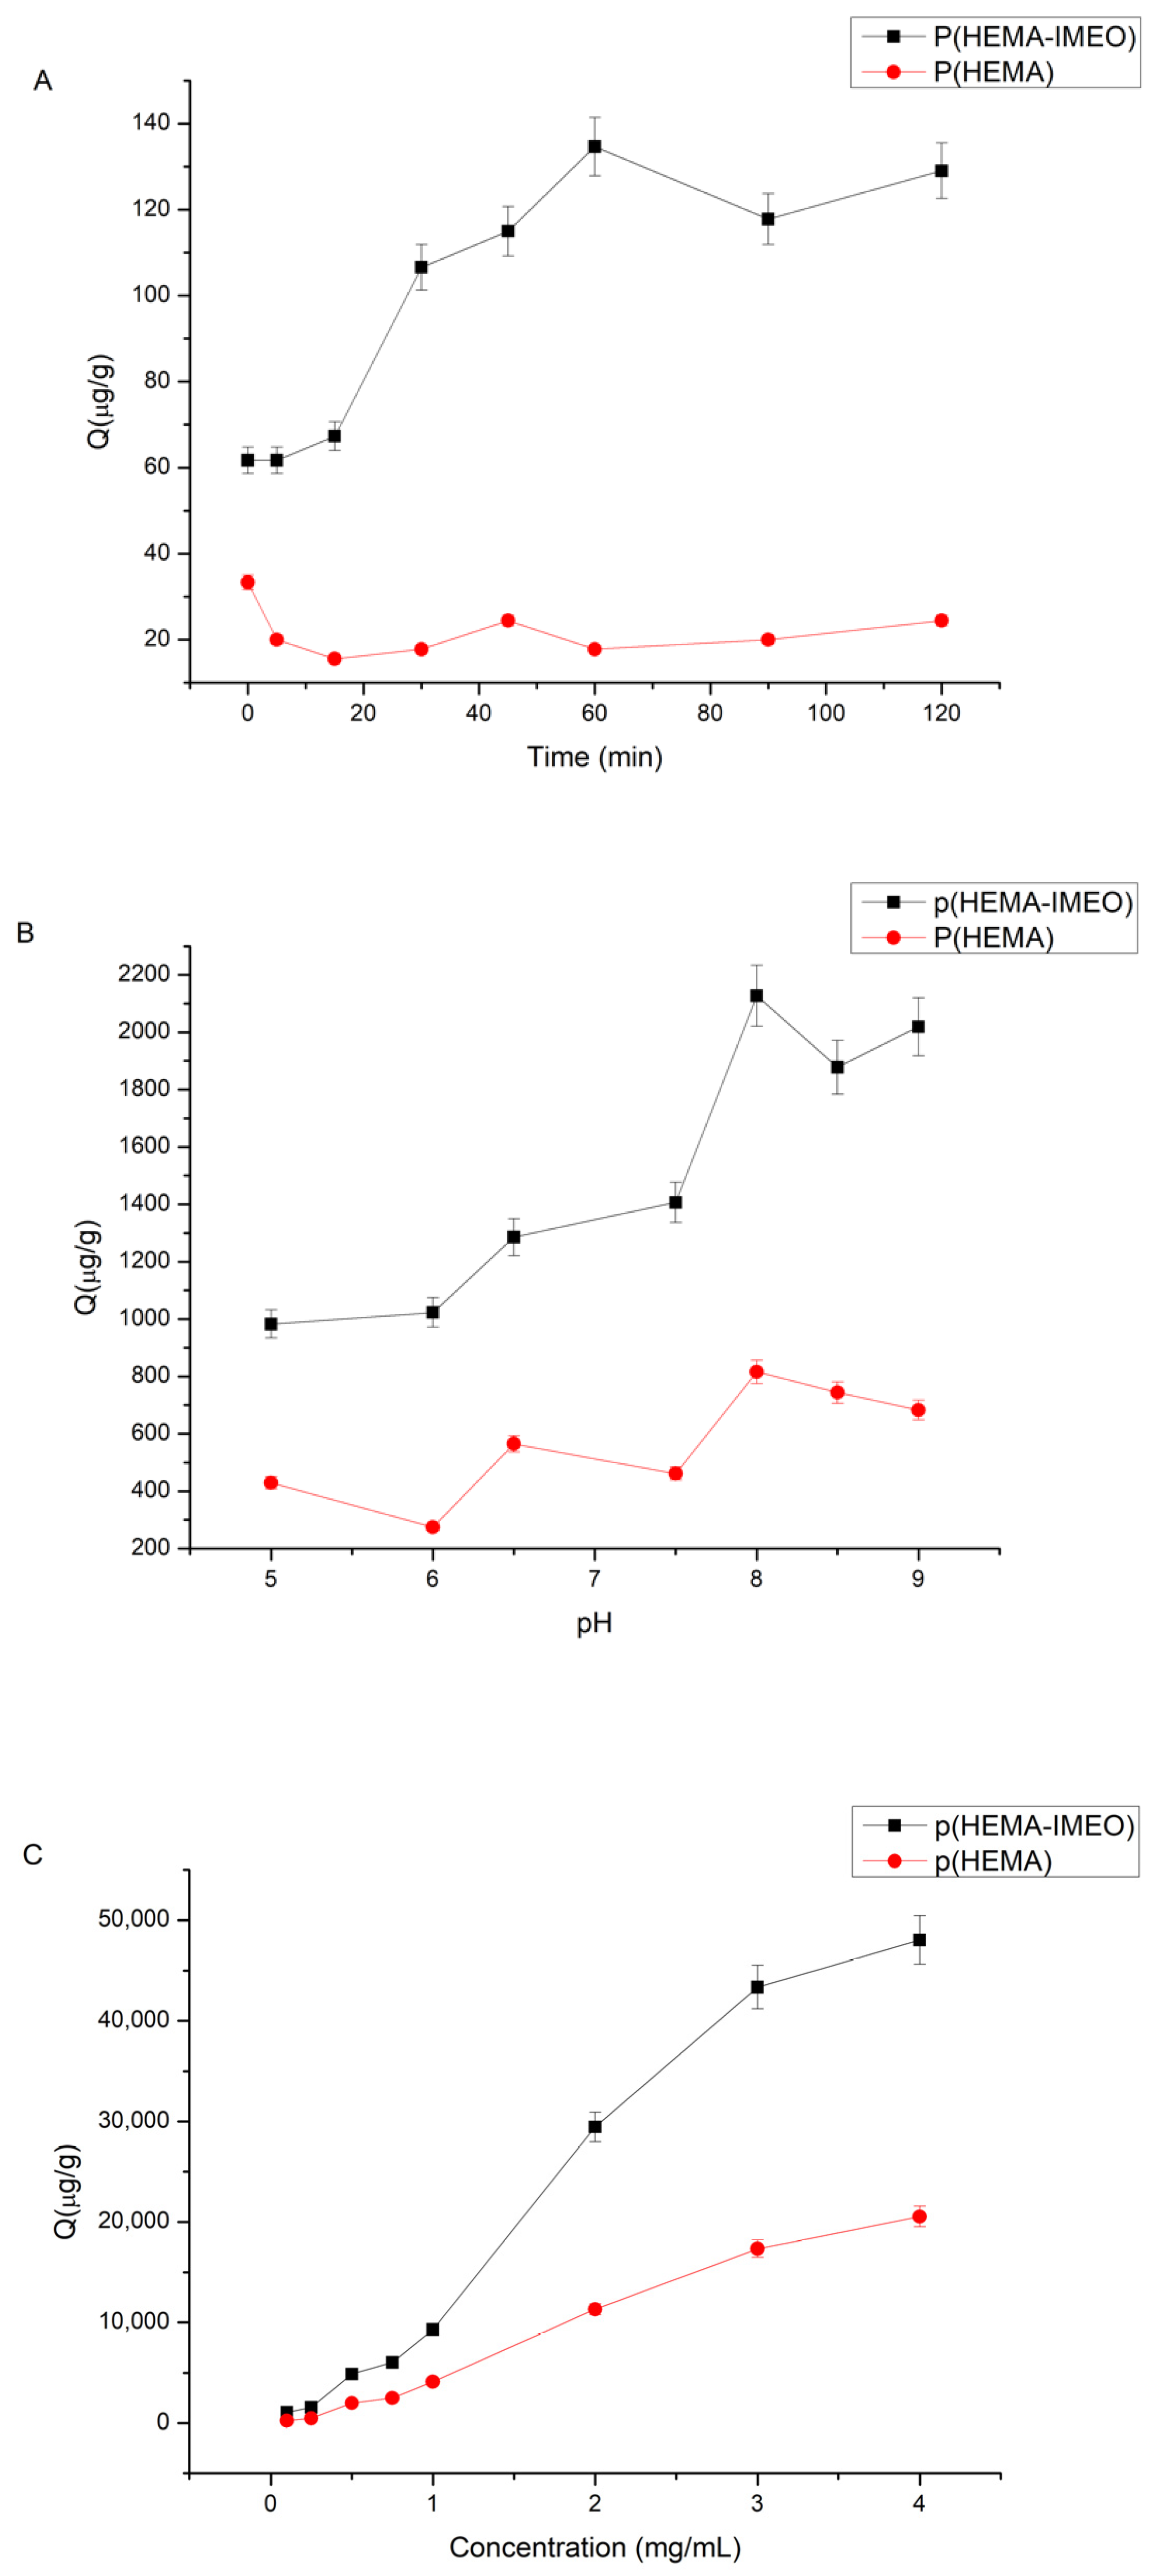
An optimization study was performed on time, pH and concentration parameters to determine ConA binding conditions. A stock solution of 0.1 mg/mL ConA (water-soluble sample diluted in 0.1 M pH 7.5 buffer) was prepared. For time effect on ConA binding, 0–120 min was tested. For pH effect on ConA binding pH 4–9 acetate, phosphate and borate buffers were used. For concentration effect on ConA binding 0.1–5 mg/mL concentration of ConA solutions were used to determine optimum concentration of ConA. Then, 100 µL of polymer, 400 µL of ConA solution in determined pH buffer were taken and mixed. Then, the supernatants were read at 280 nm after centrifugation at 14,500 rpm for 35–40 min to determine the optimum parameters for ConA binding to the p(HEMA)-IMEO polymer.
2.2.2. Characterization of Nanopolymers
Characterization of our nanopolymers were performed with Scanning Electron Microscope (SEM), X-ray Photoelectron Spectroscopy (XPS), Atomic Force Microscopy (AFM), Fourier Transform Infrared Spectroscopy (FTIR), Zeta size and potential analysis, surface area calculations. Sensor surface was characterized due to ellipsometer and surface angle analysis.
In the sample preparation stage for SEM analysis, a 1:100 (v/v) diluted solution of nanopolymers was distributed over the surface of the coverslip and dried in the oven. SEM analysis of nanopolymers was performed using scanning electron microscopy (Carl Zeiss 300 VP, İzmir Katip Çelebi University Central Research Laboratories Application and Research Center, Izmir, Turkey).
For the XPS analysis, nanopolymers were precipitated at the sample preparation stage and dried in the oven after removing the upper phase. XPS analyses of nanopolymers were performed using Angle Resolution X-ray Photoelectron Spectrometry (Thermo Scientific K-Alpha, Ege University Central Research Test and Analysis Laboratory Application and Research Center, Izmir, Turkey). The applied parameters are as follows: X-ray source: Al K-Alpha Monochromatic (1486.68 eV), X-ray spot size: 200 μm, Sampling Area: 60 × 60 mm, Analyzer: 180° half-spherical analyzer-128 channel detector, Energy: 30 eV, Number of scans: 3, ARXPS angle 15°.
For the AFM analysis, the dilution solution of 1:100 ratio (v/v) of the nanopolymers was distributed to the surface of the coverslip and dried in the oven. AFM analyses of nanopolymers were performed using Atomic Force Microscopy (BRUKER Dimension Edge with ScanAsyst, Ege University Central Research Test and Analysis Laboratory Application and Research Center, Izmir, Turkey).
For the FTIR (Fourier Transform Infrared Spectrophotometer) measurements of nanopolymers, they were dried in the oven during the sample preparation phase. Dried nanopolymers (2 mg) for the FTIR-ATR spectrum were tested in the range of 450–4000cm−1 wave number. FTIR analysis of nanopolymers was performed using Fourier Transform Infrared Spectroscopy (Perkin Elmer/Spectrum Two, Ege University Institute of Nuclear Sciences, Izmir, Turkey).
The zeta size and zeta potential analyses of the synthesized p(HEMA) and p(HEMA)-IMEO and p(HEMA)-IMEO-ConA nanopolymers were performed with Nano Zetasizer (NanoZS, Malvern Instruments, Ege University Institute of Nuclear Sciences, Izmir, Turkey). For zeta size and zeta potential analysis, samples were read by diluting 1:100 (v/v) with distilled water.
The following equation was used to determine the surface area of synthesized p(HEMA)–IMEO-ConA nanoparticles, giving the number of particles in the 1 mL suspension [
27].
where N is the number of nanoparticles in the 1 mL suspension; S, % solids; d, diameter (μm); ρ
s is the polymer density (g/mL).
The amount of mg nanoparticle in the mL suspension was theoretically determined using the standard mass-volume plot of the nanoparticles. The specific surface area of the synthesized p(HEMA)-IMEO-ConA nanoparticles was calculated in m
2/g using the equilibrium surface area equation.
(π, 3.14; r, nanoparticle radius (m)).
For the analysis of the nanobiosensor surface, nanopolymers to be used as bioactive layer during the sample preparation phase were dropped in different volumes on a silicon substrate cleaned in oxygen plasma for 5 min. The surface was dried in a fume hood and analysis was performed. Ellipsometer analyzes were carried out using the Ellipsometer device (Gartner, Erciyes University, Nanotechnology Application and Research Center (ERNAM), Kayseri, Turkey).
For the analysis of the nanobiosensor surface, nanopolymers to be used as a bioactive layer in the sample preparation phase were dropped on a coverslip and dried in the oven. Contact Angle analyzes (Attension Theta, Izmir Katip Çelebi University Central Research Laboratories Application and Research Center, Izmir, Turkey) were performed.
2.2.3. Sensor Studies
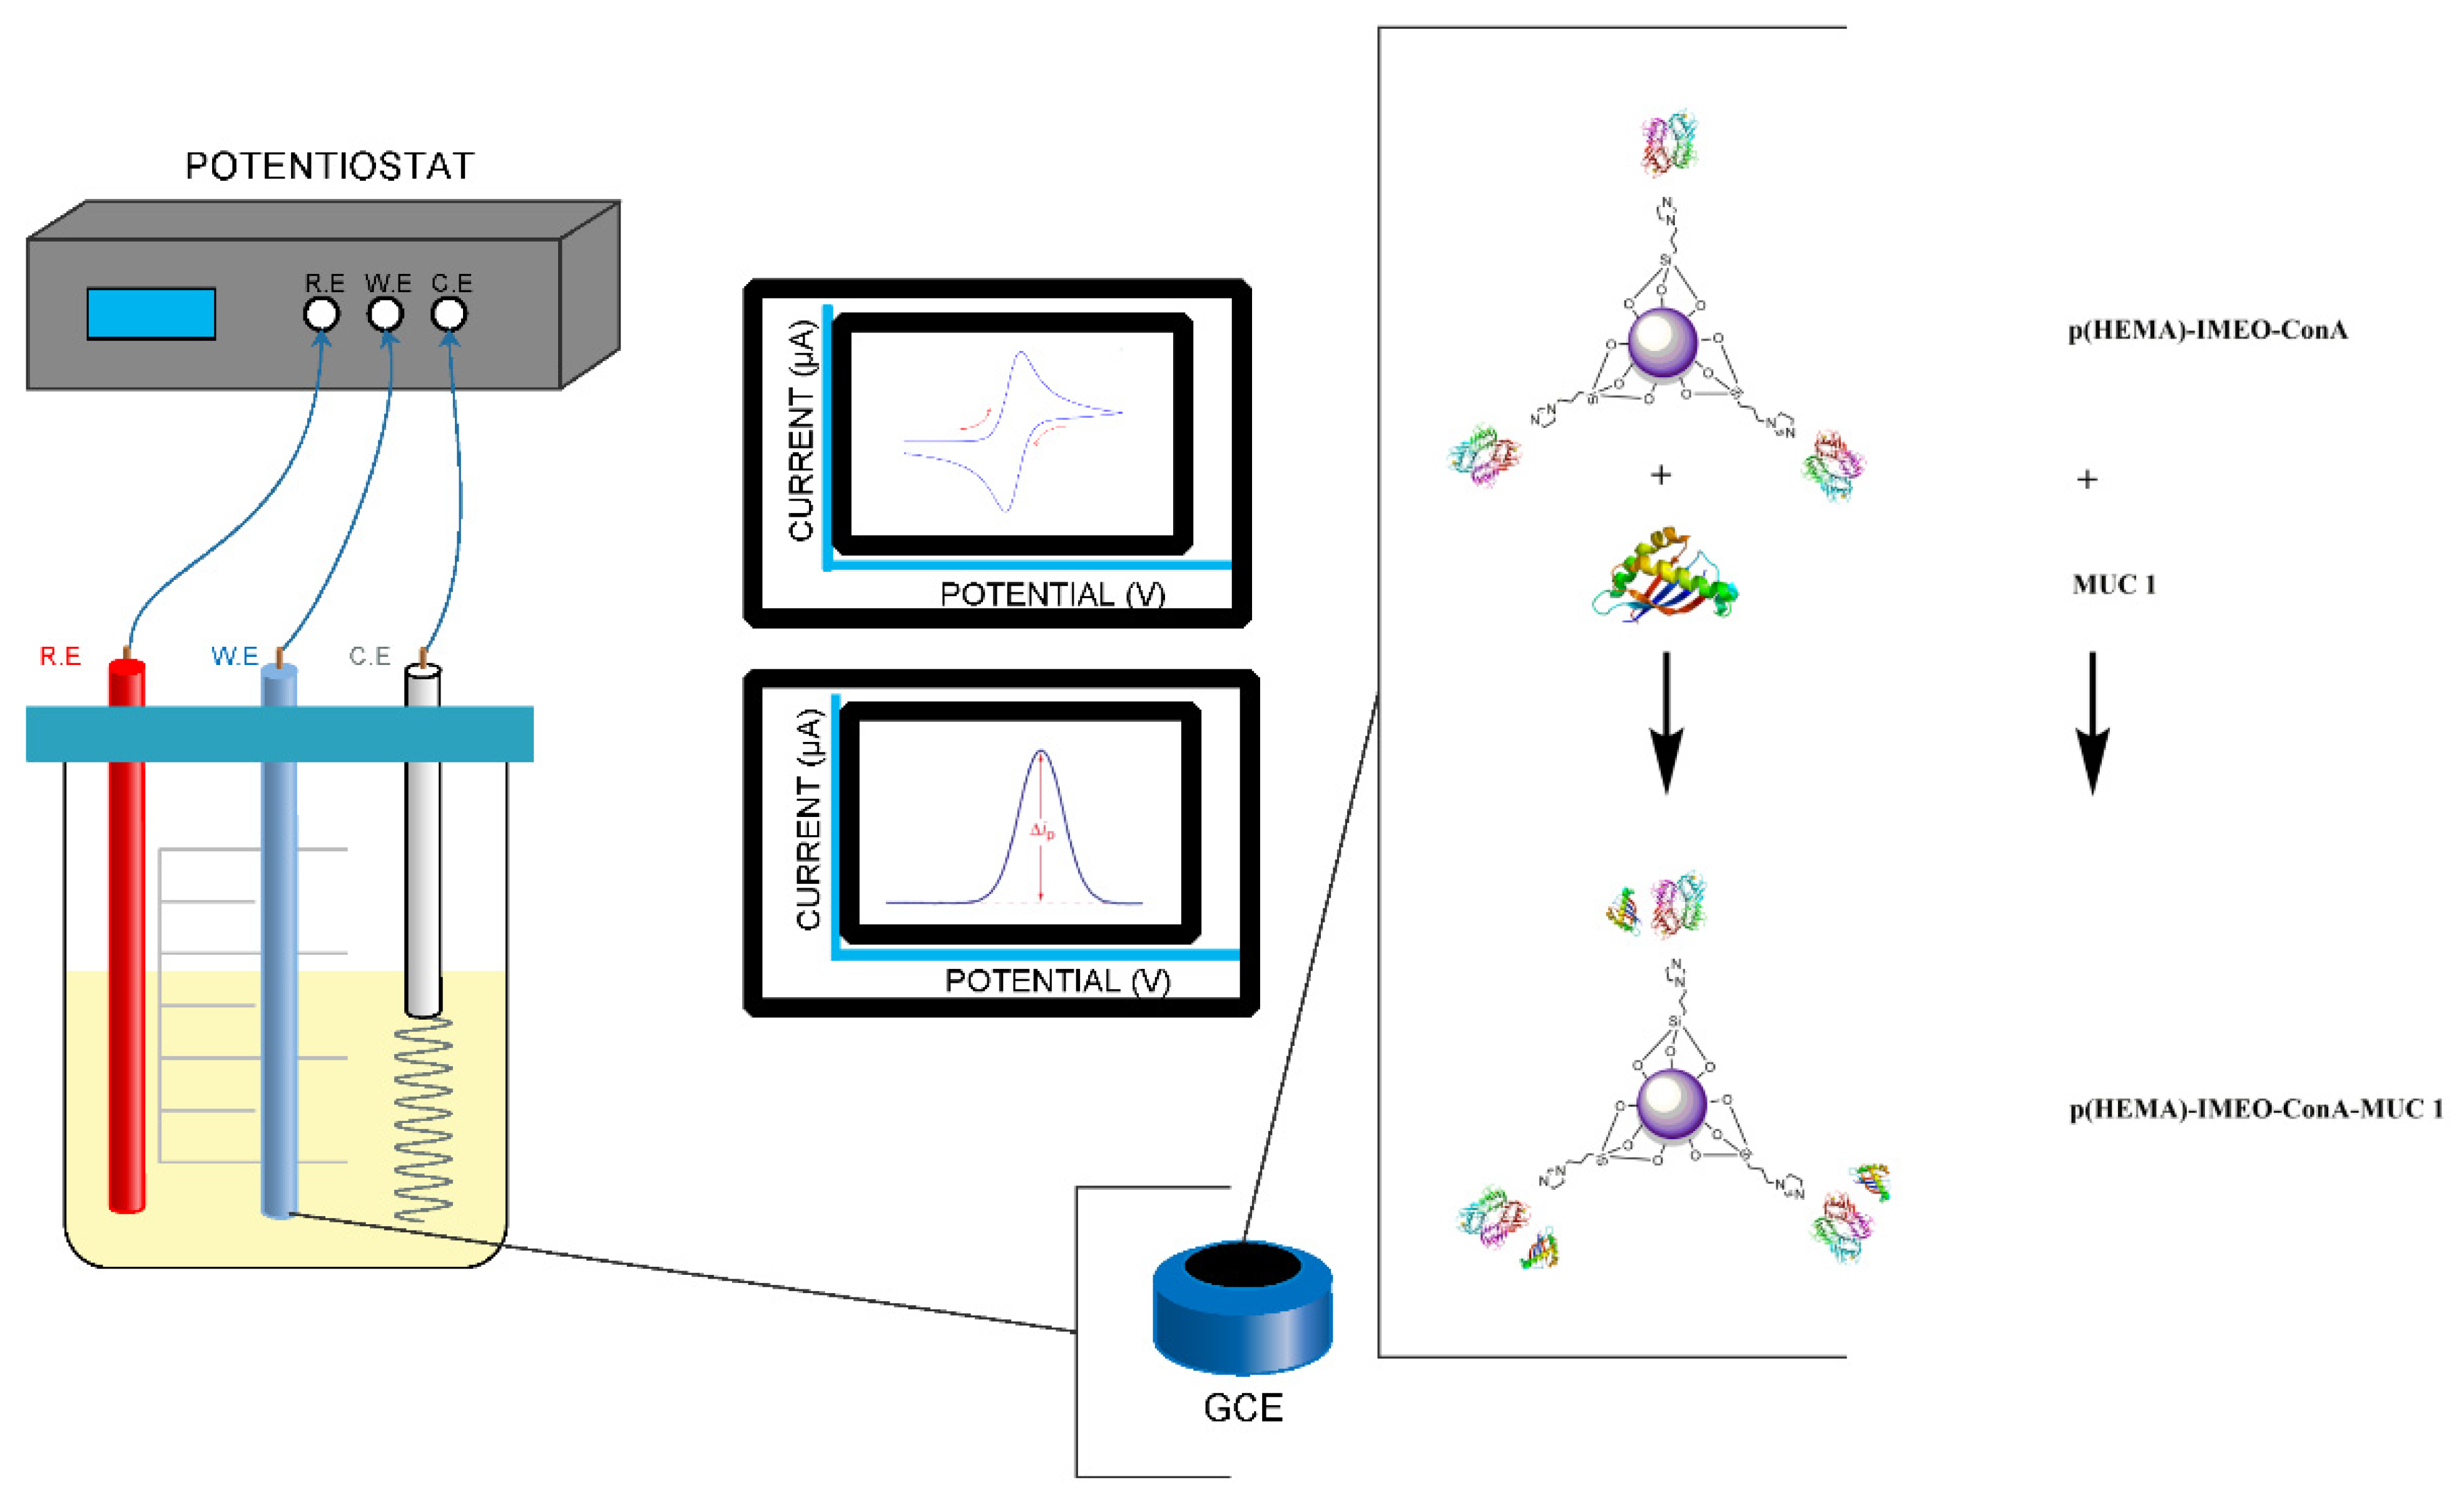
Our developed nanopolymeric material p(HEMA)-IMEO-ConA were used as a biological active surface of the biosensor’s electrode. In
Figure 2, recognition strategy of our nanomaterial-based biosensor was exhibited. Developed MUC1 specific p(HEMA)-IMEO-ConA nanopolymer was dropped onto electrode surface. Then, the sample that including MUC1 was dropped onto the polymer coated electrode. In each step, electrochemical measurements were performed.
Measurements were taken with differential pulse voltammetry (DPV) and cyclic voltammetry (CV) methods with PalmSens Potensiotat. DPV conditions were used as −0.4 between 0.6 V with 0.05 V/s scan rate. Additionally, CV conditions were used as −0.4 between 0.4 V with 0.05 V/s scan rate. We used 50 mM ferri-ferro solution as the electrolyte. In CV measurements, the decrease in the anodic potential and the increase in the cathodic potential are associated with the decrease of surface conductivity. As the thickness of the material deposited on the surface increases, the current decreases [
28]. According to the DPV graph, when the nanopolymer is coated on the electrode surface, the difference on current value obtained as a result of the analysis can be interpreted that the surface is covered.
2.2.4. Sensor Optimization Studies
Sensor optimization studies were performed with respect to parameters that effect MUC1 binding to the electrode. Measurements are taken by differential pulse voltammetry (DPV) and cyclic voltammetry (CV). General procedures for sensor studies were as follows:
Electrode cleaning (3–5 min with Alumina pasta);
Bare electrode was measured;
Determined amount of p(HEMA)-IMEO-ConA nanopolymer was dropped onto electrode surface and incubated until dry;
Washing was completed in ultrapure water slightly;
Electrode with nanopolymer was measured;
Determined amount of MUC1 was dropped onto p(HEMA)-IMEO-ConA binded electrode’s surface and waited in determined time;
Washing was done in ultrapure water slightly;
Electrode with nanopolymer + MUC1 was measured;
Differences between current were calculated and graphed.
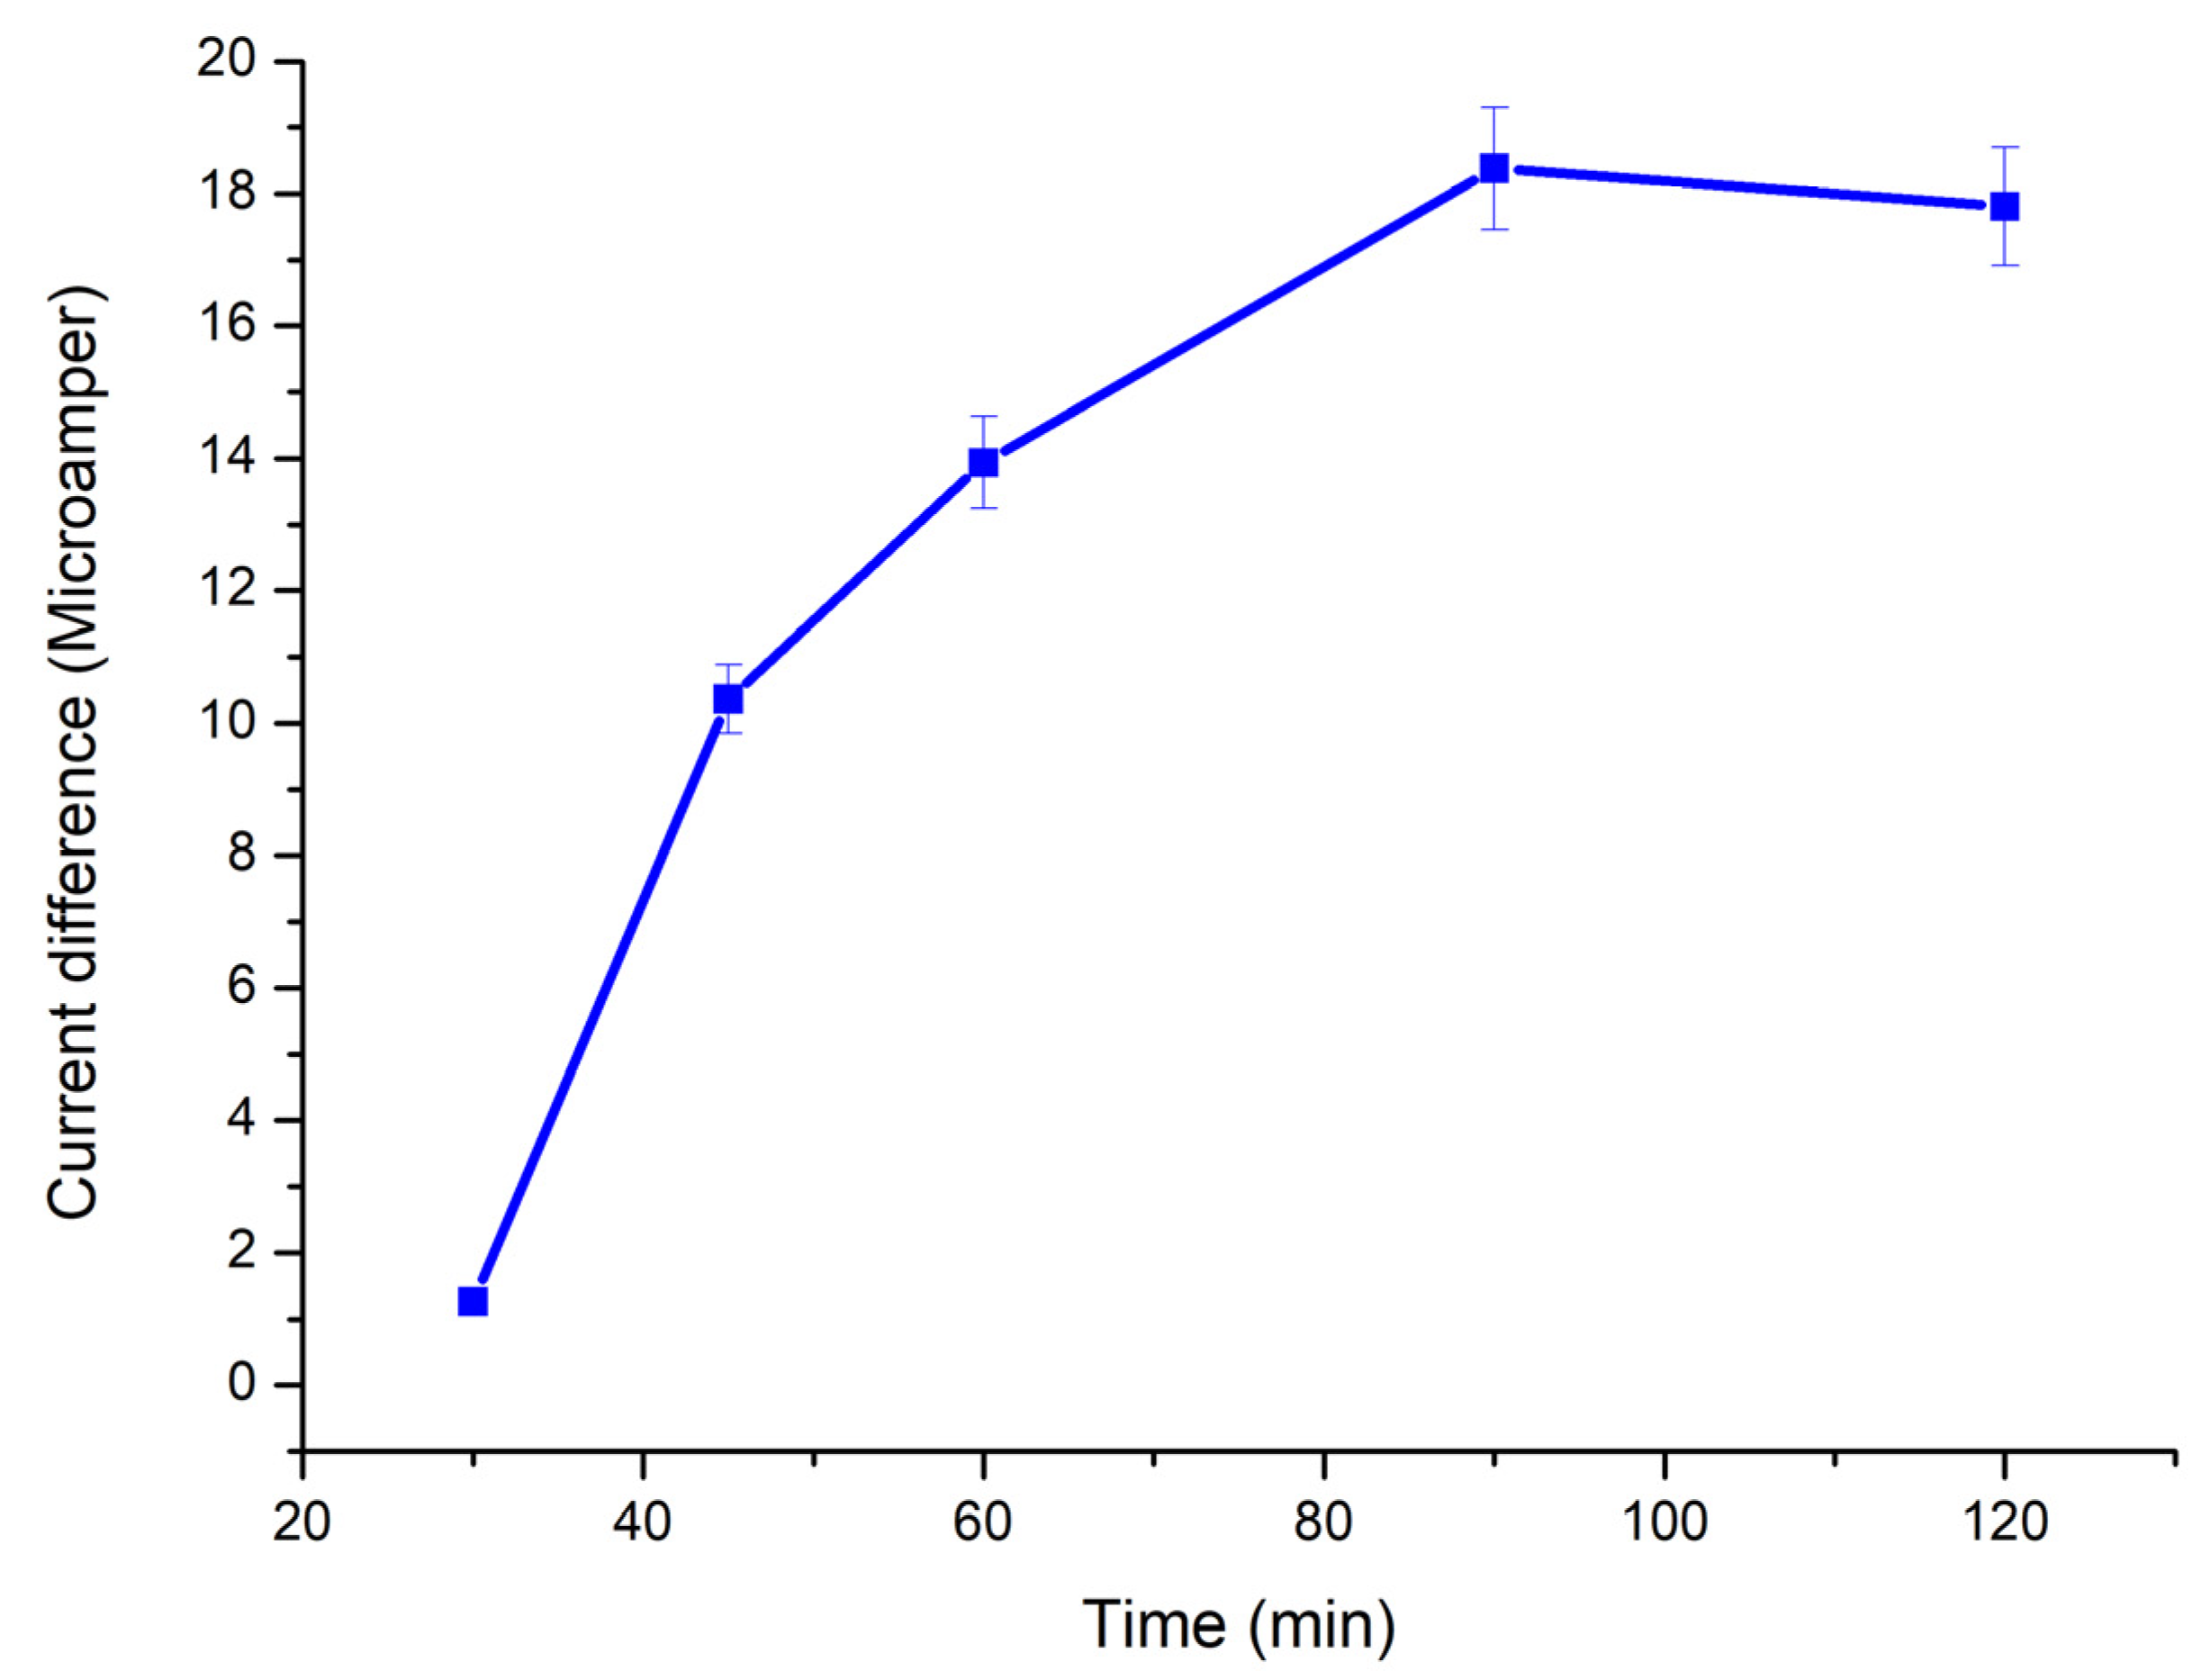
2.2.5. Polymer-Electrode Binding Time
For polymer-electrode binding time parameter, p(HEMA)-IMEO-ConA nanopolymer was dropped onto the electrode’s surface and incubated for 30–45–60–90–120 min. Then measurements were performed.
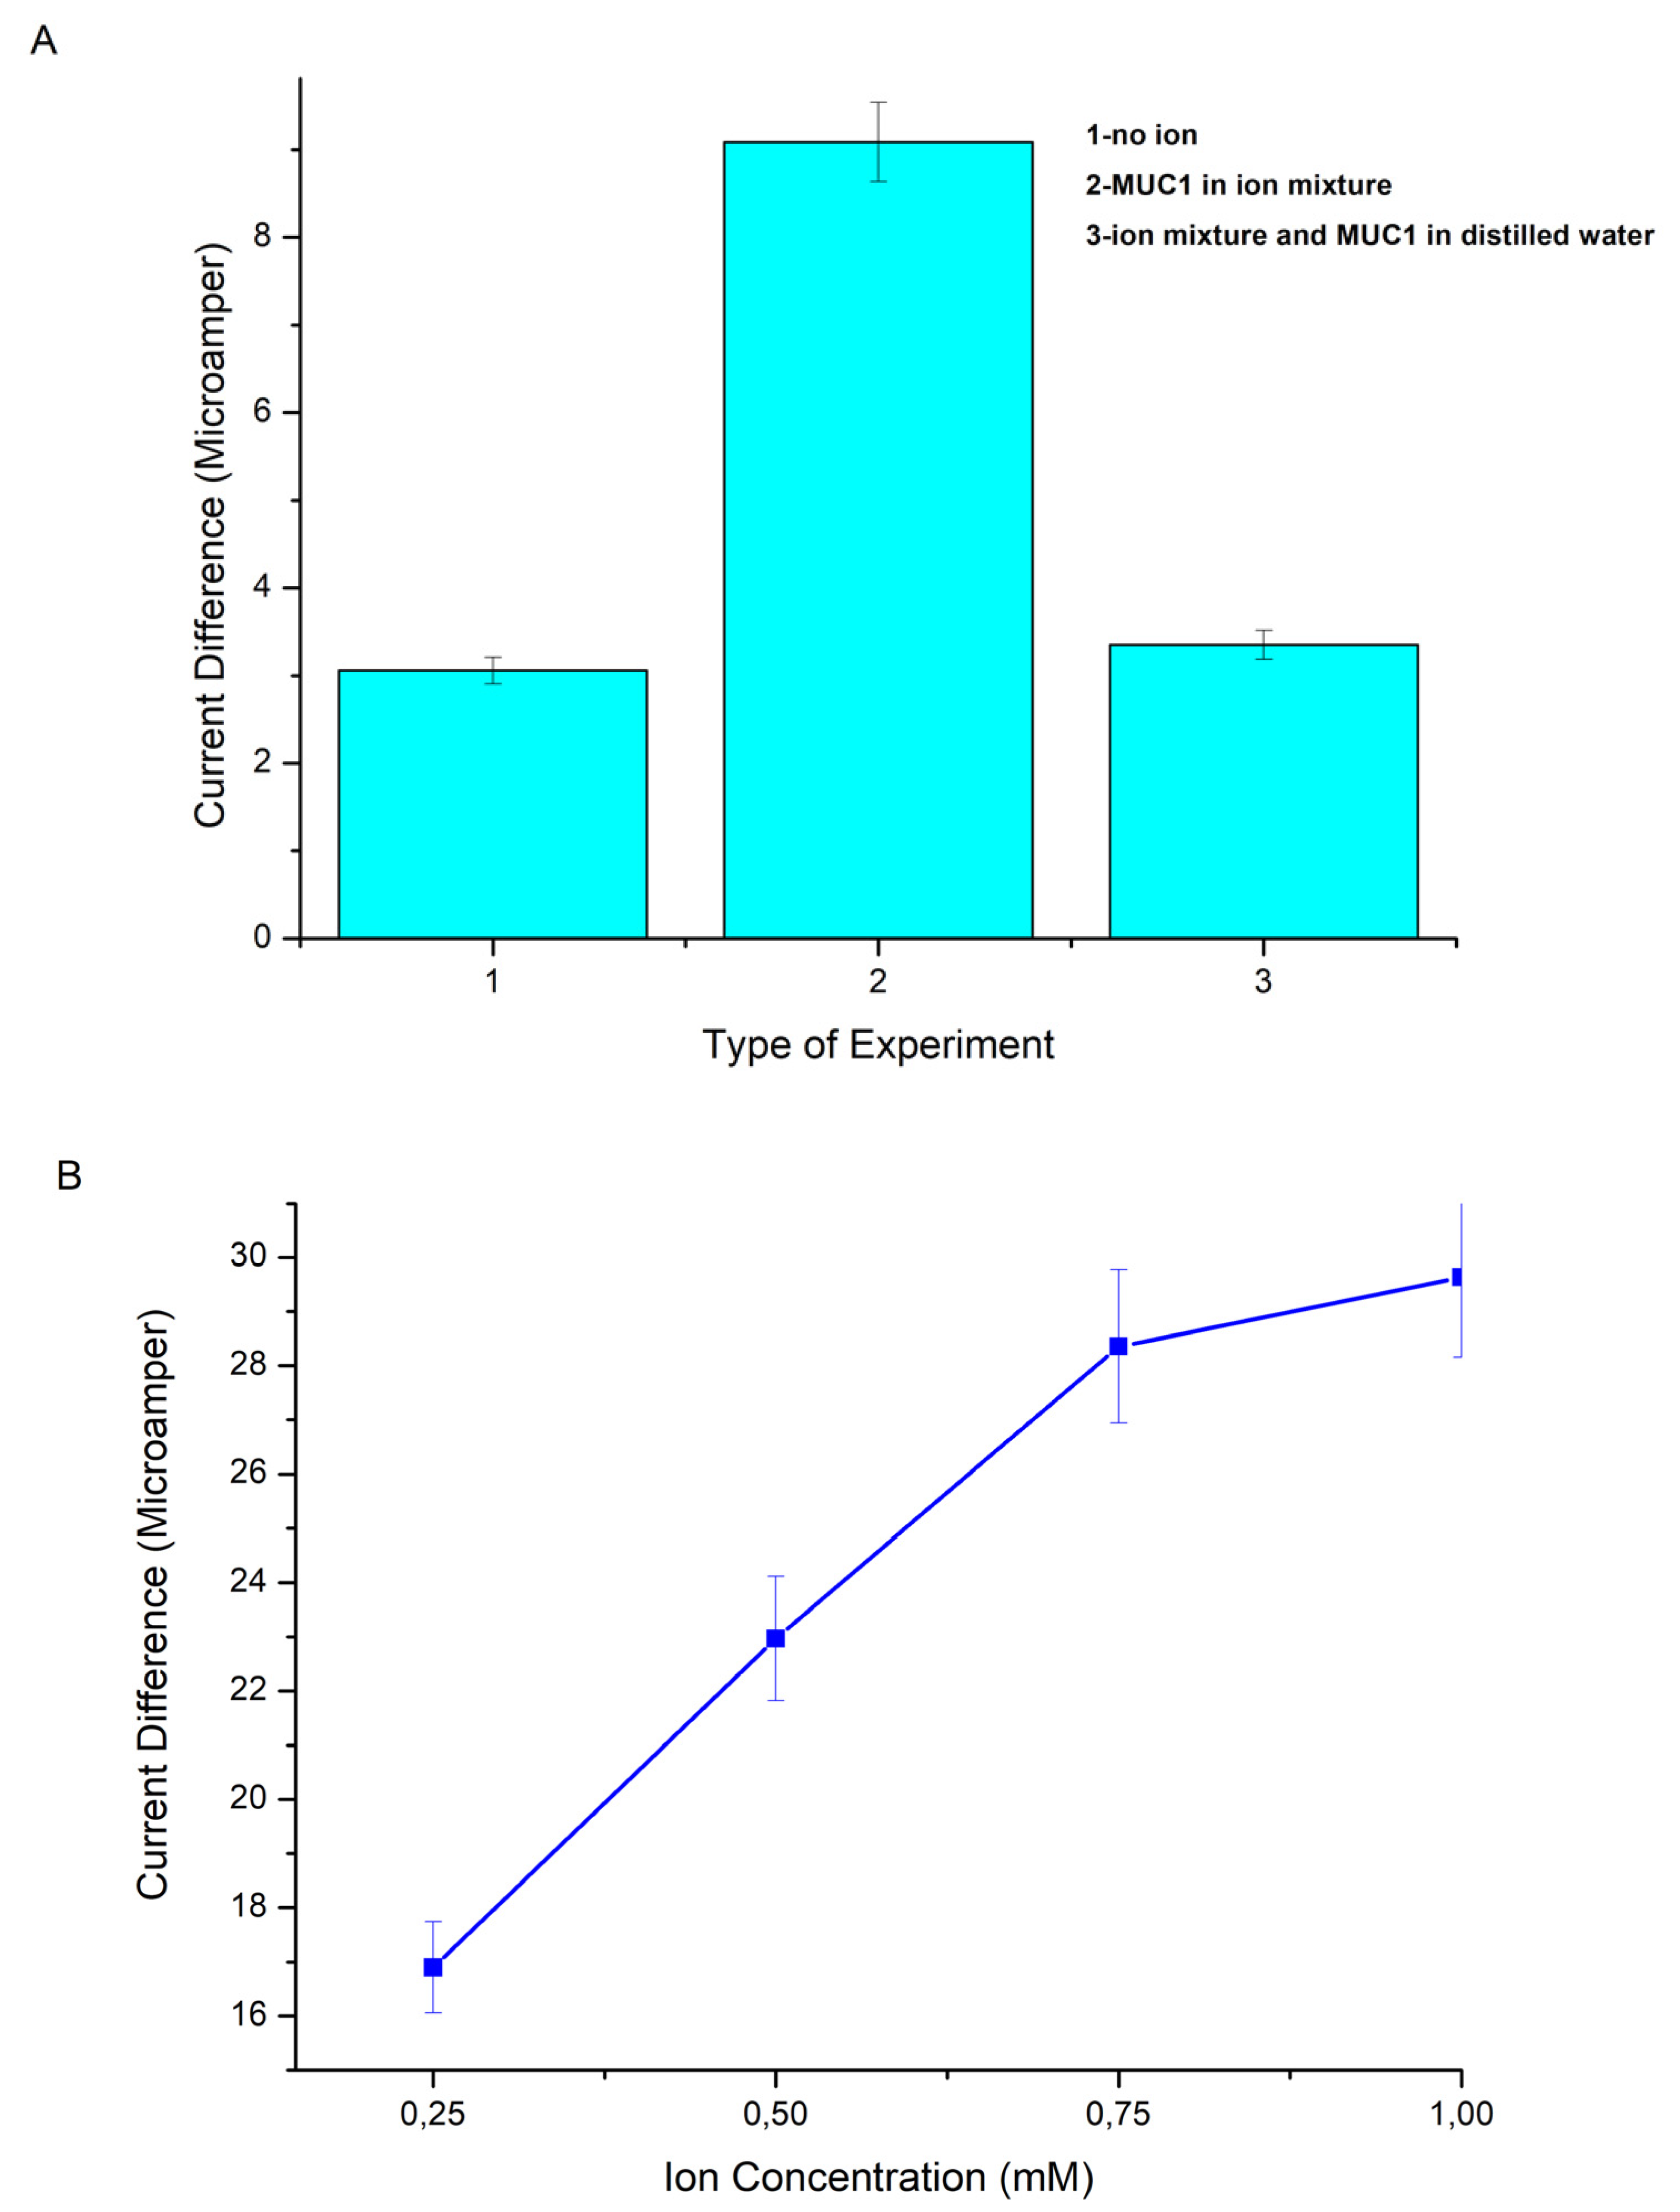
2.2.6. Ion Effect on MUC1 Binding
Since ConA lectin, which is located at the endpoints of p(HEMA)-IMEO-ConA nanopolymer, is metalloprotein, it is thought that binding will be more effective by affecting the presence of ions during the binding to sugar groups on MUC1 [
29,
30]. Therefore, the effect of ions was investigated in 3 separate groups:
Group one: 30 U/mL MUC1 solution in ultrapure water;
Group two: 30 U/mL MUC1 was dissolved in 1 mM MnCl2 and 1 mM CaCl2 ion mixture;
Group three: 2 µL of 1 mM MnCl2 and 1 mM CaCl2 ion mixture was added to 30 U/mL MUC1 in 4 µL ultrapure water.
5 µL of each sample was dropped onto nanopolymer coated electrodes and then waited. Then measurements were performed.
2.2.7. Buffer Type Effect on MUC1 Binding
After the ion effect has been determined, to test whether there is a need for buffers to increase binding, the samples were prepared as follows;
Ultrapure water, 0.01 M phosphate-buffered saline (PBS) and 0.01 M 4-(2-hydroxyethyl)-1-piperazineethanesulfonic acid buffer (HEPES) buffer were used as pH 7.4 for ion containing buffer. A mixture of 1 mM MnCl2 and 1 mM CaCl2 ion was added to each buffer. MUC1 solutions were prepared at 10 U/mL concentration with these prepared buffers. p(HEMA)-IMEO-ConA nanopolymers were dropped onto the electrode surfaces (5 µL) and then incubated for 90 min. Then 5 µL of MUC1 solutions in different buffers were dropped onto the polymer and waited for 20 min. Measurements of each steps were done. Buffer type effect was determined due to differences in current.
2.2.8. Ion Concentration Effect on MUC1 Binding
The samples were prepared as follows. Ultrapure water was used to pH 7.4 as the ion-containing buffer type. A mixture of 0.25–0.5–0.75–1 mM MnCl2 and 1 mM CaCl2 ions were added seperately. MUC1 solutions were prepared at 10 U/mL concentration with these ions including waters. p(HEMA)-IMEO-ConA nanopolymers were dropped onto the electrode surfaces (5 µL) and then incubated for 90 min. Then 5 µL of MUC1 solutions in different buffers were dropped onto the polymer and waited for 20 min. Then measurements of each steps were done. Ion concentration effect was determined due to differences in current.
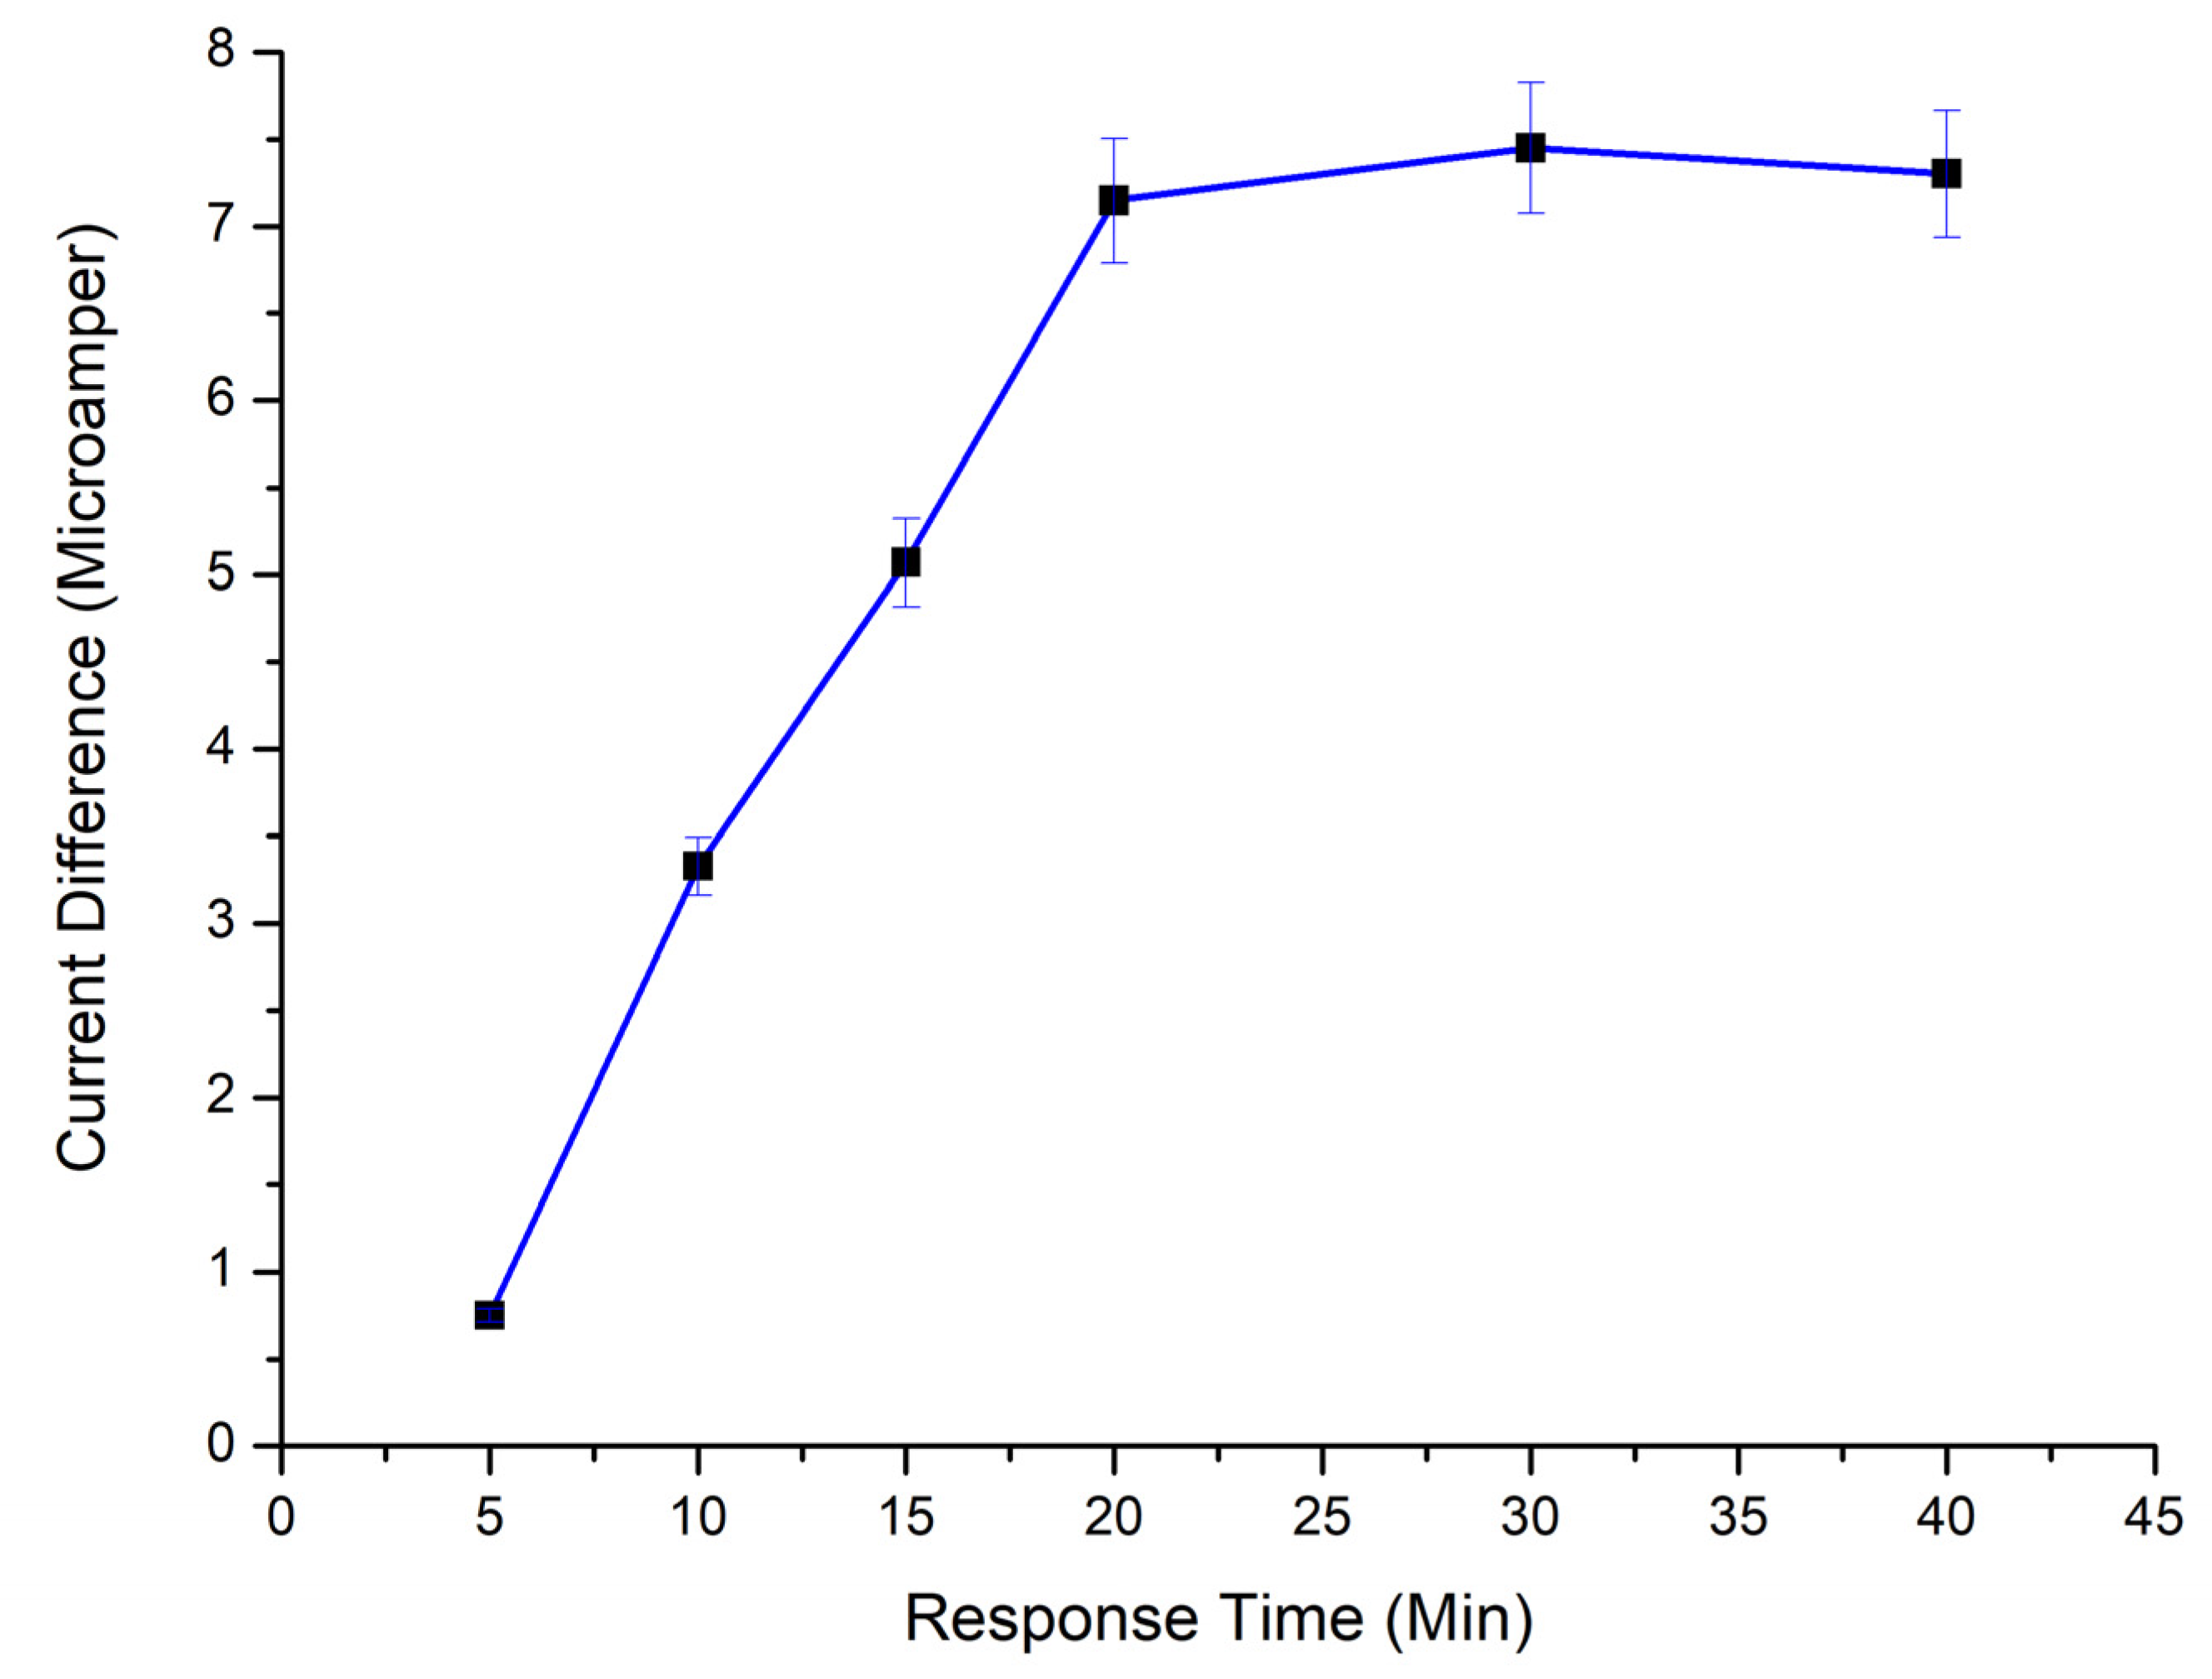
2.2.9. Time Effect on MUC1 Binding
p(HEMA)-IMEO-ConA nanopolymers were dropped onto the electrode surfaces (5 µL) and then incubated for 90 min. When 5 µL of MUC1 solutions were dropped onto sensor surfaces, samples were kept on the electrode surface for 5–10–15–20–30–40 min. Then measurements of each steps were conducted. Time effect was determined due to differences in current.
2.2.10. Nanobiosensor Characteristics and Method Validation
Nanobiosensor characteristics can be achieved by determination of several parameters and method validations. For this purpose, calibration curve, specificity, selectivity, reproducibility and storage stability determination studies were carried out. Using the prepared MUC1 calibration graph, parameters such as linearity, detection limit, determination limit, accuracy and precision parameters were calculated.
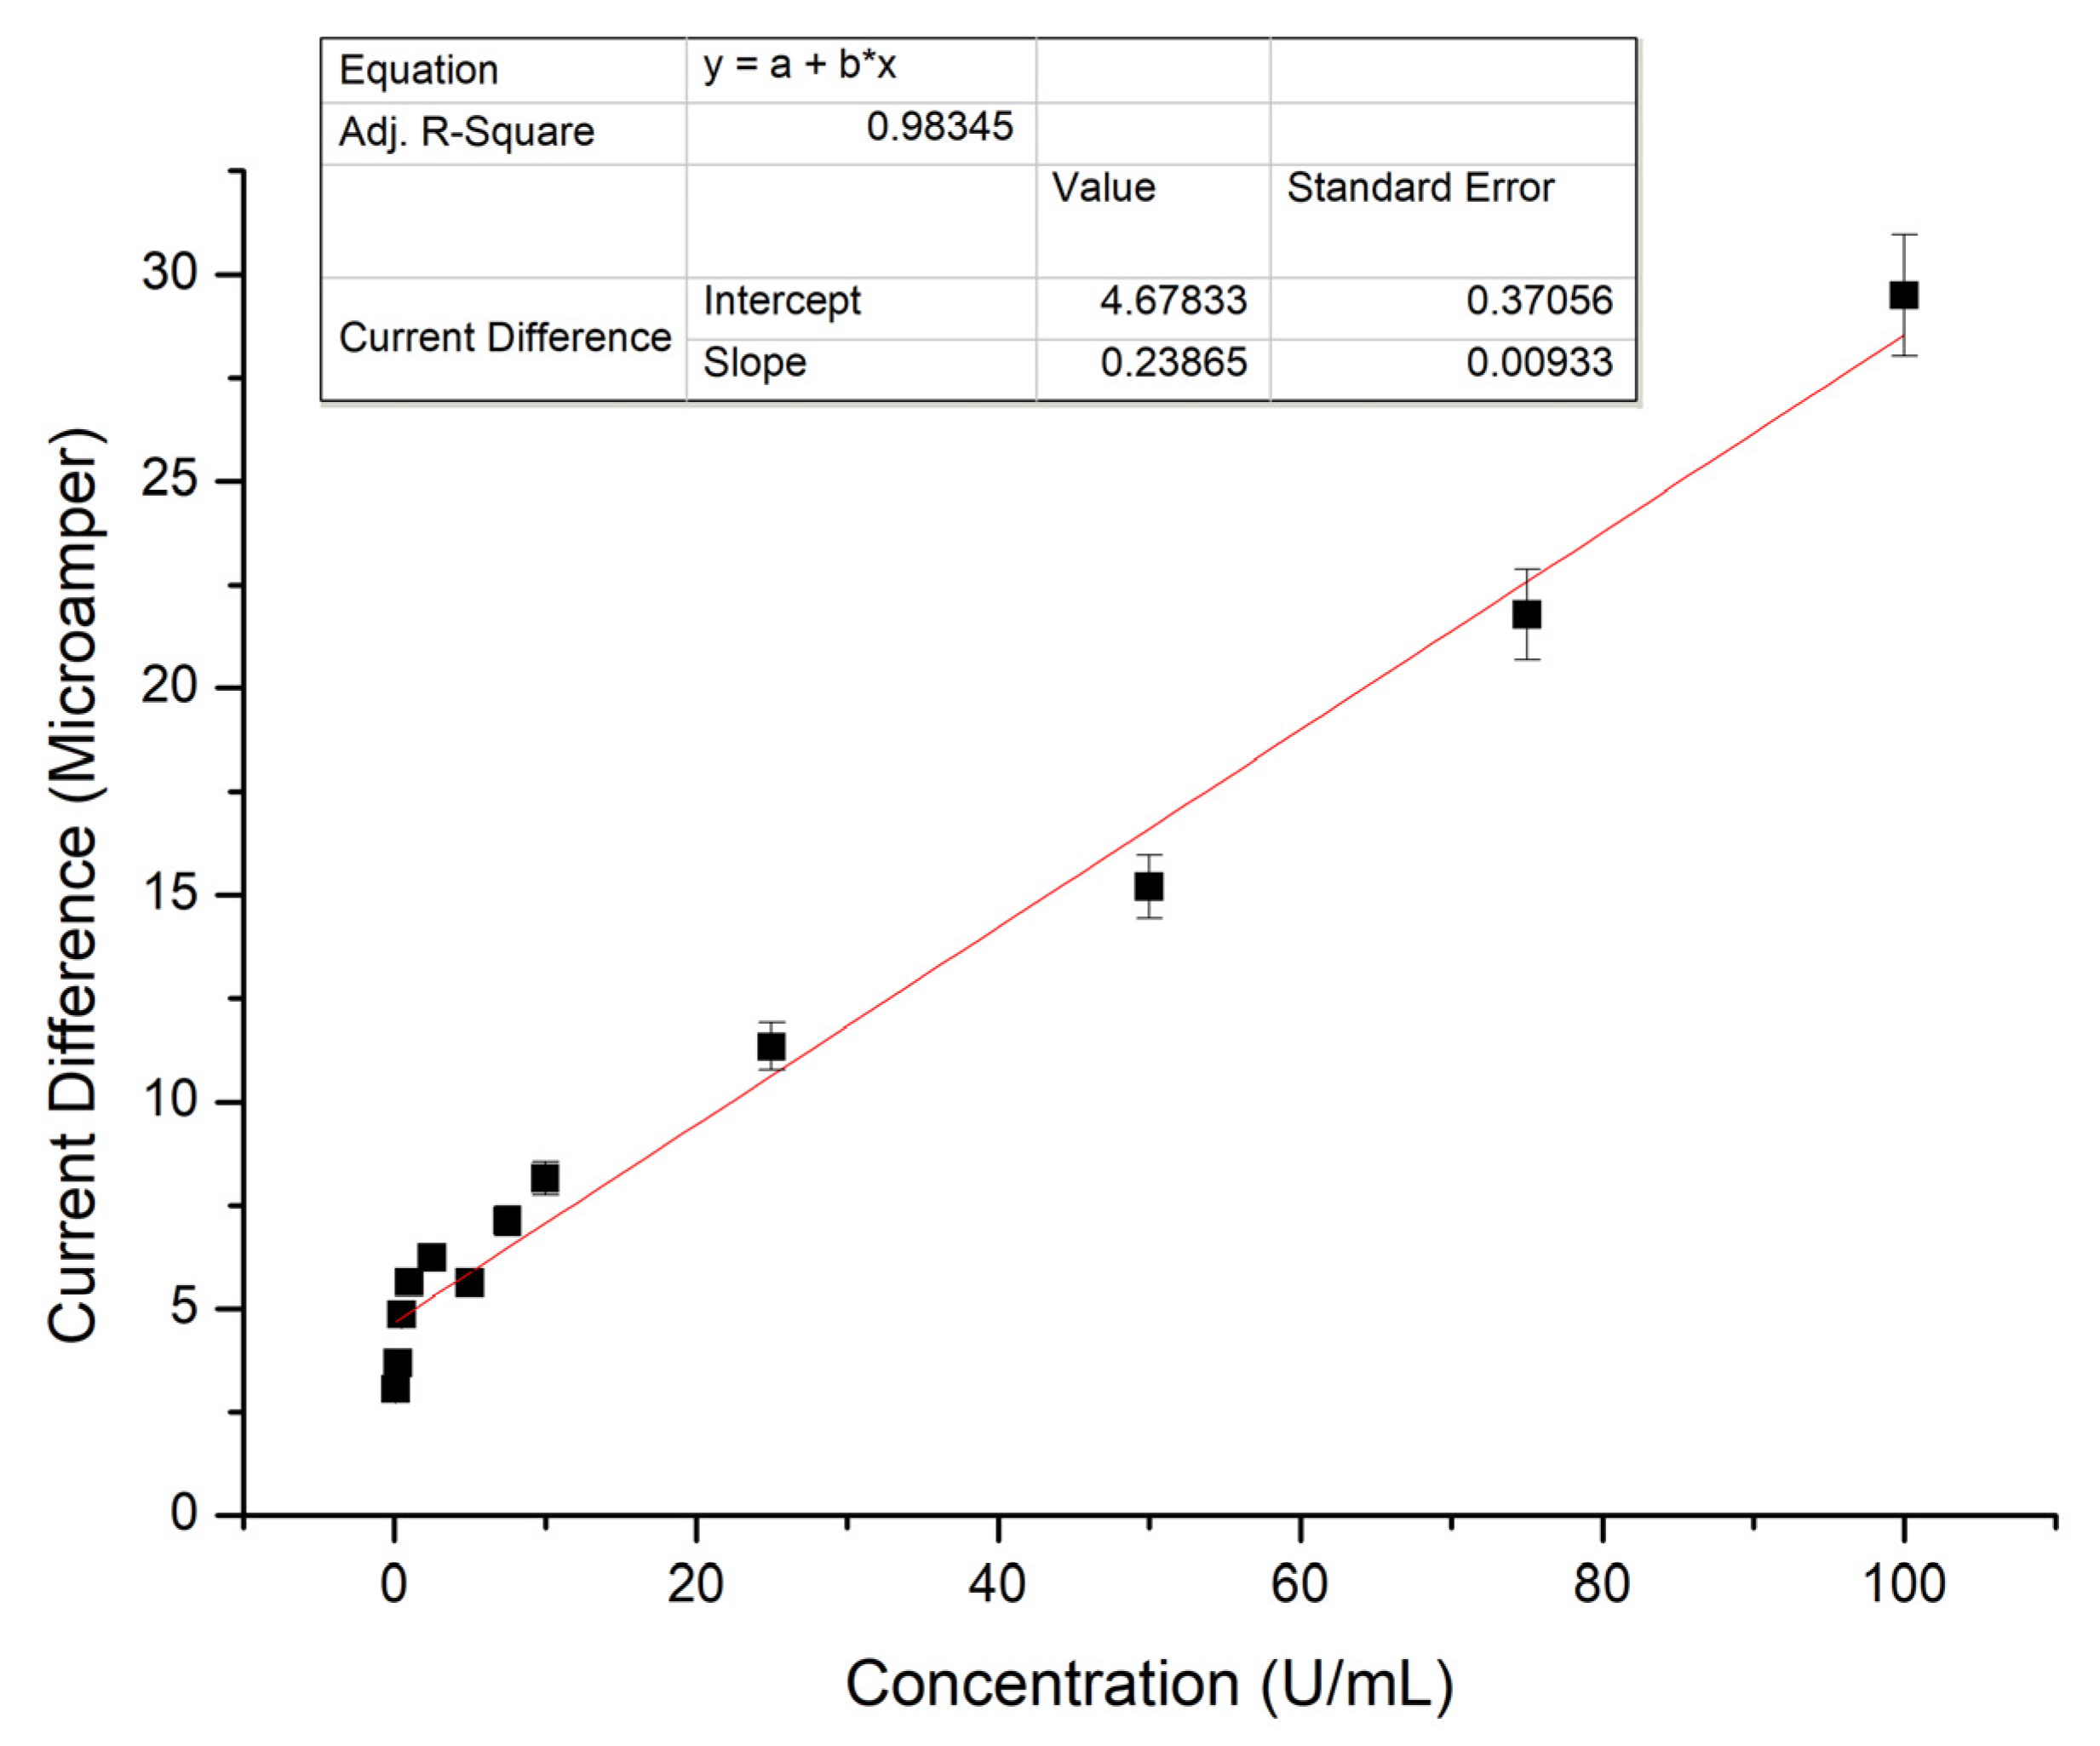
For MUC1 calibration curve, 5 µL of 0.1–100 U/mL MUC1 solution in pH 7.4. ultrapure was dropped on nanopolymers bounded carbon electrode and measurements were taken after 20 min. Graphics were obtained from the current differences obtained as a result of DPV measurements.
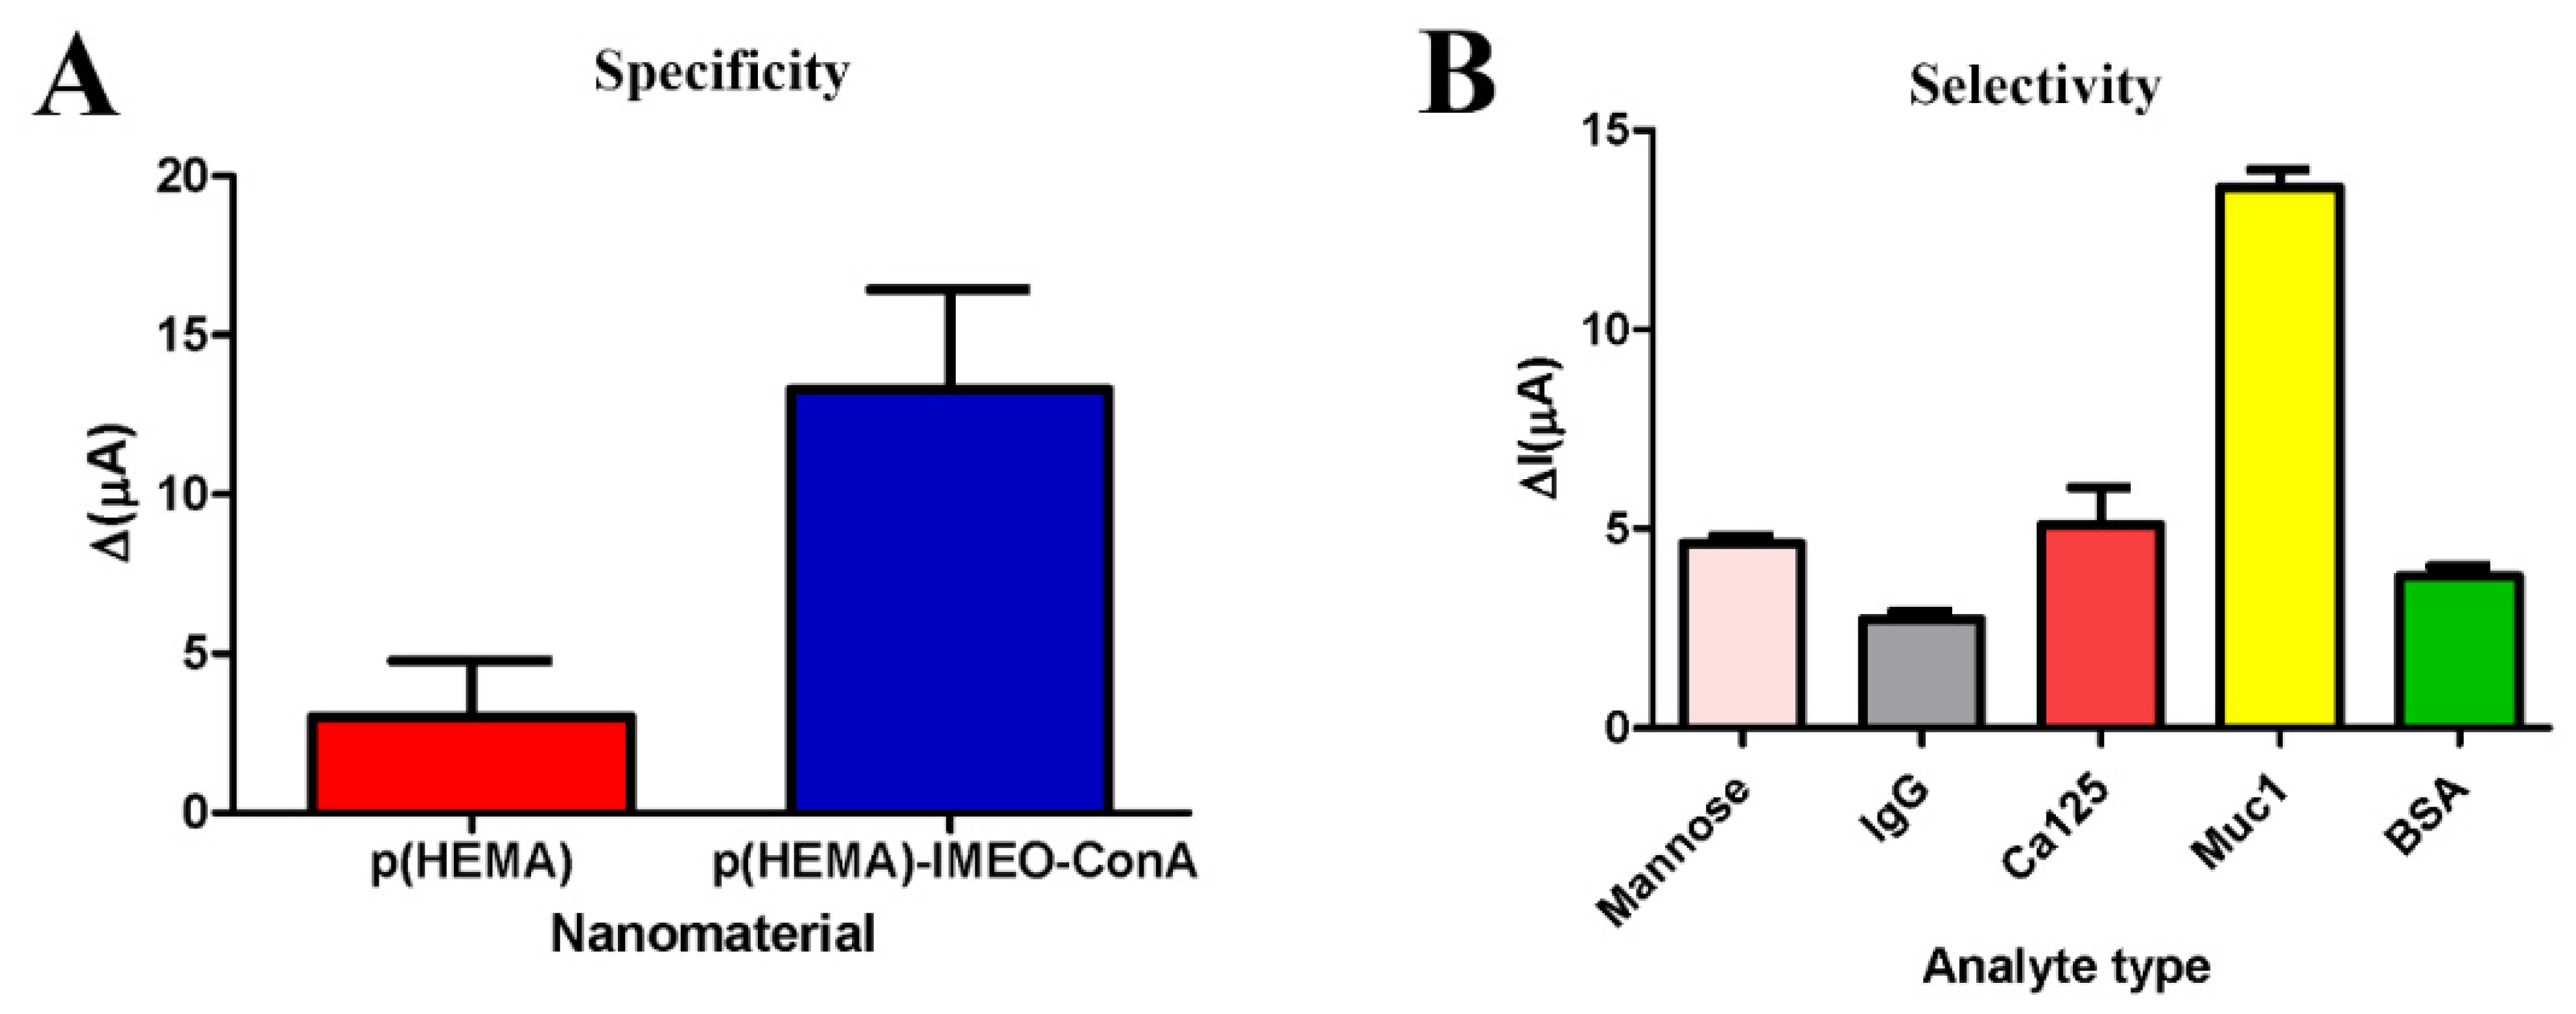
p(HEMA) and p(HEMA)-IMEO-ConA nanopolymer were compared for specificity testing. And general procedure was performed with these nanopolymers seperately. Nanopolymers were dropped onto electrode surfaces and incubated for 90 min. Then 5 µL of 30 U/mL MUC1 in 1 mM MnCl2 and 1 mM CaCl2 was added and waited for 20 min. Then measurements were taken and speficificity was determined due to the differences in current
For the selectivity assay, p(HEMA)-IMEO-ConA nanopolymers were dropped onto the electrode surfaces (5 µL) and then incubated 90 min. Then, 0.05 mg/mL mannose, 0.05 mg/mL Immunoglobulin G (IgG) and 10 U/mL Cancer Antigen 125 (CA125) and 0.05 mg/mL Bovine Serum Albumin (BSA) were compared with 10 U/mL MUC1. 5 µL of each of the samples were dropped onto the polymer seperately, then waited for 20 min. Measurements were taken and selectivity of the developed nanopolymer were determined due to the differences in current.
Prepared electrodes were stored at +4 °C for 5 days, 10 days, 20 days, 30 days and 60 days. At the end of each time period, the samples were dropped (5 µL of 10 U/mL MUC1, 25 °C, 20 min) and measurements were taken.
For reproducibility tests, measurements were taken in different times and differences in current were calculated with using calibration curve as U/mL. Experiments were repeated 6 times and performed in optimum conditions that are determined in previous studies.
Validation studies of our sensor were carried out due to parameters of linearity, limit of detection (LOD), limit of quantification (LOQ), accuracy, RSD%, confidence limit and sensitivity. For linearity, R2 value of MUC1 calibration curve was used.
Linear regression is a statistical method for calculating the value of a dependent variable from an independent variable. This method measures the relationship between two variables [
31]. Here, we used the linear regression model in order to determine the concentration of MUC1 effect on current changes. This graph was used as the calibration curve. The calibration curve of target biomarker is used to calculate the sensitivity parameter. The linear calibration curve equation is defined in
y =
a +
bx equation. LOD and LOQ were calculated with Equations (3) and (4) as follows:
where
Sa is the standard deviation of the response and
b is the slope of the calibration curve [
32].
Precision of a parameter of the degree of closeness measurements among individual test results when the procedure is applied repeatedly to multiple samplings. And it is related with relative standard deviations (RSD) [
33,
34]. Accuracy is another parameter of analytical methods that is related with degree of agreement of test results generated by the method to the true value [
34]. Recovery, relative standard deviation (RSD%) and confidence limit were calculated with the following formulas and Grubbs’ test was applied. Grubbs’ test is applied when the testing the null hypothesis that a suspected value is an outlier versus the alternative hypothesis that the suspected value is not an outlier. It is easy to apply and operated using the mean and standard deviation of the data [
35].
C = known concentration of analyte,
Cref = average of analyte concentrations found as a result of reproducibility testing [
36].
Relative Standard Deviation% (RSD%) value was calculated with Equation (6).
S = standard deviation.
Student’s
t-test is a common method when testing hypotheses about the mean of a small sample drawn from a normally distributed population when the population standard deviation is unknown. The main focus of
t-tests is on describing a situation such as: (a) Mean/proportion in one sample, (b) mean/proportion in two unrelated samples, (c) mean/proportion in two related samples, (d) correlation coefficient and (e) regression coefficient [
37]. In this study we used
t-test for the confidence limit calculation and reference kit comparation.
Confidence limit (
CL) calculation is another way of determining the accuracy of an analysis [
38]. Equation (7) is used for confidence limit calculation.
n = the number of repetitions, t = (n − 1).
t value read from the table, S = standard deviation.
To determine the accuracy of the method, Grubbs’ test was calculated using GraphPad with the Equation (8) formula below.
Using the Grubb table, the critical
Z value determined for the number of samples is compared with the calculated
Z value with the Equation (9) formula. If the calculated
Z value is less than the critical
Z value, it is stated that the precision of the analysis is high [
39].
Reality parameter is determined by systematic error calculation (
t).
Xcalculated, average of analyte concentrations obtained as a result of reproducibility testing, XCRM = known concentration of analyte, n = number of repetitions, S = standard deviation.
The reality is calculated by examining whether there is a significant difference between the systematic error value calculated with the formula above and the actual value calculated by doing
t-tests [
40].
2.2.11. Real Samples Experiments
The general procedure for real sample testing were performed and repeated 3 times. Samples were prepared as follows:
Samples in different concentrations prepared in blood serum with a serial dilution (0.5–1–5–10–50–100 U/mL) and dropped into the electrode surface (5 µL, 25 °C, 20 min). After each step, cleaning is performed with ultra-pure water and measurements are taken by differential pulse voltammetry (DPV) and cyclic voltammetry (CV). For the calculations, the equation in the MUC1 calibration graph was used and the U/mL concentrations of the samples analyzed at the end of the experiment were determined.
2.2.12. Reference Kit
As a reference kit, MUC1 ELISA kit was used. Standard procedure in kit was performed. OD values were read in 450 nm and calibration curve was plotted. Calibration graph was prepared with standard solutions prepared at 0.25–8 ng/mL concentration. MUC1 in different concentrations (0.5, 1, 5, 10, 50, 100 U/mL) prepared in the blood serum (Human Serum, P2918, SIGMA ALDRICH) and used for comparision test.
The results obtained within the scope of the comparison study with the reference method were checked for accuracy by performing a
t-test. For this purpose, a comparison was made with the t test calculated using the Equations (10) and (11) [
40].
.
s: standard deviation value.
n: number of samples.


