Article

Exploring Cranial Growth Patterns from Birth to Adulthood for Forensic Research and Practice

1
Department of Anthropology, University of Nevada, Reno, NV 89557, USA
2
Department of Anatomy, Faculty of Health Sciences, University of Pretoria, Pretoria 0031, South Africa
3
Department of Anthropology, East Carolina University, Greenville, NC 27858, USA
*
Authors to whom correspondence should be addressed.
Forensic Sci. 2025, 5(3), 32; https://doi.org/10.3390/forensicsci5030032 (registering DOI)
Submission received: 19 May 2025 / Revised: 15 July 2025 / Accepted: 22 July 2025 / Published: 26 July 2025
(This article belongs to the Special Issue Forensic Anthropology and Human Biological Variation)

Abstract

Although cranial growth has been extensively explored, forensic and biological anthropology lack a formal incorporation of how cranial growth processes impact the adult phenotype and downstream biological profile estimations. Objectives: This research uses an ontogenetic framework to identify when interlandmark distances (ILDs) stabilize during growth to reach adult levels of variation and to evaluate patterns of cranial sexual size dimorphism. Methods: Multivariate adaptive regression splines (MARS) were conducted on standardized cranial ILDs for 595 individuals from the Subadult Virtual Anthropology Database (SVAD) and the Forensic Data Bank (FDB) aged between birth and 25 years. Cross-Validated R-squared (CVRSq) values evaluated ILD variation explained by age while knot placements identified meaningful changes in ILD growth trajectories. Results: Results reveal the ages at which males and females reach craniometric maturity across splanchnocranium, neurocranium, basicranium and cross-regional ILDs. Changes in growth patterns observed here largely align with growth milestones of integrated soft tissue and skeletal structures as well as developmental milestones like puberty. Conclusions: Our findings highlight the variability in growth by sex and cranial region and move forensic anthropologists towards recognizing cranial growth as a mosaic, continuous process with overlap between subadults and adults rather than consistently approaching subadult and adult research separately.

1. Introduction

The human cranial complex is a critical component in the development and application of forensic anthropology methods. While it is broadly understood that the adult cranium is a product of various growth processes, formal incorporation of how variation throughout ontogeny impacts the adult phenotype is largely absent from forensic anthropology literature [1]. Developmental stages of cranial elements and cranial measurements have been used for age estimation, but they usually do not span the entirety of cranial ontogeny and instead focus on specific periods [2,3,4,5,6,7,8]. Further, while subadult research in forensic anthropology usually uses growth in size and maturity of other skeletal or dental elements for the purpose of age estimation [9], consideration for patterns of human variation and sexual dimorphism across ontogeny is relatively absent for the cranium [1,10,11]. In part, the divergence between research on cranial growth and development and its application to biological profile estimation methods may be linked to the paucity of subadult remains in skeletal collections [12,13]. With limited access to robust samples comes a restricted ability to explore and develop the methodological pipelines typically used for subadults. As a result, there is a persistent assumption that many variables used in the adult biological profile are inappropriate for use on subadults. This is especially prevalent in the untested assumption that the adult cranial phenotype does not emerge until the skeleton has reached full maturity. Mobilizing theory that considers the relationship between human ontogeny and skeletal variation is necessary to expand our understanding of the cranial phenotype and improve guidelines made from untested assumptions [14].
Cranial growth has been studied through many methodologies, data types, classification systems, and populations e.g., [15,16,17,18,19,20,21,22,23,24,25,26,27,28,29,30,31,32,33,34]. Many of these studies have mobilized geometric morphometrics, used non-standard cranial measurements (sometimes based on soft tissue), focused on specific cranial regions or specific age ranges, and/or included samples from different time frames or populations, all of which make direct comparisons across studies and the application of results difficult. However, some key themes have emerged from this research: (1) cranial growth is non-linear, (2) different regions of the cranium develop at different rates before stabilizing at adult levels of variation, (3) degrees of sexual dimorphism are variable across the cranial complex depending on the data types used (e.g., shape, metrics), (4) the cranial base tends to stabilize sooner than other regions, and (5) size (growth) and shape (development) changes to cranial elements/regions do not always follow the same growth patterns even when they are spatially associated. While these results are important for understanding subadult cranial growth, few studies have taken an interdisciplinary approach on the subject. Therefore, there is still a need for quantifiable and replicable examinations of cranial growth trajectories across the entire subadult ontogenetic period (from birth into adulthood) using data that is directly relevant to forensic anthropology methods.
We aim to highlight how and when adult levels of cranial phenotypic variation are reached in different cranial regions by adopting an ontogenetic framework for the study of cranial variation using a sample that ranges from birth through adulthood. By exploring the entire cranial complex across ontogeny, we can increase our understanding of the impact that factors like sexual dimorphism and/or population variation have on its phenotypic structures. The formalization of ontogenetic approaches in forensic anthropology is crucial for establishing and interpreting appropriate methodologies. This will provide theoretical grounding for forensic anthropologists building or using biological profile methods based on the cranium and, ultimately, contribute to improving these methods [14].

Why Is the Cranial Complex, Complex?

The human cranium is a confluence of different developmental mechanisms and vital functional modules that are buffered through their structural integration [35,36,37,38,39]. The nuanced interactions between this network of hierarchical and non-hierarchical modules act as the precursors for the adult phenotype [15]. The intricacies of these interactions mean there are many ways to explore and conceptualize cranial growth, whether through ossification patterns, functional components, or anatomical regions. While most researchers strive to use at least one of these lenses to frame their approach, growth of the cranial complex is ultimately the result of differently timed changes in size and shape according to the interaction between myriad developmental processes [38,40,41]. The complexity within and across this network of interactions is beyond the scope of this paper, see [36,38,39,42,43]. However, we do want to recognize a few of the characteristics that researchers have used previously when analyzing the cranium and how they relate to cranial growth trajectories.
The cranium forms through both endochondral and intramembranous ossification processes [39,40,44,45,46]. However, the anatomical regions discussed in much of the anthropological literature are not always linked to a single ossification mode. The cranial base (i.e., basicranium) undergoes endochondral ossification during fetal development and is comprised of distinct anterior, posterior, and bilateral components that interact with different anatomical and functional cranial modules [34,47,48,49]. For example, the anterior and bilateral cranial base experiences more prolonged growth in association with facial growth while the posterior cranial base ossifies earlier and has more interaction with the neurocranium [34,35,48,49,50]. In contrast, some bones of the cranial vault (i.e., neurocranium) and facial structures (i.e., splanchnocranium) develop via endochondral ossification (e.g., ethmoid, inferior nasal concha, portions of the temporal bone), while others develop through intramembranous ossification (e.g., craniofacial, frontal, parietal, and occipital bones, squamous and tympanic parts of the temporal bones) [47,51,52]. Therefore, anatomical regions of the cranium do not exclusively conform to ossification-based developmental modules [53].
Another approach to understanding the phenotypic drivers of cranial variation is considering the functional purpose of each anatomical region. Some cranial regions can be classified according to shared purpose such as participation in optic, auditory, nasal, or mastication functions, or in protecting neural tissue of the brain [40,44,45,46,54]. Contextualizing cranial regions according to their functional components allows growth researchers to highlight the inherent interaction between the soft tissues or organs and the bony structures that support and protect them. For example, it is argued that growth of the neurocranium is driven by brain growth [55,56] while growth of the splanchnocranium is driven by facial functional units (i.e., eyes, nose, and mouth) or sexual selection [41,46,53,57,58]. However, like ossification-based modules, research has shown that functional components alone also do not explain patterns of growth variation across cranial regions [16,32,45,46,54]. Other drivers like sexual dimorphism and population variation—whose cranial phenotypic expressions in adulthood are sufficient to allow for reliable and accurate biological sex and population affinity estimation methods [57,59]—likely also contribute differentially to observed patterns of cranial growth. However, these contributors to cranial developmental biology have not been formally integrated into the design or interpretation of cranial forensic methods.
The goal of the current study is to use an ontogenetic framework to contextualize growth trends across cranial regions as captured by standard interlandmark distances (ILDs) used in forensic anthropology methods. This research investigates when ILDs reach phenotypic maturity by quantifying the timing of growth stabilization (i.e., when size and variance of an ILD is analogous with adult individuals) and evaluates patterns of sexual dimorphism that emerge across growth and development periods. We use a large U.S. based cross-sectional sample, encompassing individuals between birth and 25 years to capture the entire active postnatal growth period and maximize variation within the sample. The sampling strategy, along with the use of craniometric ILDs used in casework, facilitates the utility and direct application of the research outcomes for the field of forensic anthropology. By focusing more specifically on univariate growth patterns across ILDs, we hope to highlight that cranial growth processes are mosaic in nature and that there is value in understanding the variation of each cranial measurement and how they relate to age and biological sex across ontogeny. Ultimately, the findings will enrich forensic anthropology’s foundational knowledge of cranial growth and development, expand the subadult toolkit used by practitioners, and theoretically ground adult forensic cranial methods.

2. Materials and Methods

2.1. Samples

The cranial data for this research stems from two independent resources: the Subadult Virtual Anthropology Database (SVAD) and the Forensic Data Bank (FDB) (provided courtesy of Dr. Richard Jantz) (Figure 1). All samples were acquired from donated skeletal collections [60] or virtual databases that follow standards for ethical data acquisition [61,62]. In total, the sample consists of 595 individuals (253 reported biological females and 342 reported biological males) between birth and 25 years of age.
The SVAD is an online cross-sectional repository of freely available contemporary skeletal and dental data obtained for over 4500 subadult individuals from eight different countries aged between birth and 20 years [61]. The crania of 560 individuals (234 reported biological females and 326 reported biological males) from the SVAD sample were virtually reconstructed from post-mortem multi-slice computed tomography (CT) scans (Phillips Brilliance Big Bore 16-slice multi-detector scanner, 512 × 512 pixel matrix, 1.0 mm slice thickness and 0.5 mm slice overlap with a soft tissue reconstruction algorithm). Scans were generated at the Office of the Medical Investigator (OMI) in Albuquerque, New Mexico from 2011 to 2019 and are now curated in the New Mexico Decedent Image Database repository (NMDID) [62]. Virtual reconstructions of the crania and landmark placement were conducted following protocols [63,64] developed for use with the Amira™ Medical Imaging Visualization software (v.6.5.0, Thermo Fisher Scientific, Waltham, MA, USA). Thresholds, or masking values, ranged between 200–500 Hounsfield Units/HU depending on the age of the individual [65]. Importantly, the acquisition parameters, pre-processing and post-processing protocols allow for virtual cranial reconstructions to be accurate representations of physical cranial structures at a (1:1) scale [66].
The craniometric data for the SVAD sample only extends to 20 years of age, which does not capture the entire skeletal growth period based on epiphyseal fusion [67], and potentially some of the morphological cranial traits used in sex estimation [1,11]. Including individuals from the FDB supplements the overall sample with a larger number of individuals who have (most likely) completed cranial growth. However, the selected maximum age (25 years) was a compromise between extending the age range to capture more young adults and late maturing adolescents while preventing the obscuration of cranial growth patterns that an overrepresentation of older adult individuals would cause. For example, if we chose to include adults up to 100 years of age, the nuanced changes in size that occur between birth and 20 years would be overpowered by the overall trajectory of a much larger adult age cohort. Therefore, an age range was selected that maintained the ability to capture those nuanced changes as well as individuals that may stabilize in size at a later age. The final FDB sample used in the current study was 35 individuals (19 reported biological females and 16 reported biological males) between six and 25 years of age.
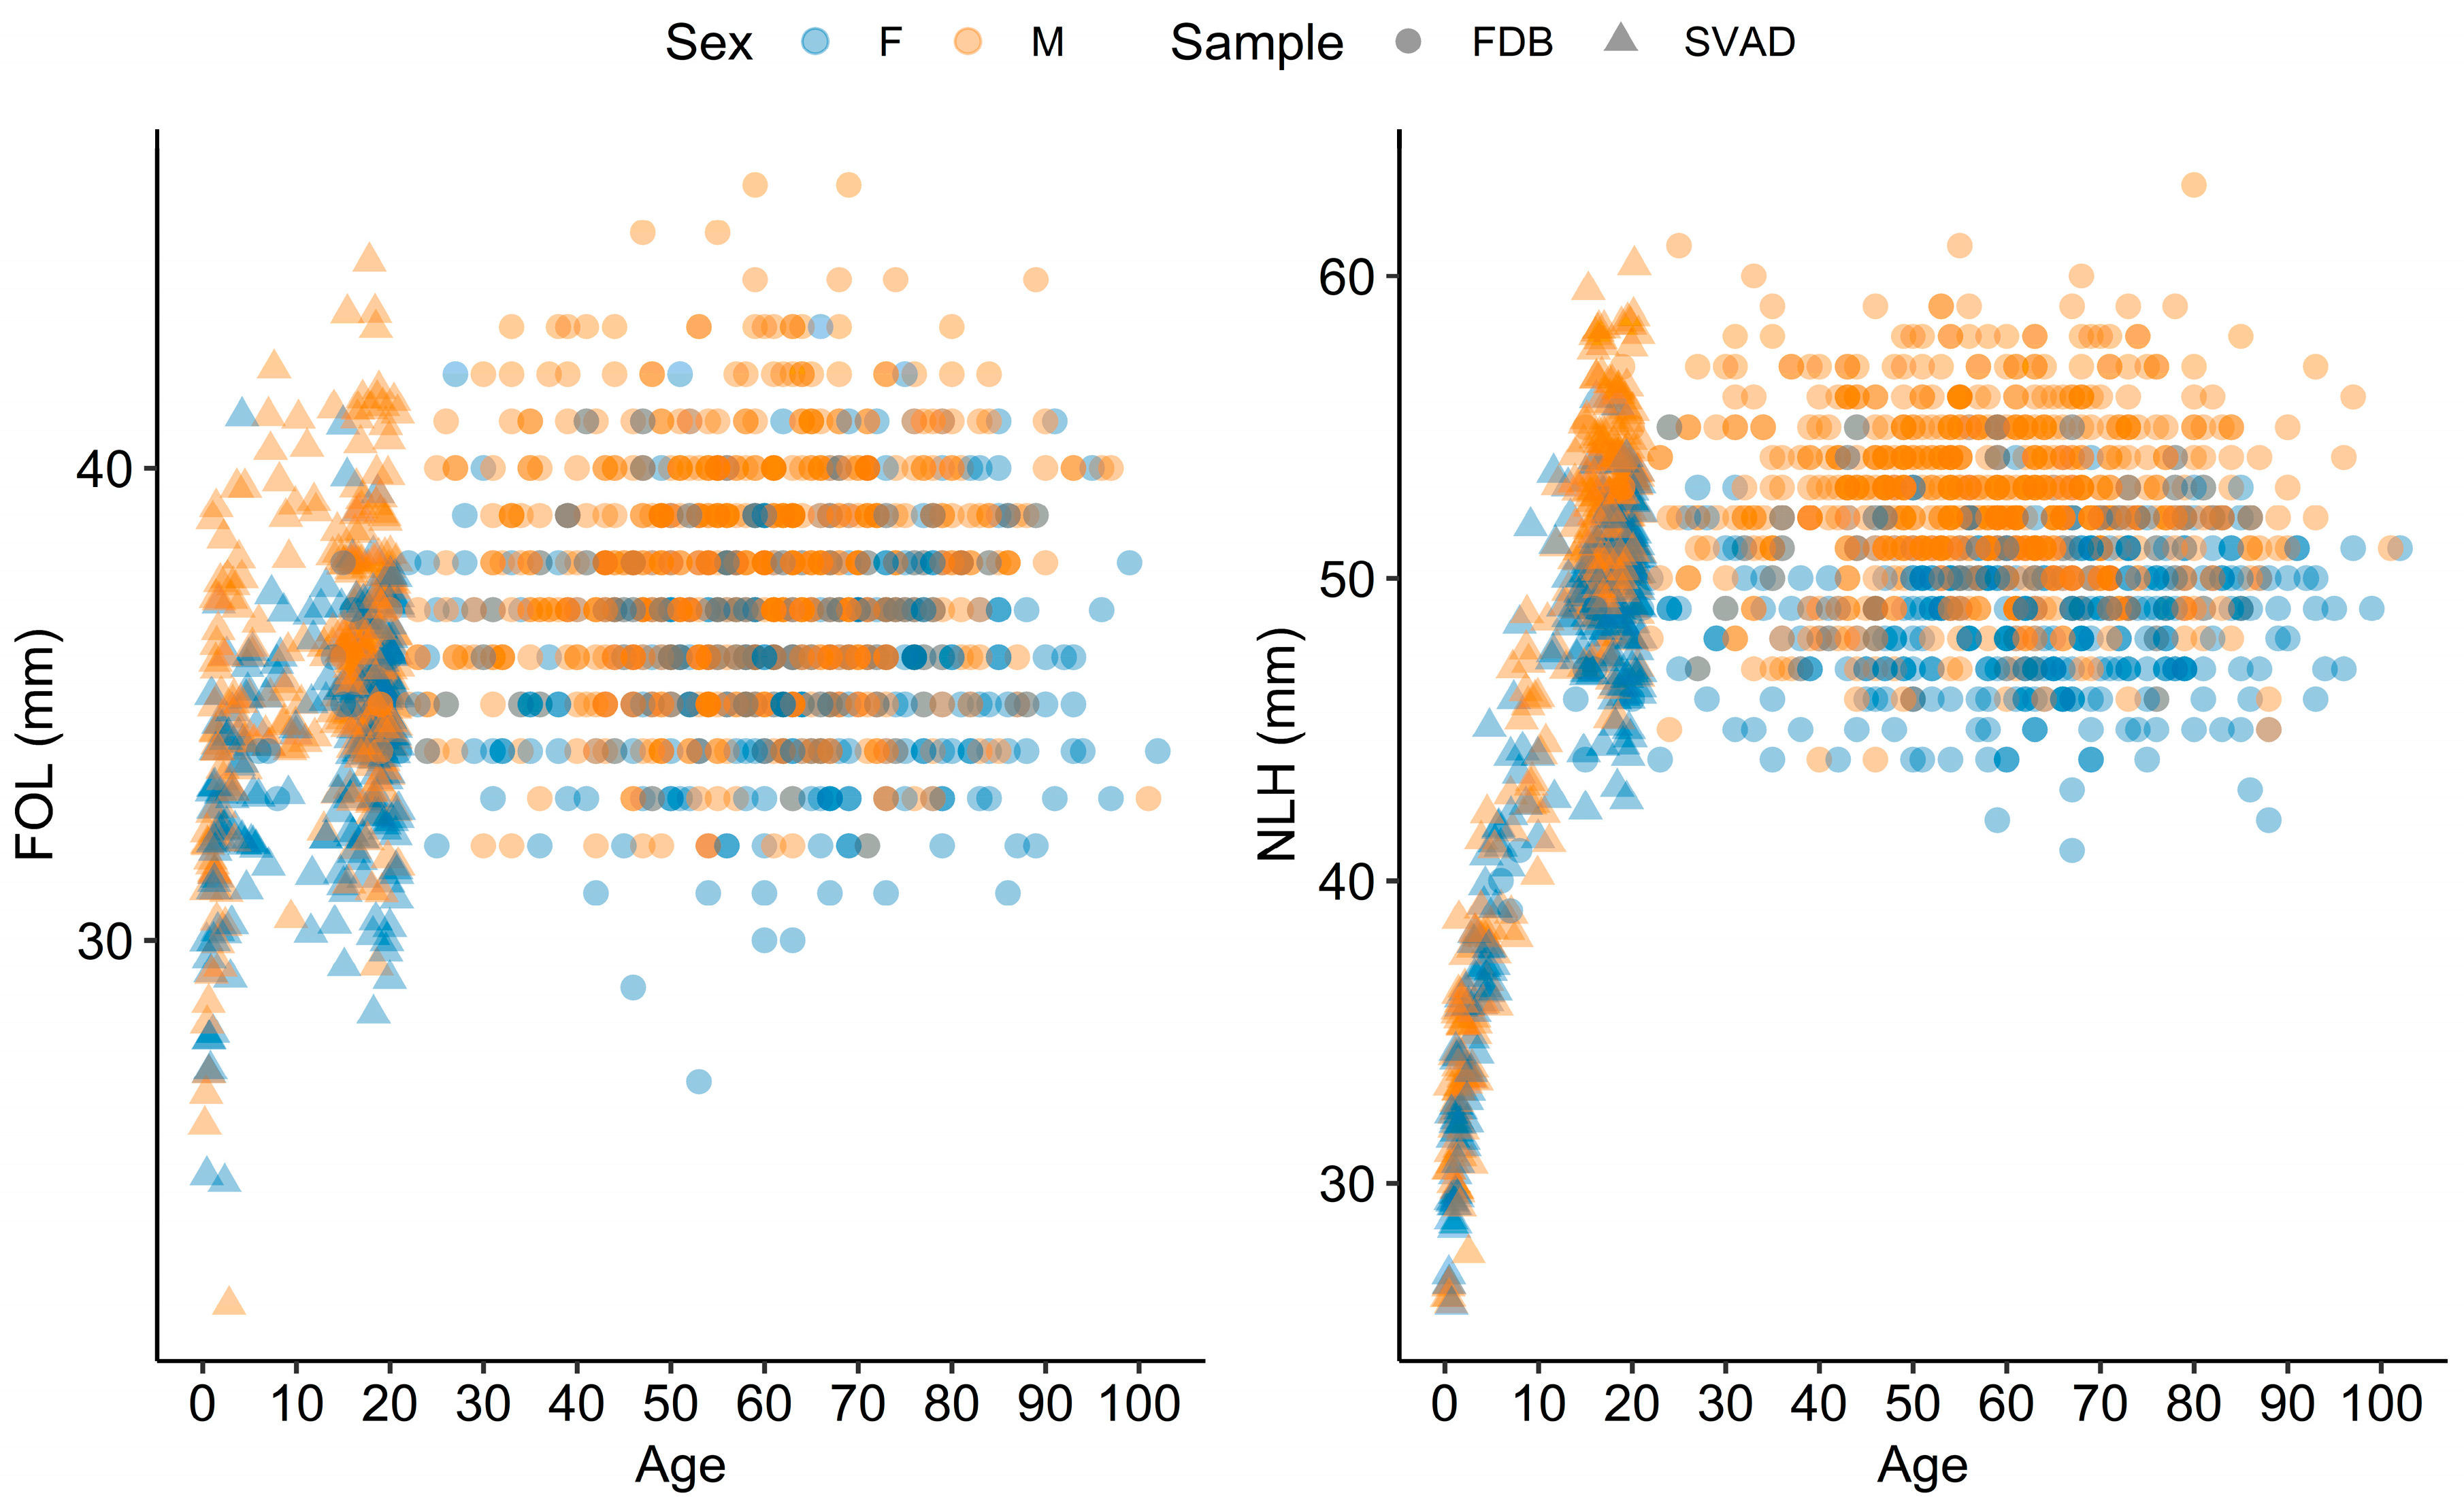
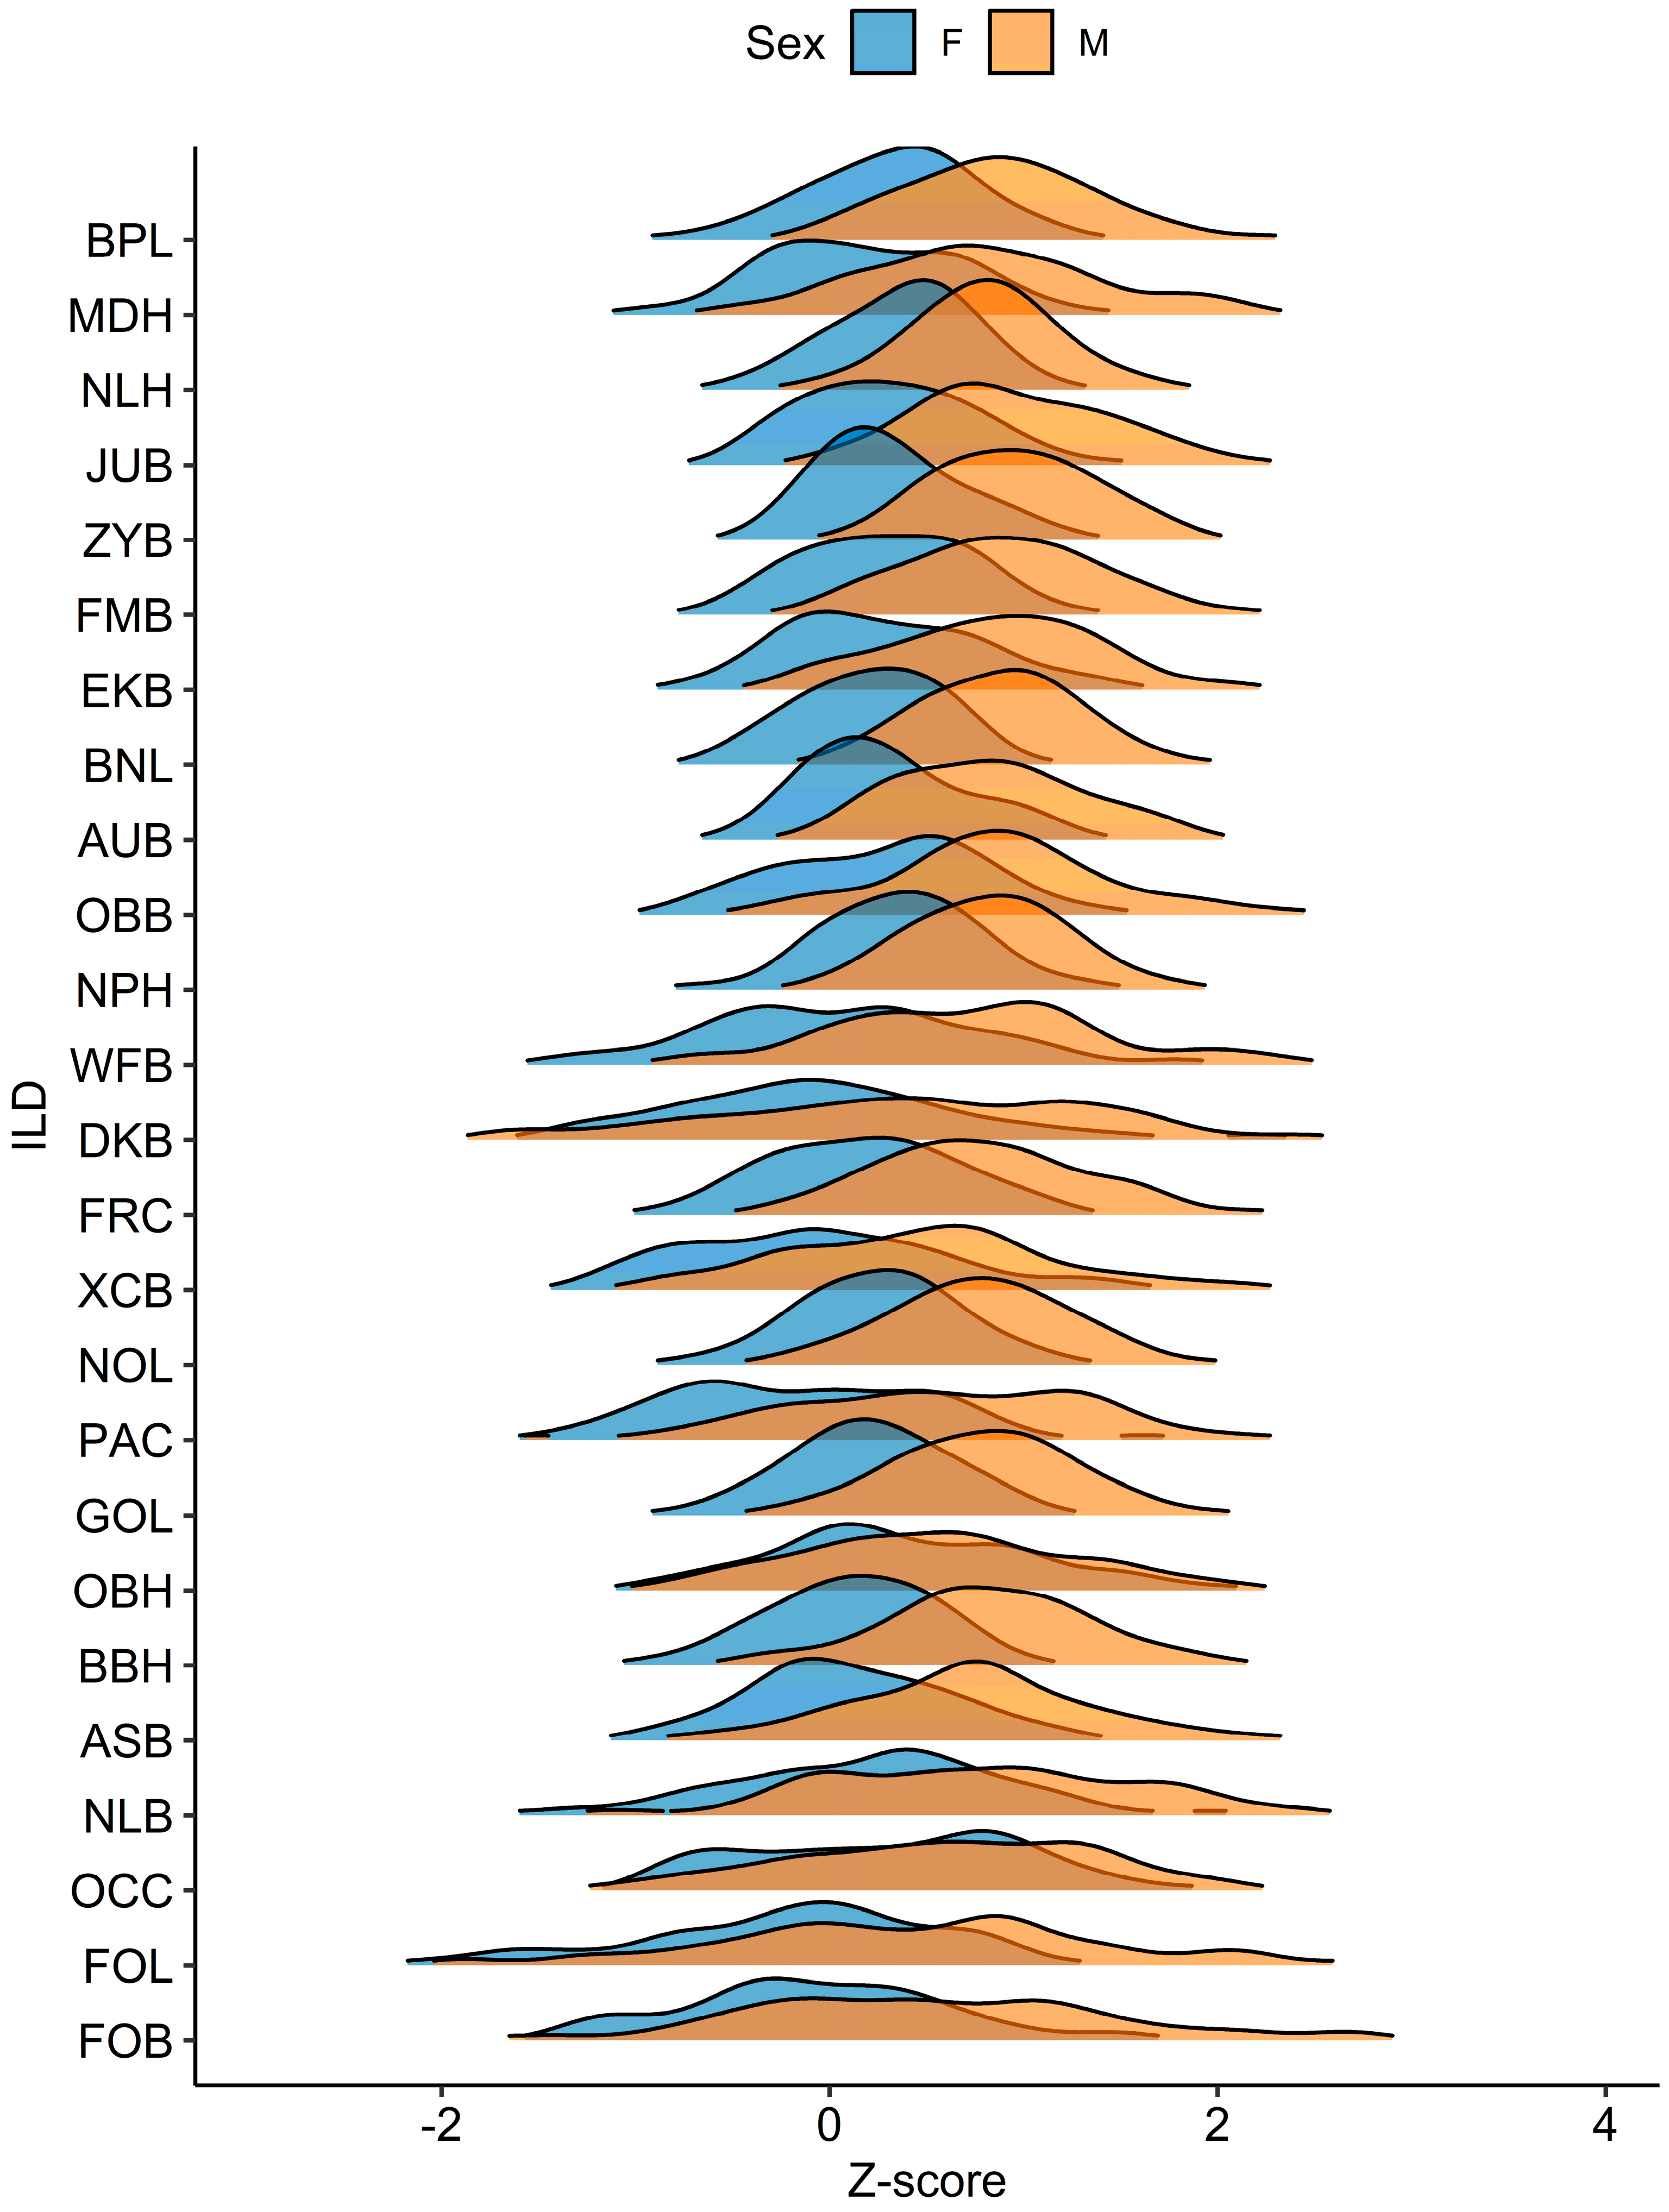
The SVAD and FDB adults (18–20 years and 18–25 years, respectively) share similar ranges of adult variation for all ILDs, which justified pooling of the two samples (Figure 2). While there is clear overlap in the variation of adult ILDs (Figure 2), there are limitations to complementing the SVAD sample with the FDB sample. The FDB sample used here is anonymized with available demographic information limited to biological sex and age. These FDB individuals are sourced from a relatively homogenous modern donated skeletal collection (UTK Donated Collection) and are born upwards of 40 to 80 years prior to some of the individuals in the SVAD, which can introduce potential biases pertaining to sample diversity. However, these limitations are outweighed by the advantages of pooling the samples to model age-related variation. Models change depending on the age range used. Thus, if all adult individuals are excluded, the ability to properly model growth in older subadults diminishes [68,69]. Therefore, the adult FDB sample provides an important age anchor to quantify the stabilization of cranial size in the SVAD sample, which is necessary to achieve the aims of our study.

2.2. Interlandmark Distances (ILDs)

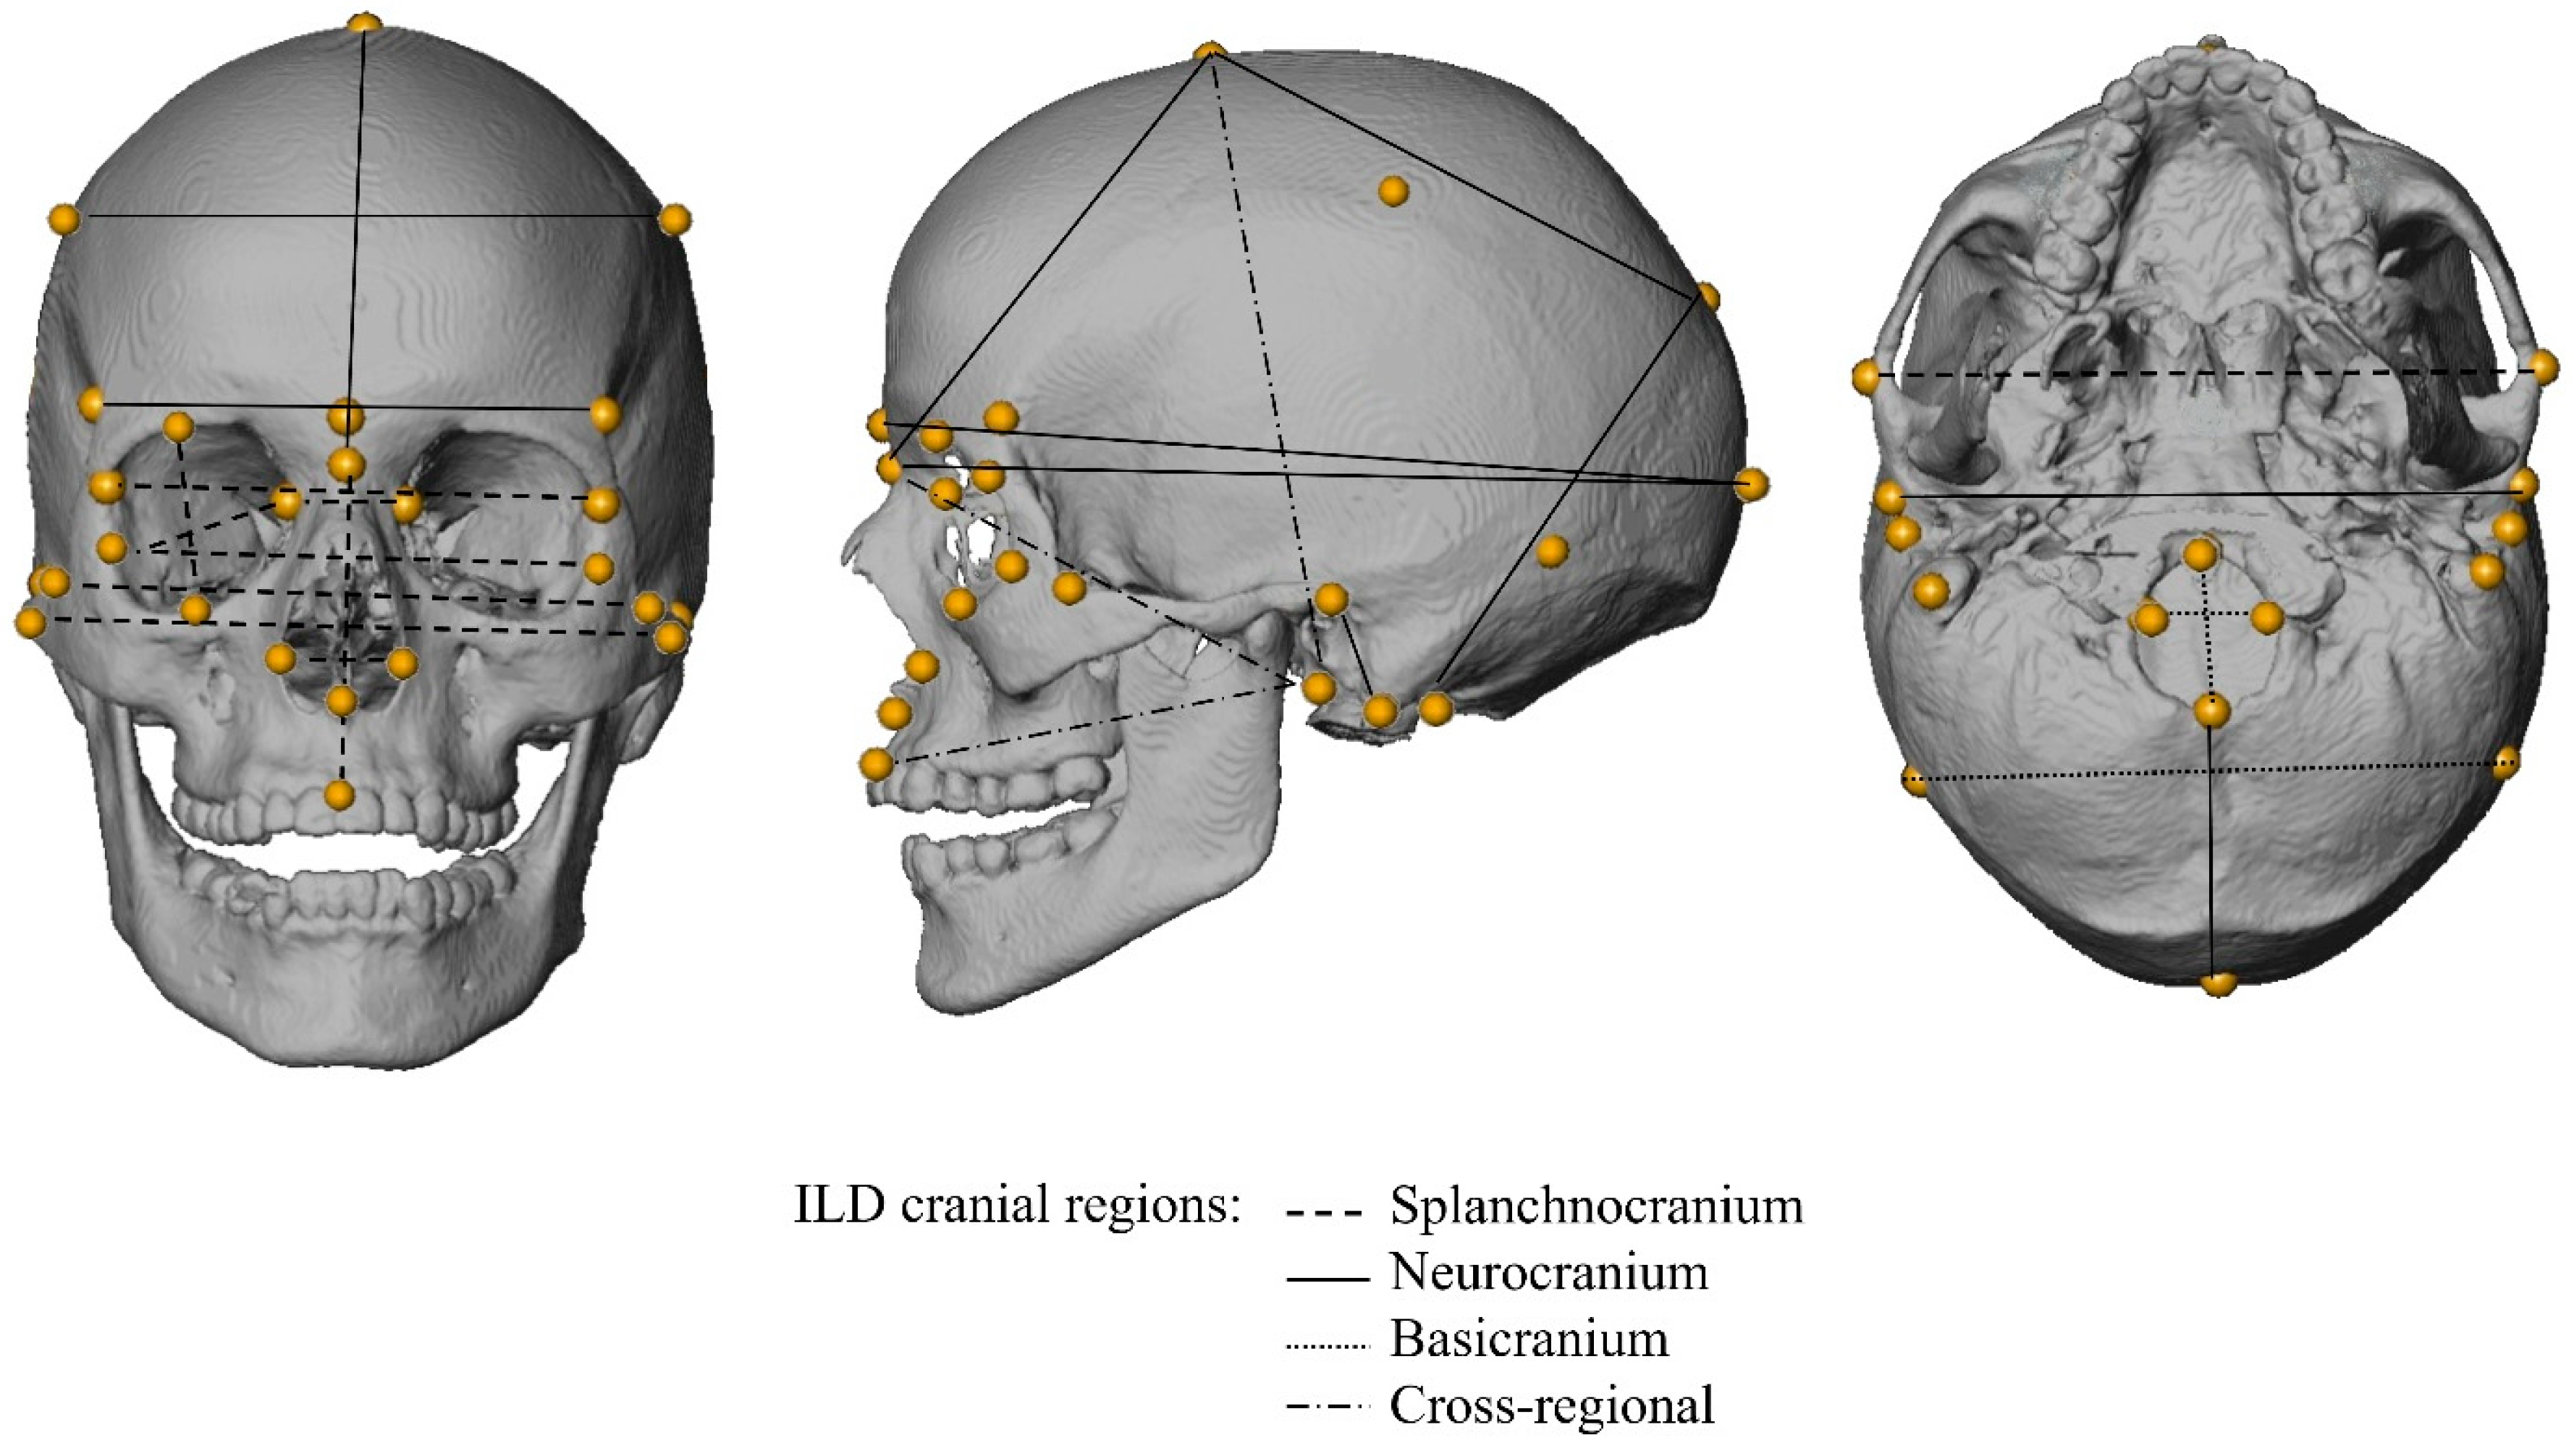
Previous research has demonstrated that data collected directly from skeletal remains and from virtual reconstructions of skeletal structures are reliable and comparable and can be combined for analysis [64,65,70,71]. For both samples, twenty-five ILDs (Table 1, Figure 3) were calculated as the Euclidean distance between the 3D coordinates (x1, y1, z1 for landmark 1 and x2, y2, z2 for landmark 2) of 36 landmarks: ILD = √(x1 − x2)2+ (y1 − y2)2+ (z1 − z2)2. Only individuals with a complete set of landmarks in either sample were included.
Landmarks were collected for the SVAD individuals following a standardized protocol developed for 3D virtual cranial reconstructions [63]. All cranial landmarks follow anthropological standards for their definitions and placement, and ILDs that are commonly used in forensic anthropology casework software (e.g., FORDISC) and are reliable in virtual reconstructions were selected [72,73,74]. For individuals with fontanelles or unfused cranial bones, the placement of bregma, frontomalare anterior, and asterion was completed by decreasing the masking threshold to visualize the cartilage and virtually extend the suture lines to find their point of intersection [63]. Landmark coordinates for the FDB sample were obtained with a 3D digitizer used directly on the dry cranial structures and recorded in the program 3Skull, which automates ILD calculations for the user [75]. Both virtual and dry bone data have comparable intra- and interobserver error rates [72,73,74]. It is worth noting that a study evaluating the reliability of craniometric data obtained on the SVAD sample found systematic higher errors for type III cranial landmark placements (e.g., alare, zygion, glabella, euryon, opisthocranion). However, errors in the resulting ILDs (e.g., AUB, FOB, FOL, FRC, GOL, NLB, WFB, XCB, and ZYB) were not consistently high and the correlation between age and landmark error was lower than 0.11 [74]. All errors were below or within the range of reported errors for dry cranial measurements [73].
For this study, ILDs were categorized into four regions: the splanchnocranium (ten ILDs), the neurocranium (nine ILDs), the basicranium (three ILDs), and a cross-regional category (three ILDs) with landmarks located in different cranial regions. As discussed above, these groupings are based on developmental and functional processes. They account for differences in the mode of ossification while also highlighting anatomical and functional associations between the structures encapsulated by each region [45,51,53,54].

2.3. Statistical Analyses

Multivariate adaptive regression splines (MARS) fit with the earth package in R [76] were used to regress each ILD onto chronological age using sex-specific samples. All ILDs were scaled and centered prior to modeling to ensure comparable visualization of ILDs within each cranial region. MARS is a flexible algorithm that is suitable for univariate or multivariate modeling of data that do not follow the assumptions of linearity or normality [77,78,79]. These capabilities are essential for modeling skeletal growth patterns, which are often non-linear and have heteroskedastic relationships with age [80,81,82,83].
Beyond meeting the needs of the data structure, MARS facilitates interpretation through its generation of piecewise linear basis functions that correspond to noticeable changes in the slope of the relationship between the dependent (y, i.e., ILDs), and independent (x, i.e., age) variables. The selected model includes hinge functions, h(x − t), where each t is the breakpoint (knot) between two consecutive functions modeling the ILD ~ age relationship. To identify the knot locations, the MARS algorithm is built on a two-step process to automatically model the nonlinear interaction between variables: a forward pass and a backward pass. In the forward pass, the algorithm iterates over each data point, identifying which observations produce different linear functions with the best fit (i.e., smallest sum of squared error). Hinge functions and their corresponding knots are added until there is no further improvement in how well the model captures the relationship between variables [84]. However, since the forward step only increases the R2 value, relying on it alone can lead to an overfit model. Therefore, MARS includes a backward pass to remove, or prune, all excess functions. Generalized Cross Validation (GCV) is used to find the best number of functions to model the ILD ~ age relationship, which is calculated as the residual sum of squares (RSS) penalized by the complexity of the model (i.e., the optimal number of model parameters divided by the number of observations). In the present study, t values of the knots indicate the chronological ages at which notable changes in the relationship (modeled as changes in the slope) between age and ILDs are detected. The generalized R-Squared (GRSq), which is a normalized GCV, provides an estimate of the selected model’s generalization performance [84].
To ensure validity of the models, they were generated using a 10-fold cross validation protocol that was repeated three times (30 total folds). The cross-validation approximates model performance on a range of training sets, which establishes the quality of the model [84]. R2 values are calculated at each fold from predictions on the out-of-fold observations and averaged to produce the mean Cross-Validated R-squared (CVRSq). A higher CVRSq can be interpreted as the level of stability of the hinge functions, the reliability of the x values (i.e., ages) corresponding to the knots/changes in slope, and the variability in each ILD explained by age.
The presentation of results is dependent on interpreting slopes and the overall change in size of an ILD across the chronological ages of a cross-sectional sample. While longitudinal data is preferred for interpreting growth rates and achievement of growth milestones, a recent study demonstrated that cross-sectional data can be used to accurately model growth parameters [85]. Larger sample sizes are recommended, however sampling of at least 200 individuals in a cross-sectional dataset can represent the population-level patterns [85]. In the current research design, the smallest models are the female ILD models which have approximately 250 individuals per model and each model is cross validated three times. While we are not reporting growth parameters like velocity estimates, because that is not the goal of this research, we believe these models adequately capture growth in cranial traits across age.
We have employed MARS models over other non-linear regression methods because of the bias-variance tradeoff. Non-linearities can be captured by the models (reducing bias), but the constrained basis functions limit excessive flexibility (preventing high variance). Ultimately, this results in interpretability for a nonlinear relationship. Additionally, the numerous built-in features (growing, pruning, cross-validation) prevent overfitting and maintain generalizability. MARS models have already been used with subadult and/or adult skeletal data to improve estimations of biological profile parameters such as age [80,81,82,86,87,88], sex [89], and population affinity [90]. For these studies, the emphasis was on whether using MARS provided improved predictive performance with components of the biological profile. The advantage of MARS for this research was not its predictive power, but its ability to capture any and multiple points of change in the data relationships through changes in the slope and corresponding knots of the models.

3. Results

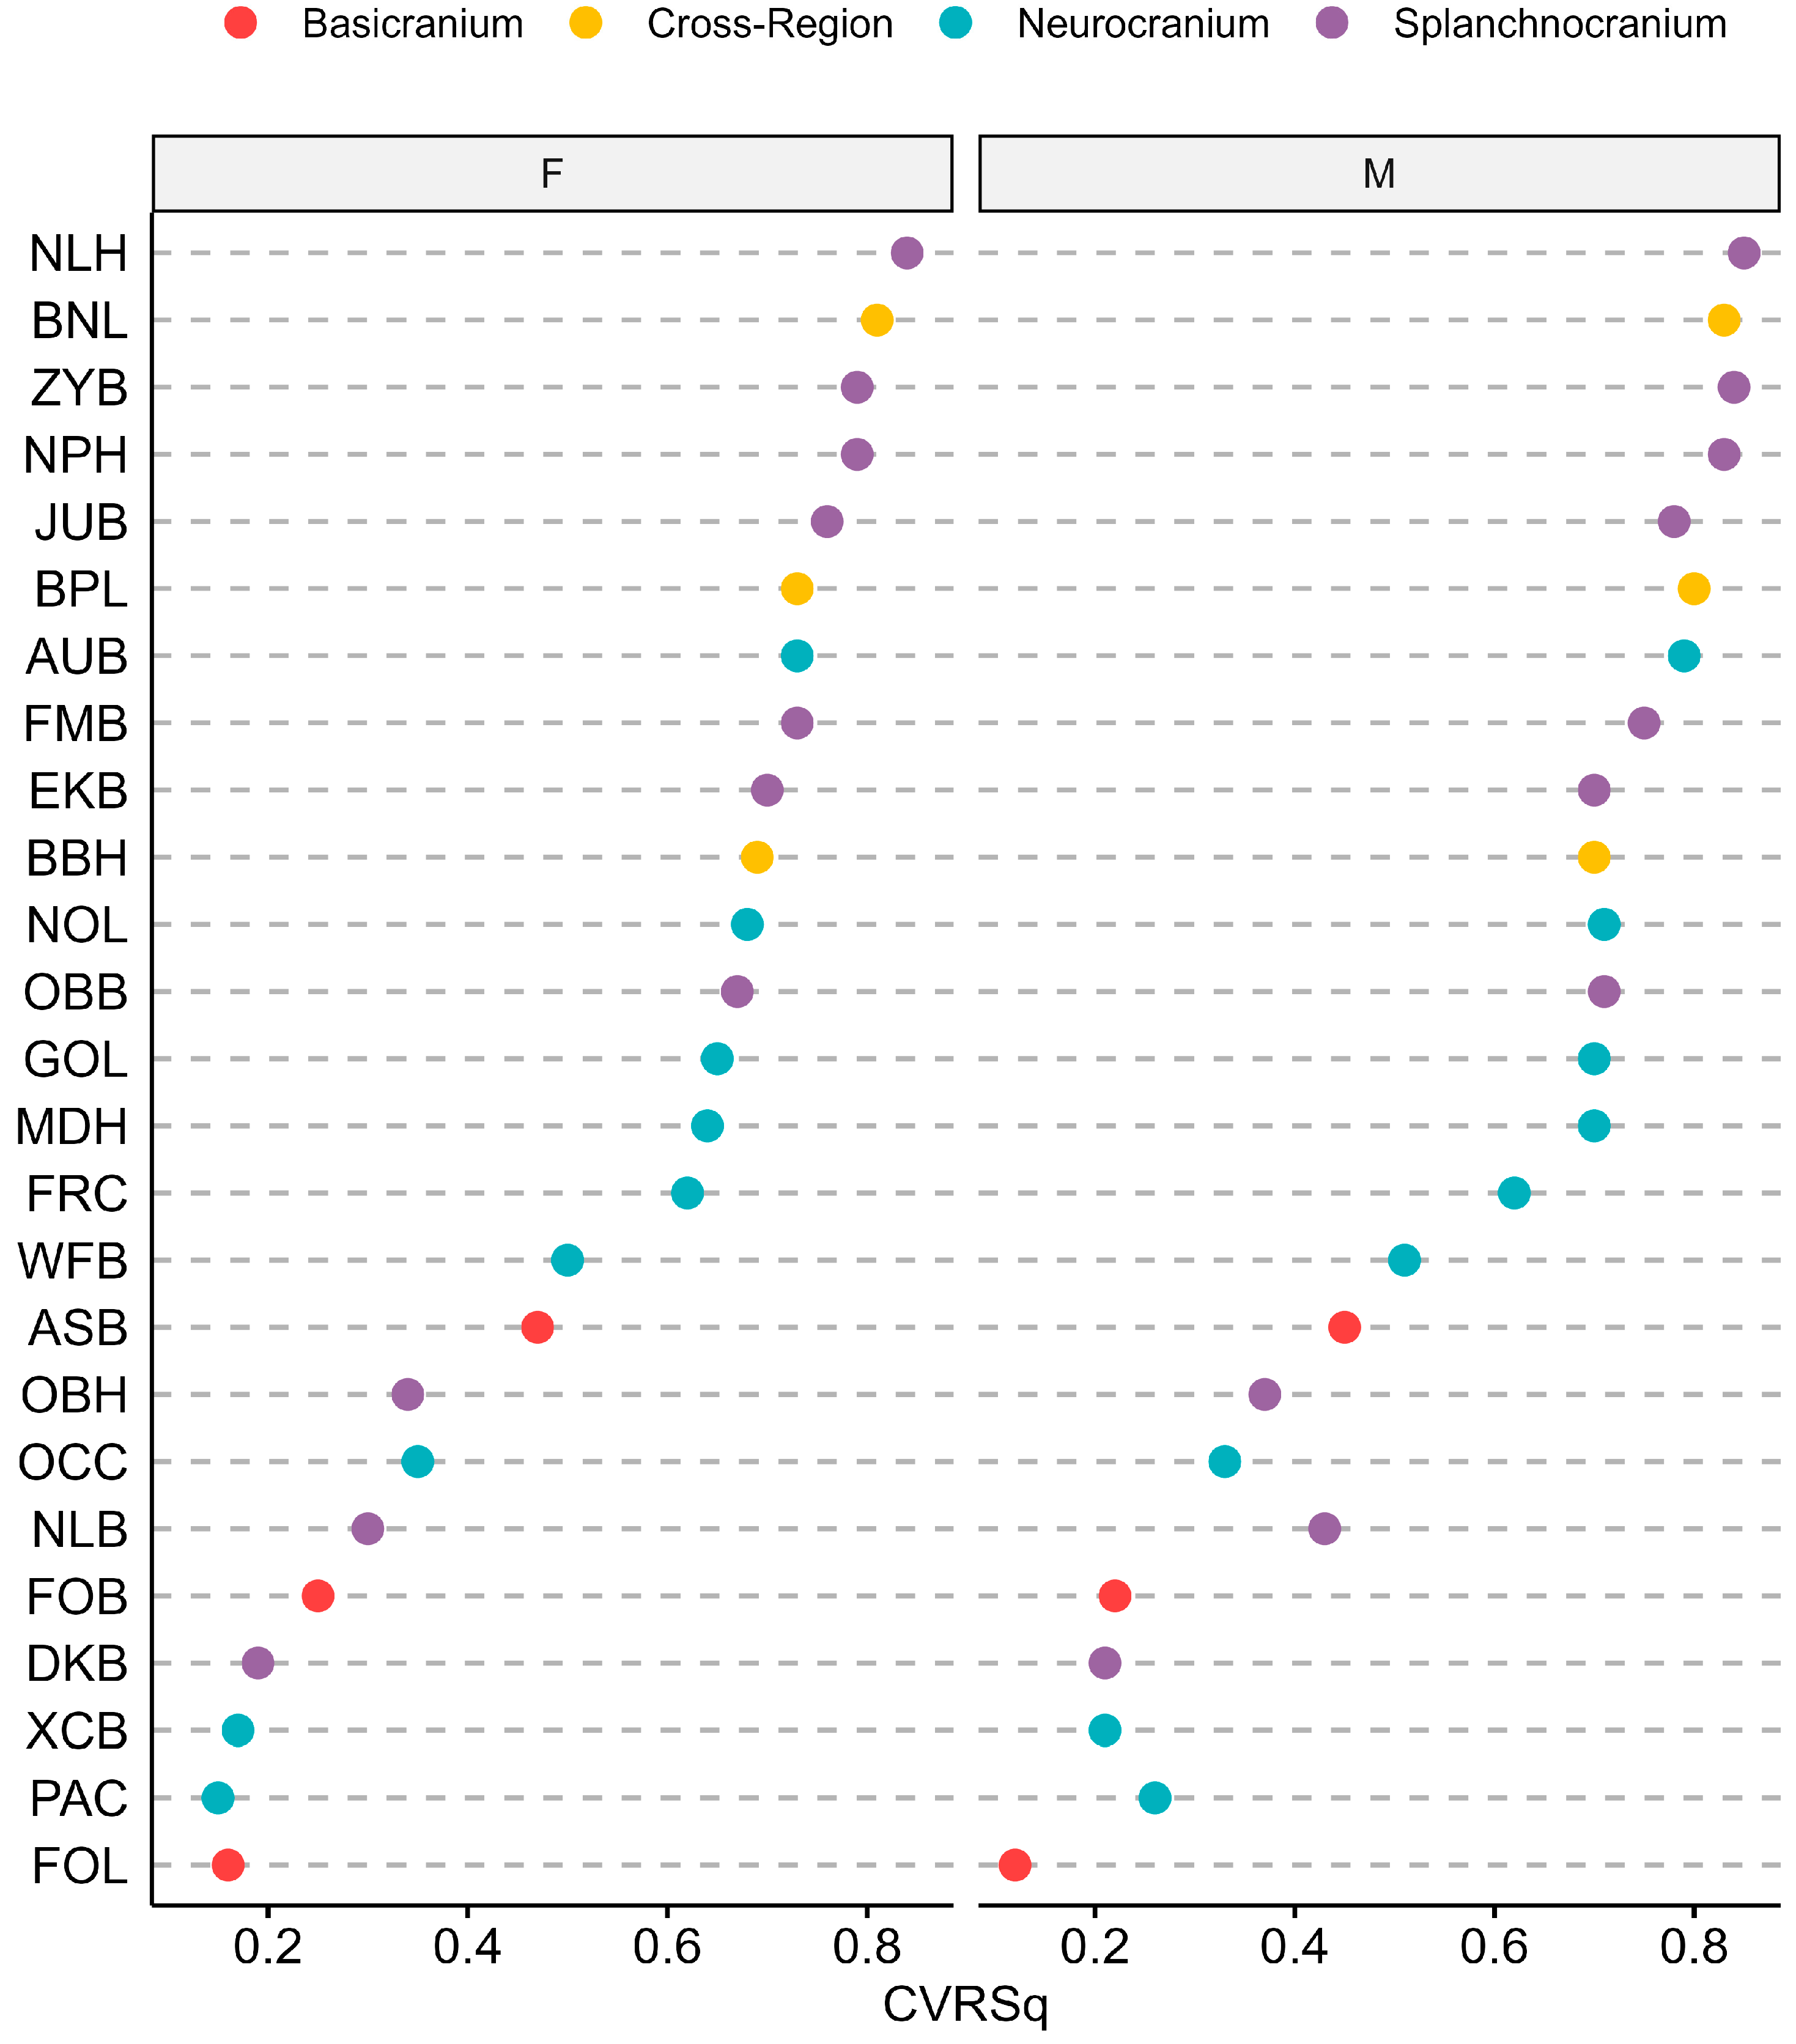
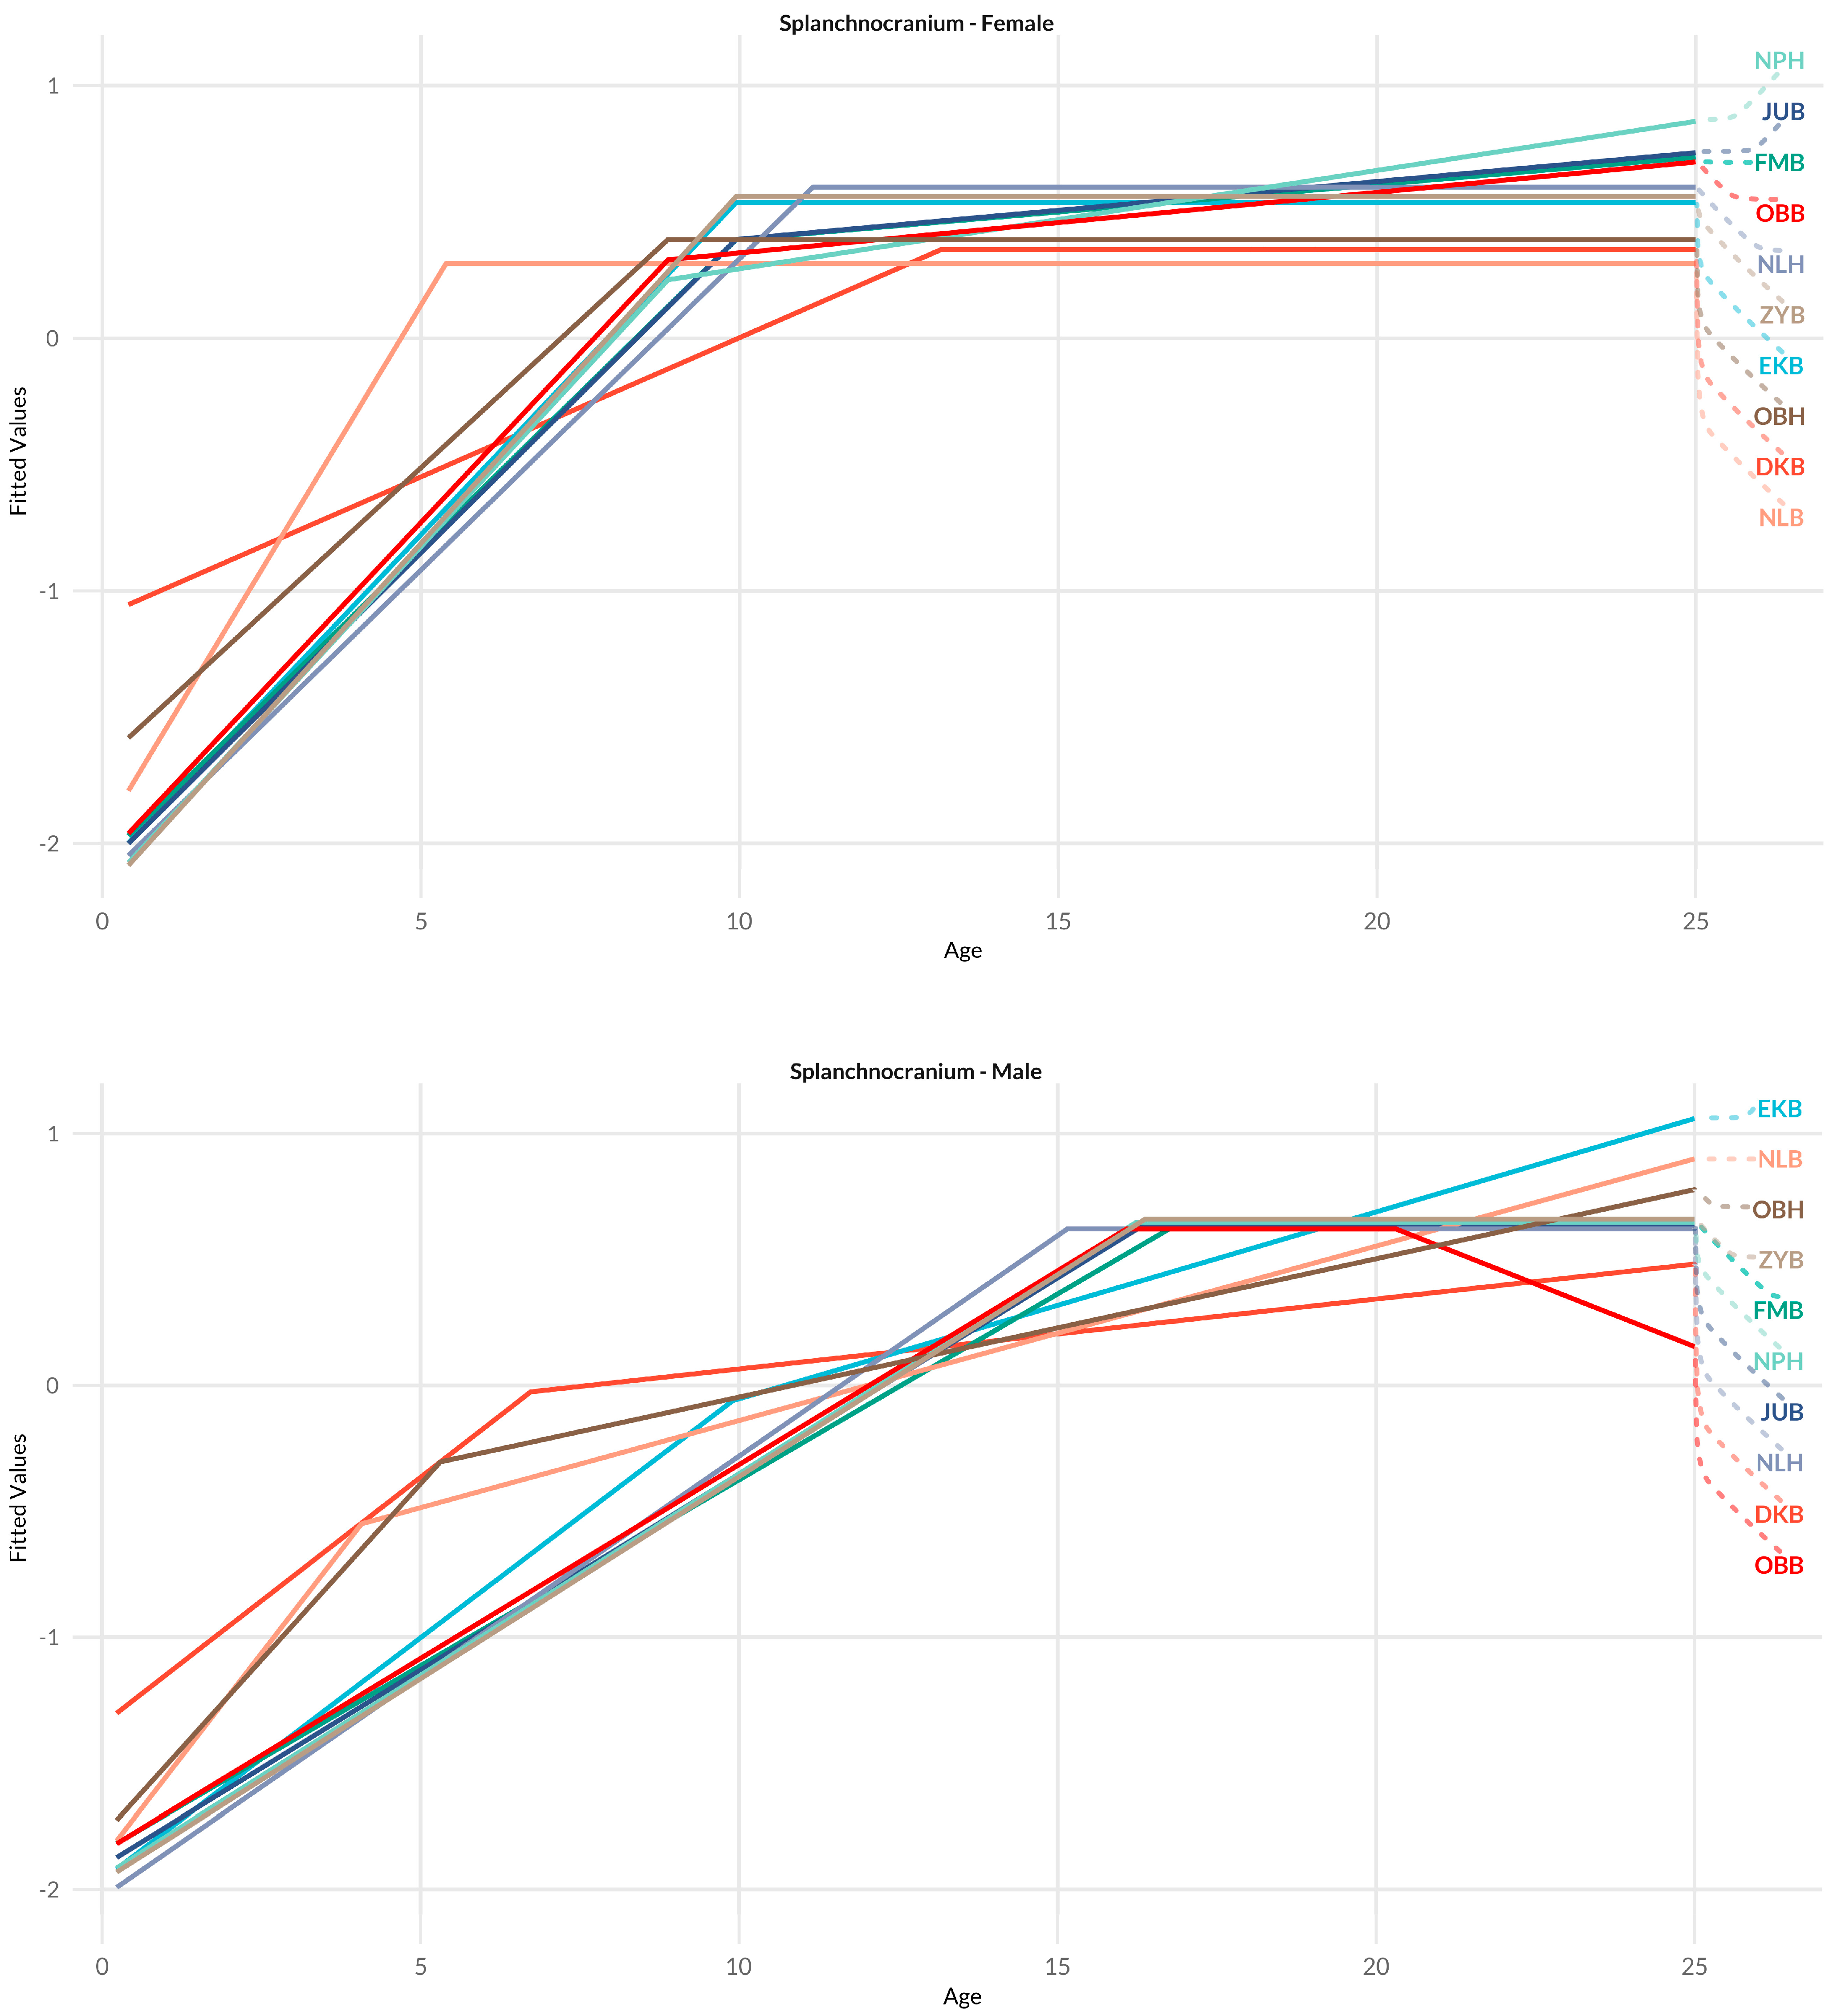
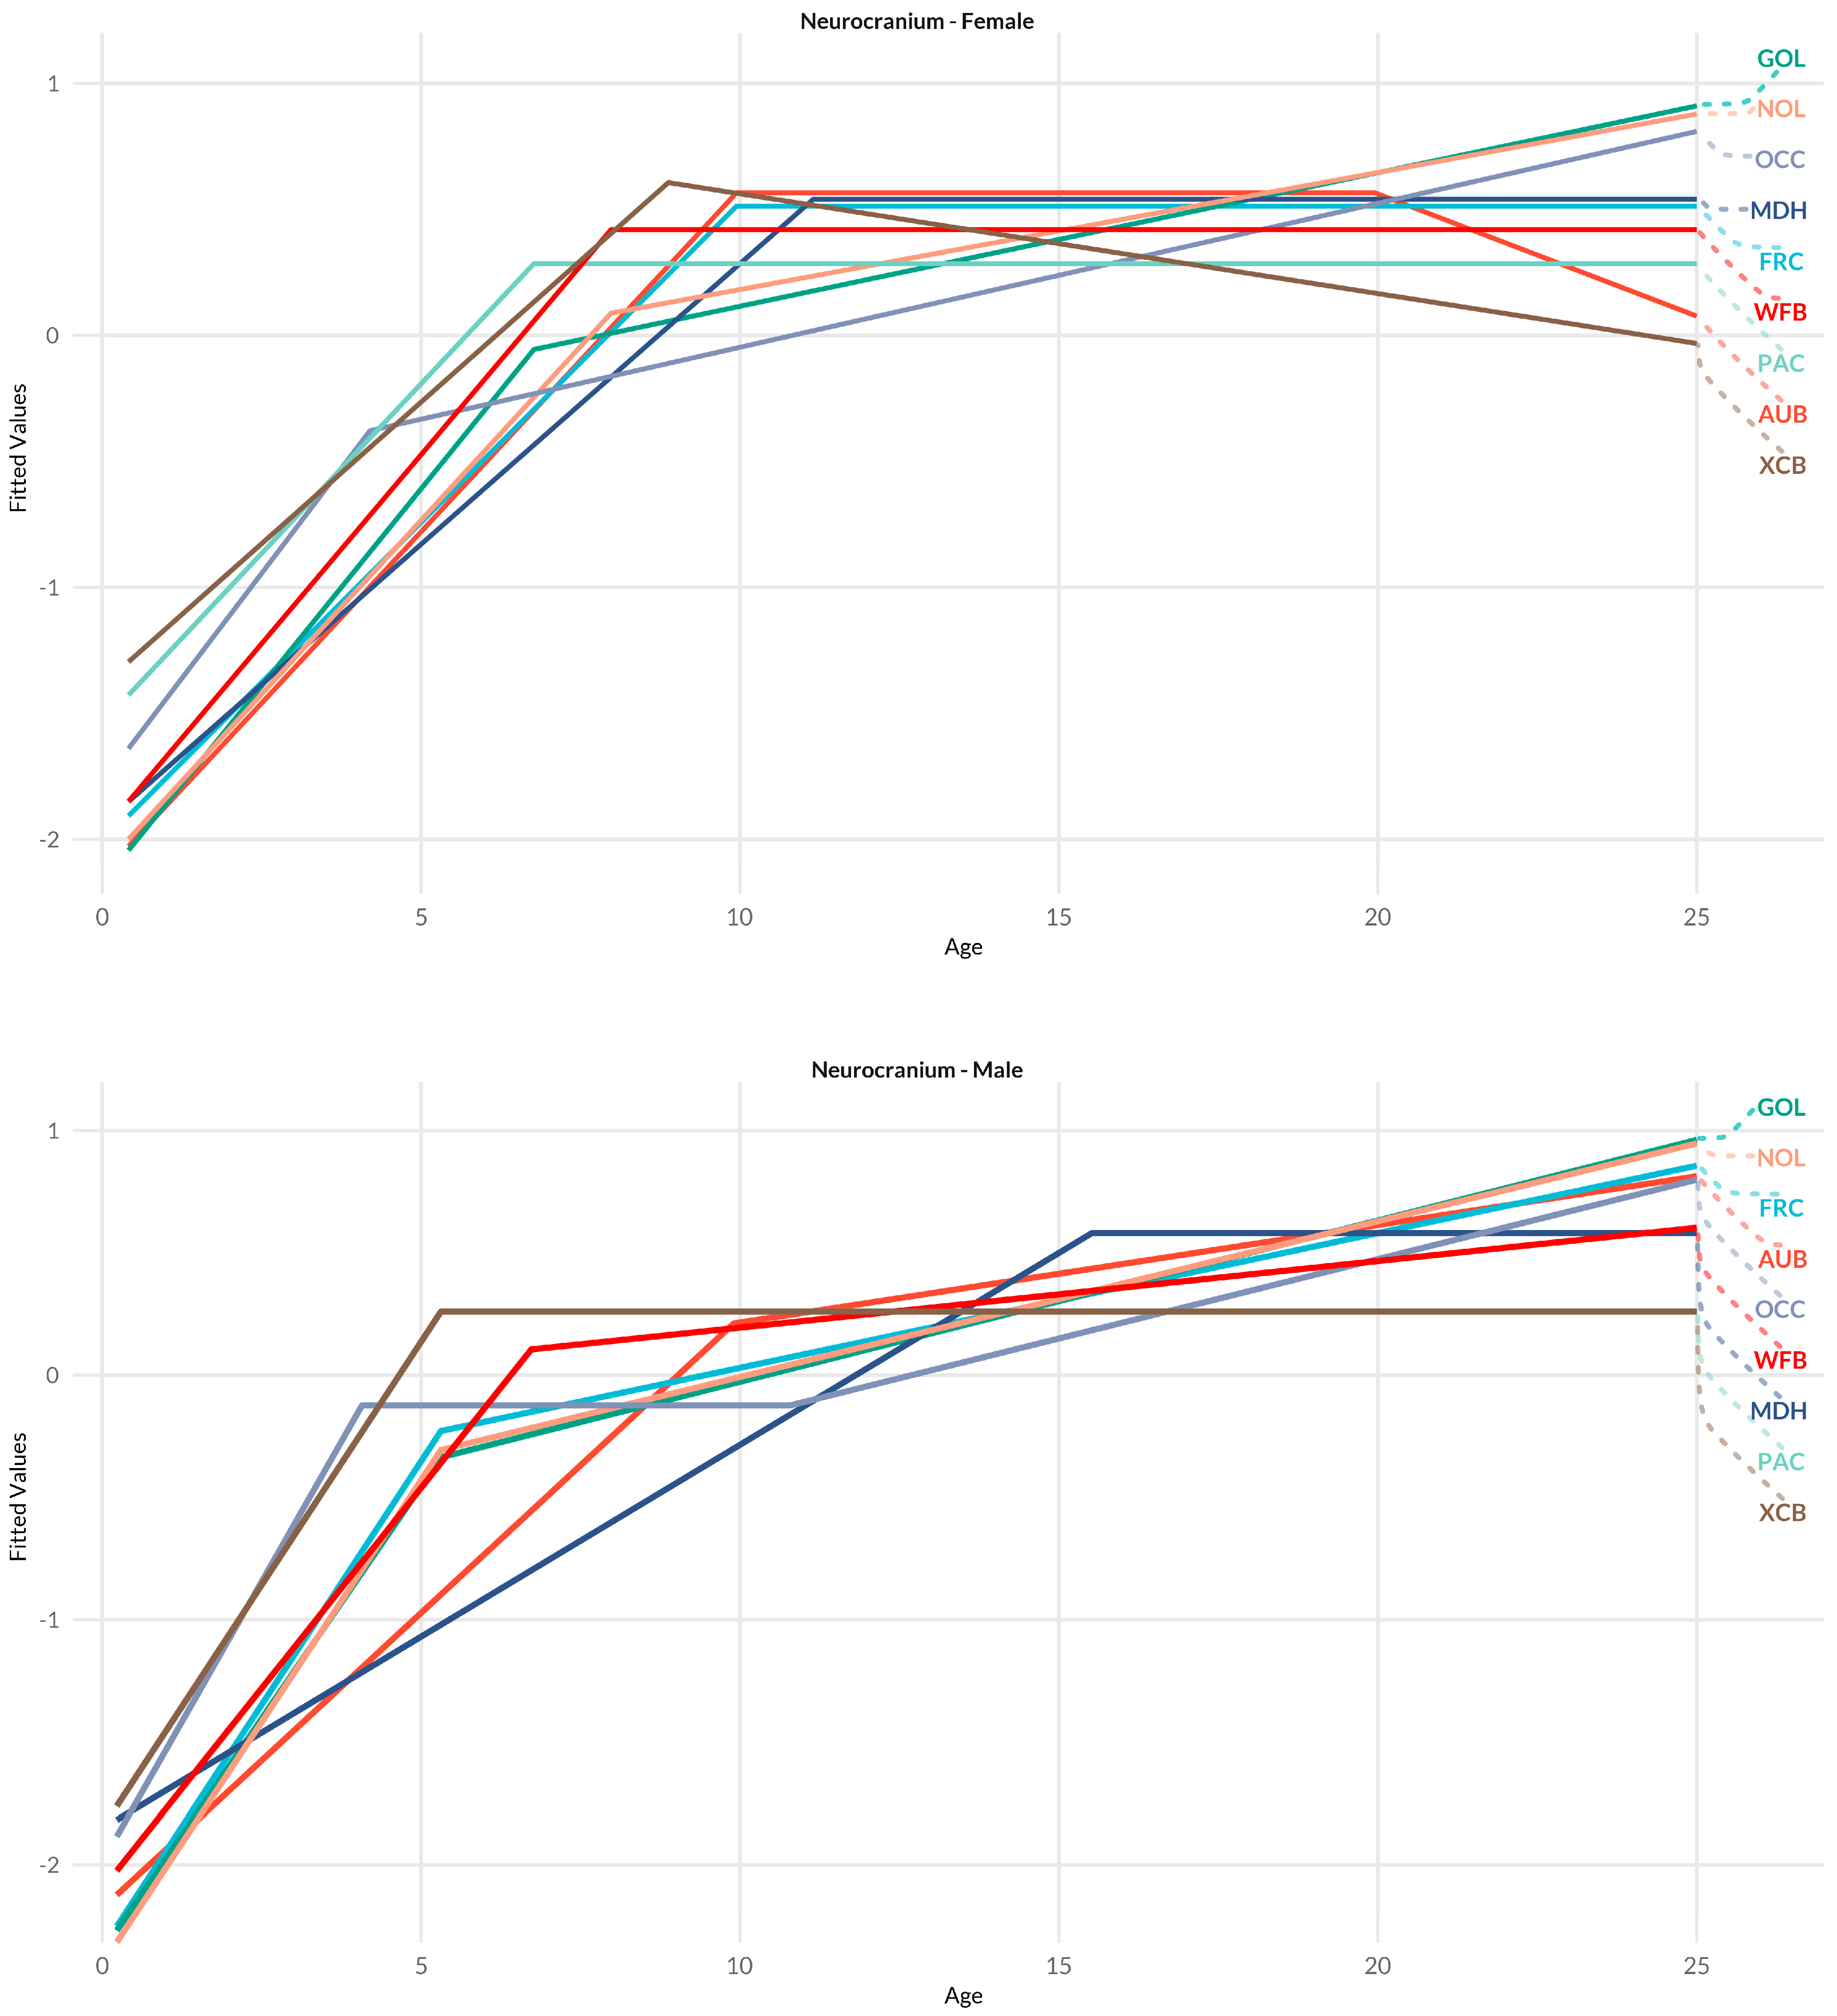
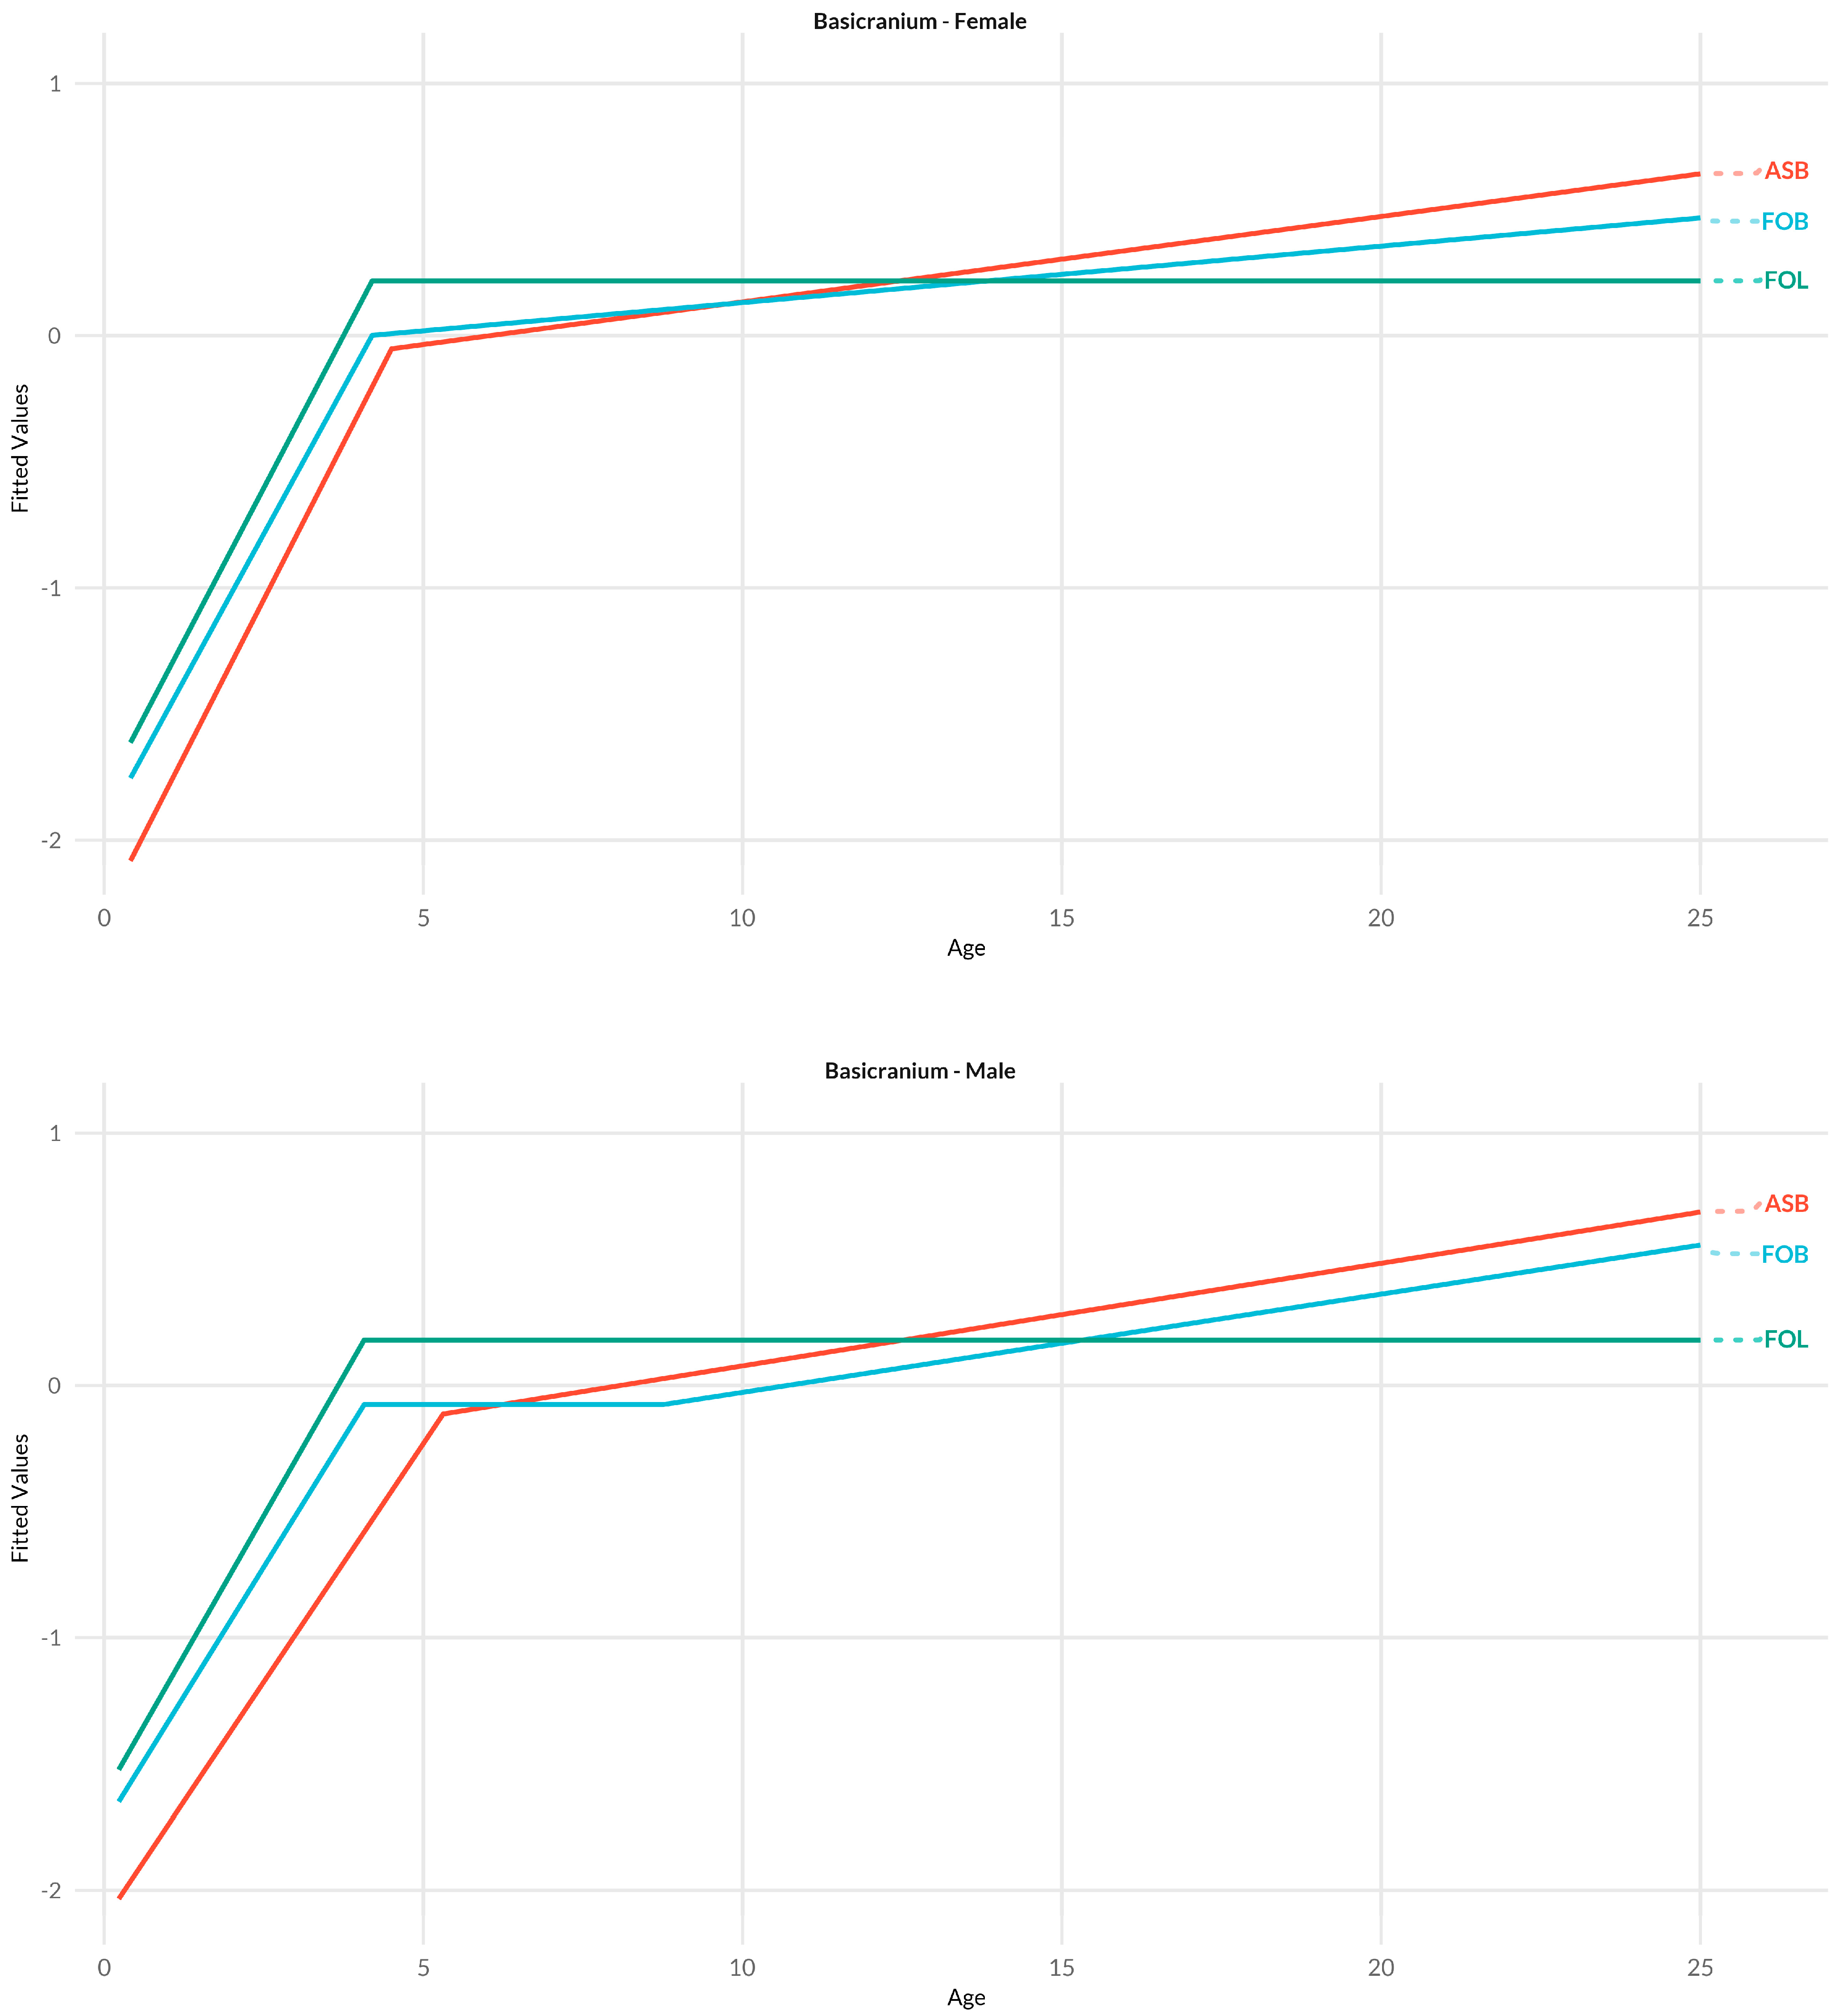
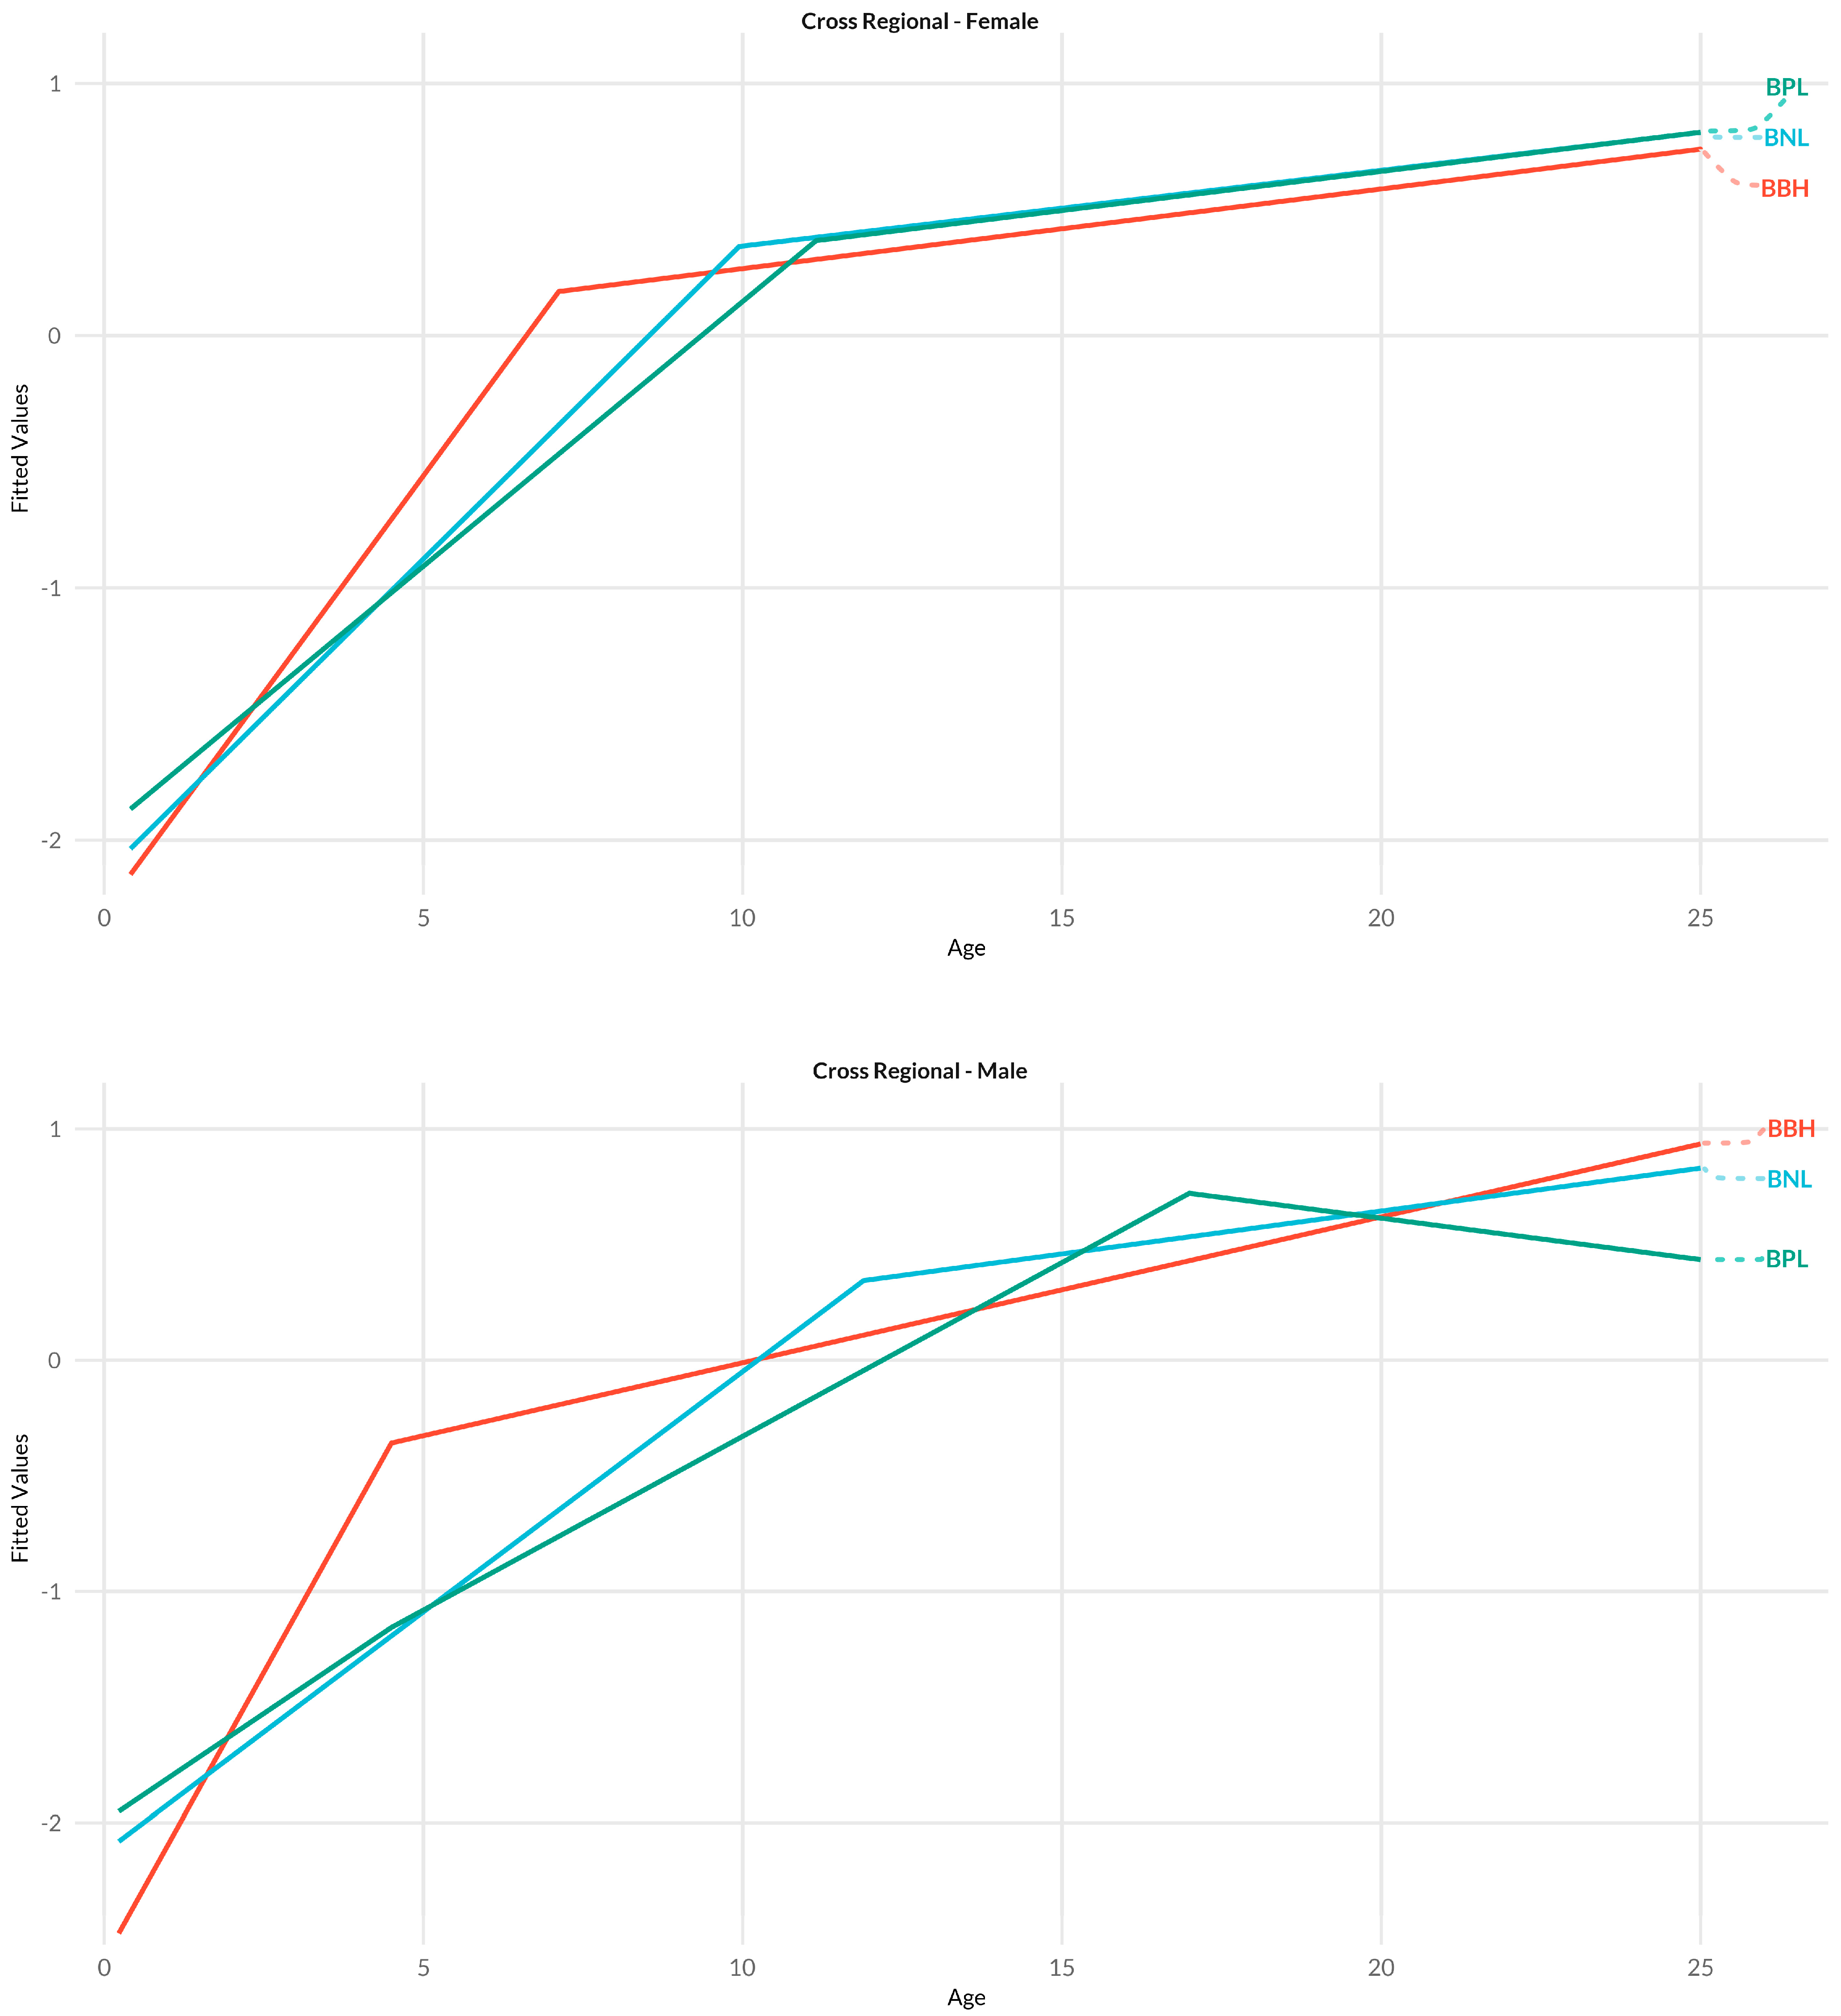
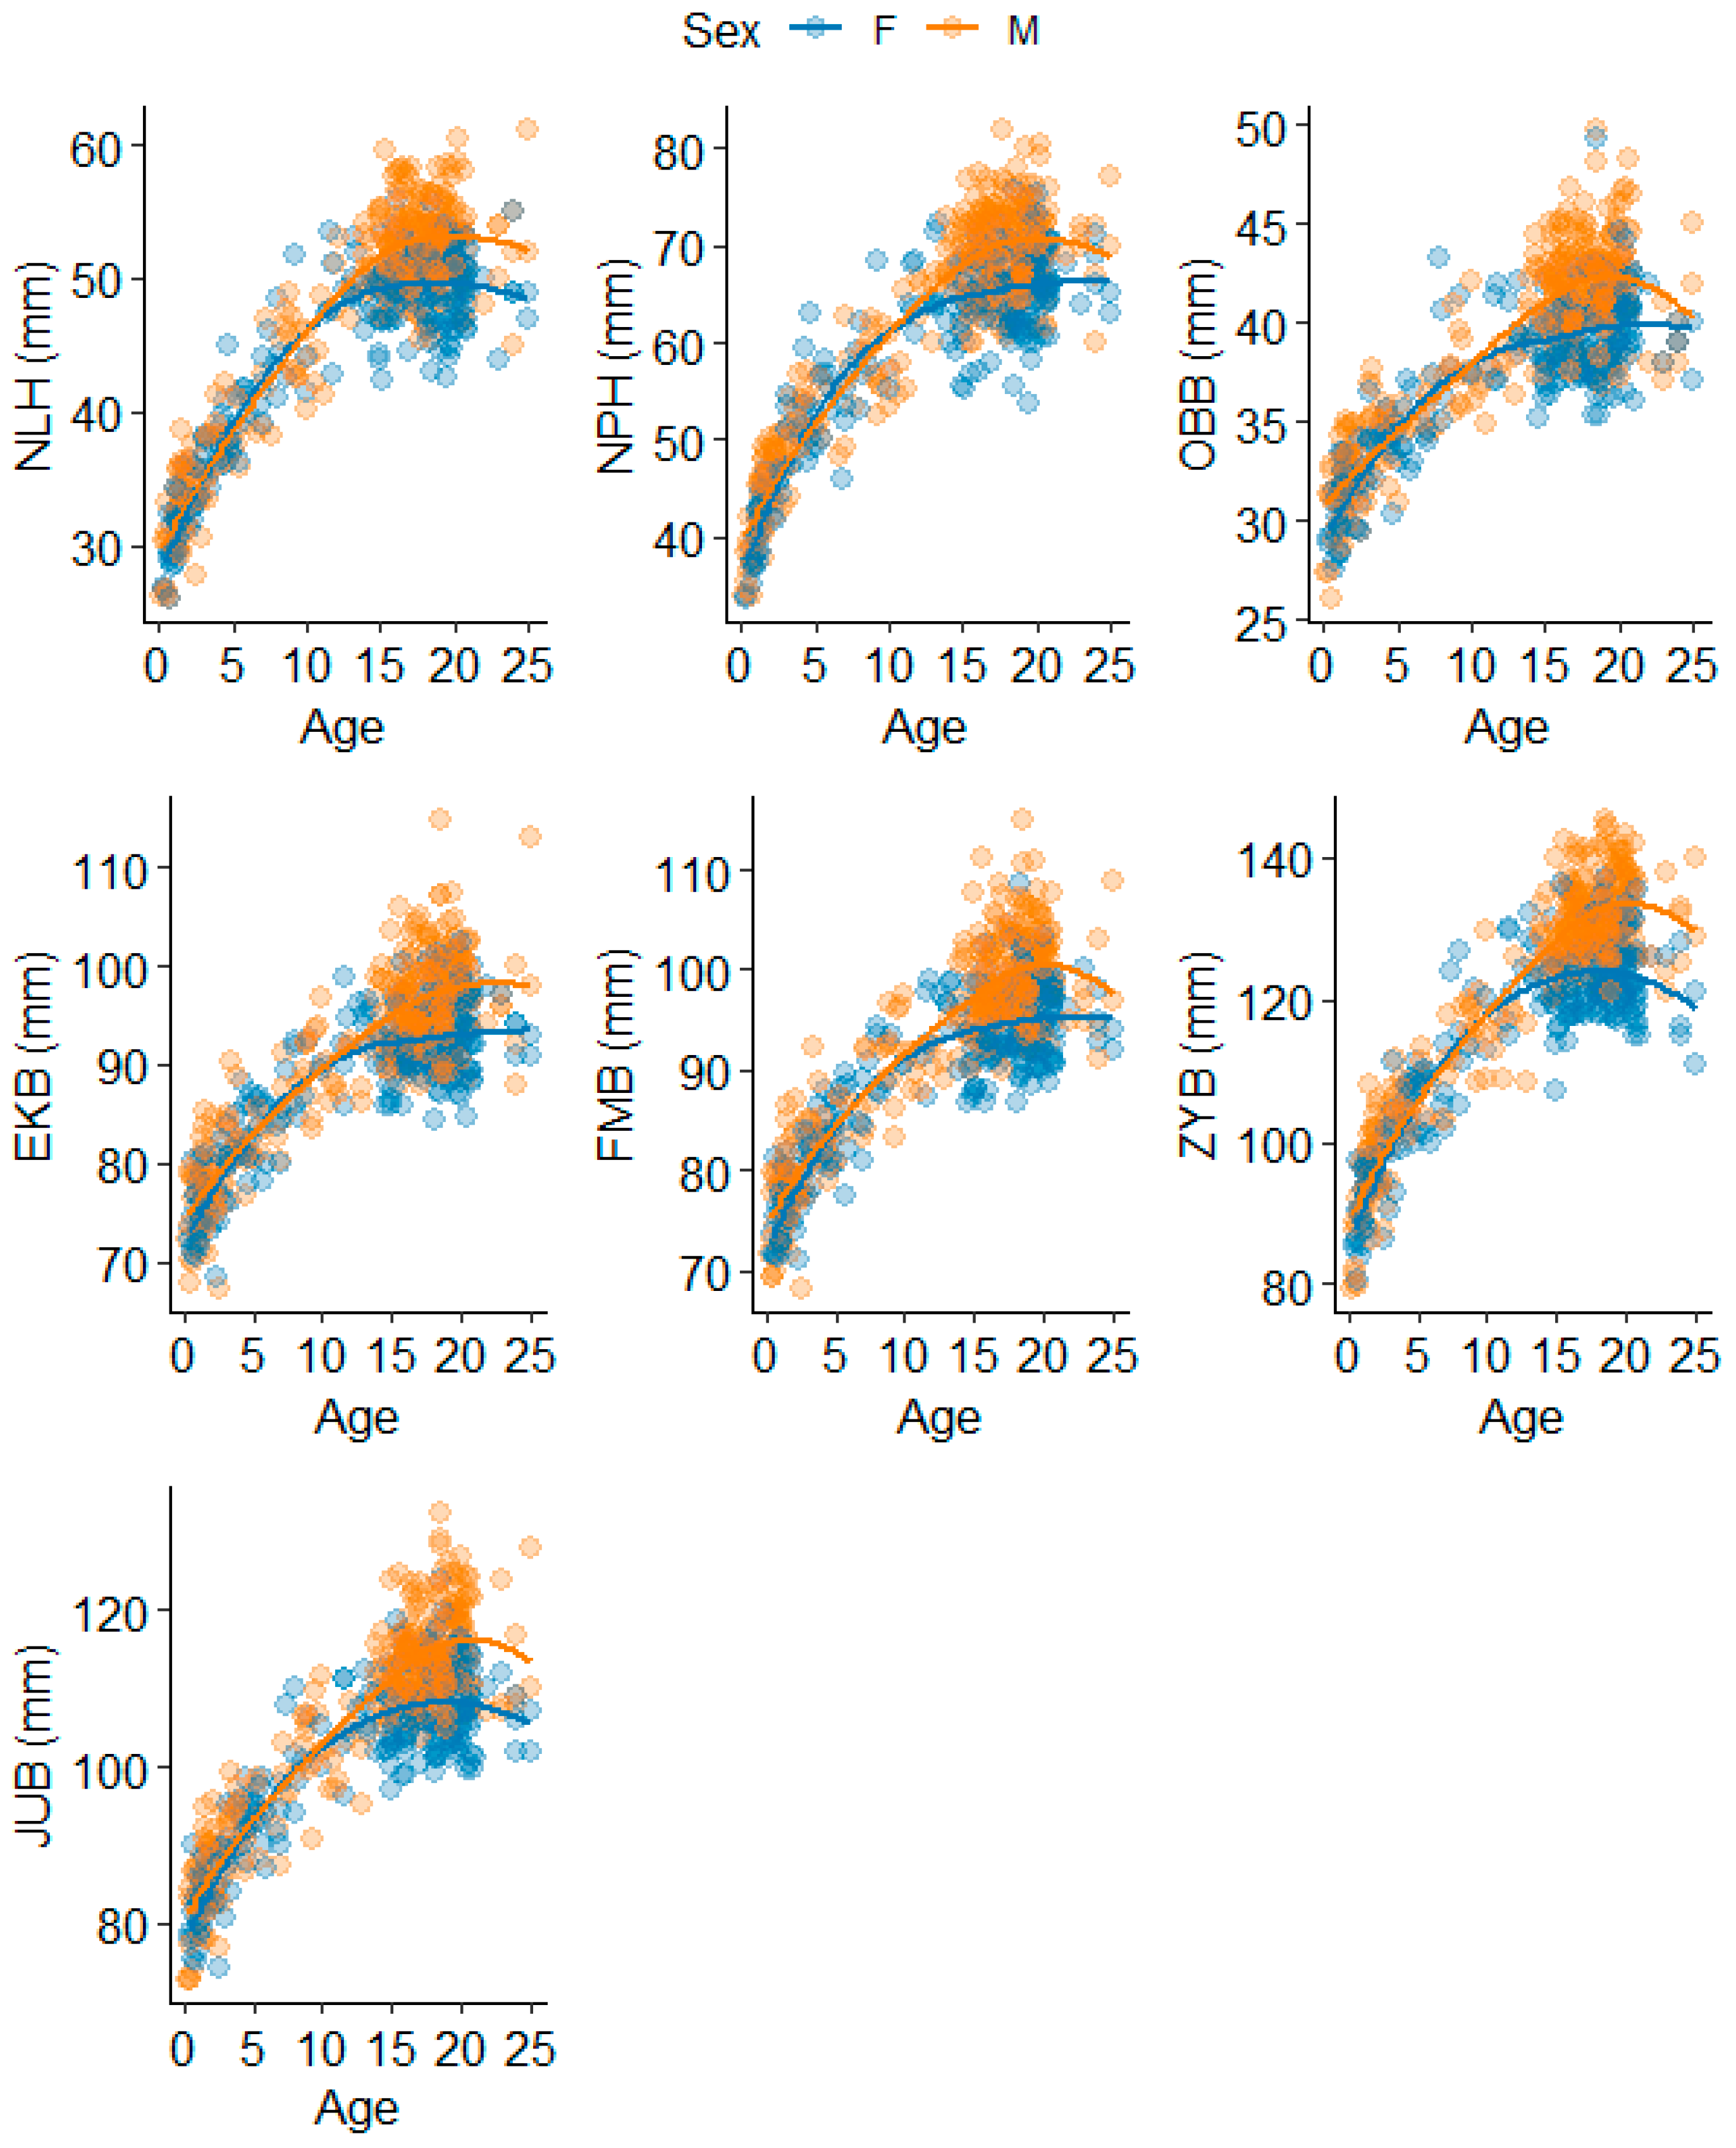
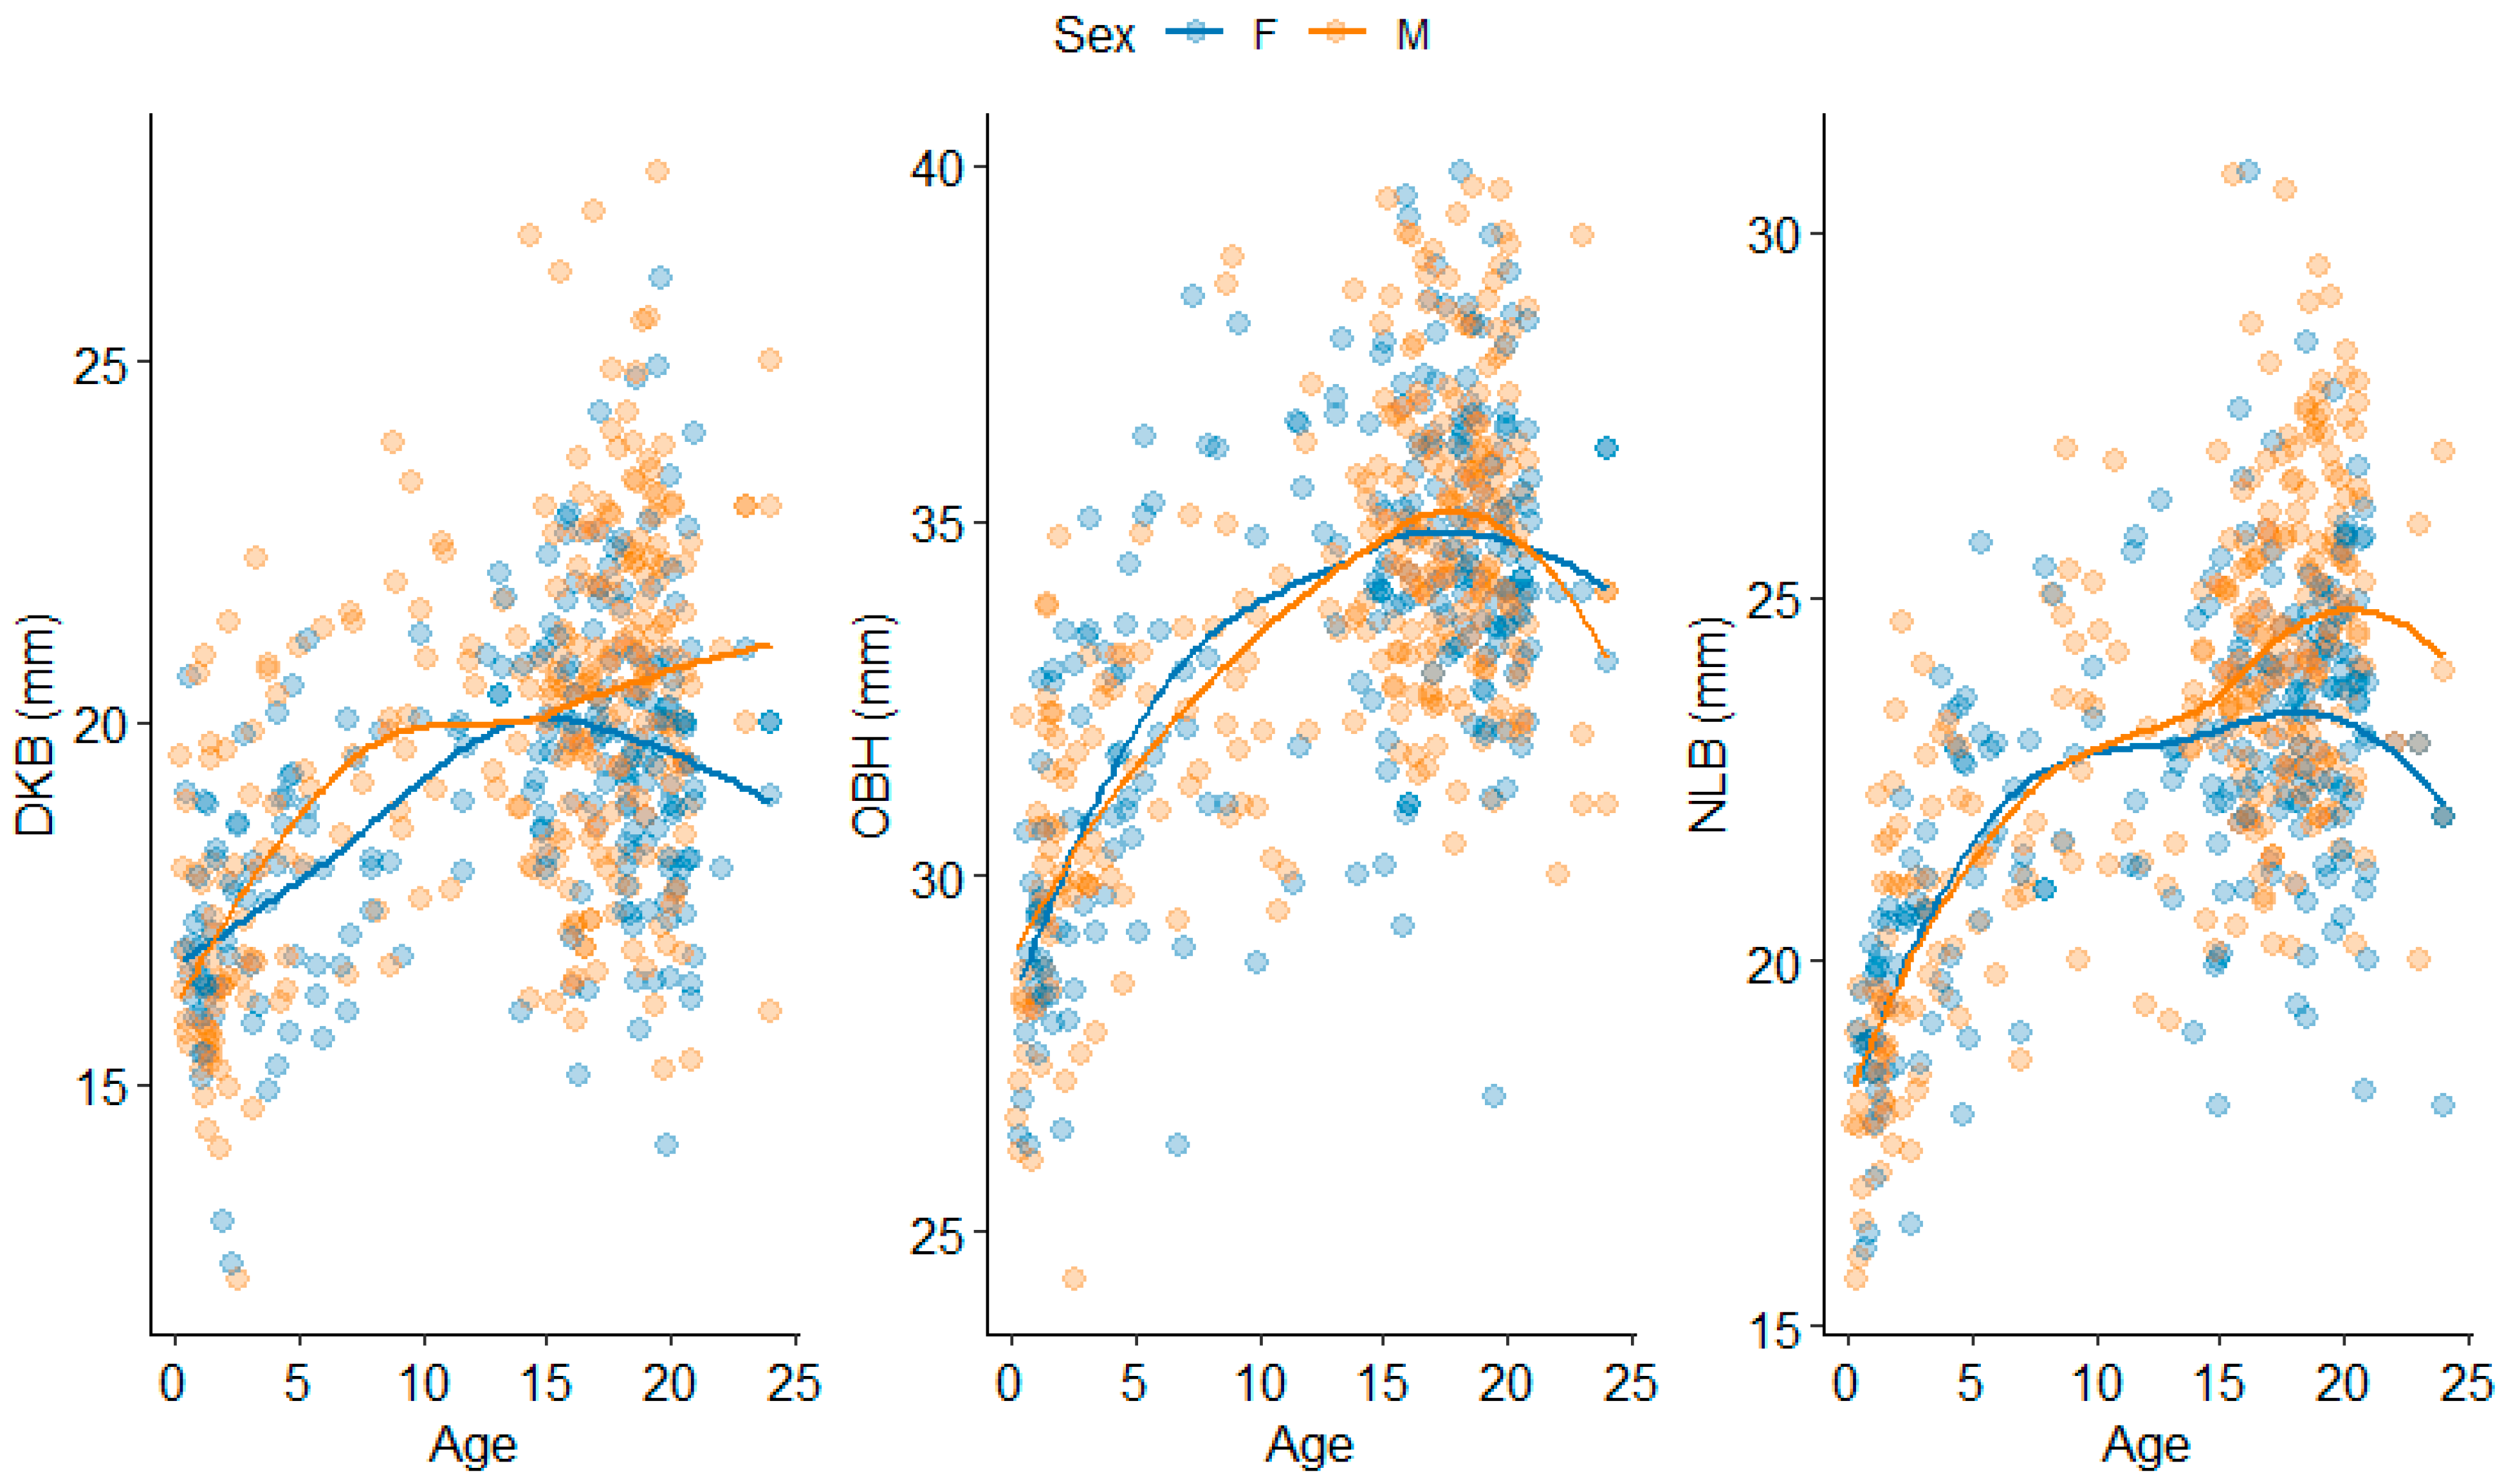
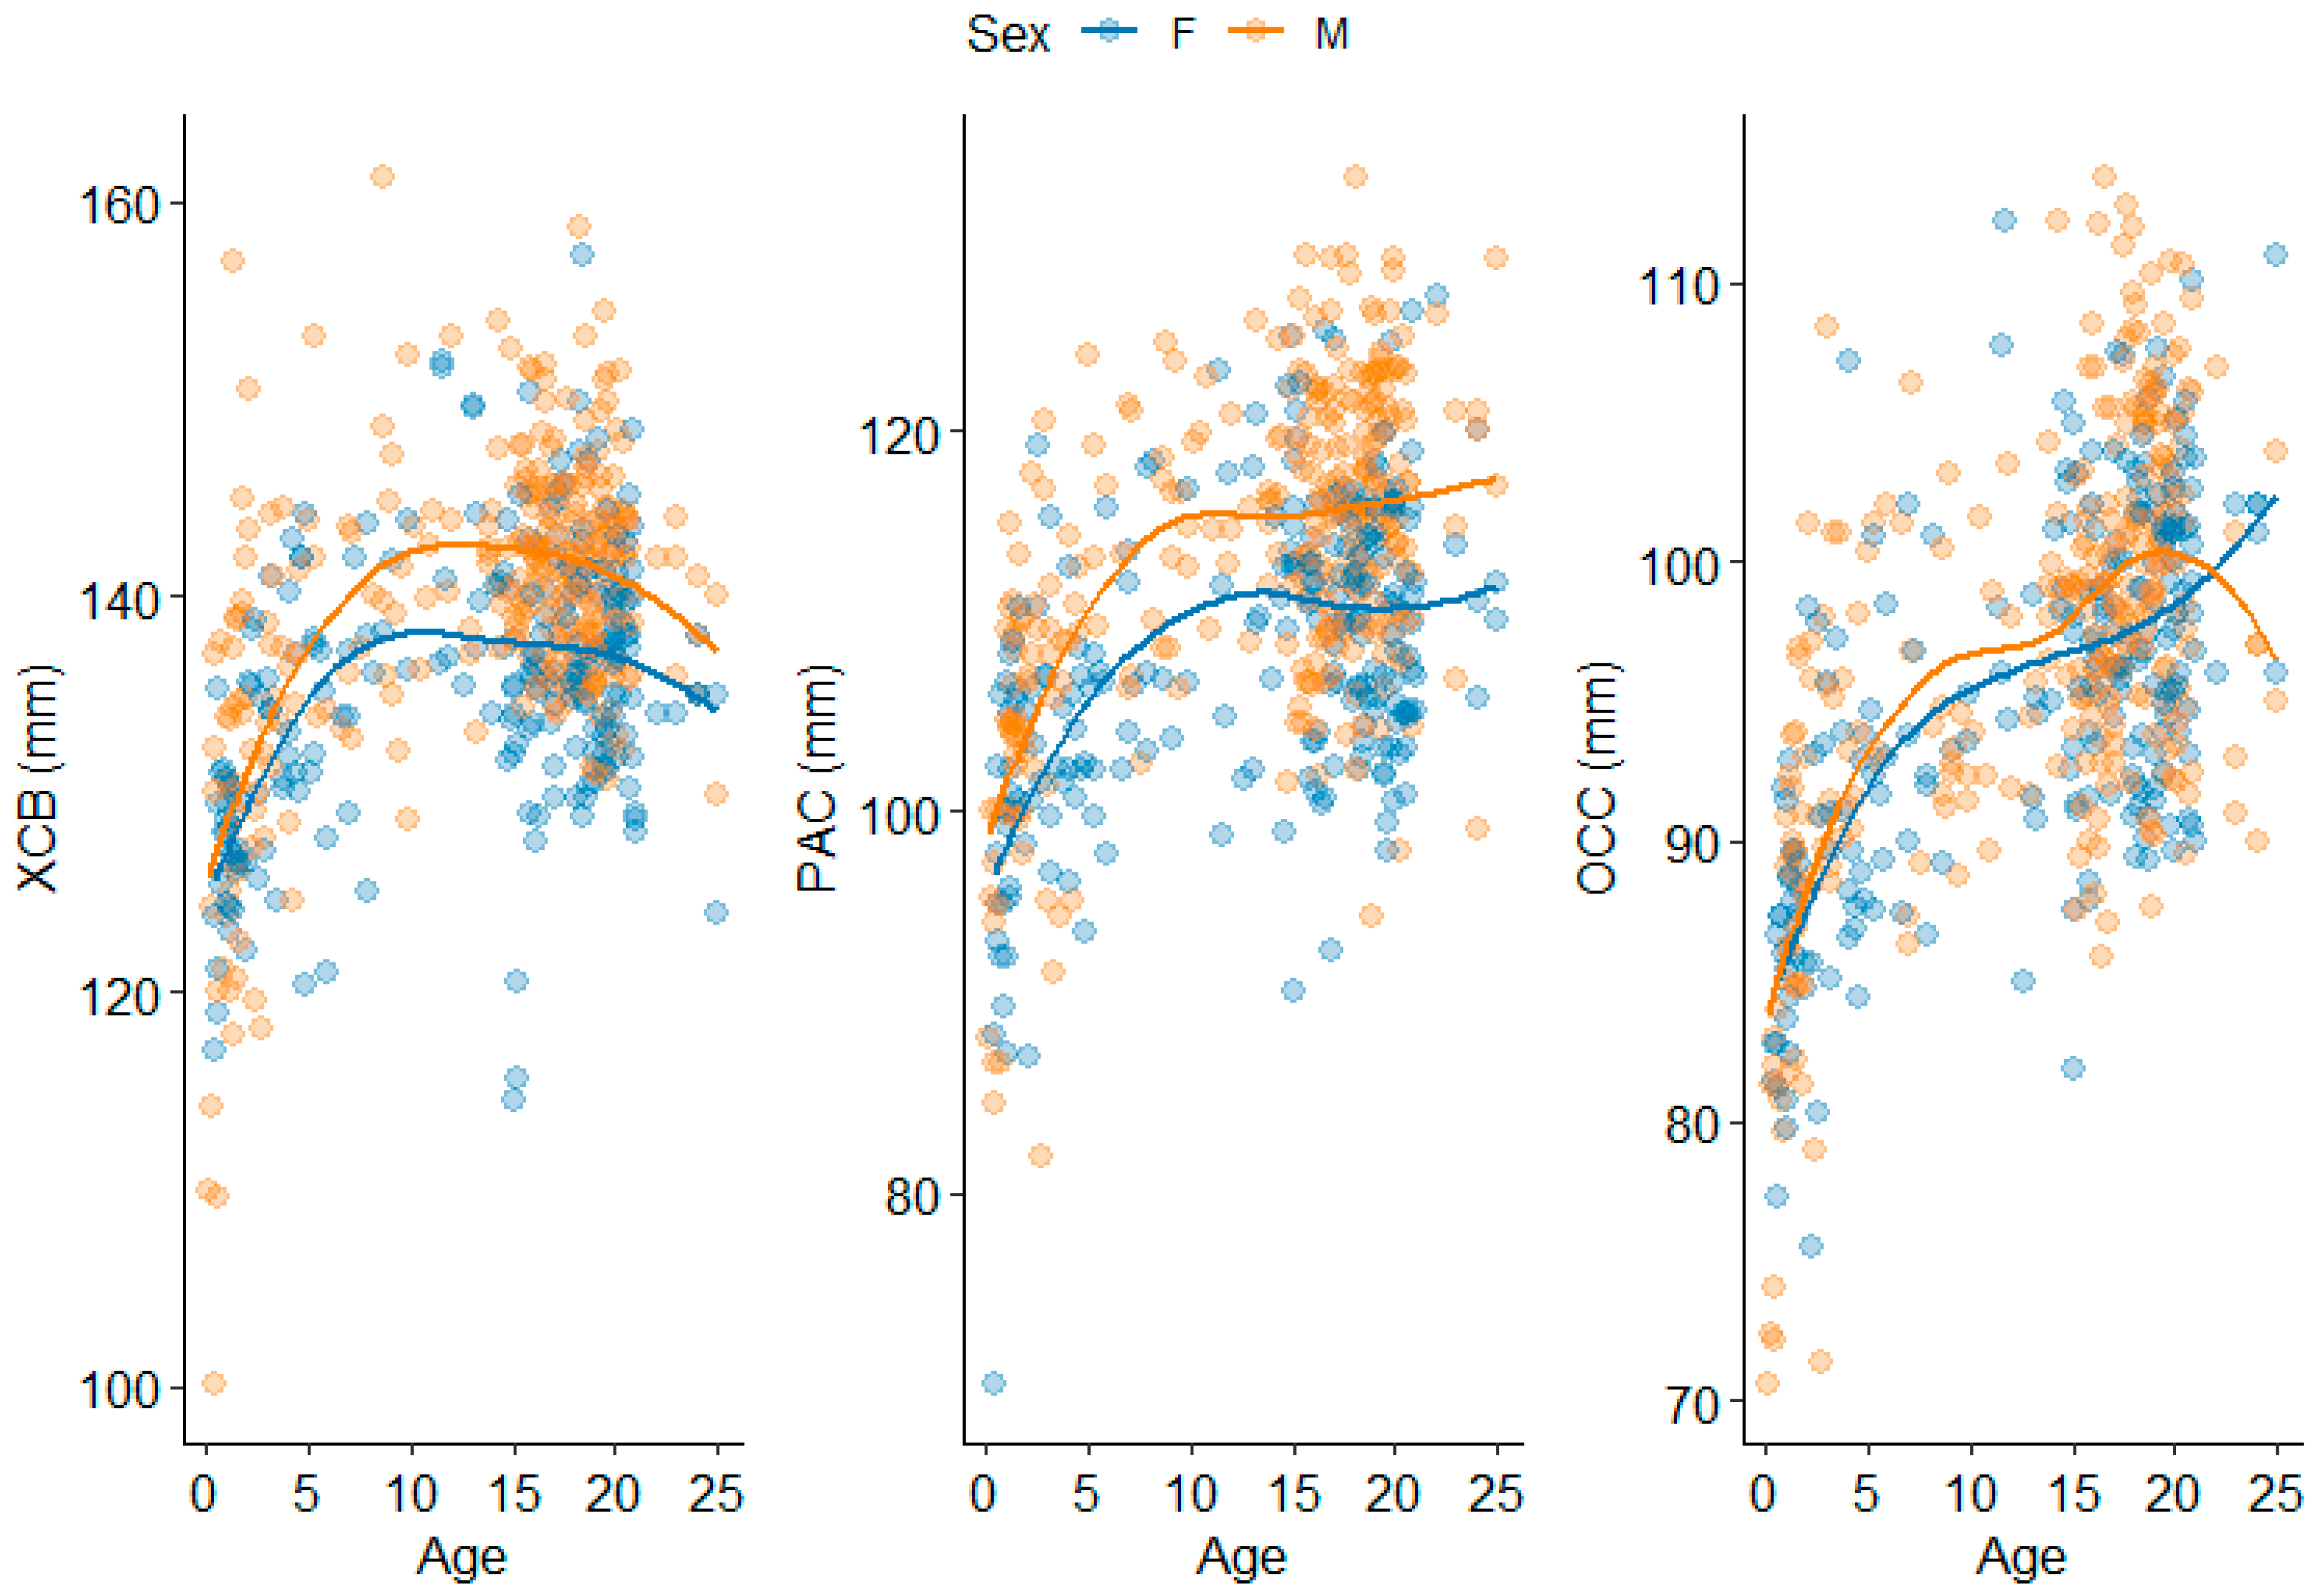
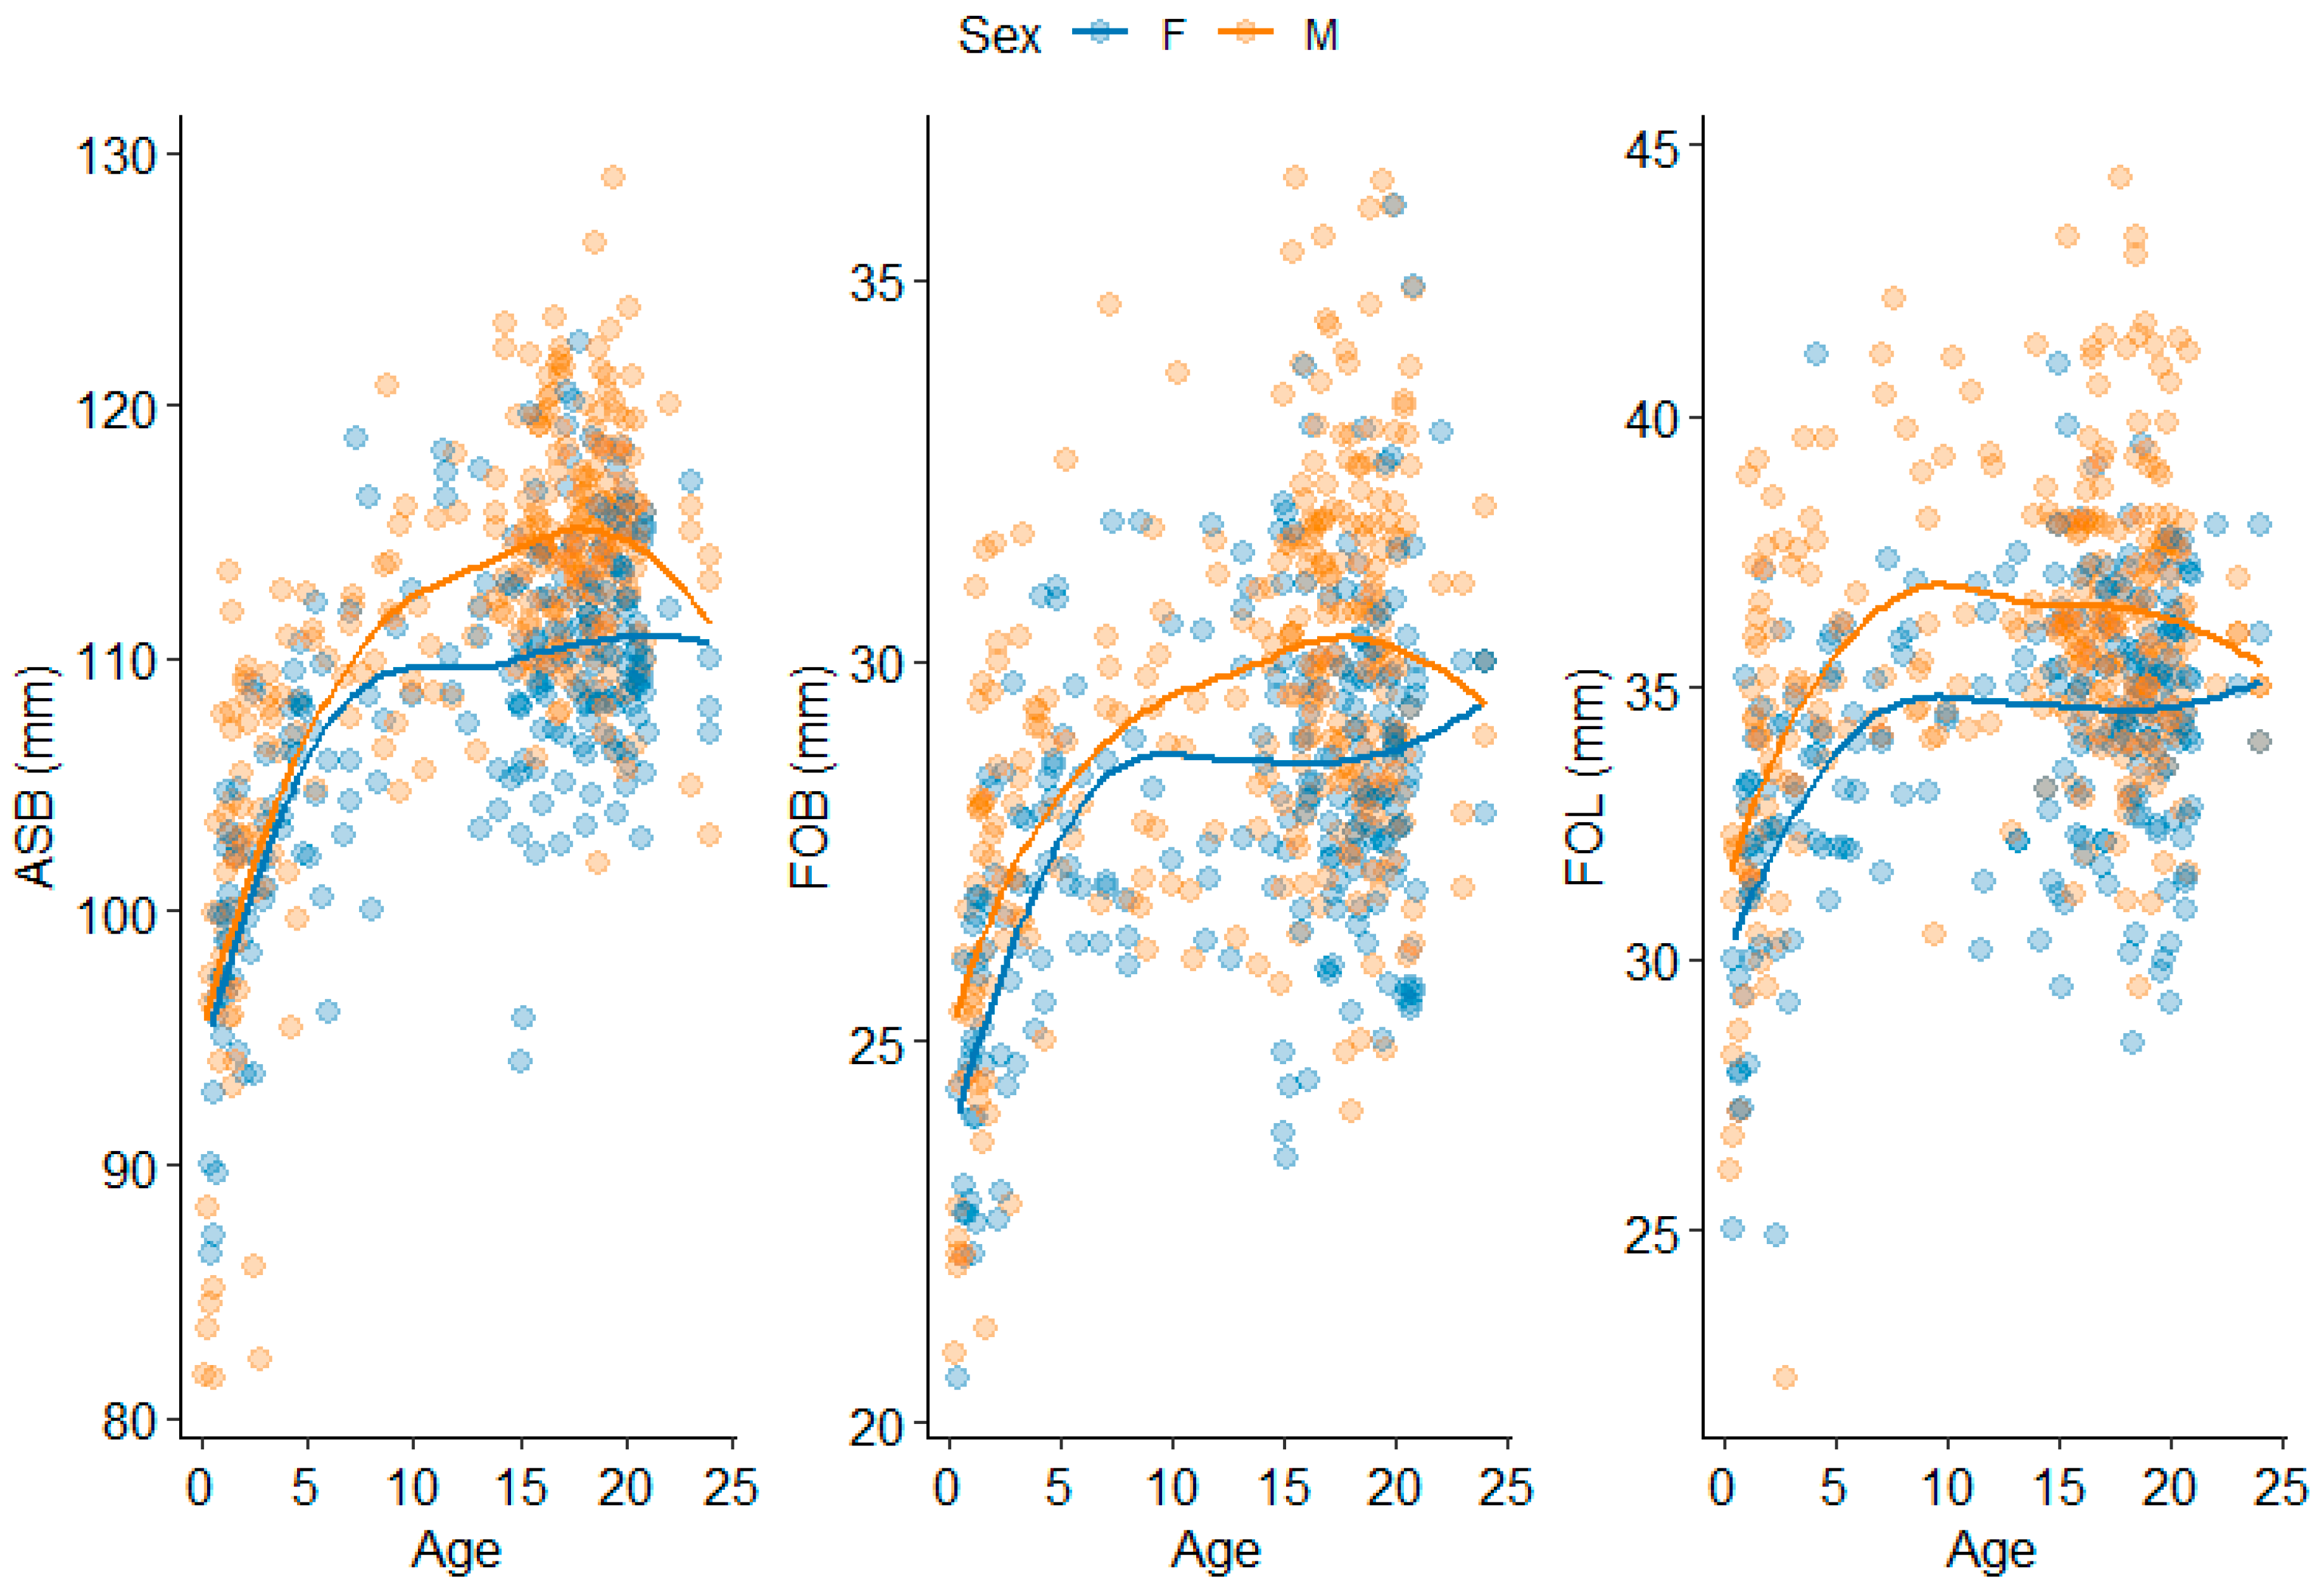
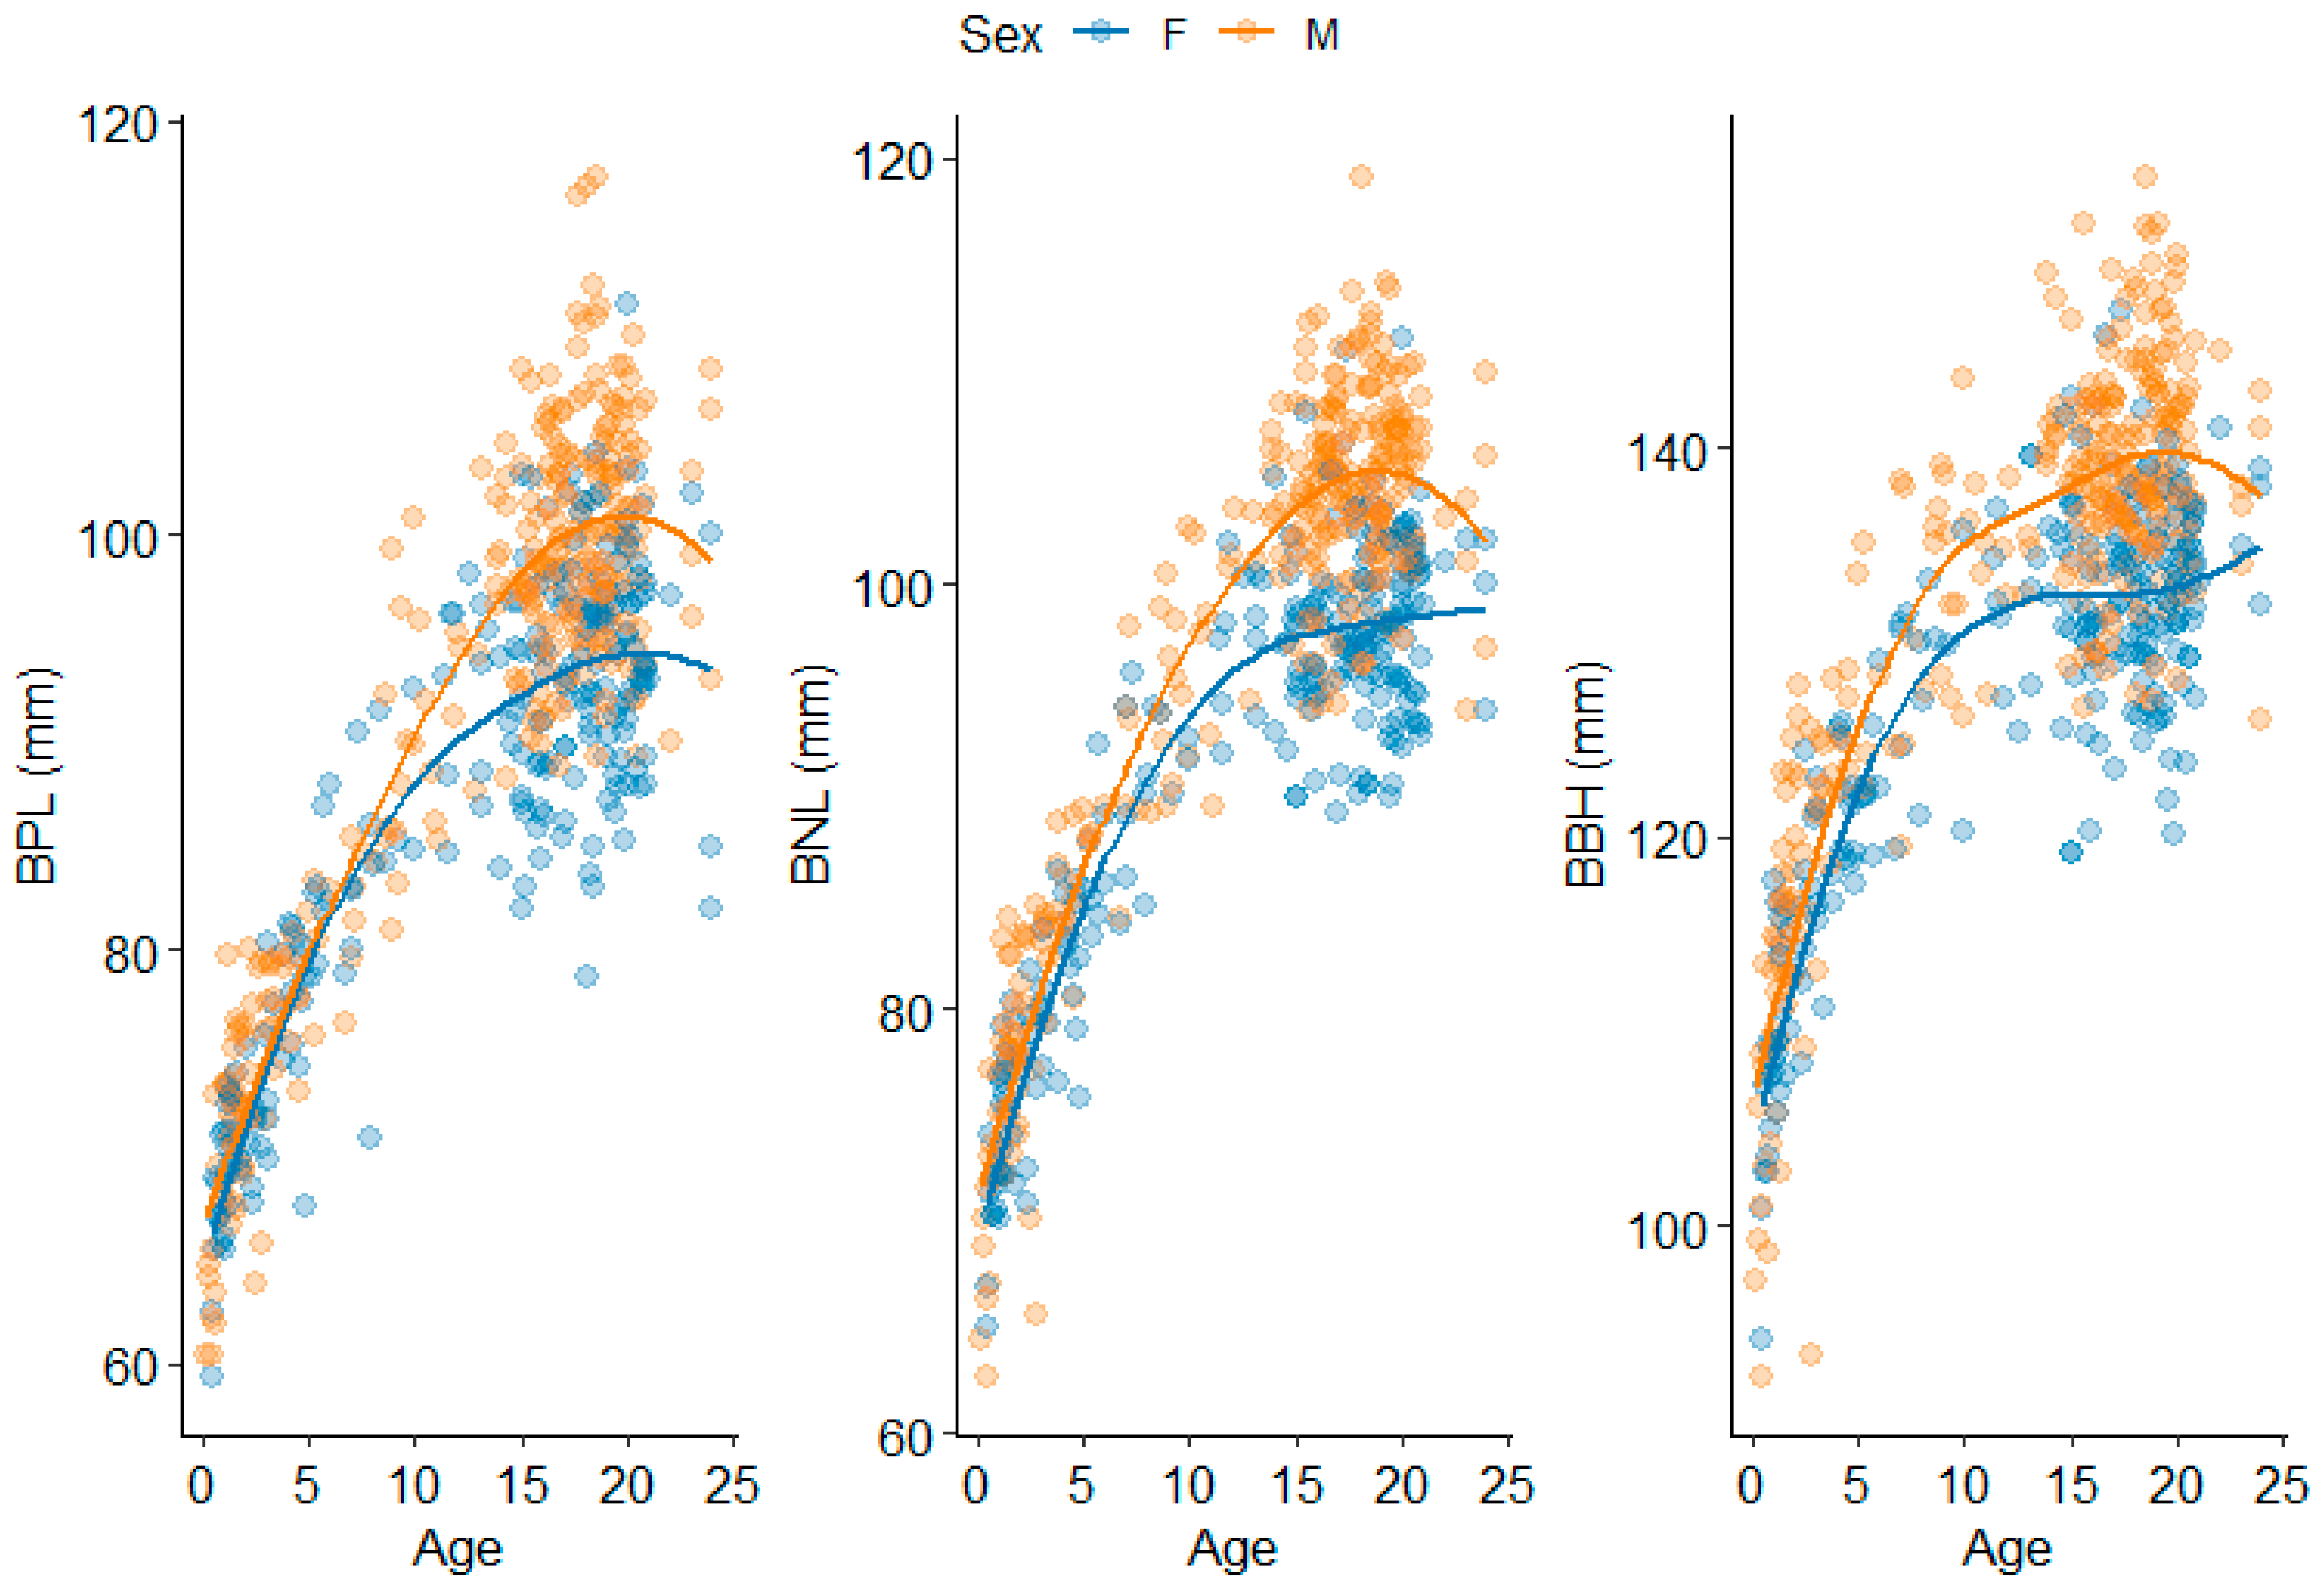
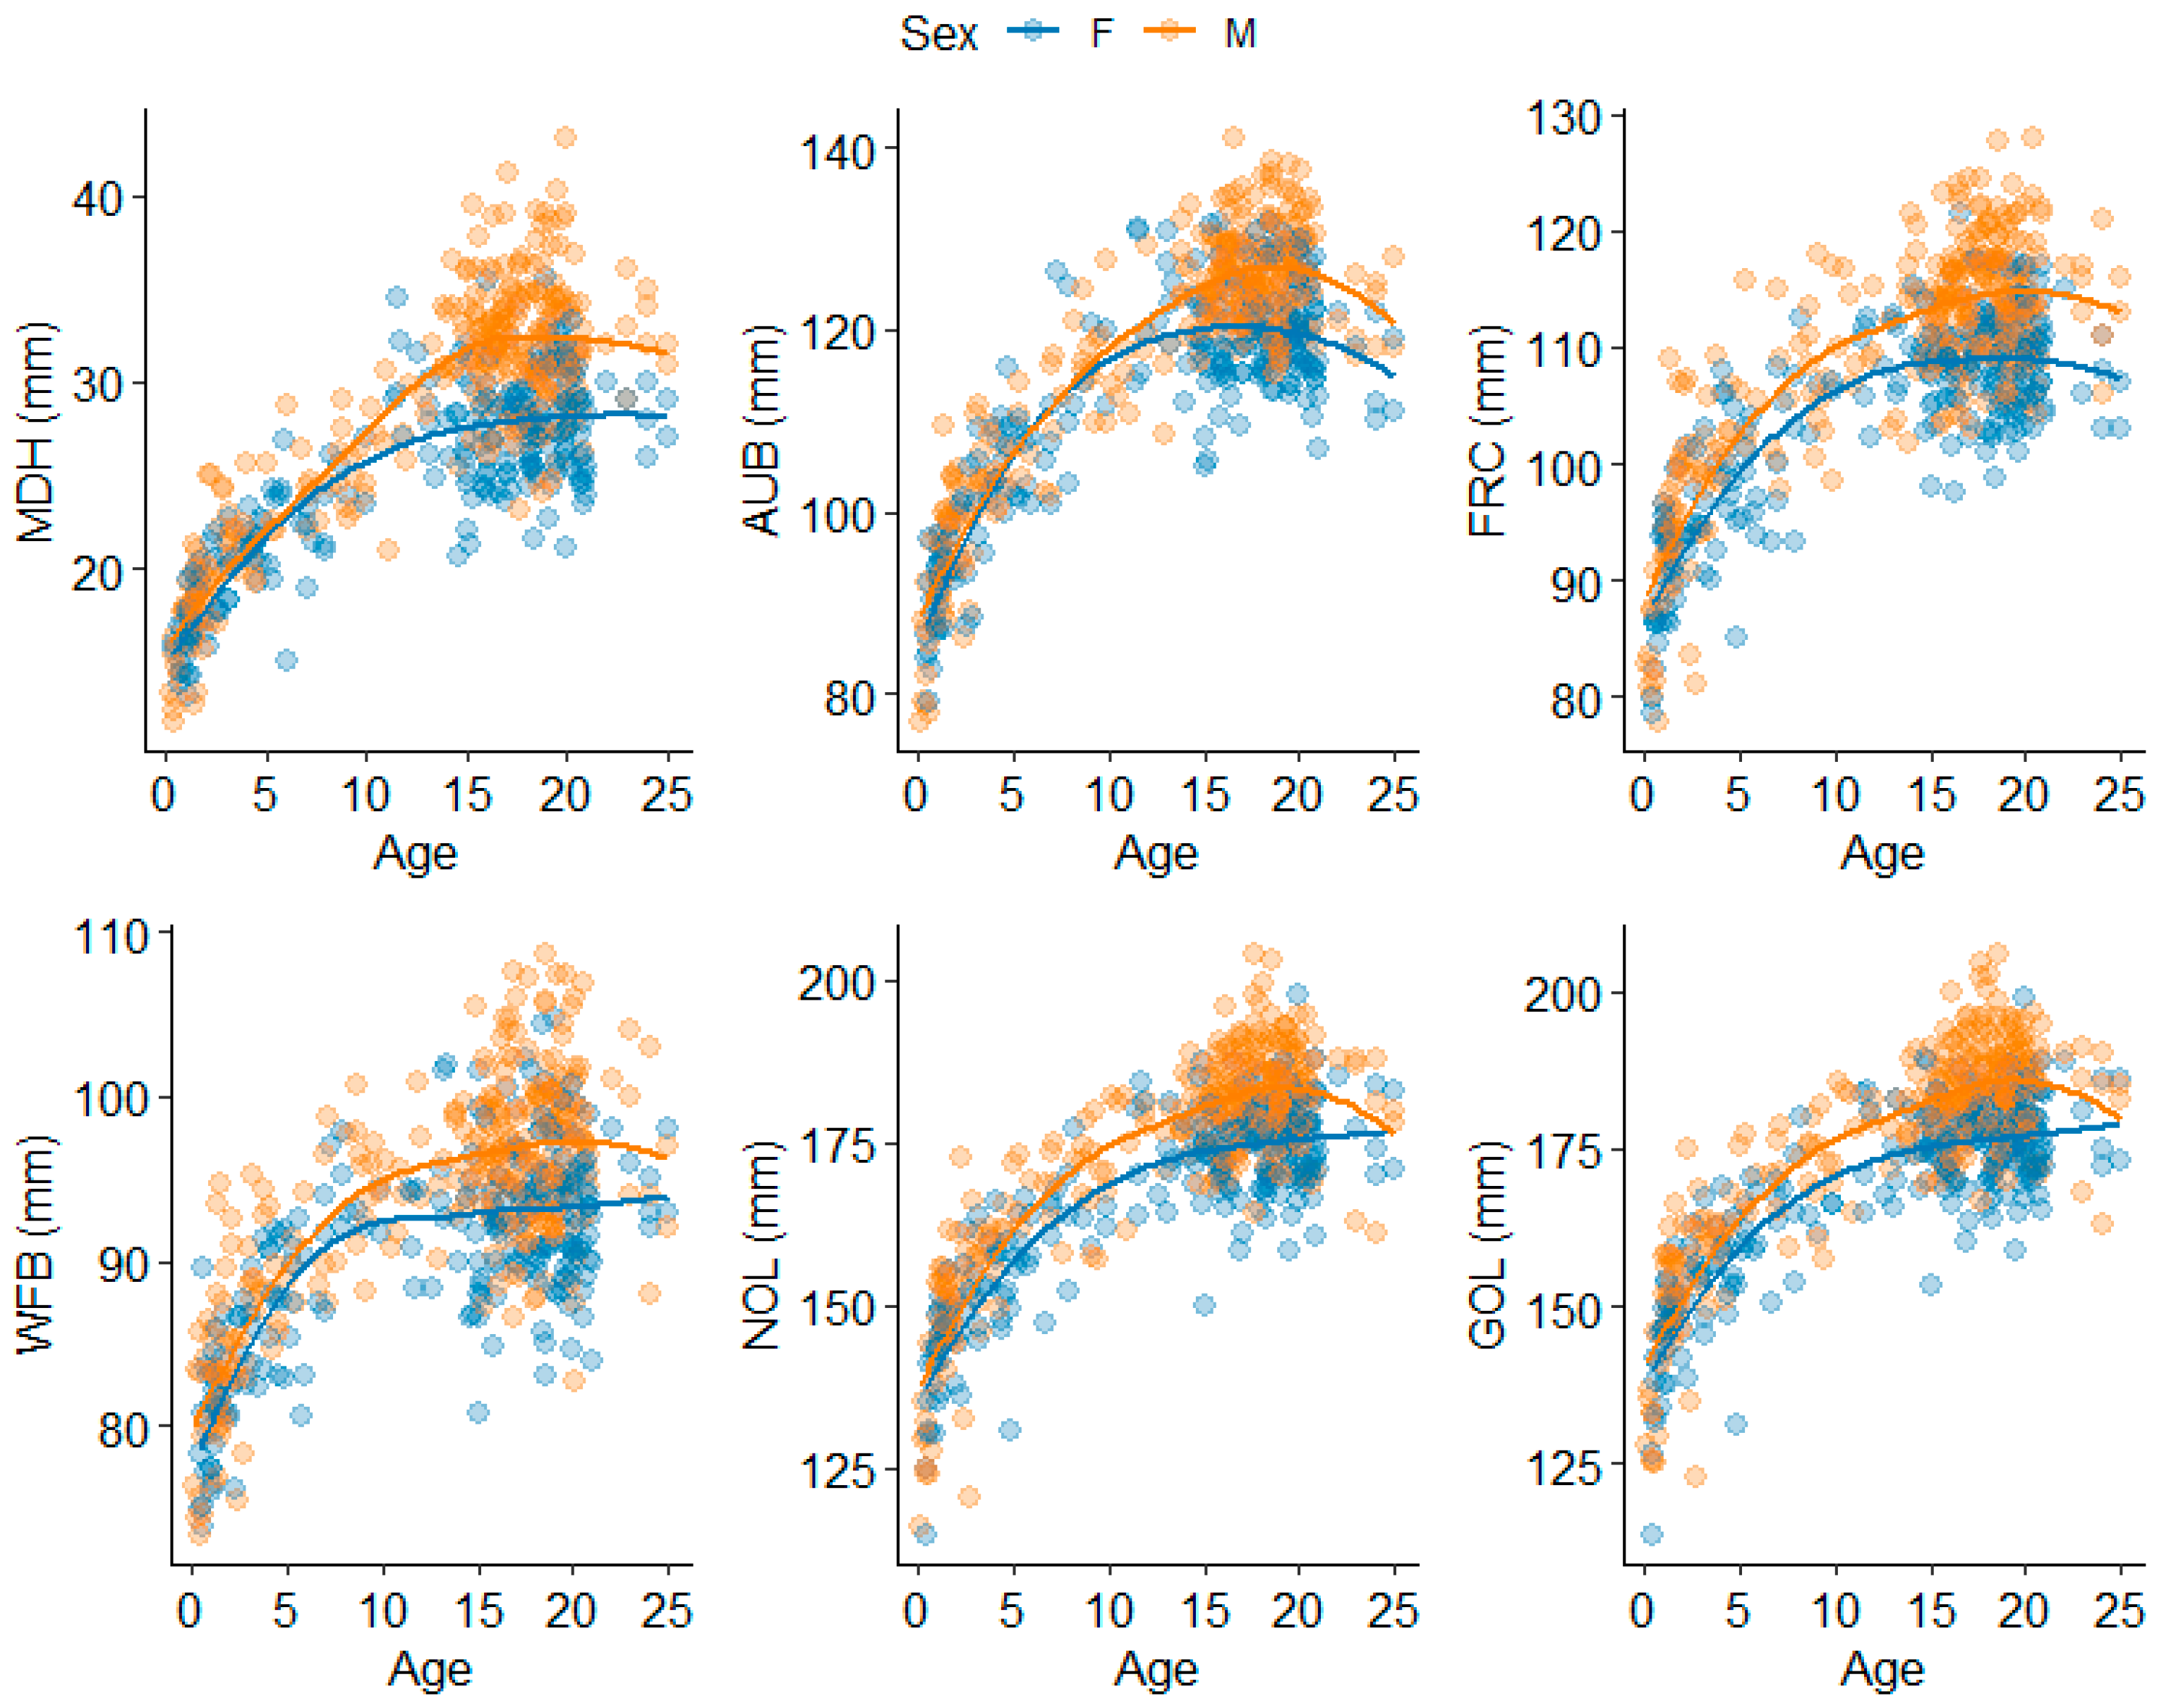
Fifty univariate MARS models were developed: one for each of the 25 ILDs regressed on age by each reported biological sex (male and female). Model information and performance metrics (knots, GCV, GRSq, and CVRSq) are provided in Table 2 and Figure 4 and Figure 5. Line plots are provided per cranial region with the fitted values for each ILD plotted by age in Figure 6, Figure 7, Figure 8 and Figure 9. The relationship between age and ILDs is heteroskedastic in most ILDs for both males and females, meaning that variance increases with age, and the magnitude of heteroskedasticity varies among the ILDs. The CVRSq values, which quantify the amount the variance in the ILD explained by age, range from 0.12 to 0.85. Males and females have similar CVRSq ranges for each ILD with a few minor exceptions (BPL, NLB, OBH, PAC, and XCB) (Table 2, Figure 4). For example, the ILDs with the lowest (FOL) and highest (NLH) CVRSq values were the same for each sex (Figure 4). Low CVRSq values (<0.5) were obtained for ASB, DKB, FOB, FOL, NLB, OBH, OCC, PAC, and XCB, which suggests that the variability in these ILDs is not well-explained by age. FOL had the lowest CVRSq values in all models. The slope for the FOL model is steep between birth and ~4 years, attesting to rapid growth followed by consistently high variability until adulthood. In contrast, NLH is more strongly related to age, which is captured by the high CVRSq value of the NLH model and a later knot (~11 years for females and ~15 years for males) after which growth plateaus and variance stabilizes.
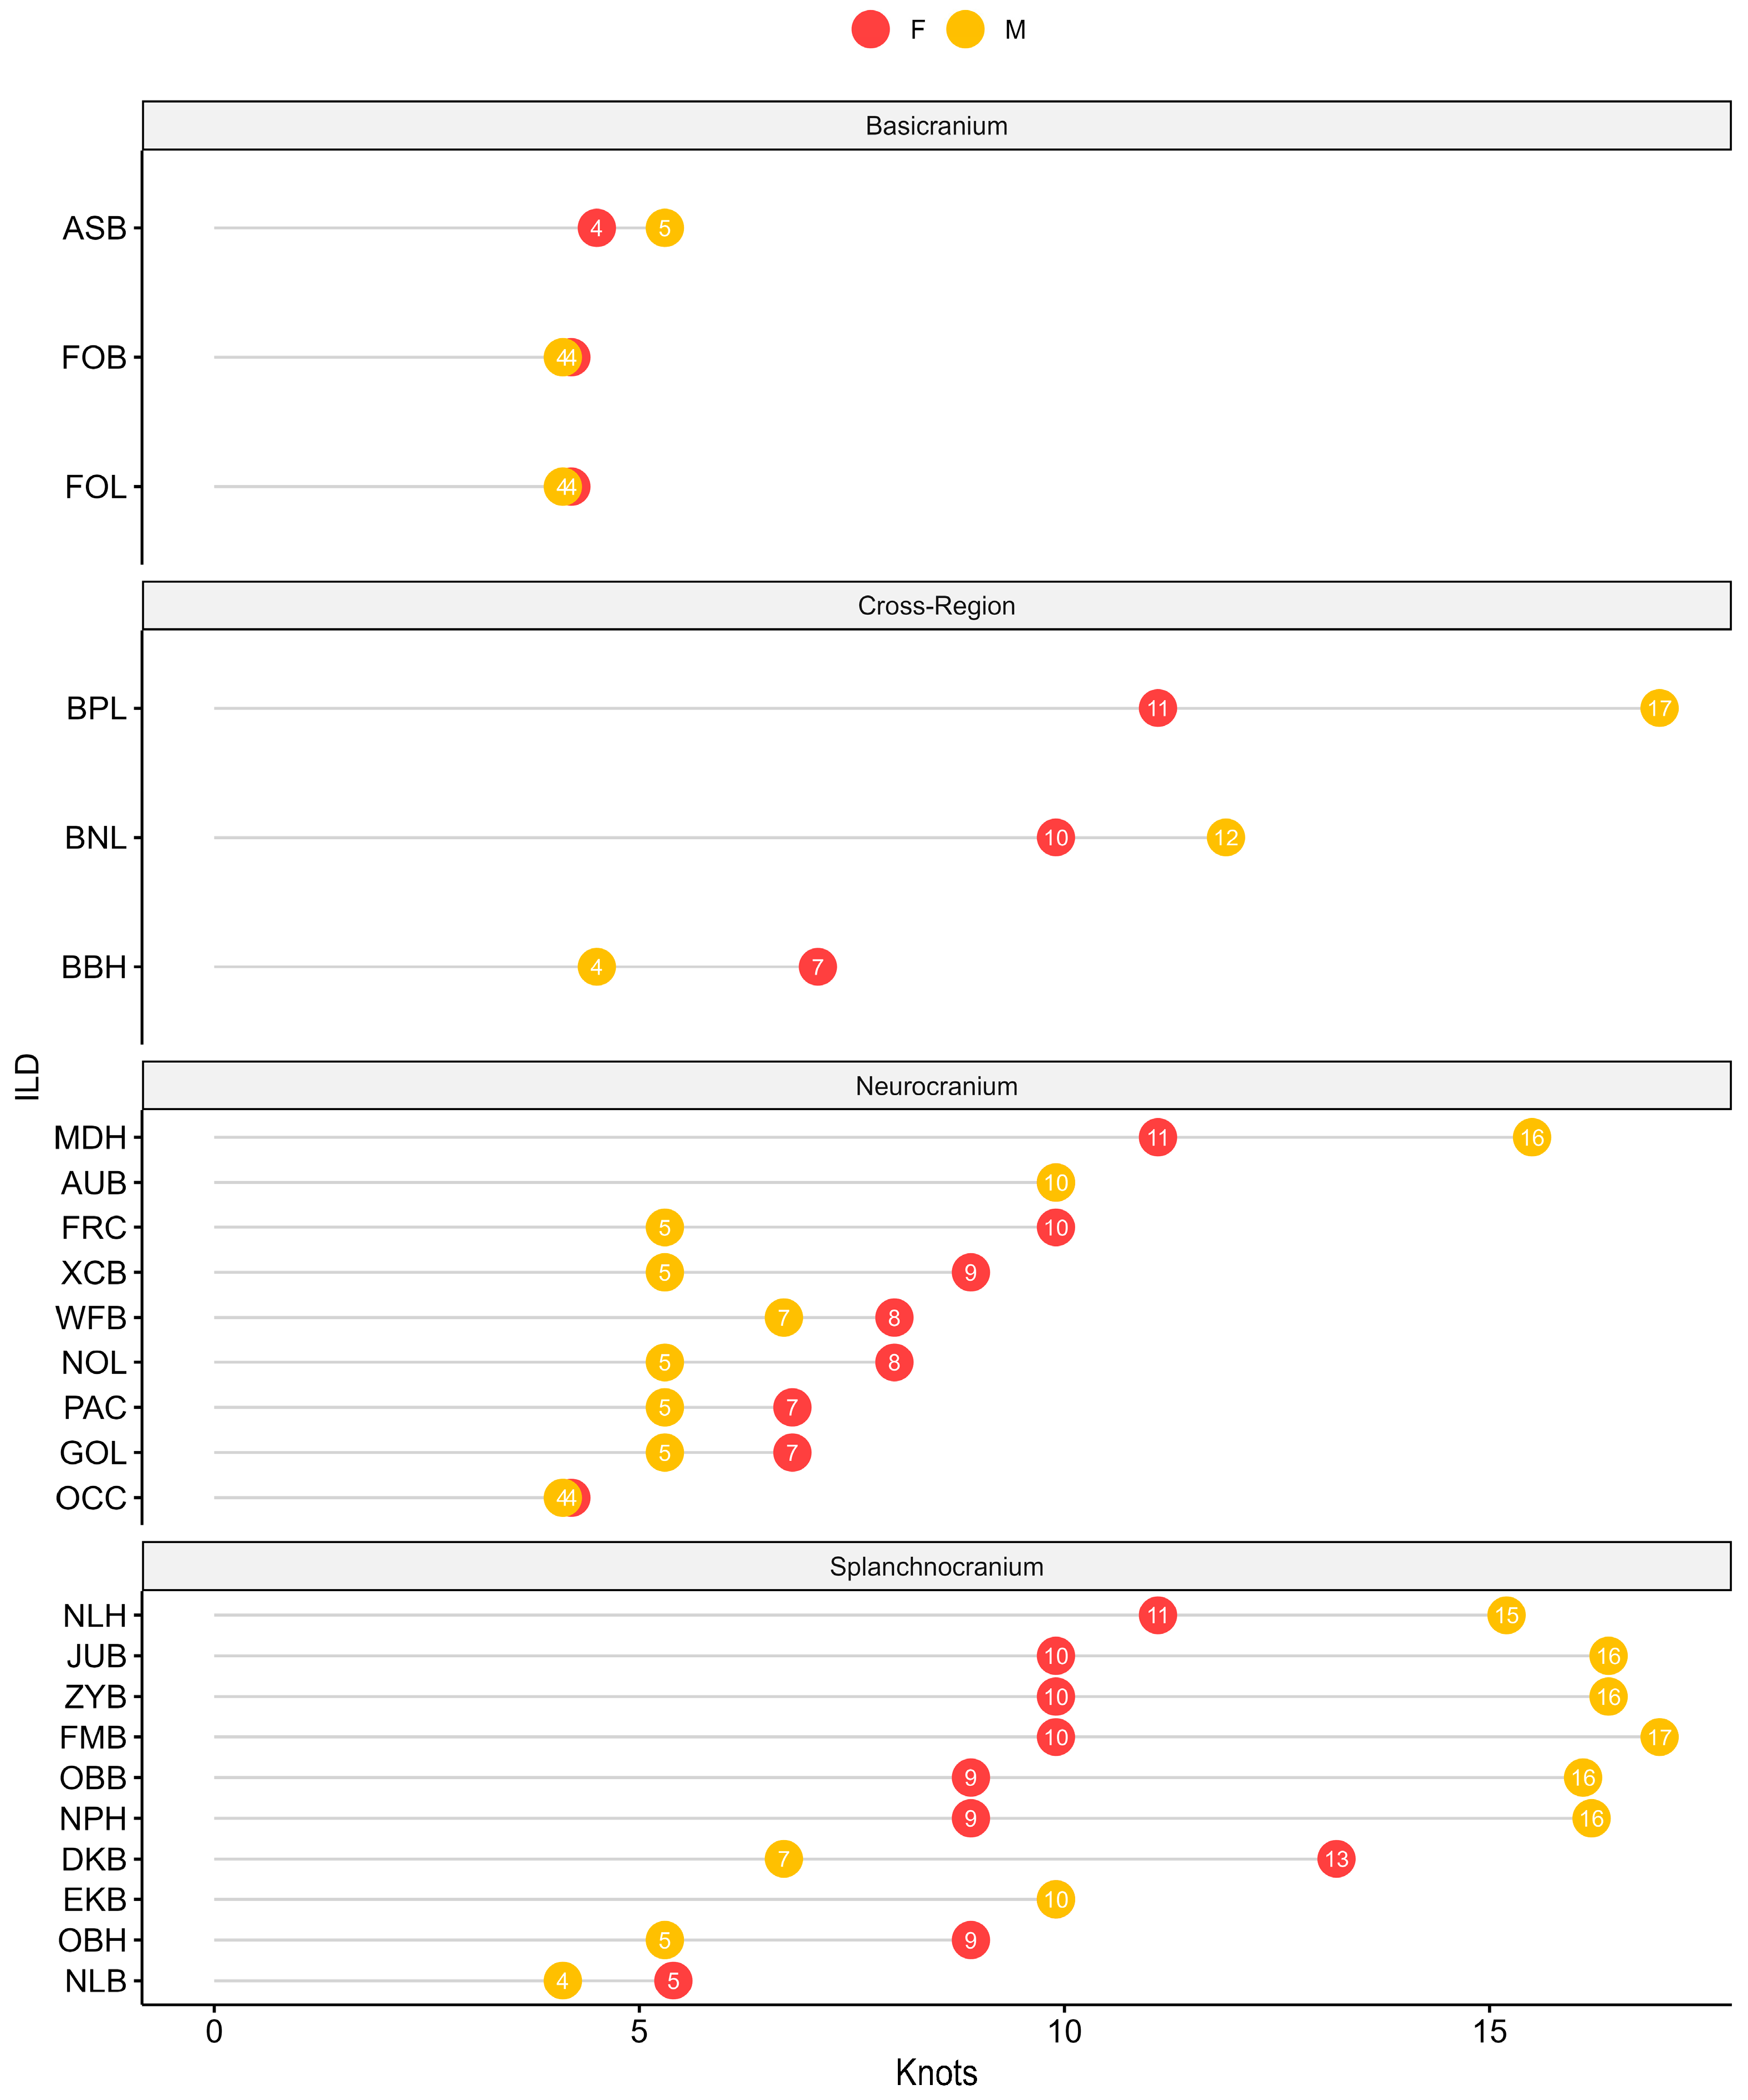
Estimated knot positions indicate changes in slope (i.e., a change in the relationship between age and ILD) and are interpreted as the ages at which growth patterns either shift or stabilize. In Table 2 the knots are presented by cranial region and in Figure 5 the knots are visualized by sex and cranial regions in decreasing order by age. Note, the knot values are rounded in Figure 5. Knot values differ by more than two years between males and females for 15/25 ILDs. The 10 ILDs that show comparable (with a difference of two years or less) knot values for both sexes are ASB, BNL, FOB, FOL, WFB, PAC, GOL, EKB, OCC, and NLB. The remaining statistical parameters will be discussed within each cranial region. The included visualizations capture two notable things; the varying relationship between age and ILD (changes in the slope of the line) and if the ILD is stabilizing (plateauing after the knot).

3.1. Splanchnocranium

The univariate models for the splanchnocranium ILDs are visualized in Figure 6. For both sexes, age explains a larger portion of the variability in the ILDs capturing facial height measurements (NLH or NPH) and breadth measurements (EKB, FMB, JUB, ZYB) (CVRSq = 0.70–0.84). Age explains a smaller portion of the variability in DKB, NLB, and OBH (CVRSq = 0.19–0.43).
When the knot locations correspond to younger ages (<9 years), the male models shift trajectories before female models (OBH, NLB, DKB) (Figure 5 and Figure 6). NLB has the earliest knot location for both males (4 years) and females (5 years) followed by OBH/DKB for males (~5–6 years). Whereas the female models have a comparably early shift for NLB, there is a later shift for OBH and DKB (~9 and ~13 years, respectively). When the knot locations correspond to older ages (>9 years), knots tend to occur earlier in the female models than in the male models (NLH, JUB, ZYB, FMB, OBB, NPH). ILDs associated with facial breadth (FMB, ZYB, and JUB) have changes in slope at ~10 years in females and at ~16 to 17 years in males. In contrast to other facial breadth ILDs, the estimated knot for the EKB model is 10 years for both males and females. Notably, the male OBB model estimates two knots around 16 and 20 years, but the second knot is likely a consequence of larger variation in this measurement combined with a smaller sample size in the upper age range.
For females, most slopes transition to plateau after a single knot, stabilizing in size at younger ages than males (<13 years) (Figure 6). A few models, such as FMB, JUB, NPH, and OBB, have a weak positive slope after the knot which reflects a slower and smaller change in size across the older ages. For male models, if the knot location is at older ages (>15 years), the slopes generally transition from a gradual slope to a slope that plateaus (Figure 6). This indicates a strong, positive relationship with age (FMB, JUB, NLH, NPH, OBB, ZYB). In models with knots at younger ages (EKB, DKB, NLB, OBH), the slope shifts but continues to have a positive relationship that increases in size as age increases.

3.2. Neurocranium

For both sexes, the CVRSq values for the neurocranium ILD models range between 0.15 and 0.79 (Table 2). These are, on average, smaller than the CVRSq achieved in models using splanchnocranium ILDs (Table 2, Figure 4). The models where age explains a larger portion of the variance of an ILD include GOL, NOL, MDH, FRC, and AUB (CVRSq = 0.62–0.79). Overall, female ILD models have smaller CVRSq values than males.
Knot locations for FRC, GOL, NOL, PAC, WFB, and XCB are between 5–7 years for males and 6–10 years for females (Figure 5). The knot location for the AUB model is at 10 years for both males and females. The AUB female model has two knots, but this is, again, more likely to be a consequence of smaller sample sizes. Notably, OCC and MDH deviate from the general trends of the neurocranium ILDs. The knot location for both male and female OCC models is around 4 years, which is more consistent with basicranium ILD models. However, like AUB, the OCC male model exhibits a second knot around 10 years which may be a product of sample size differences or OCC may be capturing the interaction between the basicranium and neurocranium regions. The knot locations for the MDH models are around 11 years for females and 16 years for males, which is more consistent with the splanchnocranium models.
For females, GOL, NOL, and OCC have a steep slope before a relatively young knot (<8 years) and maintain a weak positive relationship with age after the knot indicating the ILD continues to slowly increase in size (Figure 7). For males, AUB and WFB have a steeper increase in size concomitant with an increase in age prior to knots at slightly older ages (<7 years) that are followed by a change in slope with gradual increase throughout the rest of ontogeny (Figure 7). For both sexes, XCB, MDH, and PAC display a plateau in the slope following the knot, indicating growth stabilization. This pattern is also reflected by WFB and FRC among the female models.

3.3. Basicranium

The models with the smallest CVRSq values are associated with FOL for both sexes (CVRSq = 0.12–0.16; Table 2). The FOB models have similarly small CVRSq values (CVRSq = 0.22–0.25) while the ASB model is slightly higher (CVRSq = 0.45–0.47). The FOL and FOB basicranium models present with knots at the youngest ages (~4 years) and no differences between the sexes (Figure 5 and Figure 8). The FOB male model has a second knot around 8 years which may be a product of sample size variation or may indicate that FOB continues to grow alongside the neurocranium. The knot locations of the ASB model are at slightly older ages with little difference between females (5 years) and males (5 years). All three ILDs display a steep positive slope prior to their knots. After the knots, FOB and AUB continue with a gradual positive slope. In contrast, FOL stabilizes in size at the knot location (4 years), which continues through the oldest individuals in the sample.

3.4. Cross-Regional

Though the cross-regional ILD models include a basicranium landmark (basion), the overall trends in these models are patterned more similar to the landmark in their counterpoint cranial region (Table 2, Figure 5). In all three cross-regional models, age explains a substantial amount of variation in the ILDs (CVRSq = 0.69–0.83). For both females and males, the BBH model has knots at the youngest ages of all the cross-regional models (~7 and ~5 years, respectively). The BBH model is consistent with the patterns identified in the neurocranium ILD models. In contrast, BNL and BPL models are more like splanchnocranium ILD models with knot locations younger in females (~9–11 years) than males (~11–17 years). BBH exhibits a steeper slope prior to the knot while BNL and BPL slope more gradually (Figure 9). After the knot, all three ILDs continue with a weak but positive slope except for the male BPL model which exhibits a negative slope.

4. Discussion

The current study offers an extensive exploration into the growth of the cranial complex using variables relevant to biological and forensic anthropology. The exploration of cranial ontogenetic patterns presented here highlights that cranial growth is neither homogenous nor static across age or among cranial regions, but instead dynamic and variable across individual cranial measurements and regions. Some of the specific findings of this study include (a) changes in growth patterns of cranial ILDs largely align with the differential ontogenetic milestones of integrated soft and hard tissue structures; (b) ILDs reach phenotypic maturity at different ages through ontogeny; (c) most ILDs demonstrate sex-specific patterns in the timing of growth stabilization; and (d) sexually dimorphic size differences increase concomitant to age.
Virtual imaging, and CT scans in particular, provided increased access to skeletal data through the entire growth and development period, which enabled us to address previously inaccessible research objectives about cranial growth. Subadult research is often lackluster because it is notoriously difficult to access large, documented, modern subadult skeletal samples with equal representation of all ontogenetic stages from birth to adulthood [12,91]. When depending solely on skeletal collections, subadult research is often hindered because overall sample sizes restrict access to small subsets of limited age ranges, studies place emphasis on a single skeletal region, and/or research focuses on archaeological samples [12,13]. The sample size included here is markedly robust for subadult research (n = 595) and allowed us to explore an innovative modeling approach that uses age continuously rather than binning or discretizing individuals into arbitrary age categories. Even still, class imbalances persist between males and females and across the age range. Females are underrepresented, with approximately 100 less individuals than males, and there are less individuals between ages 5–13 years and 20–25 years. This imbalance both by sex and across ages is not uncommon in mortality data [92,93], though it is less than ideal for the current exploration because some of the major shifts in cranial growth patterns seem to occur across less represented ages. Nevertheless, the sample size is still large overall and cross-validation within the MARS models makes the models robust to overfitting. Therefore, the overarching patterns should stay consistent as the findings are validated, and hypotheses are tested across various contexts and/or samples.

4.1. Age-Patterned ILD Variance and Growth Trajectories

4.1.1. Splanchnocranium

In our analysis, most splanchnocranium ILDs (NLH, NPH, OBB, EKB, FMB, ZYB, and JUB) have high CVRSq values (>0.67) with later occurring knots (>9 years) which suggests the corresponding features change across age and do not stabilize in size until adolescence (Figure 6 and Figure 10). These ILDs increase in size for a longer duration with a more gradual growth trajectory (i.e., a flatter slope) prior to stabilization. While NLH and NPH are height (vertical) dimensions, the remaining five ILDs are all capturing breadth (horizontal) dimensions. Some research has argued that vertical dimensions tend to grow for longer compared to facial breadth dimensions [19,94,95], but this dynamic is inconsistent across the literature and seems to depend on the specific cranial regions and measurements incorporated in a given study. Studies that also include craniofacial areas like the zygomatic processes observe similar growth patterns between breadth and height facial dimensions [28,96,97]. Similarly, many of the facial breadth dimensions used here (e.g., FMB, ZYB, JUB) also exhibit a longer period of growth across ontogeny with slopes that plateau after their older-occurring knots, indicating these ILDs stabilize at adult levels of variation in conjunction with height dimensions (NLH, NPH).
Interestingly, the ILDs representing the orbital and nasal functional modules both deviate from and embody these overarching age-related patterns. In our study, the splanchnocranium ILDs with the earliest knots (<7 years; NLB, OBH, and DKB), smallest CVRSq values (<0.43), and widest variances at the youngest ages include some of the ILDs representing the orbital and nasal functional regions (Figure 11). Because age explains less of the variability (low CVRSq) in these ILDs, it attests to the likelihood of other factors contributing more to the observed variability. It has been hypothesized that some facial dimensions tend to stabilize sooner and exhibit larger variability in size from an early age due to selective pressures associated with functional demands [19,25]. For example, research that focuses more specifically on midfacial growth (i.e., regions of the eyes and nose), observed rapid, canalized development of craniofacial features between birth and 5 years [19,22,23,28,70,97]. The high levels of variance observed in these structures early on during ontogeny likely mean there are more factors driving the development of these facial dimensions than functional selective pressures.
NLH and NLB capture growth of the nasal functional module and display different patterns of growth and stabilization that hint at the influence of different developmental pressures. Whereas NLB presents with early stabilization and achievement of adult size, NLH displays a gradual growth trajectory with stabilization later in ontogeny like other later maturing splachnocranium ILDs with high CVRSq values. This finding corroborates the assertions of previous studies suggesting that directional growth of the nasal functional module (nasal height and breadth) is driven and constrained by different pressures [98,99,100]. It is hypothesized that the nasal septum influences the timing of growth in nasal height such that any disruption of nasal septum growth can lead to negative downstream consequences for facial height dimensions [99,101,102,103,104]. For this reason, the nasal septum has been termed a pacemaker for vertical facial growth [101]. In contrast, nasal breadth consistently demonstrates ecogeographic variation [100,105,106,107]. Other studies have revealed weaker signals of climate adaptation, particularly in nasal soft-tissue size [108], and identified differential degrees of sexual dimorphism impacting nasal dimensions [98,102,108,109]. Our results corroborate the presence of sexual dimorphism in these dimensions, both in growth trajectories and final size (Figure 10 and Figure 11, and suggest that nasal growth must also experience other selective forces.
OBH, OBB, and EKB capture growth of the orbital functional module and vary in their growth and stabilization patterns. Though exact ages varied, researchers have identified a two-stage pattern to orbital development: a younger peak in vertical growth, associated with eye development and overall increase in facial height, followed by older stabilization around 10 years largely associated with brain growth [16,19,28,110,111]. Our findings support the two-stage pattern observed by these studies with OBH stabilizing around 5 to 9 years of age, OBB stabilizing around 9 to 16 years, and EKB stabilizing around 10 years. While there are different hypotheses for why vertical and horizontal orbital dimensions demonstrate different growth patterns, it is important to consider constraints in growth as well. First, OBH stabilizes earlier than breadth measurements indicating that orbital height may be a trait impacted by higher heritability, structural constraints, or selective pressures. Additionally, the midface is positioned between two driving functional modules: the brain and the mouth. Therefore, the integration of surrounding regions and the influence of functional constraints on ILD growth should be considered when attempting to parse causative mechanisms and selective forces.
Our results further support the hypotheses of previous research suggesting that the splanchnocranium is influenced by population variation and sexual dimorphism. The influence of these factors is especially evident in the orbital and nasal regions that exhibit changes in growth patterns at much younger ages than previously hypothesized [10,16,18,19,33,38,41,85,112,113,114,115,116,117]. Furthermore, research looking at the growth of facial macromorphoscopic (MMS) traits across ontogeny found that regional variability was observable by 0–3 years for nasal aperture shape and between 10–15 years for orbit shape [10]. The relationship between growth patterns and the appearance of adult levels of population variation in these cranial structures is especially important to assess when considering how to apply these results to forensic casework. Previous exploratory multivariate analyses on adults also observed stronger relationships between NLB, OBH, DKB, facial MMS traits, and population, compared to all other ILDs which showed a stronger association to biological sex [118,119]. Yet, these nasal and orbital ILDs are not always among the strongest markers for population affinity estimation, as they have demonstrated inconsistent results depending on sample composition and method selection [120,121,122,123]. This contrast highlights that exploratory, foundational research findings may not directly translate to prediction performance in forensic methods, signaling an opportunity for future forensic research to clarify these relationships. Regardless, the combination of these results provides support for the hypothesis that early cranial growth is not driven exclusively by ossification-based development, functional modules, and/or sexually dimorphic patterns but likely a combination of these and other factors not explored here in relation to population variation and evolutionary constraints [19,32,45,46,54,70,124].

4.1.2. Neurocranium

Neurocranium stabilization occurs earlier than most of the splanchnocranium with knots detected between 5 and 10 years of age and sexual dimorphism in the age at onset (discussed in more detail below). Neurocranium ILDs also exhibit steeper growth trajectories, especially prior to knots compared to splanchnocranium ILDs (Figure 7). The neurocranium is functionally important for the protection and support of the brain and central nervous system [46,56,125]. As a result, research has identified parallel growth between the skeletal neurocranium and brain tissue, but has also highlighted that skeletal cranial stabilization takes place around 10 years of age [17,24] which is slightly later than the reported attainment of adult brain size. Indeed, the brain reaches approximately 90% of its adult size (in volume) between 7–8 years [27,56].
Our results reflect this parallel brain-neurocranium growth trajectory for most ILDs (AUB, FRC, WFB, GOL, NOL). However, four ILDs (XCB, PAC, OCC, and MDH) display different patterns. XCB, PAC, and OCC have lower (<0.35) CVRSq values indicating that variation across age is not a good explanation for their change in size. These three ILDs demonstrate wide variability at birth that is maintained throughout ontogeny and may be explained by their orientation along the midline (PAC, OCC) and posterior neurocranium (XCB, OCC) (Figure 12). The functional integration of these regions with both the brain and cranial base may explain some of the constraints in degree of growth [115,126]. Interestingly, while the knots for XCB and PAC continue to follow the trends of other neurocranium ILDs, both the knots and lower CVRSq of OCC are more consistent with the findings of basicranium ILDs (Figure 5, Figure 12 and Figure 13). OCC captures the posterior dimension of the cranial vault. However, it spans the entire occipital bone and is an element that follows both endochondral (the base) and intramembranous (the squama) ossification processes and includes the foramen magnum which plays an important functional role in the central nervous system. These results suggest that OCC growth might be closer to that of basicranium ILDs and indicate the important functional integration of the occipital region. This is consistent with previous literature that highlights the different developmental processes of the posterior cranial base compared to other basicranium segments [18,26,34,50].

4.1.3. Basicranium

While the basicranium is comprised of anterior, bilateral, and posterior segments, this research only includes basicranium ILDs that reflect posterior growth patterns. All three basicranium ILDs have low CVRSq (<0.47) values and knots around 4 years. This indicates that age is not a strong explanation for the variance present in these ILDs, though FOB and ASB do exhibit a slight positive change in slope after the knot (Figure 8 and Figure 13). In our results, all three ILDs exhibit the steepest growth trajectory between birth and 4 years, which is consistent with literature on basicranial growth patterns, supports early phenotypic stability for this region, and mimics the rapid growth of the brain and spinal cord [17,22,23,34,35,48]. Researchers have shown that the pediatric cervical spinal cord has some of the most rapid growth compared to the entire spinal cord with cervical size stabilizing around 4 years of age followed by minimal changes into adulthood [127,128]. Skeletally, this has also been demonstrated by other authors, with minimal variation in the ages of stabilization. Humphrey [22] identified completion of the foramen magnum by approximately 6 years in tandem with the completion of occipital fusion while Neubauer et al. [27] identified that the foramen magnum becomes rounder in shape between 6–12 years. Our results suggest that the foramen magnum first stabilizes in size antero-posteriorly (FOL) but continues to grow for a slightly longer duration in the transverse (FOB) dimension.
The anatomical proximity of the posterior basicranium with the cervical spine and their early, lifelong shared roles in the support of the head and protection of the spinal cord are likely co-factors in the early stabilization of growth and lack of sexual dimorphism in basicranium ILDs. Indeed, early stabilization in size and shape of the posterior basicranium mirrors the early growth and maturation of cervical vertebrae [129,130], and of the atlas and axis in particular, as they directly support the cranium [51,131]. In fact, these vertebrae derive in part from the same embryonic structure (sclerotome) as the occipital condyles [51]. Anterior fusion (i.e., anterior synchondrosis and neurocentral fusion for the atlas, dentocentral synchondrosis and neurocentral synchondrosis for the axis) and later on posterior fusion (i.e., posterior synchondrosis for both the atlas and axis), as well as most of growth in the size and shape of the atlas and axis bodies, occur for the most part during infancy and childhood, resulting in these two vertebrae reaching their adult size as early five or six years of age [131,132,133]. The morphological integration of the cranial base and upper cervical spine ensures the development of necessary biomechanical functions for survival and locomotion, such as holding the head upright, the acquisition of quadrupedalism and, later, bipedalism, while continuously protecting the central nervous system. Therefore, the low CVRSq values for basicranium ILDs suggest that the posterior dimensions are less explained by age due to their young stabilization and functional importance. It is possible that the rapid patterns of growth taking place between birth and 4 years may be better revealed with a narrower age distribution, as some of the nuanced changes in these younger years may be masked by exploration of a broader age range of individuals between birth and 25 years.

4.1.4. Cross-Region

Most ILDs included in this analysis span a single cranial region, but BBH, BNL, and BPL are all calculated from landmarks within separate regions: the basicranium (basion), splanchnocranium (prosthion and nasion), and neurocranium (bregma). Therefore, these ILDs capture different dimensions of the cranium and reflect growth through height of the cranial vault, the anterior cranial base, and facial prognathism, respectively. Despite the potential growth variation introduced through landmarks from different regions, all three ILDs are among the highest CVRSq values in the analysis (0.69–0.83), indicating a strong relationship with age (Figure 9 and Figure 14).
BBH exhibits a rapid growth trajectory that changes slope between 4 and 7 years with continued gradual growth thereafter. Previous research has reported that the most rapid growth in head height takes place prior to 4 years, but identified that growth reaches adult levels around 13 years [94] which is around the age that the current dataset also begins to stabilize in size (Figure 14). In contrast, BNL and BPL have a longer duration of growth through ontogeny and a continued positive slope through the entire age range. While MARS results do not capture a stabilization in phenotype, the loess lines and scatterplots in Figure 14 demonstrate how the variance in size stabilizes around 15 years of age. In our analysis, BNL exhibits changes in growth between 9 to 12 years which is consistent with previous research incorporating this ILD [21].
BPL is the only measurement in our analysis that captures changes in facial prognathism over ontogeny. BPL exhibits a change in slope between 11 to 17 years which is consistent with female and male slope transitions for many splanchnocranium ILDs. Regionally, this ILD includes structures interfacing between the splanchnocranium and basicranium, [17,30,34], but growth trajectories captured in our analysis align more closely with the splanchnocranium. These results are also consistent with research intended to capture ontogeny of facial prognathism [30]. Furthermore, morphological observations of prognathism suggest stability in the trait at a slightly older age range, 15 to 20 years [10], which highlights the differences in growth patterns between variables capturing size and shape variation [18,25,29].

4.2. ILD Sexual Dimorphism

Our analyses revealed an overarching trend of sexual dimorphism in the timing of phenotypic stabilization within and between cranial regions. To better identify the expression of fully stabilized sexual size dimorphism in the sample, male and female dimensions of individuals 18 years and older were visualized (Figure 15). In general, the greater the distance between the male and female knots (Figure 5), the greater the degree of sexual dimorphism in the measurement (Figure 15). The ILDs with larger CVRSq values and later occurring knots are also dimensions that have the greatest difference between male and female knot placements (Figure 4 and Figure 5). Knot placements highlight the onset of a pattern of size differentiation between the sexes. This results in sexual size dimorphism, as assessed by the distribution of measurements across the oldest individuals (Figure 15). The ILDs with the greatest overlap between the sexes are those with the lowest CVRSq values and the weakest association with age (Figure 4 and Figure 5). Overall, the basicranium is the least sexually dimorphic cranial region and the splanchnocranium is the most sexually dimorphic. This is consistent with growth literature which states that later stabilizing elements exhibit extended growth in males compared to females exacerbating the degree of sexual size dimorphism of these elements [18,22,23,25,41,134].
Most splanchnocranium ILDs (NLH, NPH, OBB, EKB, FMB, ZYB, JUB) and cross regional ILDs with at least one splanchnocranium landmark (BPL, BNL) present a strong relationship with age and a later shift in trajectory. The knot placements for later shifting ILDs are between 9 to 13 years for females and 12 to 17 years for males and encompass the pubertal period. Some craniofacial growth studies have suggested that sex differences are evident prior to puberty, primarily in terms of size differentiation wherein males are larger than females [18,22,23,28,33]. Our results do not corroborate these findings as there are minimal differences between sexes in both size and trajectory for these dimensions prior to knot placement (Figure 6 and Figure 10). In the current study, knot placements for these ILDs are consistent with sexual dimorphism in the timing of downstream pubertal changes (i.e., secondary sexual characteristics) and facial growth trajectories [17,18,22,23,25,28,29,33,135]. Puberty is marked by the reinitiation of the hypothalamic-pituitary-axis (HPG axis), increased growth rates across the body, and progressive circulation of steroid hormones into adult-levels [136,137,138]. The exact implications that these changes have for cranial structures is understudied. However, previous research has highlighted that males exhibit ongoing growth in the splanchnocranium past that of females [18,23,25,41,134] and our results highlight a 2 to 7-year difference in the knot placement and stabilization of the splanchnocranium and cross-region ILDs (except for EKB, which exhibits no sex-patterned difference in knot placement but does have observable sexual size dimorphism). These trends are relevant for forensic anthropologists because they highlight the existence of sex-patterned variation in growth stabilization for craniofacial ILDs and an increase of the magnitude of this differentiation with age, suggesting these ILDs may be more informative of biological sex at younger ages than previously believed and worth exploring further.
The male and female trajectories for the neurocranium and one cross regional ILD (BBH) demonstrate different patterning that is contrary to those observed in the splanchnocranium. In our analysis, males consistently stabilize earlier (5–7 years) than females (7–10 years) for all neurocranium ILDs except OCC and AUB, which have knots at the same age for both sexes (Figure 5 and Figure 7). It is possible that the pattern of earlier knots for males versus females is reflective of smaller sample sizes across this age range in the analysis. However, at least one anthropometric growth study examining neurocranium volume reported a shared increase in growth for both males and females around four years followed by an additional above average increase in growth for males around 5 years [139]. Therefore, it is possible that our results are capturing a real shift in neurocranium growth that takes place in males, increasing the magnitude of size difference between the sexes and contributing to the overall sexual size dimorphism observed in the neurocranium (Figure 16). Future research with a more robust sample across the 5-to-10-year age range, and, if possible, longitudinal data would be required to verify these results.
Two neurocranium ILDs (GOL and MDH) include morphological features (i.e., supraciliary arches and mastoid process) that are well-known sexually dimorphic traits and used in sex estimation methodologies [1,140,141]. While research is emerging to capture the age at onset and the magnitude of sex differences across ontogeny for cranial morphological traits [1,11], these differences remain unknown to a practitioner with regard to metric assessment. It would be logical to assume that ILDs would also express sexual dimorphism because it is hypothesized that both size and shape of skeletal structures are subject to the influence of steroid hormones [11,142,143] though the exact pathways and mechanisms are not fully understood. Research investigating the ontogeny of morphological trait scores for the glabellar region have identified significant sexually dimorphic differences as early as 13 years [1,11]. Our results suggest that the magnitude of variation across ontogeny for these sexually dimorphic ILDs is relative to the timing of growth and their integration with surrounding structures. In our analysis, GOL reflects the pattern of sexual dimorphism in knot placement observed in other neurocranium ILDs with knots estimated around 5 for males and 7 for females though growth continues at a positive slope after the knot and throughout ontogeny (Figure 5, Figure 7 and Figure 16). Therefore, the MARS model for GOL likely captures its relationship with brain growth prior to the first knot, while continued but slower growth occurring after the knot likely reflects the influence of sexually dimorphic processes on the development of the glabella and size differences related to morphological integration and allometry [115,144]. Thus, the functional forces and constraints exerted on this region lead to an ILD that is not as sexually dimorphic as the regional morphology (Figure 14).
MDH was classified among neurocranium ILDs because it shares similar developmental origins [54]. However, MDH growth patterns appear more consistent with splanchnocranium ILDs with knots estimated around 11 years for females and 16 years for males and positive slopes thereafter (Figure 5 and Figure 7). In contrast to other neurocranium ILDs, the mastoid is a muscle attachment site that is not directly driven by brain growth, but rather increases in muscle mass largely occurring around puberty [135,145]. Therefore, it appears logical that MDH size would stabilize and reach adult levels of variation later in ontogeny. Like the glabellar region, forensic anthropologists regularly use the mastoid process in sex estimation techniques [140,141]. In two studies that evaluated sex-patterned ontogeny of the mastoid process using morphological trait scores, the initiation of sexual dimorphism was observed around 15 years with divergence in trait scores observed later compared to those of the glabella [1,11]. The differences between the ages at which sexual dimorphism in morphological trait expression of the glabella or mastoid process was observable, and in the knot placement for GOL and MDH, highlight the necessity for further clarity on the factors influencing the interaction between size and shape.
The presence of sexual dimorphism as discussed here is interpreted through observable differences between sexes in the slopes and/or knot locations produced by the MARS models (i.e., the ages at which growth trajectories change between sexes). Because MARS is a regression methodology that highlights meaningful points of change in data relationships, the generalizability of the identified hinge points/knots is highly dependent on whether the sample adequately captures the broader population. While our research design included a large sample and evaluated sexual dimorphism continuously across ontogeny, the sample population is largely homogenous and less representative of human variation. The level of sexual dimorphism is known to vary around the world [58,146], so future studies should explore the variation in knot placement with a sample more representative of the global population.

4.3. Forensic Implications of Exploring Ontogenetic Variation

The results of this study have significant implications for forensic anthropological practice. Unlike most cranial growth studies, the present research was designed with measurements commonly used in biological profile estimation methods. This allows for direct and immediate application of the observations made here to practitioner interpretation, method development, and ongoing discussions in the field. Besides age estimation, currently published standards are exclusively (sex and population affinity estimation) or primarily (stature estimation) written for use with adult remains [147,148,149]. However, the saliency of this research for practice is in the revelation that cranial regions and cranial measurements can reach adult levels of variation in size prior to adulthood. These results speak directly to the necessity of understanding the age appropriateness of each cranial ILD for expanding forensic methods.
Stabilization of a measurement at its adult size indicates that it is appropriate to use for subadults in estimation methods that are typically developed for adults. For example, ILDs that stabilize in their phenotypic expression at young ages (ASB, FOB, FOL, OCC under 5 years; AUB, WFB, EKB at ~7–10 years) with less evidence of sexual dimorphism may be less discriminatory for sex estimation but could be used for other parameters regardless of biological sex. Conversely, measurements like BBH, GOL, NOL, XCB, FRC, and PAC that exhibit relatively young (~5 years for males; ~7–10 for females) sex-patterned differences in size and growth trajectories may be more informative for sex estimation or population variation in subadults by those ages. Even the latest stabilizing measurements like NPH, JUB, ZYB, FMB, OBB, NPH, BPL, BNL and MDH reach adult size and variance from the onset of puberty (~9 to 11 years for females and ~12 to 17 years for males).
The current methodological pipeline for most subadult cases in forensic anthropology is restricted to age estimation. However, the results obtained here reveal that the subadult biological profile does not necessarily require the development of new methods. Instead, extensions of current adult methods to younger individuals may also be appropriate for variables with growth trajectories verified by ontogenetic explorations of skeletal variation. Moving forward, there is a need to further align these size stabilization patterns with other dental and skeletal developmental markers. Recent studies have shifted toward better understanding the developmental stage of an individual to dictate whether it is appropriate to estimate other biological profile parameters with skeletal variables typically reserved for adults e.g., [150,151,152] and we believe the next step with our findings is something comparable.
Importantly, this study only explores univariate patterns, which may be informative in conjunction with developmental markers in a fragmentary setting. However, the field’s standards and many researchers encourage multivariable approaches to estimations of the biological profile e.g., [88,147,153,154]. Because univariate estimations from the cranium are generally not recommended, we provide no comparisons in terms of estimation performance. Rather, this research provides an important foundation for future work that can validate the performance and accuracy of the observed patterns. For example, the current findings led to the hypothesis that applying craniometrics in a multivariate framework can estimate biological sex in adolescent individuals [155]. Indeed, Stull and colleagues found comparable performance of craniometric sex estimation between adolescents and adults which support the findings herein that the cranium achieves adult size prior to adulthood. Previous studies involving pelvic measurements and cranial morphology have similar conclusions [11,150,151].
Consideration for these patterns of growth across ontogeny also creates an opportunity to explore how biological profile estimations are influenced by plasticity during growth. It is well understood that the ebb and flow of environmental stressors throughout life can induce processes like stunting and catch-up growth in postcranial structures in ways that may have a life-long impact on the resulting adult phenotype. Yet, similar considerations for the ebbs and flows of cranial growth, and their adult phenotypic outcomes, are less discussed in method development and interpretation. Like the rest of the body, the cranium experiences periods of rapid, canalized growth [33,38,48,156], but as we have demonstrated, the mechanisms driving growth are not static across ontogeny allowing the cranium to undergo periods of lesser or greater responsiveness to environmental stimuli [38]. Therefore, interpreting the performance of ILDs in estimation methods can be improved by understanding the timing of these growth fluctuations and the stabilization of cranial size at adult levels of variation.
This ontogenetic framework can make an important contribution to many ongoing debates within the discipline. For example, it is possible that younger stabilizing ILDs are associated with stronger genetic canalization and larger degrees of genetic heritability contrary to later stabilizing ILDs with prolonged growth that may exhibit more plasticity in response to environmental pressures. These hypotheses are pertinent for disentangling the influence of genetic heritability and environmental factors on cranial structures that have long been the focus of anthropological research [44,115,157,158,159]. Moreover, while this research uses dichotomized (female/male) reported biological sex, as that is the demographic information available to us, understanding the onset and spectrum of cranial sexual dimorphism across ontogeny may be of use for ongoing discussions regarding sex and gender diversity in forensic estimations [160,161]. The variation in sexual dimorphism within and across cranial regions observed here provides a foundation for future research exploring the intersection of skeletal biology, developmental age, and other factors that may influence skeletal development such as hormone therapy [162,163]. These, and other possible applications, demonstrate how introducing an ontogenetic approach to forensic anthropology research and practice can ultimately help forensic anthropologists understand how developmental, evolutionary, and/or environmental drivers influence skeletal variation and translate into improved biological profile estimations.

5. Conclusions

This study showed that investigating growth and development across the entirety of postnatal ontogeny is crucial for better contextualizing, quantifying, and qualifying cranial phenotypic variation in both subadults and adults. Specifically, approaching subadult cranial growth under the lenses of developmental and functional mechanisms allowed us to better understand the variation in cranial size and when each ILD exhibits adult-levels of variation during ontogeny. The findings of this paper alter the subadult forensic anthropology pipeline and integrate cranial developmental biology to highlight what is missing in both subadult research and practice in the field.
We started this manuscript by highlighting several reasons why the cranial complex is complex, and we end the paper by re-emphasizing the inherent nested hierarchy that contributes to its complexity. While the cranium is a single anatomical structure, it is comprised of numerous modules that are differentially integrated and subject to various developmental, evolutionary, functional, and environmental pressures. To simplify the interpretation of changes in cranial size over time, we specifically explored ILDs through the lenses of ontogeny and anatomical-functional regions. This perspective allowed us to map the overarching patterns linked to differential prioritization and selective pressures in each region. However, the influencing factors were not clear for all ILDs. Some ILDs, such as XCB, did not show straightforward growth patterns. The SVAD and FDB samples used here are relatively homogenous in their population distributions, so a lack of sample diversity prevented us from further exploring potential microevolutionary pressures that may contribute to shaping it, like thermoregulatory effects [113,164], prompting future research opportunities.
The impact of ontogenetic processes on adult cranial variation is often hypothesized, but difficult to directly demonstrate without access to representative subadult samples and data [112,117,165,166,167]. Capturing univariate ILD growth patterns in a large sample with representation of all ages from birth to adulthood allowed us to place them in conversation with a plethora of growth, human variation, and evolutionary literature, and highlighted patterns that are of particular importance to forensic anthropology casework. Our findings move anthropologists towards the recognition of cranial growth as a mosaic, continuous process that requires a complete ontogenetic approach to better understand the forces that shape phenotypic variation observed in subadult and adult individuals. The majority of the cranial ILDs included in the present study stabilize and arrive at adult levels of phenotypic variation prior to completion of the skeletal maturation markers that typically define adulthood. Therefore, we emphasize the need to avoid arbitrary divides between subadults and adults based on biologically inconsistent chronologically defined categories. Rather than first discretizing subadult and adult methods, future research and method development should transition to considering the different developmental trajectories of cranial dimensions. Foundational research that explicitly brings quantified, theoretically grounded understandings of subadult biology and growth into forensic anthropology is necessary to further improve the discipline and how we approach casework.

Author Contributions

Conceptualization, B.T.N. and K.E.S.; methodology, B.T.N., K.E.S., and L.K.C.; validation, B.T.N.; formal analysis, B.T.N.; investigation, B.T.N. and C.A.W.; resources, K.E.S.; data curation, K.E.S. and L.K.C.; writing—original draft preparation, B.T.N.; writing—review and editing, B.T.N., K.E.S., L.K.C., and C.A.W.; visualization, B.T.N. and K.E.S.; supervision, K.E.S.; project administration, B.T.N. and K.E.S.; funding acquisition, K.E.S. All authors have read and agreed to the published version of the manuscript.

Funding

This research was funded by National Institute of Justice Award 2019-DU-BX-0039.

Institutional Review Board Statement

The Office of Human Research Protection at the University of Nevada, Reno determined that this project did not require human research protection oversight.

Informed Consent Statement

Not applicable.

Data Availability Statement

The data presented in this this study are available upon request from the corresponding author (SVAD) or with permission of Drs. Richard Jantz and Kate Spradley (FDB). The data collection protocols are openly available: Amira [doi:10.5281/zenodo.5348411] and Data collection Protocol: Cranial Landmarks and Craniometrics [doi:10.5281/zenodo.6625998].

Acknowledgments

The authors would like to thank the University of New Mexico Health Sciences Center, Office of the Medical Investigator as well as Richard Jantz and Kate Spradley for providing data that made this research feasible.

Conflicts of Interest

The authors declare no conflicts of interest.

References

  1. Stock, M.K. A Preliminary Analysis of the Age of Full Expression of Sexually Dimorphic Cranial Traits. J. Forensic Sci. 2018, 63, 1802–1808. [Google Scholar] [CrossRef]
  2. Coqueugniot, H.; Weaver, T.D. Brief Communication: Infracranial Maturation in the Skeletal Collection From Coimbra, Portugal: New Aging Standards for Ephiphyseal Union. Am. J. Phys. Anthropol. 2007, 134, 424–437. [Google Scholar] [CrossRef]
  3. Fazekas, I.G.; Kósa, F. Forensic Fetal Osteology; Akadémiai Kiadó: Budapest, Hungary, 1978; ISBN 978-963-05-1491-0. [Google Scholar]
  4. Konie, J.C. Comparative Value Of X-Rays Of The Spheno-Occipital Synchondrosis And Of The Wrist For Skeletal Age Assessment. Angle Orthod. 1964, 34, 303–313. [Google Scholar]
  5. Niel, M.; Adalian, P. New Models to Estimate Fetal and Young Infant Age with the Pars Basilaris Biometry. Forensic Sci. Int. 2023, 342, 111531. [Google Scholar] [CrossRef]
  6. Powell, T.V.; Brodie, A.G. Closure of the Spheno-occipital Synchondrosis. Anat. Rec. 1963, 147, 15–23. [Google Scholar] [CrossRef]
  7. Sahni, D.; Jit, I.; Neelam; Suri, S. Time of Fusion of the Basisphenoid with the Basilar Part of the Occipital Bone in Northwest Indian Subjects. Forensic Sci. Int. 1998, 98, 41–45. [Google Scholar] [CrossRef]
  8. Scheuer, L.; MacLaughlin-Black, S. Age Estimation from the Pars Basilaris of the Fetal and Juvenile Occipital Bone. Int. J. Osteoarchaeol. 1994, 4, 377–380. [Google Scholar] [CrossRef]
  9. Ubelaker, D.H.; Khosrowshahi, H. Estimation of Age in Forensic Anthropology: Historical Perspective and Recent Methodological Advances. Forensic Sci. Res. 2019, 4, 1–9. [Google Scholar] [CrossRef]
  10. Wood, C. The Age-Related Emergence of Cranial Morphological Variation. Forensic Sci. Int. 2015, 251, 220.e1–220.e20. [Google Scholar] [CrossRef]
  11. Cole, S.J. Developing Subadult Sex Estimation Standards Using Adult Morphological Sex Traits and an Ontogenetic Approach. Ph.D. Dissertation, University of Nevada, Reno, Reno, NV, USA, 2022. [Google Scholar]
  12. Saunders, S.R. Juvenile Skeletons and Growth-Related Studies. In Biological Anthropology of the Human Skeleton; Katzenberg, M.A., Saunders, S.R., Eds.; Wiley: Hoboken, NJ, USA, 2008; pp. 115–147. ISBN 978-0-471-79372-4. [Google Scholar]
  13. Corron, L.K.; Marchal, F.; Condemi, S.; Adalian, P. A Critical Review of Sub-Adult Age Estimation in Biological Anthropology: Do Methods Comply with Published Recommendations? Forensic Sci. Int. 2018, 288, 328.e1–328.e9. [Google Scholar] [CrossRef]
  14. Winburn, A.P.; Yim, A.; Stock, M.K. Recentering Forensic Anthropology within a Multifaceted Body of Evolutionary Theory: Strengthening Method by Making Theory Explicit. Am. J. Biol. Anthropol. 2022, 179, 535–551. [Google Scholar] [CrossRef]
  15. Anzelmo, M.; Barbeito-AndrÉs, J.; Ventrice, F.; Pucciarelli, H.M.; Sardi, M.L. Ontogenetic Patterns of Morphological Variation in the Ectocranial Human Vault. Anat. Rec. 2013, 296, 1008–1015. [Google Scholar] [CrossRef]
  16. Barbeito-Andrés, J.; Anzelmo, M.; Ventrice, F.; Pucciarelli, H.M.; Sardi, M.L. Morphological Integration of the Orbital Region in a Human Ontogenetic Sample: Integration of Human Orbital Region. Anat. Rec. 2016, 299, 70–80. [Google Scholar] [CrossRef]
  17. Bastir, M.; Rosas, A.; O’Higgins, P. Craniofacial Levels and the Morphological Maturation of the Human Skull: Spatiotemporal Pattern of Cranial Ontogeny. J. Anat. 2006, 209, 637–654. [Google Scholar] [CrossRef]
  18. Bulygina, E.; Mitteroecker, P.; Aiello, L. Ontogeny of Facial Dimorphism and Patterns of Individual Development within One Human Population. Am. J. Phys. Anthropol. 2006, 131, 432–443. [Google Scholar] [CrossRef]
  19. Evteev, A.; Anikin, A.; Satanin, L. Midfacial Growth Patterns in Males from Newborn to 5 Years Old Based on Computed Tomography. Am. J. Hum. Biol. 2018, 30, e23132. [Google Scholar] [CrossRef]
  20. Freidline, S.E.; Martinez-Maza, C.; Gunz, P.; Hublin, J.-J. Exploring Modern Human Facial Growth at the Micro- and Macroscopic Levels. In Building Bones: Bone Formation and Development in Anthropology; Percival, C.J., Richtsmeier, J.T., Eds.; Cambridge University Press: Cambridge, UK, 2017; pp. 104–127. ISBN 978-1-316-38890-7. [Google Scholar]
  21. Hardin, A.M.; Knigge, R.P.; Oh, H.S.; Valiathan, M.; Duren, D.L.; McNulty, K.P.; Middleton, K.M.; Sherwood, R.J. Estimating Craniofacial Growth Cessation: Comparison of Asymptote- and Rate-Based Methods. Cleft Palate Craniofacial J. 2022, 59, 230–238. [Google Scholar] [CrossRef]
  22. Humphrey, L.T. Growth Patterns in the Modern Human Skeleton. Am. J. Phys. Anthr. 1998, 105, 57–72. [Google Scholar] [CrossRef]
  23. Jeffery, N.S.; Humphreys, C.; Manson, A. A Human Craniofacial Life-course: Cross-sectional Morphological Covariations during Postnatal Growth, Adolescence, and Aging. Anat. Rec. 2022, 305, 81–99. [Google Scholar] [CrossRef]
  24. Jeon, S.; Chung, J.H.; Baek, S.-H.; Yang, I.H.; Choi, K.Y.; Seo, H.J.; Shin, J.Y.; Kim, B.J. Characterization of Cranial Growth Patterns Using Craniometric Parameters and Best-Fit Logarithmic Growth Curves. J. Cranio-Maxillofac. Surg. 2024, 52, 30–39. [Google Scholar] [CrossRef]
  25. Liang, C.; Profico, A.; Buzi, C.; Khonsari, R.H.; Johnson, D.; O’Higgins, P.; Moazen, M. Normal Human Craniofacial Growth and Development from 0 to 4 Years. Sci. Rep. 2023, 13, 9641. [Google Scholar] [CrossRef]
  26. Lieberman, D.E.; McCarthy, R.C. The Ontogeny of Cranial Base Angulation in Humans and Chimpanzees and Its Implications for Reconstructing Pharyngeal Dimensions. J. Hum. Evol. 1999, 36, 487–517. [Google Scholar] [CrossRef]
  27. Neubauer, S.; Gunz, P.; Hublin, J. The Pattern of Endocranial Ontogenetic Shape Changes in Humans. J. Anat. 2009, 215, 240–255. [Google Scholar] [CrossRef]
  28. Niemann, K.; Lazarus, L.; Rennie, C.O. Developmental Changes of the Facial Skeleton from Birth to 18 Years within a South African Cohort (A Computed Tomography Study). J. Forensic Leg. Med. 2021, 83, 102243. [Google Scholar] [CrossRef]
  29. Noble, J.; Cardini, A.; Flavel, A.; Franklin, D. Geometric Morphometrics on Juvenile Crania: Exploring Age and Sex Variation in an Australian Population. Forensic Sci. Int. 2019, 294, 57–68. [Google Scholar] [CrossRef]
  30. Patcas, R.; Keller, H.; Markic, G.; Beit, P.; Eliades, T.; Cole, T.J. Craniofacial Growth and SITAR Growth Curve Analysis. Eur. J. Orthod. 2022, 44, 325–331. [Google Scholar] [CrossRef]
  31. Ross, A.H.; Williams, S.E. Craniofacial Growth, Maturation, and Change: Teens to Midadulthood. J. Craniofac. Surg. 2010, 21, 458–461. [Google Scholar] [CrossRef]
  32. Sardi, M.L.; Ramírez Rozzi, F.V. A Cross-Sectional Study of Human Craniofacial Growth. Ann. Hum. Biol. 2005, 32, 390–396. [Google Scholar] [CrossRef]
  33. Syutkina, T.; Anikin, A.; Satanin, L.; Evteev, A. Sexual Dimorphism in Human Midfacial Growth Patterns from Newborn to 5 Years Old Based on Computed Tomography. J. Anat. 2023, 242, 132–145. [Google Scholar] [CrossRef]
  34. Wellens, H.L.L.; Kuijpers-Jagtman, A.M.; Halazonetis, D.J. Geometric Morphometric Analysis of Craniofacial Variation, Ontogeny and Modularity in a Cross-Sectional Sample of Modern Humans. J. Anat. 2013, 222, 397–409. [Google Scholar] [CrossRef]
  35. Gkantidis, N.; Halazonetis, D.J. Morphological Integration between the Cranial Base and the Face in Children and Adults: Cranial Base and Face Integration. J. Anat. 2011, 218, 426–438. [Google Scholar] [CrossRef]
  36. Klingenberg, C.P. Cranial Integration and Modularity: Insights into Evolution and Development from Morphometric Data. Hystrix Ital. J. Mammal. 2013, 24, 43–58. [Google Scholar] [CrossRef]
  37. Lesciotto, K.M.; Richtsmeier, J.T. Craniofacial Skeletal Response to Encephalization: How Do We Know What We Think We Know? Am. J. Phys. Anthropol. 2019, 168, 27–46. [Google Scholar] [CrossRef]
  38. Mitteroecker, P.; Stansfield, E. A Model of Developmental Canalization, Applied to Human Cranial Form. PLoS Comput. Biol. 2021, 17, e1008381. [Google Scholar] [CrossRef]
  39. von Cramon-Taubadel, N. Multivariate Morphometrics, Quantitative Genetics, and Neutral Theory: Developing a “Modern Synthesis” for Primate Evolutionary Morphology. Evol. Anthropol. Issues News Rev. 2019, 28, 21–33. [Google Scholar] [CrossRef]
  40. Kawasaki, K.; Richtsmeier, J.T. Association of the Chondrocranium and Dermatocranium in Early Skull Formation. In Building Bones: Bone Formation and Development in Anthropology; Percival, C.J., Richtsmeier, J.T., Eds.; Cambridge University Press: Cambridge, UK, 2017; pp. 52–78. ISBN 978-1-316-38890-7. [Google Scholar]
  41. Milella, M.; Franklin, D.; Belcastro, M.G.; Cardini, A. Sexual Differences in Human Cranial Morphology: Is One Sex More Variable or One Region More Dimorphic? Anat. Rec. 2021, 304, 2789–2810. [Google Scholar] [CrossRef]
  42. Mitteroecker, P.; Gunz, P.; Neubauer, S.; Müller, G. How to Explore Morphological Integration in Human Evolution and Development? Evol. Biol. 2012, 39, 536–553. [Google Scholar] [CrossRef]
  43. West-Eberhard, M.J. Modularity as a Universal Emergent Property of Biological Traits. J. Exp. Zoolog. B Mol. Dev. Evol. 2019, 332, 356–364. [Google Scholar] [CrossRef]
  44. Cheverud, J.M. Developmental Integration and the Evolution of Pleiotropy. Am. Zool. 1996, 36, 44–50. [Google Scholar] [CrossRef]
  45. González-José, R.; Van Der Molen, S.; González-Pérez, E.; Hernández, M. Patterns of Phenotypic Covariation and Correlation in Modern Humans as Viewed from Morphological Integration. Am. J. Phys. Anthropol. 2004, 123, 69–77. [Google Scholar] [CrossRef]
  46. Moss, M.L.; Young, R.W. A Functional Approach to Craniology. Am. J. Phys. Anthropol. 1960, 18, 281–292. [Google Scholar] [CrossRef]
  47. Carlson, B. Human Embryology and Developmental Biology, 6th ed.; Elsevier: Amsterdam, The Netherlands, 2018. [Google Scholar]
  48. Lieberman, D.E. Ontogeny, Homology, and Phylogeny in the Hominid Craniofacial Skeleton: The Problem of the Browridge. In Development, Growth and Evolution: Implications for the Study of Hominid Skeletal Evolution; O’Higgins, P., Cohn, M., Eds.; Academic Press: London, UK, 2000; pp. 85–122. [Google Scholar]
  49. Nie, X. Cranial Base in Craniofacial Development: Developmental Features, Influence on Facial Growth, Anomaly, and Molecular Basis. Acta. Odontol. Scand. 2005, 63, 127–135. [Google Scholar] [CrossRef]
  50. Lieberman, D.E.; Pearson, O.M.; Mowbray, K.M. Basicranial Influence on Overall Cranial Shape. J. Hum. Evol. 2000, 38, 291–315. [Google Scholar] [CrossRef]
  51. Cunningham, C.; Scheuer, L.; Black, S. Developmental Juvenile Osteology; Elsevier Science: Amsterdam, The Netherlands, 2016; ISBN 978-0-12-382107-2. [Google Scholar]
  52. Tubbs, R.S.; Bosmia, A.N.; Cohen-Gadol, A.A. The Human Calvaria: A Review of Embryology, Anatomy, Pathology, and Molecular Development. Childs Nerv. Syst. 2012, 28, 23–31. [Google Scholar] [CrossRef]
  53. von Cramon-Taubadel, N. The Relative Efficacy of Functional and Developmental Cranial Modules for Reconstructing Global Human Population History. Am. J. Phys. Anthropol. 2011, 146, 83–93. [Google Scholar] [CrossRef]
  54. von Cramon-Taubadel, N. Congruence of Individual Cranial Bone Morphology and Neutral Molecular Affinity Patterns in Modern Humans. Am. J. Phys. Anthropol. 2009, 140, 205–215. [Google Scholar] [CrossRef]
  55. Barbeito-Andrés, J.; Bonfili, N.; Nogué, J.M.; Bernal, V.; Gonzalez, P.N. Modeling the Effect of Brain Growth on Cranial Bones Using Finite-Element Analysis and Geometric Morphometrics. Surg. Radiol. Anat. 2020, 42, 741–748. [Google Scholar] [CrossRef]
  56. Frassanito, P.; Bianchi, F.; Pennisi, G.; Massimi, L.; Tamburrini, G.; Caldarelli, M. The Growth of the Neurocranium: Literature Review and Implications in Cranial Repair. Childs Nerv. Syst. 2019, 35, 1459–1465. [Google Scholar] [CrossRef]
  57. Garvin, H.M.; Ruff, C.B. Sexual Dimorphism in Skeletal Browridge and Chin Morphologies Determined Using a New Quantitative Method. Am. J. Phys. Anthr. 2012, 147, 661–670. [Google Scholar] [CrossRef]
  58. Kleisner, K.; Tureček, P.; Roberts, S.C.; Havlíček, J.; Valentova, J.V.; Akoko, R.M.; Leongómez, J.D.; Apostol, S.; Varella, M.A.C.; Saribay, S.A. How and Why Patterns of Sexual Dimorphism in Human Faces Vary across the World. Sci. Rep. 2021, 11, 5978. [Google Scholar] [CrossRef]
  59. Weston, E.M.; Friday, A.E.; Liò, P. Biometric Evidence That Sexual Selection Has Shaped the Hominin Face. PLoS ONE 2007, 2, e710. [Google Scholar] [CrossRef]
  60. Ousley, S.D.; Jantz, R.L. The Forensic Data Bank: Documenting Skeletal Trends in the United States. In Forensic Osteology: Advances in the Identification of Human Remains; Reichs, K.J., Ed.; Charles C Thomas: Springfield, IL, USA, 1998; pp. 441–458. [Google Scholar]
  61. Stull, K.E.; Corron, L.K. The Subadult Virtual Anthropology Database (SVAD): An Accessible Repository of Contemporary Subadult Reference Data. Forensic Sci. 2022, 2, 20–36. [Google Scholar] [CrossRef]
  62. Berry, S.D.; Edgar, H.J. Announcement: The New Mexico Decedent Image Database. Forensic Imaging 2021, 24, 200436. [Google Scholar] [CrossRef]
  63. Spradley, M.K.; Wolfe, C.A.; Stull, K.E.; Chu, E.Y.; Broehl, K.A.; Vlemincq-Mendieta, T.; Pilloud, M.A.; Scott, G.R.; Corron, L.K. Subadult Virtual Anthropology Database (SVAD) Data Collection Protocol: Cranial Landmarks and Craniometrics (2.0); Zenodo: Geneva, Switzerland, 2021. [Google Scholar] [CrossRef]
  64. Stull, K.E.; Corron, L.K. Subadult Virtual Anthropology Database (SVAD) Data Collection Protocol: Amira (1.0); Zenodo: Geneva, Switzerland, 2021. [Google Scholar] [CrossRef]
  65. Stock, M.K.; Garvin, H.M.; Corron, L.K.; Hulse, C.N.; Cirillo, L.E.; Klales, A.R.; Colman, K.L.; Stull, K.E. The Importance of Processing Procedures and Threshold Values in CT Scan Segmentation of Skeletal Elements: An Example Using the Immature Os Coxa. Forensic Sci. Int. 2020, 309, 110232. [Google Scholar] [CrossRef]
  66. Stock, M.K.; Stull, K.E.; Garvin, H.M.; Klales, A.R. Development of Modern Human Subadult Age and Sex Estimation Standards Using Multi-Slice Computed Tomography Images from Medical Examiner’s Offices. In Proceedings of the Proc. SPIE 9967, Developments in X-Ray Tomography X, San Diego, CA, USA, 29–31 August 2016; Volume 9967, pp. 99670E–99670E-14. [Google Scholar]
  67. Langley-Shirley, N.; Jantz, R.L. A Bayesian Approach to Age Estimation in Modern Americans from the Clavicle. J. Forensic Sci. 2010, 55, 571–583. [Google Scholar] [CrossRef]
  68. Chu, E.Y. Explorations into Appendicular Ontogeny Using a Cross-Sectional, Contemporary U.S. Sample. Ph.D. Dissertation, University of Nevada, Reno, Reno, NV, USA, 2022. [Google Scholar]
  69. Chu, E.Y.; Stull, K.E. An Investigation of the Relationship between Long Bone Measurements and Stature: Implications for Estimating Skeletal Stature in Subadults. Int. J. Legal Med. 2025, 139, 441–453. [Google Scholar] [CrossRef]
  70. Barbeito-Andrés, J.; Anzelmo, M.; Ventrice, F.; Sardi, M.L. Measurement Error of 3D Cranial Landmarks of an Ontogenetic Sample Using Computed Tomography. J. Oral Biol. Craniofacial Res. 2012, 2, 77–82. [Google Scholar] [CrossRef]
  71. Corron, L.K.; Marchal, F.; Condemi, S.; Chaumoître, K. Evaluating the Consistency, Repeatability, and Reproducibility of Osteometric Data on Dry Bone Surfaces, Scanned Dry Bone Surfaces, and Scanned Bone Surfaces Obtained from Living Individuals. Bull. Mém. Société Anthropol. Paris 2017, 29, 33. [Google Scholar] [CrossRef]
  72. Howells, W.W. Cranial Variation in Man: A Study by Multivariate Analysis of Patterns of Difference Among Recent Human Populations; Papers of the Peabody Museum of Archaeology and Ethnolgy; Harvard University Press: Cambridge, MA, USA, 1973; ISBN 0-87365-189-8. [Google Scholar]
  73. Langley, N.R.; Jantz, L.M.; Ousley, S.D.; Jantz, R.L.; Milner, G.R. Data Collection Procedures for Forensic Skeletal Material 2.0; Department of Anthropology, The University of Tennessee: Knoxville, TN, USA, 2016. [Google Scholar]
  74. Corron, L.K.; Broehl, K.A.; Chu, E.Y.; Vlemincq-Mendieta, T.; Wolfe, C.A.; Pilloud, M.A.; Scott, G.R.; Spradley, M.K.; Stull, K.E. Agreement and Error Rates Associated with Standardized Data Collection Protocols for Skeletal and Dental Data on 3D Virtual Subadult Crania. Forensic Sci. Int. 2022, 334, 111272. [Google Scholar] [CrossRef]
  75. Edgar, H.J.H.; Spradley, M.K.; Kamnikar, K.R.; McKeown, A.H. Roadmap to the Future: Calipers to Digitizing to Virtual Osteology. Forensic Anthropol. 2024, 7, 89. [Google Scholar] [CrossRef]
  76. Milborrow, S. Derived from mda:mars by T. Hastie and R. Tibshirani. Earth: Multivariate Adaptive Regression Spline Models (5.3.4). R Package. 2024. Available online: http://www.milbo.users.sonic.net/earth/ (accessed on 18 May 2025).
  77. Friedman, J.H. Multivariate Adaptive Regression Splines. Ann. Stat. 1991, 19, 1–67. [Google Scholar] [CrossRef]
  78. Friedman, J.H.; Roosen, C.B. An Introduction to Multivariate Adaptive Regression Splines. Stat. Methods Med. Res. 1995, 4, 197–217. [Google Scholar] [CrossRef]
  79. Hastie, T.; Tibshirani, R.; Friedman, J. The Elements of Statistical Learning: Data Mining, Inference, and Prediction, 2nd ed.; Springer: New York, NY, USA, 2009. [Google Scholar]
  80. Corron, L.K.; Marchal, F.; Condemi, S.; Telmon, N.; Chaumoitre, K.; Adalian, P. Integrating Growth Variability of the Ilium, Fifth Lumbar Vertebra, and Clavicle with Multivariate Adaptive Regression Splines Models for Subadult Age Estimation. J. Forensic Sci. 2019, 64, 34–51. [Google Scholar] [CrossRef]
  81. Corron, L.K.; Marchal, F.; Condemi, S.; Chaumoître, K.; Adalian, P. A New Approach of Juvenile Age Estimation Using Measurements of the Ilium and Multivariate Adaptive Regression Splines (MARS) Models for Better Age Prediction. J. Forensic Sci. 2017, 62, 18–29. [Google Scholar] [CrossRef]
  82. Stull, K.E.; L’Abbé, E.N.; Ousley, S.D. Using Multivariate Adaptive Regression Splines to Estimate Subadult Age from Diaphyseal Dimensions. Am. J. Phys. Anthr. 2014, 154, 376–386. [Google Scholar] [CrossRef]
  83. Stull, K.E.; Chu, E.Y.; Corron, L.K.; Price, M.H. Subadult Age Estimation Using the Mixed Cumulative Probit and a Contemporary United States Population. Forensic Sci. 2022, 2, 741–779. [Google Scholar] [CrossRef]
  84. Milborrow, S. Notes on the Earth Package; R Vignette: 2024; pp. 1–68. Available online: http://www.milbo.org/doc/earth-notes.pdf (accessed on 19 May 2025).
  85. Middleton, K.M.; Duren, D.L.; McNulty, K.P.; Oh, H.; Valiathan, M.; Sherwood, R.J. Cross-Sectional Data Accurately Model Longitudinal Growth in the Craniofacial Skeleton. Sci. Rep. 2023, 13, 19294. [Google Scholar] [CrossRef]
  86. Bartholdy, B.P.; Hoogland, M.L.P.; Waters-Rist, A. How Old Are You Now? A New Ageing Method for Nonadults Based on Dental Wear. Int. J. Osteoarchaeol. 2019, 29, 622–633. [Google Scholar] [CrossRef]
  87. Nikita, E.; Nikitas, P. On the Use of Machine Learning Algorithms in Forensic Anthropology. Leg. Med. 2020, 47, 101771. [Google Scholar] [CrossRef]
  88. Stull, K.E.; Armelli, K. Combining Variables to Improve Subadult Age Estimation. Forensic Anthropol. 2021, 3, 203. [Google Scholar] [CrossRef]
  89. Krüger, G.C.; L’Abbé, E.N.; Stull, K.E. Sex Estimation from the Long Bones of Modern South Africans. Int. J. Legal Med. 2017, 131, 275–285. [Google Scholar] [CrossRef]
  90. Liebenberg, L.; L’Abbé, E.N.; Stull, K.E. Population Differences in the Postcrania of Modern South Africans and the Implications for Ancestry Estimation. Forensic Sci. Int. 2015, 257, 522–529. [Google Scholar] [CrossRef]
  91. Stull, K.E.; Corron, L.K.; Price, M.H. Subadult Age Estimation Variables: Exploring Their Varying Roles across Ontogeny. In Remodeling Forensic Skeletal Age; Elsevier: Amsterdam, The Netherlands, 2021; pp. 49–73. ISBN 978-0-12-824370-1. [Google Scholar]
  92. Kochanek, K.; Murphy, S.L.; Xu, J.; Arias, E. Mortality in the United States, 2022; NCHS Data Brief, no 492; National Center for Health Statistics: Hyattsville, MD, USA, 2023. [Google Scholar] [CrossRef]
  93. Stull, K.E.; Wolfe, C.A.; Corron, L.K.; Heim, K.; Hulse, C.N.; Pilloud, M.A. A Comparison of Subadult Skeletal and Dental Development Based on Living and Deceased Samples. Am. J. Phys. Anthropol. 2021, 175, 36–58. [Google Scholar] [CrossRef]
  94. Farkas, L.G.; Posnick, J.C.; Hreczko, T.M. Growth Patterns of the Face: A Morphometric Study. Cleft Palate Craniofacial J. 1992, 29, 308–315. [Google Scholar] [CrossRef]
  95. Snodell, S.F.; Nanda, R.S.; Currier, G.F. A Longitudinal Cephalometric Study of Transverse and Vertical Craniofacial Growth. Am. J. Orthod. Dentofacial Orthop. 1993, 104, 471–483. [Google Scholar] [CrossRef]
  96. Nanda, R.; Snodell, S.F.; Bollu, P. Transverse Growth of Maxilla and Mandible. Semin. Orthod. 2012, 18, 100–117. [Google Scholar] [CrossRef]
  97. Waitzman, A.A.; Posnick, J.C.; Armstrong, D.C.; Pron, G.E. Craniofacial Skeletal Measurements Based on Computed Tomography: Part I. Accuracy and Reproducibility. Cleft Palate Craniofac. J. 1992, 29, 112–117. [Google Scholar] [CrossRef]
  98. Bastir, M.; Megía, I.; Torres-Tamayo, N.; García-Martínez, D.; Piqueras, F.M.; Burgos, M. Three-dimensional Analysis of Sexual Dimorphism in the Soft Tissue Morphology of the Upper Airways in a Human Population. Am. J. Phys. Anthropol. 2020, 171, 65–75. [Google Scholar] [CrossRef]
  99. Butaric, L.N.; Nicholas, C.L.; Kravchuk, K.; Maddux, S.D. Ontogenetic Variation in Human Nasal Morphology. Anat. Rec. 2022, 305, 1910–1937. [Google Scholar] [CrossRef]
  100. Maddux, S.D.; Butaric, L.N.; Yokley, T.R.; Franciscus, R.G. Ecogeographic Variation across Morphofunctional Units of the Human Nose. Am. J. Phys. Anthropol. 2017, 162, 103–119. [Google Scholar] [CrossRef]
  101. Hall, B.K.; Precious, D.S. Cleft Lip, Nose, and Palate: The Nasal Septum as the Pacemaker for Midfacial Growth. Oral Surg. Oral Med. Oral Pathol. Oral Radiol. 2013, 115, 442–447. [Google Scholar] [CrossRef]
  102. Holton, N.E.; Alsamawi, A.; Yokley, T.R.; Froehle, A.W. The Ontogeny of Nasal Shape: An Analysis of Sexual Dimorphism in a Longitudinal Sample: The Ontogeny of Nasal Shape. Am. J. Phys. Anthropol. 2016, 160, 52–61. [Google Scholar] [CrossRef]
  103. Holton, N.E.; Yokley, T.R.; Figueroa, A. Nasal Septal and Craniofacial Form in European- and African-derived Populations. J. Anat. 2012, 221, 263–274. [Google Scholar] [CrossRef]
  104. Scott, J.H. The Growth of the Human Face. Proc. R. Soc. Med. 1954, 47, 91–100. [Google Scholar] [CrossRef]
  105. Franciscus, R.G.; Long, J.C. Variation in Human Nasal Height and Breadth. Am. J. Phys. Anthropol. 1991, 85, 419–427. [Google Scholar] [CrossRef]
  106. Hubbe, M.; Hanihara, T.; Harvati, K. Climate Signatures in the Morphological Differentiation of Worldwide Modern Human Populations. Anat. Rec. 2009, 292, 1720–1733. [Google Scholar] [CrossRef]
  107. Noback, M.L.; Harvati, K.; Spoor, F. Climate-related Variation of the Human Nasal Cavity. Am. J. Phys. Anthropol. 2011, 145, 599–614. [Google Scholar] [CrossRef]
  108. Zaidi, A.A.; Mattern, B.C.; Claes, P.; McEvoy, B.; Hughes, C.; Shriver, M.D. Investigating the Case of Human Nose Shape and Climate Adaptation. PLoS Genet. 2018, 14, e1007207. [Google Scholar] [CrossRef]
  109. Bastir, M.; Godoy, P.; Rosas, A. Common Features of Sexual Dimorphism in the Cranial Airways of Different Human Populations. Am. J. Phys. Anthropol. 2011, 146, 414–422. [Google Scholar] [CrossRef]
  110. Landi, F.; Barraclough, J.; Evteev, A.; Anikin, A.; Satanin, L.; O’Higgins, P. The Role of the Nasal Region in Craniofacial Growth: An Investigation Using Path Analysis. Anat. Rec. 2022, 305, 1892–1909. [Google Scholar] [CrossRef]
  111. Ye, F.; Ji, Y.; Chen, Y.; He, F.; Fan, X. Orbital Growth Is Associated with Eyeball Size: A Study Using CT-Based Three-Dimensional Techniques. Curr. Eye Res. 2022, 47, 317–324. [Google Scholar] [CrossRef]
  112. Barbeito-Andres, J.; Pucciarelli, H.M.; Sardi, M.L. An Ontogenetic Approach to Facial Variation in Three Native American Populations. Homo-J. Comp. Hum. Biol. 2011, 62, 56–67. [Google Scholar] [CrossRef]
  113. Harvati, K.; Weaver, T.D. Human Cranial Anatomy and the Differential Preservation of Population History and Climate Signatures. Anat. Rec.—Part A Discov. Mol. Cell. Evol. Biol. 2006, 288, 1225–1233. [Google Scholar] [CrossRef]
  114. Hefner, J.T.; Plemons, A.M.; Kamnikar, K.R.; Ousley, S.D.; Linde, K.C. User Guide for MMS [Macromorphoscopic Traits] (v.1.6.1); Michigan State University: East Lansing, MI, USA, 2018. [Google Scholar]
  115. Martínez-Abadías, N.; Esparza, M.; Sjøvold, T.; González-José, R.; Santos, M.; Hernández, M. Heritability of Human Cranial Dimensions: Comparing the Evolvability of Different Cranial Regions. J. Anat. 2009, 214, 19–35. [Google Scholar] [CrossRef]
  116. Plemons, A.M. The Interaction Between Genetics and Climate on Craniofacial Variation: Examining the Causative Forces of Macromorphoscopic Trait Expression. Ph.D. Dissertation, Michigan State University, East Lansing, MI, USA, 2022. [Google Scholar]
  117. von Cramon-Taubadel, N. Evolutionary Insights into Global Patterns of Human Cranial Diversity: Population History, Climatic and Dietary Effects. J. Anthropol. Sci. 2014, 92, 43–77. [Google Scholar] [CrossRef]
  118. New, B.T.; Auchter, L.E.; Chu, E.Y.; Corron, L.K.; Go, M.C.; Hefner, J.T.; Spradley, M.K.; Wolfe, C.A.; Stull, K.E. Patterns of Covariation in Cranial Metric and Macromorphoscopic Variables. In Proceedings of the 76th Meeting of the American Academy of Forensic Sciences, Baltimore, MD, USA, 19–24 February 2025. [Google Scholar]
  119. Stull, K.E.; New, B.T.; Corron, L.; Auchter, L.E.; Spradley, K.; Wolfe, C.A.; Chu, E.Y.; Hefner, J.T. Exploring Mutual and Exclusive Biological Information in Cranial Metric and Morphological Variables. Forensic Anthropol. 2024, 7, 141. [Google Scholar] [CrossRef]
  120. Hefner, J.T.; Spradley, M.K.; Anderson, B. Ancestry Assessment Using Random Forest Modeling. J. Forensic Sci. 2014, 59, 583–589. [Google Scholar] [CrossRef]
  121. Liebenberg, L. South African Cranial Variation: A Combined Metric-Macromorphoscopic Method for Ancestry Estimation. Ph.D. Thesis, University of Pretoria, Pretoria, South Africa, 2023. [Google Scholar]
  122. Navega, D.; Coelho, C.; Vicente, R.; Ferreira, M.T.; Wasterlain, S.; Cunha, E. AncesTrees: Ancestry Estimation with Randomized Decision Trees. Int. J. Legal Med. 2015, 129, 1145–1153. [Google Scholar] [CrossRef]
  123. Spradley, M.K. Use of Craniometric Data to Facilitate Migrant Identifications at the United States/Mexico Border. Am. J. Phys. Anthropol. 2021, 175, 486–496. [Google Scholar] [CrossRef]
  124. Hallgrímsson, B.; Jamniczky, H.; Young, N.M.; Rolian, C.; Parsons, T.E.; Boughner, J.C.; Marcucio, R.S. Deciphering the Palimpsest: Studying the Relationship Between Morphological Integration and Phenotypic Covariation. Evol. Biol. 2009, 36, 355–376. [Google Scholar] [CrossRef]
  125. Friede, H. Normal Development and Growth of the Human Neurocranium and Cranial Base. Scand. J. Plast. Reconstr. Surg. 1981, 15, 163–169. [Google Scholar] [CrossRef]
  126. Pereira-Pedro, A.S.; Bruner, E. Craniofacial Orientation and Parietal Bone Morphology in Adult Modern Humans. J. Anat. 2022, 240, 330–338. [Google Scholar] [CrossRef]
  127. Kumar, A.; Vandekar, S.; Schilling, K.G.; Bhatia, A.; Landman, B.A.; Smith, S. Mapping Pediatric Spinal Cord Development with Age. In Proceedings of the Medical Imaging 2022: Image Processing, San Diego, CA, USA, 20–24 February 2022; Išgum, I., Colliot, O., Eds.; SPIE: San Diego, CA, USA, 2022; p. 41. [Google Scholar]
  128. Parenteau, C.S.; Wang, N.C.; Zhang, P.; Caird, M.S.; Wang, S.C. Quantification of Pediatric and Adult Cervical Vertebra—Anatomical Characteristics by Age and Gender for Automotive Application. Traffic Inj. Prev. 2014, 15, 572–582. [Google Scholar] [CrossRef]
  129. Corron, L.K.; Wolfe, C.A.; Stull, K.E. A Multifaceted Exploration of Ontogenetic Variation in Vertebral Neural Canal Size across Contemporary Populations. Am. J. Biol. Anthropol. 2022, 180, 328–351. [Google Scholar] [CrossRef]
  130. Lottering, N.; MacGregor, D.M.; Alston, C.L.; Watson, D.; Gregory, L.S. Introducing Computed Tomography Standards for Age Estimation of Modern Australian Subadults Using Postnatal Ossification Timings of Select Cranial and Cervical Sites. J. Forensic Sci. 2016, 61, S39–S52. [Google Scholar] [CrossRef]
  131. Miller, C.A.; Hwang, S.J.; Cotter, M.M.; Vorperian, H.K. Cervical Vertebral Body Growth and Emergence of Sexual Dimorphism: A Developmental Study Using Computed Tomography. J. Anat. 2019, 234, 764–777. [Google Scholar] [CrossRef]
  132. Ford, D.M.; McFadden, K.D.; Bagnall, K.M. Sequence of Ossification in Human Vertebral Neural Arch Centers. Anat. Rec. 1982, 203, 175–178. [Google Scholar] [CrossRef]
  133. Piatt, J.H.; Grissom, L.E. Developmental Anatomy of the Atlas and Axis in Childhood by Computed Tomography: Clinical Article. J. Neurosurg. Pediatr. 2011, 8, 235–243. [Google Scholar] [CrossRef]
  134. Smith, O.A.M.; Nashed, Y.S.G.; Duncan, C.; Pears, N.; Profico, A.; O’Higgins, P. 3D Modeling of Craniofacial Ontogeny and Sexual Dimorphism in Children. Anat. Rec. 2021, 304, 1918–1926. [Google Scholar] [CrossRef]
  135. Bogin, B. Patterns of Human Growth, 3rd ed.; Cambridge University Press: Cambridge, UK, 2020; ISBN 978-1-108-37997-7. [Google Scholar]
  136. Ellison, P.T. Endocrinology, Energetics, and Human Life History: A Synthetic Model. Horm. Behav. 2017, 91, 97–106. [Google Scholar] [CrossRef]
  137. Marshall, W.A.; Tanner, J.M. Variations in the Pattern of Pubertal Changes in Boys. Arch. Dis. Child. 1970, 45, 13–23. [Google Scholar] [CrossRef]
  138. Wheeler, M.D. Physical Changes of Puberty. Endocrinol. Metab. Clin. 1991, 20, 1–14. [Google Scholar] [CrossRef]
  139. Purkait, R. Growth of Cranial Volume: An Anthropometric Study. J. Plast. Reconstr. Aesthet. Surg. 2011, 64, e115–e117. [Google Scholar] [CrossRef]
  140. Klales, A.R.; Cole, S.J. MorphoPASSE: The Morphological Pelvis and Skull Sex Estimation Database Manual; Washburn University: Topeka, KS, USA, 2016; Volume 1. [Google Scholar]
  141. Walker, P.L. Sexing Skulls Using Discriminant Function Analysis of Visually Assessed Traits. Am. J. Phys. Anthropol. 2008, 136, 39–50. [Google Scholar] [CrossRef]
  142. Garvin, H.M. The Effects of Living Conditions on Human Cranial and Postcranial Sexual Dimorphism. Ph.D. Dissertation, Johns Hopkins University, Baltimore, MD, USA, 2012. [Google Scholar]
  143. Garvin, H.M.; Sholts, S.B.; Mosca, L.A. Sexual Dimorphism in Human Cranial Trait Scores: Effects of Population, Age, and Body Size. Am. J. Phys. Anthr. 2014, 154, 259–269. [Google Scholar] [CrossRef]
  144. Del Bove, A.; Menéndez, L.; Manzi, G.; Moggi-Cecchi, J.; Lorenzo, C.; Profico, A. Mapping Sexual Dimorphism Signal in the Human Cranium. Sci. Rep. 2023, 13, 16847. [Google Scholar] [CrossRef]
  145. Petaros, A.; Sholts, S.B.; Slaus, M.; Bosnar, A.; Wärmländer, S.K.T.S. Evaluating Sexual Dimorphism in the Human Mastoid Process: A Viewpoint on the Methodology. Clin. Anat. 2015, 28, 593–601. [Google Scholar] [CrossRef]
  146. L’Abbé, E.N.; Kenyhercz, M.; Stull, K.E.; Keough, N.; Nawrocki, S. Application of Fordisc 3.0 to Explore Differences Among Crania of North American and South African Blacks and Whites, J. Forensic Sci. 2013, 58, 1579–1583. [Google Scholar] [CrossRef]
  147. ANSI/ASB Standard 090; Standard for Sex Estimation in Forensic Anthropology, 1st ed. AAFS Standards Board: Colorado Springs, CO, USA, 2019.
  148. ANSI/ASB Standard 045; Standard for Stature Estimation in Forensic Anthropology, 1st ed. AAFS Standards Board: Colorado Springs, CO, USA, 2019.
  149. ANSI/ASB Standard 132; Standard for Population Affinity Estimation in Forensic Anthropology, 1st ed. AAFS Standards Board: Colorado Springs, CO, USA, 2023.
  150. Corron, L.K.; Santos, F.; Adalian, P.; Chaumoitre, K.; Guyomarc’h, P.; Marchal, F.; Brůžek, J. How Low Can We Go? A Skeletal Maturity Threshold for Probabilistic Visual Sex Estimation from Immature Human Os Coxae. Forensic Sci. Int. 2021, 325, 110854. [Google Scholar] [CrossRef]
  151. Auchter, L.E.; Stull, K. Development and Validation of a Subadult Sex Estimation Method Using Pelvic Metrics. Forensic Anthropol. 2025, 8, 19. [Google Scholar] [CrossRef]
  152. Sanchez, J.; Hoppa, R. Is Adulthood Required? Examining the Accuracy of Pelvic Sex Estimation Throughout Pubertal Growth. Bioarchaeology Int. 2022, 7, 173. [Google Scholar] [CrossRef]
  153. Klales, A.R. Current State of Sex Estimation in Forensic Anthropology. Forensic Anthropol. 2021, 4, 118–133. [Google Scholar] [CrossRef]
  154. Maier, C. Evaluating Mixed-Methods Models for the Estimation of Ancestry from Skeletal Remains. Forensic Anthropol. 2019, 2, 22–28. [Google Scholar] [CrossRef]
  155. Stull, K.E.; Wolfe, C.A.; Corron, L.K.; New, B.T.; Spradley, M.K. Growth and Development of the Cranial Complex and Its Implications for Sex Estimation. Forensic Sci. 2025; submitted. [Google Scholar]
  156. Richtsmeier, J.T.; Lesciotto, K.M. From Phenotype to Genotype And Back Again. Bull. Mém. Société Anthropol. Paris 2020, 32, 8–17. [Google Scholar] [CrossRef]
  157. Roseman, C.C. Random Genetic Drift, Natural Selection, and Noise in Human Cranial Evolution. Am. J. Phys. Anthropol. 2016, 160, 582–592. [Google Scholar] [CrossRef]
  158. Carson, E.A. Maximum Likelihood Estimation of Human Craniometric Heritabilities. Am. J. Phys. Anthropol. 2006, 131, 169–180. [Google Scholar] [CrossRef]
  159. Katz, D.C.; Grote, M.N.; Weaver, T.D. A Mixed Model for the Relationship between Climate and Human Cranial Form. Am. J. Phys. Anthropol. 2016, 160, 593–603. [Google Scholar] [CrossRef]
  160. Tallman, S.; Kincer, C.; Plemons, E. Centering Transgender Individuals in Forensic Anthropology and Expanding Binary Sex Estimation in Casework and Research. Forensic Anthropol. 2021, 5, 161–180. [Google Scholar] [CrossRef]
  161. Meloro, R.; Tallman, S.D.; Streed, C.G.; Stowell, J.T.; Delgado, T.A.; Haug, J.D.; Redgrave, A.; Winburn, A.P. A Framework for Incorporating Diverse Gender Identities into Forensic Anthropology Casework and Theory: Recommendations for Inclusive Practices. Curr. Anthropol. 2025, 66, 1–27. [Google Scholar] [CrossRef]
  162. Márquez-Grant, N.; Baldini, E.; Jeynes, V.; Biehler-Gomez, L.; Aoukhiyad, L.; Passalacqua, N.V.; Giordano, G.; Di Candia, D.; Cattaneo, C. How Do Drugs Affect the Skeleton? Implications for Forensic Anthropology. Biology 2022, 11, 524. [Google Scholar] [CrossRef]
  163. Boogers, L.S.; Sikma, B.T.; Bouman, M.-B.; Van Trotsenburg, A.S.P.; Den Heijer, M.; Wiepjes, C.M.; Hannema, S.E. Shaping the Skeleton: Impact of GnRH Analogue and Sex Hormone Therapy on Skeletal Dimensions in Transgender Individuals. J. Clin. Endocrinol. Metab. 2025, 110, e1411–e1419. [Google Scholar] [CrossRef]
  164. Roseman, C.C. Detecting Interregionally Diversifying Natural Selection on Modern Human Cranial Form by Using Matched Molecular and Morphometric Data. Proc. Natl. Acad. Sci. USA 2004, 101, 12824–12829. [Google Scholar] [CrossRef]
  165. Angel, J.L. A New Measure of Growth Efficiency: Skull Base Height. Am. J. Phys. Anthropol. 1982, 58, 297–305. [Google Scholar] [CrossRef]
  166. Senator, M.; Kwiatkowska, B.; Gronkiewicz, S. Height of Skull Base as an Indicator of Living Conditions in Historical Native Populations from Europe, Australia and Africa. HOMO 2009, 60, 535–549. [Google Scholar] [CrossRef]
  167. Wescott, D.J.; Jantz, R.L. Assessing Craniofacial Secular Change in American Blacks and Whites Using Geometric Morphometry. In Modern Morphometrics in Physical Anthropology; Developments in Primatology: Progress and Prospects; Slice, D.E., Ed.; Kluwer Academic Publishers-Plenum Publishers: New York, NY, USA, 2005; pp. 231–245. ISBN 978-0-306-48697-5. [Google Scholar]
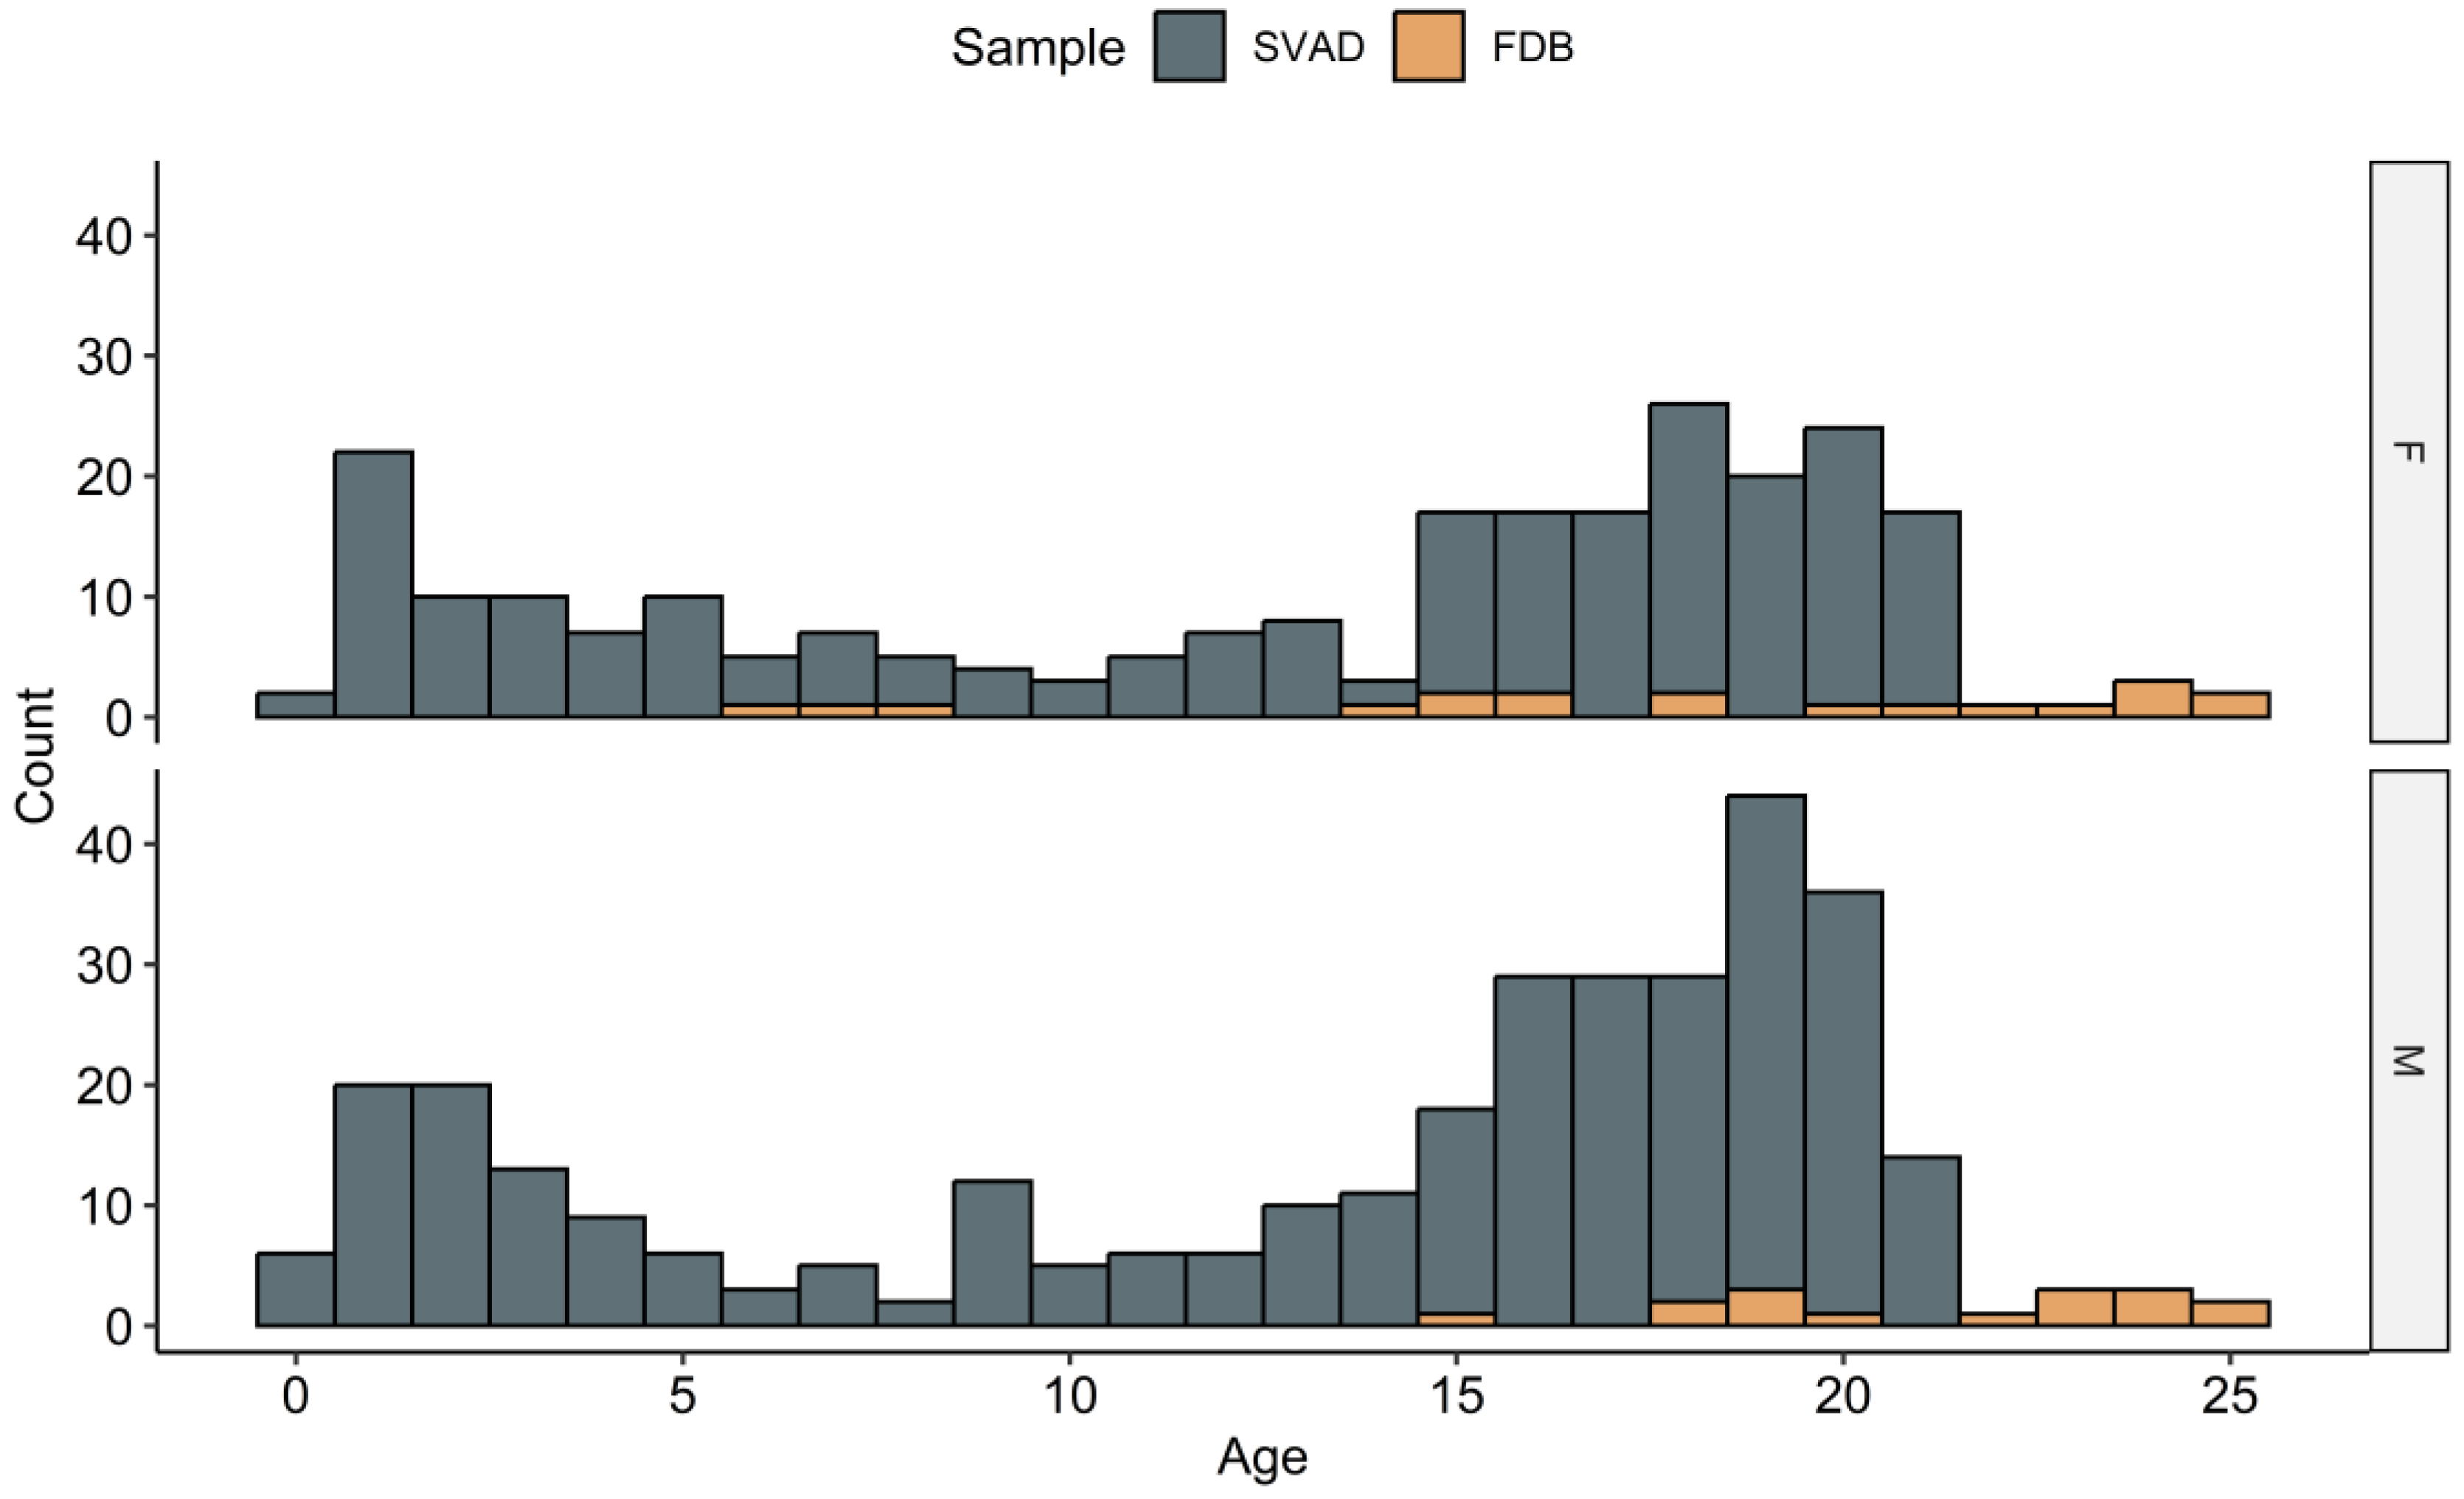
Figure 1. Age and sex distributions by sample.
Forensicsci 05 00032 g001
Figure 2. Scatterplots of two ILDs (left: FOL; right: NLH) to illustrate the feasibility of pooling the samples. The SVAD sample includes individuals younger than 21 years of age, and the FDB sample is primarily comprised of individuals older than 20 years of age.
Forensicsci 05 00032 g002
Figure 3. Three views of the cranium with landmarks used to calculate ILDs and cranial regions attributed to each ILD.
Forensicsci 05 00032 g003
Figure 4. CVRSq values for each ILD by biological sex and cranial region in descending order.
Forensicsci 05 00032 g004
Figure 5. Ages with knots detected in the MARS models for each ILD by biological sex and cranial region. EKB, AUB, OCC, FOB, and FOL all have overlapping knot locations for males and females.
Forensicsci 05 00032 g005
Figure 6. Splanchnocranium ILD growth trajectories by biological sex (top: female, bottom: male).
Forensicsci 05 00032 g006
Figure 7. Neurocranium ILD growth trajectories by biological sex (top: female, bottom: male).
Forensicsci 05 00032 g007
Figure 8. Basicranium ILD growth trajectories by biological sex (top: female, bottom: male).
Forensicsci 05 00032 g008
Figure 9. Cross-regional ILD growth trajectories by biological sex (top: female, bottom: male).
Forensicsci 05 00032 g009
Figure 10. Splanchnocranium ILDs with continued growth across ontogeny and sex-patterned differences (left to right, top: NLH, NPH, OBB, middle: EKB, FMB, ZYB, bottom: JUB). Loess lines by biological sex are included to illustrate overall size differences. All ILDs except for EKB have different knot placements for males and females.
Forensicsci 05 00032 g010
Figure 11. Scatterplots of three splanchnocranium ILDs (left to right: DKB, OBH, NLB) illustrating the lack of variance explained by age and biological sex. Loess lines by sex are included to illustrate the overall differences in size.
Forensicsci 05 00032 g011
Figure 12. Scatterplots of three neurocranium ILDs (left to right: XCB, PAC, OCC) illustrating the lack of variance explain by age. Loess lines by biological sex are included to illustrate the overall differences in size.
Forensicsci 05 00032 g012
Figure 13. Scatterplots of basicranium ILDs (left to right: ASB, FOB, FOL). Loess lines by biological sex are included to illustrate the consistency in size and variation across age.
Forensicsci 05 00032 g013
Figure 14. Scatterplots of cross regional ILDs (left to right: BPL, BNL, BBH). Loess lines by biological sex are included to illustrate the overall differences in size.
Forensicsci 05 00032 g014
Figure 15. Density ridges of scaled and centered ILDs (z-scores) for individuals 18 years and older. Arranged by age at first knot and separated by biological sex (bottom: earliest age, top: latest age, regardless of sex).
Forensicsci 05 00032 g015
Figure 16. Scatterplots of neurocranium ILDs (left to right, top: MDH, AUB, FRC, bottom: WFB, NOL, GOL). Loess lines by biological sex are included to illustrate overall differences in size. All ILDs except WFB have at least 2 years difference between male and female knot placements.
Forensicsci 05 00032 g016
Table 1. Craniometric interlandmark distances by cranial region.
RegionILDAbbreviationDefinitions
SplanchnocraniumNasal HeightNLHNasion to most inferior nasal border (L)
Nasion-Prosthion HeightNPHNasion to prosthion
Nasal BreadthNLBAlare (L) to alare (R)
Orbital HeightOBHOrbit height inferior (R) to orbit height superior (R)
Orbital BreadthOBBDacryon (R) to ectoconchion (R)
Interorbital BreadthDKBDacryon (L) to dacryon (R)
Biorbital BreadthEKBEctoconchion (L) to ectoconchion (R)
Bifrontal BreadthFMBFrontomalare anterior (L) to frontomalare anterior (R)
Bizygomatic BreadthZYBZygion (L) to zygion (R)
Bijugal BreadthJUBJugale (L) to jugale (R)
NeurocraniumMaximum Cranial LengthGOLGlabella to opisthocranion
Nasio-occipital LengthNOLNasion to opisthocranion
Mastoid HeightMDHPorion (R) to mastoideale (R)
Maximum Cranial BreadthXCBEuryon (L) to euryon (R)
Minimum Frontal BreadthWFBFrontotemporale (L) to frontotemporale (R)
Frontal ChordFRCNasion to bregma
Parietal ChordPACBregma to lambda
Occipital ChordOCCLambda to opisthion
Biauricular BreadthAUBRadiculare (L) to radiculare (R)
BasicraniumBiasterionic BreadthASBAsterion (L) to asterion (R)
Foramen Magnum LengthFOLBasion to opisthion
Foramen Magnum BreadthFOBForamen magnum breadth (L) to foramen magnum breadth (R)
Cross-RegionCranial Base LengthBNLBasion to nasion
Basion-Bregma HeightBBHBasion to bregma
Basion-Prosthion LengthBPLBasion to prosthion
Table 2. MARS model outputs for each ILD and biological sex with the predicted knots, GCV, GRSq, and CVRSq values.
FemaleMale
Cranial RegionILDKnots
h(Age − t)
GCVGRSqCVRSqKnots
h(Age − t)
GCVGRSqCVRSq
SplanchnocraniumNLH11.10.140.860.8415.20.140.860.85
NPH8.90.170.830.7916.20.170.830.83
NLB5.40.630.370.34.10.550.450.43
OBH8.90.580.430.345.30.580.420.37
OBB8.90.300.710.6716.10.260.740.71
20.3
DKB13.20.760.250.196.70.770.230.21
EKB9.90.250.750.79.90.260.740.7
FMB9.90.230.770.7317.00.230.770.75
ZYB9.90.180.820.7916.40.150.850.84
JUB9.90.210.790.7616.40.200.800.78
NeurocraniumGOL6.80.280.720.655.30.290.710.7
NOL8.00.260.740.685.30.270.730.71
MDH11.10.300.700.6715.50.280.730.7
XCB8.90.760.240.175.30.700.300.21
WFB8.00.460.540.56.70.450.550.51
FRC9.90.320.680.625.30.340.660.62
PAC6.80.730.280.155.30.700.300.26
OCC4.20.610.390.354.10.650.350.33
10.8
AUB9.90.230.770.739.90.200.800.79
20.0
BasicraniumASB4.50.490.510.475.30.500.500.45
FOL4.20.760.240.164.10.830.170.12
FOB4.20.690.320.254.10.750.250.22
8.6
Cross-RegionBNL9.90.160.840.8111.90.150.850.83
BBH7.10.270.730.694.50.270.730.7
BPL11.10.230.770.7317.00.190.810.8
Disclaimer/Publisher’s Note: The statements, opinions and data contained in all publications are solely those of the individual author(s) and contributor(s) and not of MDPI and/or the editor(s). MDPI and/or the editor(s) disclaim responsibility for any injury to people or property resulting from any ideas, methods, instructions or products referred to in the content.