
Analysis of Footstep/Stride Length from Gait Patterns of Dynamic Footprints as a Parameter for Biological Profiling—A Preliminary Study

 , , ,
, , ,
Abstract
1. Introduction
2. Materials and Methods
2.1. Anthropometric and Gait Measurements
- -
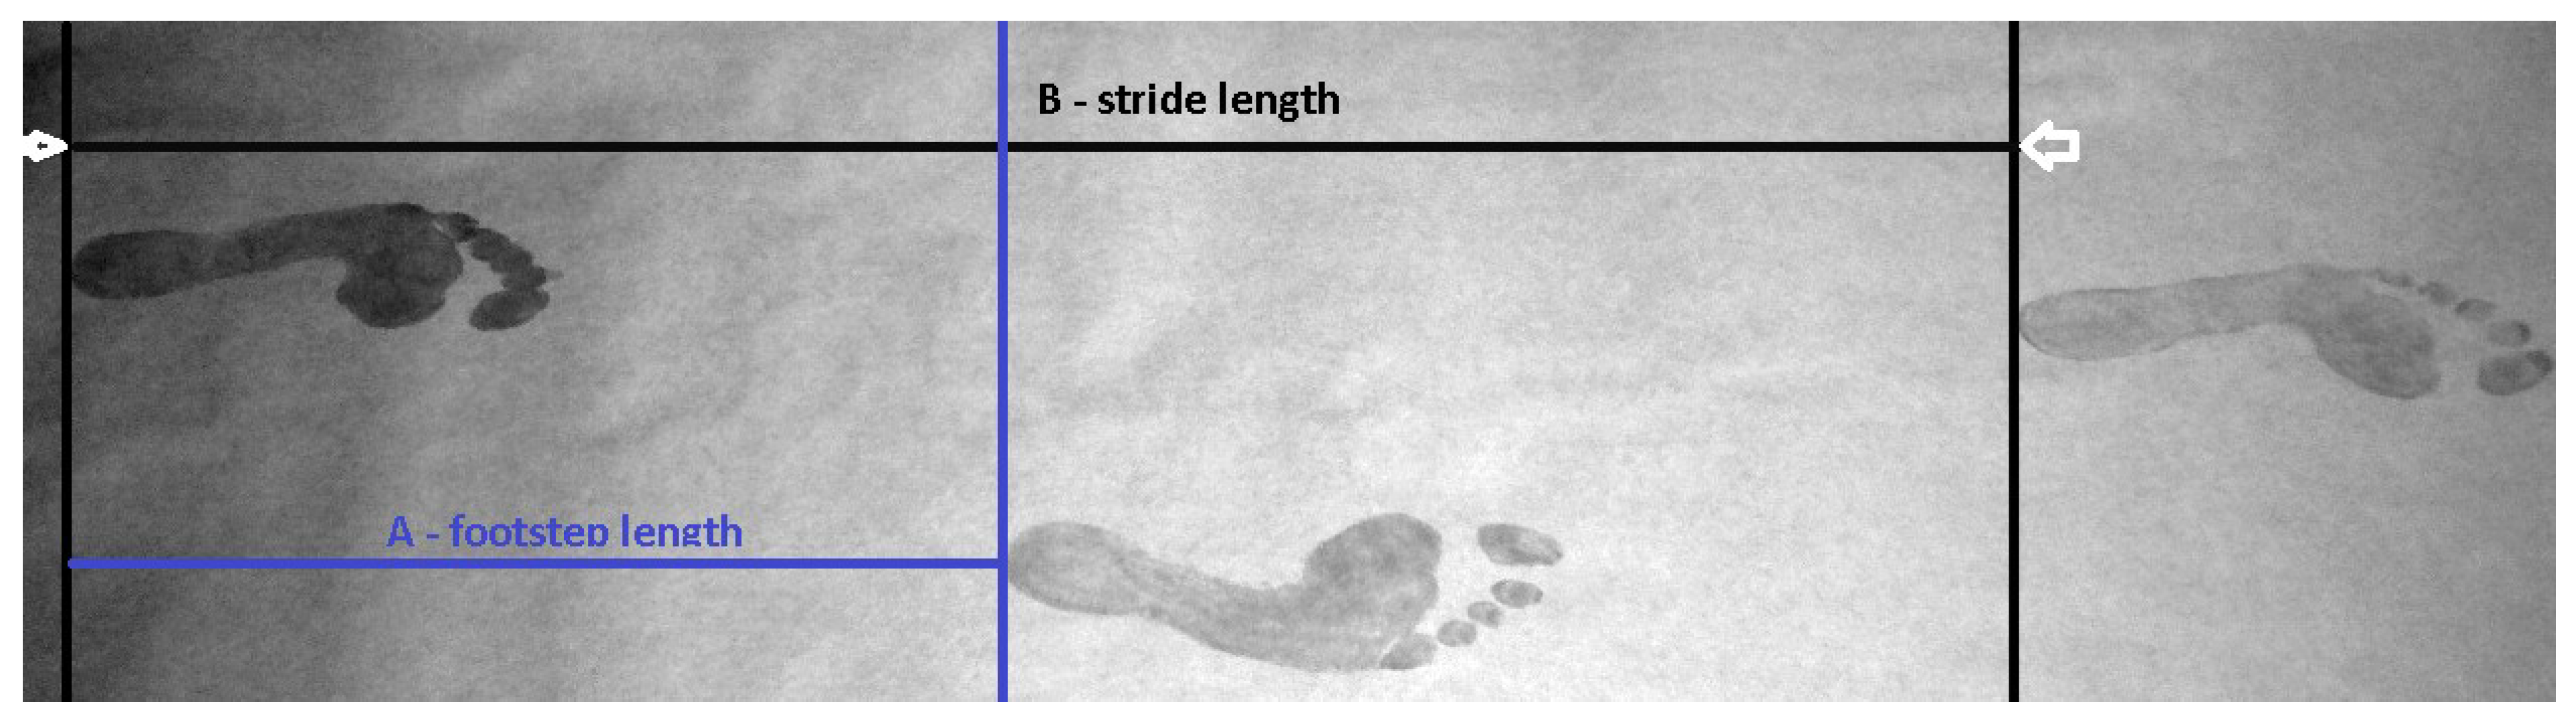
- Footstep length was measured as a straight distance from the rearmost point of the heel of one footprint to the rearmost point of the heel of consecutive footprint (Figure 1A) [20,28]. The term “footstep” represents the single footstep taken by a participant and is used in the present study with the defined meaning.
- -
- Stride length was measured as the straight distance between the rearmost point of the heel of one footprint and the rearmost point of the heel of the following footprint on the ipsilateral side (Figure 1B) [20,28]. Thus, the stride represents a double step of a participant, and in the present study, the term “stride” is used with the defined meaning. Stride length was used in the present study following the meaning found in previous studies [14,15,17,20] in relation to stature.
2.2. Statistical Analysis
3. Results and Discussion
3.1. Analysis of the Length of Footsteps and Strides in Relation to Sex, Sequence, and Laterality
3.2. The Association Between Length Parameters of Footstep/Stride and Stature
3.3. Study Limits and Further Recommendations
4. Conclusions
Author Contributions
Funding
Institutional Review Board Statement
Informed Consent Statement
Data Availability Statement
Acknowledgments
Conflicts of Interest
References
- Ansert, E.; Nirenberg, E.; Mukhara, R.; Kanchan, T.; Krishan, K. Ghosting phenomenon in static and dynamic footprints in India and the United States. Sci. Justice 2023, 63, 406–413. [Google Scholar] [PubMed]
- Krishan, K. Anthropometry in Forensic Medicine and Forensic Science—‘Forensic Anthropometry’. Internet J. Forensic Sci. 2006, 2, 95–97. [Google Scholar]
- Uhrová, P.; Beňuš, R.; Masnicová, S. Stature estimation from various foot dimensions among Slovak population. J. Forensic Sci. 2013, 58, 448–451. [Google Scholar] [PubMed]
- Atamturk, D. Estimation of Sex from the Dimensions of Foot, Footprints, and Shoe. Anthropol. Anz. 2010, 68, 21–29. [Google Scholar]
- Kanchan, T.; Krishan, K.; Sharma, A.; Menezes, R.G. A study of correlation of hand and foot dimensions for personal identification in mass disasters. Forensic Sci. Int. 2010, 199, 112.e1–112.e6. [Google Scholar] [PubMed]
- Krishan, K.; Sharma, A. Estimation of stature from dimensions of hands and feet in a North Indian population. J. Forensic Leg. Med. 2007, 14, 327–332. [Google Scholar]
- Caplová, Z.; Švábová, P.; Fuchsová, M.; Masnicová, S.; Neščáková, E.; Bodoriková, S.; Dörnhöferová, M.; Beňuš, R. Estimation of stature and body weight in Slovak adults using static footprints: A preliminary study. Leg. Med. 2018, 34, 7–16. [Google Scholar]
- Švábová, P.; Caplová, Z.; Beňuš, R.; Chovancová, M.; Masnicová, S. Estimation of stature and body weight from static and dynamic footprints—Forensic implications and validity of non-colouring cream method. Forensic Sci. Int. 2022, 330, e111105. [Google Scholar]
- Reel, S.; Rouse, S.; Vernon, W.; Doherty, P. Estimation of stature from static and dynamic footprints. Forensic Sci. Int. 2012, 219, 283.e1–283.e5. [Google Scholar]
- Abledu, J.K.; Abledu, G.K.; Offei, F.B.; Antwi, E.M. Determination of Sex from Footprint Dimensions in a Ghanaian Population. PLoS ONE 2015, 10, e0139897. [Google Scholar]
- Fawzy, I.A.; Kamal, N.N. Stature and Body Weight Estimation from Various Footprints Measurements Among Egyptian Population. J. Forensic Sci. 2010, 55, 884–888. [Google Scholar] [PubMed]
- Kanchan, T.; Krishan, K.; Geriani, D.; Khan, I.S. Estimation of stature from the width of static footprints—Insight into an Indian model. Foot 2013, 23, 136–139. [Google Scholar]
- Nataraja Moorthy, T.; Ang, Y.L.; Saufee, A.S.; Nik, F.N.H. Estimation of stature from footprint and foot outline measurements in Malaysian Chinese. Aust. J. Forensic Sci. 2013, 46, 136–159. [Google Scholar]
- Jasuja, O.P. Manjula Estimation of stature from footstep length. Forensic Sci. Int. 1993, 61, 1–5. [Google Scholar]
- Jasuja, O.P.; Harbhajan, S.; Anupama, K. Estimation of stature from stride length while walking fast. Forensic Sci. Int. 1997, 86, 181–186. [Google Scholar] [PubMed]
- Guest, R.; Miguel-Hurtado, O.; Stevenage, S.; Black, S. Exploring the relationship between stride, stature and hand size for forensic assessment. J. Forensic Leg. Med. 2017, 52, 46–55. [Google Scholar] [CrossRef] [PubMed]
- Kanchan, T.; Sinha, S.; Krishan, K. Is There a Correlation Between Footstep Length, Lower Extremities, and Stature? J. Forensic Sci. 2015, 60, 1337–1340. [Google Scholar] [CrossRef]
- Nirenberg, M.S.; Ansert, E.; Krishan, K.; Kanchan, T. Two-dimensional linear analysis of dynamic bare footprints: A comparison of measurement techniques. Sci. Justice 2019, 59, 552–557. [Google Scholar]
- Vernon, W.; Simmonite, N.; Reel, S.; Reidy, S. An investigation into the cause of the inner dark areas and outer lighter areas (ghosting) seen in dynamically-created two-dimensional bare footprints. Sci. Justice 2017, 57, 276–282. [Google Scholar]
- Straus, J. Forenzní biomechanika; Policejní Akademie České Republiky: Praha, Czech Republic, 1999. [Google Scholar]
- Samson, M.M.; Crowe, A.; de Vreede, P.L.; Dessens, J.A.G.; Duursma, S.A.; Verhaar, H.J.J. Differences in gait parameters at a preferred walking speed in healthy subjects due to age, height and body weight. Aging Clin. Exp. Res. 2001, 13, 16–21. [Google Scholar]
- Pataky, T.C.; Mu, T.; Bosch, K.; Rosenbaum, D.; Goulermas, J.Y. Gait recognition: Highly unique dynamic plantar pressure patterns among 104 individuals. J. R. Soc. Interface 2012, 9, 790–800. [Google Scholar] [PubMed]
- Badiye, A.; Kathane, P.; Krishan, K. Forensic Gait Analysis. PubMed. Available online: https://www.ncbi.nlm.nih.gov/books/NBK557684/ (accessed on 20 February 2025).
- Krishan, K.; Kanchan, T.; DiMaggio, J.A. Emergence of forensic podiatry—A novel sub-discipline of forensic sciences. Forensic Sci. Int. 2015, 255, 16–27. [Google Scholar] [CrossRef] [PubMed]
- Thurzo, M.; Department of Anthropology, Faculty of Natural Science, Comenius University in Bratislava, Bratislava, Slovakia; Beňuš, R.; Department of Anthropology, Faculty of Natural Science, Comenius University in Bratislava, Bratislava, Slovakia. Morfologická variabilita ako dôsledok makroevolučných procesov. 2007; Unpublished work. [Google Scholar]
- Vaughan, C.L.; Davis, B.L.; O’Connor, J.C. Dynamics of Human Gait, 2nd ed.; Kiboho Publishers: Cape Town, South Africa, 1999. [Google Scholar]
- Robbins, L.M. The Individuality of Human Footprints. J. Forensic Sci. 1978, 23, 778–785. [Google Scholar] [PubMed]
- Wilkinson, M.J.; Menz, H.B.; Raspovic, A. The measurement of gait parameters from footprints. Foot 1995, 5, 84–90. [Google Scholar]
- Aung, S.T.Y.; Kusakunniran, W. A comprehensive review of gait analysis using deep learning approaches in criminal investigation. PeerJ Comput. Sci. 2024, 10, e2456. [Google Scholar] [CrossRef]
- Shifana, M.; Sona, P.; Nanthini, N. Gait Recognition in Forensic: Analyzing CCTV Footage for Criminal Profiling. In Proceedings of the 2025 International Conference on Data Science, Agents & Artificial Intelligence (ICDSAAI), Chennai, India, 3–5 June 2025; pp. 1–6. [Google Scholar] [CrossRef]
- Güner Şahan, P.; Şahin, S.; Kaya Gülağız, F. A survey of appearance-based approaches for human gait recognition: Techniques, challenges, and future directions. J. Supercomput. 2024, 80, 18392–18429. [Google Scholar] [CrossRef]
- Singla, A.; Khan, Z. Exploring Artificial Intelligence-Driven Gait Analysis for Suspect Identification in Forensic Video Footage. Int. J. Sci. Inno. Eng. 2025, 2, 15–19. [Google Scholar] [CrossRef]
- McGibbon, C.A. Toward a better understanding of gait changes with age and disablement: Neuromuscular adaptation. Exerc. Sport Sci. Rev. 2003, 31, 102–108. [Google Scholar]
- Weiner, J.; Lourie, J.A. Human Biology—Guide to Field Methods; IBP Handbook No. 9; Blackwell Scientific Publications: Oxford, UK, 1969. [Google Scholar]
- Robbins, L. Estimating Height and Weight from Size of Footprints. J. Forensic Sci. 1986, 31, 143–152. [Google Scholar]
- Krishan, K.; Vij, K. Diurnal Variation of Stature in Three Adults and One Child. Anthropologist 2007, 9, 113–117. [Google Scholar]
- Tyrrell, A.R.; Reilly, T.; Troup, J.D. Circadian variation in stature and the effects of spinal loading. Spine 1985, 10, 161–164. [Google Scholar]
- Tripathy, B.J. A study on step distance and its relation with some morphometric features in adult male. Anthropologist 2004, 6, 137–139. [Google Scholar]
- Jansen, E.C.; Vittass, D.; Hellber, S.; Hansen, J. Normal gait of young and old men and women—Ground reaction force measurement on a treadmill. Acta Orthop. Scand. 1982, 53, 193–196. [Google Scholar] [PubMed]
- Howsam, N.; Bridgen, A. A comparative study of standing fleshed foot and walking and jumping bare footprint measurements. Sci. Justice 2018, 58, 346–354. [Google Scholar] [CrossRef] [PubMed]
- Burrow, J.G. Ghosting of Images in Barefoot Exemplar Prints Collection: Issues for Analyses. J. Forensic Identif. 2015, 65, 884–900. [Google Scholar]
- Nirenberg, M.; Ansert, E.; Campbell, J.; Curran, M. Chasing ghosts: An investigation of the ghosting phenomenon in footprints. Sci. Justice 2020, 60, 432–437. [Google Scholar] [CrossRef]
- Reel, S.; Rouse, S.; Vernon, W.; Doherty, P. Reliability of a two-dimensional footprint measurement approach. Sci. Justice 2010, 50, 113–118. [Google Scholar] [CrossRef]
- Cassidy, M.J. Footwear Identification; Public Relation Branch, RCMP: Ottawa, ON, Canada, 1980. [Google Scholar]
- Ghoshmaulik, S.K. Relation of Step-Distance with Somatimetric Features. Man Soc. 1996, 1, 53–58. [Google Scholar]
- Morlock, M.; Mittlmeiser, T. First step method versus full gait method: Results for comparison. Eur. J. Phys. Rehabil. Med. 1992, 2, 33. [Google Scholar]
- Wearing, S.C.; Urry, S.; Smeathers, J.E.; Battistutta, D. A comparison of gait initiation and termination methods for obtaining plantar foot pressures. Gait Posture 1999, 10, 255–263. [Google Scholar]

| Gait Parameters (in cm) | Females (N = 114) | Males (N = 104) | ||||||
|---|---|---|---|---|---|---|---|---|
| Mean | SD | Min | Max | Mean | SD | Min | Max | |
| Footstep lengths (FSL) | ||||||||
| FSL 1 | 46.89 | 8.13 | 30.20 | 70.70 | 49.23 | 8.39 | 30.70 | 73.40 |
| FSL 2 | 53.32 | 8.70 | 32.50 | 76.10 | 53.45 | 7.87 | 35.80 | 78.00 |
| FSL 3 | 56.36 | 8.07 | 31.20 | 74.50 | 58.52 | 7.38 | 39.50 | 75.50 |
| FSL 4 | 58.84 | 7.32 | 39.10 | 82.20 | 59.84 | 7.53 | 40.10 | 76.30 |
| FSL 5 | 58.48 | 6.02 | 44.30 | 74.80 | 60.83 | 7.32 | 42.70 | 78.80 |
| FSL 6 | 55.08 | 5.38 | 43.30 | 64.90 | 58.43 | 7.15 | 35.80 | 73.40 |
| FSL 7 | 52.13 | 7.11 | 27.00 | 70.10 | 54.69 | 6.70 | 38.90 | 66.70 |
| Stride lengths (SL) | ||||||||
| SL 1 | 100.33 | 15.42 | 66.80 | 143.40 | 102.77 | 14.80 | 66.90 | 150.30 |
| SL 2 | 109.76 | 15.85 | 67.10 | 149.00 | 111.88 | 14.10 | 84.20 | 152.70 |
| SL 3 | 115.17 | 14.49 | 70.30 | 150.70 | 118.35 | 13.88 | 86.30 | 150.20 |
| SL 4 | 116.46 | 13.34 | 76.80 | 152.60 | 120.71 | 13.77 | 90.20 | 151.00 |
| SL 5 | 112.44 | 10.43 | 80.80 | 133.90 | 118.96 | 12.84 | 90.50 | 141.70 |
| SL 6 | 107.53 | 9.92 | 86.10 | 134.50 | 112.23 | 11.81 | 71.90 | 137.20 |
| Stature | 166.86 | 6.04 | 152.10 | 186.30 | 180.33 | 6.98 | 161.00 | 198.40 |
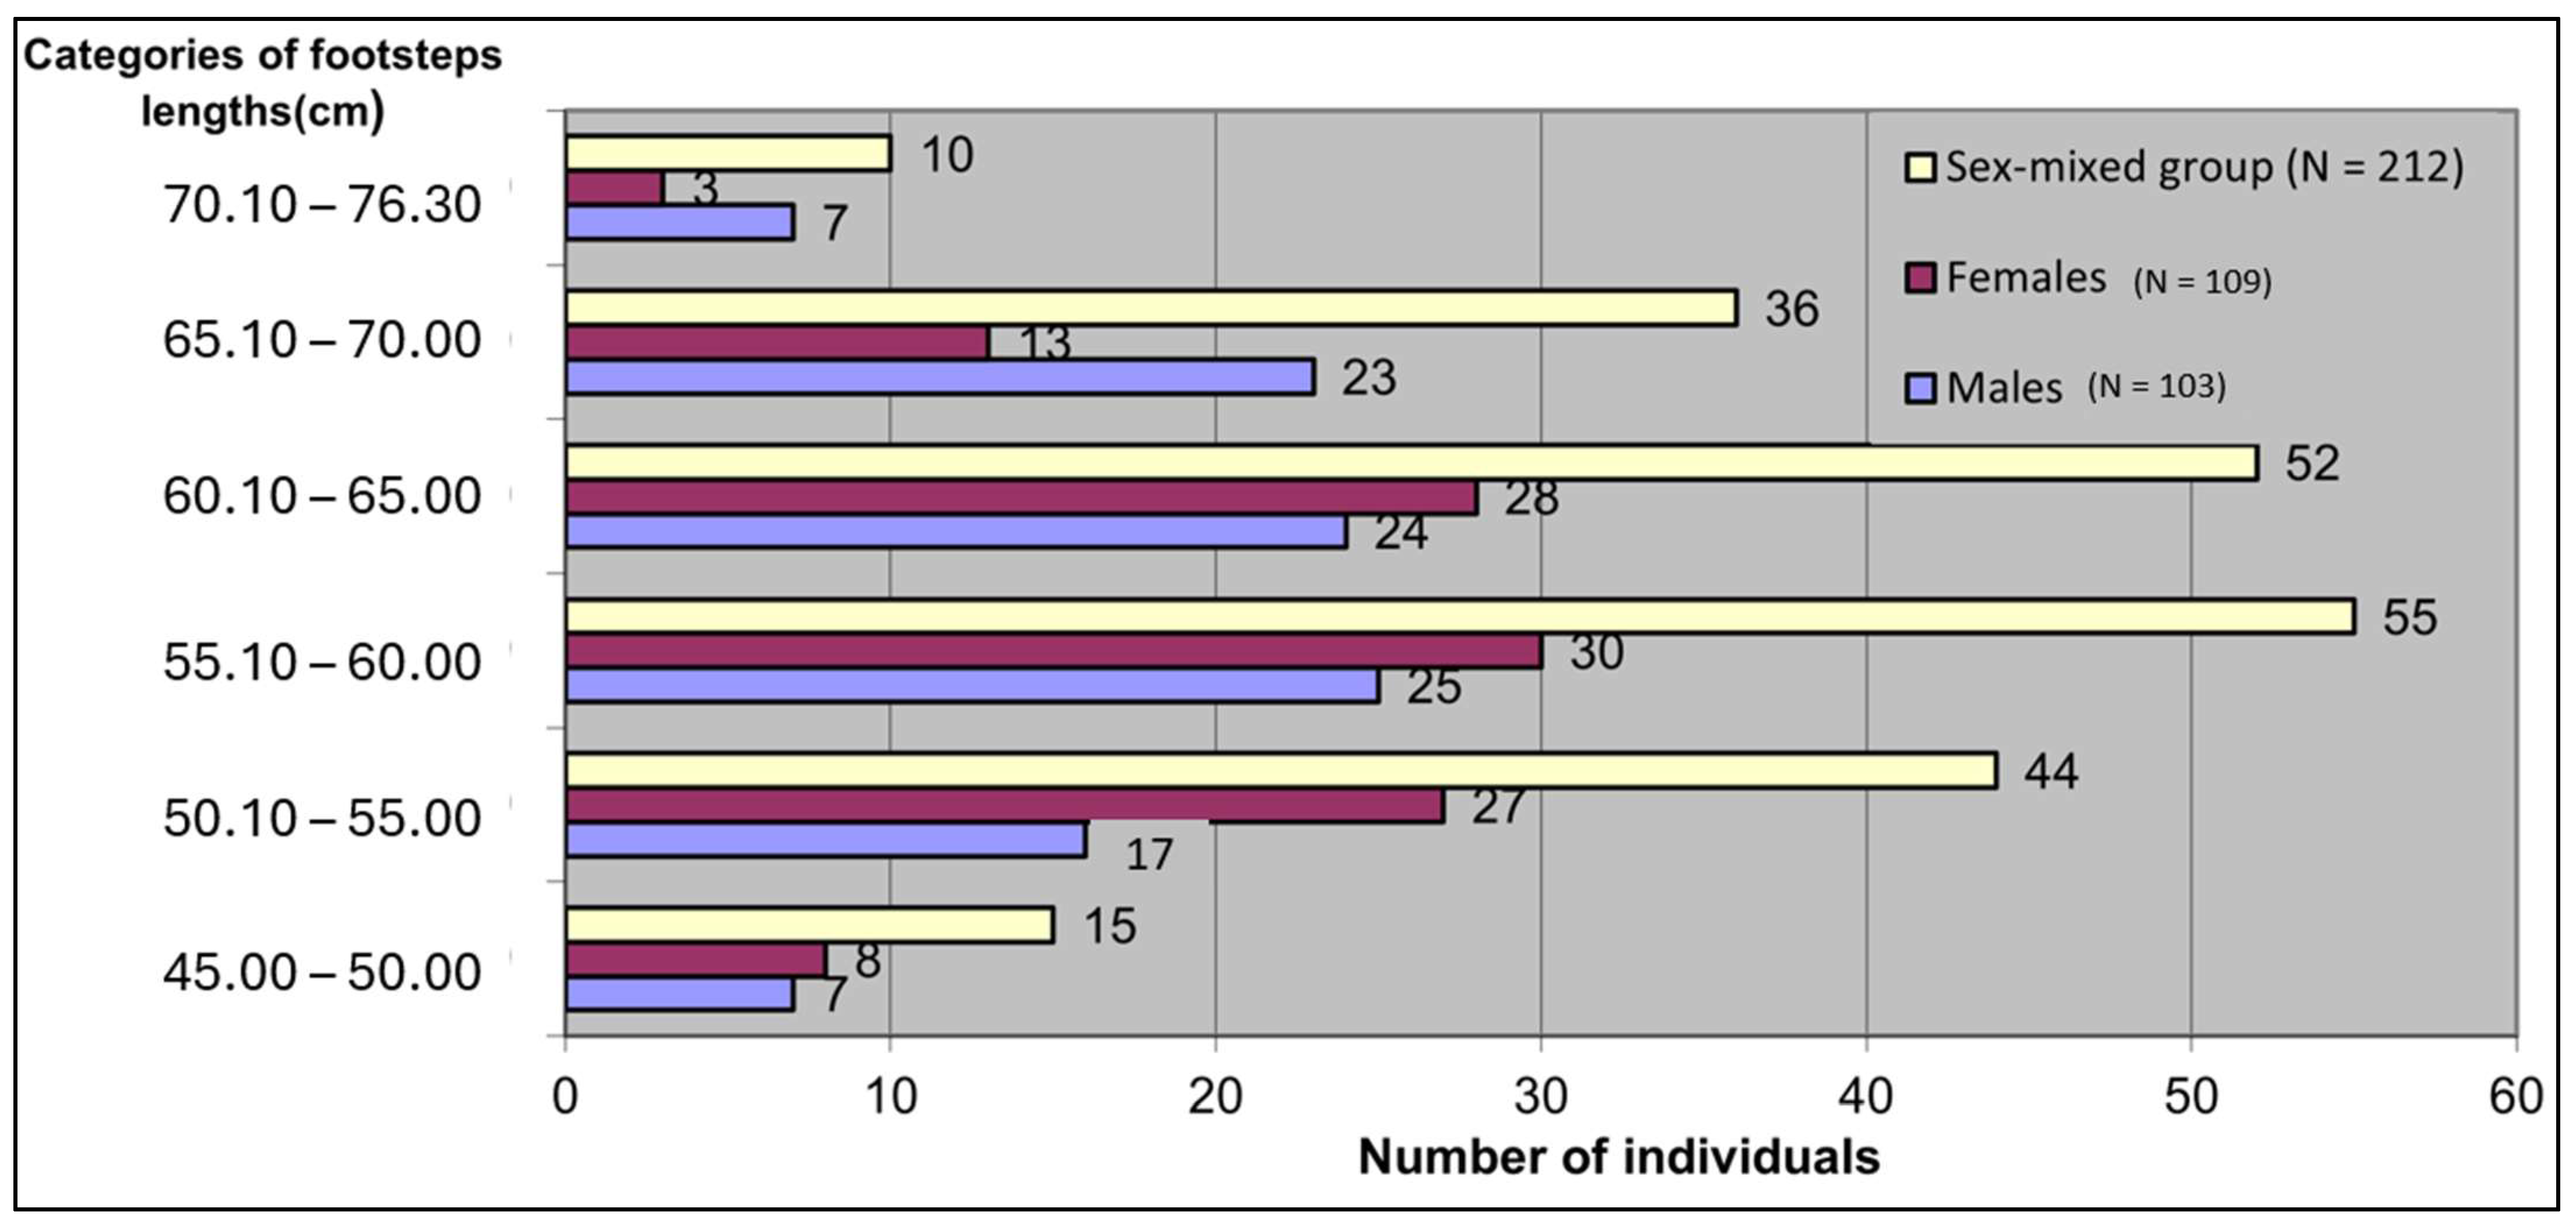
| Range of Footstep Lengths (cm) | Mixed Sex Group (N = 212) | Females (N = 109) | Males (N = 103) | |||
|---|---|---|---|---|---|---|
| n | % | n | % | n | % | |
| 45.00–50.00 | 15 | 7.08 | 8 | 7.34 | 7 | 6.80 |
| 50.10–55.00 | 44 | 20.75 | 27 | 24.77 | 17 | 16.50 |
| 55.10–60.00 | 55 | 25.94 | 30 | 27.52 | 25 | 24.27 |
| 60.10–65.00 | 52 | 24.53 | 28 | 25.69 | 24 | 23.30 |
| 65.10–70.00 | 36 | 16.98 | 13 | 11.93 | 23 | 22.33 |
| 70.10–76.30 | 10 | 4.72 | 3 | 2.75 | 7 | 6.80 |
| total | 212 | 100 | 109 | 100 | 103 | 100 |
| Sequence of Footsteps | N Right | N Left | N Total | % Right | % Left |
|---|---|---|---|---|---|
| Mixed sex group | |||||
| 1 | 124 | 96 | 220 | 56.36 | 43.64 |
| 2 | 97 | 124 | 221 | 43.89 | 56.11 |
| 3 | 125 | 96 | 221 | 56.56 | 43.44 |
| 4 | 96 | 125 | 221 | 43.44 | 56.56 |
| 5 | 123 | 92 | 215 | 57.21 | 42.79 |
| 6 | 82 | 103 | 185 | 44.32 | 55.68 |
| 7 | 76 | 47 | 123 | 61.79 | 38.21 |
| Females | |||||
| 1 | 63 | 52 | 115 | 54.78 | 45.22 |
| 2 | 53 | 63 | 116 | 45.69 | 54.31 |
| 3 | 64 | 52 | 116 | 55.17 | 44.83 |
| 4 | 52 | 64 | 116 | 44.83 | 55.17 |
| 5 | 63 | 50 | 113 | 55.75 | 44.25 |
| 6 | 45 | 50 | 95 | 47.37 | 52.63 |
| 7 | 39 | 26 | 65 | 60.00 | 40.00 |
| Males | |||||
| 1 | 60 | 44 | 104 | 57.69 | 42.31 |
| 2 | 44 | 60 | 104 | 42.31 | 57.69 |
| 3 | 60 | 44 | 104 | 57.69 | 42.31 |
| 4 | 44 | 60 | 104 | 42.31 | 57.69 |
| 5 | 59 | 42 | 101 | 58.42 | 41.58 |
| 6 | 37 | 52 | 89 | 41.57 | 58.43 |
| 7 | 36 | 21 | 57 | 63.16 | 36.84 |
| Gait Parameters (in cm) | Females (N = 114) | Sequency Comparison | Males (N = 104) | Sequency Comparison | Sex Differences | ||
|---|---|---|---|---|---|---|---|
| Mean | SD | p-Value | Mean | SD | p-Value | p-Value | |
| FOOTSTEPS | |||||||
| FSL1 | 46.89 | 8.13 | 0.000 | 49.23 | 8.39 | 0.000 | 0.038 |
| FSL2 | 53.35 | 8.74 | 53.45 | 7.87 | 0.904 | ||
| FSL2 | 53.32 | 8.70 | 0.000 | 53.45 | 7.87 | 0.000 | |
| FSL3 | 56.36 | 8.07 | 58.52 | 7.38 | 0.042 | ||
| FSL3 | 56.36 | 8.07 | 0.000 | 58.52 | 7.38 | 0.015 | |
| FSL4 | 58.84 | 7.32 | 59.84 | 7.53 | 0.318 | ||
| FSL4 | 58.85 | 7.11 | 0.400 | 59.78 | 7.60 | 0.065 | |
| FSL5 | 58.48 | 6.02 | 60.83 | 7.32 | 0.012 | ||
| FSL5 | 58.02 | 5.52 | 0.000 | 60.42 | 6.96 | 0.002 | |
| FSL6 | 55.20 | 5.30 | 58.43 | 7.15 | <0.000 | ||
| FSL6 | 55.35 | 4.84 | 0.001 | 58.40 | 5.68 | 0.000 | |
| FSL7 | 52.13 | 7.11 | 54.69 | 6.70 | 0.047 | ||
| STRIDES | |||||||
| SL1 | 100.33 | 15.42 | 0.000 | 102.77 | 14.80 | 0.000 | 0.237 |
| SL2 | 109.76 | 15.92 | 111.88 | 14.10 | 0.300 | ||
| SL2 | 109.76 | 15.85 | 0.000 | 111.88 | 14.10 | 0.000 | |
| SL3 | 115.17 | 14.49 | 118.35 | 13.88 | 0.099 | ||
| SL3 | 114.67 | 14.32 | 0.004 | 117.94 | 13.82 | 0.000 | |
| SL4 | 116.46 | 13.34 | 120.71 | 13.77 | 0.024 | ||
| SL4 | 115.04 | 11.92 | 0.001 | 119.63 | 13.83 | 0.312 | |
| SL5 | 112.44 | 10.43 | 118.96 | 12.84 | <0.000 | ||
| SL5 | 111.74 | 9.76 | 0.000 | 117.56 | 10.81 | 0.000 | |
| SL6 | 107.53 | 9.92 | 112.23 | 11.81 | 0.020 | ||
| Gait Parameter (in cm) | Females (N = 114) | Comparison | Males (N = 104) | Comparison | Sex Differences | ||
|---|---|---|---|---|---|---|---|
| Mean | SD | p-Value | Mean | SD | p-Value | p-Value | |
| FSL right 1 | 46.46 | 7.74 | 0.000 | 47.66 | 7.93 | 0.000 | 0.415 |
| FSL left 2 | 52.43 | 8.51 | 52.45 | 7.80 | 0.965 | ||
| FSL left 1 | 47.26 | 8.57 | 0.000 | 51.38 | 8.62 | 0.001 | 0.021 |
| FSL right 2 | 54.75 | 8.71 | 54.82 | 7.83 | 0.857 | ||
| FSL right 2 | 54.75 | 8.71 | 0.000 | 54.82 | 7.83 | 0.000 | |
| FSL left 3 | 57.84 | 8.53 | 59.96 | 7.82 | 0.211 | ||
| FSL left 2 | 52.39 | 8.45 | 0.000 | 52.45 | 7.80 | 0.000 | |
| FSL right 3 | 55.25 | 7.48 | 57.46 | 6.92 | 0.083 | ||
| FSL right 3 | 55.20 | 7.43 | 0.000 | 57.46 | 6.92 | 0.006 | |
| FSL left 4 | 57.44 | 7.31 | 59.29 | 7.78 | 0.173 | ||
| FSL left 3 | 57.84 | 8.53 | 0.004 | 59.96 | 7.82 | 0.492 | |
| FSL right 4 | 60.52 | 6.89 | 60.59 | 7.19 | 0.960 | ||
| FSL right 4 | 60.38 | 6.99 | 0.305 | 60.64 | 7.35 | 0.921 | |
| FSL left 5 | 59.84 | 5.58 | 60.81 | 10.69 | 0.578 | ||
| FSL left 4 | 57.27 | 7.25 | 0.246 | 59.16 | 7.78 | 0.330 | |
| FSL right 5 | 56.24 | 7.72 | 59.82 | 7.37 | 0.010 | ||
| FSL right 5 | 56.90 | 6.49 | 0.017 | 59.30 | 6.83 | 0.046 | |
| FSL left 6 | 54.04 | 7.52 | 57.94 | 7.78 | 0.012 | ||
| FSL left 5 | 58.84 | 4.84 | 0.000 | 60.36 | 10.94 | 0.536 | |
| FSL right 6 | 55.10 | 4.61 | 59.12 | 6.18 | 0.001 | ||
| FSL right 6 | 54.73 | 4.19 | 0.009 | 58.60 | 5.08 | 0.001 | |
| FSL left 7 | 51.07 | 5.65 | 52.86 | 6.98 | 0.336 | ||
| FSL left 6 | 55.66 | 5.16 | 0.025 | 58.05 | 6.15 | 0.011 | |
| FSL right 7 | 52.95 | 7.76 | 54.17 | 9.33 | 0.538 | ||
| Females | Males | Mixed Sex Group | Females | Males | Mixed Sex Group | ||
|---|---|---|---|---|---|---|---|
| N = 114 | N = 104 | N = 218 | N = 114 | N = 104 | N = 218 | ||
| Footstep length (FSL) | Stride length (SL) | ||||||
| FSL1-r | 0.236 | 0.140 | 0.229 | SL1-r | 0.272 | 0.094 | 0.184 |
| p-value | 0.012 | 0.155 | 0.00 | p-value | 0.004 | 0.342 | 0.007 |
| FSL2-r | 0.269 | 0.026 | 0.110 | SL2-r | 0.302 | 0.105 | 0.192 |
| p-value | 0.004 | 0.791 | 0.107 | p-value | 0.001 | 0.290 | 0.004 |
| FSL3-r | 0.295 | 0.160 | 0.256 | SL3-r | 0.248 | 0.128 | 0.209 |
| p-value | 0.001 | 0.104 | 0.000 | p-value | 0.008 | 0.195 | 0.002 |
| FSL4-r | 0.169 | 0.079 | 0.133 | SL4-r | 0.091 | 0.105 | 0.180 |
| p-value | 0.072 | 0.424 | 0.049 | p-value | 0.343 | 0.294 | 0.009 |
| FSL5-r | 0.033 | 0.153 | 0.197 | SL5-r | 0.141 | 0.135 | 0.291 |
| p-value | 0.732 | 0.127 | 0.004 | p-value | 0.179 | 0.207 | <0.000 |
| FSL6-r | 0.144 | 0.068 | 0.256 | SL6-r | 0.140 | −0.072 | 0.176 |
| p-value | 0.174 | 0.524 | 0.001 | p-value | 0.273 | 0.596 | 0.054 |
| FSL7-r | 0.118 | −0.172 | 0.122 | FSL (mean)-r | 0.072 | 0.121 | 0.159 |
| p-value | 0.358 | 0.209 | 0.188 | p-value | 0.457 | 0.230 | 0.022 |
| Equations Footsteps | SEE | R2 | Fa | Equations Strides | SEE | R2 | Fa |
|---|---|---|---|---|---|---|---|
| Females (N = 114) | Females (N = 114) | ||||||
| 158.590 + 0.176 × FSL1 | 5.916 | 0.056 | 6.533 | 156.097 + 0.107 × SL1 | 5.857 | 0.074 | 8.893 |
| 156.917 + 0.187 × FSL2 | 5.843 | 0.072 | 8.721 | 154.244 + 0.115 × SL2 | 5.784 | 0.091 | 11.214 |
| 154.412 + 0.221 × FSL3 | 5.796 | 0.087 | 10.686 | 154.973 + 0.103 × SL3 | 5.878 | 0.061 | 7.316 |
| Mixed sex group (N = 218) | Mixed sex group (N = 218) | ||||||
| 160.912 + 0.258 × FSL1 | 9.150 | 0.052 | 11.890 | 161.754 + 0.114 × SL1 | 9.240 | 0.034 | 7.509 |
| 155.689 + 0.307 × FSL3 | 9.069 | 0.065 | 15.113 | 160.029 + 0.120 × SL2 | 9.206 | 0.034 | 8.299 |
| 157.167 + 0.271 × FSL5 | 9.163 | 0.039 | 8.340 | 157.252 + 0.137 × SL3 | 9.173 | 0.044 | 9.898 |
| 151.575 + 0.383 × FSL6 | 9.481 | 0.065 | 12.446 | 158.662 + 0.123 × SL4 | 9.218 | 0.032 | 7.023 |
| 159.942 + 0.225 × FSL | 9.227 | 0.025 | 5.345 | 146.104 + 0.235 × SL5 | 9.360 | 0.085 | 16.636 |
| Equations Footsteps (FSL) and Strides (SL) | SEE | R2 | Fa |
|---|---|---|---|
| Females (N = 114) | |||
| 154.455 + 0.220 × FSL3 | 5.819 | 0.086 | 10.476 |
| 154.218 + 0.115 × SL2 | 5.803 | 0.091 | 11.139 |
| Mixed sex group (n = 218) | |||
| 153.175 + 0.360 × FSL3 | 9.453 | 0.069 | 13.089 |
| 144.770 + 0.262 × FSL3 + 0.246 * FSL6 | 9.371 | 0.091 | 8.709 |
| 145.881 + 0.237 × SL5 | 9.376 | 0.086 | 16.828 |
| Stature (cm) | |||
|---|---|---|---|
| Females | Mixed Sex Group | ||
| Variable | Mean Differences | Variable | Mean Differences |
| FSL1 | 0.95 | FSL1 | −1.23 |
| FSL2 | 0.48 | FSL3 | −0.77 |
| FSL3 | 0.42 | FSL5 | −0.53 |
| SL1 | 0.55 | FSL6 | 0.10 |
| SL2 | 0.34 | SL1 | −0.78 |
| SL3 | 0.76 | SL2 | −0.55 |
| SL3 | −0.69 | ||
| SL4 | −0.50 | ||
| SL5 | −0.35 | ||
Disclaimer/Publisher’s Note: The statements, opinions and data contained in all publications are solely those of the individual author(s) and contributor(s) and not of MDPI and/or the editor(s). MDPI and/or the editor(s) disclaim responsibility for any injury to people or property resulting from any ideas, methods, instructions or products referred to in the content. |
© 2025 by the authors. Licensee MDPI, Basel, Switzerland. This article is an open access article distributed under the terms and conditions of the Creative Commons Attribution (CC BY) license (https://creativecommons.org/licenses/by/4.0/).
Share and Cite
Švábová, P.; Falbová, D.; Kozáková, Z.; Chovancová, M.; Vorobeľová, L.; Beňuš, R. Analysis of Footstep/Stride Length from Gait Patterns of Dynamic Footprints as a Parameter for Biological Profiling—A Preliminary Study. Forensic Sci. 2025, 5, 29. https://doi.org/10.3390/forensicsci5030029
Švábová P, Falbová D, Kozáková Z, Chovancová M, Vorobeľová L, Beňuš R. Analysis of Footstep/Stride Length from Gait Patterns of Dynamic Footprints as a Parameter for Biological Profiling—A Preliminary Study. Forensic Sciences. 2025; 5(3):29. https://doi.org/10.3390/forensicsci5030029
Chicago/Turabian StyleŠvábová, Petra, Darina Falbová, Zuzana Kozáková, Mária Chovancová, Lenka Vorobeľová, and Radoslav Beňuš. 2025. "Analysis of Footstep/Stride Length from Gait Patterns of Dynamic Footprints as a Parameter for Biological Profiling—A Preliminary Study" Forensic Sciences 5, no. 3: 29. https://doi.org/10.3390/forensicsci5030029
APA StyleŠvábová, P., Falbová, D., Kozáková, Z., Chovancová, M., Vorobeľová, L., & Beňuš, R. (2025). Analysis of Footstep/Stride Length from Gait Patterns of Dynamic Footprints as a Parameter for Biological Profiling—A Preliminary Study. Forensic Sciences, 5(3), 29. https://doi.org/10.3390/forensicsci5030029