Article

Microstructure and Mechanical Performance of Cu and Gr/Cu Composites: Experimental and Ab Initio Insights

by
Galiia Korznikova
1,
Gulnara Khalikova
1,
Igor Kosarev
2,3,
Wei Wei
4,5,
Alexander Semenov
3,6,* and
Elena Korznikova
1,2,7
1
Institute for Metals Superplasticity Problems, Russian Academy of Sciences (RAS), 450001 Ufa, Russia
2
Research Laboratory “Metals and Alloys under Extreme Impacts”, Ufa University of Science and Technology, 450076 Ufa, Russia
3
Institute of Molecule and Crystal Physics, Ufa Federal Research Center of Russian Academy of Sciences, 450075 Ufa, Russia
4
School of Materials Science and Engineering, Changzhou University, Changzhou 213164, China
5
Jiangsu Key Laboratory of Materials Surface Science and Technology, Changzhou University, Changzhou 213164, China
6
Polytechnic Institute (Branch) in Mirny, North-Eastern Federal University, 677000 Mirny, Russia
7
Institute of Physics and Mathematics, Peter the Great St. Petersburg Polytechnic University, 29 Polytechnicheskaya Street, 195251 St. Petersburg, Russia
*
Author to whom correspondence should be addressed.
Solids 2025, 6(4), 57; https://doi.org/10.3390/solids6040057
Submission received: 15 June 2025 / Revised: 28 August 2025 / Accepted: 28 September 2025 / Published: 8 October 2025

Abstract

This study investigates the microstructure and mechanical properties of copper (Cu) and graphene/Cu (Gr/Cu) composites produced via high-pressure torsion (HPT) under 5 GPa at room temperature. Microstructural analysis revealed significant grain refinement, with average grain sizes of 0.39 μm for pure Cu and 0.35 μm for Gr/Cu composite. The Gr/Cu composite exhibited slightly higher microstrains and effective stacking fault energy (SFE). Tensile tests showed ultimate tensile strengths of 689 MPa (pure Cu) and 674 MPa (Gr/Cu), with the latter demonstrating improved ductility (~10% elongation). Ab initio calculations confirmed a 27% increase in SFE for Gr/Cu, aligning with experimental results. These findings highlight the potential of Gr/Cu composites for applications requiring high strength and efficient heat dissipation.

1. Introduction

Technological advances in modern electronics are leading to the miniaturization of high-performance electronic devices to improve their usability. Such smart devices require efficient heat dissipation and high electrical and thermal conductivity to prevent premature failures, which is difficult due to the limitations associated with compact designs. When developing materials with high energy efficiency, high conductivity and high mechanical strength are simultaneously required. Among all metals, copper has the second highest electrical and thermal conductivity after silver, making it an ideal candidate for these applications. However, the low strength and hardness of pure copper limit its practical use in electronics.
The strength of copper is sensitive to its microstructure and chemical composition, and the most well-known approaches to strengthening metals are alloying, grain refinement, and deformation treatment. However, all traditional strengthening methods face a fundamental trade-off: increasing strength results in decreasing conductivity. For example, alloying pure copper can increase the yield strength by two to three times, but the electrical conductivity of copper alloys is only half that of pure copper or even less [1]. Strengthening by grain refinement and deformation treatment is associated with limiting the proliferation and movement of lattice dislocations, which hinders plastic deformation. On the other hand, the same defects that block the movement of dislocations also increase the scattering of conductive electrons. Consequently, all attempts to increase strength by increasing the density of defects lead to a decrease in electrical conductivity [2,3].
To overcome this fundamental limitation, it is necessary to form a suitable microstructure in which the motion of dislocations is effectively blocked and the scattering of conductive electrons is minimized. The use of twin boundaries (TBs) is a promising solution to this problem. Twin boundaries are a special type of coherent boundary that includes atomic planes on both sides arranged in a mirror-symmetric manner. Twin boundaries are capable of blocking the motion of dislocations like conventional high-angle grain boundaries and increase the mechanical strength of the material, but their electrical resistance, due to high coherence, is approximately an order of magnitude lower than that of conventional high-angle grain boundaries [3,4].
High-strength nanotwinned copper foil samples have been successfully fabricated using pulsed electroplating [3], with the mechanical properties controlled by the nanotwin thickness. The strength increases with decreasing twin thickness [5,6], similar to the Hall–Petch law for grain boundary strengthening of nanocrystalline metals [7]. The yield strength reaches a maximum value of about 1000 MPa at a nanotwin thickness of 15 nm, but it begins to weaken at smaller values. However, this approach has a significant limitation, since the thickness of high-strength electroplated foils does not exceed 30 μm, which does not allow the fabrication of bulk components required for most engineering applications. While nanotwinned Cu foils prove the concept of defect-engineering for strength + conductivity, their size limitations motivate bulk routes—particularly high-pressure torsion HPT combined with 2D reinforcements—that can generate analogous defect structures [8].
During HPT processing, a disc-shaped sample is subjected to torsional-shear deformation under high hydrostatic pressure, which allows the metal to be deformed at room temperature to significant strain. The advantages of HPT include the absence of introduced contaminants and the ability to vary the deformation conditions (pressure, strain rate, and number of rotations). Previous studies have shown that HPT processing consolidates mechanically mixed Cu-Gr powders under high pressure and severe shear deformation, resulting in the formation of a nanocrystalline Cu matrix with uniformly distributed graphene sheets. This process improves interfacial bonding, resulting in exceptional hardness (up to 2.67 GPa, which is 118% higher compared to pure copper) and Young’s modulus of ~102 GPa, while maintaining high electrical conductivity (~87% IACS) [9]. Strengthening mechanisms include grain refinement, dislocation pinning by graphene, and improved load transfer at the Cu-Gr interface. Despite the occurrence of defects in graphene during processing, HPT provides a uniform microstructure and excellent performance, making Gr/Cu composites suitable for applications in electronics, heat exchangers, and structural components [10,11,12].
Thus, the aim of this work was to develop an HPT technology for the fabrication of a graphene-reinforced copper matrix composite by pressing thin copper foils coated with a graphene monolayer. This approach combines the advantages of bulk processing with the potential to retain decent conductivity; the present work concentrates on microstructure evolution, hardness, and tensile behavior. This study addresses two issues: (i) how does graphene influence stacking-fault energy and, consequently, deformation mechanisms during HPT, and (ii) how do these mechanisms translate into hardness and tensile performance? For comparison, consolidated samples of pure copper foil without a graphene coating were studied under identical conditions. Since direct measurement of the stacking fault energy is impossible, ab initio modeling was used to estimate this parameter, which determines the microstructure evolution scenarios in the studied materials.

2. Materials and Methods

2.1. Experimental Methods

The copper electroplated foil layers were coated on both sides with a monolayer of graphene and subjected to HPT processing. Graphene-coated foils were obtained by the chemical vapor deposition processing in the mixture of methane, hydrogen, and argon at 800–1000 °C. The thickness of the foils was 20 µm. Round-shaped plates with a diameter of 10 mm were cut by spark erosion from the foils. Finally, 18 round plates were HPT-processed at room temperature, at a pressure of 5 GPa, and with 5 turns, with a rotation speed of 2 rotations per minute. Prior research [8] indicates that a 5 GPa level of pressure ensures sufficient hydrostatic stress to prevent cracking while enabling grain refinement via dislocation accumulation and dynamic recrystallization. The same can be applied to the number of turns, where 5 turns of the anvil correspond to achieving a cumulative strain of ε ≈ 5–6, which is sufficient for homogenizing microstructure and dispersing graphene.
The shear strain for HPT processing is calculated as
γ = (2πnR)/h,
where γ is the shear strain, n is the number of turns (5 in our case), R is the radial distance from center (3 mm measurement location), and h is the sample thickness (≈0.1 mm after processing). The equivalent strain is then calculated using the von Mises relationship:
ε eq   =   γ / 3 =   ln [ ( 2 π n R ) / ( h 3 )
For our experimental conditions, Equation (2) gives εeq = ln[(2π × 5 × 3)/(0.1 × 3 )] = 94.2/0.173 ≈ 6.3.
High-quality disk-shaped samples after processing by the HPT method had a thickness of about 0.1 mm and did not contain cracks, pores, or other defects. Stacks of copper foils without graphene coating were processed under the same conditions.
For electron backscatter diffraction (EBSD) measurements, disc-shaped HPT samples were sectioned perpendicular to the torsion axis and mounted in conductive Bakelite. The samples were mechanically ground using SiC papers up to 4000 grit and then polished with diamond suspensions down to 0.05 μm.
Microstructural analysis was performed at a site of 3 mm away from the center of specimens using a Tescan Mira 3LMH scanning electron microscope (TESCAN, Brno, Czech Republic) with backscattered electron detectors at 20 kV accelerating voltage. EBSD analysis was carried out on the same scanning electron microscope using the OXFORD HKL Channel 5 microanalysis system. Due to the limited angular accuracy of EBSD, boundaries with misorientations below 2° were excluded from consideration. A 15° threshold was applied to differentiate low-angle grain boundaries (LAGBs) and high-angle grain boundaries (HAGBs). LAGBs and HAGBs on EBSD maps are depicted as red and black lines, respectively, and TBs are depicted as green lines. To improve the reliability of the EBSD data, small grains comprising five or less pixels were automatically removed from the maps. Transmission electron microscopy studies were performed on the JEM 2100 Plus microscope at an accelerating voltage of 200 kV. Selected area diffraction pattern was taken from the area 0.28 μm2. Thin foils for TEM analysis were cut from the outer region (~3 mm from the sample center) and mechanically thinned to ~100 μm. Final thinning to electron transparency was performed by twin-jet electro-polishing using a solution of 30% nitric acid in methanol. The polishing endpoint was detected automatically via short-circuit current drop.
X-ray diffraction (XRD) patterns were recorded over a scanning range of 20–90° (2θ), with a step size of 0.02° and scanning rate of 2°/min, using a high-resolution Rigaku Ultima IV diffractometer equipped with Cu Kα radiation (λ = 0.15405 nm).
The microhardness was measured by the Vickers method, using the instrument AFFRI DM8A “Micromet 5101” (Jinan, China), with a diamond indenter (a pyramid with an apex angle of 136°), under a load of 1 N (100 g) and with a load holding time of 10 s. Measurements were taken along the radius, and the distance between rows was 300 µm, with 4 measurements in each row.
Tensile tests were carried out using specially elaborated locks mounted in an CMT-5 (Liangong Testing Technology Co., Ltd., Jinan, China) tensile testing machine [11]. The gauge length and width were 3 and 1 mm, respectively, and corresponded to a portion of the disk sample located approximately 3 mm from its edge. The tests were carried out at room temperature, at a tensile speed of 1 mm/min until fracture of the sample.

2.2. Theoretical Methods

Ab initio calculations were performed using spin-polarized density functional theory (DFT) with Quantum Espresso software (Version 7.2) [13,14], employing ultrasoft pseudopotentials [15] cu_pbe_v1.2.uspp.F.UPF for copper and c_pbe_v1.2.uspp.F.UPF [16] for carbon from the GBRV-1.2 library of the Standard Solid State PPs precision collection [17,18]. The copper unit cell construction utilized a two-atom translational cell with perpendicular vectors in the XY plane, oriented such that the (111) plane, the primary slip plane in FCC crystals, corresponded to the calculation plane (secondary slip planes were not considered). The translational vectors of the copper unit cell are defined as a1 = a (√2/2, 0, 0), a2 = a (0, √6/2, 0), a3 = a (√2/4, √6/12, √3/3), where a is the lattice parameter, with atomic coordinates b1 = 0 and b2 = (a1 + a2)/2 (Figure 1c). For graphene calculations, an orthogonal four-carbon-atom cell was employed with translation vectors c1 = τ (2cos(30°), 0, 0) and c2 = τ (0, 3, 0), where τ represents the equilibrium bond length, and carbon atomic coordinates are d1 = τ (cos(30°), 0, 0), d2 = τ (0, sin(30°), 0), d3 = τ (0, sin(30°) + 1, 0), and d4 = τ (cos(30°), 2, 0) (Figure 1d). Stacking fault energy calculations employed a 1 × 4 × 4 supercell of copper translational units where stacking faults were created by removing specific copper atoms, and graphene was embedded into the fault plane without altering cell dimensions. Due to the limited size of the calculation cell, the defect under consideration is only similar to a stacking fault and is a rather linear defect, but for convenience, we will continue to call the defect under consideration a stacking fault. All calculations incorporated periodic boundary conditions with electronic relaxation convergence of 10−6 a.u. and ionic relaxation convergence of 10−5 a.u., using a 10 × 6 × 6 k-point mesh for Brillouin zone sampling and a kinetic energy cutoff of 540 eV. Since the lattice parameter with embedded graphene remains almost unchanged, subsequent theoretical calculations for stacking fault analysis employed fixed cell volume and shape with relaxation limited to atomic positions only.
As shown below, the lattice parameter with embedded graphene remains almost unchanged. Therefore, in further theoretical calculations for the analysis of the stacking fault, the volume and shape of the cell are fixed, and only the positions of the atoms are relaxed.
Graphene was embedded in a stacking fault. The calculation cells for the cases of stacking fault in copper and graphene embedded in a stacking fault in copper are shown in Figure 1.
To calculate the stacking fault energy in pure Cu, the following formula is used,
E ~ C u _ S F = E C u _ S F n C u E C u L x L y ,
where ECu_SF is the energy of pure Cu with a stacking fault; nCu and ECu are the number of copper atoms and the energy of the equilibrium Cu structure per atom, respectively; and LxLy is the area of the stacking fault. The stacking fault energy with the addition of graphene is calculated as follows:
E ~ C u G r _ S F = E C u G r _ S F n C u E C u n C E G r L x L y
where ECuGr_SF is the energy of Gr/Cu composite with a stacking fault; and nC and EGr are the number of carbon atoms and the energy of the ideal graphene structure per atom, respectively.

3. Results

3.1. Microstructure Prior to HPT

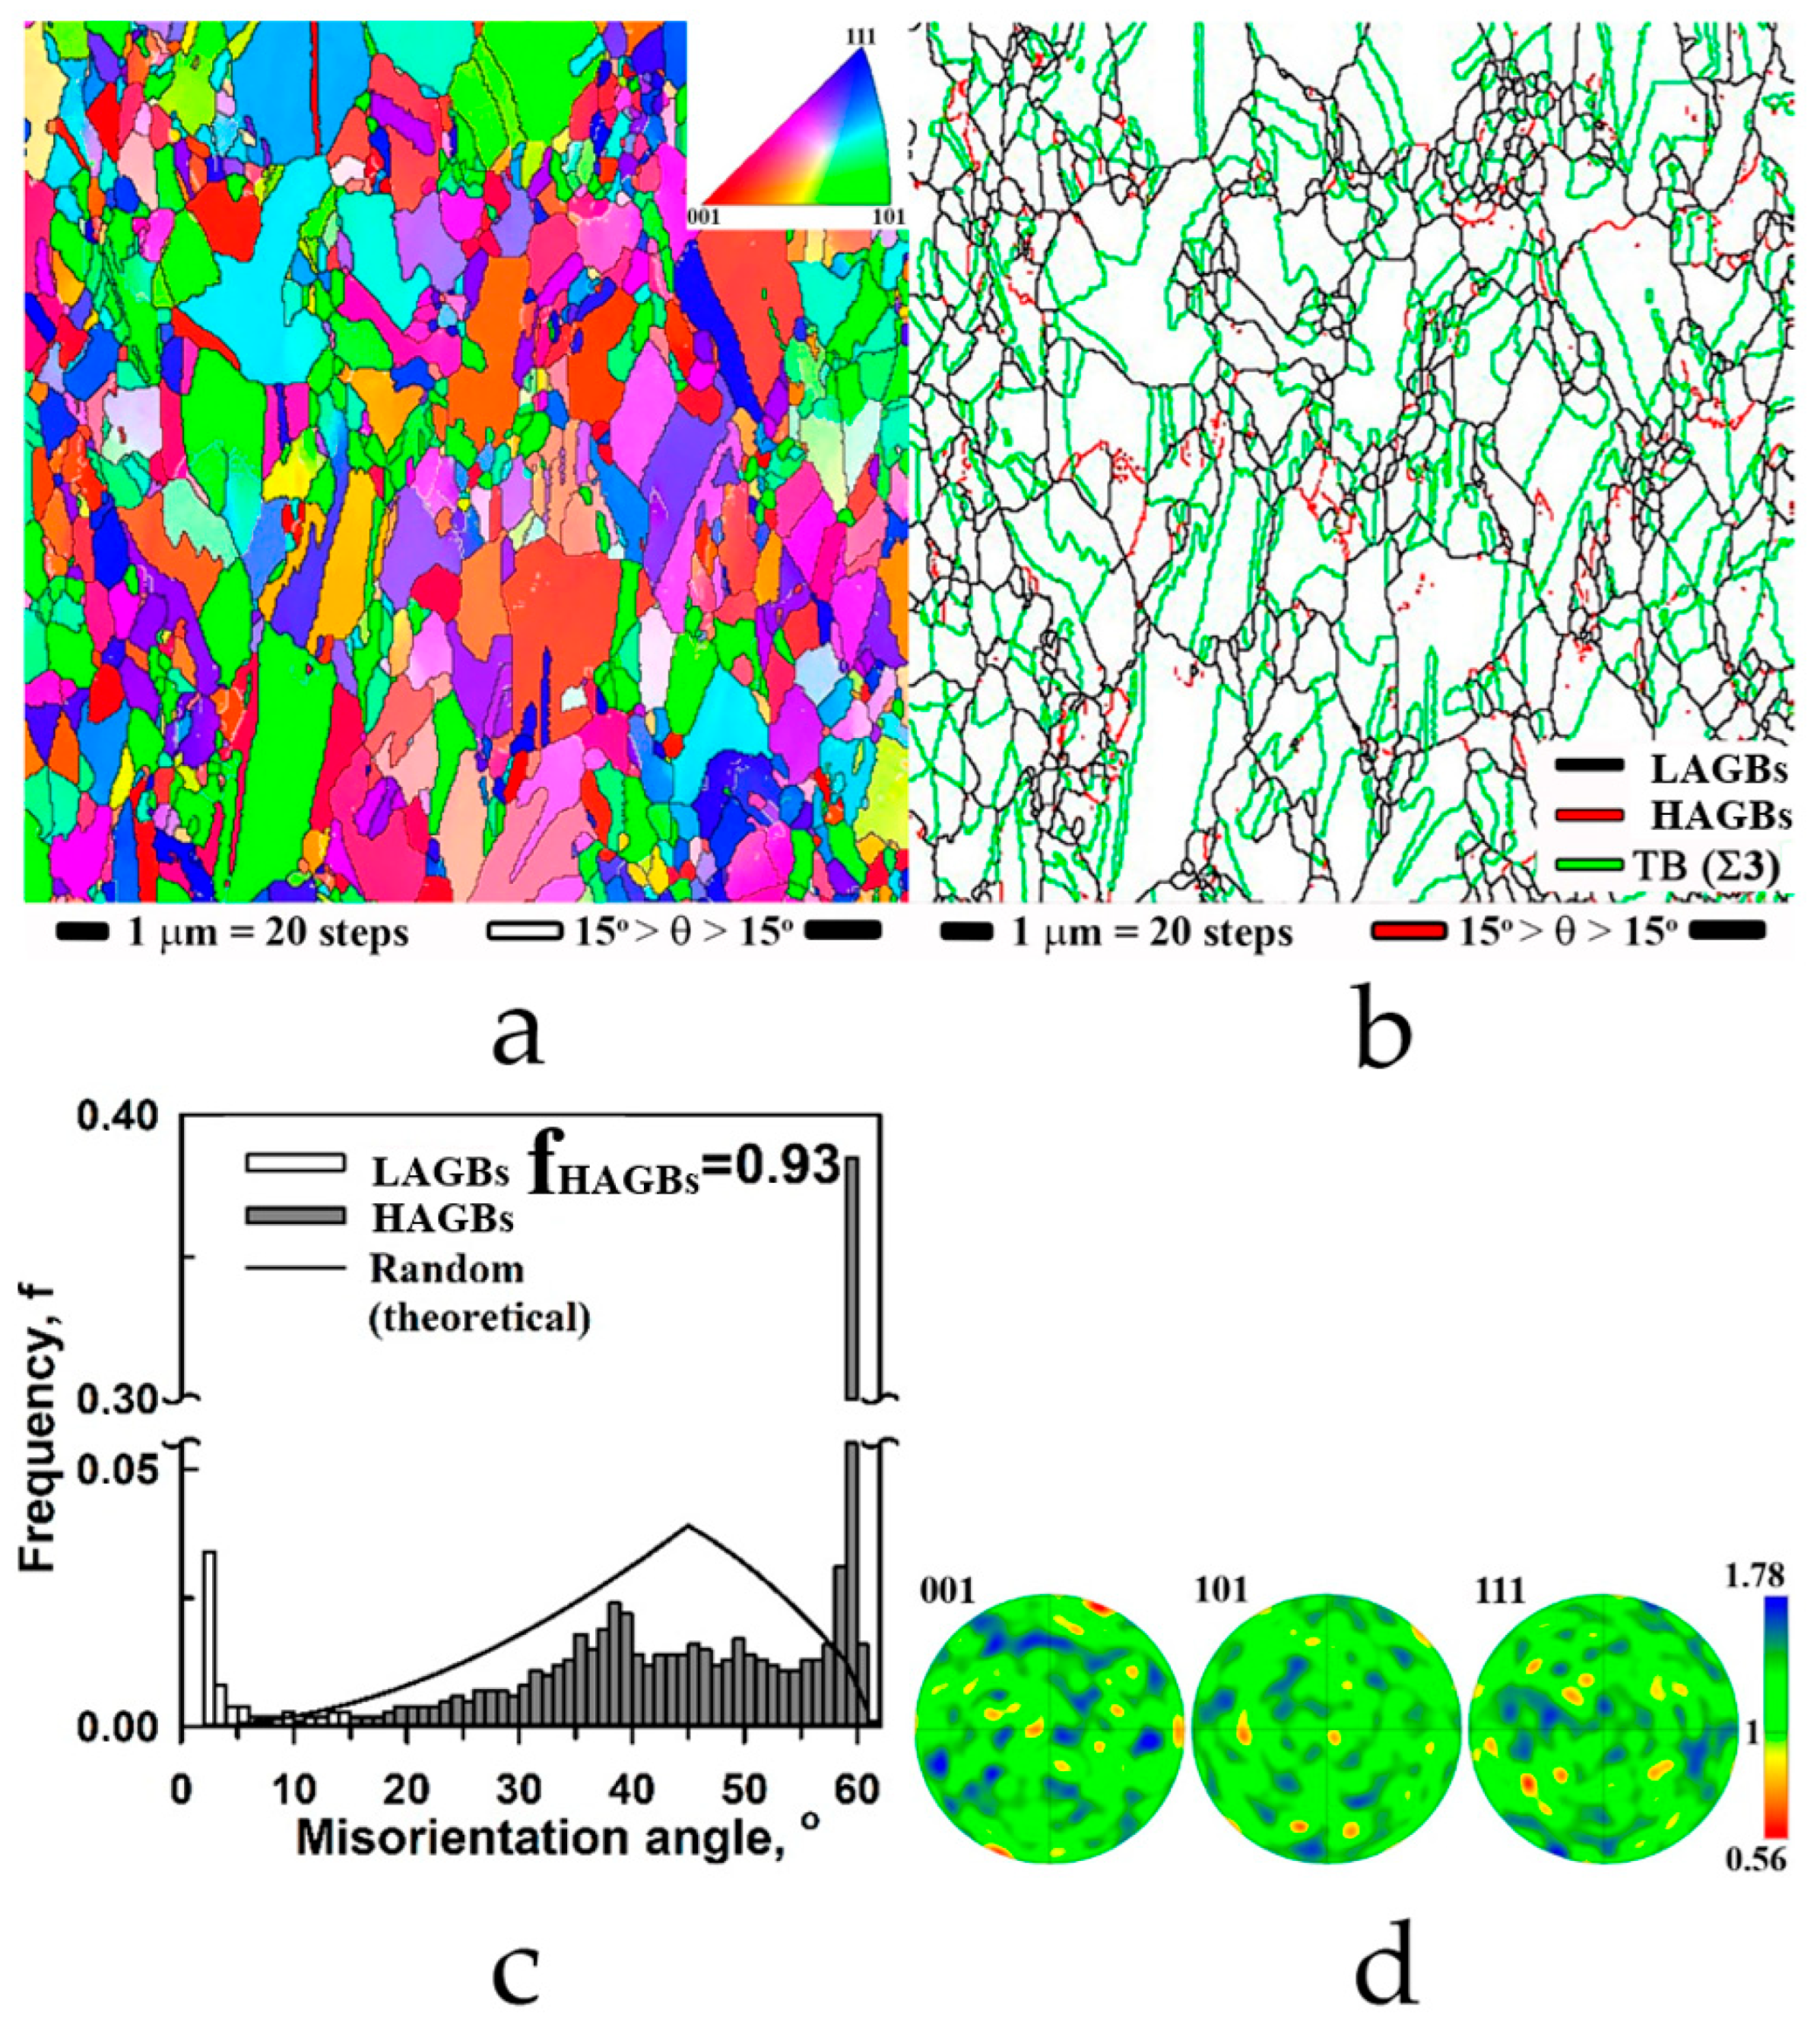
Typical microstructural features of the initial Cu foil coated with a graphene monolayer are summarized in Figure 2. The EBSD inverse-pole figure (IPF) map for the normal direction is shown in Figure 2a. The IPF map indicates that the initial microstructure was reasonably inhomogeneous. The mean HAGB intercept was 0.9 µm, with an aspect ratio of 1.03. Most of the grain boundaries were high-angle (HAGB fraction was 93%). Twin boundaries dominated the grain boundary map (Figure 2b). The distribution of misorientation angles differs from random, which is indicated by a solid black line in Figure 2c, and the fraction of Σ3 twin boundaries (TB) amounts 38% (Figure 2c). The material had a weak nearly cubic texture (Figure 2d). A similar set of microstructure characteristics was obtained for Cu foil without coating, suggesting that the graphene monolayer on the surface does not affect bulk microstructural features.

3.2. Characterizations of Composites Processed by HPT

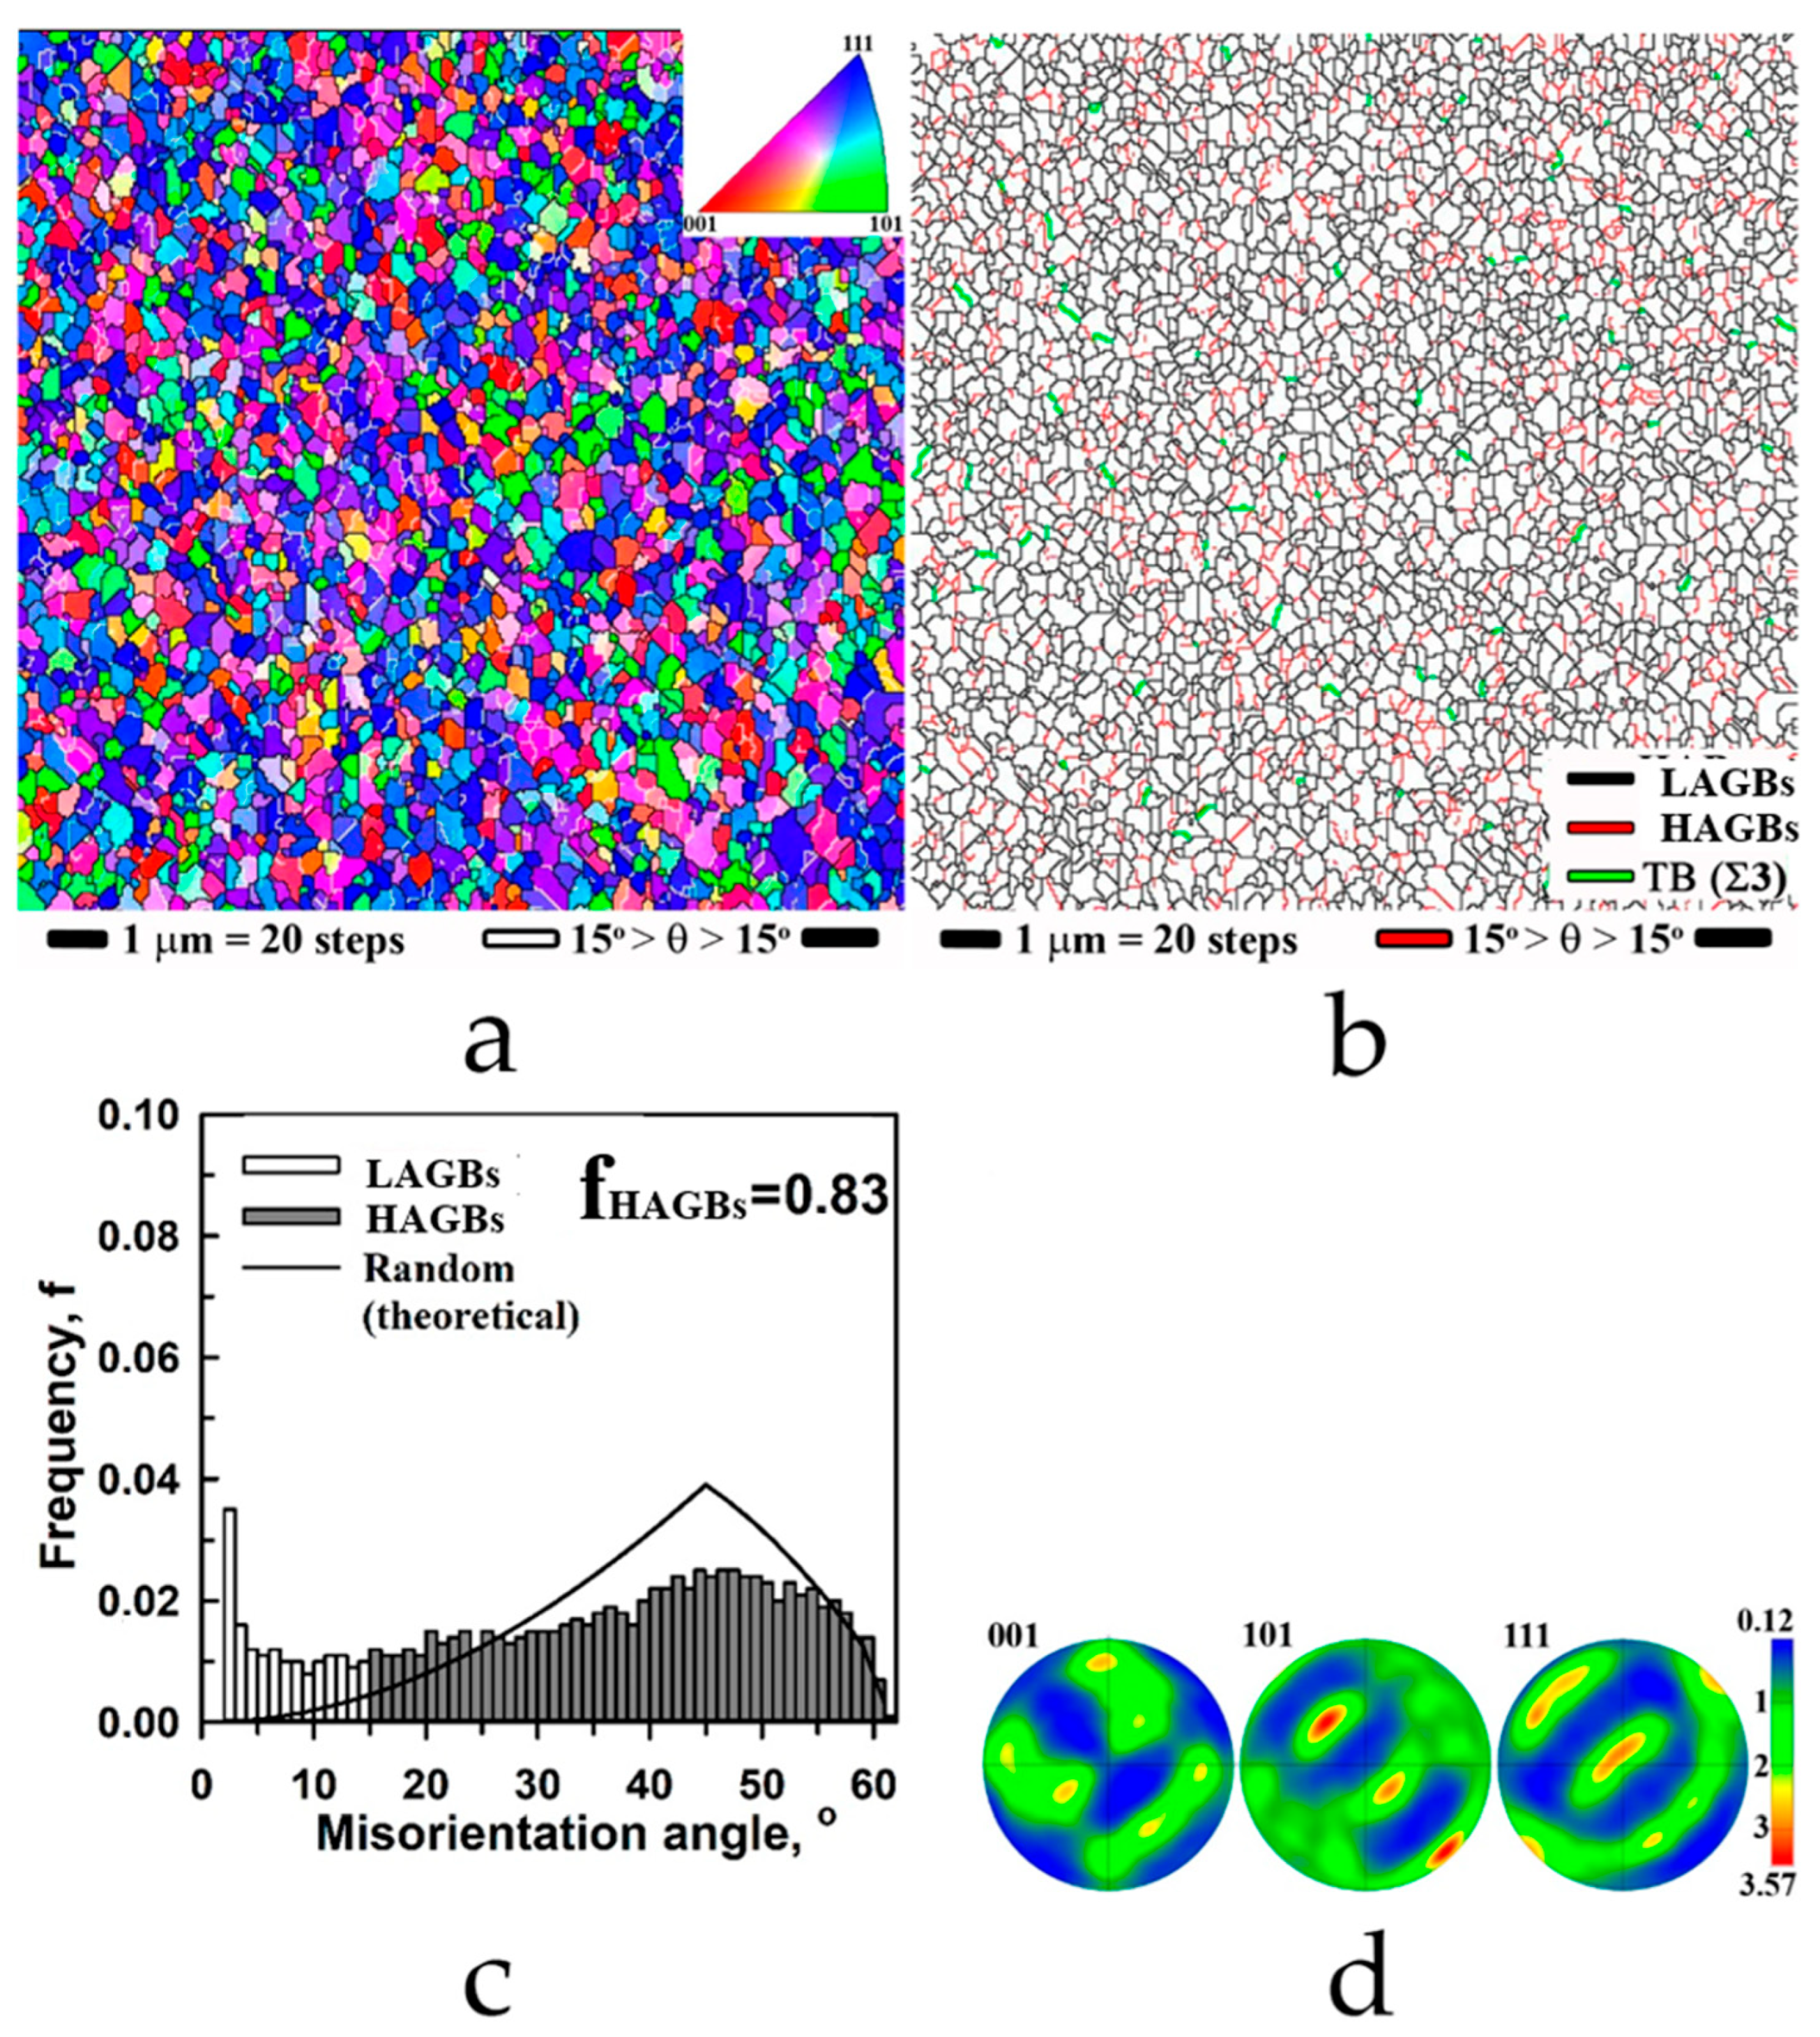
Some microstructural features were noted in the HPT-processed samples. These included grain size, subgrain boundaries, twins, and texture. Figure 3 presents the results of EBSD analysis of Gr/Cu composite.
The microstructure of the Gr/Cu composite after HPT processing became homogeneous, and the average grain size approximated 0.35 µm, with an aspect ratio 1.77 (Figure 3a,b). The fraction of HAGBs decreased to 0.83, and twin boundaries almost disappeared (Figure 3c). As can be seen in Figure 3d, a typical shear texture with the presence of all shear components is formed after five turns during HPT. It is known that HPT is essentially a shear-based process [8,19]. The texture is noticeably stronger and different from that in the original foil. This is a typical case for FCC materials with a middle value of stacking fault energy (~78 mJ/m2 in pure Cu), since it has been established that, for most of these materials, the texture is unstable and heterogeneous along the radius of the disk in the early stages of shear strain, but it becomes more uniform with increasing strain to about five turns of the anvils due to severe grain refinement and activation of grain-boundary sliding [19].
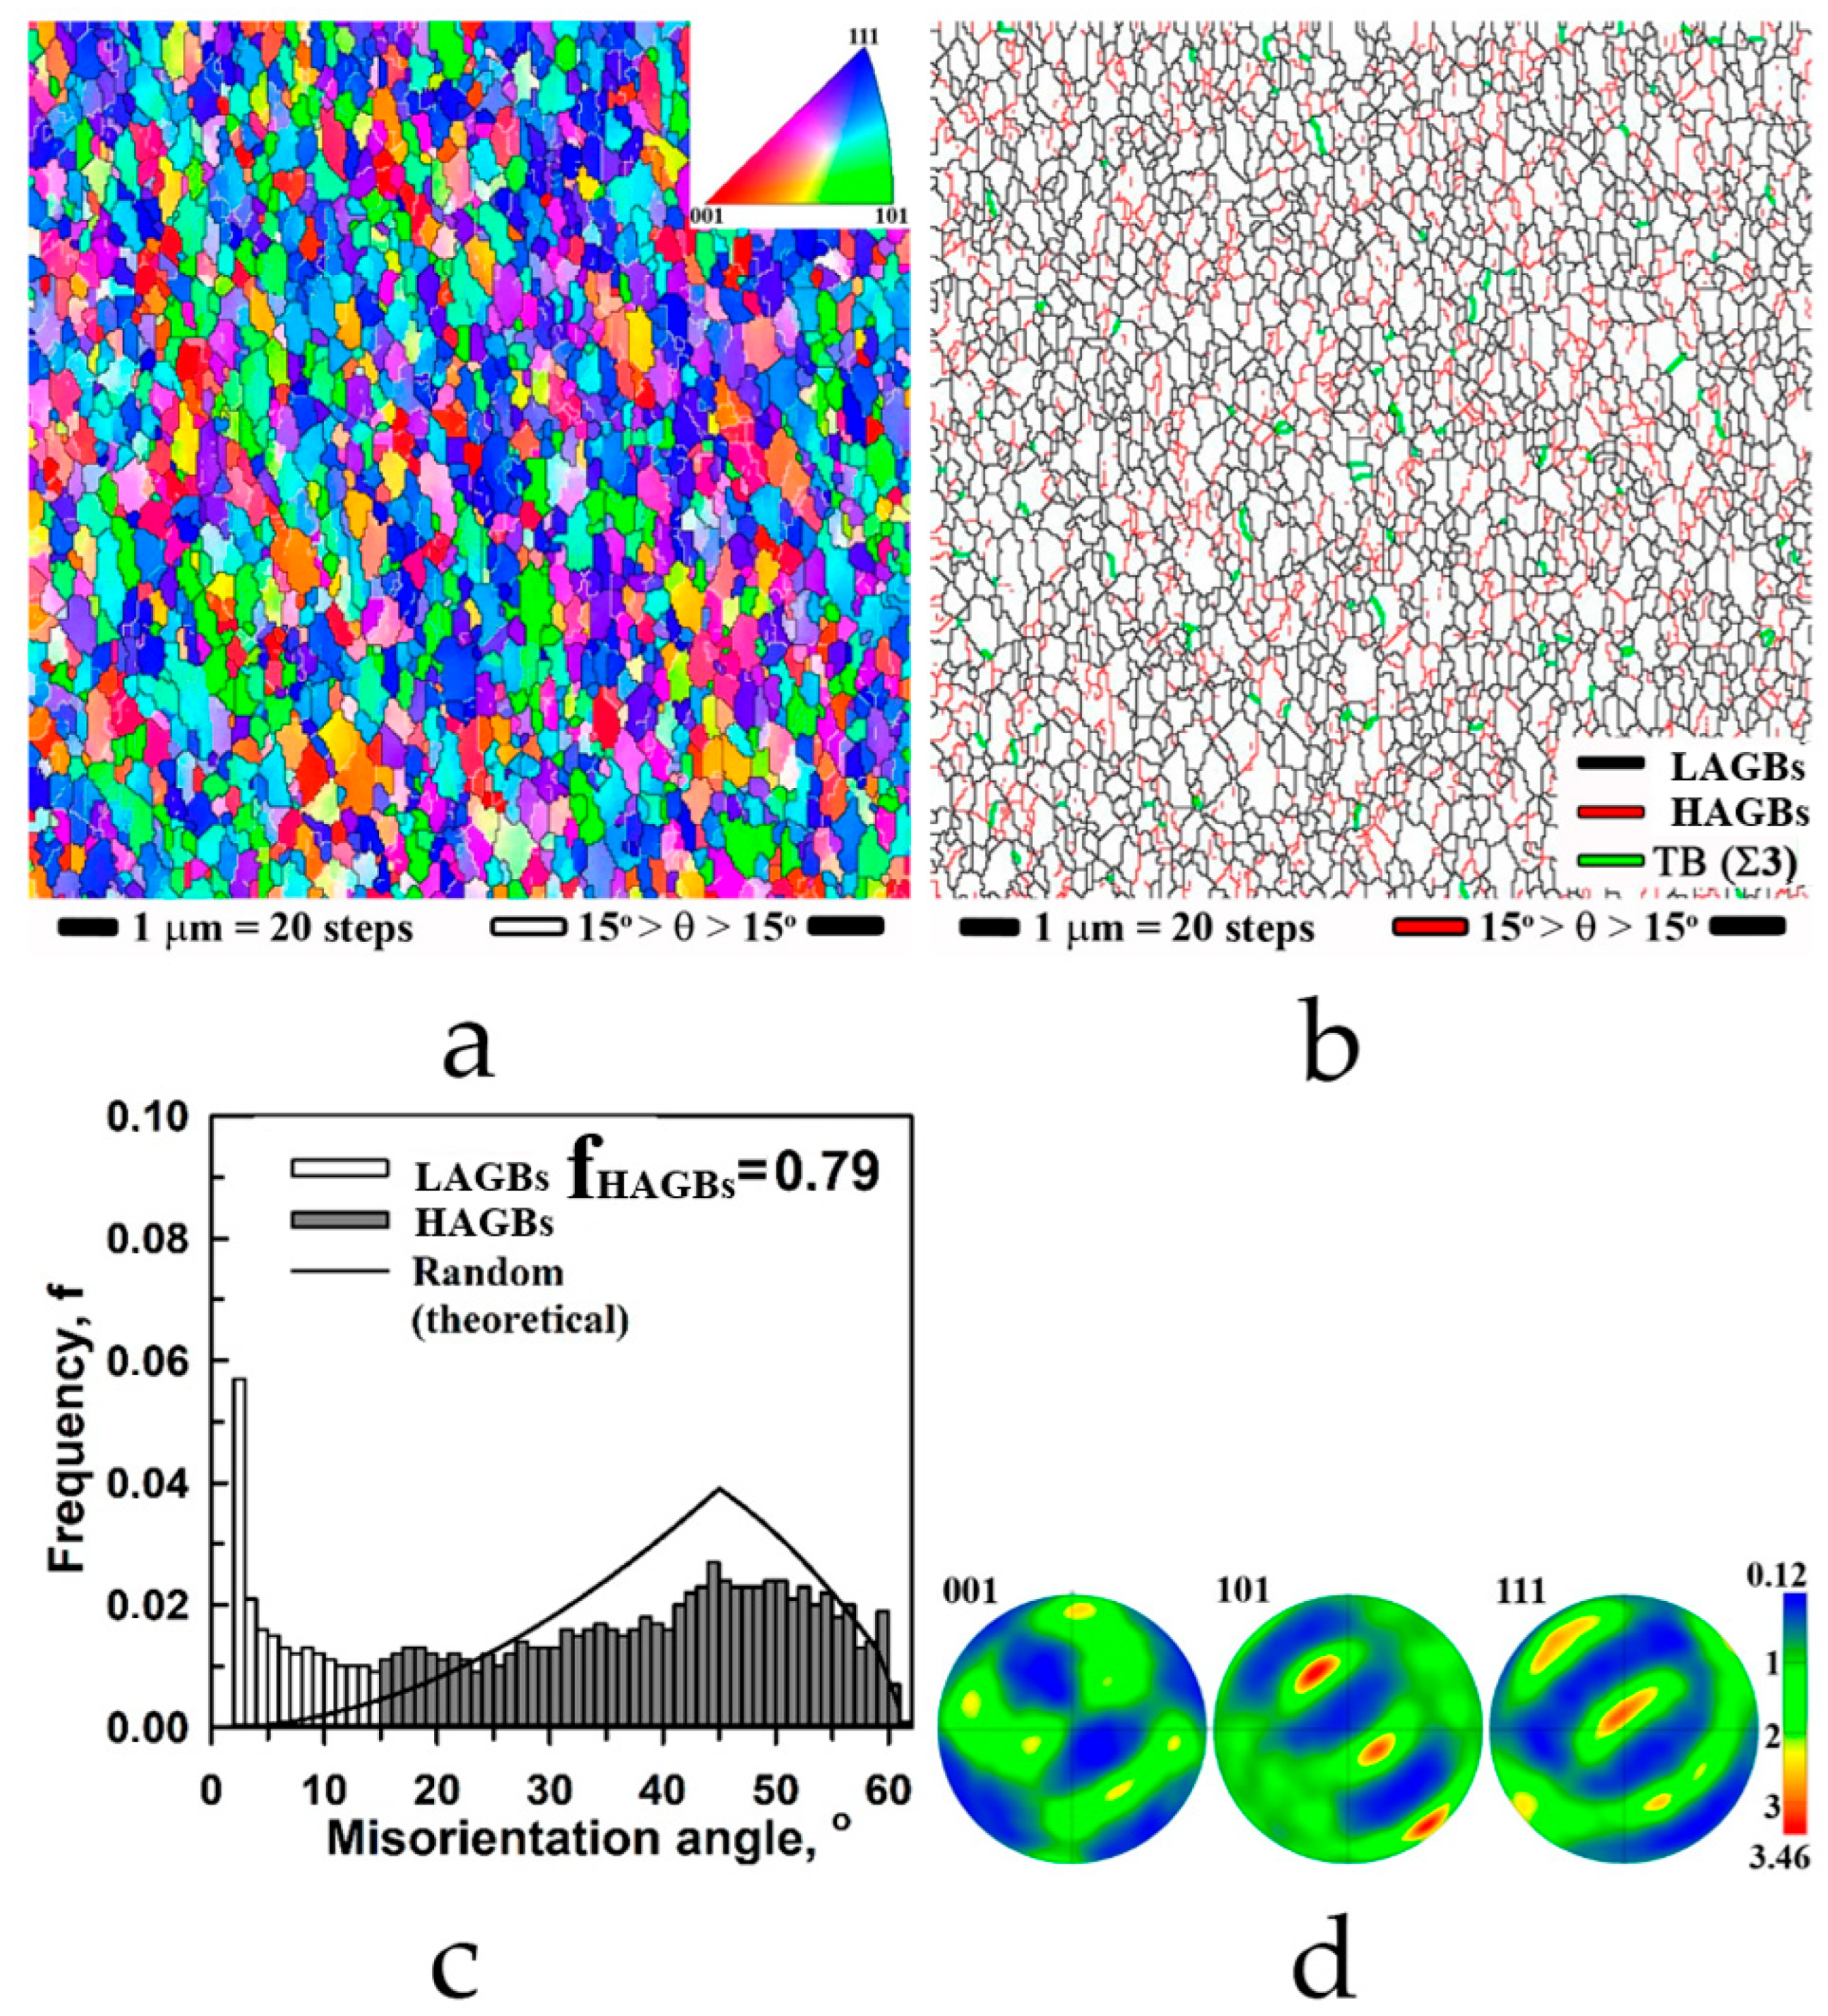
Similar results of EBSD analysis were obtained for HPT-processed Cu foils without graphene coating (Figure 4). The average grain size was above 0.39 µm, with an aspect ratio of more than 1.98 (Figure 4a,b). The fraction of HAGB (Figure 4c) and the texture (Figure 4d) were similar to that in Gr/Cu composite. The grain size of the Gr/Cu composite was observed to be slightly smaller than that of the pure Cu. In both samples, severe plastic deformation during HPT processing caused grain transformation via the activity of different slip systems and twinning, leading to refinement and elongation of the grains, along with the formation of intragranular substructures that increase the fraction of LAGB.
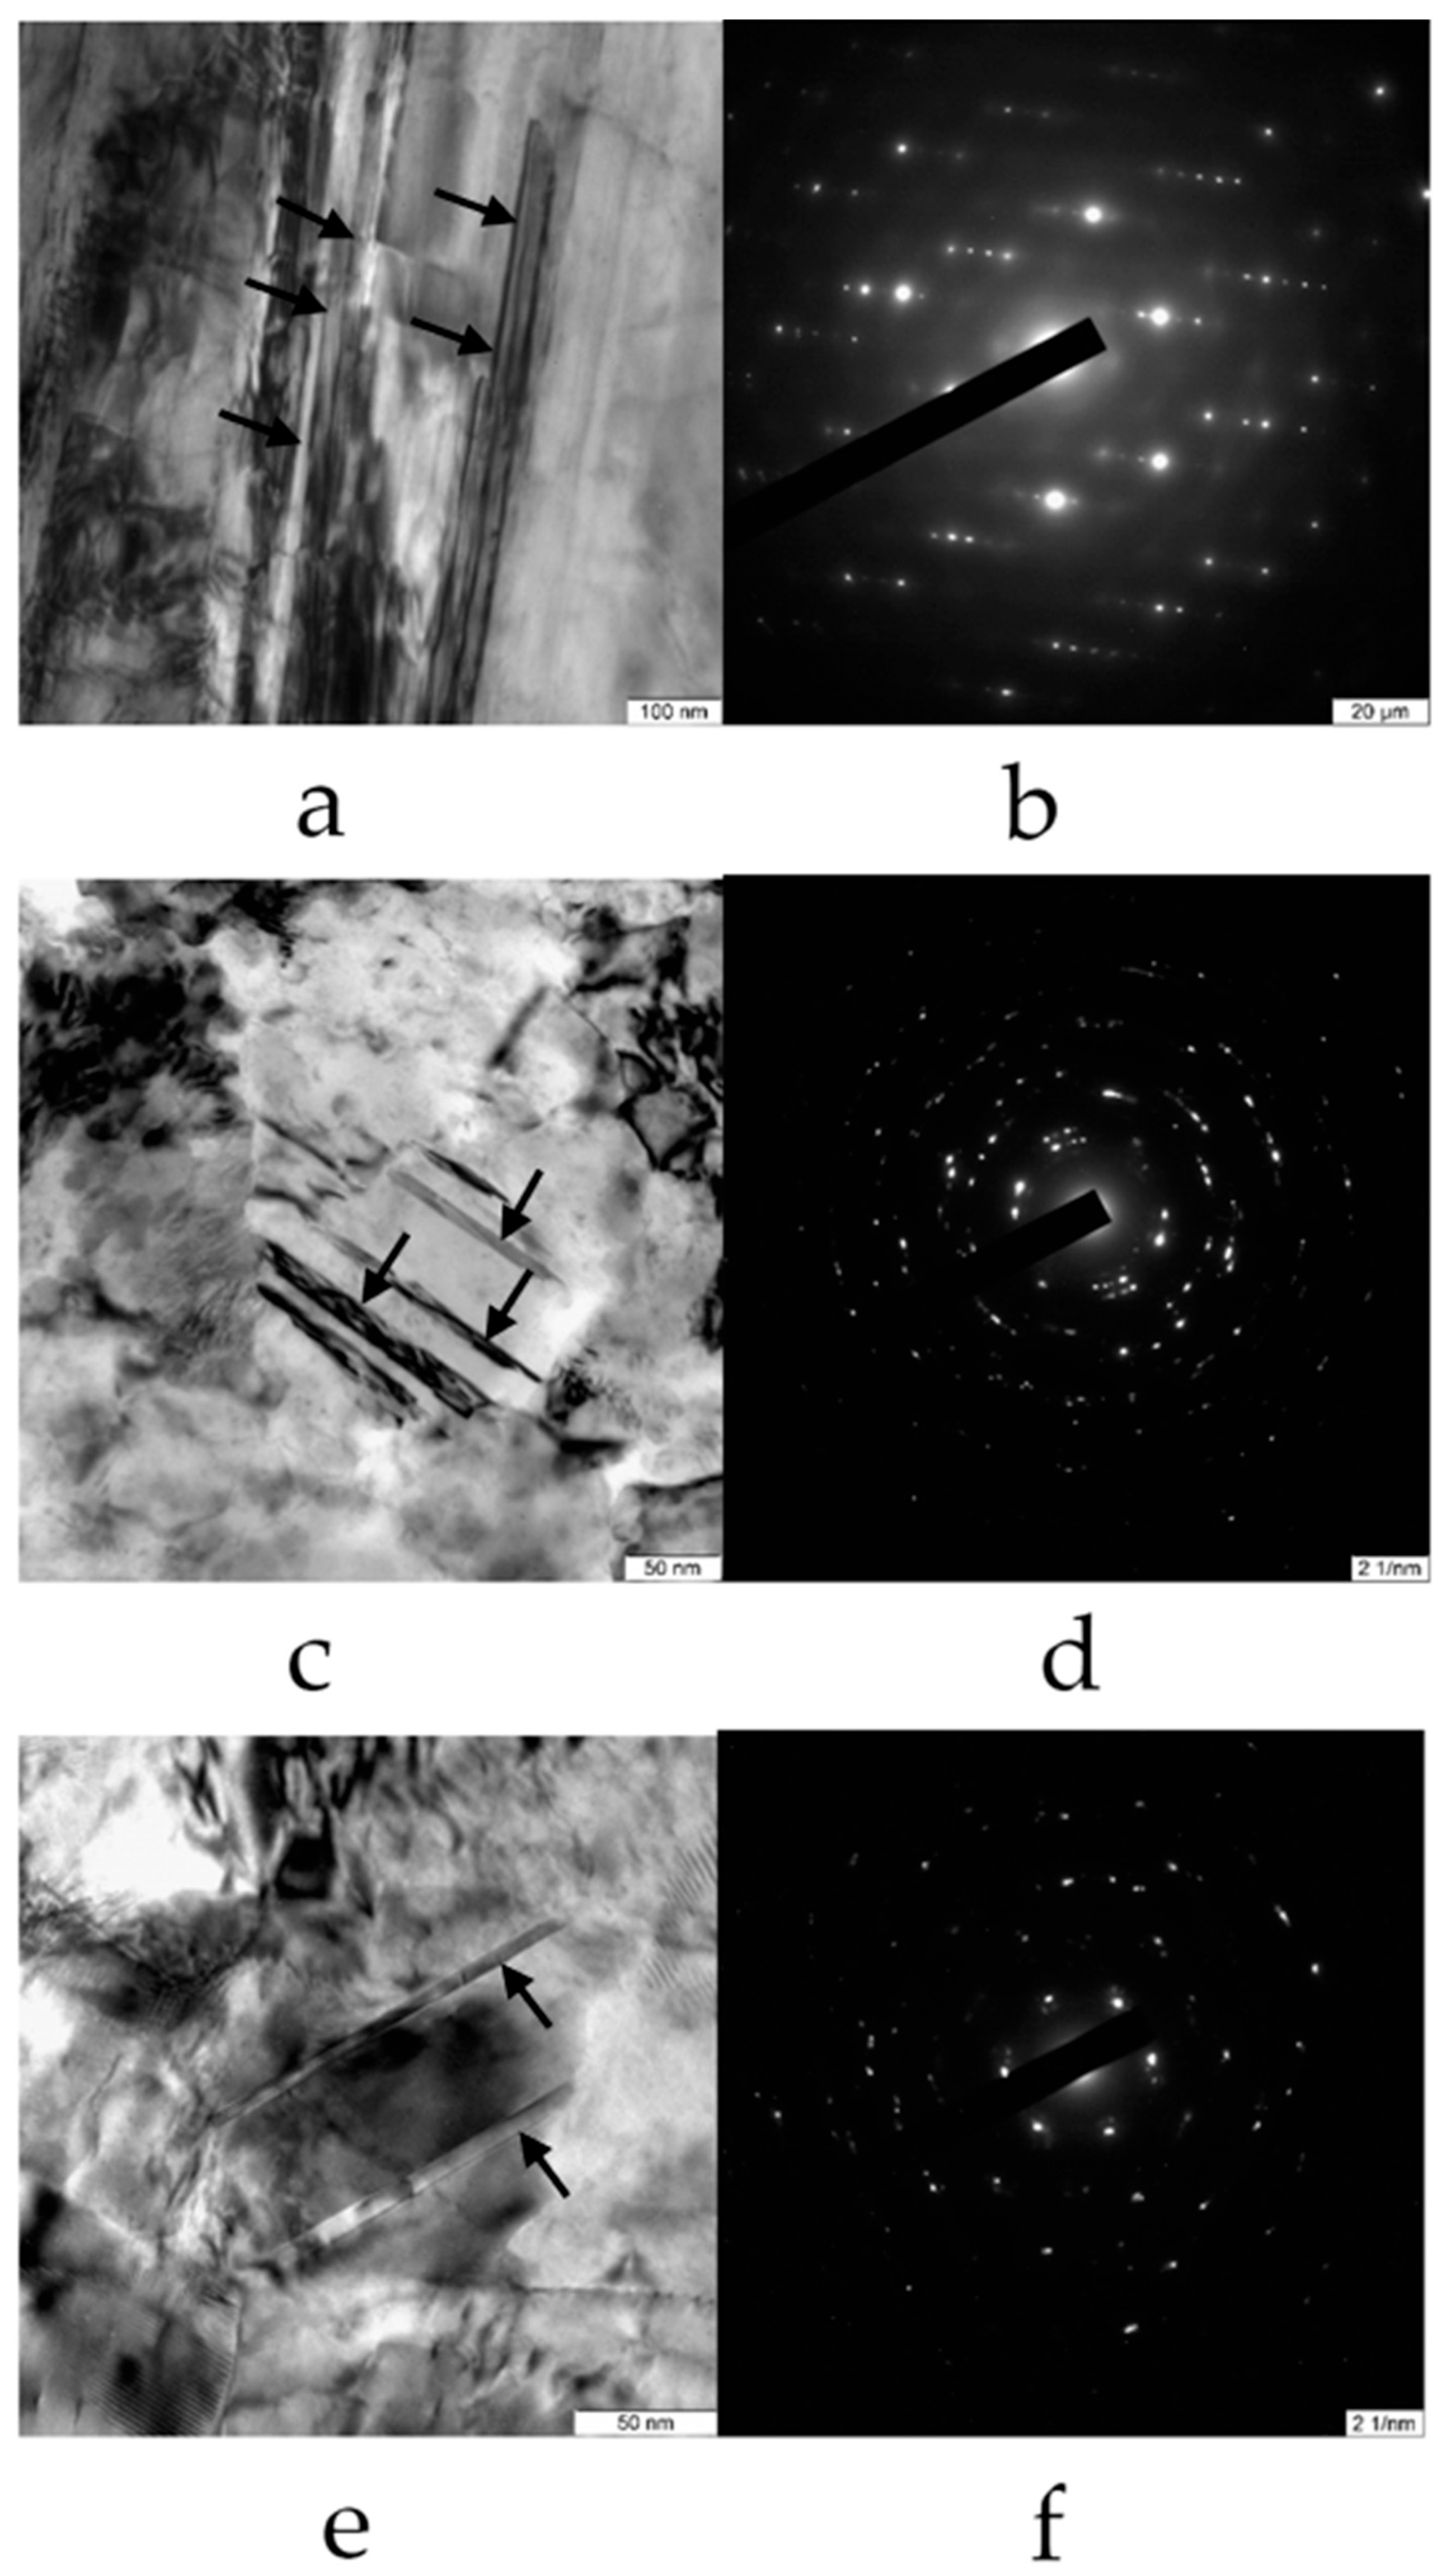
It should be noted that the fraction of Σ3 twin boundaries decreased drastically after HPT processing. This effect can be caused by strain-induced deviation from the exact twin/matrix relationship and thus transformation of the twin boundaries into random HAGBs during deformation However, it is necessary to consider that the scanning step during EBSD analysis was 50 nm, and nanotwins with a thickness of about 10–20 nm cannot be detected reliably in the samples. Therefore, a more detailed study of the foil was carried out by means of an transmission electron microscope at high magnifications that allowed us to reveal many 10–20 nm thick nanotwins in Cu foils (Figure 5a,b), similar to those addressed in [20], and minor amounts of nanotwins in HPT-processed composites both with graphene (Figure 5c,d) and without graphene (Figure 5e,f). Nanotwins in Figure 5 are indicated by arrows. Thus, electron microscopy studies, both SEM and TEM, indicate a significant decrease in the fraction of twin boundaries and reveal that sub-boundaries were developed in the samples during HPT processing.
Moreover, TEM observations of the HPT-processed composites (Figure 5c–f) suggested the occurrence of discontinuous recrystallization. In some regions, the microstructure was dominated by high dislocation density and sharp contrast variations, indicating significant elastic strains that are often found in materials subjected to severe plastic deformation [8]. In other areas (Figure 5c,e), dislocation-free, recrystallized grains exhibiting reasonably homogeneous TEM contrast and containing twins were found.
X-ray diffraction (XRD) line-broadening techniques allowed us to quantify some structural characteristics and to confirm significant elastic strains after HPT. Table 1 presents data on the lattice parameter, coherent scattering regions, and microstrains of HPT-processed samples.
The presence of graphene increases microstrains and the lattice parameter, and it decreases coherent scattering regions in HPT-processed Cu. In accordance with the theory of dislocations, there is a proportionality between stacking fault energy (SFE) and lattice strain [21] that was used to effectively evaluate SFE. Compared with the pure Cu nanocomposite, the Gr/Cu composite has a higher effective SFE. It is well known that increasing the stacking fault energy promotes the accommodation of plastic deformation via the activation of sufficient dislocation glide systems in materials that are characterized by softening behavior during high strain due to the rapid annihilation of dislocations, their rearrangement to subgrains with LAGBs, and then their transformation to HAGBs to produce ultrafine grains [19]. By contrast, a decrease in effective SFE could promote deformation via mechanical twinning.
Thus, the results of our microstructure analysis reveal that the HPT of electroplated copper foils with graphene coating, as well as without graphene, provides significant grain refinement, but the desirable nanotwinned samples were not achieved. The decrease in Σ3 twin boundaries may be due to the limited contribution of twinning and shear banding to microstructure evolution in the present work due to the medium value of effective SFE. Further research is needed, however, to confirm whether this is an inherent feature of the HPT of copper or a result of the fine-grained nature of the initial electroplated material [22]. The present findings need further studies, including heat treatment, because annealing can stimulate the formation of a large fraction of twins.

3.3. Mechanical Properties of the Composites

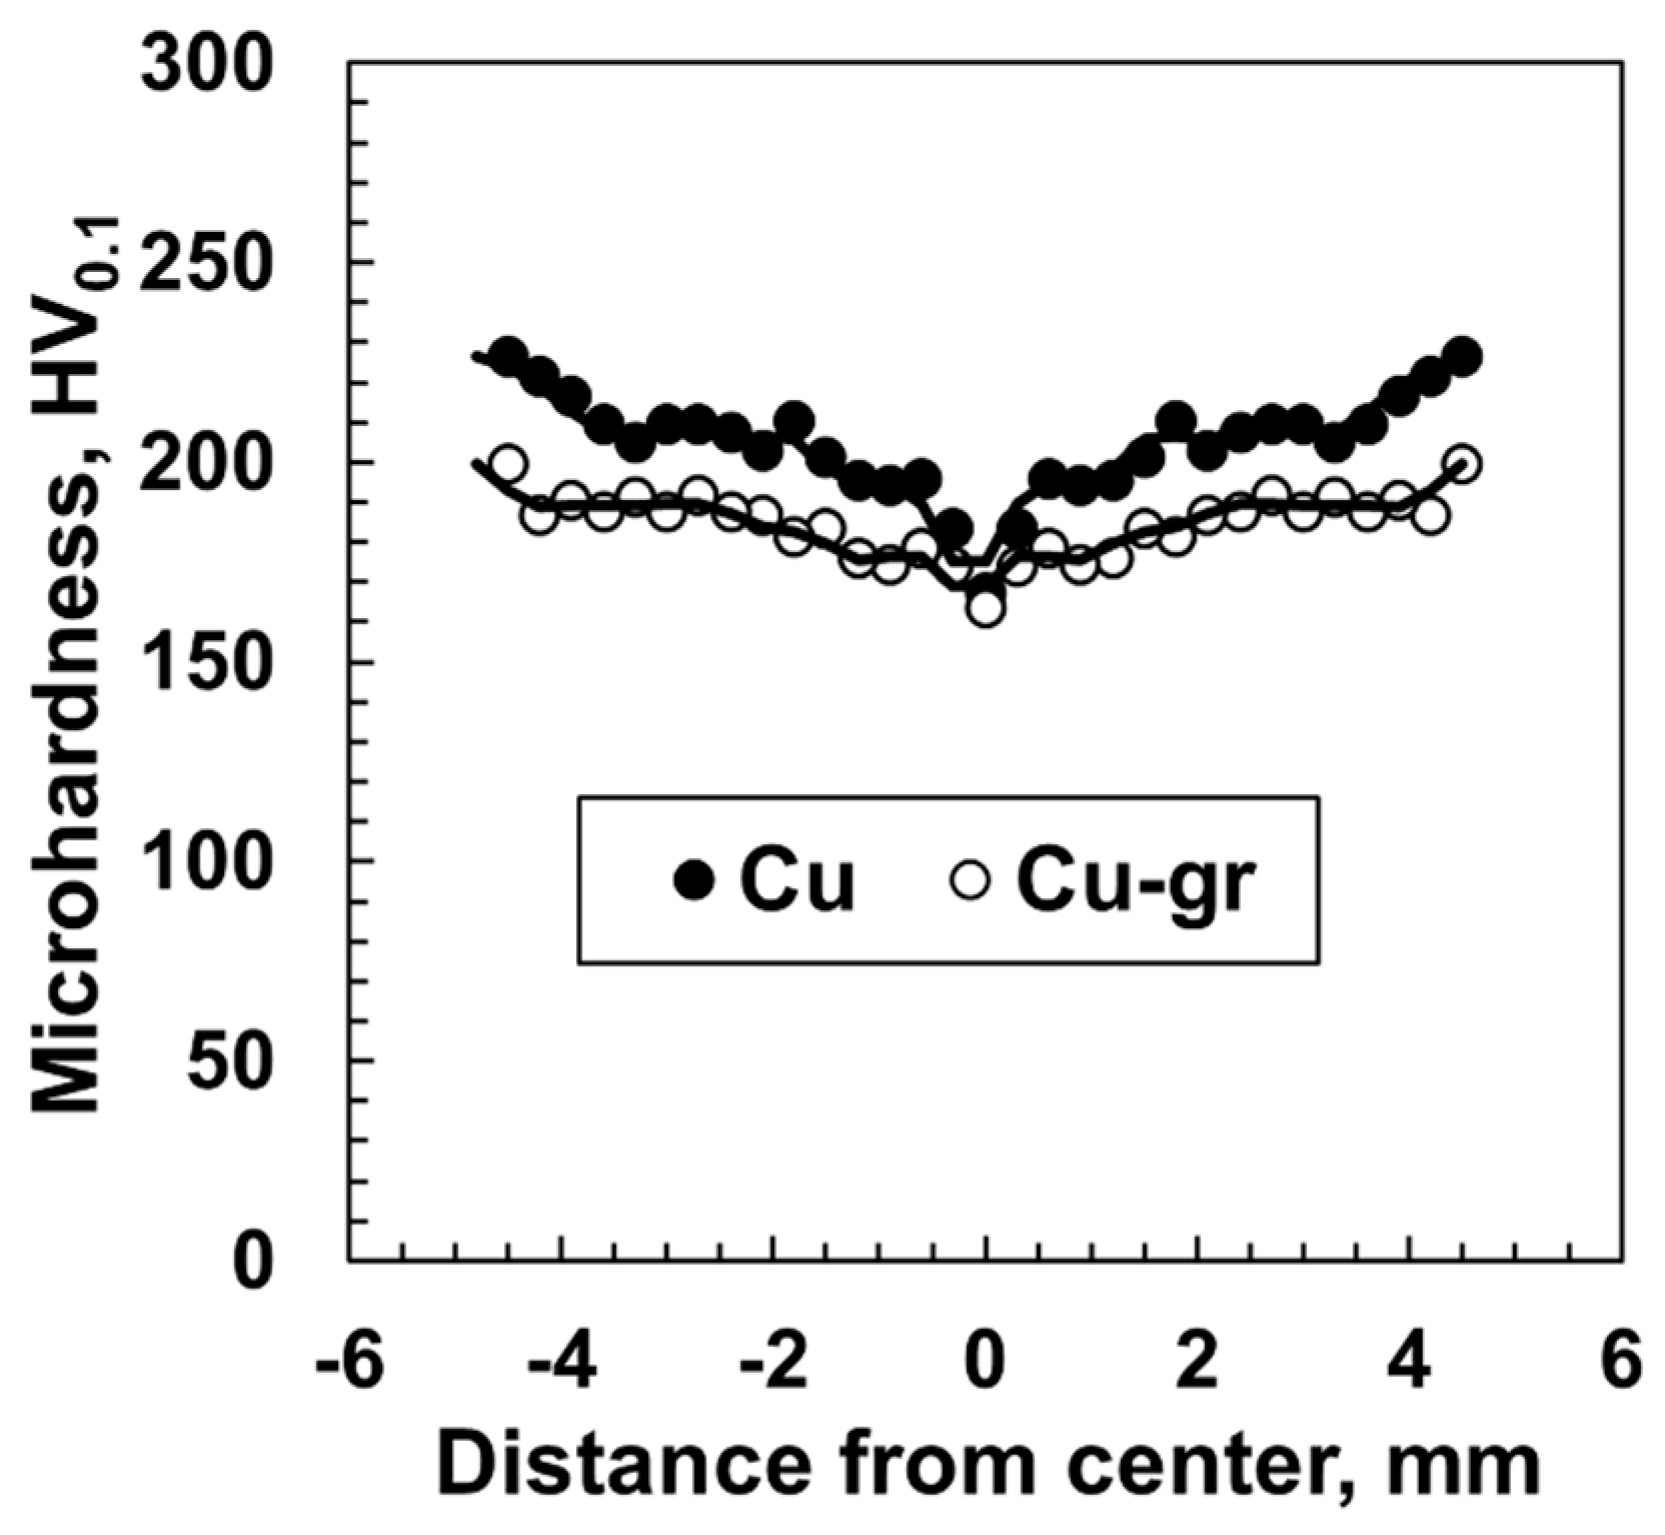
To obtain a broader view of underlying microstructural changes, the Vickers microhardness was also measured on both HPT-processed samples on the surface, along their diameter (Figure 6). The distribution of the microhardness was found to increase gradually from the center to the edge in both samples. The reason for this is that the imposed strain varies across the sample, and the strain is reduced to zero at the disk center. However, although the microhardness is lower in the central region, it appears to become fairly uniform throughout the discs. The more homogeneous distribution of microhardness in the Gr/Cu composite may be, as noted above, due to the softening effect of the increased SFE value. A comparison of the mechanical properties, including tensile strength, ductility, and microhardness, of the current work with previously reported data is presented in Table 2, highlighting the effect of different processing methods and graphene addition on the material performance.
According to most experimental data, Gr/Cu composites exhibit superior hardness, Young’s modulus, yield strength, and room temperature tensile strength compared to the corresponding unreinforced matrices [28]. The results are, however, very dependent on the graphene content and the processing route. In composites obtained via the deformation route, particularly by accumulative roll bonding and high-ratio rolling, the obtained values of maximum strength are significantly higher, reaching 485 MPa, and the difference between reinforced and non-reinforced composites is small [22].
Concerning the possible role of graphene distribution and agglomeration, one can conclude that the homogeneous shear texture (Figure 3a) and near-identical grain aspect ratios in Gr/Cu (1.77) and pure Cu (1.98) suggest graphene does not disrupt strain localization, implying effective dispersion. Another argument in favor of the effective interfacial bonding is the enhanced ductility with strength retention. Thus, Gr/Cu exhibits ~10% elongation vs. 8% for pure Cu (Table 2), despite comparable grain sizes. This “strength–ductility synergy” is a hallmark of strong interfacial load transfer. The same reasoning can be applied to microhardness consistency, where the gradual radial hardness gradient (Figure 6) and absence of localized softening indicate uniform graphene dispersion. Tensile tests of the samples under study revealed that samples of both types processed by HPT show excellent tensile strength, achieving ultimate tensile strengths of 674 and 689 MPa for Gr/Cu and pure Cu composite samples, respectively, exceeding the well-known data for most of Gr/Cu composites [5,22,28]. The ductility of the Gr/Cu composite is higher than that of the pure Cu sample; it is about 10%.
Nevertheless, the obtained strength values are a little lower than the strength values for high-strength and high-conductivity nanotwinned Cu that can reach 800 MPa [21]. The achieved strength and microhardness of the HPT-processed samples are obviously not associated with twinning; instead, they are related to hardening by a superposition of different factors, the most important of which are grain-size strengthening and dislocation strengthening during HPT processing. The strength and microhardness of HPT-processed copper foils generally agree with the data for HPT-processed bulk pure copper [29]. Due to the low content of graphene, its contribution to hardening could not be identified definitely; however, it is facilitated by the strong Cu-Gr interface formed during HPT, which promotes load sharing and dislocation pinning. This enhances ductility by redistributing stresses and preventing localization; however, the low graphene content limits direct strengthening. The literature studies confirm that, in Cu–graphene composites, interfacial bonding enables effective stress transfer, improving ductility via modified local deformation fields [10,11,28].
The observed “strength–ductility synergy”—where Gr/Cu maintains high strength (674 MPa) with improved ductility (10%)—arises from balanced microstructural effects, including grain refinement for hardening and SFE elevation for recovery. This aligns with the literature on graphene–metal composites, where synergy results from heterogeneous deformation enabling sustained work hardening without a significant trade-off.

3.4. Stacking Fault Energy Calculation by Ab Initio Simulations

The equilibrium lattice parameter of copper is 3.58 Å, which is in good agreement with both the experimental results in this work (Table 1) and in other works [30,31], and it also agrees with theoretical data [32]. The equilibrium lattice parameter of graphene is 2.47 Å, and the interatomic distance is 1.42 Å, which is also consistent with other studies [33].
To clarify the experimental results on the effective stacking fault energy in the Gr/Cu composite, ab initio calculations were carried out. The SFE in pure copper, according to the calculation results, is 0.40 × 10⁻⁴ eV/Å = 64 mJ/m2, while the SFE in the Gr/Cu composite is 0.52 × 10⁻⁴ eV/Å = 77 mJ/m2. The high energy in the case of the Gr/Cu composite is consistent with the experimental results shown earlier. Due to the small size of the calculation cell and, as a consequence, the stacking fault and the placed graphene, these results are suitable only for a qualitative assessment of the SFE. For Gr/Cu composites, direct measurements or calculations of SFE values are limited. However, indirect evidence suggests increased SFE in these composites. For instance, Zhang et al. [34] observed enhanced ductility in Gr/Cu composites, indicating a higher SFE. Similarly, Weng et al. [35,36] found that incorporating graphene into the FCC lattice increased the twin boundary energy, which correlates with a higher SFE. The 27% increase in SFE observed in this study is significant, though not unprecedented for metal matrix composites. As a point of comparison, adding 1 wt% carbon nanotubes (CNTs) to aluminum resulted in an SFE increase of approximately 40% [36]. The strongly nonlinear influence of the carbon component on material strengthening is attributed to the peculiarities and diversity of carbon nanostructures [37,38,39]. The qualitative significant change in the SFE obtained in this work does not claim full numerical correspondence with full-scale experimental data; however, these findings collectively suggest that graphene incorporation can substantially alter the stacking fault energy in metal matrix composites, potentially influencing their mechanical properties and deformation behavior.

4. Conclusions

High-pressure torsion (HPT) processing proves to be an effective method for synthesizing bulk Cu–matrix composites reinforced with graphene. The process significantly refines grain size, resulting in a homogeneous fine-grained structure. However, the formation of a desirable nanotwinned microstructure was not achieved, likely due to the medium stacking fault energy (SFE) of the materials. Instead, grain refinement primarily occurred through dynamic recrystallization and dislocation activity.
Mechanical testing revealed that both pure Cu and Gr/Cu composite exhibit high tensile strength, with ultimate tensile strengths of 689 MPa and 674 MPa, respectively. The Gr/Cu composite showed slightly enhanced ductility (~10% elongation), attributed to the increased SFE, which promoted dislocation glide systems. Ab initio calculations confirmed a 27% increase in SFE for the Gr/Cu composite compared to pure Cu, aligning with experimental observations. This higher SFE facilitates plastic deformation through dislocation mechanisms rather than twinning, contributing to the material’s mechanical performance.
The combination of high strength and adequate ductility makes these materials promising candidates for applications in high-power electronic devices requiring efficient heat dissipation. Future studies should explore post-processing techniques, such as annealing, to enhance twin boundary formation and further optimize the microstructural and mechanical properties of these composites.

Author Contributions

Conceptualization, G.K. (Galiia Korznikova) and E.K.; methodology, G.K. (Galiia Korznikova), G.K. (Gulnara Khalikova), and I.K.; software, A.S.; validation, G.K. (Galiia Korznikova), I.K., and W.W.; formal analysis, G.K. (Gulnara Khalikova) and A.S.; investigation, G.K. (Galiia Korznikova), G.K. (Gulnara Khalikova), and I.K.; resources, W.W. and E.K.; data curation, G.K. (Gulnara Khalikova) and A.S.; writing—original draft preparation, G.K. (Galiia Korznikova) and E.K.; writing—review and editing, G.K. (Gulnara Khalikova), I.K., W.W., and A.S.; visualization, G.K. (Gulnara Khalikova) and A.S.; supervision, E.K.; project administration, E.K.; funding acquisition, W.W. and E.K. All authors have read and agreed to the published version of the manuscript.

Funding

This work was supported by the Ministry of Science and Higher Education of the Russian Federation within the framework of the state task of the Institute of Metal Superplasticity Problems RAS (No. 124022900008-6). EAK is grateful for the support of the Russian Science Foundation (grant No. 24-22-20038, https://rscf.ru/project/24-22-20038/ accessed on 1 June 2025) and the Saint Petersburg Science Foundation (grant No. 24-22-20038) (conceptualization, original draft writing, and editing). W.W. sincerely appreciates the financial support provided by Jiangsu Carbon Peak Carbon Neutrality Science and Technology Innovation Project (BE2022044), and Yunnan Province Science and Technology Project (202401BN070001-012) (discussion of results, manuscript editing).

Data Availability Statement

Data are available from the corresponding author upon reasonable request.

Acknowledgments

Initial Cu foils were kindly provided by T. Czeppe (IMIM PAS).

Conflicts of Interest

The authors declare no conflicts of interest.

Abbreviations

The following abbreviations are used in this manuscript:
TBsTwin boundaries
HPTHigh-pressure torsion
HAGBsHigh-angle grain boundaries
LAGBsLow-angle boundaries
QEQuantum Espresso
DFTDensity functional theory
XRDX-ray diffraction
SFEStacking fault energy
CNTsCarbon nanotubes

References

  1. Mao, Q.; Liu, Y.; Zhao, Y. A review on copper alloys with high strength and high electrical conductivity. J. Alloys Compd. 2024, 990, 174456. [Google Scholar] [CrossRef]
  2. Champion, Y.; Couzine, J.P.; Tusseau Nenez, S.; Bréchet, Y.; Islamgaliev, R.K.; Valiev, R. High strength and electrical conductivity of UFG copper alloys. Mater. Sci. Forum 2010, 667–669, 755–759. [Google Scholar] [CrossRef]
  3. Lu, L.; Shen, Y.; Chen, X.; Qian, L.; Lu, K. Ultrahigh strength and high electrical conductivity in copper. Science 2004, 304, 422–426. [Google Scholar] [CrossRef]
  4. Christian, J.W.; Mahajan, S. Deformation twinning. Prog. Mater. Sci. 1995, 39, 1–157. [Google Scholar] [CrossRef]
  5. Lee, K.-P.; Chen, B.-Y.; Lin, Y.-Q.; Hung, Y.-W.; Hsu, W.-Y.; Chen, Y.-H.; Chen, C. High-strength and high-conductivity nanotwinned Cu lightly doped with Ni. Mater. Sci. Eng. A 2024, 891, 145990. [Google Scholar] [CrossRef]
  6. Lu, L.; Chen, X.; Huang, X.; Lu, K. Revealing the maximum strength in nanotwinned copper. Science 2009, 323, 607–610. [Google Scholar] [CrossRef] [PubMed]
  7. Chen, J.; Lei, L.; Ku, L. Hardness and strain rate sensitivity of nanocrystalline Cu. Scr. Mater. 2006, 54, 1913–1918. [Google Scholar] [CrossRef]
  8. Zhilyaev, A.; Langdon, T. Using high-pressure torsion for metal processing: Fundamentals and applications. Prog. Mater. Sci. 2008, 53, 893–979. [Google Scholar] [CrossRef]
  9. Czeppe, T.; Korznikova, G.; Korznikov, A.; Wróbel, M. Properties of the Cu-graphene composites produced by high pressure torsion. Mechanik 2016, 5–6, 500–501. [Google Scholar] [CrossRef]
  10. Mutlu, A.; Çavdar, U. Investigation of mechanical properties of Copper-Graphene composites in terms of production methods and additive ratios: A review. Sigma J. Eng. Nat. Sci. 2024, 42, 600–613. [Google Scholar] [CrossRef]
  11. Zhang, C.; Lu, C.; Pei, L.; Li, J.; Wang, R.; Tieu, K. The negative Poisson’s ratio and strengthening mechanism of nanolayered graphene/Cu composites. Carbon 2019, 143, 125–137. [Google Scholar] [CrossRef]
  12. Korznikova, G.; Kabirov, R.; Nazarov, K.; Khisamov, R.; Shayakhmetov, R.; Korznikova, E.; Khalikova, G.; Mulyukov, R. Influence of constrained high-pressure torsion on microstructure and mechanical properties of an aluminum-based metal matrix composite. JOM 2020, 72, 2898–2911. [Google Scholar] [CrossRef]
  13. Giannozzi, P.; Baroni, S.; Bonini, N.; Calandra, M.; Car, R.; Cavazzoni, C.; Wentzcovitch, R.M. QUANTUM ESPRESSO: A modular and open-source software project for quantum simulations of materials. J. Phys. Condens. Matter 2009, 21, 395502. [Google Scholar] [CrossRef] [PubMed]
  14. Giannozzi, P.; Andreussi, O.; Brumme, T.; Bunau, O.; Nardelli, M.B.; Calandra, M.; Baroni, S. Advanced capabilities for materials modelling with Quantum ESPRESSO. J. Phys. Condens. Matter 2017, 29, 465901. [Google Scholar] [CrossRef] [PubMed]
  15. Vanderbilt, D. Soft self-consistent pseudopotentials in a generalized eigenvalue formalism. Phys. Rev. B 1990, 41, 7892. [Google Scholar] [CrossRef] [PubMed]
  16. Garrity, K.F.; Bennett, J.W.; Rabe, K.M.; Vanderbilt, D. Pseudopotentials for high-throughput DFT calculations. Comput. Mater. Sci. 2014, 81, 446–452. [Google Scholar] [CrossRef]
  17. Prandini, G.; Marrazzo, A.; Castelli, I.E.; Mounet, N.; Marzari, N. Precision and efficiency in solid-state pseudopotential calculations. npj Comput. Mater. 2018, 4, 72. [Google Scholar] [CrossRef]
  18. Lejaeghere, K.; Bihlmayer, G.; Björkman, T.; Blaha, P.; Blügel, S.; Blum, V.; Cottenier, S. Reproducibility in density functional theory calculations of solids. Science 2016, 351, aad3000. [Google Scholar] [CrossRef]
  19. Azzeddine, H.; Bradai, D.; Baudin, T.; Langdon, T.G. Texture evolution in high-pressure torsion processing. Prog. Mater. Sci. 2022, 125, 100886. [Google Scholar] [CrossRef]
  20. Cao, J.; Li, Y.; Liu, J.; Zhan, K.; Zhao, B.; Ji, V. Engineering texture and twins of Cu foils preparing by pulse electrodeposition and their properties. Mater. Charact. 2024, 218, 114477. [Google Scholar] [CrossRef]
  21. Reed, R.P.; Schramm, R.E. Relationship between stacking fault energy and x-ray measurements of stacking fault probability and microstrain. J. Appl. Phys. 1974, 45, 4705. [Google Scholar] [CrossRef]
  22. Sadoun, A.M.; Abdallah, A.W.; Najjar, I.M.R.; Basha, M.; Elmahdy, M. Effect of lattice structure evolution and stacking fault energy on the properties of Cu–ZrO2/GNP nanocomposites. Ceram. Int. 2021, 47, 29598–29606. [Google Scholar] [CrossRef]
  23. Kunčická, L.; Jambor, M.; Král, P. High-pressure torsion of copper; Effect of processing temperature on structural features, microhardness and electric conductivity. Materials 2023, 16, 2738. [Google Scholar] [CrossRef]
  24. Rijal, A.; Singh, S.P.; Han, J.; Kawasaki, M.; Kumar, P. Effect of HPT processing followed by long term natural ageing on mechanical and electrical properties of commercially pure Cu. Lett. Mater. 2019, 9, 561–565. [Google Scholar] [CrossRef]
  25. Korznikova, G.; Czeppe, T.; Khalikova, G.; Gunderov, D.; Korznikova, E.; Litynska-Dobrzynska, L.; Szlezynger, M. Microstructure and mechanical properties of Cu-graphene composites produced by two high pressure torsion procedures. Mater. Charact. 2020, 161, 110122. [Google Scholar] [CrossRef]
  26. Wang, L.; Yang, Z.; Cui, Y.; Wei, B.; Xu, S.; Sheng, J.; Wang, M.; Zhu, Y.; Fei, W. Graphene-copper composite with micro-layered grains and ultrahigh strength. Sci. Rep. 2017, 7, 41896. [Google Scholar] [CrossRef]
  27. da Cruz, R.A.; de Andrade Mendes Filho, A.; Santos, S.L.d.; Santos, V.T.d.; da Silva, M.R.; Lobo, F.G.; Santos, G.A.d.; Couto, A.A. Microstructure and mechanical properties of copper/graphene composites fabricated via accumulative roll bonding and heat treatment without a controlled atmosphere. Metals 2024, 14, 4. [Google Scholar] [CrossRef]
  28. Hidalgo-Manrique, P.; Lei, X.; Xu, R.; Zhou, M.; Kinloch, I.A.; Young, R.J. Copper/graphene composites: A review. J. Mater. Sci. 2019, 54, 12236–12289. [Google Scholar] [CrossRef]
  29. Lugo, N.; Llorca, N.; Cabrera, J.M.; Horita, Z. Microstructures and mechanical properties of pure copper deformed severely by equal-channel angular pressing and high pressure torsion. Mater. Sci. Eng. A 2008, 477, 366–371. [Google Scholar] [CrossRef]
  30. Arblaster, J.W. Selected Values of the Crystallographic Properties of Elements; ASM International: Almere, The Netherlands, 2018. [Google Scholar]
  31. Zhou, L.P.; Wang, M.P.; Kun, P.E.N.; Zhu, J.J.; Zhen, F.U.; Zhou, L.I. Structure characteristic and its evolution of Cu-W films prepared by dual-target magnetron sputtering deposition. Trans. Nonferrous Met. Soc. China 2012, 22, 2700–2706. [Google Scholar] [CrossRef]
  32. Trong, D.N.; Long, V.C.; Saraç, U.; Quoc, V.D.; Ţălu, Ş. First-principles calculations of crystallographic and electronic structural properties of Au-Cu alloys. J. Compos. Sci. 2022, 6, 383. [Google Scholar] [CrossRef]
  33. Gray, D.; McCaughan, A.; Mookerji, B. Crystal structure of graphite, graphene and silicon. Phys. Solid State Appl. 2009, 6, 730. [Google Scholar]
  34. Zhang, Y.; An, Q.; Li, J.; Lu, B.; Wu, W.; Xia, R. Strengthening mechanisms of graphene in copper matrix nanocomposites: A molecular dynamics study. J. Mol. Model. 2020, 26, 335. [Google Scholar] [CrossRef] [PubMed]
  35. Weng, S.; Ning, H.; Fu, T.; Hu, N.; Zhao, Y.; Huang, C.; Peng, X. Molecular dynamics study of strengthening mechanism of nanolaminated graphene/Cu composites under compression. Sci. Rep. 2018, 8, 3089. [Google Scholar] [CrossRef]
  36. Yankovskaya, U.I.; Sharapova, Y.R.; Zakharov, P.V. Influence of carbon nanotubes on mechanical properties of Ni3Al polycrystal. Mater. Technol. Des. 2022, 4, 76–81. [Google Scholar]
  37. Baimova, J.A.; Korznikova, E.A.; Lobzenko, I.P.; Dmitriev, S.V. Discrete breathers in carbon and hydrocarbon nanostructures. Rev. Adv. Mater. Sci. 2015, 42, 68–82. [Google Scholar] [CrossRef]
  38. Rysaeva, L.K.; Bachurin, D.V.; Murzaev, R.T.; Mulyukov, R.R.; Dmitriev, S.V. Evolution of the carbon nanotube bundle structure under biaxial and shear strains. Facta Univ. Ser. Mech. Eng. 2020, 18, 525–536. [Google Scholar] [CrossRef]
  39. Babicheva, R.I.; Dahanayaka, M.; Liu, B.; Korznikova, E.A.; Dmitriev, S.V.; Wu, M.S.; Zhou, K. Characterization of two carbon allotropes, cyclicgraphene and graphenylene, as semi-permeable materials for membranes. Mater. Sci. Eng. B 2020, 259, 114569. [Google Scholar] [CrossRef]
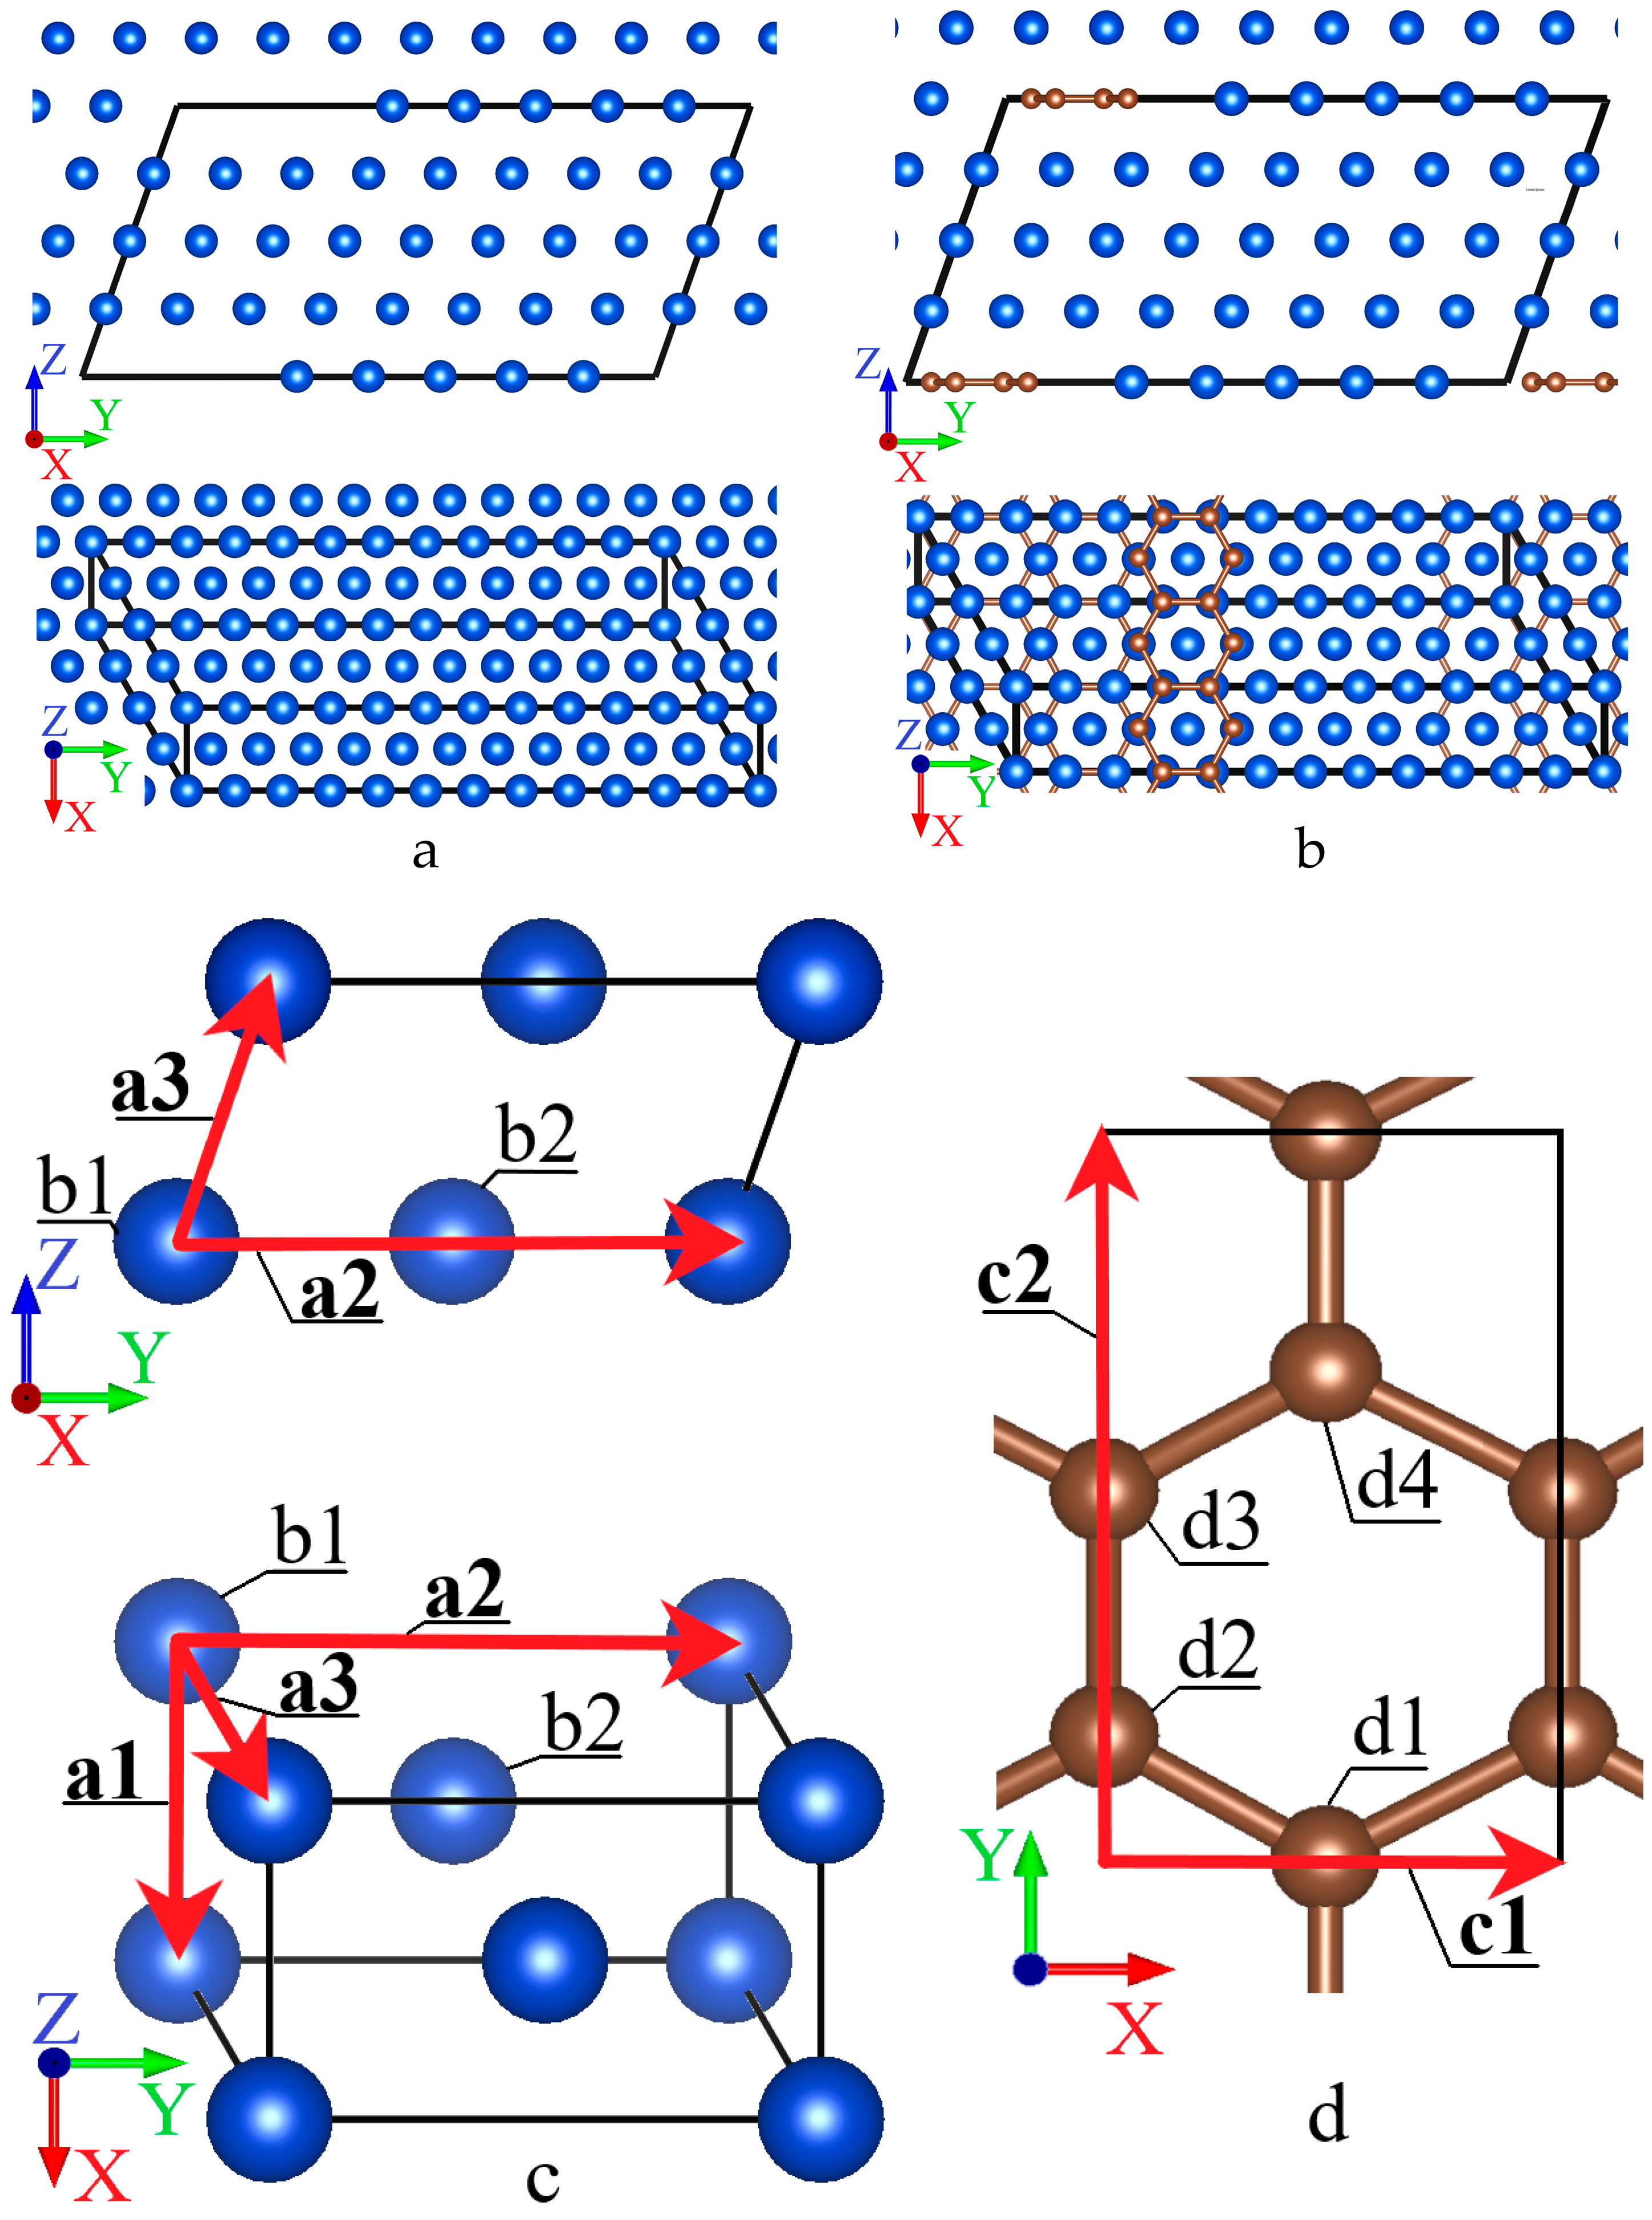
Figure 1. Projections of structures with a stacking fault on the YZ and XY planes in pure Cu (a) and in the Gr/Cu composite (b). Copper atoms are shown in blue, and carbon atoms in brown, with interatomic bonds additionally shown for graphene. The black line shows the calculation cell. Scheme of the elementary calculational cell of Cu (c) and graphene (d). The arrows indicate the translation vectors.
Solids 06 00057 g001
Figure 2. Characterization of the copper foil with graphene monolayer prior to HPT: (a) EBSD inverse-pole-figure map; (b) EBSD grain-boundary map; (c) misorientation angle distribution; and (d) (0 0 1), (1 0 1), and (1 1 1) pole figures, illustrating texture.
Solids 06 00057 g002
Figure 3. Characterization of Gr/Cu composite fabricated by HPT: (a) EBSD inverse-pole-figure map; (b) EBSD grain-boundary map; (c) misorientation angle distribution; and (d) (0 0 1), (1 0 1), and (1 1 1) pole figures, illustrating texture.
Solids 06 00057 g003
Figure 4. Characterization of bulk Cu sample without graphene after HPT processing: (a) EBSD inverse-pole-figure map; (b) EBSD grain-boundary map; (c) grain boundary misorientation angle distribution; and (d) (0 0 1), (1 0 1), and (1 1 1) pole figures, illustrating texture.
Solids 06 00057 g004
Figure 5. Transmission electron microscope bright field images and corresponding selected area diffraction patterns of HPT-processed samples: (a,b) pure copper foil, (c,d) Gr/Cu composite, and (e,f) Cu composite sample without graphene. Nanotwins are indicated by arrows.
Solids 06 00057 g005
Figure 6. Microhardness distribution in the HPT-processed Gr/Cu and pure Cu samples.
Solids 06 00057 g006
Table 1. X-ray diffraction analysis results.
MaterialLattice Parameter, a, (nm)Coherent Scattering Regions, CSR, (nm)Microstrain, e, %
HPT
Gr/Cu
0.3616984 ± 0.000005260.63 ± 0.47e = 0.21587
HPT
Pure Cu
0.3616962 ± 0.000004968.29 ± 0.39e = 0.17972
Table 2. Room-temperature mechanical properties of HPT-processed Cu and Gr/Cu composites compared to the literature data.
MaterialProcessTensile Strength (MPa)Ductility (%)Microhardness (HV)Reference
Cu/graphene
(this work)
HPT (N = 5 rev.)67413.7210This work
Pure Cu (this work)HPT (N = 5 rev.)68912.1190This work
Pure CuHPT (RT,
N = 1 rev.)
3878.2105Ref. [23]
Pure CuHPT (ε = 1000)142Ref. [24]
Cu-0.1 wt% GrPowder
metallurgy
3155.8131Ref. [25]
Cu-5 vol% RGOSPS + layered6087.5Ref. [26]
Cu-0.5 wt% GrHot pressing3084.2Ref. [27]
Cu-8 vol% GNPsHPT485<5Ref. [10]
Disclaimer/Publisher’s Note: The statements, opinions and data contained in all publications are solely those of the individual author(s) and contributor(s) and not of MDPI and/or the editor(s). MDPI and/or the editor(s) disclaim responsibility for any injury to people or property resulting from any ideas, methods, instructions or products referred to in the content.