Review

Luminescence Properties of Defects in GaN: Solved and Unsolved Problems

by
Michael A. Reshchikov
Department of Physics, Virginia Commonwealth University, Richmond, VA 23220, USA
Solids 2025, 6(3), 52; https://doi.org/10.3390/solids6030052
Submission received: 2 July 2025 / Revised: 25 July 2025 / Accepted: 1 September 2025 / Published: 10 September 2025

Abstract

Gallium Nitride (GaN) is a wide-bandgap semiconductor that has revolutionized optoelectronic applications, enabling blue/white light-emitting devices and high-power electronics. Point defects in GaN strongly influence its optical and electronic properties, producing both beneficial and detrimental effects. This review provides a comprehensive update on the current understanding of point defects in GaN and their impact on photoluminescence (PL). Since our earlier review (Reshchikov and Morkoç, J. Appl. Phys. 2005, 97, 061301), substantial progress has been made in this field. PL bands associated with major intrinsic and extrinsic defects in GaN are now much better understood, and several defects in undoped GaN (arising from unintentional impurities or specific growth conditions) have been identified. Notably, the long-debated origin of the yellow luminescence band in GaN has been resolved, and the roles of Ga and N vacancies in the optical properties of GaN have been revised. Zero-phonon lines have been discovered for several defects. Key parameters, such as electron- and hole-capture coefficients, phonon energies, electron–phonon coupling strength, thermodynamic charge transition levels, and the presence of excited states, have been determined or refined. Despite these advances, several puzzles associated with PL remain unsolved, highlighting areas for future investigation.

Graphical Abstract

1. Introduction

Gallium nitride (GaN), a wide-bandgap semiconductor with a direct bandgap of 3.43 eV at room temperature, is a cornerstone of modern optoelectronics and power electronics. Applications include bright blue and white light-emitting diodes (LEDs), blue lasers, and high-power and high-frequency electronic devices. Its outstanding material properties, including a high breakdown voltage and the availability of both n- and p-type doping, have established GaN as a key platform for next-generation semiconductor technologies [1,2,3,4]. However, defects significantly degrade optical and electrical performance. While structural defects are well-characterized, point defects—including vacancies, interstitials, antisites, impurities, and their complexes—remain insufficiently understood. Identifying and characterizing these defects is essential for improving the efficiency, reliability, and operational lifetime of GaN-based devices.
Point defects in GaN are probed using a wide range of experimental techniques, including photoluminescence (PL), cathodoluminescence (CL), secondary ion mass spectrometry (SIMS), Hall effect measurements, positron annihilation spectroscopy (PAS), Raman and Fourier-transform infrared (FTIR) spectroscopy, deep-level transient spectroscopy (DLTS), electron paramagnetic resonance (EPR), and optically detected magnetic resonance (ODMR) [5]. Among these, PL stands out as the most versatile and widely used method for probing optically active defects. PL enables the determination of key defect parameters, such as concentration, charge states, charge transition levels (with ~1 meV precision), carrier capture coefficients, electron–phonon coupling strengths, and excited-state characteristics. While excitonic luminescence, or, in general, near-band-edge (NBE) emission in GaN is well-understood [6,7,8,9,10,11,12,13,14,15,16], the origins of broad defect-related PL bands remain controversial. Persistent misattributions in the literature have hindered progress in the field.
The review by Reshchikov and Morkoç (2005) [16] provided a comprehensive analysis of PL in undoped and intentionally doped GaN. Since then, advances in material growth, experimental techniques, and first-principles calculations, particularly density functional theory (DFT), have prompted substantial revisions to earlier models. For example, the carbon impurity on a nitrogen site (CN) was previously misidentified as a shallow acceptor with a −/0 charge transition level ~0.2 eV above the valence band maximum (VBM) [17,18,19,20,21,22], and was believed to be responsible for the ultraviolet luminescence (UVL) band at 3.28 eV [23]. However, modern DFT calculations and experimental evidence have reclassified CN as a deep acceptor with a −/0 level at 0.9 eV above the VBM, now linked to the yellow luminescence (YL) band centered at ~2.2 eV [24,25,26,27]. Another illustrative case concerns the role of the gallium vacancy (VGa) and its complex with oxygen (VGaON) in PL from GaN. Early DFT calculations [17,22] and the results of PAS experiments [28] led to the incorrect conclusion that transitions from the conduction band (or shallow donors) to these defects cause the YL band in undoped GaN [16]. More accurate calculations have since revised the energy levels of VGa and VGaON by 1–2 eV [29,30,31,32], and recent experimental findings conclusively rule out their contribution to YL in undoped GaN (Section 3.1.5).
Although many controversies surrounding defect-related PL in GaN have been resolved since 2005, incorrect attributions, outdated theoretical interpretations, and misinterpretations of experimental data persist in the literature. This review aims to consolidate and disseminate an updated understanding of PL arising from major point defects in wurtzite GaN, with a focus on areas where significant revisions have been made. PL phenomena associated with excitons, structural defects, alloys, low-dimensional structures, transition metals, or rare-earth elements are beyond the scope of this work.
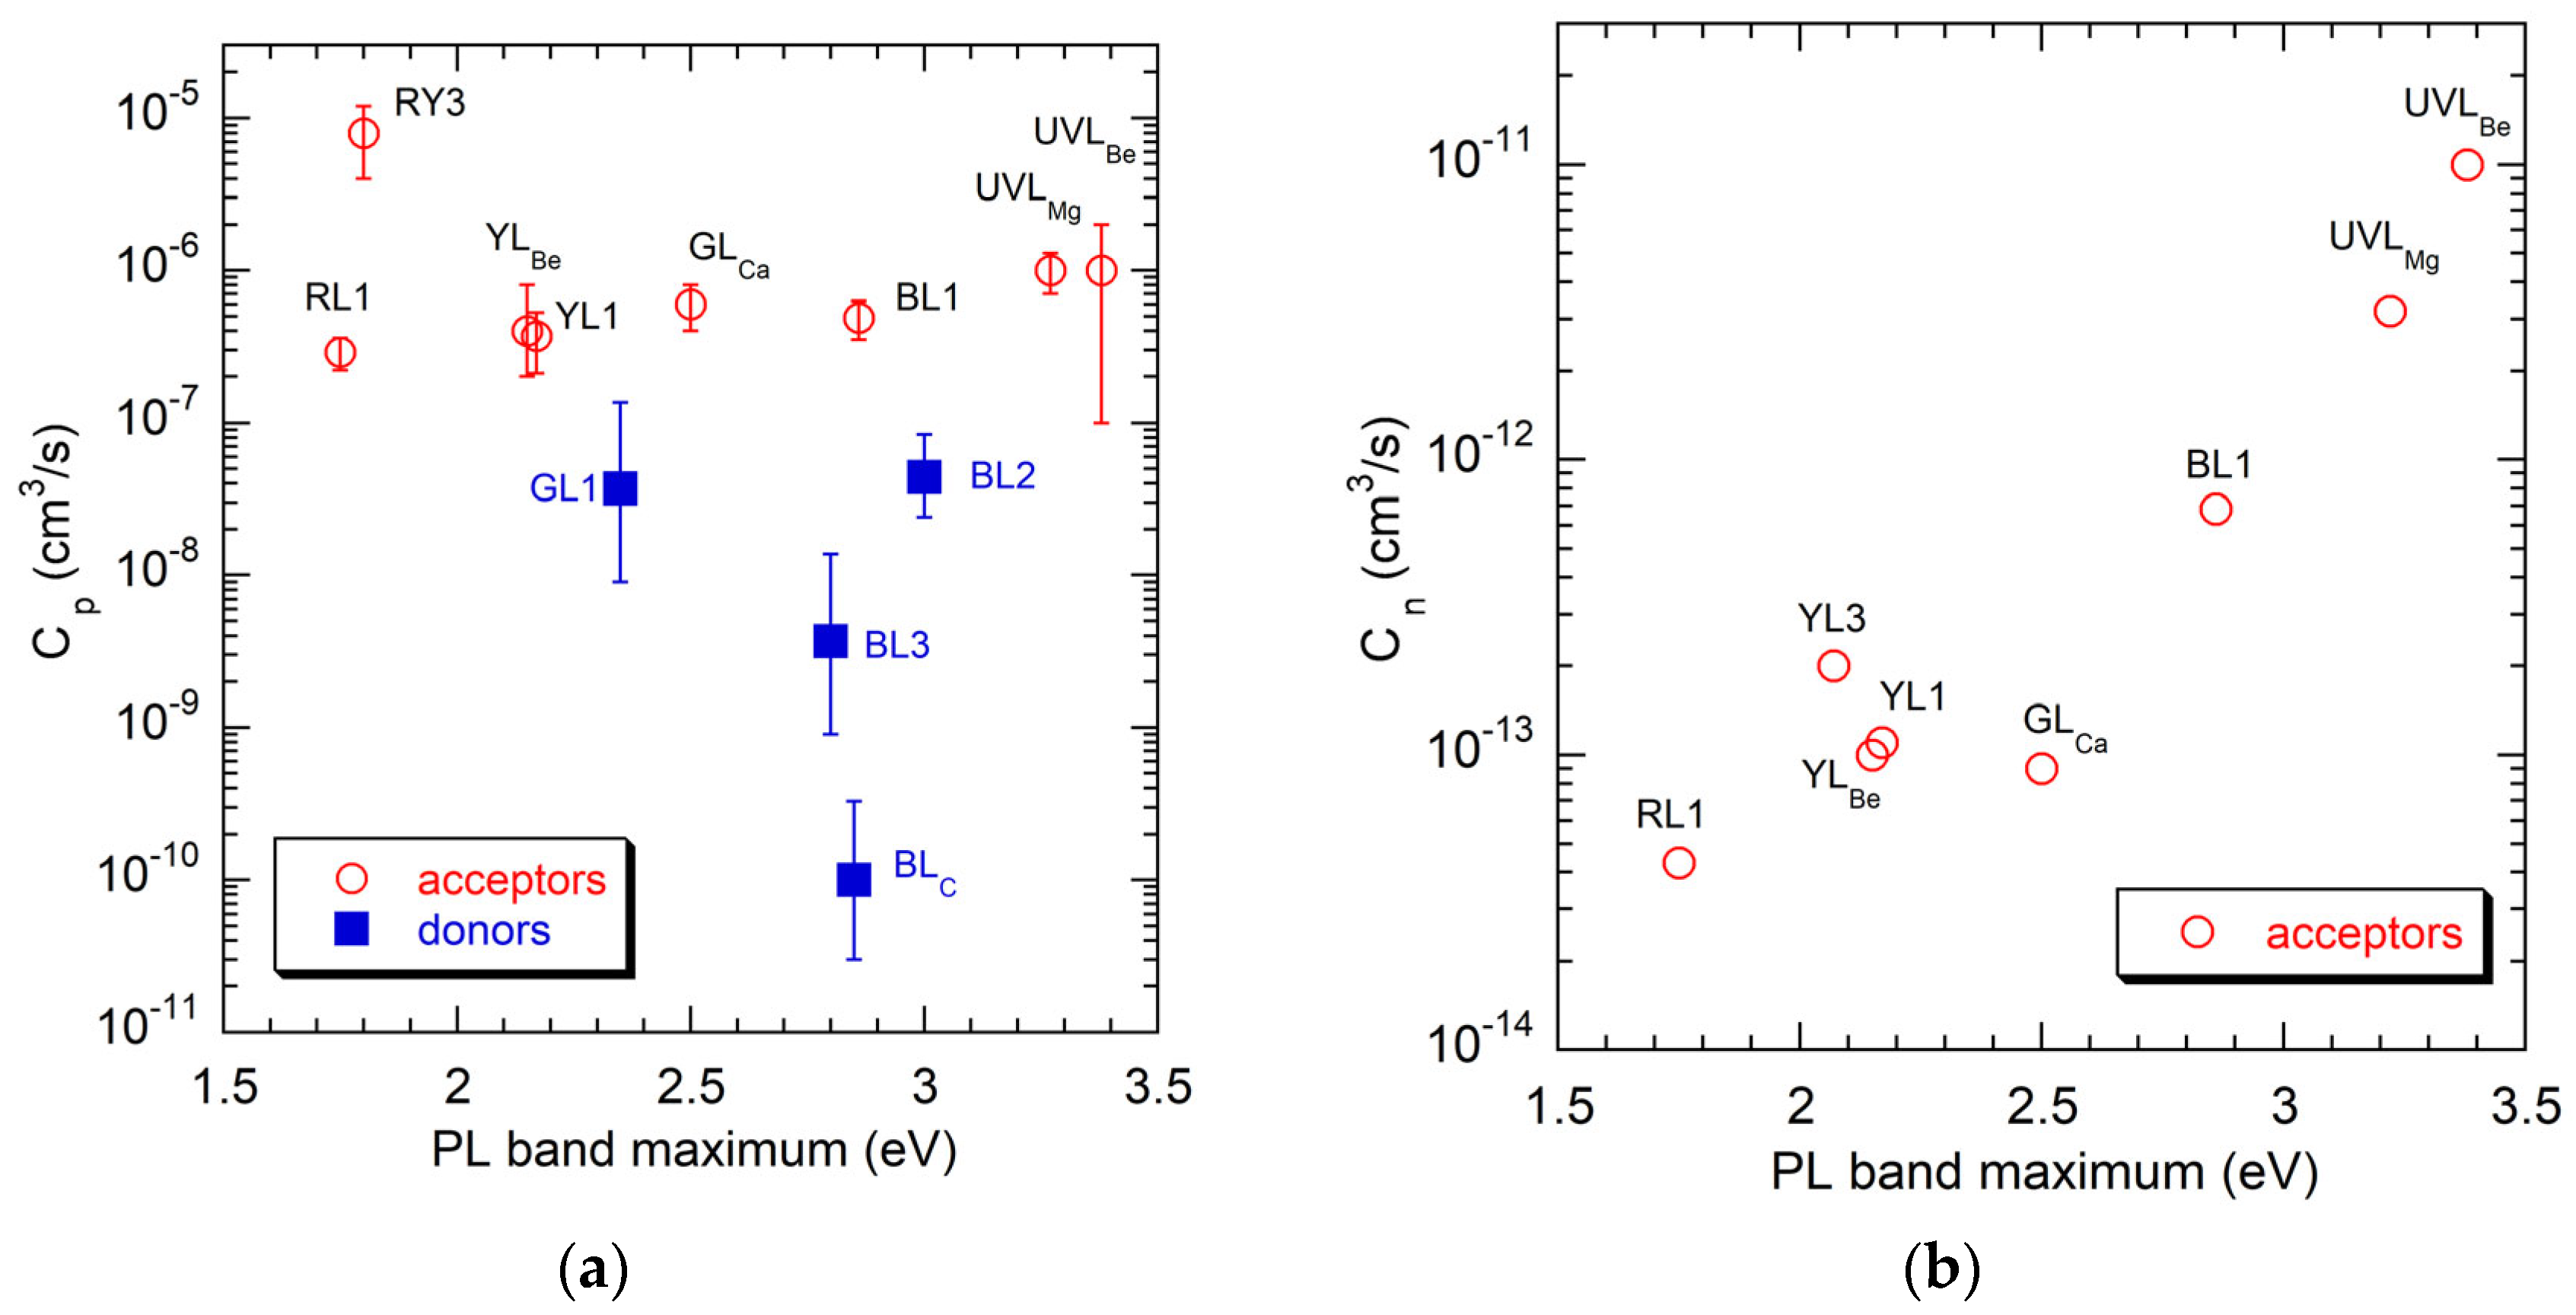
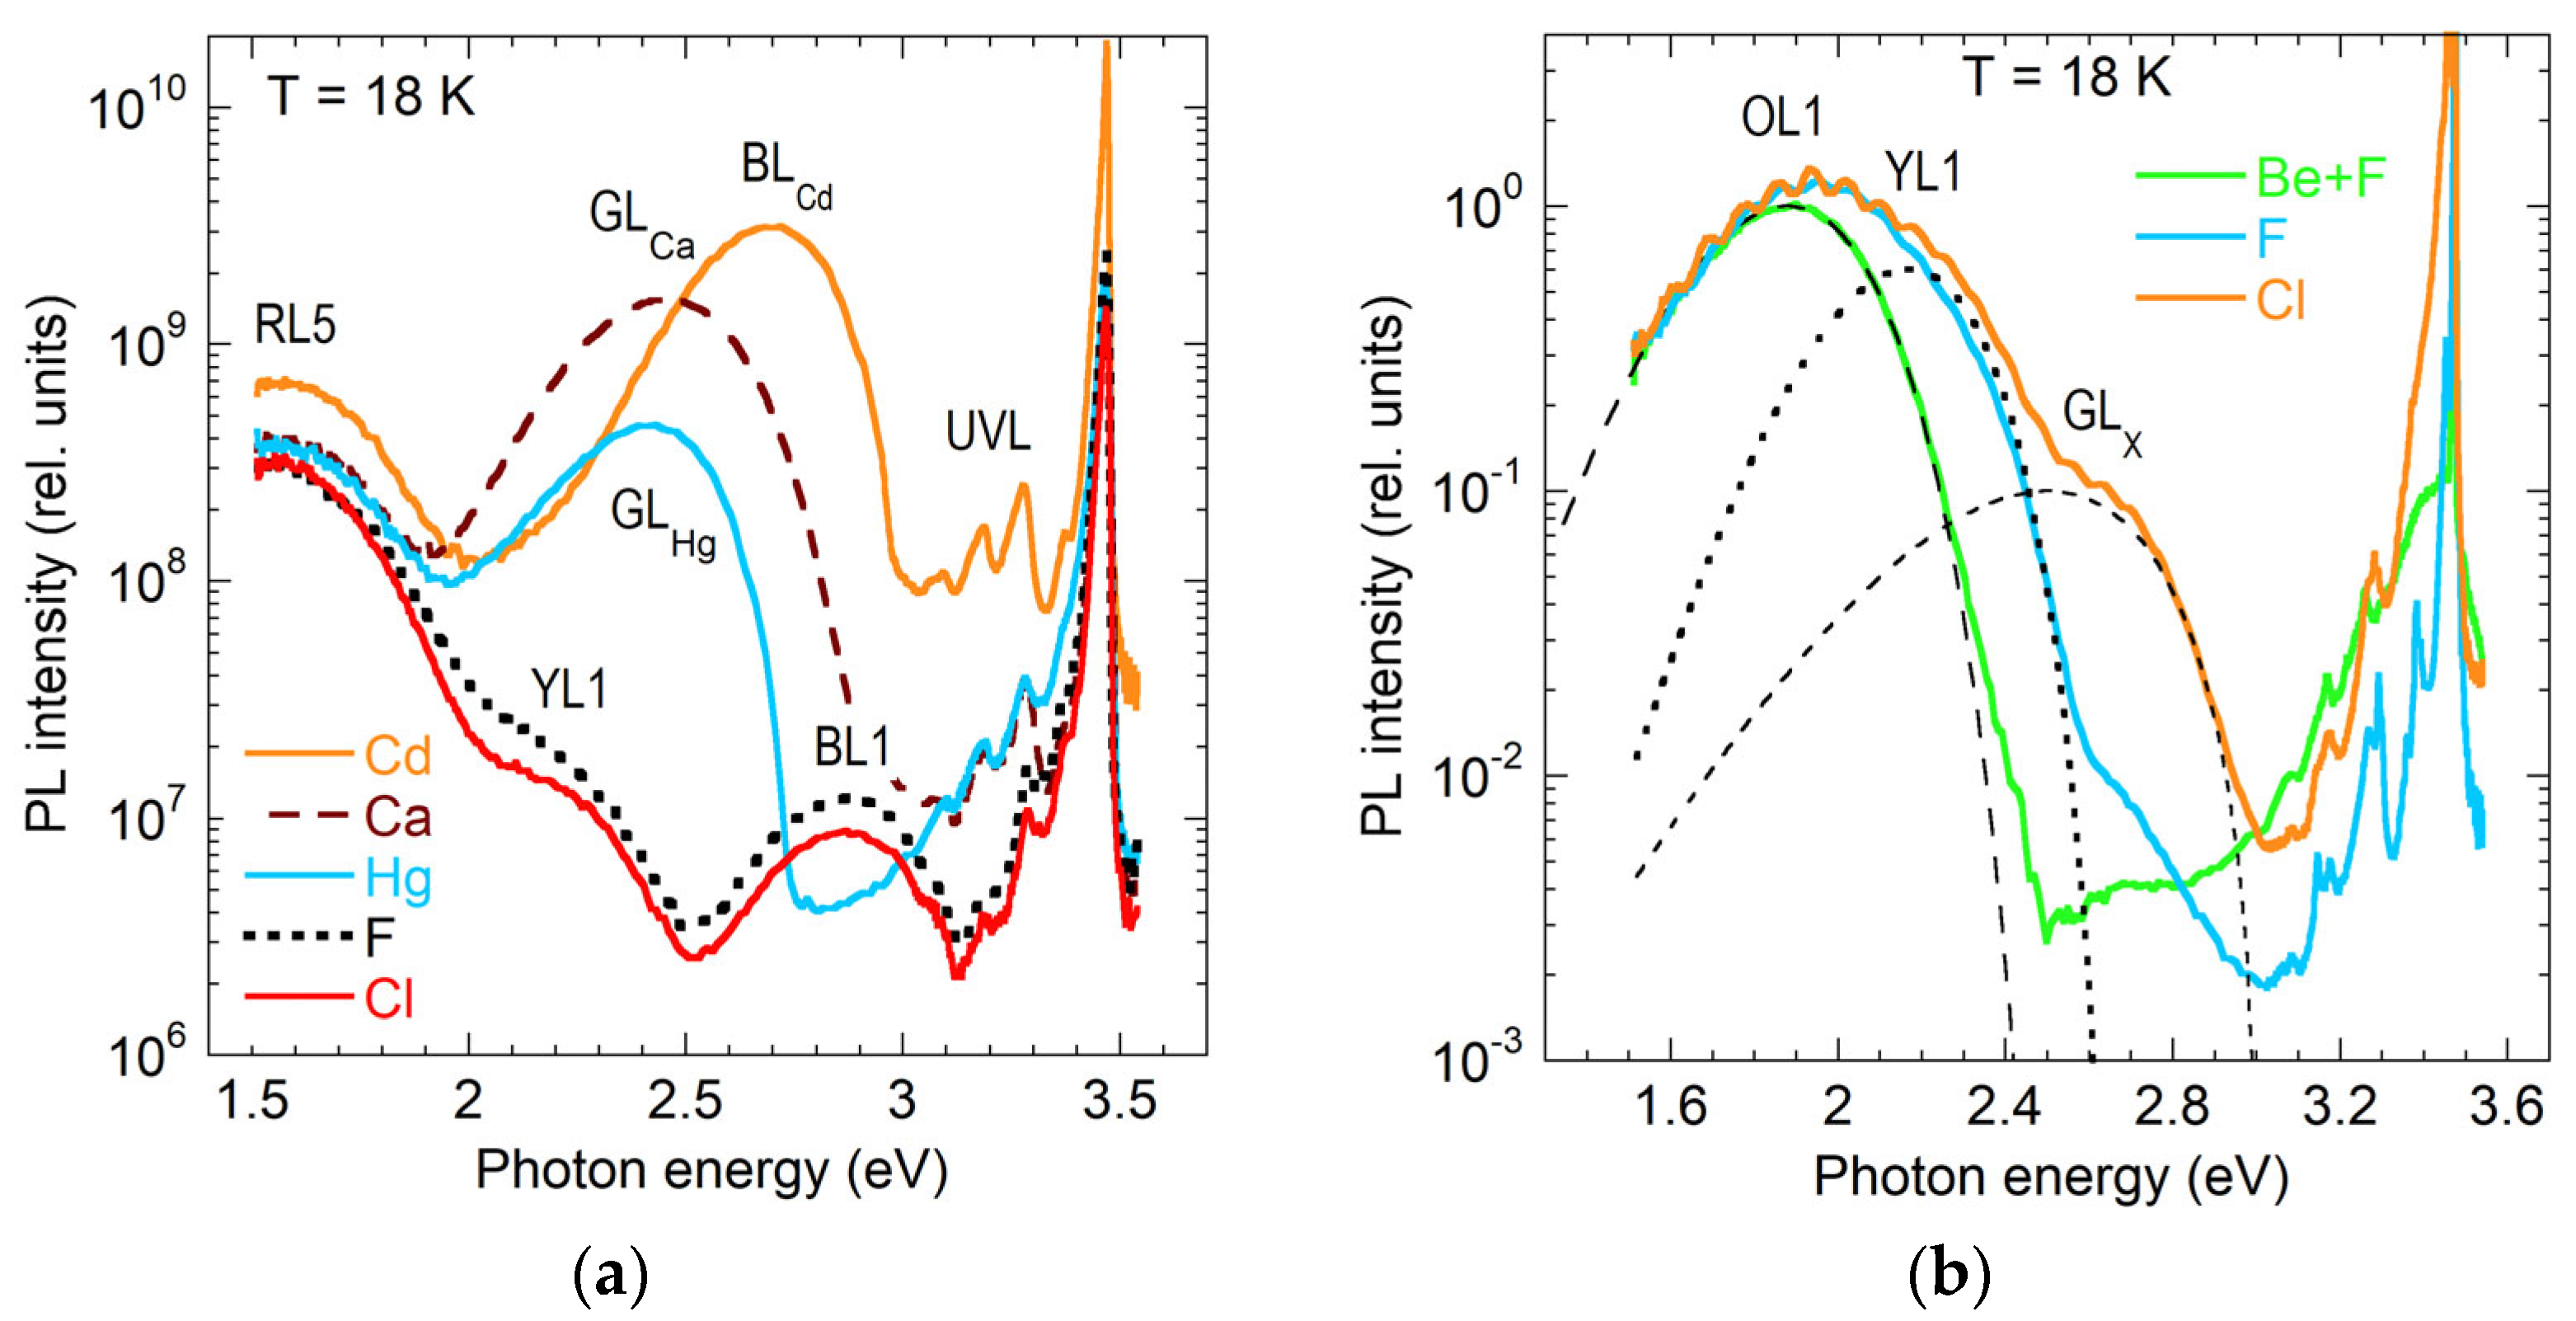
Table 1 summarizes the principal PL bands and their updated parameters. Figure 1 illustrates the corresponding electronic transitions schematically.
Traditionally, PL bands in GaN are labeled according to their perceived emission color, such as red luminescence (RL) or green luminescence (GL). However, multiple defects can produce PL bands with similar spectral positions and overlapping hues, leading to ambiguity. To address this, we adopt a refined nomenclature introduced in Ref. [65], which supplements traditional band names with numerical or index-based identifiers. For instance, the GL band described in Ref. [16] is now designated GL1, while GL2 retains its original classification.
The most important changes and remaining challenges in understanding defect-related PL in GaN (in the author’s opinion) are summarized below.
Solved problems:
  • The YL band (2.2 eV) in undoped GaN is now conclusively attributed to the CN acceptor (Section 3.1.2). Remaining issue: Reliable experimental data are lacking for the charge transition levels and PL signatures of VGa and VGaON complexes (Section 3.1.5 and Section 3.6).
  • The UVL band (3.28 eV) in undoped GaN originates from the MgGa acceptor, and not from CN, SiGa, VGa-related, or structural defects (Section 3.5). Remaining issue: The theoretically predicted dual nature of the MgGa acceptor has not been confirmed experimentally (Section 4.3.2).
  • The GL2 and RL2 bands are associated with isolated nitrogen vacancies (VN) and the AVN complexes, where A denotes a cation-site acceptor (Section 3.2.2 and Section 3.3.2). Remaining questions: What is A in the RL2 from undoped GaN? Is there PL from the AVN complexes with A = ZnGa, CdGa, or HgGa? Can GL2 and RL2 be linked to different charge transition levels of these multi-charged defects?
  • The fundamental properties of the isolated BeGa acceptor have been well established (Section 4.2.2). Remaining uncertainties: The identities of the shallow acceptor and deep donor responsible for the UVLBe (3.38 eV) and BLBe (2.6 eV) bands, respectively, should be verified (Section 4.2.3 and Section 4.2.5).
  • The origin of the aquamarine band in undoped GaN has been clarified (Section 4.6.2).
  • Novel mechanisms of PL quenching emerged (Section 2.2.2 and Section 4.4.2).
  • Significant redshifts of PL bands with decreasing excitation intensity have been explained (Section 4.3.4 and Section 4.4.5).
Unsolved problems:
  • The predicted dual nature of acceptors (excluding BeGa) remains unverified experimentally (Section 4.3.2 and Section 4.4.1).
  • The origins of the GL1 and RL1 bands are still unknown (Section 3.2.1 and Section 3.3.1).
  • The RY3 defect remains unidentified (Section 3.1.4, Section 3.2.3, and Section 3.4.3).
  • The influence of mobile defects at growth temperatures on the formation of complexes is not yet fully understood.
  • The effect of the surface and structural defects on PL from point defects remains insufficiently explored.
  • Significant discrepancies persist between predictions of first-principles calculations and experimental observations (Section 5.6).
The structure of the Review is the following. Section 2 outlines specific methodologies for conducting and analyzing PL experiments. Section 3 and Section 4 review PL bands in undoped and doped GaN, respectively. Section 5 summarizes key developments since the previous review [16] and highlights unresolved issues. Section 6 concludes.

2. Luminescence Methods

2.1. Photoluminescence Setup

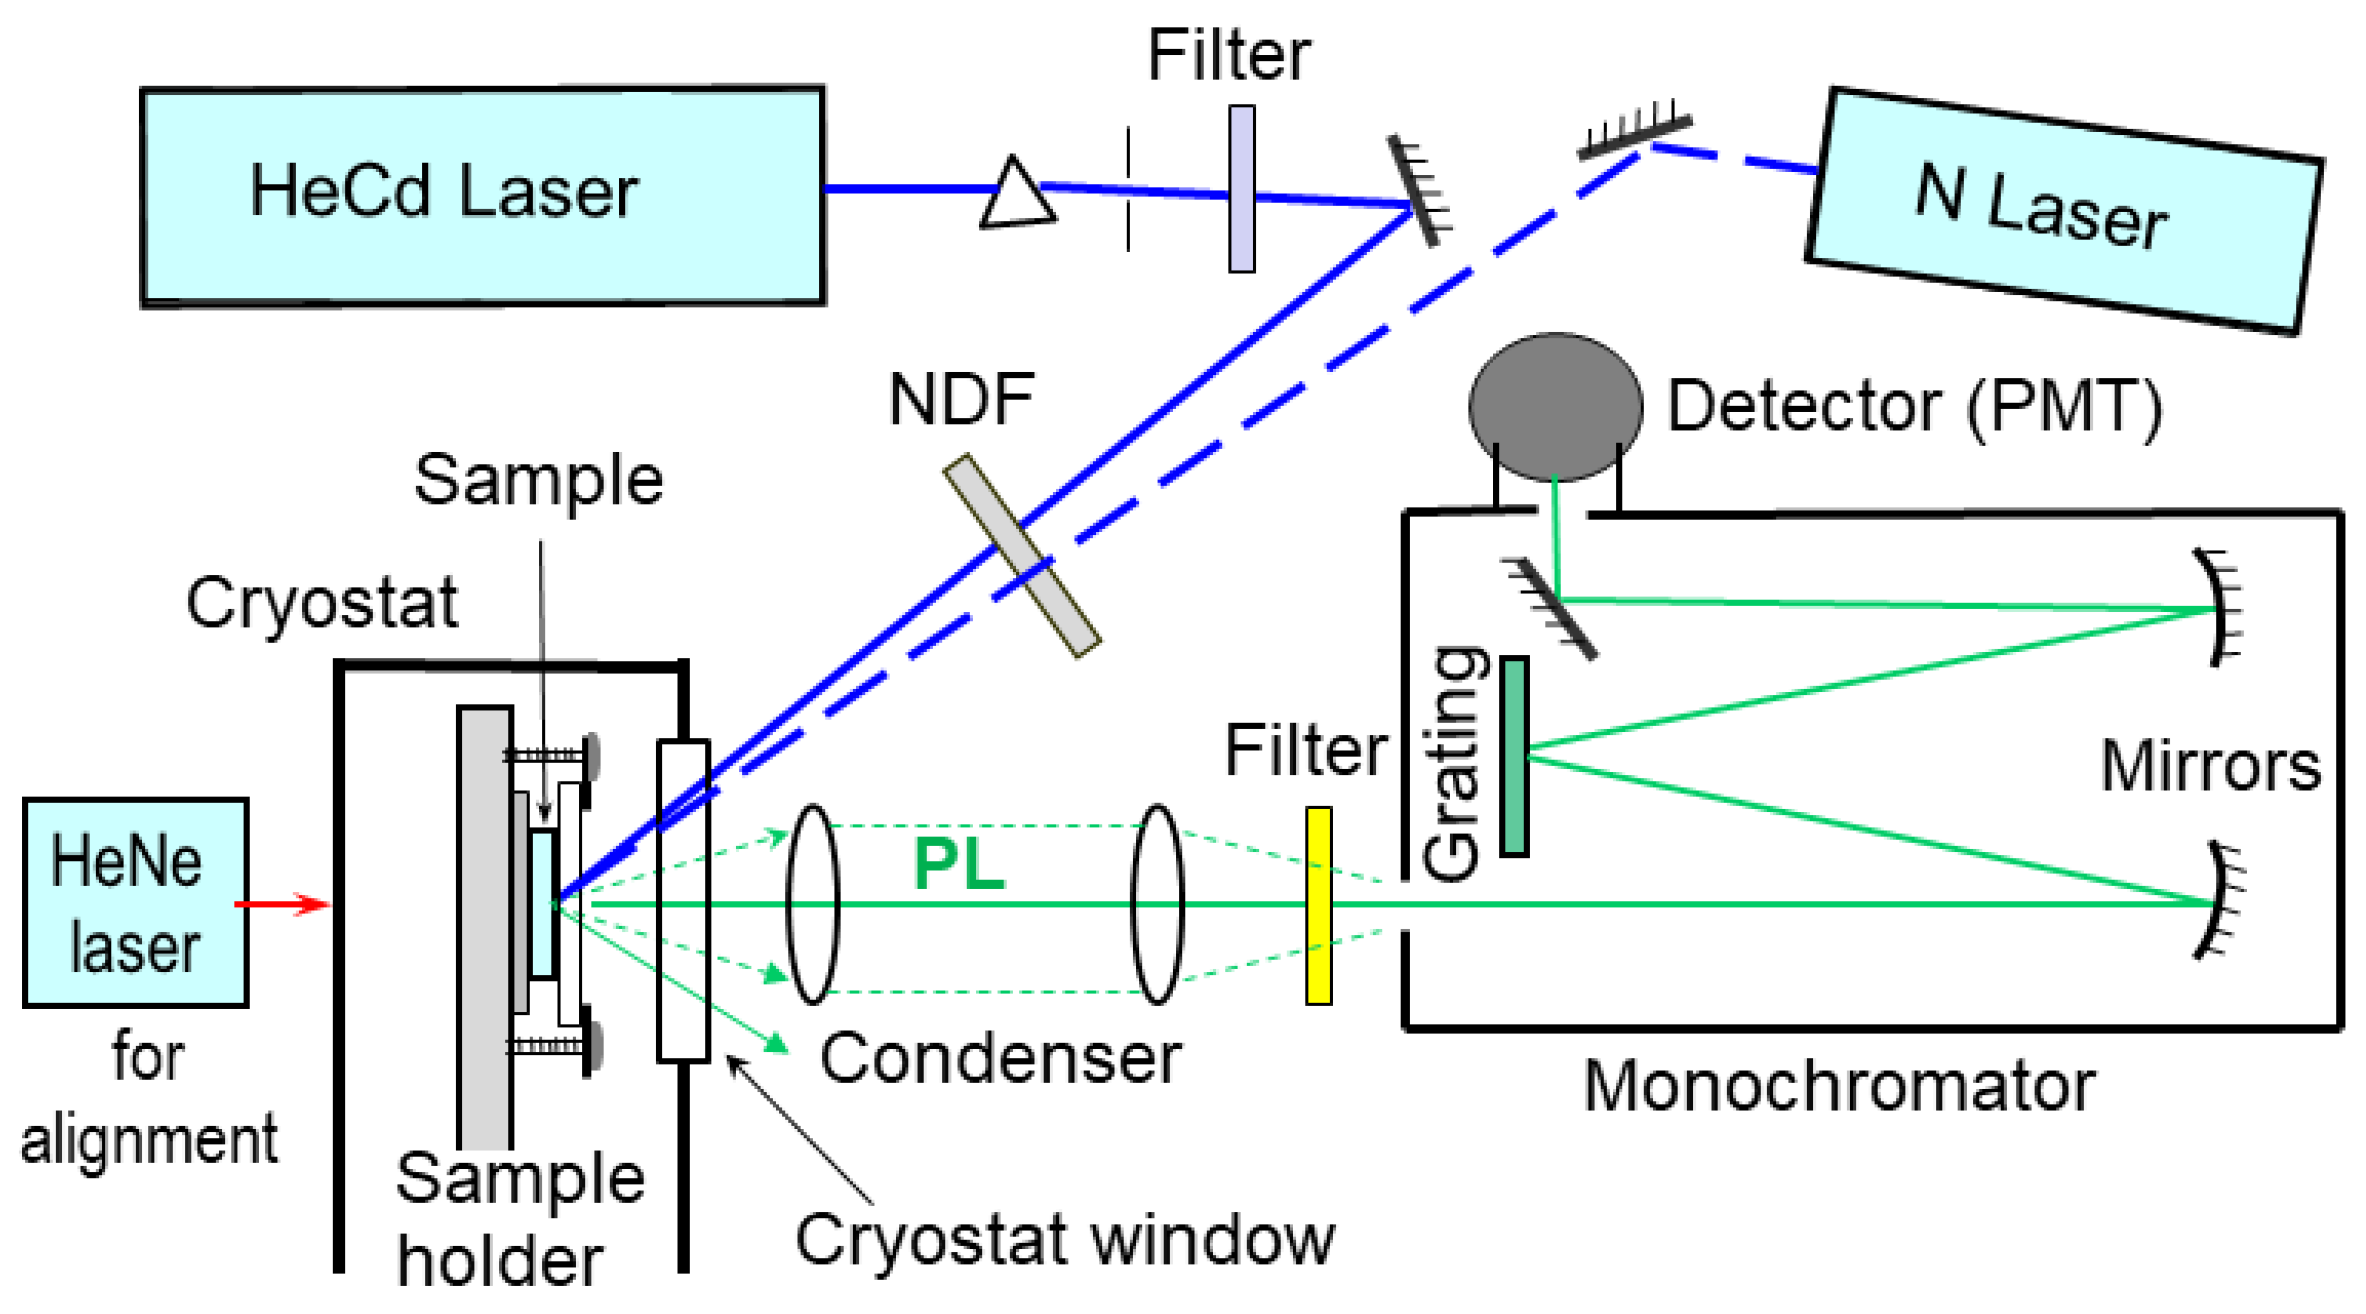
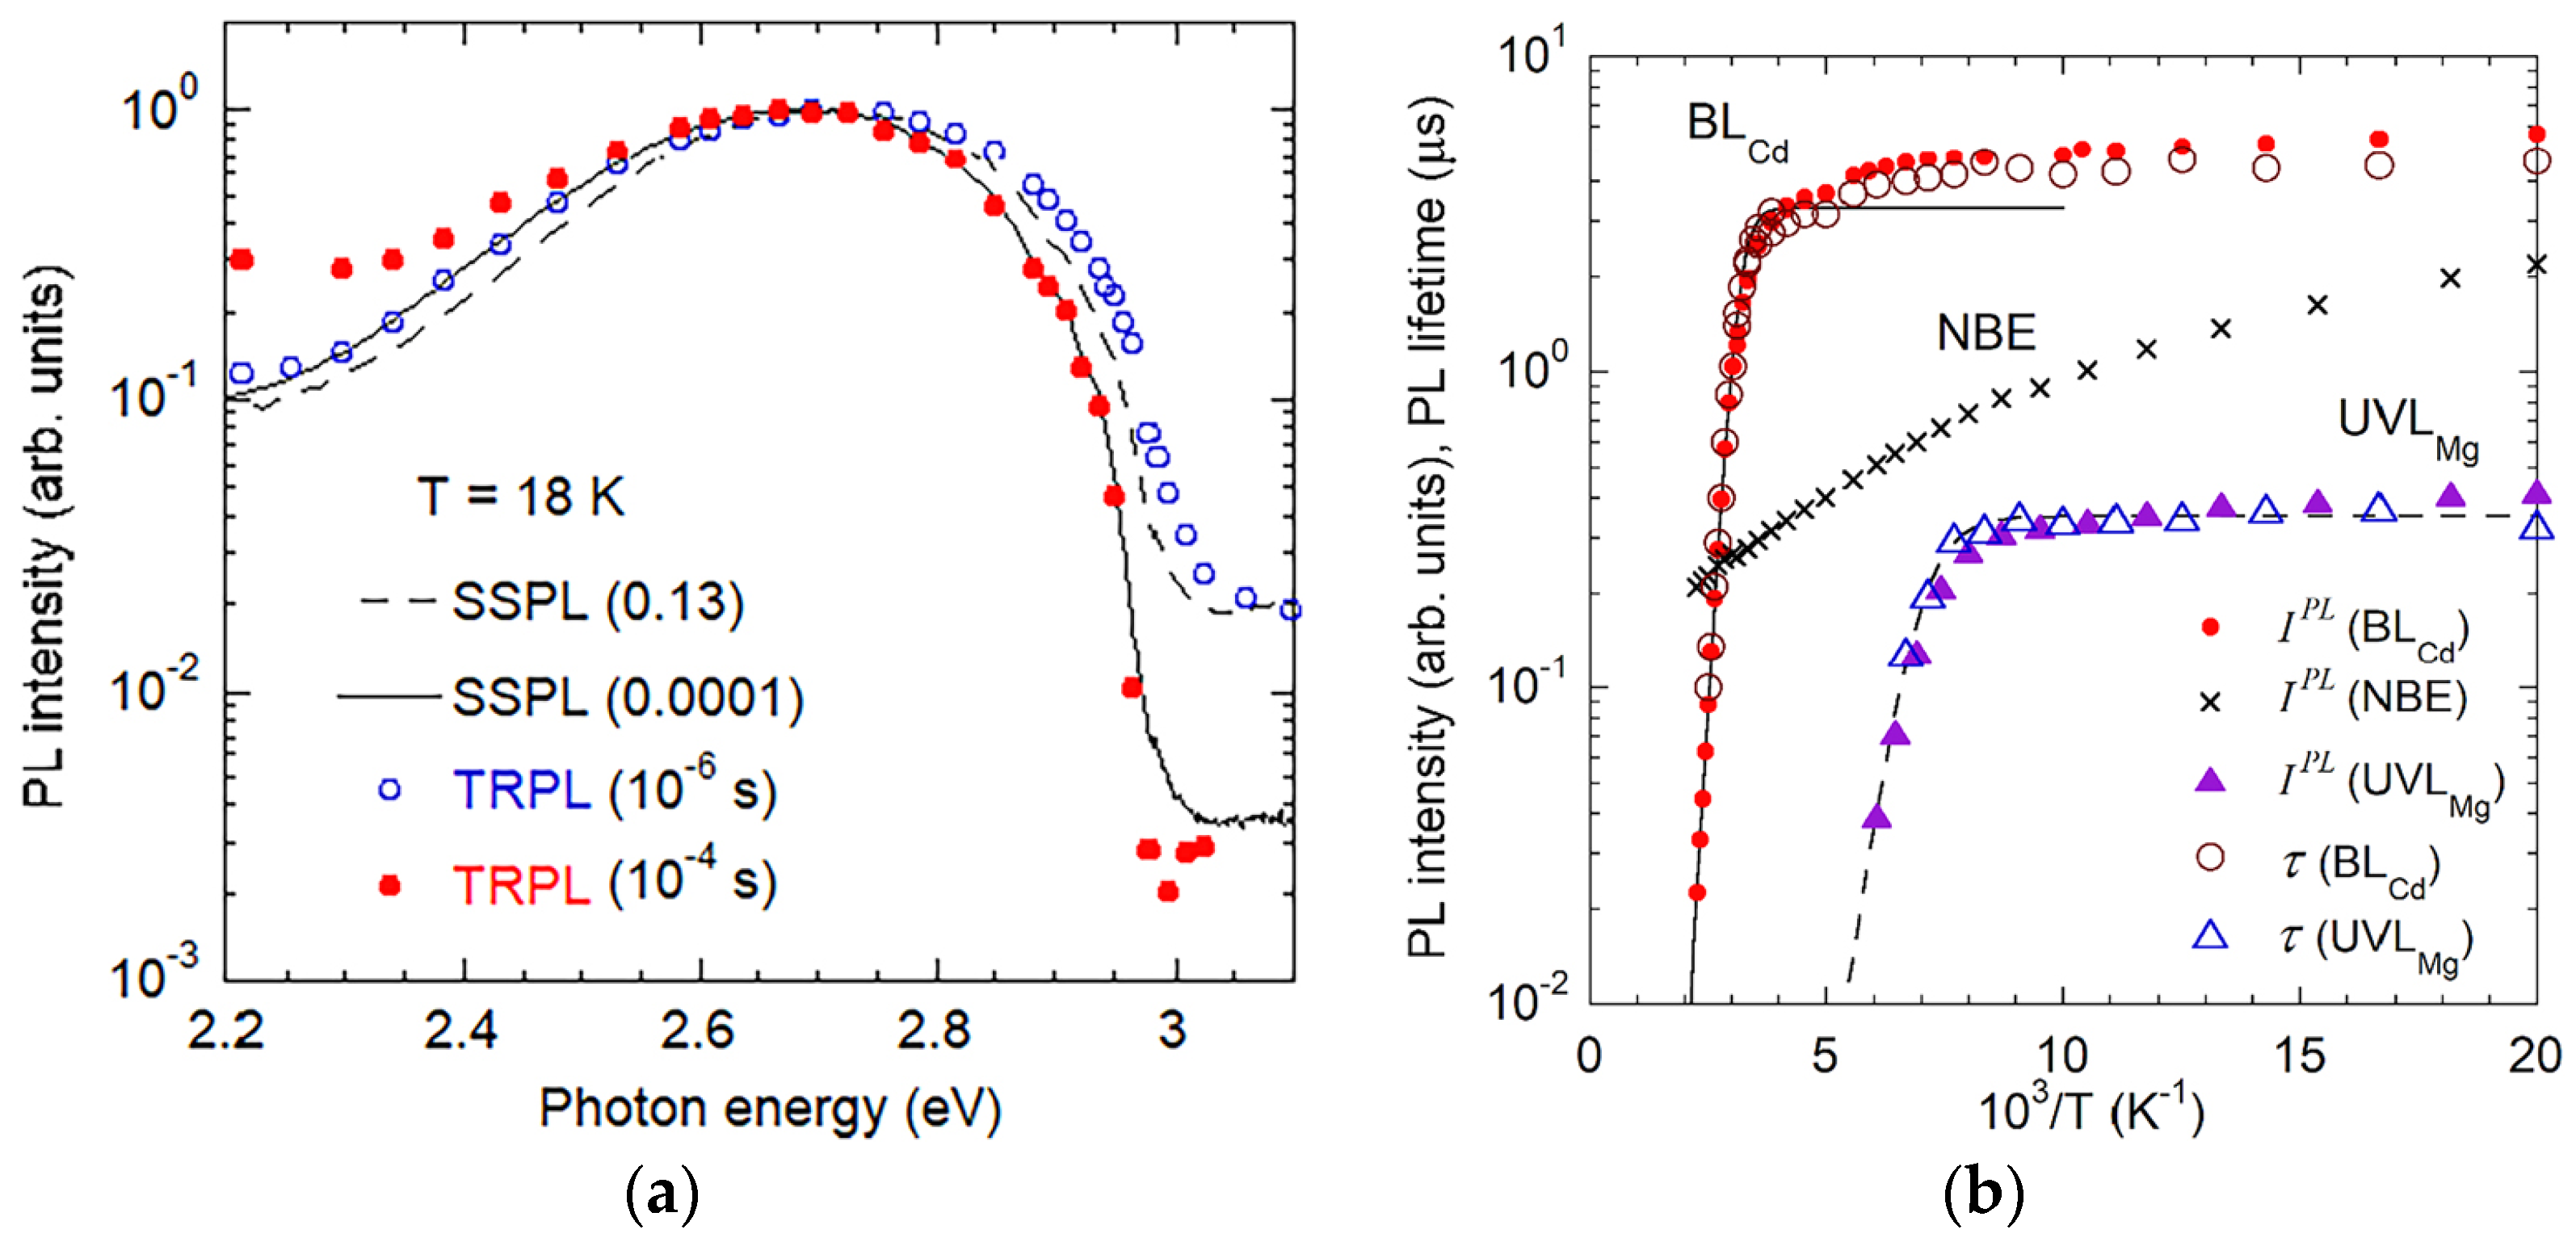
Steady-state PL (SSPL) and time-resolved PL (TRPL) measurements, conducted over a wide range of temperatures and excitation intensities, are basic techniques for probing defect-related luminescence in GaN [16]. Figure 2 illustrates a schematic of a typical PL setup, employing a continuous-wave HeCd laser (λ = 325.03 nm) for SSPL and a pulsed nitrogen laser (λ = 337 nm) for TRPL. Detailed descriptions of the experimental configuration are provided elsewhere [25,66].
Since 2018, an improved approach to PL spectral presentation has been proposed to ensure consistency between experimentally measured spectra and theoretically calculated band shapes [25]. As before, as-measured spectra are corrected for the spectral response of the detection system. In addition, the PL intensity is now scaled by a factor of λ3, where λ is the emission wavelength, so that spectra are expressed in units proportional to the number of emitted photons as a function of photon energy ħω. These corrections are applied to PL spectra throughout this review (except for Figure 18a, Figure 26a, Figure 35, Figure 36, Figure 37a and Figure 39a). Note that positions and shapes of broad PL bands associated with the same defect may vary when measured on different setups unless proper corrections are applied, partly explaining discrepancies in the literature [66].
The internal quantum efficiency (IQE) of individual PL bands, η, can be estimated by integrating the corrected band intensity and comparing it with that of calibrated GaN standards, as described in previous works [34,52,53]. Challenges associated with measuring external quantum efficiency (EQE) of PL and accurately deriving η have recently been addressed in detail [67,68,69,70,71].

2.2. Phenomenological Models for Defect-Related PL in GaN

Phenomenological models, based on rate equations inspired by the Shockley-Read-Hall formalism [72,73], enable the extraction of key parameters from SSPL and TRPL data, thereby facilitating the identification of defect-related PL bands in semiconductors [65,74,75]. These models, refined specifically for defects in GaN [52,53,76,77], describe carrier recombination dynamics and defect properties, including electron- and hole-capture coefficients, ionization energies, and defect concentrations.

2.2.1. TRPL and Electron-Capture Coefficient

The radiative electron-capture coefficient Cn for a defect (Table 1) can be determined from the PL lifetime τ0 when the PL arises from electron transitions from the conduction band to the defect level (e-A transitions). The relationship is given by [65,77]:
C n = 1 n τ 0
where n is the free electron concentration, typically obtained via Hall effect measurements. Once Cn is determined for a specific PL band, it can be used to estimate n in other GaN samples [65]. For not purely exponential PL decay, such as when e-A and donor-acceptor-pair (DAP) transitions overlap, the effective PL lifetime τ0* can be extracted from the maximum of the t·IPL(t) dependence [78].

2.2.2. Temperature Dependence of PL and Hole-Capture Coefficient

The nonradiative hole-capture coefficient Cp for a defect (Table 1) can be derived from the temperature dependence of PL intensity, IPL, or PL lifetime, τ. Above a critical temperature T0, both the IPL and τ decrease exponentially with increasing temperature in an Arrhenius plot—a phenomenon known as PL quenching. For defects in n-type GaN, PL quenching arises from the thermal emission of holes from defect levels to the valence band via the Schön–Klasens mechanism [74]. For PL driven by e-A transitions, the IPL(T) and τ(T) dependences are described with the following expression:
I P L T I P L 0 = τ T τ 0 = 1 1 + C exp E A k T
where C = (1 − η0)τ0 Cp Nv g−1; η0 = η and τ0 = τ at T < T0; Nv = 2(2πmp*kT)3/2h−3 is the effective density of states in the valence band; mp* is the hole effective mass, k is Boltzmann’s constant; g is the defect level degeneracy; and EA is the activation energy (defect ionization energy), equal to the energy difference between the defect level and the VBM plus any potential barrier to hole capture [52,53]. Note that the values of Cp in Table 1 are calculated under the assumption that mp* = 0.8m0 and g = 2. If these parameters differ, Cp must be scaled by a factor of 0.36g(mp*)−3/2. In DLTS measurements, Cp can be found with a similar approach. However, the common practice in DLTS analysis is to calculate the hole-capture cross-section, σp. The two quantities are related via Cp = <vp>σp, where <vp> = (3kT/mp*)1/2 is the mean thermal velocity of holes in the valence band.
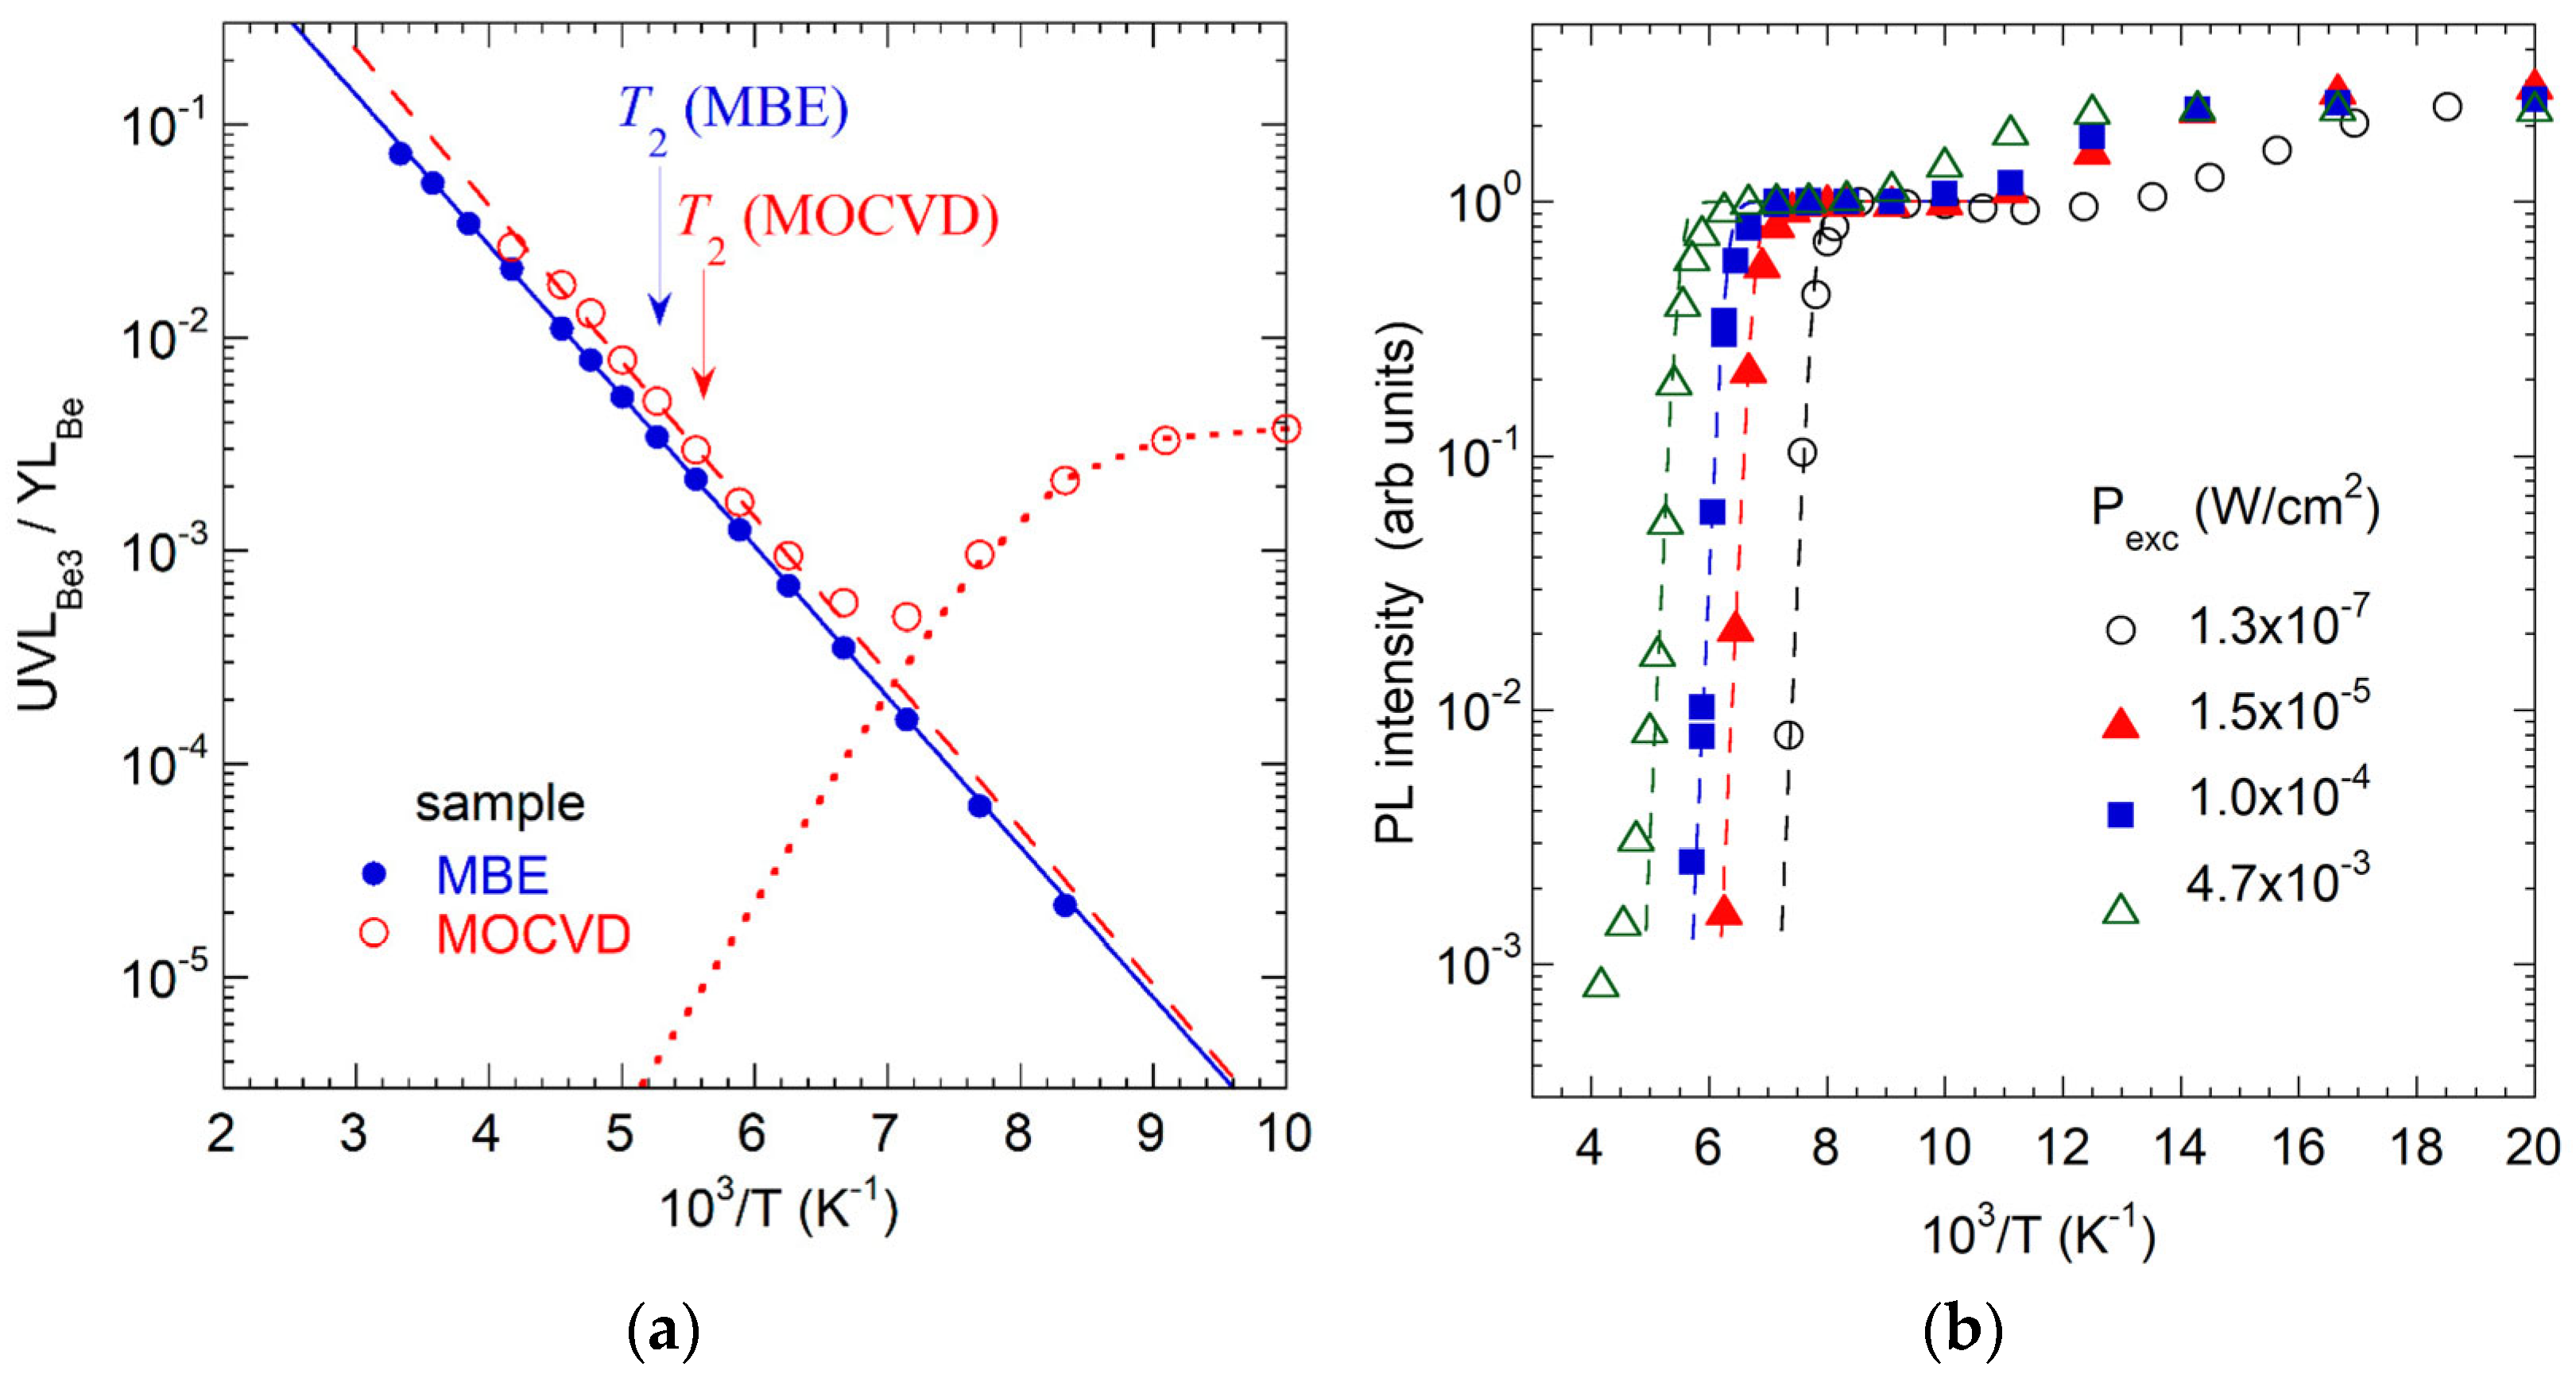
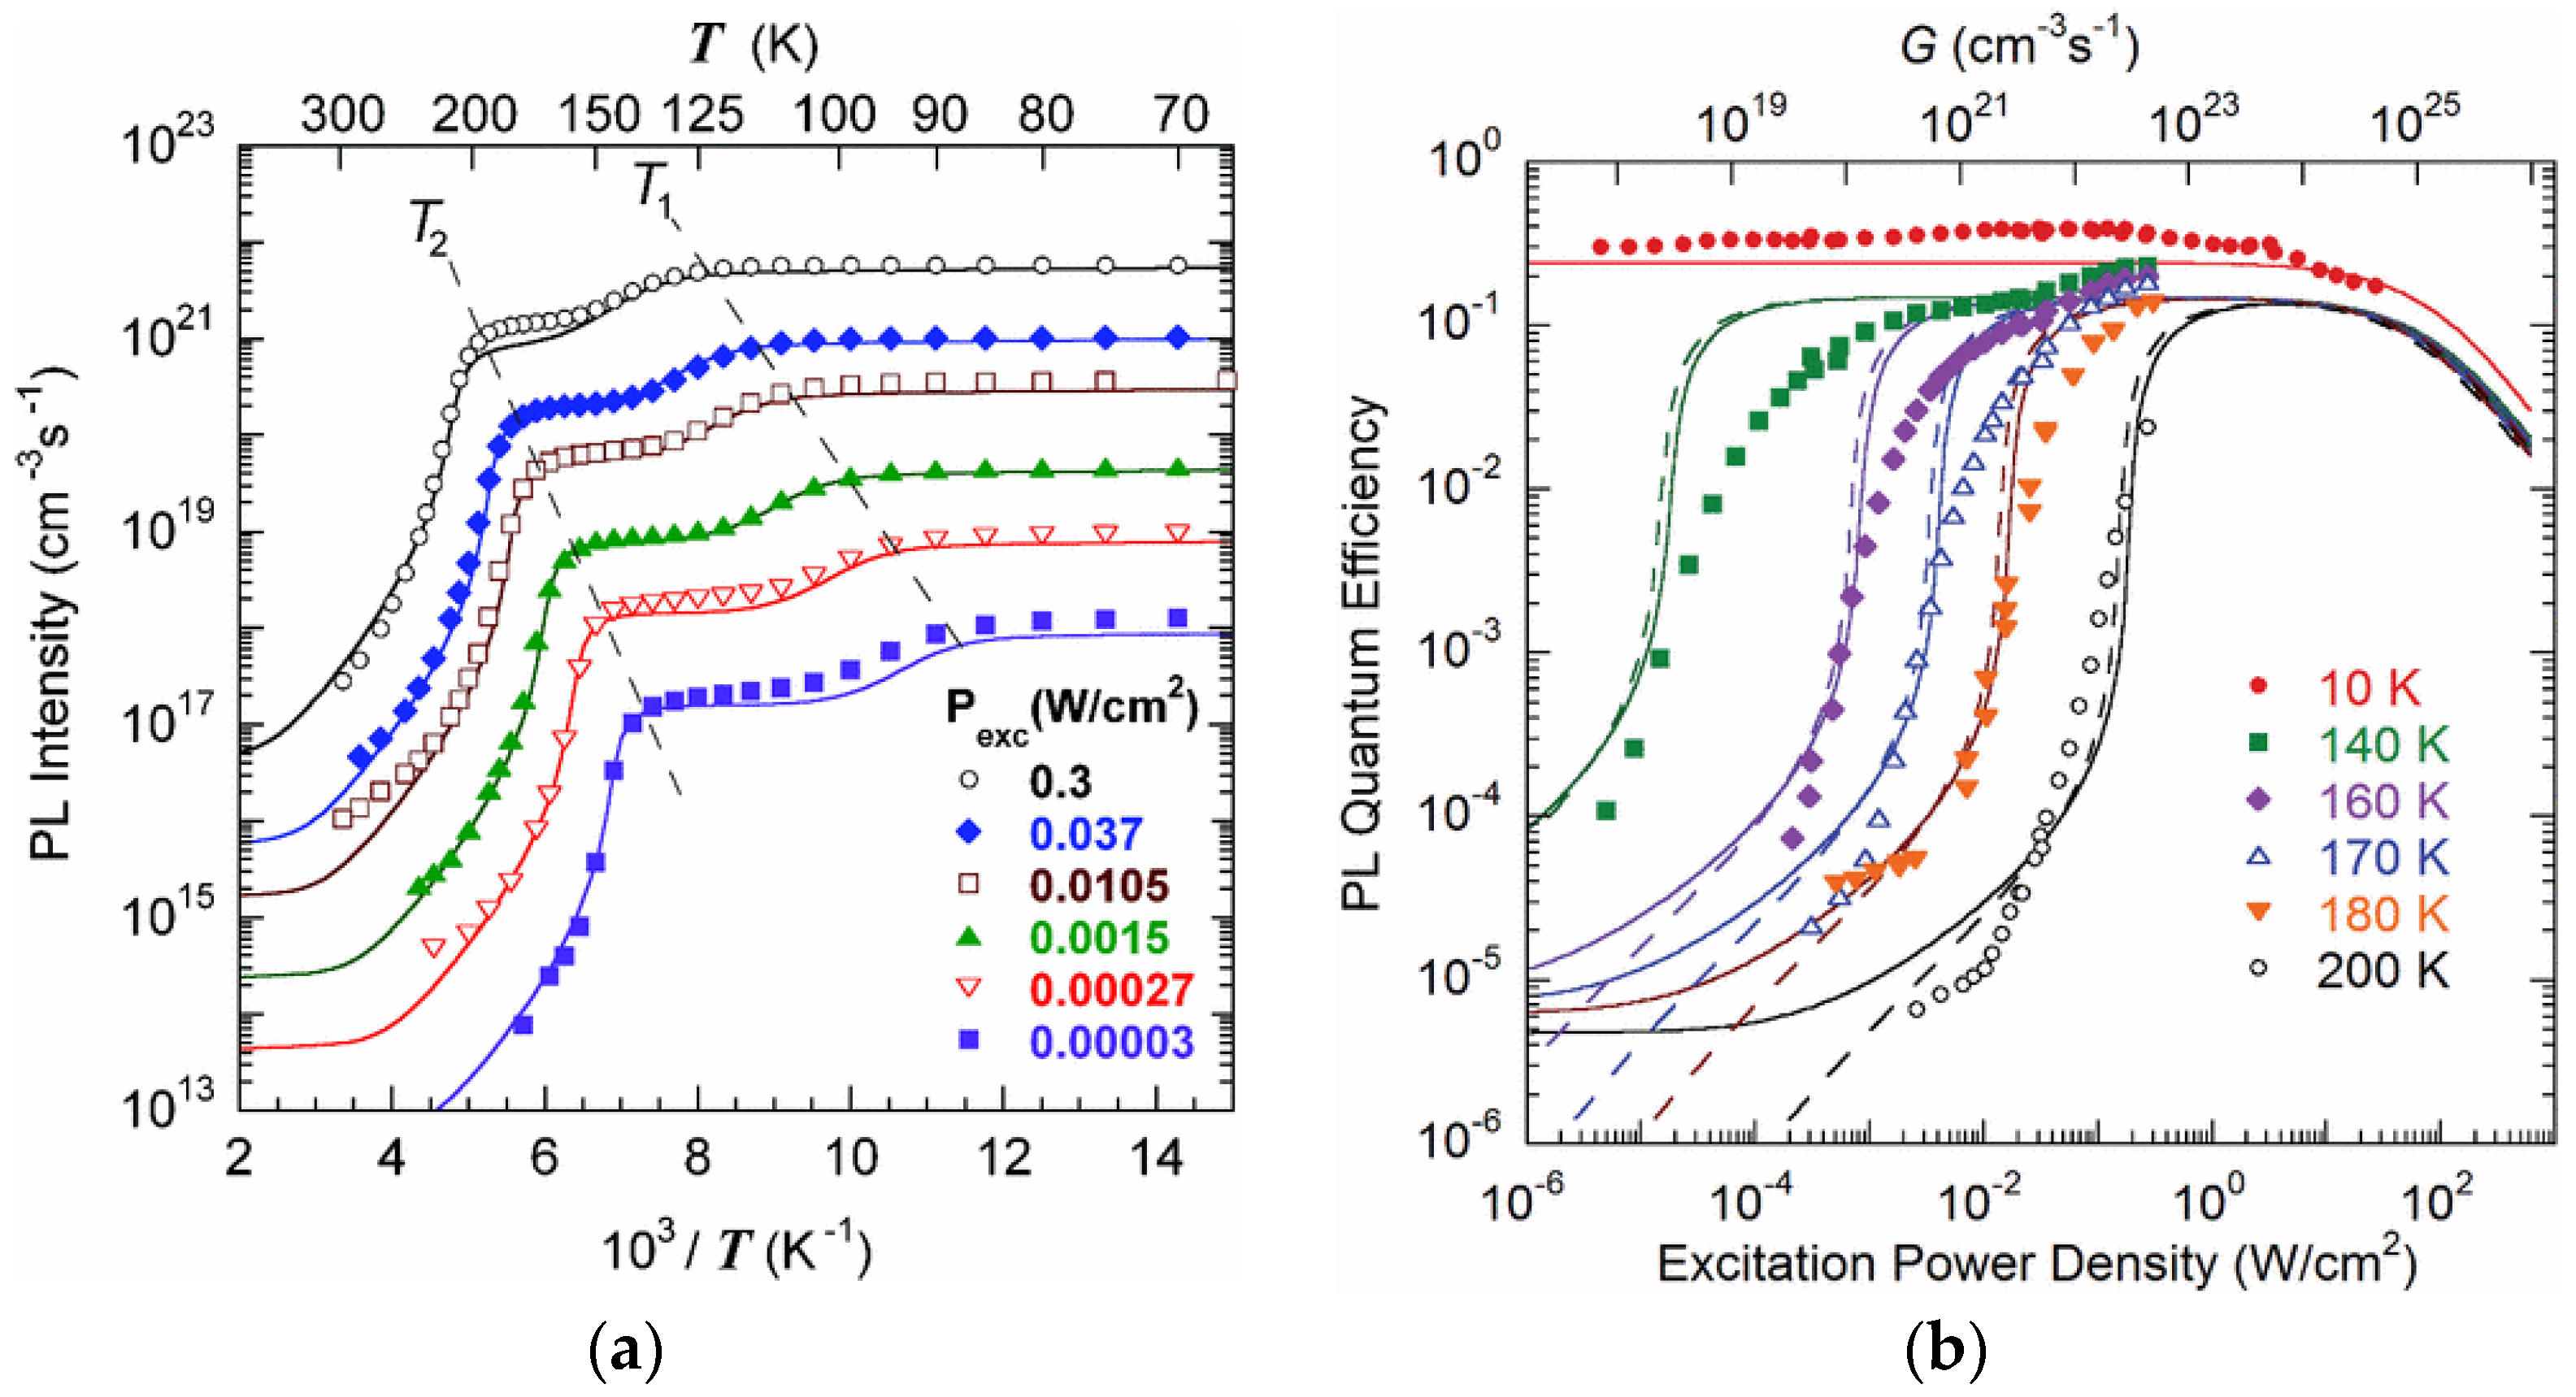
In semi-insulating (SI) GaN, PL quenching often occurs via a tunable and abrupt quenching (TAQ) mechanism [52]. Although IPL(T) can be formally fitted using Equation (2), the parameters C and EA lack direct physical meaning in this case. The apparent EA may significantly exceed the true ionization energy (abrupt quenching), and T0 increases with excitation intensity Pexc (tunable quenching). For such samples, the defect ionization energy is instead obtained from
E A = k T 0 ln B P e x c ,
where B′ depends on Cp and relative concentrations of defects involved in recombination [52]. The nonlinear rate equations governing carrier dynamics in SI semiconductors can lead to counterintuitive behavior, necessitating numerical simulations for accurate analysis [52,79]. The TAQ mechanism resembles a phase transition: at T < T0, recombination (including PL) is dominated by defects with high hole-capture efficiency, whereas at T > T0, defects with faster electron capture dominate in recombination.

2.2.3. Excitation Intensity Dependence

The defect concentration N can be found from the dependence of SSPL intensity on the excitation photon flux, P, modeled as:
I P L ( P ) I 0 P L = η ( P ) η 0 = P 0 P ln 1 + P P 0 ,
where P0 = N(η0ατ0)−1 [80,81]. Here, I0PL and η0 denote the PL intensity and the absolute IQE, respectively, in the limit of low excitation intensity, and α is the absorption coefficient for incident photons (1.2 × 105 cm−1 at 325 nm for GaN [82]). For TRPL, Equation (4) applies with τ0 replaced by the laser pulse duration tL [77]. The accuracy of N is limited by uncertainties in η0 [83]. However, relative defect concentrations for a given sample can be determined with higher precision, as the light-extraction efficiency—a primary source of η0 uncertainty—is approximately the same for different PL bands in a given sample.
Once relative concentrations of radiative defects in a particular sample are known, the relative hole-capture coefficients for PL bands can be obtained because, according to Equation (2),
C p i C p j = I i P L I j P L N j N i
where IiPL/IjPL is the ratio of integrated PL intensities for PL bands i and j at T < T0, and Ni, Nj are the respective defect concentrations. If Cp is known for a reference defect (e.g., the CN acceptor responsible for the YL1 band), Equation (5) enables the determination of Cp for other defects.

2.3. Configuration Coordinate Model for Defect-Related PL

Parameters associated with electron–phonon coupling can be extracted from PL band shapes modeled within a one-dimensional configuration coordinate framework. The spectral shapes of broad PL bands can be fitted using the expression [47]:
I P L ( ω ) = I P L ( ω max ) exp 2 S e E 0 * ω + Δ d F C g 1 2
Here, Se is the Huang–Rhys factor for the excited state of the defect, dFCg = E0* − ħωmax is the Franck–Condon shift in the ground state, E0* = E0 + 0.5ħΩe, E0 is the zero-phonon line (ZPL) energy, ħΩe is the effective phonon mode energy in the excited state, ħω is the photon energy, ħωmax is the PL band maximum, and Δ is a sample-dependent energy shift (<20 meV) arising from factors such as in-plane biaxial strain in GaN thin layers on sapphire substrates or local electric fields. Typical values of these parameters for broad PL bands are summarized in Table 2.
Note that, unless the ZPL is explicitly identified, parameters E0* (or dFCg) and Se remain ambiguous; namely, similar PL band shapes can be obtained by simultaneous increase (or decrease) of these parameters [34]. Nevertheless, three parameters from Table 2 (e.g., E0*, ħωmax, and Se) are sufficient to define bands’ positions and shapes, allowing distinctive defect-related PL bands in GaN to be recognized (provided appropriate corrections are applied to as-measured low-temperature PL spectra), and overlapped PL bands to be deconvoluted.
The effective phonon energy ħΩe can be extracted from the temperature dependence of the PL band’s full width at half maximum (FWHM), W(T). For a Gaussian-like PL band shape, the FWHM is modeled by [16,47]:
W T = W 0 coth Ω e 2 k T
where W0 is the FWHM at T = 0. Values of W0 and ħΩe for selected broad PL bands are listed in Table 2.

2.4. Electron Transition Mechanisms

Analysis of PL provides insights into the nature of electronic transitions responsible for defect-related luminescence [66]. In n-type GaN, at low temperatures (T < 50 K), most PL bands originate from DAP recombination, involving shallow donors and various acceptors [84,85]. The high efficiency of the DAP transitions at low temperatures arises from the extended electron wavefunctions for shallow donors, which overlap substantially with acceptor states. These PL bands exhibit a blueshift of up to ~10 meV as excitation intensity Pexc increases from 10−5 to 0.3 Wcm−2 [16,40,44,62], since emission from distant DAPs, contributing at lower photon energies due to weaker Coulomb interactions, saturates at lower Pexc. The PL decay following a laser pulse is nonexponential in this regime (often exhibiting the t−m dependence with m ≈ 1), reflecting the distribution of DAP separations [85]. At elevated temperatures, transitions from the conduction band to the same acceptors (the e-A transitions) dominate, gradually replacing DAP recombination. In this regime, the PL decay becomes exponential, with a characteristic lifetime τ0, which is inversely proportional to the concentration of free electrons, see Equation (1).
PL from deep donors in GaN is typically caused by internal transitions: from an excited state (located near the conduction band) of a positively charged donor to its ground state [66]. These transitions yield exponential PL decays even at very low temperatures, with τ0 independent of n (Table 1).
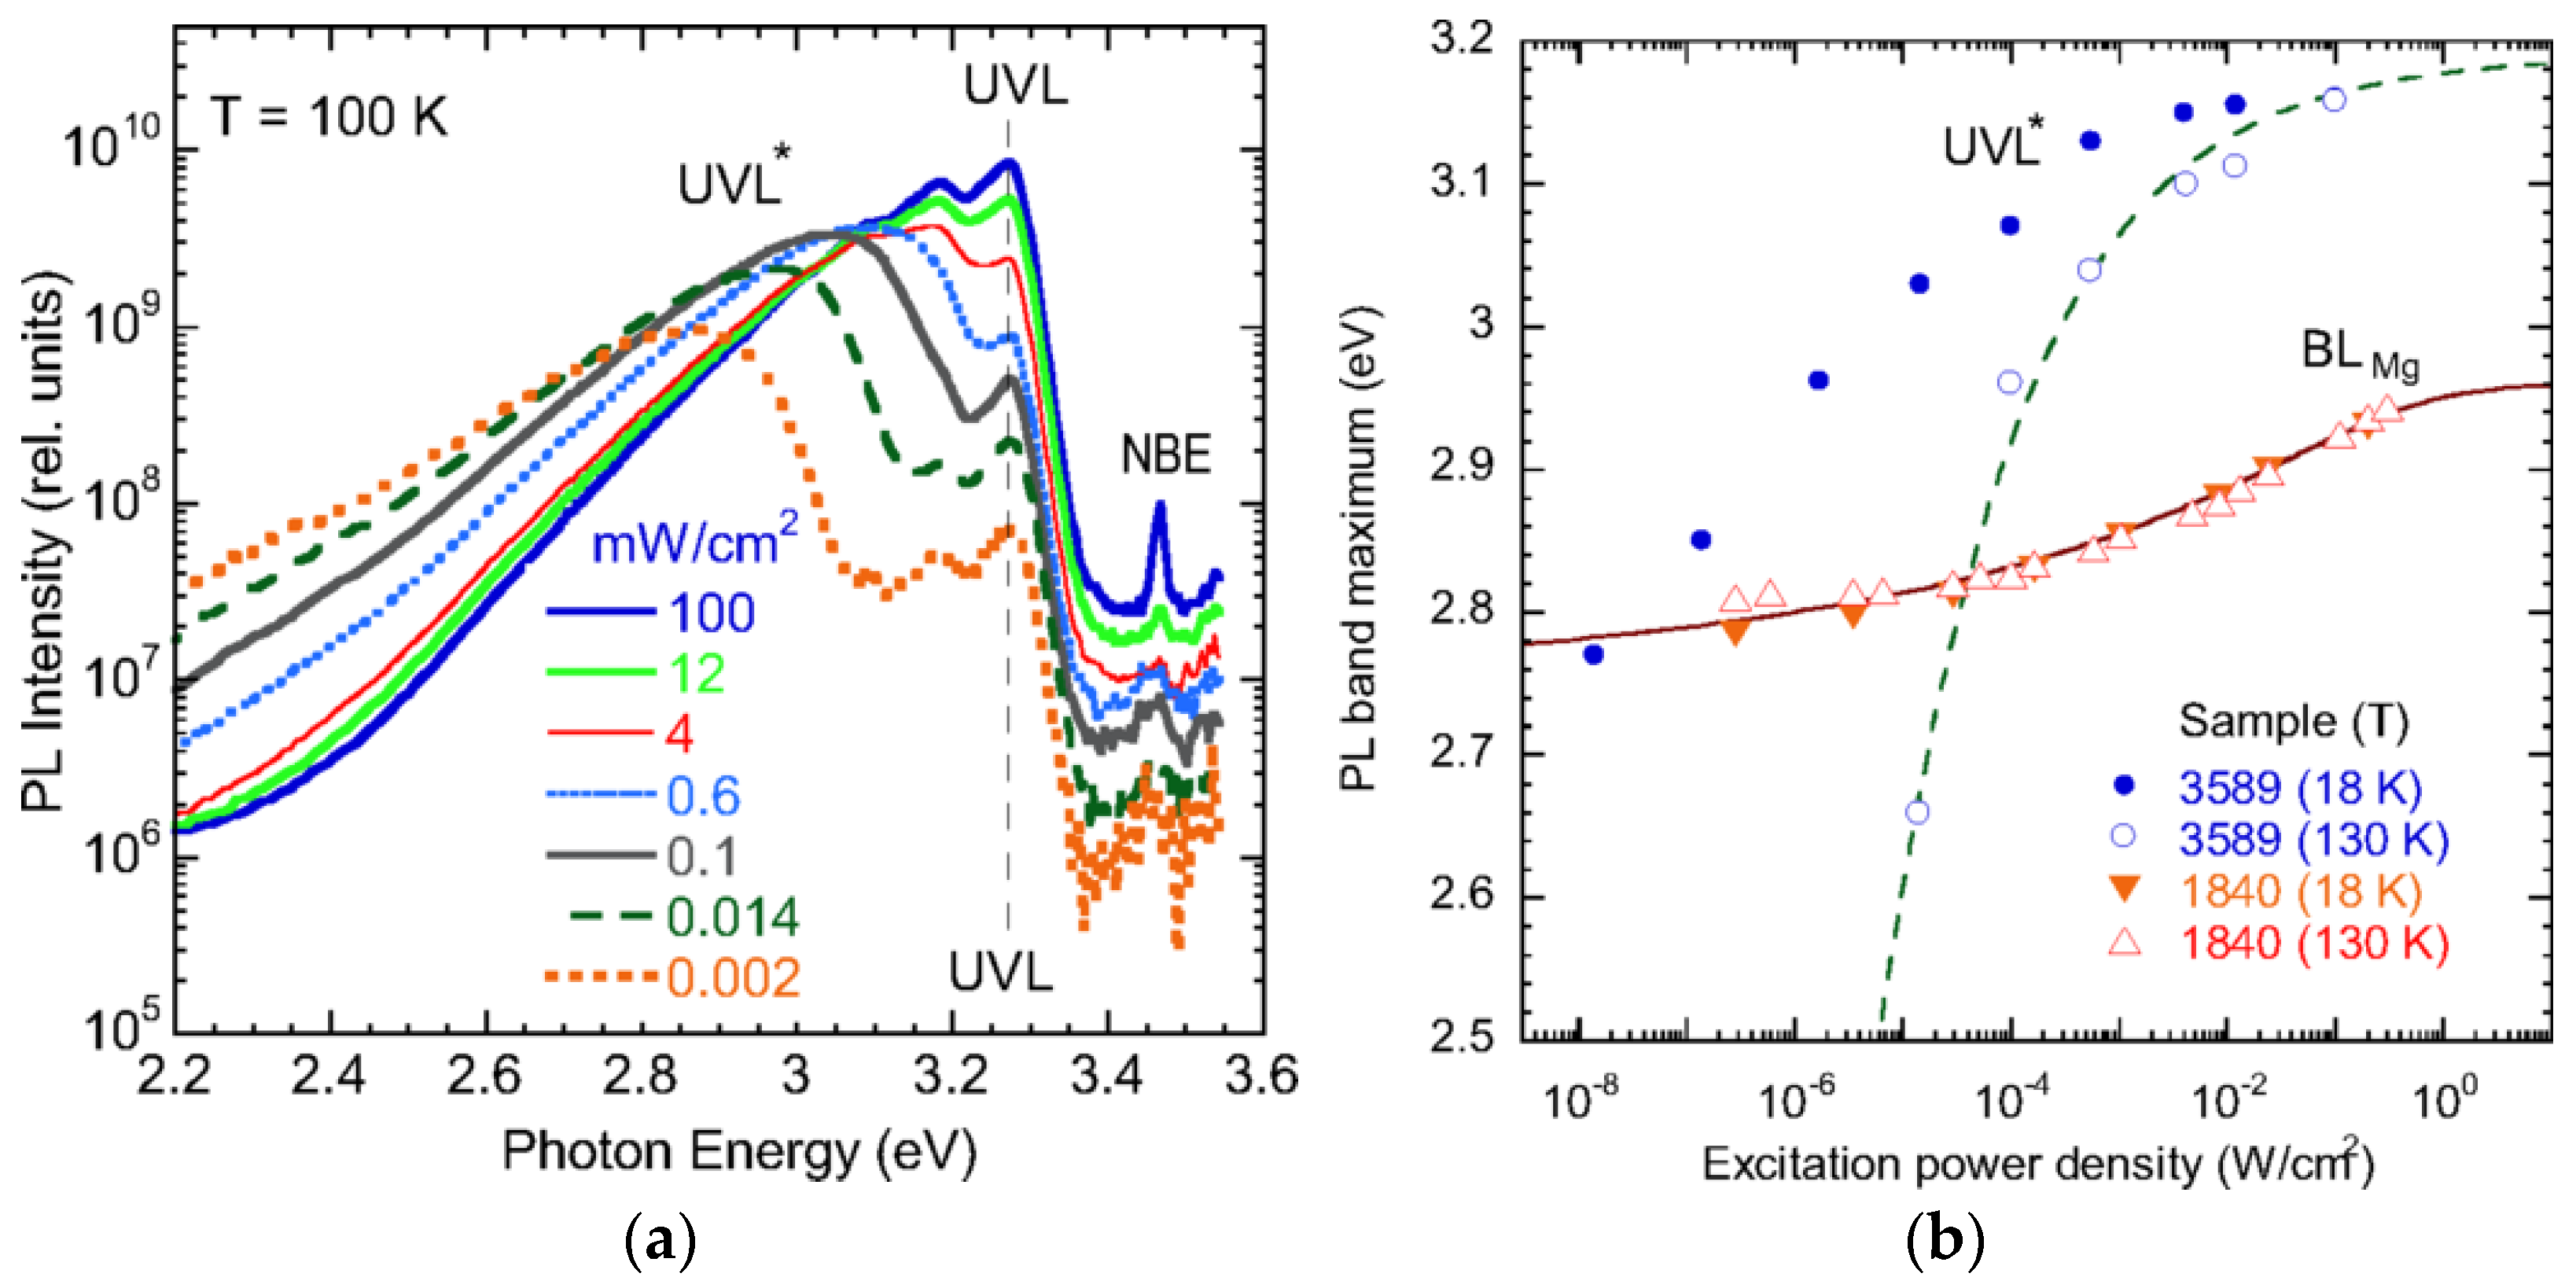
DAP transitions involving deep donors are rarely observed in GaN. A notable exception is the BLMg band, which shifts from ~2.8 to 2.94 eV as Pexc increases from 10−6 to 0.3 Wcm−2 [62]. This band is attributed to electron transitions from an unidentified deep donor to the shallow MgGa acceptor, as discussed in Section 4.3.3. The strongly localized electron wavefunction for the deep donor requires small DAP separations for efficient recombination, thereby restricting the BLMg band to heavily Mg-doped GaN ([Mg] > 1018 cm−3) [62]. Note that large PL band shifts (up to 0.5 eV) with varying Pexc may also arise from potential fluctuations in SI GaN or due to local electric fields induced by structural defects or the surface [54]. For instance, the UVLMg band can exhibit a giant redshift and broadening with decreasing Pexc, potentially causing confusion with the BLMg band [54,62].

3. Luminescence Associated with Defects in Undoped GaN

Over the past two decades, there has been significant progress in explaining defect-related PL in undoped GaN and resolving longstanding controversies, most notably the origin of the yellow luminescence (YL) band. Several PL bands in nominally undoped GaN arise from unintentional impurities such as MgGa, ZnGa, CaGa, and CN, which are responsible for the UVL, BL1, GLCa, and YL1 bands, respectively. Additionally, the GL2 and RL2 bands, observed in SI GaN, have been attributed to VN and the VN-acceptor complexes. Conversely, the RL1 and GL1 bands in GaN grown by hydride vapor phase epitaxy (HVPE) technique remain unidentified, though a better understanding has emerged. A novel defect, tentatively assigned to Fe and labeled RY3, has recently been recognized in undoped HVPE GaN. Importantly, VGa-related defects have been ruled out as sources of any observed PL bands in undoped GaN. The following sections classify defect-related PL bands in undoped GaN by color and provide concise analyses.

3.1. Yellow Luminescence in Undoped GaN (YL1, YL2, YL3)

3.1.1. Historical Overview

The YL band with a maximum at about 2.2 eV is the dominant defect-related PL feature observed in both undoped and doped GaN across various growth techniques, including HVPE, metal–organic chemical vapor deposition (MOCVD), and molecular beam epitaxy (MBE) [41]. Its microscopic origin, a subject of debate for nearly four decades, has now been conclusively identified. Early studies by Ogino and Aoki [86] provided compelling evidence linking the YL band to carbon impurities. In contrast, Pankove and Hutchby [87] observed the YL band in GaN implanted with 35 different ions, with negligible intensity in unimplanted controls, suggesting that implantation-induced native defects, such as VGa, were responsible for it. Supporting this view, early DFT calculations predicted that electron transitions from the conduction band to deep acceptor levels, namely the 3−/2−level of VGa and the 2−/− level of the VGaON complex, calculated at ~1.1 eV above the VBM, caused the YL band [22]. PAS experiments further seemed to support this model by suggesting a correlation between YL intensity and VGa concentration [28]. During this period, multiple competing hypotheses were proposed regarding both the identity of the defect responsible for YL and the nature of the optical transition involved [16].
Nevertheless, accumulating experimental evidence pointed to carbon as the source of the YL band [88]. Although early DFT calculations misidentified CN as a shallow acceptor with a predicted −/0 level at ~0.2 eV above the VBM [20,22], more accurate hybrid functional DFT calculations have since corrected this assignment. These modern calculations place the CN −/0 transition level at 0.9 eV above the VBM, confirming that CN acts as a deep acceptor and is the primary candidate for the YL band [24].
At one point, a widely accepted view prevailed that several distinct defects could produce YL bands with similar shapes and positions [29,89,90,91,92]. In particular, Armitage et al. [89] suggested that the YL band in undoped GaN originates from VGa-related defects, while a nearly indistinguishable YL band in C-doped GaN is caused by C-related defects. However, current experimental evidence definitely attributes the YL band at ~2.2 eV in undoped GaN—referred to as YL1—to the isolated CN acceptor. The prominence of YL1 is especially notable in GaN grown by MOCVD, where residual carbon contamination is unavoidable. Nonetheless, the YL1 band may also be observed in HVPE- and MBE-grown GaN, even when carbon levels fall below the SIMS detection limit of ~1016 cm−3. The prominence of the YL band stems from the high hole-capture efficiency of CN acceptors, which outcompete nonradiative or weakly radiative defects introduced by contamination, doping, or ion implantation.
Additional yellow luminescence bands include the YLBe band, induced by intentional doping or implantation with Be (Section 4.2.2), and the YL2 band, observed in bulk GaN crystals grown by ammonothermal (AT) method (Section 3.1.3). The YL3 band, exclusive to Fe-contaminated HVPE GaN, is discussed in Section 3.1.4. The VGa and VGaON defects are not associated with any observed PL bands in GaN (Section 3.1.5).

3.1.2. CN-Related YL1 Band

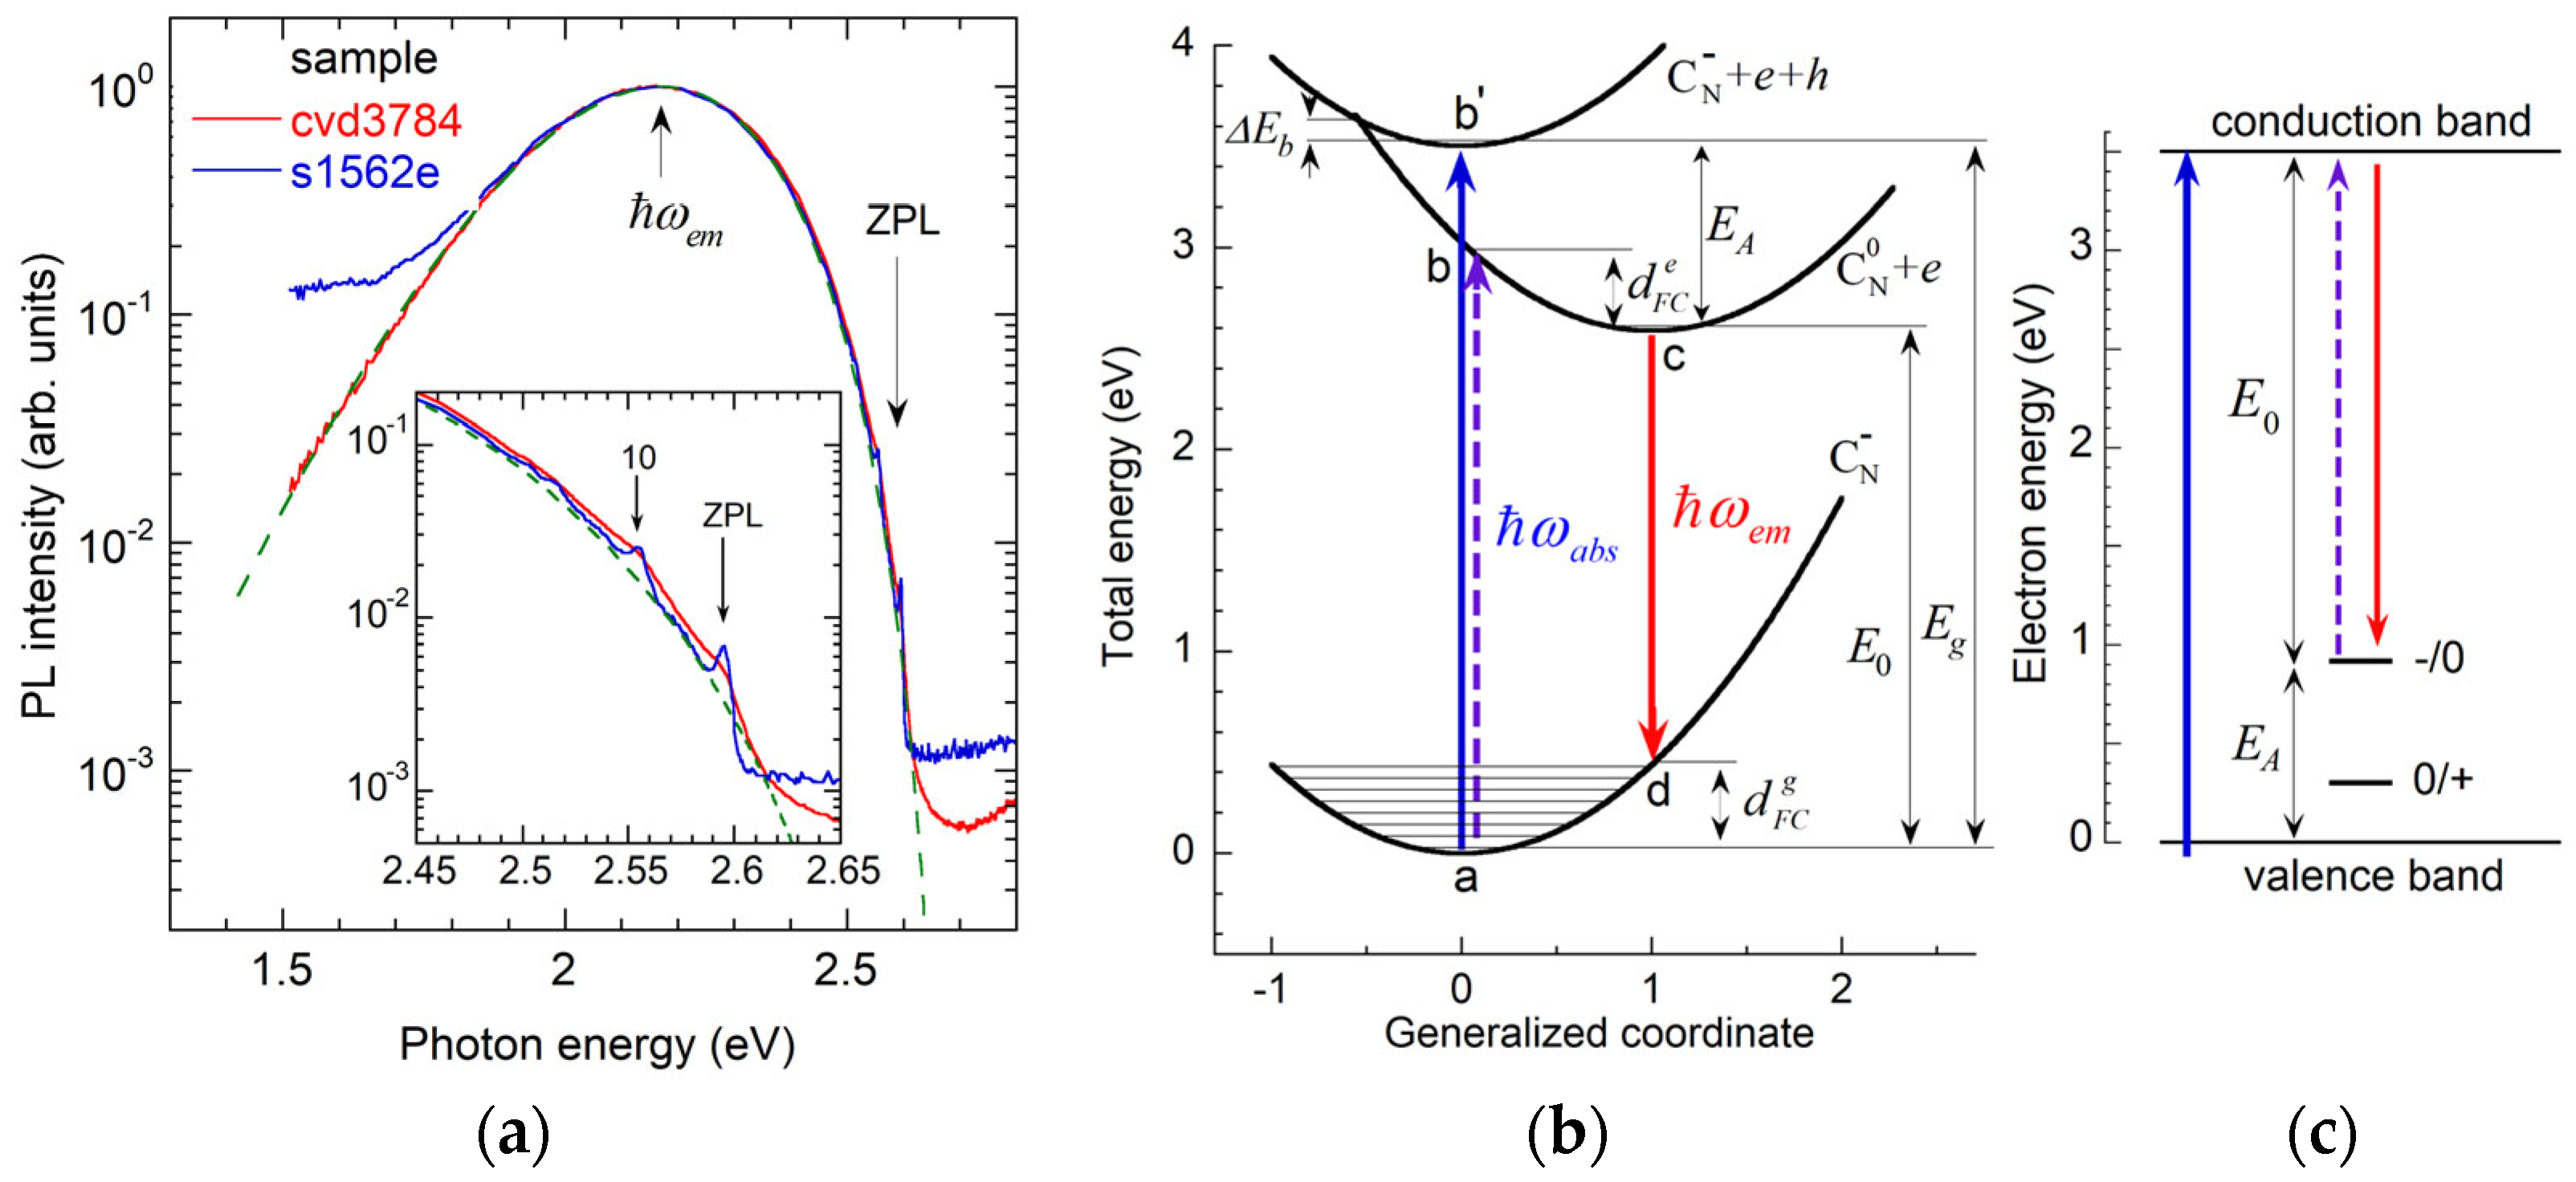
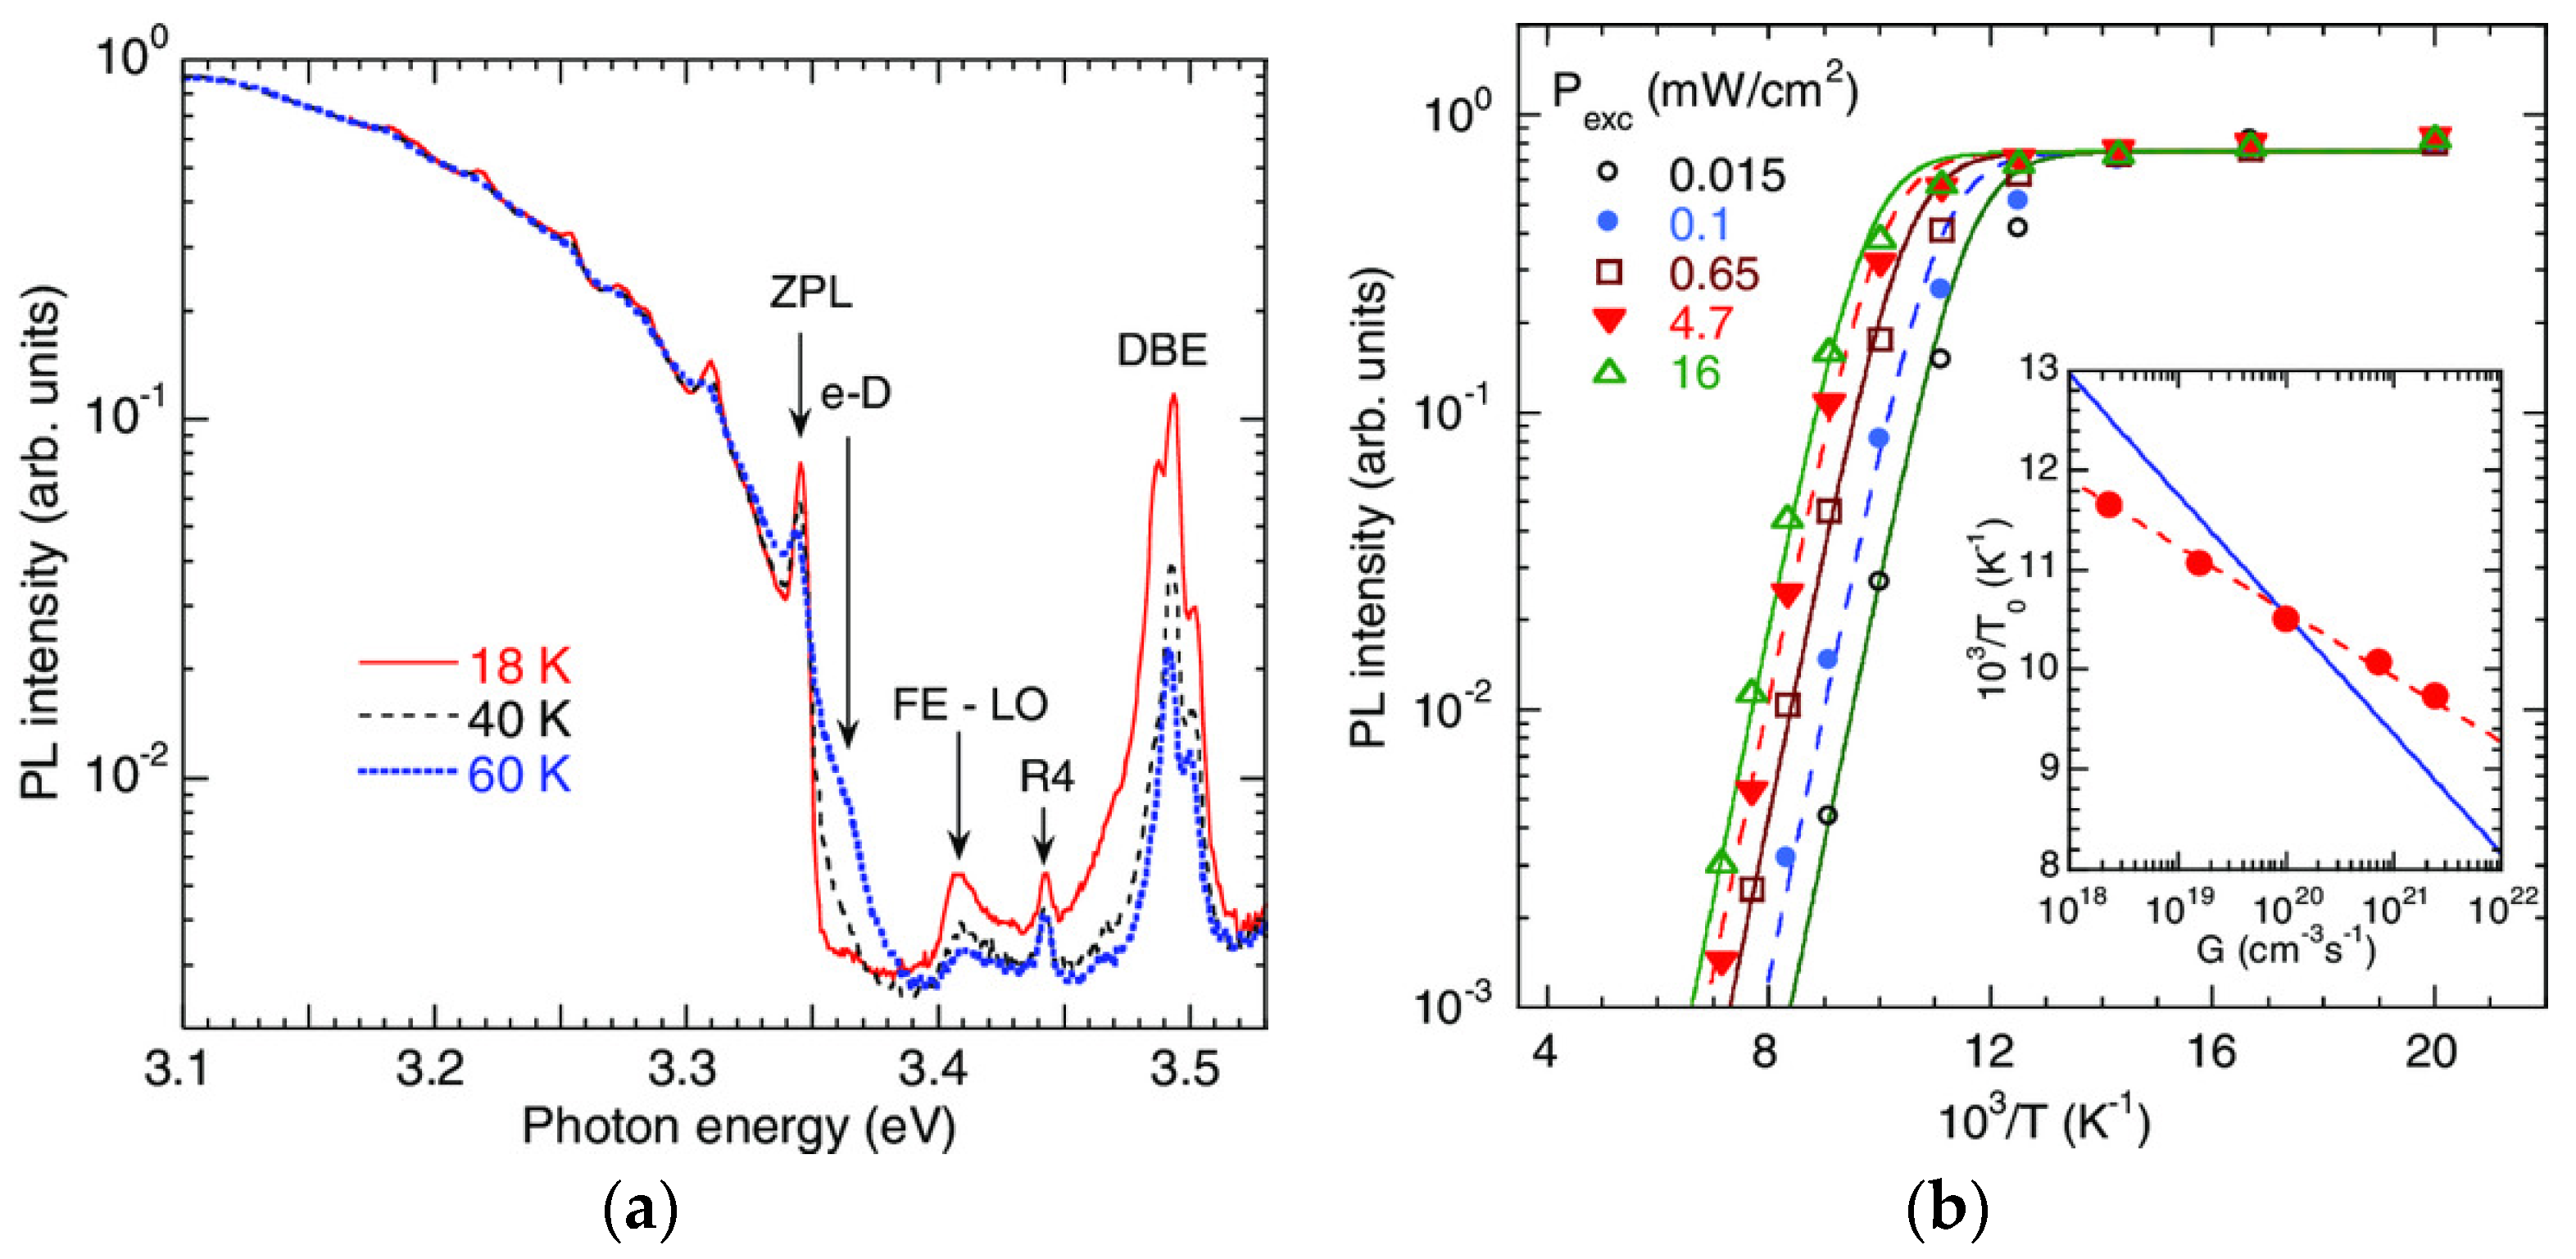
The YL1 band, attributed to the CN acceptor, exhibits distinctive spectral features [41]. At low temperatures (T < 40 K), it has a maximum at 2.17 ± 0.05 eV, with a slightly asymmetric shape, and a FWHM of about 0.43 eV when well resolved (Figure 3a). In high-quality samples with minimal spectral overlap from other PL bands, a sharp ZPL can be resolved at 2.57 eV. At these low temperatures, the YL1 band arises from DAP recombination, specifically electron transitions from shallow donors to the −/0 level of CN, located at 0.916 ± 0.003 eV above the VBM [40].
At higher temperatures (T > 50 K), electrons are thermally excited from shallow donors to the conduction band, and e-A transitions contribute to the YL1 band. The CN defect also exhibits a 0/+ transition level at 0.33 eV above the VBM, which is responsible for the BLC band (Section 4.1.1).
The YL1 band can be excited with photons below the bandgap, down to ~2.7 eV. Early PL excitation (PLE) studies modeled the PLE band of YL1 with a Gaussian shape, estimating a characteristic photoabsorption energy ħωabs between 3.19 and 3.32 eV [86,93]. However, for transitions from a defect to the conduction band, the excitation band is asymmetric due to the continuum of conduction band states [94], yielding a corrected value of ħωabs = 3.00 ± 0.05 eV [66].
From combined PL and PLE analyses, Ogino and Aoki predicted the ZPL of the YL1 band at 2.64 ± 0.05 eV [86]. More recent studies have directly observed the ZPL at 2.57 eV (at T < 40 K) [40]. The ZPL blue-shifts with increasing excitation intensity, consistent with the DAP recombination mechanism. At higher temperatures, an e-A-related ZPL emerges at 2.59 eV. In some undoped GaN samples (presumably with a low concentration of shallow donors), the e-A-related ZPL dominates already at T = 18 K [41]. Subtracting a smooth shape of the YL1 band reveals phonon replicas, including the longitudinal optical (LO) phonon mode at 91.5 ± 0.5 meV and a pseudo-local phonon mode at 39.5 ± 0.5 meV (Figure 4).
In TRPL experiments, the YL1 band in nondegenerate n-type GaN samples exhibits nonexponential decay at T < 50 K, consistent with DAP recombination dynamics, gradually transitioning to exponential decay at higher temperatures due to the increasing contribution of e-A recombination [78]. In degenerate n-type GaN samples, e-A transitions dominate at all temperatures. The effective PL lifetime τ0, is inversely proportional to the free electron concentration n (Figure 5), yielding an electron-capture coefficient Cn = (1.1 ± 0.2) × 10−13 cm3s−1 for the YL1 band [41,65]. Knowing this parameter, the concentration of free electrons can be found in GaN samples from TRPL measurements [65].
Thermal quenching of the YL1 band occurs well above room temperature. In conductive n-type GaN, its temperature dependence follows Equation (2) with EA ≈ 0.9 eV. The critical temperature T0, at which the PL quenching begins, is T0 = EA(klnC)−1. From the PL quenching, the temperature-independent hole-capture coefficient Cp is determined as (3.5 ± 1.5) × 10−7 cm3s−1 (assuming g = 2 and mp = 0.8 m0). The YL1 band broadens with increasing temperature in agreement with Equation (7), and analysis of the temperature dependence of the band width W(T) yields an effective phonon energy ħΩe = 56 ± 2 meV [41]. In SI GaN samples, the YL1 quenching follows the TAQ mechanism [52]. The T0 shifts with excitation intensity, and EA ≈ 0.9 eV can be found from Equation (3) [95].
Similar to PL from other acceptors in GaN, the YL1 band exhibits excitation intensity-dependent shifts. In conductive n-type GaN samples, the YL1 band blueshifts by up to 10 meV with increasing Pexc over several orders of magnitude at low temperatures, consistent with the DAP recombination model. In SI or heavily Si-doped GaN samples, the YL1 band may blue-shift by as much as 0.1 eV with increasing Pexc due to screening of potential fluctuations by photogenerated charge carriers [54]. A redshift in the YL1 band with a time delay after a laser pulse is also observed in TRPL measurements. The YL1 band saturates with increasing Pexc in agreement with Equation (4), enabling estimation of CN defect concentrations [41,80].
Hybrid functional DFT calculations accurately reproduce key properties of the CN-related YL1 band [24,96,97,98,99]. Theoretical predictions include a ZPL energy E0 = 2.48–2.71 eV, a band maximum ħωmax = 2.01–2.18 eV, the −/0 level at EA = 0.78–1.1 eV, and characteristic resonant excitation energy ħωabs = 2.91–3.04 eV, in close agreement with experimental values (E0 = 2.59 eV, ħωmax = 2.19 eV for e-A transitions, EA = 0.916 eV, and ħωabs = 3.0 eV [40,41]). Calculations predict a classical barrier for hole capture by CNEb = 0.49–0.73 eV with the calculated −/0 level at 1.02 eV [100,101]), which is expected to cause a pronounced temperature dependence of Cp. However, experimentally, the YL1 intensity (which is proportional to Cp) remains nearly constant from very low temperatures up to T0, suggesting a negligible capture barrier (Figure 3b). Other parameters of the configuration coordinate model extracted from experimental data are also close to theoretical predictions. In particular, the experimental Huang–Rhys factor Se = 8 ± 1 [41] agrees with the calculated Se = 10.3 [102].
Attempts to assign defects by formally matching theoretical predictions and experimental data are common [96,103], and they often lead to errors [104]. A recent example includes the incorrect attribution of the YL1 band to the CNON complex [105]. First-principles calculations in that study predicted PL band maxima for the CN and CNON defects at 1.88 eV and 2.25 eV, respectively. The YL1 band with a maximum at ~2.2 eV was accordingly attributed to the CNON complex [105]. This attribution gained some theoretical support [106], but was subsequently challenged [98,103,107]. According to current advanced calculations, the concentration of isolated CN defects should be orders of magnitude higher than that of the CNSiGa and CNON complexes, and PL bands from these complexes are predicted at higher photon energies (at 2.23–2.71 eV) [98,103,106]. Finally, experimental evidence consistently supports CN as the sole contributor to the YL1 band, with no signatures of CNON or CNSiGa in PL spectra [25,41], likely due to their low concentrations and/or low hole-capture efficiencies (Section 4.1.4).

3.1.3. YL2 Band in Ammonothermal GaN

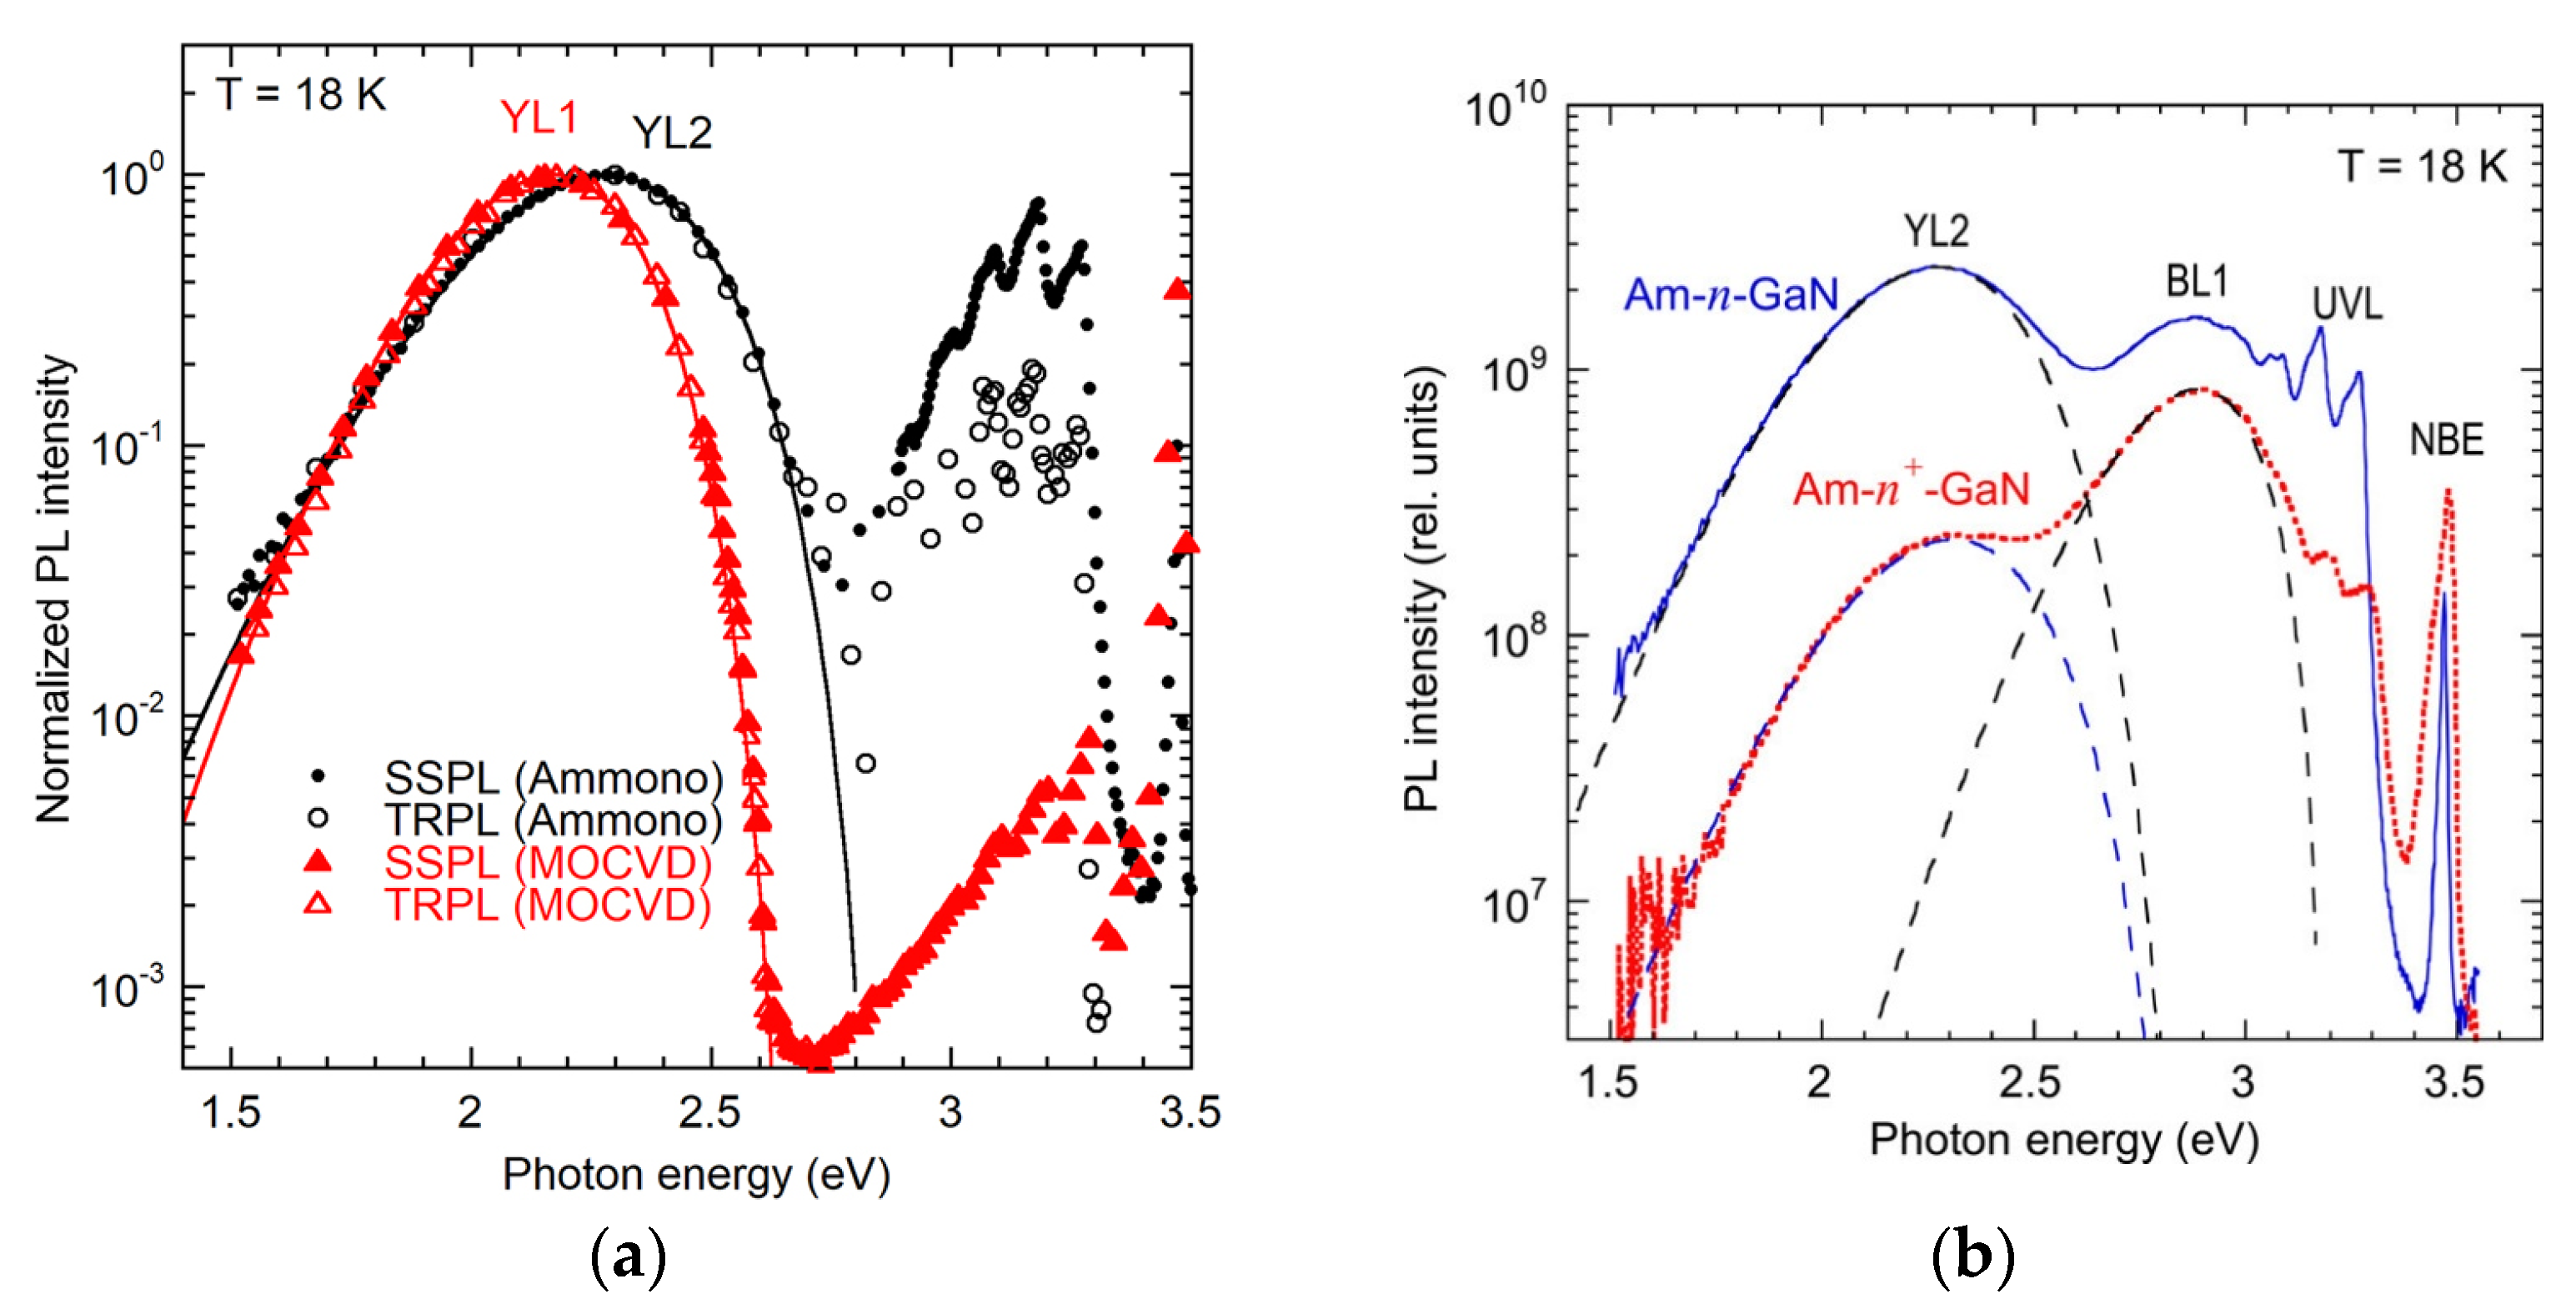
Unlike GaN layers deposited on sapphire substrates by MOCVD, MBE, or HVPE techniques, bulk GaN crystals grown by the AT method contain high concentrations of VGa or VGa-related complexes [108,109,110,111]. These samples are typically degenerate n-type (n = 1018–1019 cm−3), contain high concentrations of O and H (1018–1019 cm−3), as well as significant levels of Si, C, Mg, and Zn (~1017 cm−3) [111]. Their PL spectra contain Mg-related UVL, Zn-related BL1, and a new yellow band at ~2.3 eV, designated YL2 (Figure 6).
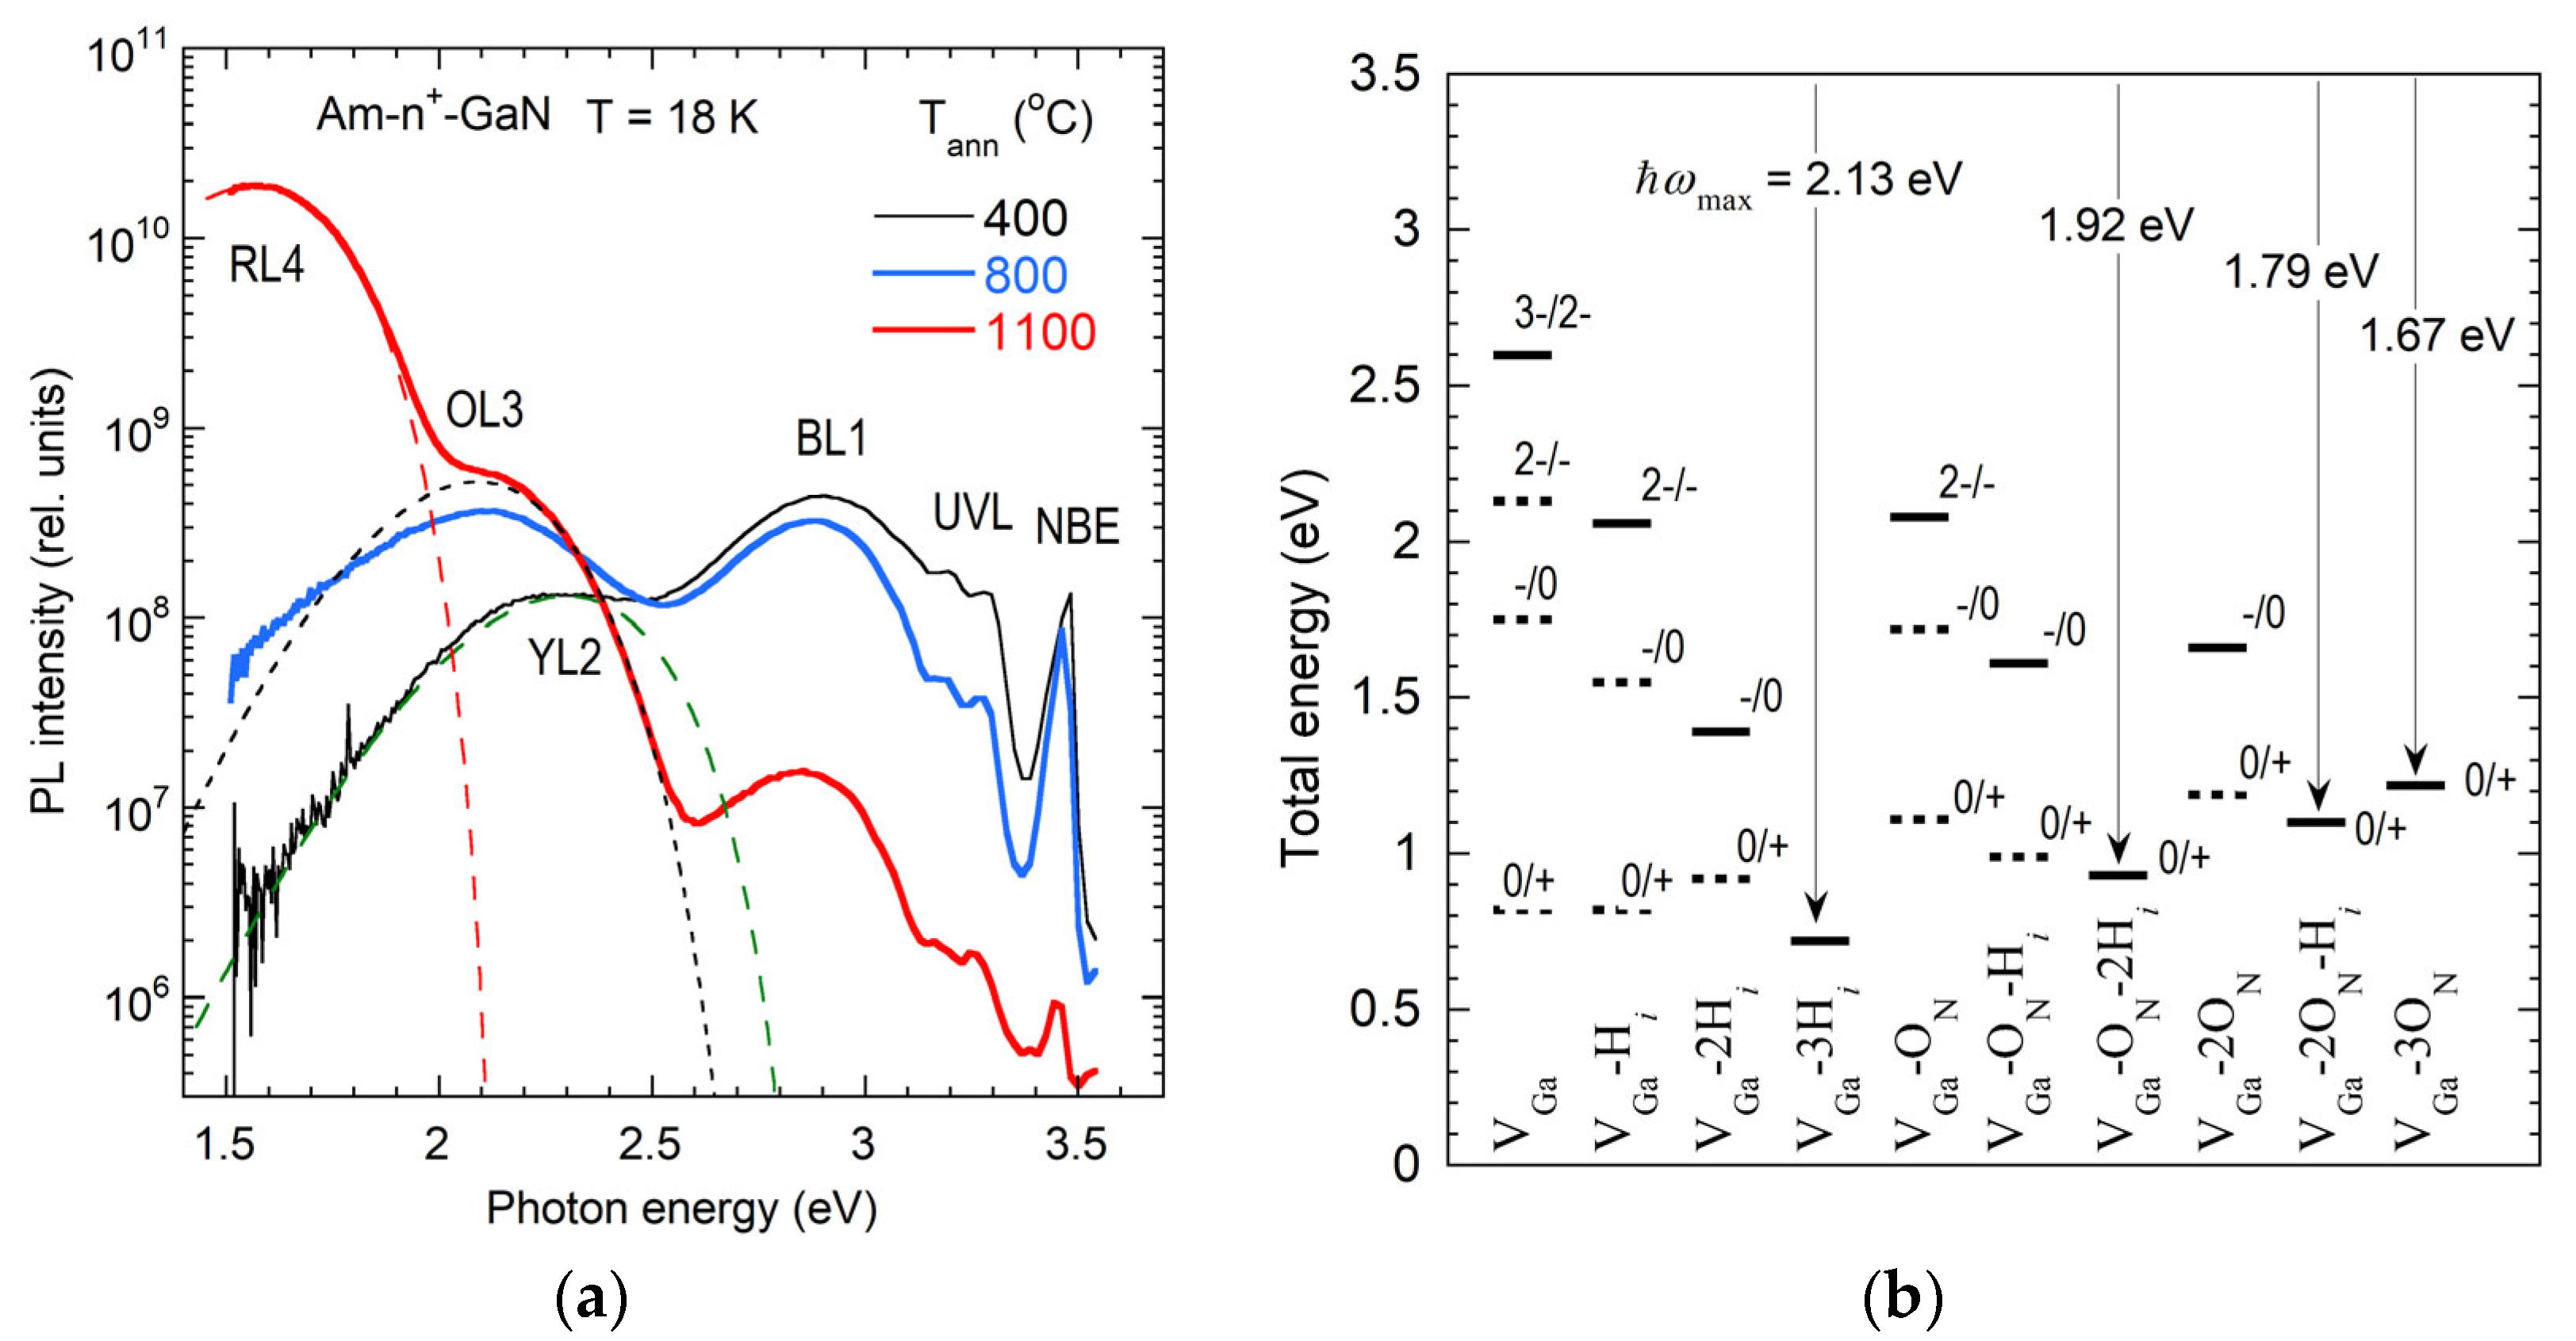
The YL2 band, distinct from the CN-related YL1 (Figure 6a), shifts from 2.28 to 2.34 eV as the excitation intensity in SSPL increases from 10−4 to ~100 Wcm−2, and exhibits a red shift of ∼0.1 eV over time delays in TRPL measurements. These shifts may indicate possible contributions from multiple defects [42]. The position of the YL2 maximum and the defect ionization energy, estimated as ~0.7 eV from the band shape, agree with predictions from first-principles calculations for deep donors such as VGa3Hi and VGaON2Hi [39,42]. Acceptor complexes (e.g., VGa2Hi and VGaONHi) are predicted to have −/0 levels at 1.4–1.6 eV above the VBM [29,39] and, thus, are not expected to contribute to visible PL. FTIR absorption measurements on degenerate n-type AT GaN samples revealed high concentrations (more than 1018 cm−3) of complexes containing VGa and up to three H atoms, in agreement with the estimates from PAS [108,110].

3.1.4. YL3 Band in HVPE GaN

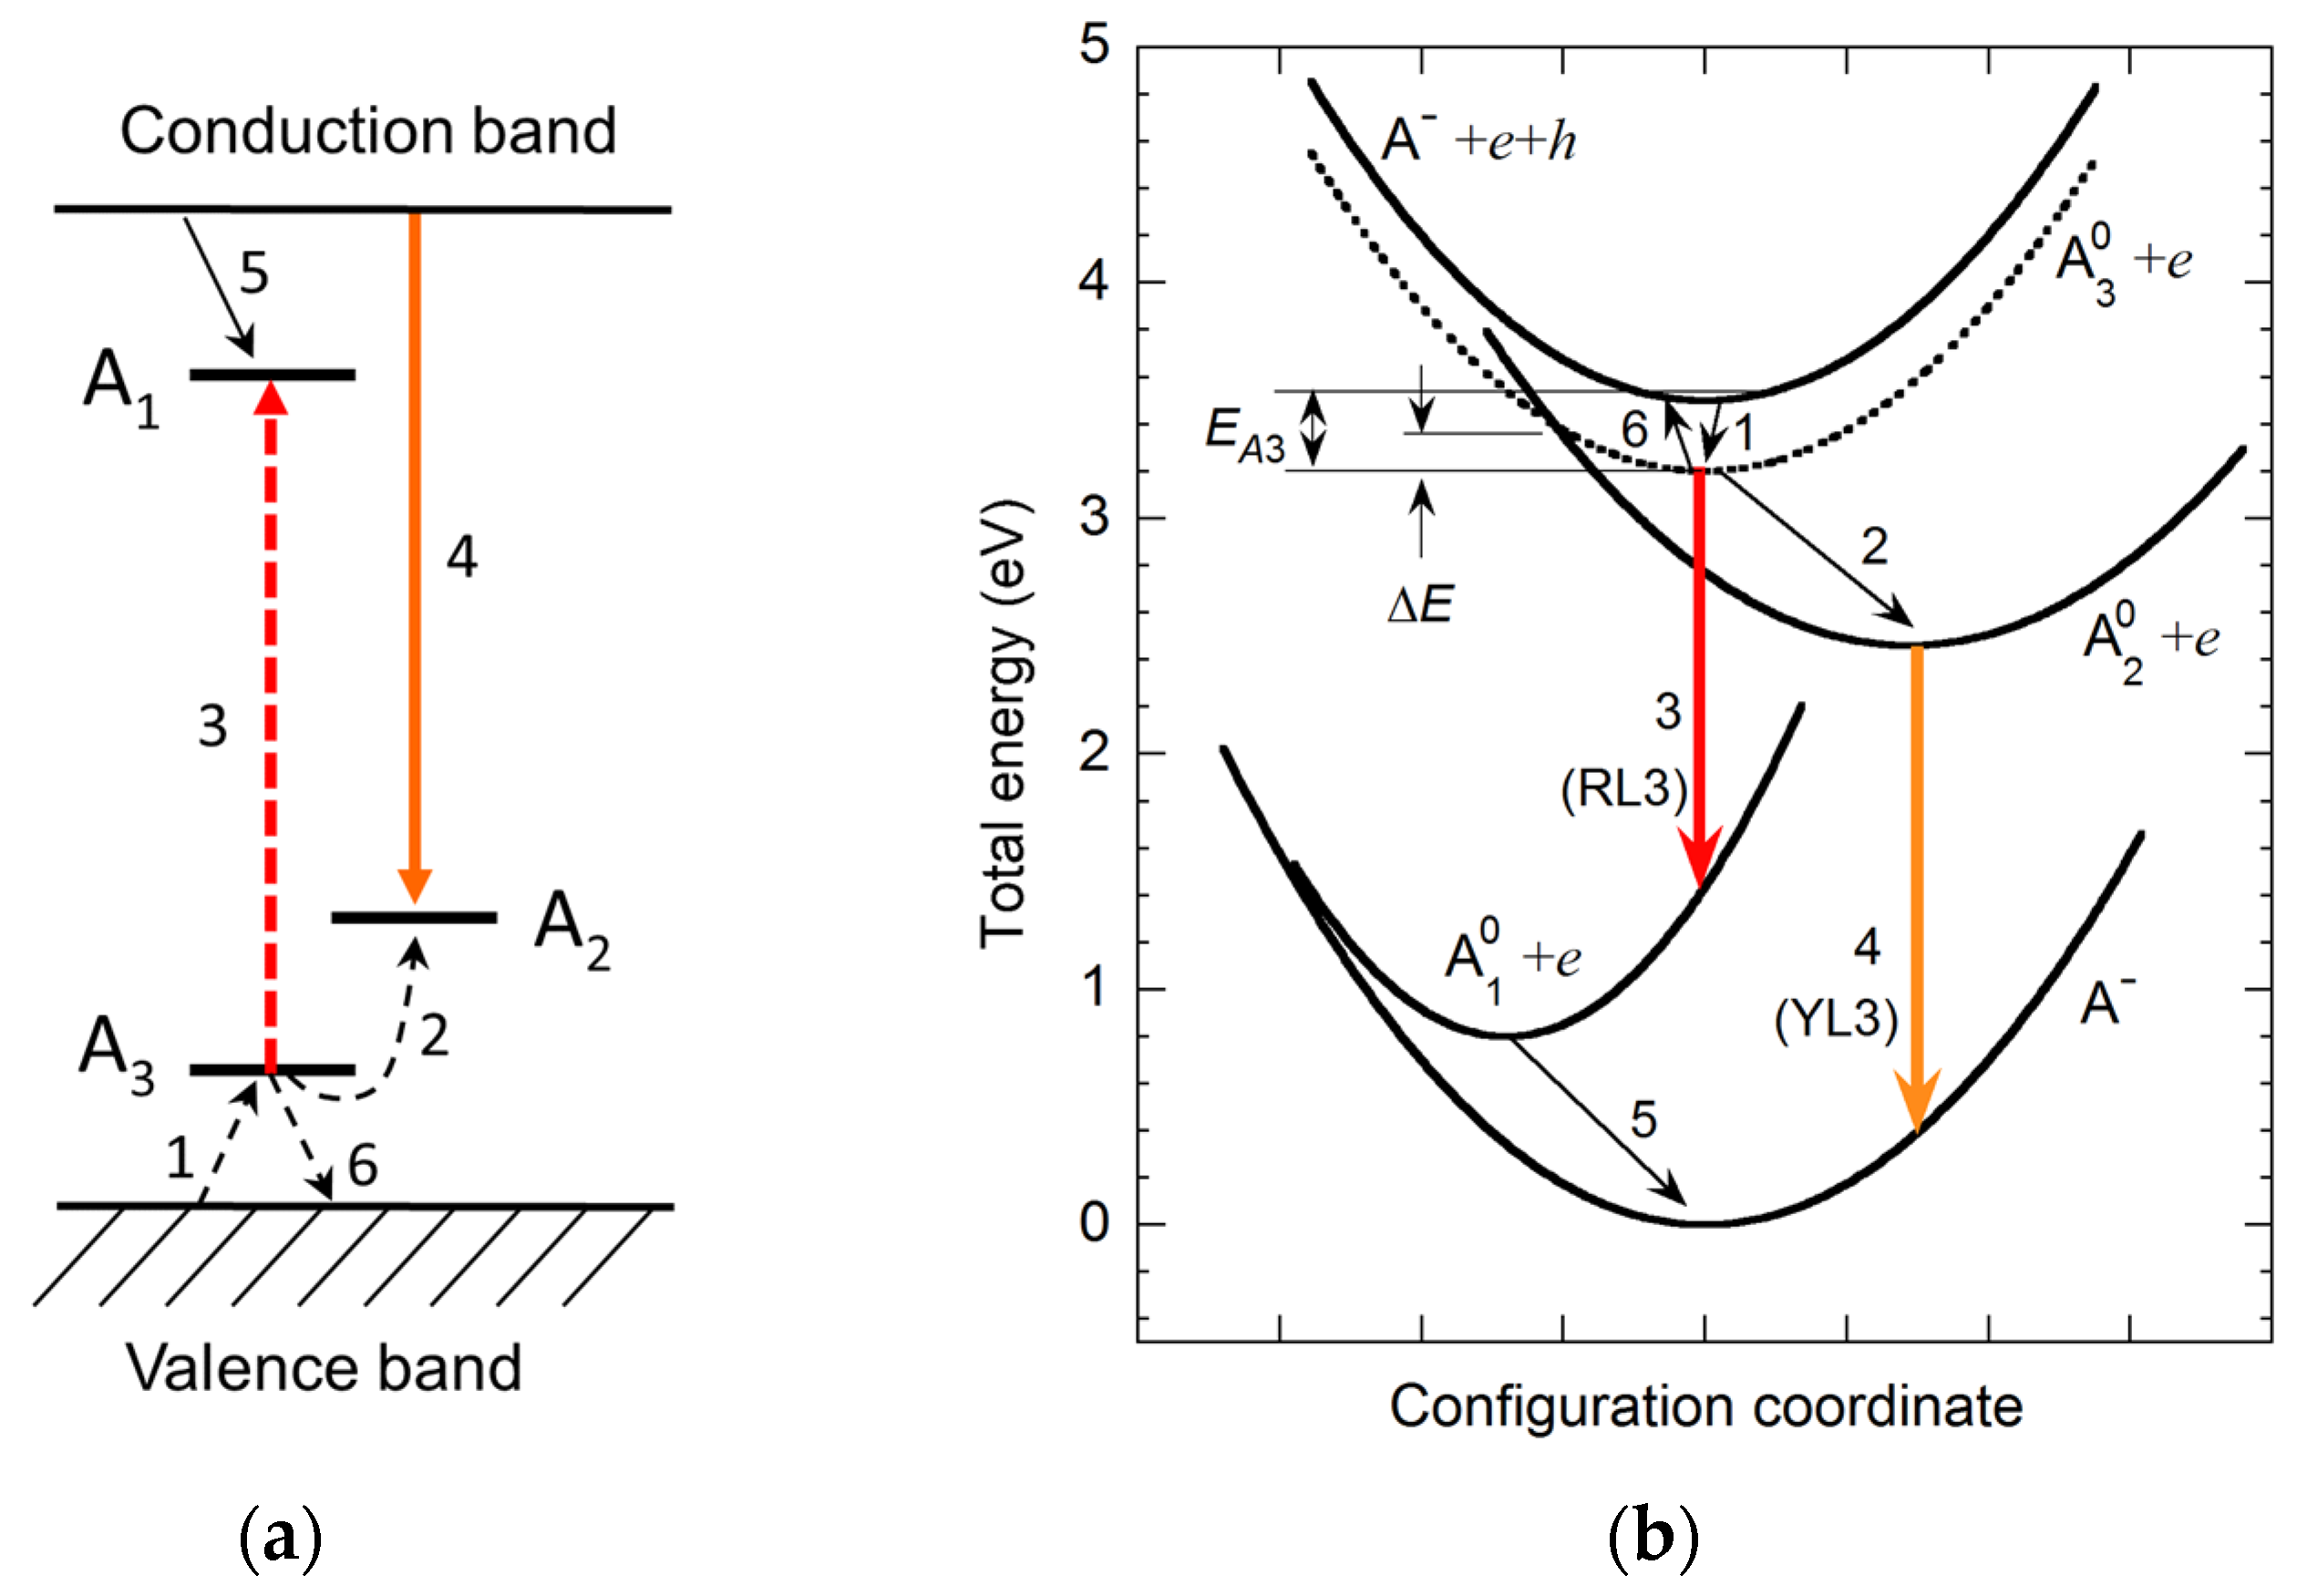
The YL3 band, peaking at 2.07 eV, with a ZPL at 2.36 eV at T ≈ 18 K, is observed in undoped HVPE GaN. It is associated with the RY3 defect, which also gives rise to the RL3 band (Section 3.2.3) [34,38,44]. The RY3 defect is an acceptor, with two deep states (A1 at 0.5–1.0 eV below the CBM, and A2 at 1.13 eV above the VBM) and a shallow state (A3 at ∼ 0.2 eV above the VBM) [38]. Photogenerated holes are quickly captured by the excited state A3. The RL3 component of the broad RY3 band arises from radiative transitions of the bound hole from A3 to A1 with a characteristic time of about 10 ns. Transitions of the bound hole from A3 to A2 are nonradiative, over a 0.06–0.07 eV barrier. The YL3 component of the RY3 band arises from DAP transitions (shallow donors to A2) at T < 40 K or e-A transitions to A2 at T > 50 K with τ0 ≈ 100 μs [38,44]. The very different lifetimes of RL3 and YL3 allow us to resolve the YL3 component (Figure 7). The fine structure of the YL3 band includes the DAP-related ZPL at 2.36 eV and the e-A-related ZPL at 2.38 eV, both followed by phonon replicas from three sets of phonons: the LO mode with ħΩ = 91 meV and two pseudo-local modes (19 and 36 meV) [43,44].
The RY3 defect is tentatively associated with FeGa or FeGa-containing complexes, as the RY3 band correlates with the FeGa-related 1.31 eV PL line. Interestingly, the RY3 band is absent in Fe-doped SI GaN, where the Fermi level is expected to lie near the −/0 level of FeGa, ~0.6 eV below the conduction band minimum (CBM) [112,113,114]. The absence of RY3 in SI GaN is presumed to arise from competition for photogenerated electrons. In such samples, electrons are preferentially captured by nonradiative donors, suppressing radiative recombination. In contrast, in conductive n-type GaN, PL intensity is governed by the capture of photogenerated holes, and the hole capture by the excited state A3 is very efficient.

3.1.5. Exclusion of VGa and VGaON as Sources of the YL Band

The VGa and VGaON defects, both deep, multi-charged acceptors, are unlikely contributors to the YL band in n-type GaN, where the Fermi level lies near the CBM. Under such conditions, only the 3−/2− level for VGa and the 2−/− level for VGaON are expected to be active. While early DFT calculations placed these levels near 1 eV above the VBM [22,115], more accurate hybrid functional DFT calculations have since revised their positions to significantly higher energies: 1.75–3.13 eV above the VBM for VGa [29,30,31,32,116,117] and 1.55–2.17 eV above the VBM for VGaON [29,39]. Electron transitions from the CBM to these levels are most likely nonradiative [30,39], precluding PL contributions above 1.5 eV.
Lyons et al. [29] suggested that hole capture at the VGa 3−/2− level is radiative and can cause a PL band similar to the YL band. However, such radiative capture would be much slower than competing nonradiative hole capture by more efficient acceptors, such as CN. As a result, any emission from this mechanism would be masked by stronger PL bands. Similarly, transitions via the 2−/− level of the VGaON complex are nonradiative or weakly radiative with a PL signal in the infrared region [39]. Alkauskas et al. [118] proposed that hole capture by this level in n-type GaN occurs nonradiatively, via an excited state located at 1.15 eV above the VBM. Note that nonradiative capture coefficients depend strongly (approximately exponentially) on the energy of the transition [119].
Wang et al. [117] proposed that the yellow band originates from electron transitions from the CBM to the 0/+ levels of VGa or VGaON. However, this mechanism is not viable in n-type GaN, where these defects reside in their fully negative charge states (3− for VGa and 2− for VGaON). To date, no reliable experimental evidence supports predictions of PL from either VGa or VGaON. In high-quality HVPE-grown GaN samples, where PL bands are reliably recognized, no PL features could be attributed to VGa, while the concentration of VGa (from PAS measurements) varied between 1016 and 1018 cm−3 [66].
Historical observations of the YL band in undoped GaN produced by various growth methods can be attributed to trace contamination with carbon [5,35,41]. In particular, Saarinen et al. [28] reported a correlation between the YL band intensity and the concentration of the VGa-related defects in GaN. However, the PL in that work was collected from a region near the GaN/sapphire interface, where the concentration of defects is very high. Subsequent studies [92,120,121] have failed to reproduce this correlation and, in some cases, have reported an anticorrelation between the YL intensity and the VGa concentration, further weakening the case for the VGa-related YL.

3.2. Red Luminescence Bands in Undoped GaN (RL1, RL2, RL3, RL4)

Red luminescence (RL) bands are frequently observed in undoped GaN, particularly in samples grown by HVPE. Four distinct RL bands—designated RL1 through RL4—have been recognized, each characterized by unique spectral features and recombination dynamics. The RL1 and RL3 bands are prominent in HVPE GaN, distinguished mainly in TRPL experiments due to their contrasting decay behaviors. The RL1 band exhibits nonexponential decay at T < 50 K, and exponential slow decay (with lifetimes in the millisecond range) at higher temperatures. The RL3 decays exponentially with τ0 ≈ 10 ns. The RL2 appears at low temperatures in SI GaN grown by various techniques. It exhibits an exponential decay with τ0 > 1 μs at T < 100 K. The RL4 band emerges in AT GaN only after thermal annealing. Below, each RL band is discussed in more detail.

3.2.1. RL1 Band in HVPE GaN

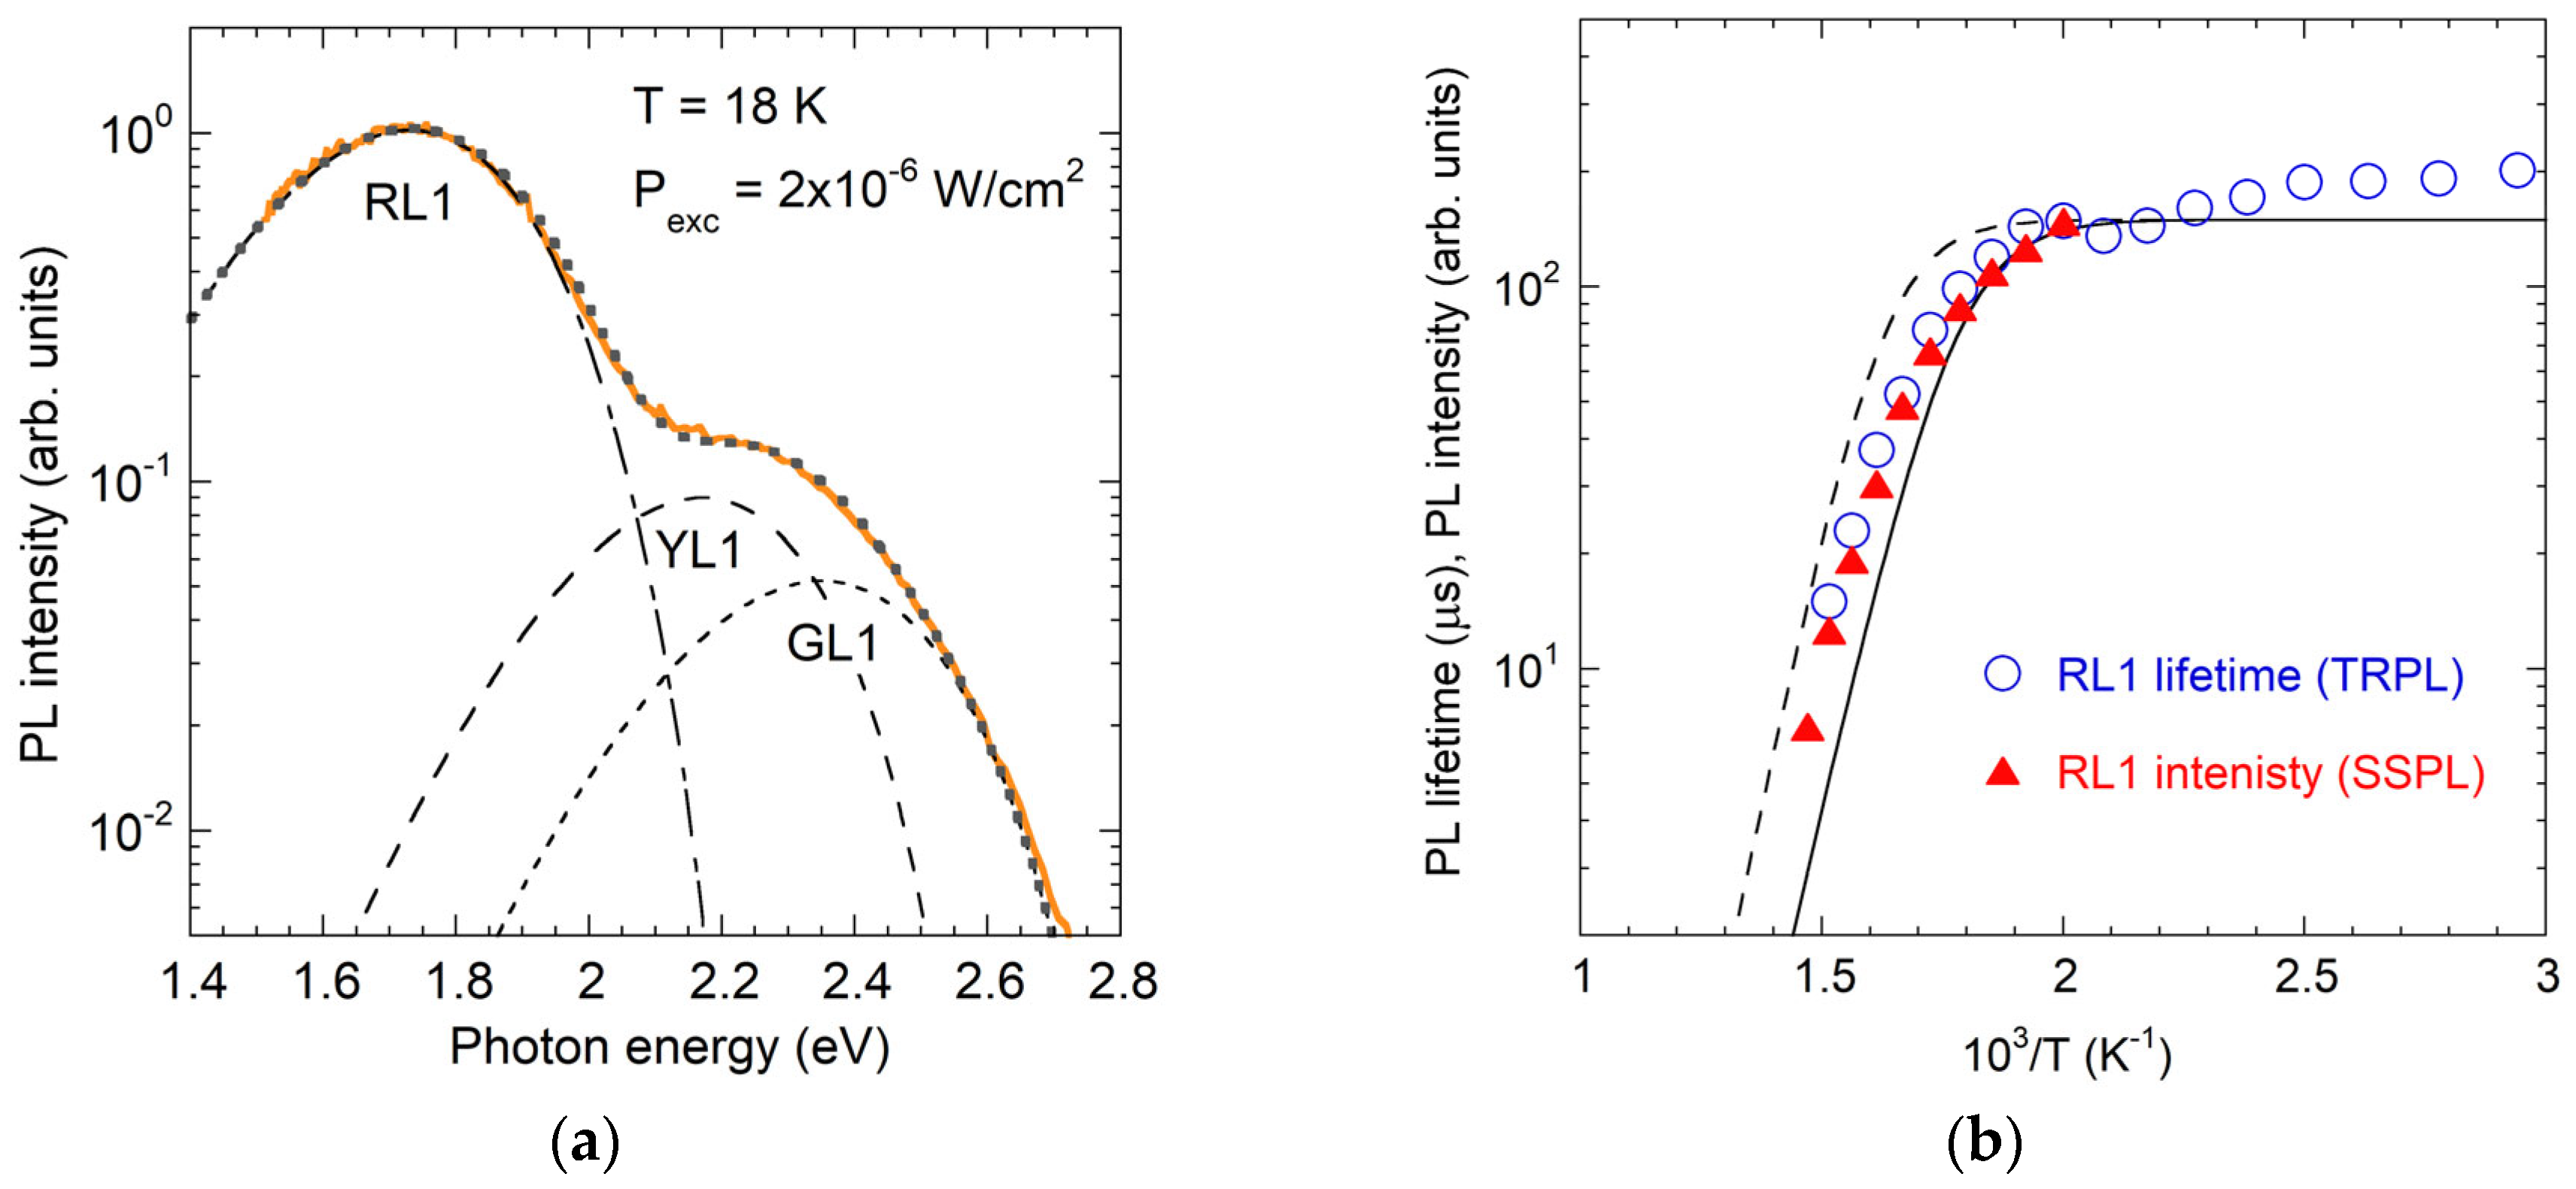
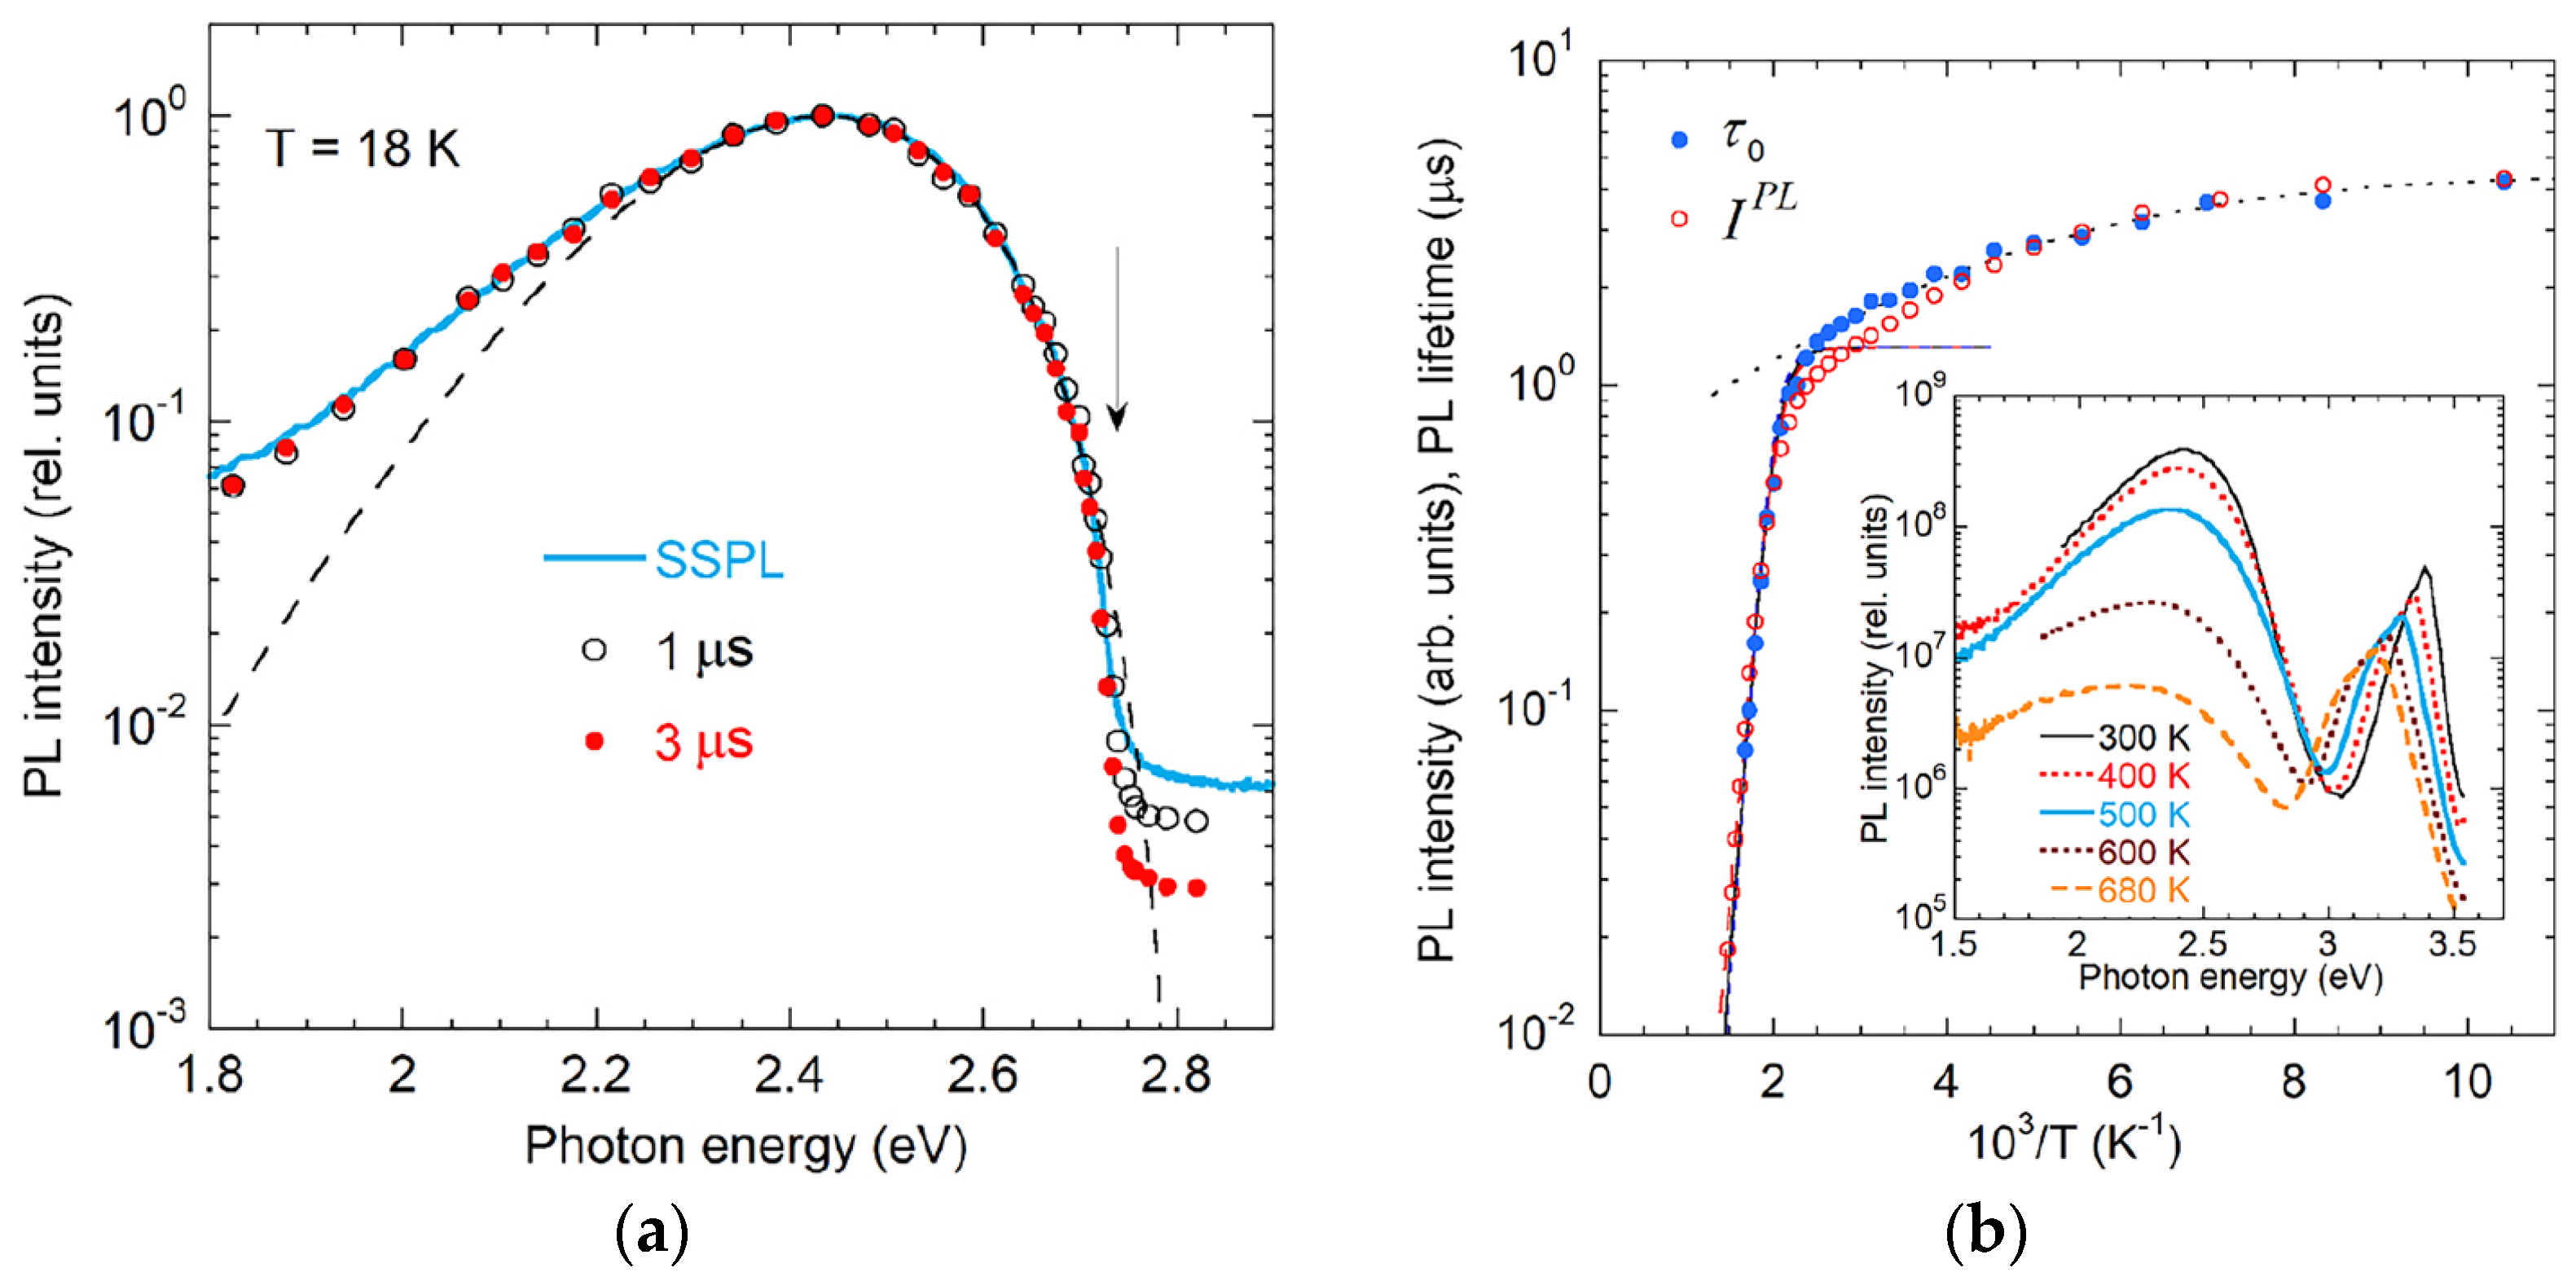
The RL1 band, peaking at ~1.75 eV, is the dominant defect-related PL feature in undoped GaN grown by HVPE, particularly at low Pexc, when contributions from YL1 (Section 3.1.2) and GL1 (Section 3.3.1) are minimal (Figure 8a). Its behavior is consistent with a deep acceptor, with an ionization energy EA ≈ 1.0–1.2 eV. In conductive n-type GaN, the RL1 band is highly efficient at low Pexc, with SSPL intensity nearly constant up to 500 K. At low temperatures (T < 50 K), non-exponential decay is consistent with DAP recombination involving shallow donors. Above 50 K, e-A transitions dominate, yielding a long effective lifetime (in the millisecond range), inversely proportional to the free electron concentration. Due to its long lifetime, the RL1 band saturates at relatively low Pexc.
Thermal quenching of RL1 begins at T > 500 K (Figure 8b), consistent with EA = 1.0–1.2 eV. TRPL analysis yields Cn ≈ 4.5 × 10⁻¹⁴ cm3s−1 from Equation (1) [65]. The hole-capture coefficient, Cp ≈ 3 × 10⁻⁷ cm3s−1, is derived from comparisons of PL intensities and defect concentrations using Equations (4) and (5) [75,83]. These coefficients align with those of other acceptors in GaN (Figure 9). ODMR studies of HVPE-grown freestanding GaN templates revealed an isotropic g = 2.019 factor for the RL1-related defect [122]. The RL1 origin remains uncertain, but it is tentatively linked to Cl or Cl-containing defects, as it is exclusive to Cl-contaminated HVPE GaN and absent in MBE- or MOCVD-grown GaN [66].

3.2.2. VN-Related RL2 Band

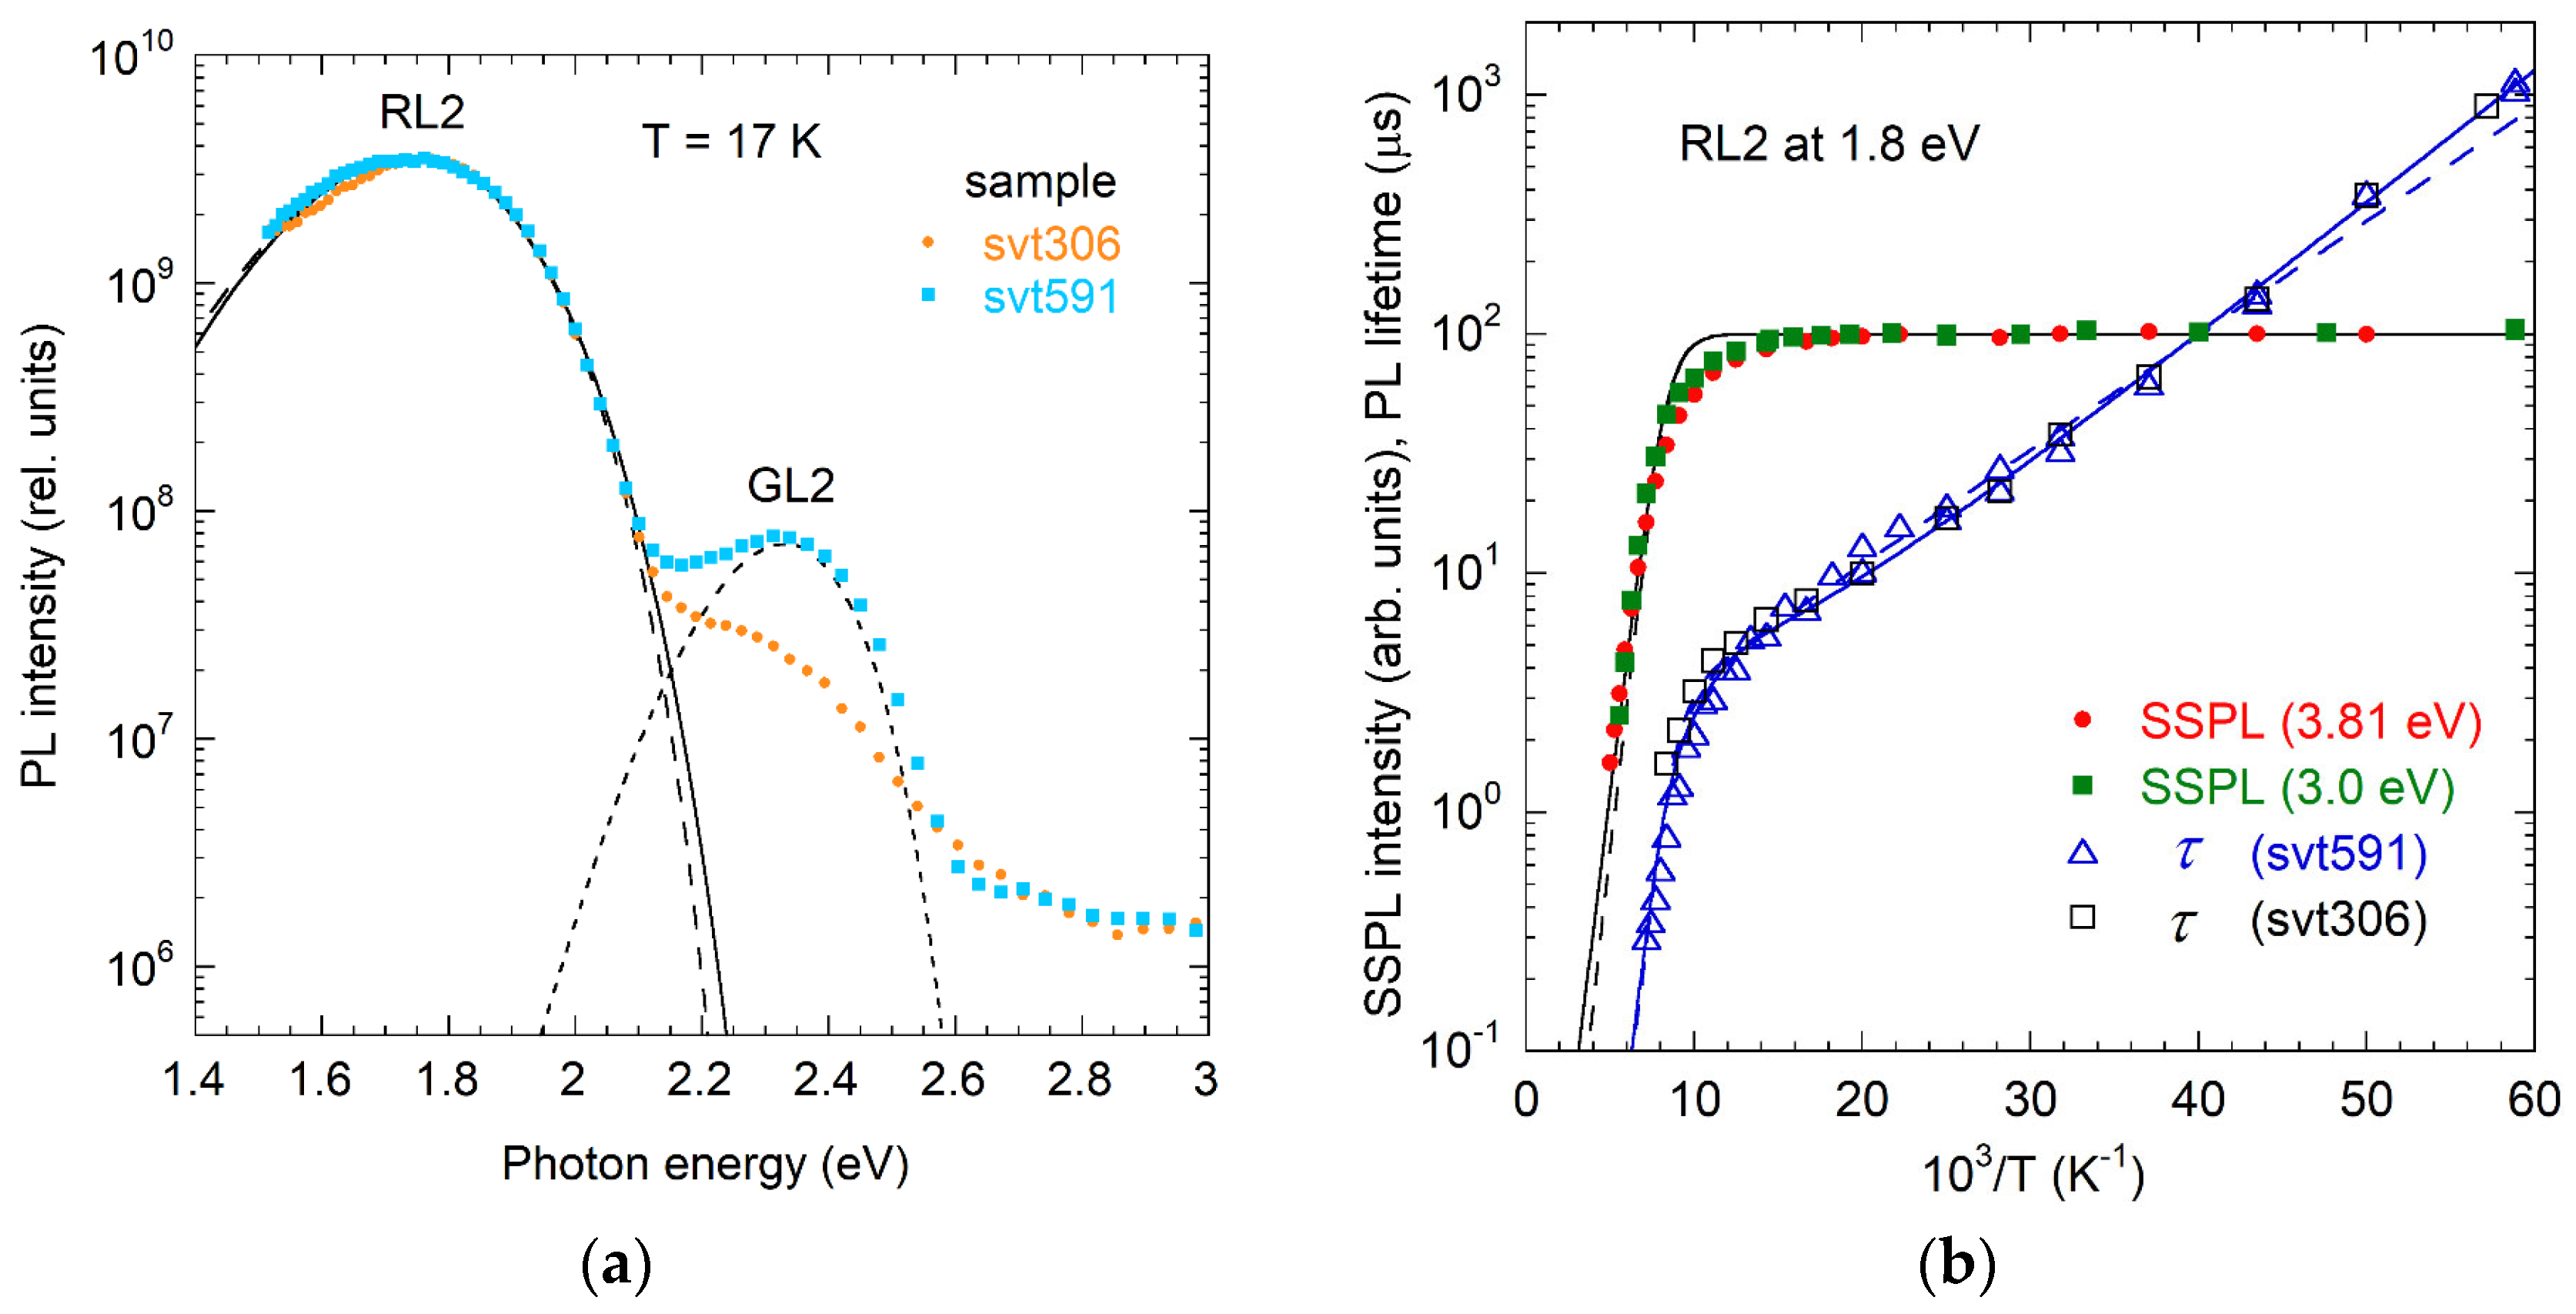
The RL2 band, peaking at ~1.74 eV, is observed alongside the GL2 band (Section 3.3.2) in SI GaN samples, particularly those grown under extremely Ga-rich conditions (Figure 10a) or after surface mechanical polishing [37,123]. The RL2 emission is characterized by exponential decay, even at very low temperatures (T < 20 K), suggesting that it originates from an internal transition within a deep donor, from an excited state to the ground state. Figure 10a shows the RL2 band, with a small contribution of GL2 at ~2.33 eV. A substantial body of evidence, accumulated since 2005, supports the assignment of the GL2 band to isolated VN defects (Section 3.3.2). The RL2 band is attributed to a family of red-emitting centers associated with AVN complexes, where A is a group-II metal substituting for Ga.
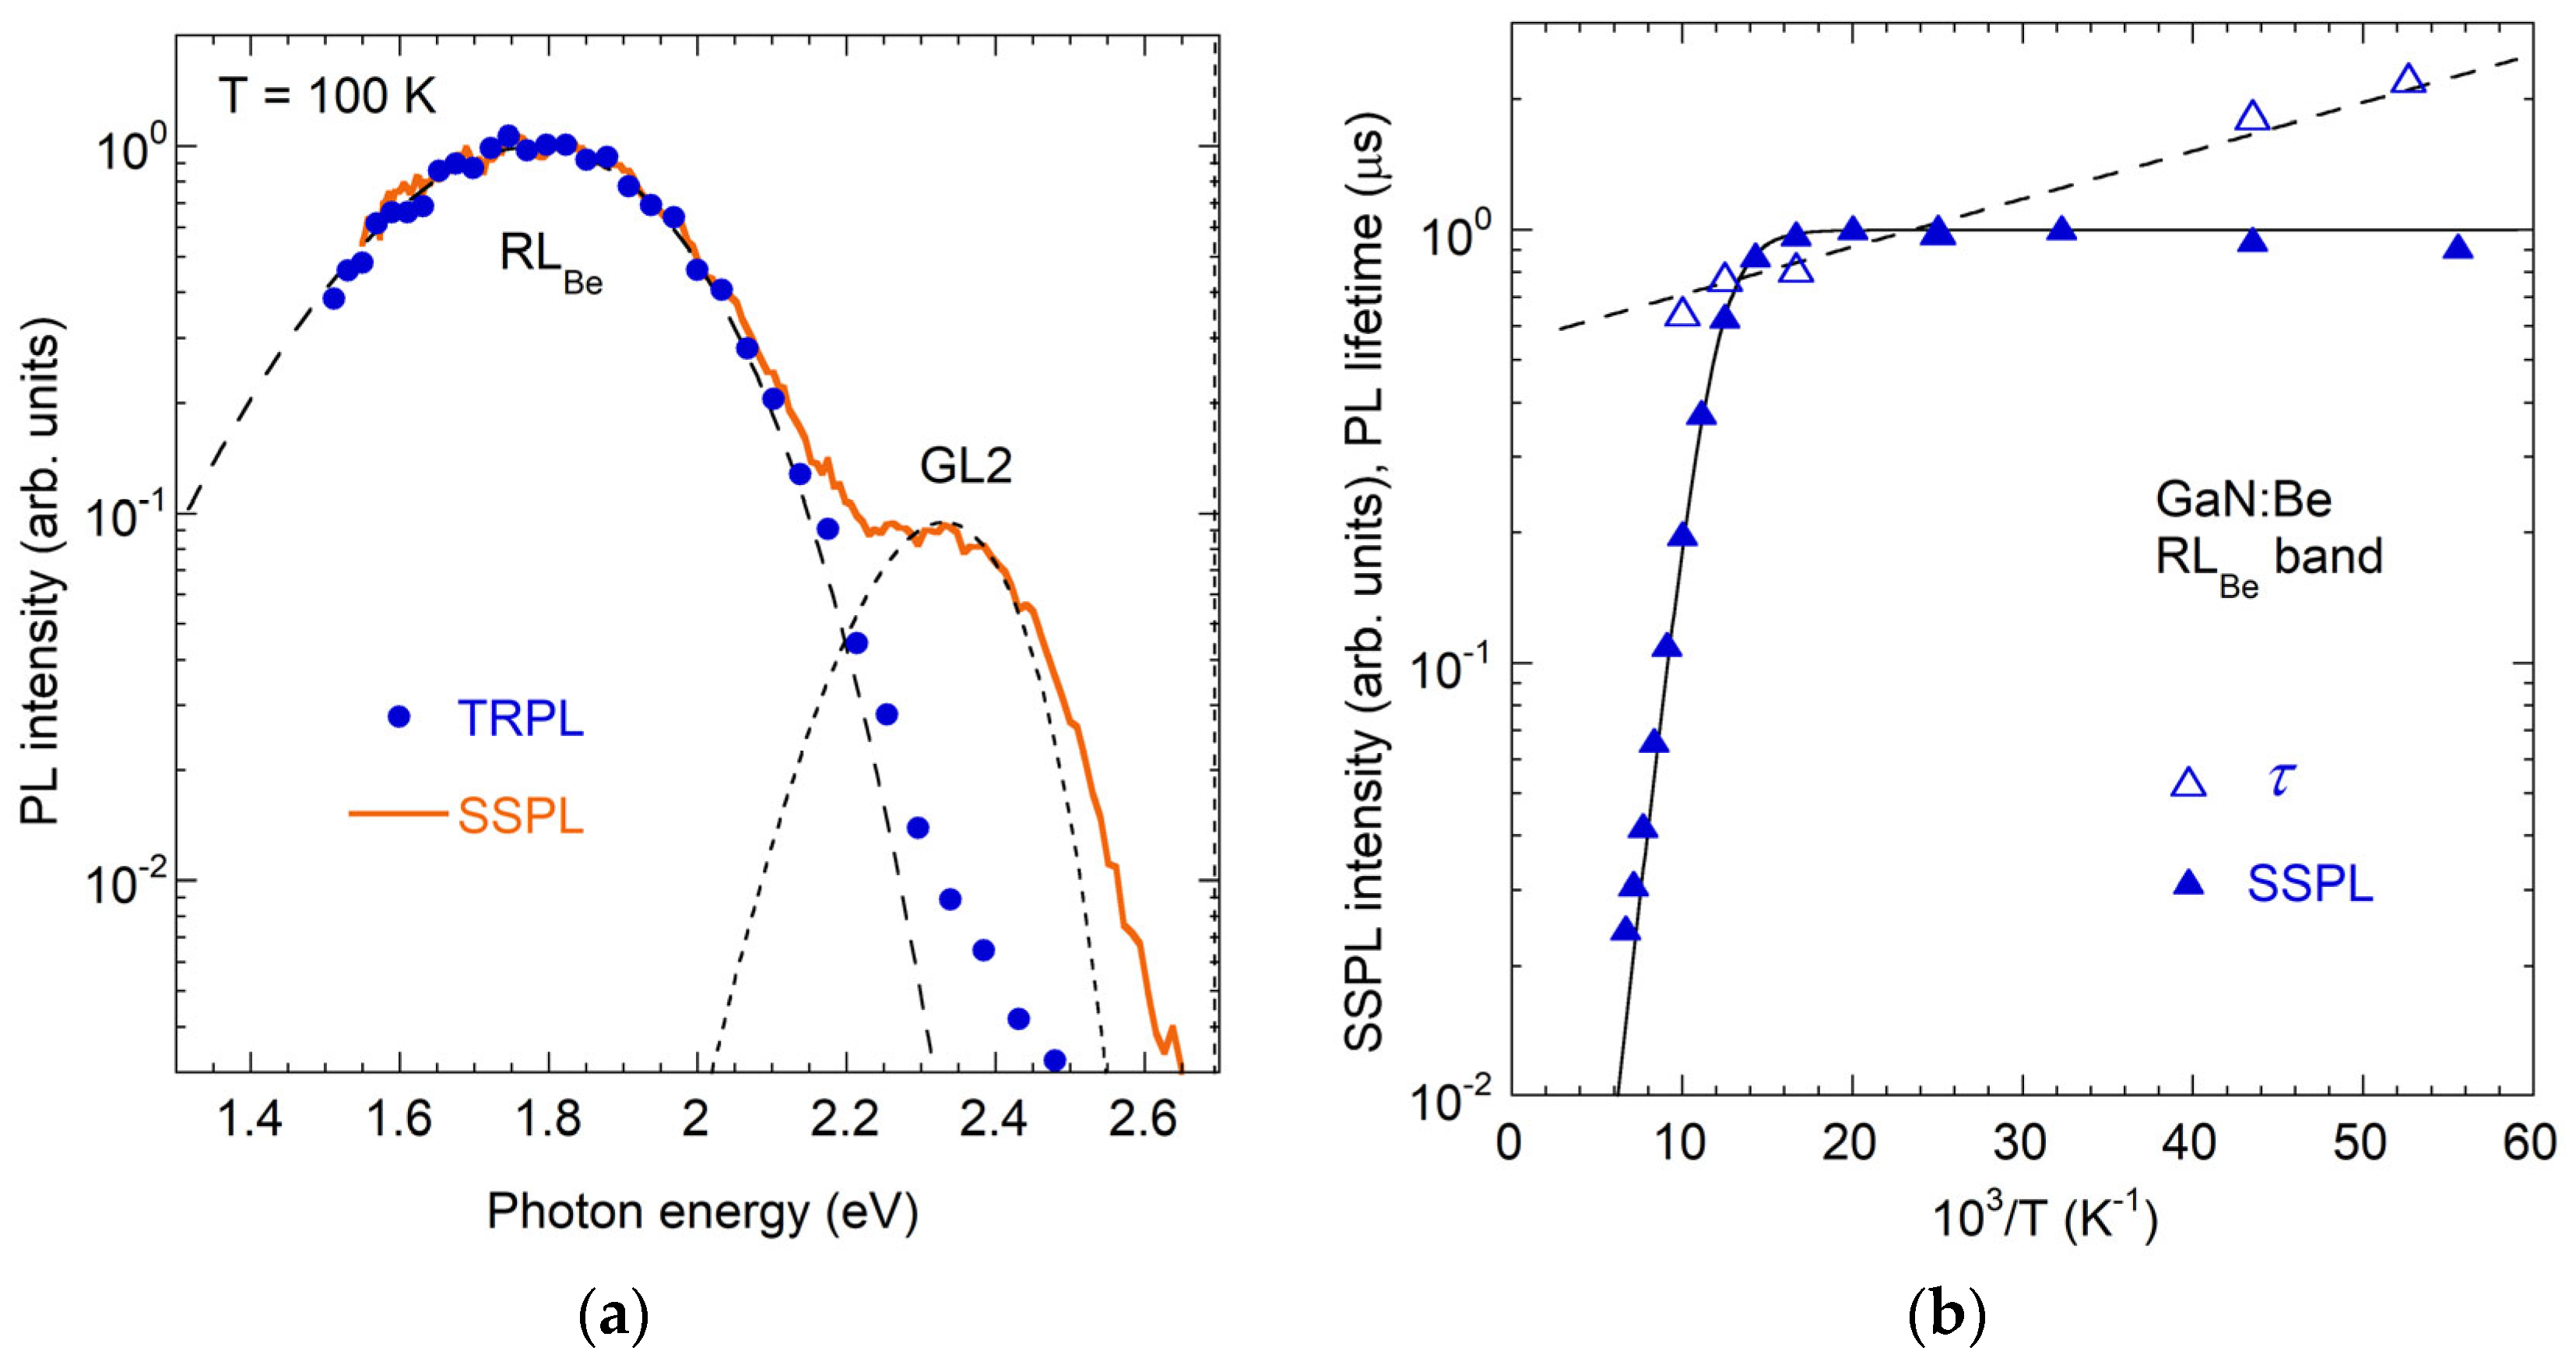
In undoped GaN grown by MBE under Ga-rich conditions [16], the RL2 lifetime decreases from 1050 to 3 μs as the temperature rises from 17 to 100 K (Figure 10b) [37]. While the SSPL intensity remains constant below 100 K, it quenches at higher temperatures with an activation energy of 0.1–0.15 eV (Figure 10b). The quenching was initially explained by the Seitz–Mott mechanism, involving a 0.12 eV barrier in the configuration coordinate diagram [16]. However, more recent interpretations favor the Schön–Klasens mechanism, in which quenching is attributed to the thermal emission of electrons from the excited state to the conduction band. This behavior is typical when competition for electrons limits the PL efficiency [36,37]. Although there is a good understanding of the RL2-type bands caused by the AVN complexes with A = BeGa, MgGa, and CaGa (Section 4.2.4, Section 4.3.5, and Section 4.6.3), the specific acceptors involved in the AVN complexes responsible for the RL2 band in MBE-grown undoped GaN [124,125] remain unidentified. A distinguishing feature of the RL2 band in these samples is the temperature-dependent lifetime behavior, which reveals an activation energy of ~10 meV between 17 and 100 K (Figure 10b). A phenomenological model has been proposed in which two excited states are located near the CBM, while the ground state lies ∼1 eV above the VBM [37]. The observed τ(T) dependence at T < 100 K is attributed to thermal activation of a radiative excited state that lies about 10 meV above a nonradiative (or weakly radiative) excited state.

3.2.3. RL3 Band in HVPE GaN

The RL3 band, peaking at 1.77 eV, is observed in HVPE-grown GaN and, together with the YL3 band, forms the RY3 band (Figure 11). The RL3 component of RY3 exhibits fast, exponential decay with a characteristic lifetime τ0 ≈ 10 ns at T = 2–200 K [38,126,127], in stark contrast to the YL3 component, which displays much slower decay (τ0 ≈ 100 μs). The consistent intensity ratio between RL3 and YL3 across a wide range of HVPE samples strongly supports their origin from the same defect, referred to as RY3. The RL3 is distinguished by a less steep high-energy spectral side. Early reports misassigned the ZPL at 2.36 eV and associated phonon structure to RL3 [43], but this was later corrected: these features belong to the YL3 band [38] (Section 3.1.4).
In early works, the RL3 band was attributed to DAP transitions involving C and O impurities that were abundant in HVPE GaN samples (~1019 cm−3 each) [128,129]. However, the fast and purely exponential decay kinetics of the RL3 emission rule out DAP recombination, indicating an internal transition. Moreover, the RL3 band is strong even in samples with very low concentrations of C and O [38], sometimes below the SIMS detection limit of 5 × 1015 cm−3 [127], further invalidating the above attribution. The RY3 defect is tentatively assigned to Fe-related defects, yet the assignment of the RL3 and YL3 bands specifically to isolated FeGa acceptors seems ambiguous, as will be discussed later.
A detailed model of the RY3 defect [38] proposes three acceptor levels (Figure 12): a ground state A1 at 0.7 ± 0.3 eV below the CBM, another deep state A2 at 1.13 eV above the VBM, and a shallow excited state A3 at ~0.2 eV above the VBM. In this model, holes captured at A3 can follow two competing paths: radiative recombination with electrons at A1, producing the RL3 (τ0 ≈ 10 ns), or nonradiative relaxation to A2 over a 0.06 eV barrier, followed by DAP or e-A recombination, resulting in the YL3. This model successfully explains the observed temperature- and excitation-dependent interplay between RL3 and YL3 components [38]. Notably, Uehara et al. [127] demonstrated that the RL3 band can be excited below the bandgap by photons with energy of 3.42 eV (but not by 3.06 eV).
The RY3 defect resembles the CuZn acceptor in ZnO, which produces the green luminescence (GLCu) band, peaking at 2.45 eV, with a ZPL at 2.859 eV [130,131,132,133]. The GLCu band originates from internal transitions of holes between an excited state (0.4 eV above the VBM) and the ground state (~0.2 eV below the CBM). Like RL3, the GLCu band exhibits exponential decay at cryogenic temperatures (even at 1.6 K), with a PL lifetime of 440 ns [130]. In conductive n-type ZnO, where the Fermi level lies above the ground −/0 level of the CuZn, the GLCu band is observed after photogenerated holes are captured by the excited state. However, resonant excitation of the GLCu band below the bandgap is possible only in high-resistivity ZnO, where the Fermi level is below the −/0 level of the CuZn [132,133,134]. In contrast, the RL3 band in GaN can be excited below the bandgap (at 3.42 eV) in moderately conductive (n ≈ 1016–1017 cm−3) HVPE GaN samples [127].
By analogy, the RY3 center in GaN is likely associated with a transition metal impurity. Indeed, Fe concentration appears to correlate with the RY3 band intensity. In particular, the concentration of Fe in a sample with a strong RY3 band was elevated (2.5 × 1015 cm−3), matching the concentration of the RY3 defect estimated from PL measurements [38]. A rough correlation between the intensities of the RL3 band and the Fe-related 1.31 eV line was also noted in a set of HVPE-grown undoped GaN samples. Furthermore, the ground level of the RY3 center (0.7 ± 0.3 eV below the CBM) is close to the reported position of the ground level of FeGa acceptors (at ~0.63 eV [135]). The RY3 band is not observed in Fe-doped SI GaN samples, and this can be explained by conditions where the PL efficiency is dictated by the fast capture of electrons, not holes. However, in some works, the RY3 was not observed in the low-temperature PL spectra, whereas samples were n-type and contained substantial concentrations of Fe [136,137]. This may indicate that the RY3 is a complex defect, not just an isolated FeGa.

3.2.4. RL4 Band in Ammonothermal GaN

The RL4 band, peaking at 1.6–1.7 eV, emerges in PL spectra from AT GaN after thermal annealing (Figure 13a), and its IQE approaches unity at Tann ≈ 1000 °C [39]. As-grown AT GaN samples contain high concentrations of VGa, O, H, and related complexes, as confirmed by FTIR studies [110,111,138,139]. First-principles calculations suggest that complexes such as VGa3Hi and VGaON2Hi contribute to yellow PL, whereas VGa2ONHi and VGa3ON can produce red PL (Figure 13b) [29,39]. The RL4 band has been tentatively attributed to the VGa3ON complex, which may form via the annealing-induced dissociation of nonradiative VGa3ONHi complexes [39]. The emission energy of the RL4 band is sample-dependent. It has a maximum at 1.7 eV in n+-GaN samples with high VGa, O, and H concentrations and at 1.6 eV in n-GaN samples with lower concentrations, suggesting possible compositional variations [39]. Spectral deconvolution also reveals a distinct orange PL band (OL3) with a maximum at 2.09 eV in annealed AT GaN samples (Figure 13a) [39].
All candidate defects proposed to contribute to the VGa-related PL in as-grown and annealed AT GaN (shown with arrows in Figure 13b) are deep donors. However, the observed high intensities and nonexponential decays of the YL2, OL3, and RL4 bands distinguish them from typical deep-donor-related PL bands in GaN, which are weak in conductive n-type GaN and exhibit exponential decays due to internal transitions (Table 1). The nonexponential decay may indicate that the related defects are, in fact, acceptors. Alternatively, potential fluctuations due to the nonuniform distribution of charged defects or overlapping PL bands may be the reason for the nonexponential decays. High PL efficiency (close to unity for the RL4 band) is another puzzle. Known deep donors in GaN generally have low hole-capture coefficients and produce inefficient PL in conductive n-type samples. However, to explain the exceptionally high IQE of the RL4 band in degenerate n-type AT GaN, the hole-capture coefficient for the related defect was estimated as ~10−6 cm3s−1 (if its concentration is close to 1020 cm−3) or even larger (if the concentration is lower) [39]. Note that the defect assignments in [39] were based on hybrid functional DFT predictions, which may lack precision, necessitating further experimental validation.

3.3. Green Luminescence Bands (GL1, GL2, GLCa)

Several distinct green luminescence (GL) bands are observed in undoped GaN, each characterized by unique spectral and temporal properties. The GL1 band, peaking at 2.35 eV, is prominent in HVPE-grown GaN. A spectrally similar but narrower GL2 band, also near 2.35 eV, appears exclusively in SI GaN grown by various techniques. These bands are readily differentiated by their distinct shapes and behaviors in SSPL and TRPL experiments. Additionally, a Ca-related GLCa band appears in MBE-grown GaN contaminated with Ca. Each band is discussed in detail below.

3.3.1. Unidentified GL1 Band in HVPE GaN

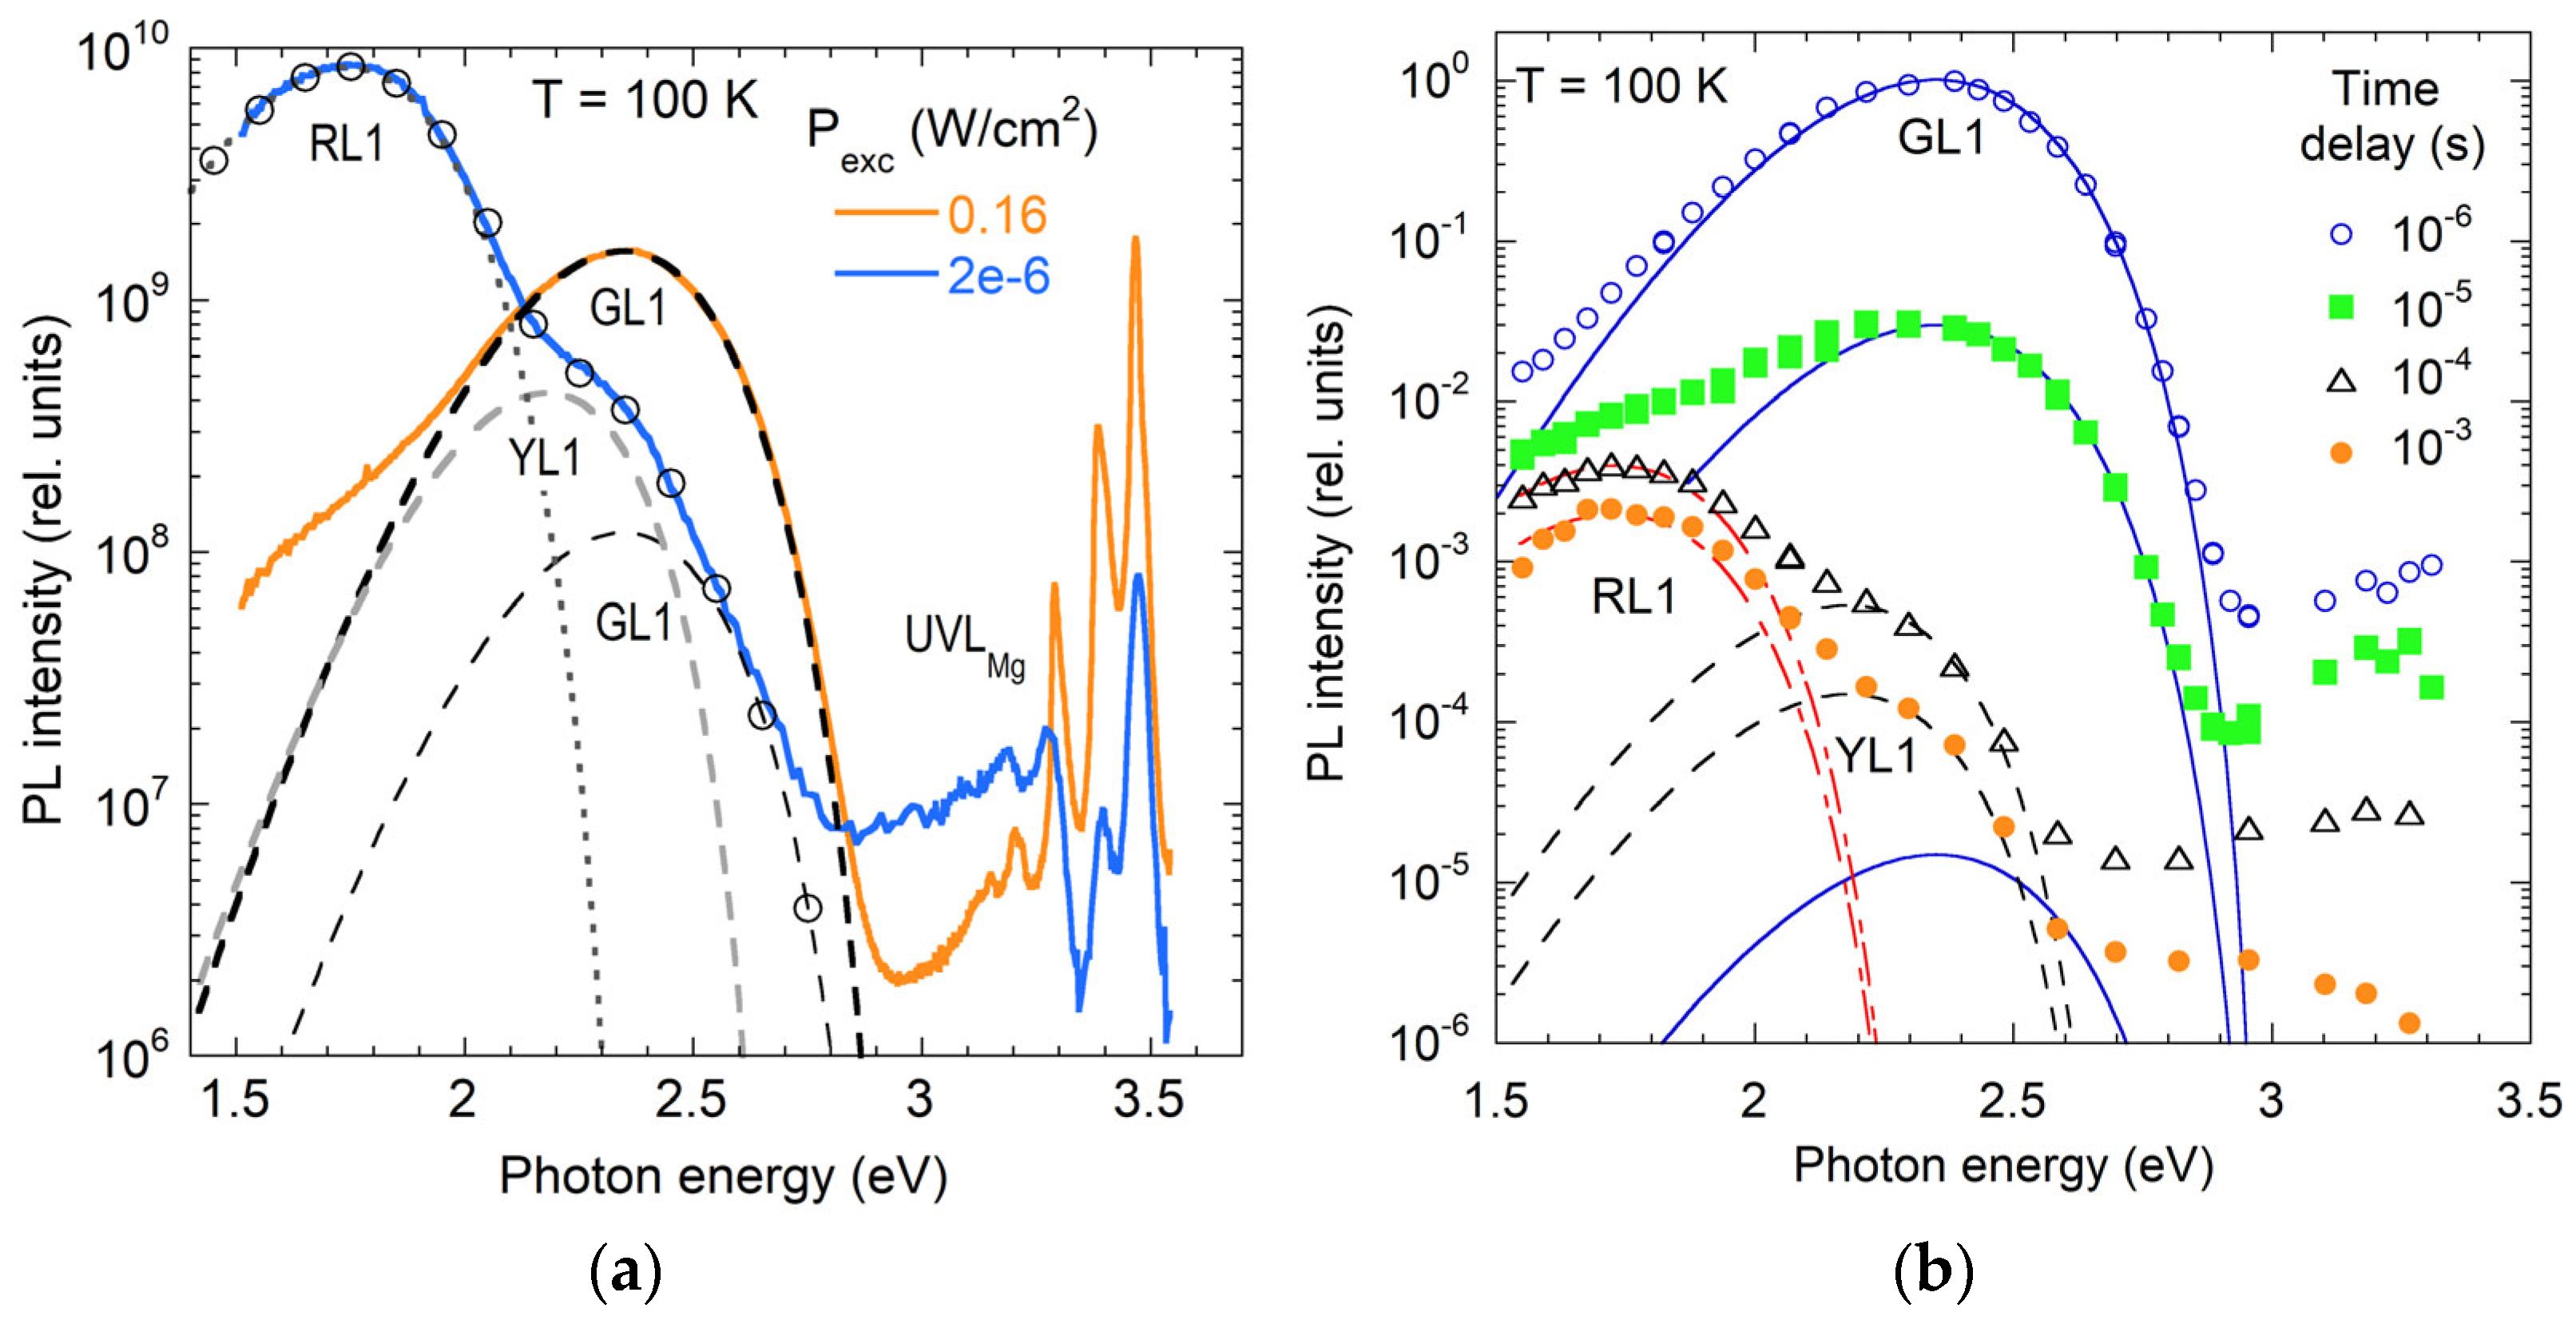
The GL1 band, peaking at 2.35 eV, is a prominent defect-related PL feature in undoped HVPE GaN (named GL band in [16]). Its intensity scales super-linearly (nearly quadratically) with excitation intensity, suggesting a secondary PL process requiring sequential capture of two holes by a deep defect [140]. TRPL reveals exponential decay kinetics, consistent with internal transitions. Figure 14 shows PL spectra from an HVPE GaN sample at T = 100 K. At low excitation intensity (Pexc = 2 × 10⁻⁶ Wcm−2), the RL1 band dominates, with a weak YL1 band at higher photon energy, while the GL1 band is not resolved. As Pexc increases, RL1 and YL1 saturate due to their long lifetimes, while GL1 intensity rises super-linearly (PL intensities are divided by Pexc in Figure 14a). The NBE luminescence (at 3.47 eV, with LO phonon replicas) also shows super-linear increase, typical of SI GaN. TRPL spectra resolve these PL bands at different time delays (Figure 14b). Analysis of the GL1 band shape and temperature-dependent intensity yields the following parameters: EA ≈ 0.50 eV, Cp = (3.7 ± 1.3) × 10−8 cm3s−1, and Se ≈ 10 [66,83].
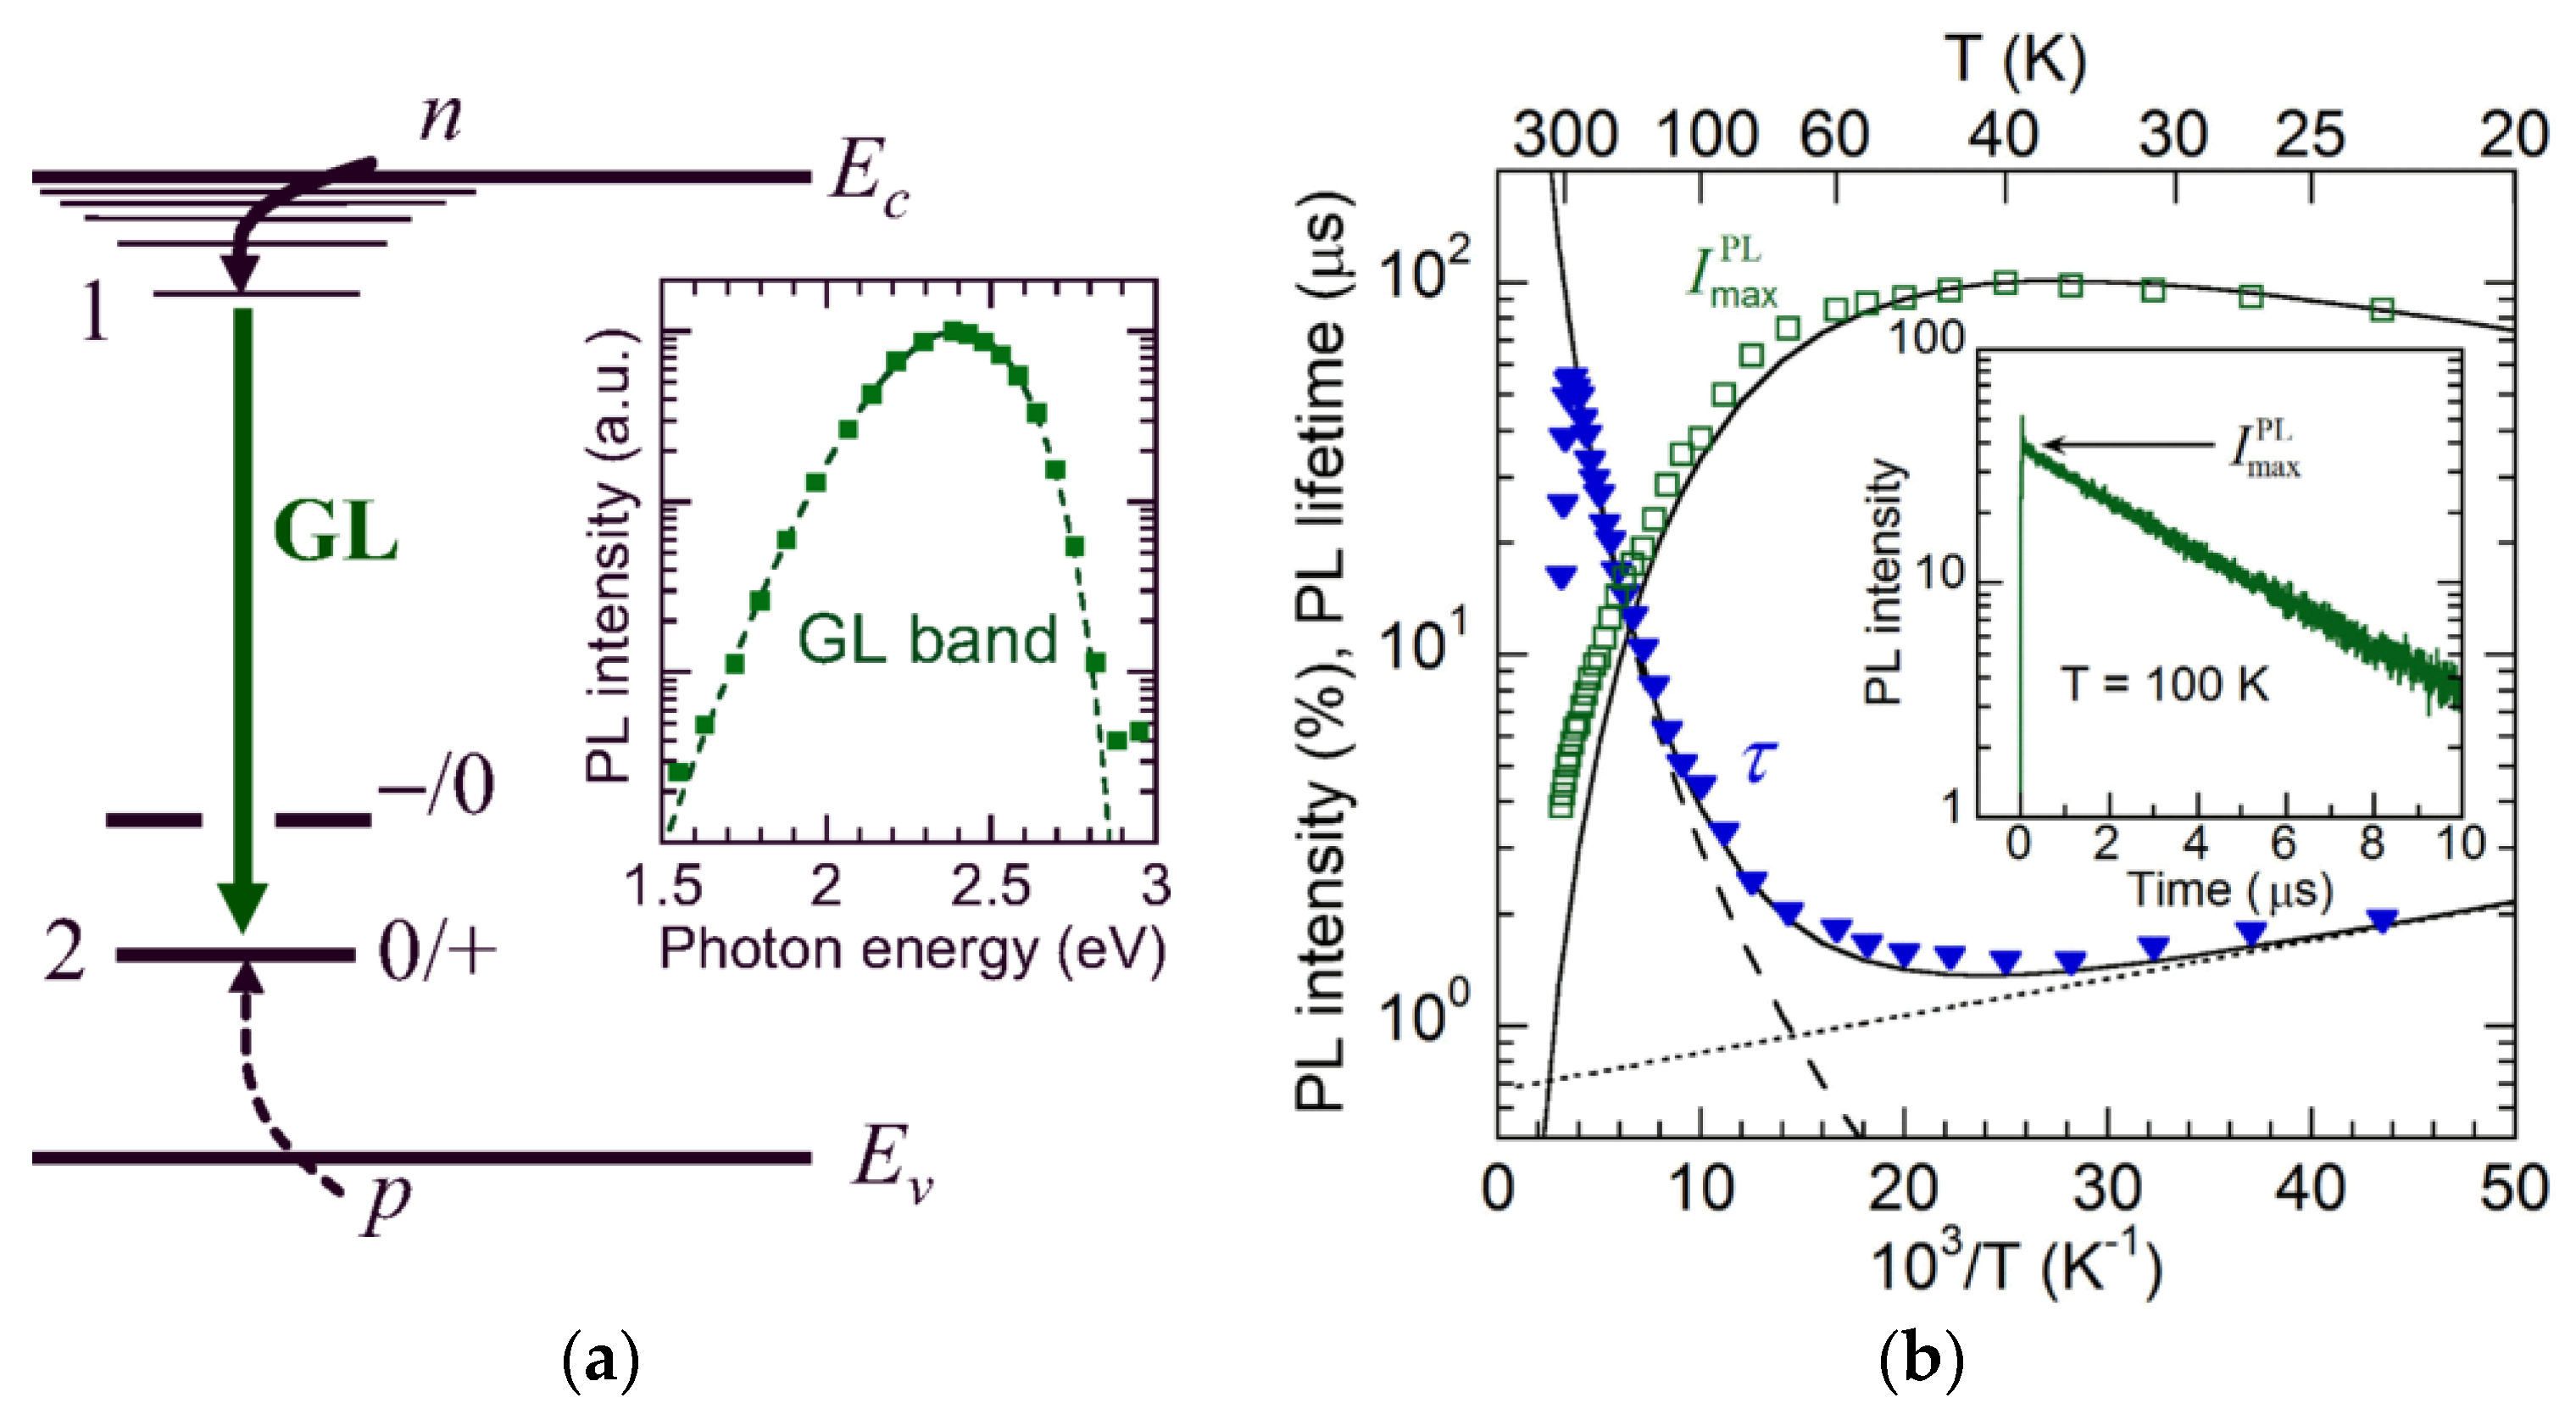
A unique feature of the GL1 band is a significant increase in its lifetime (by 20–50 times) with increasing temperature from 100 to 300 K [141,142,143,144]. A model proposed in [144] explains this behavior (Figure 15a): following above-bandgap excitation, the defect captures two holes and becomes positively charged. The capture of a free electron into an excited state near the CBM (level 1) occurs via the nonradiative Lax mechanism [145] (characteristic time τ1), followed by a radiative internal transition to level 2 (with the characteristic time τ2 ≈ 1 μs), producing the GL1 band. The PL intensity decays with time t after a laser pulse as [144]:
I P L t = I max P L exp t τ 1 exp t τ 2
At low temperatures, the cascade capture of free electrons by the excited state 1 is very fast (τ1 << τ2), and Equation (8) reduces to IPL(t) ≈ IPLmax exp(−t/τ2). As temperature rises, τ1 increases as T3 (typical of “giant traps” [145]), while τ2 remains nearly constant, leading to τ1 >> τ2 and IPL(t) ≈ IPLmax exp(−t/τ1) at high temperatures. Overall, at any temperature, the decay of PL is nearly exponential, where τ is determined by the slower process (Figure 15b).
Identifying the defect responsible for GL1 is critical, as it is prominent in high-quality freestanding GaN grown by HVPE, which has low dislocation and point defect densities. ODMR studies of HVPE-grown GaN freestanding templates revealed g factors g =1.975 and g = 1.969 for the defect responsible for GL1 [122]. Early studies attributed YL and GL1 bands, respectively, to the 2−/− and −/0 levels of the VGaON complex [16,140,141]. However, hybrid functional DFT calculations later ruled out VGaON as a visible PL source and instead proposed the CN and CNON defects as responsible for the YL bands [24,98,103,105]. The YL band at 2.1 eV (now called YL3) and the GL1 band were tentatively linked to two charge states of the CN defect, while the YL band at 2.2 eV (now called YL1) was thought to be caused by the CNON [142,143]. These assignments have since been disproven. Current understanding identifies the −/0 and 0/+ levels of the CN as responsible for the YL1 (Section 3.1.2) and BLC (Section 4.1.1) bands, respectively, while the CNON donor does not contribute observable PL (Section 4.1.4). Lack of correlation between GL1 and either YL1 or YL3 further supports the conclusion that they originate from distinct centers.
The GL1 and RL1 arise from unidentified point defects with estimated concentrations of 1015–1016 cm−3 in high-quality HVPE GaN [142,146]. Defects containing VGa or VN are unlikely to be responsible [66] (Section 3.6). While Cl, with typical concentrations of ~1016 cm−3 in HVPE-grown GaN, appears to correlate with RL1 intensity in some samples, this may be coincidental [38,142]. The super-linear excitation behavior of GL1 suggests it is a secondary PL process, becoming prominent only after a primary PL band (denoted X) saturates. The X and GL1 may be caused by transitions via the −/0 and 0/+ levels of a deep defect. In n-type GaN, where PL efficiency is governed by hole capture, the IQE of X at low Pexc should exceed that of GL1 at high Pexc, similar to the behavior observed for the CN defect [25]. While RL1 is a candidate for the X, no consistent correlation has been observed between RL1 and GL1, leaving the identities of both bands unresolved.

3.3.2. VN-Related GL2 Band

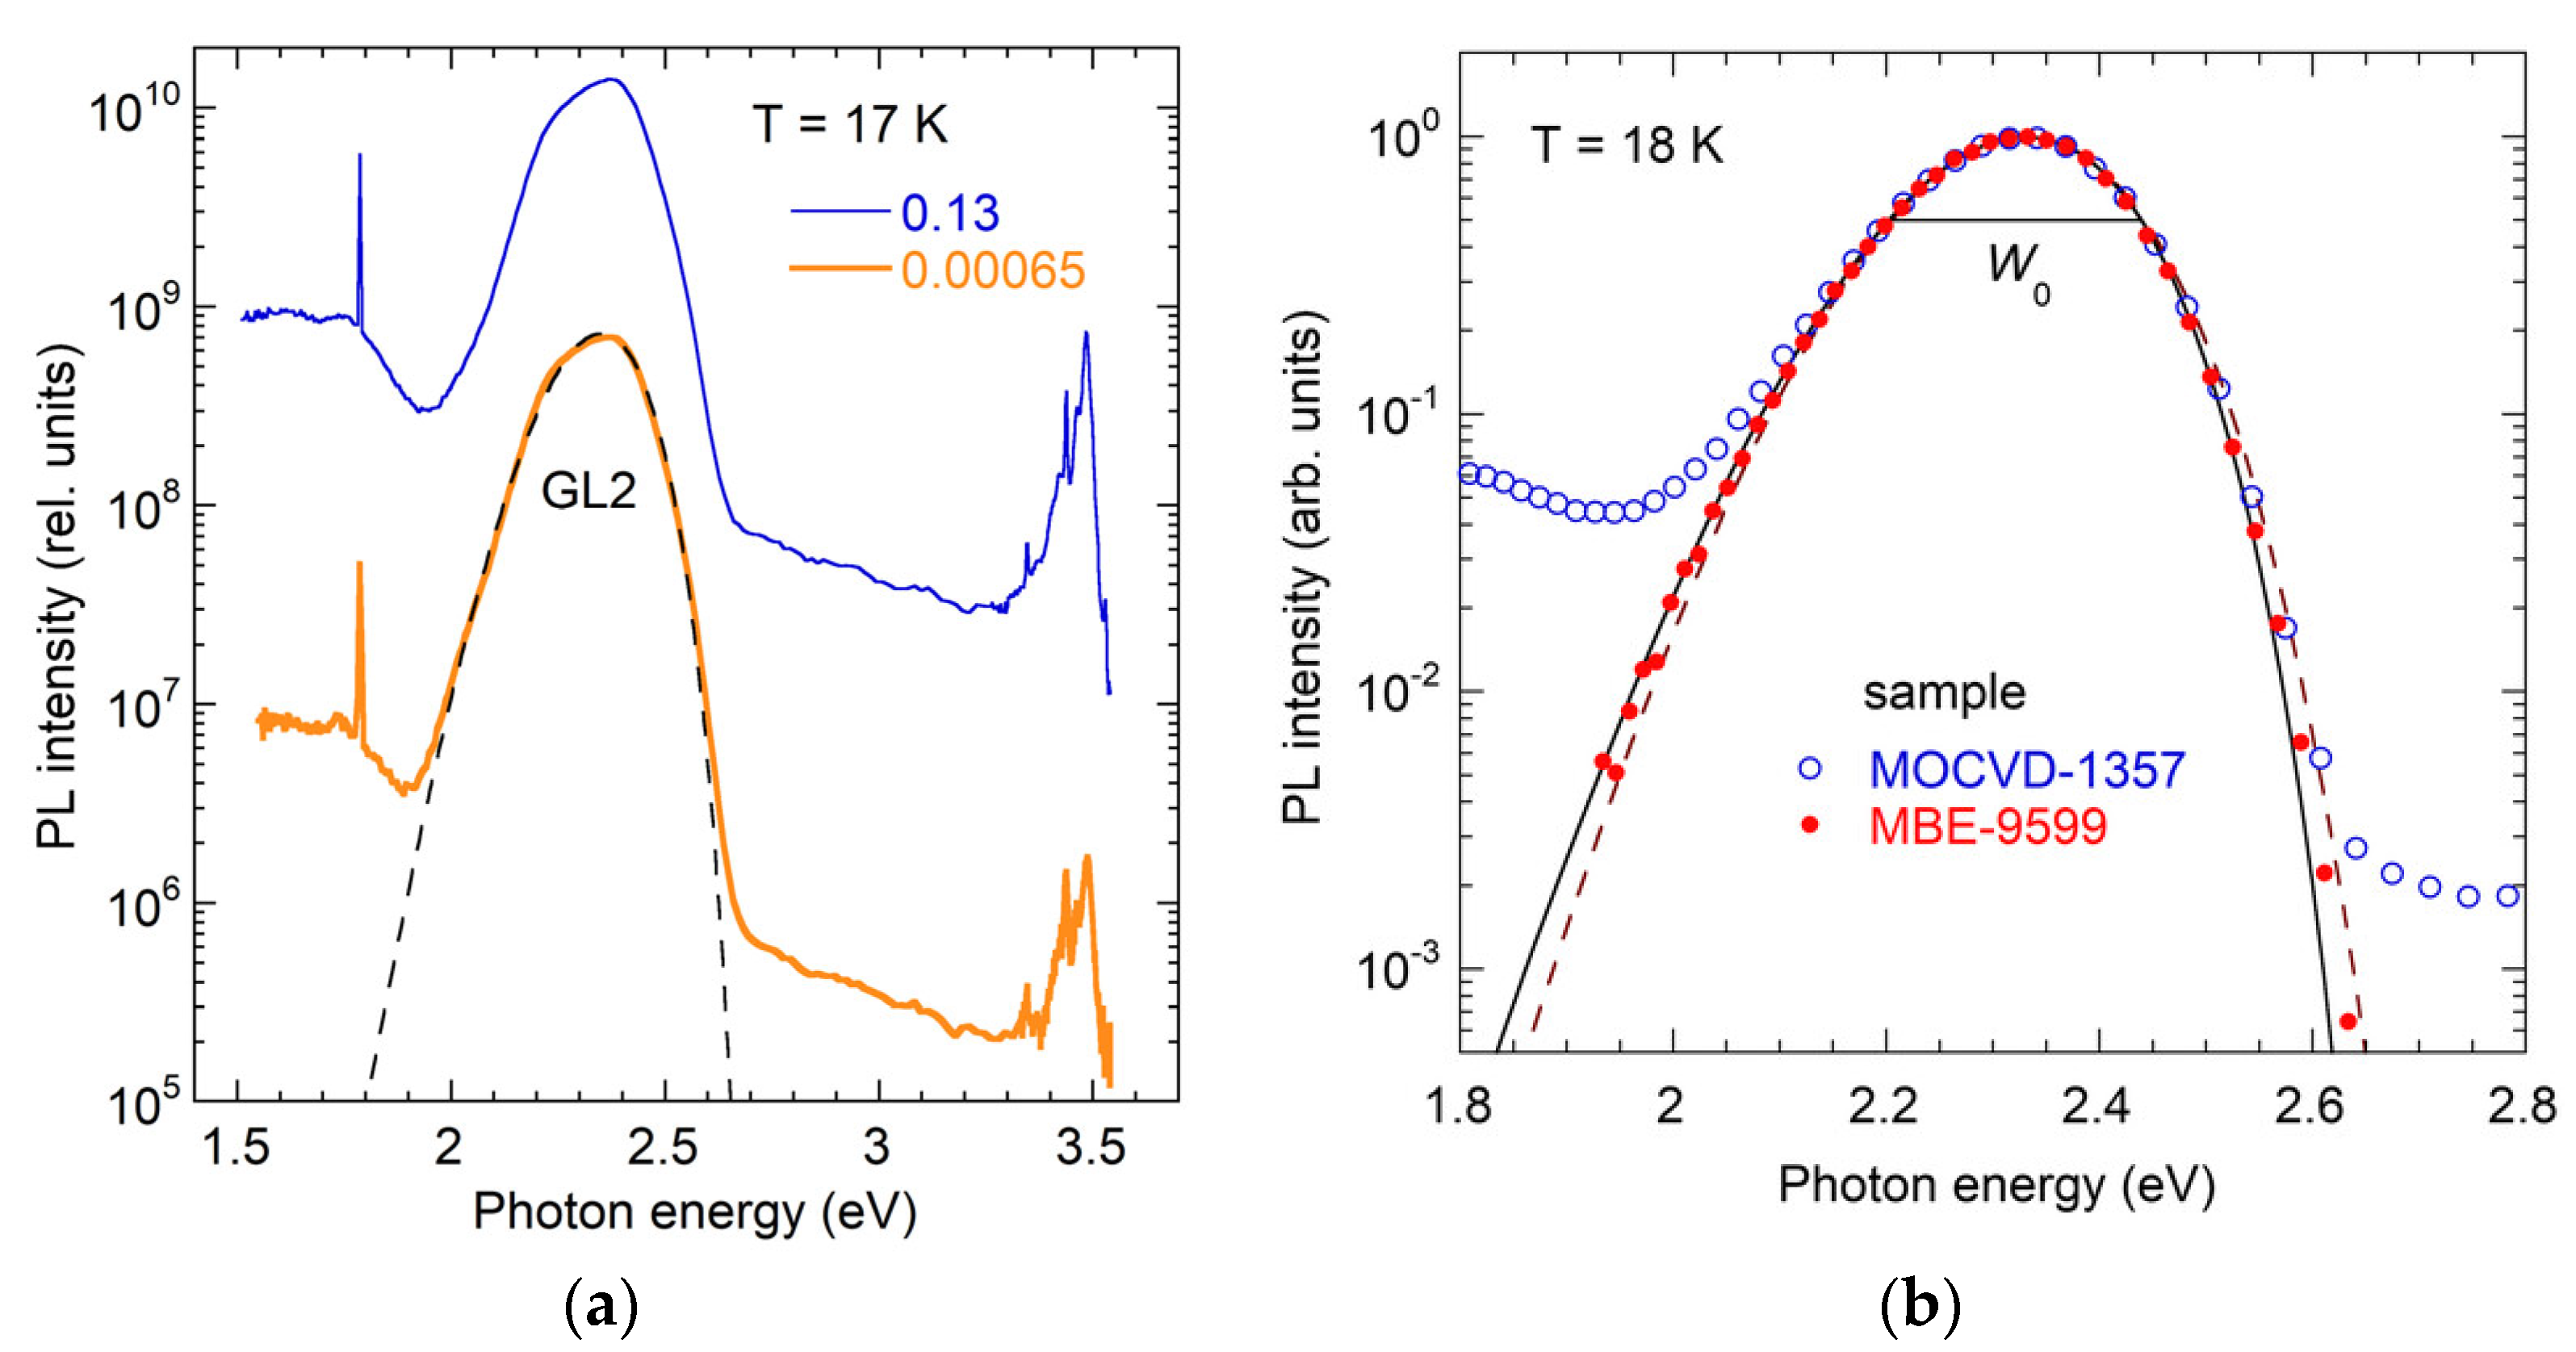
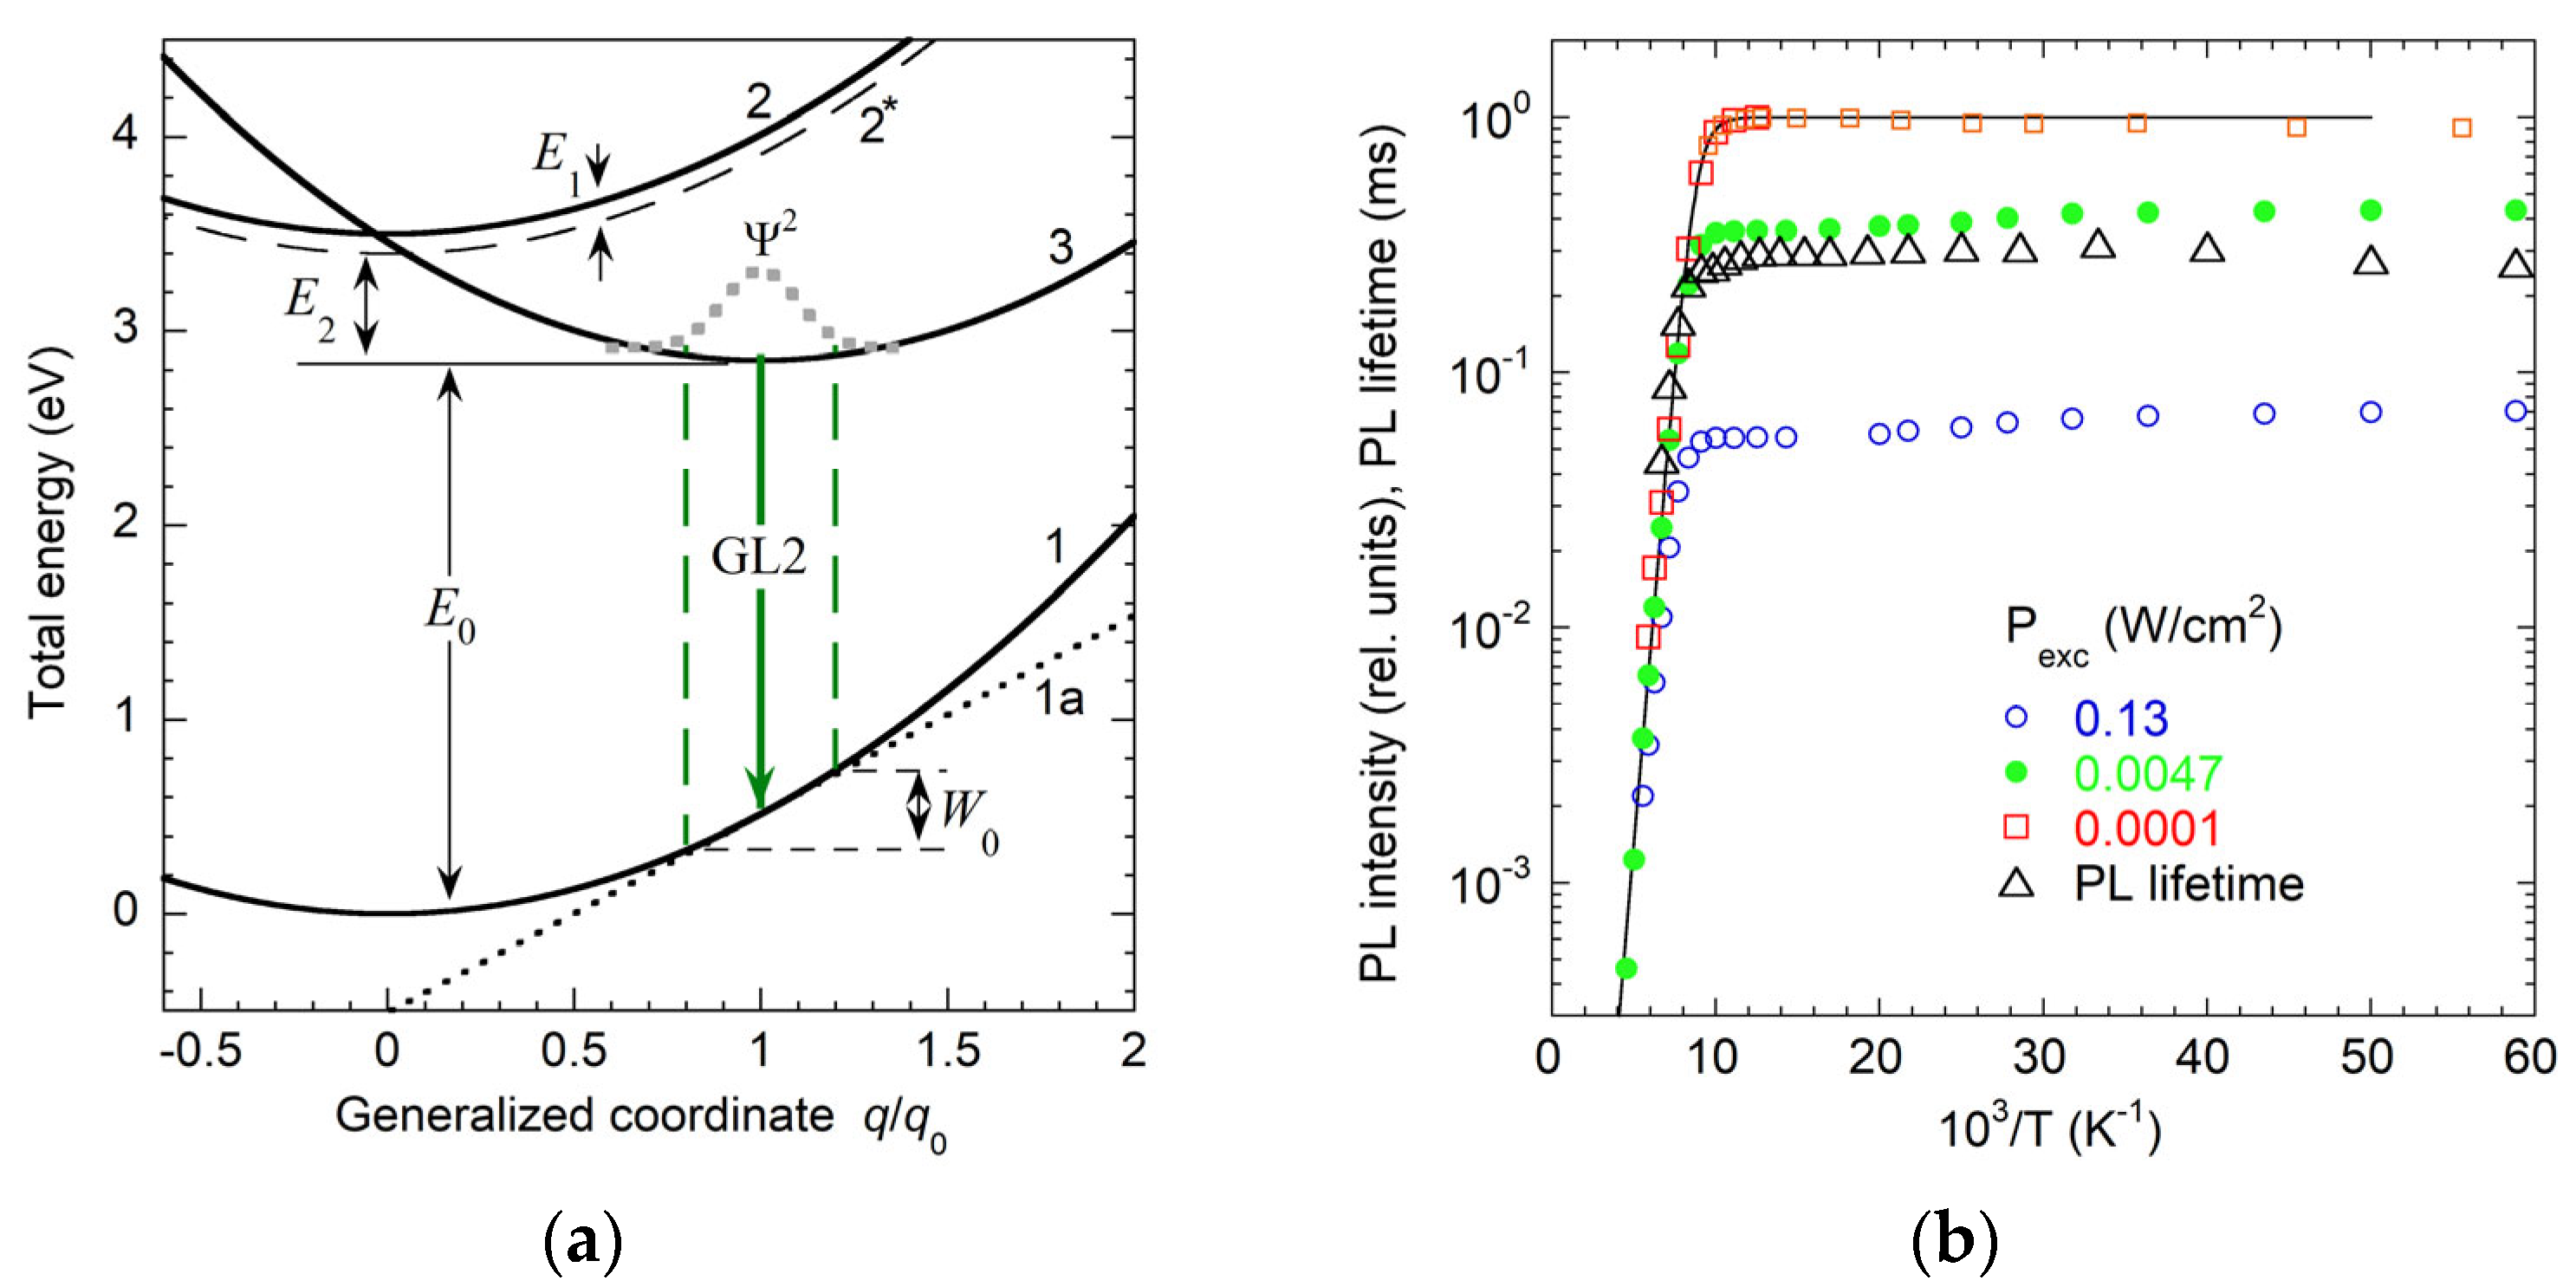
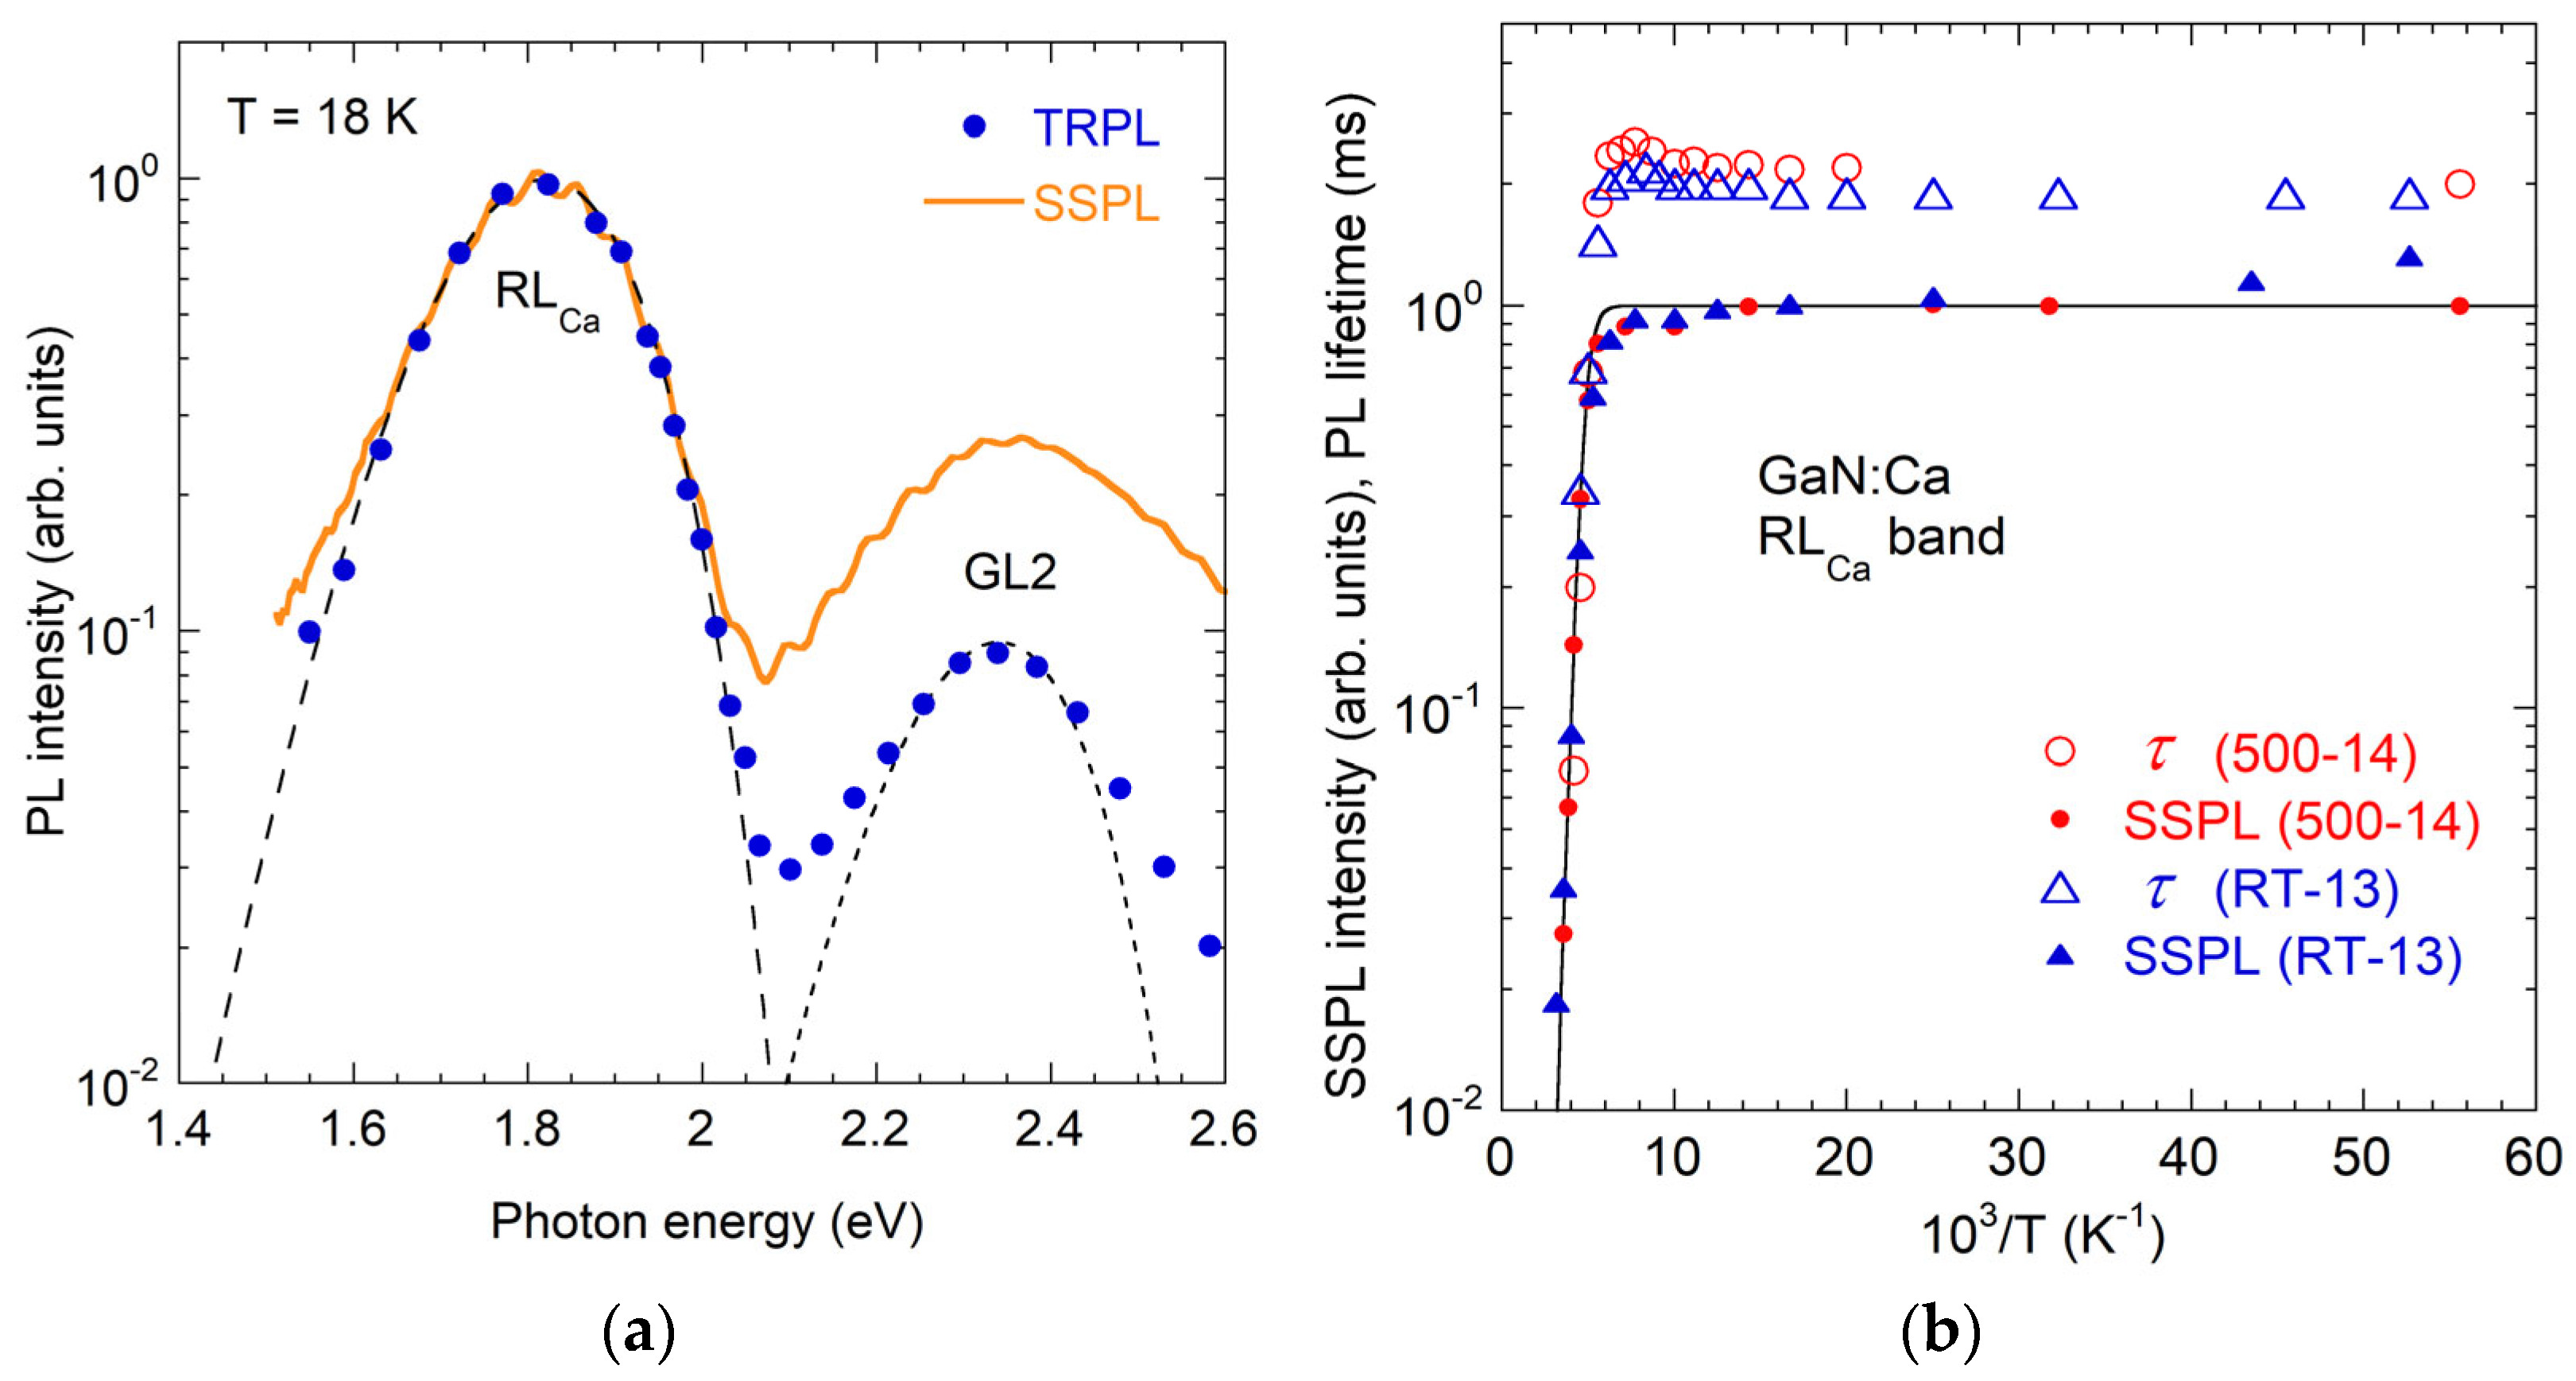
The GL2 band, peaking at ~2.33 eV, with a FWHM of 0.23–0.25 eV (Figure 16), is attributed to internal transitions from an excited state to the +/2+ level of the isolated VN [47]. This band is usually observed in high-resistivity or SI GaN, particularly in samples grown under Ga-rich conditions or doped/implanted with acceptor impurities such as Mg or Be [16,47,147,148,149,150,151]. A distinguishing feature of the GL2 band is its exponential decay after pulsed excitation, with a lifetime of ~300 μs at T < 100 K. Its relatively narrow FWHM is consistent with the configuration-coordinate model (Figure 17a), and the spectral shape can be quantitatively described with Equation (6) [35,37,47,152].
The GL2 intensity is temperature-independent below 100 K, decreasing exponentially between 100 and ∼200 K with an activation energy E1 ≈ 0.15 eV. Unlike the RL2 band (Section 3.2.2), both the IPL(T) and τ(T) show identical temperature behavior (Figure 17b). This quenching is attributed to thermal electron emission from the excited state to the conduction band, with E1 representing the depth of the excited state below the CBM.
At temperatures above ~180 K, the quenching accelerates and follows distinct mechanisms depending on the sample conductivity: the TAQ mechanism in SI GaN:Mg and the Schön–Klasens mechanism in conductive p-type GaN:Mg [47]. This high-temperature quenching is attributed to the thermal emission of holes from the +/2+ level to the valence band. The +/2+ level is located at E2 = 0.40–0.43 eV above the VBM as determined from Equation (3) for SI GaN:Mg or Equation (2) for p-type GaN:Mg [47]. In principle, transitions from an excited state to the 2+/3+ level may also cause a similar PL band in p-type GaN:Mg, since the calculated +/2+ and 2+/3+ levels are very close [47]. However, no clear experimental evidence exists to support the existence of two distinct GL2 bands associated with two charge transition levels in GaN. Thus, the question of whether the experimentally observed GL2 band arises from transitions via the +/2+ or 2+/3+ level remains unresolved.

3.3.3. Aquamarine Band in MBE GaN

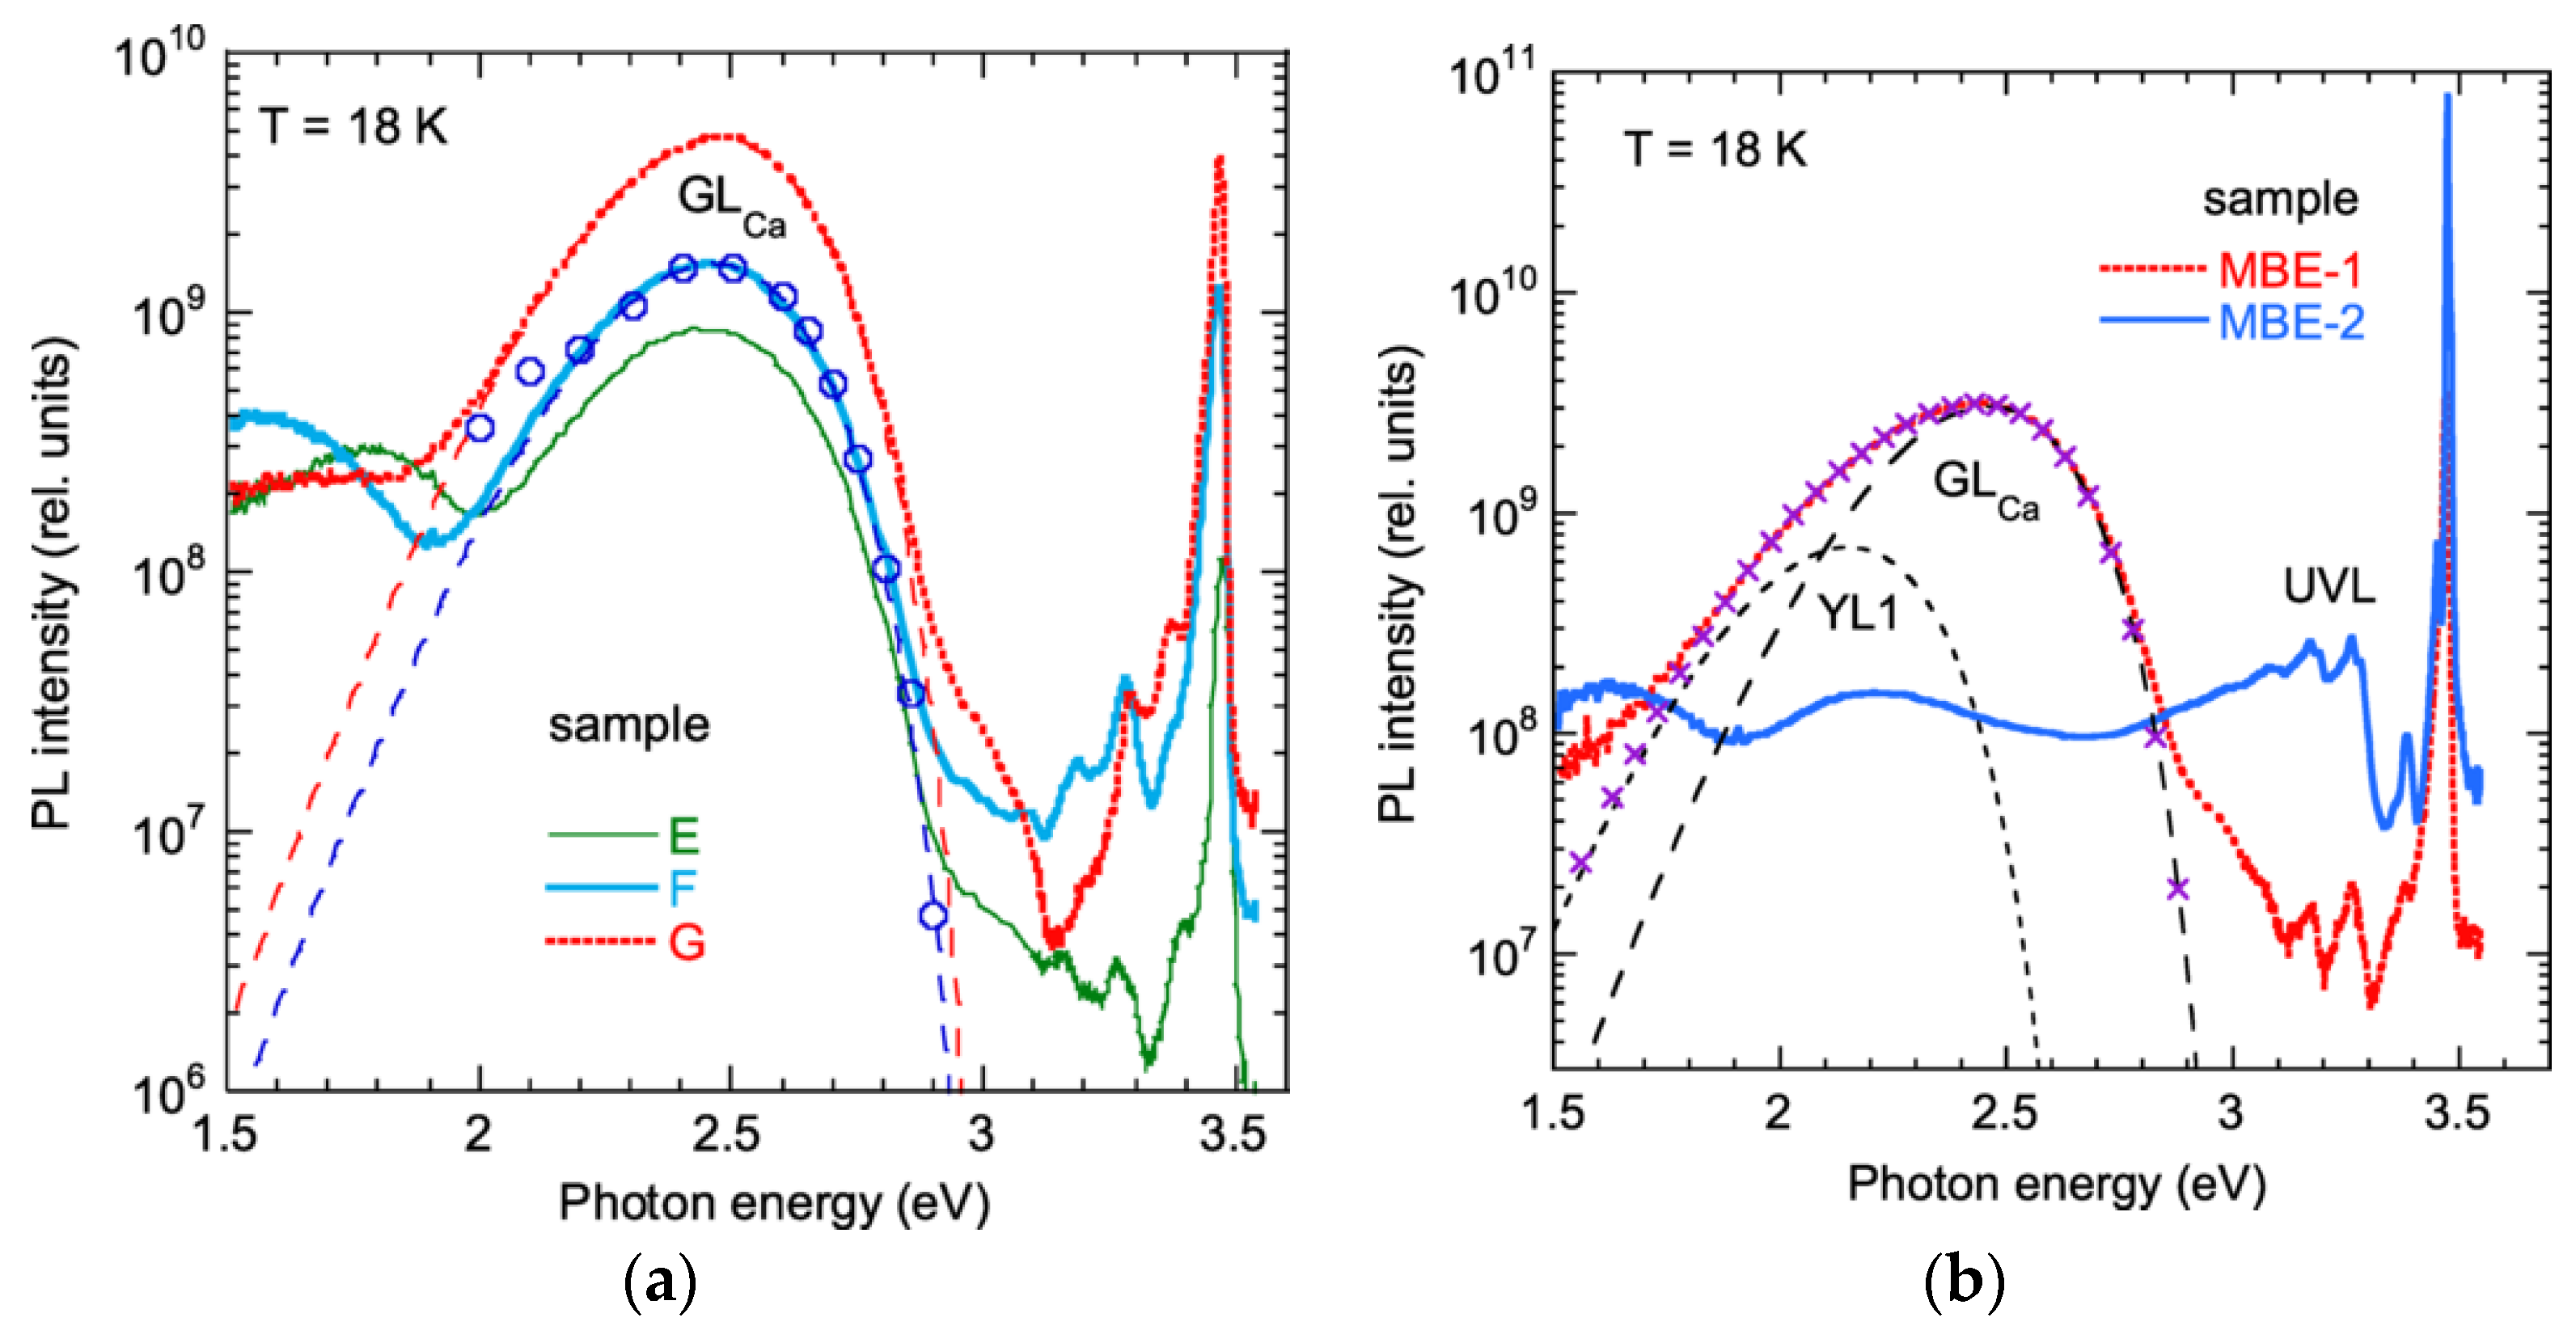
A PL band, peaking at ∼2.5 eV, was observed in GaN layers grown by MBE on freestanding HVPE GaN substrates [153]. Initially termed the aquamarine luminescence (AL) band due to its color [153,154], it has been eventually identified as the CaGa-related GLGa band [49]. Low-temperature MBE growth of GaN and InGaN often introduces Ca contamination [155,156,157]. A more detailed analysis of the GLCa band is provided in Section 4.6.

3.4. Blue Luminescence Bands in Undoped GaN (BL1, BL2, BL3)

Two broad blue luminescence (BL) bands are commonly observed in undoped GaN: the BL1 band, peaking at 2.9 eV, and the BL2 band at 3.0 eV. The third band, BL3, emerges at high excitation intensities in HVPE GaN and is associated with the RY3 defect. All three bands exhibit ZPL and phonon-related fine structure in high-quality GaN samples. These spectral features allow for detailed analysis of their vibrational properties.

3.4.1. ZnGa-Related BL1 Band

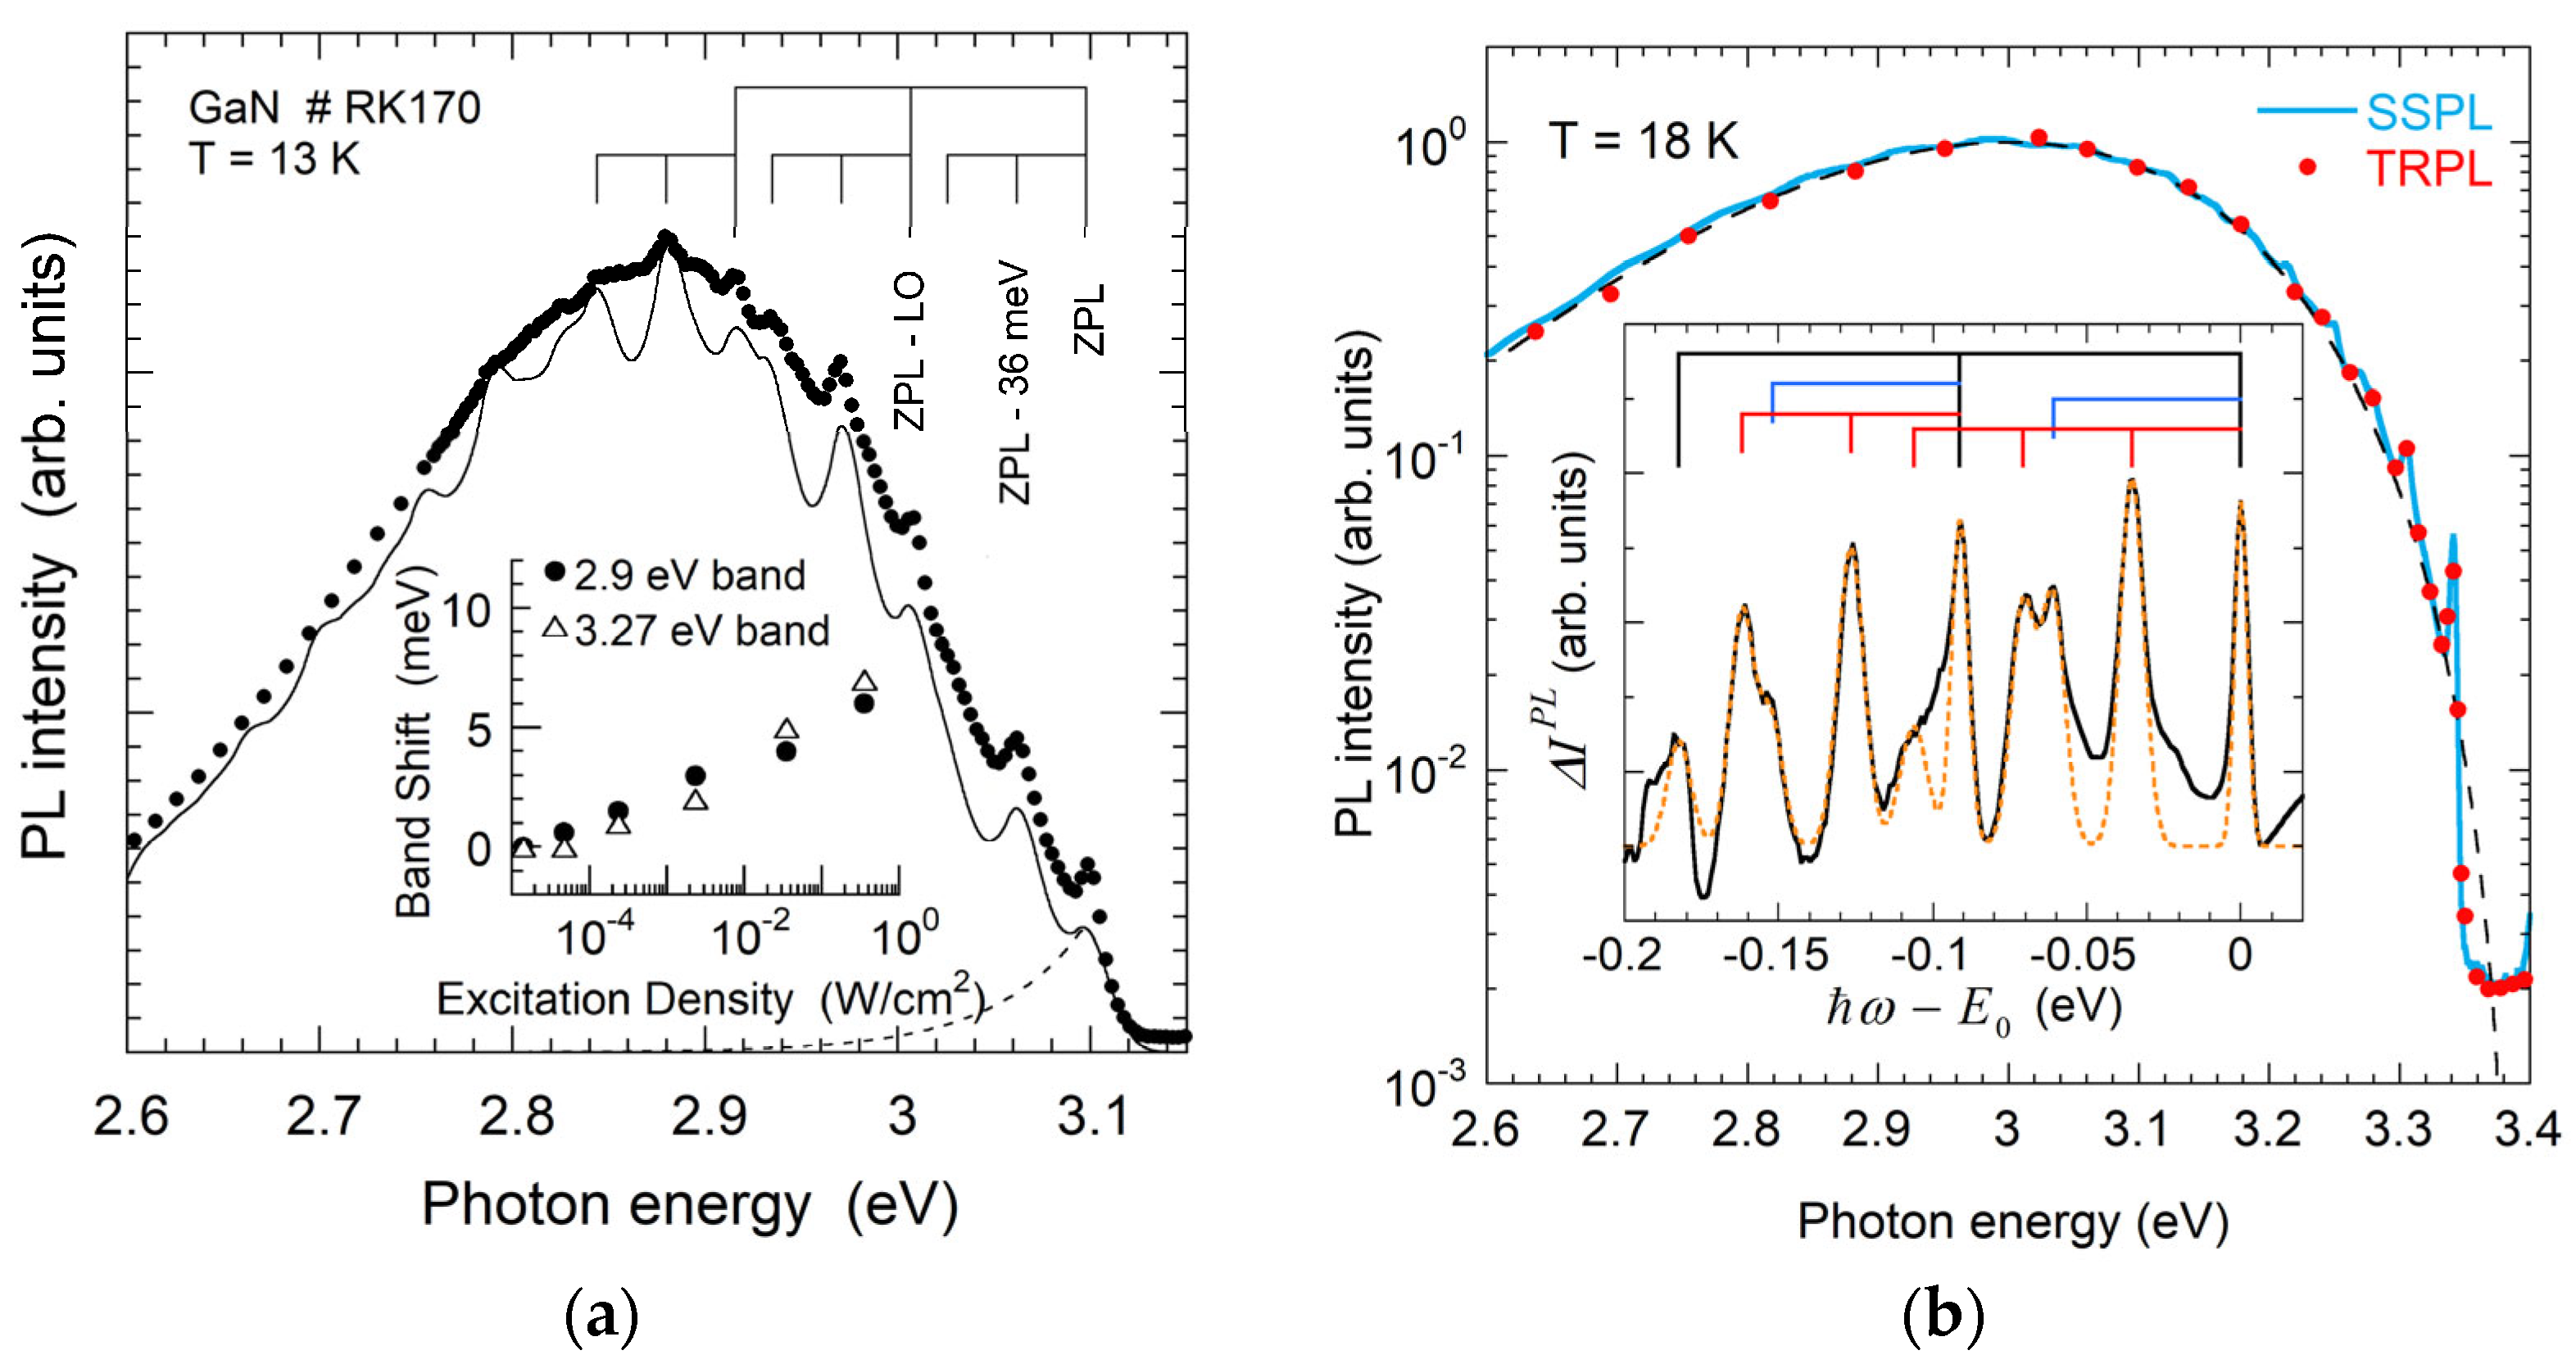
The BL1 band, peaking at 2.9 eV, is observed in undoped GaN grown by MOCVD, HVPE, or AT techniques due to Zn contamination. The assignment of BL1 to ZnGa acceptors is well established and supported by both experimental and theoretical studies [51,52,57]. The BL1 band exhibits a ZPL at 3.10 eV and distinctive phonon-related fine structure (Figure 18a). At low temperatures (T < 50 K), BL1 results from DAP recombination involving shallow donors and the ZnGa acceptors. A slight blueshift (up to 7 meV) with increasing excitation intensity (inset to Figure 18a) reflects saturation of distant pairs contributing at lower energies, a hallmark of DAP recombination. This shift is constrained by the shallow donor’s ionization energy [84,158].
The fine structure of the BL1 band, observable at low temperatures, consists of two sets of sharp peaks (Figure 18a). Peaks separated by 36 meV are attributed to a pseudo-local phonon mode, while those at 91.5 meV correspond to the LO phonon mode of the GaN lattice [50]. Vibrational parameters for BL1 and other PL bands in GaN are summarized in Table 3. The ZnGa-related BL1 band (also referred to as BLZn) is prevalent in MOCVD- and AT-grown GaN, and occasionally in HVPE GaN, due to unintentional Zn incorporation.

3.4.2. CNHi-Related BL2 Band

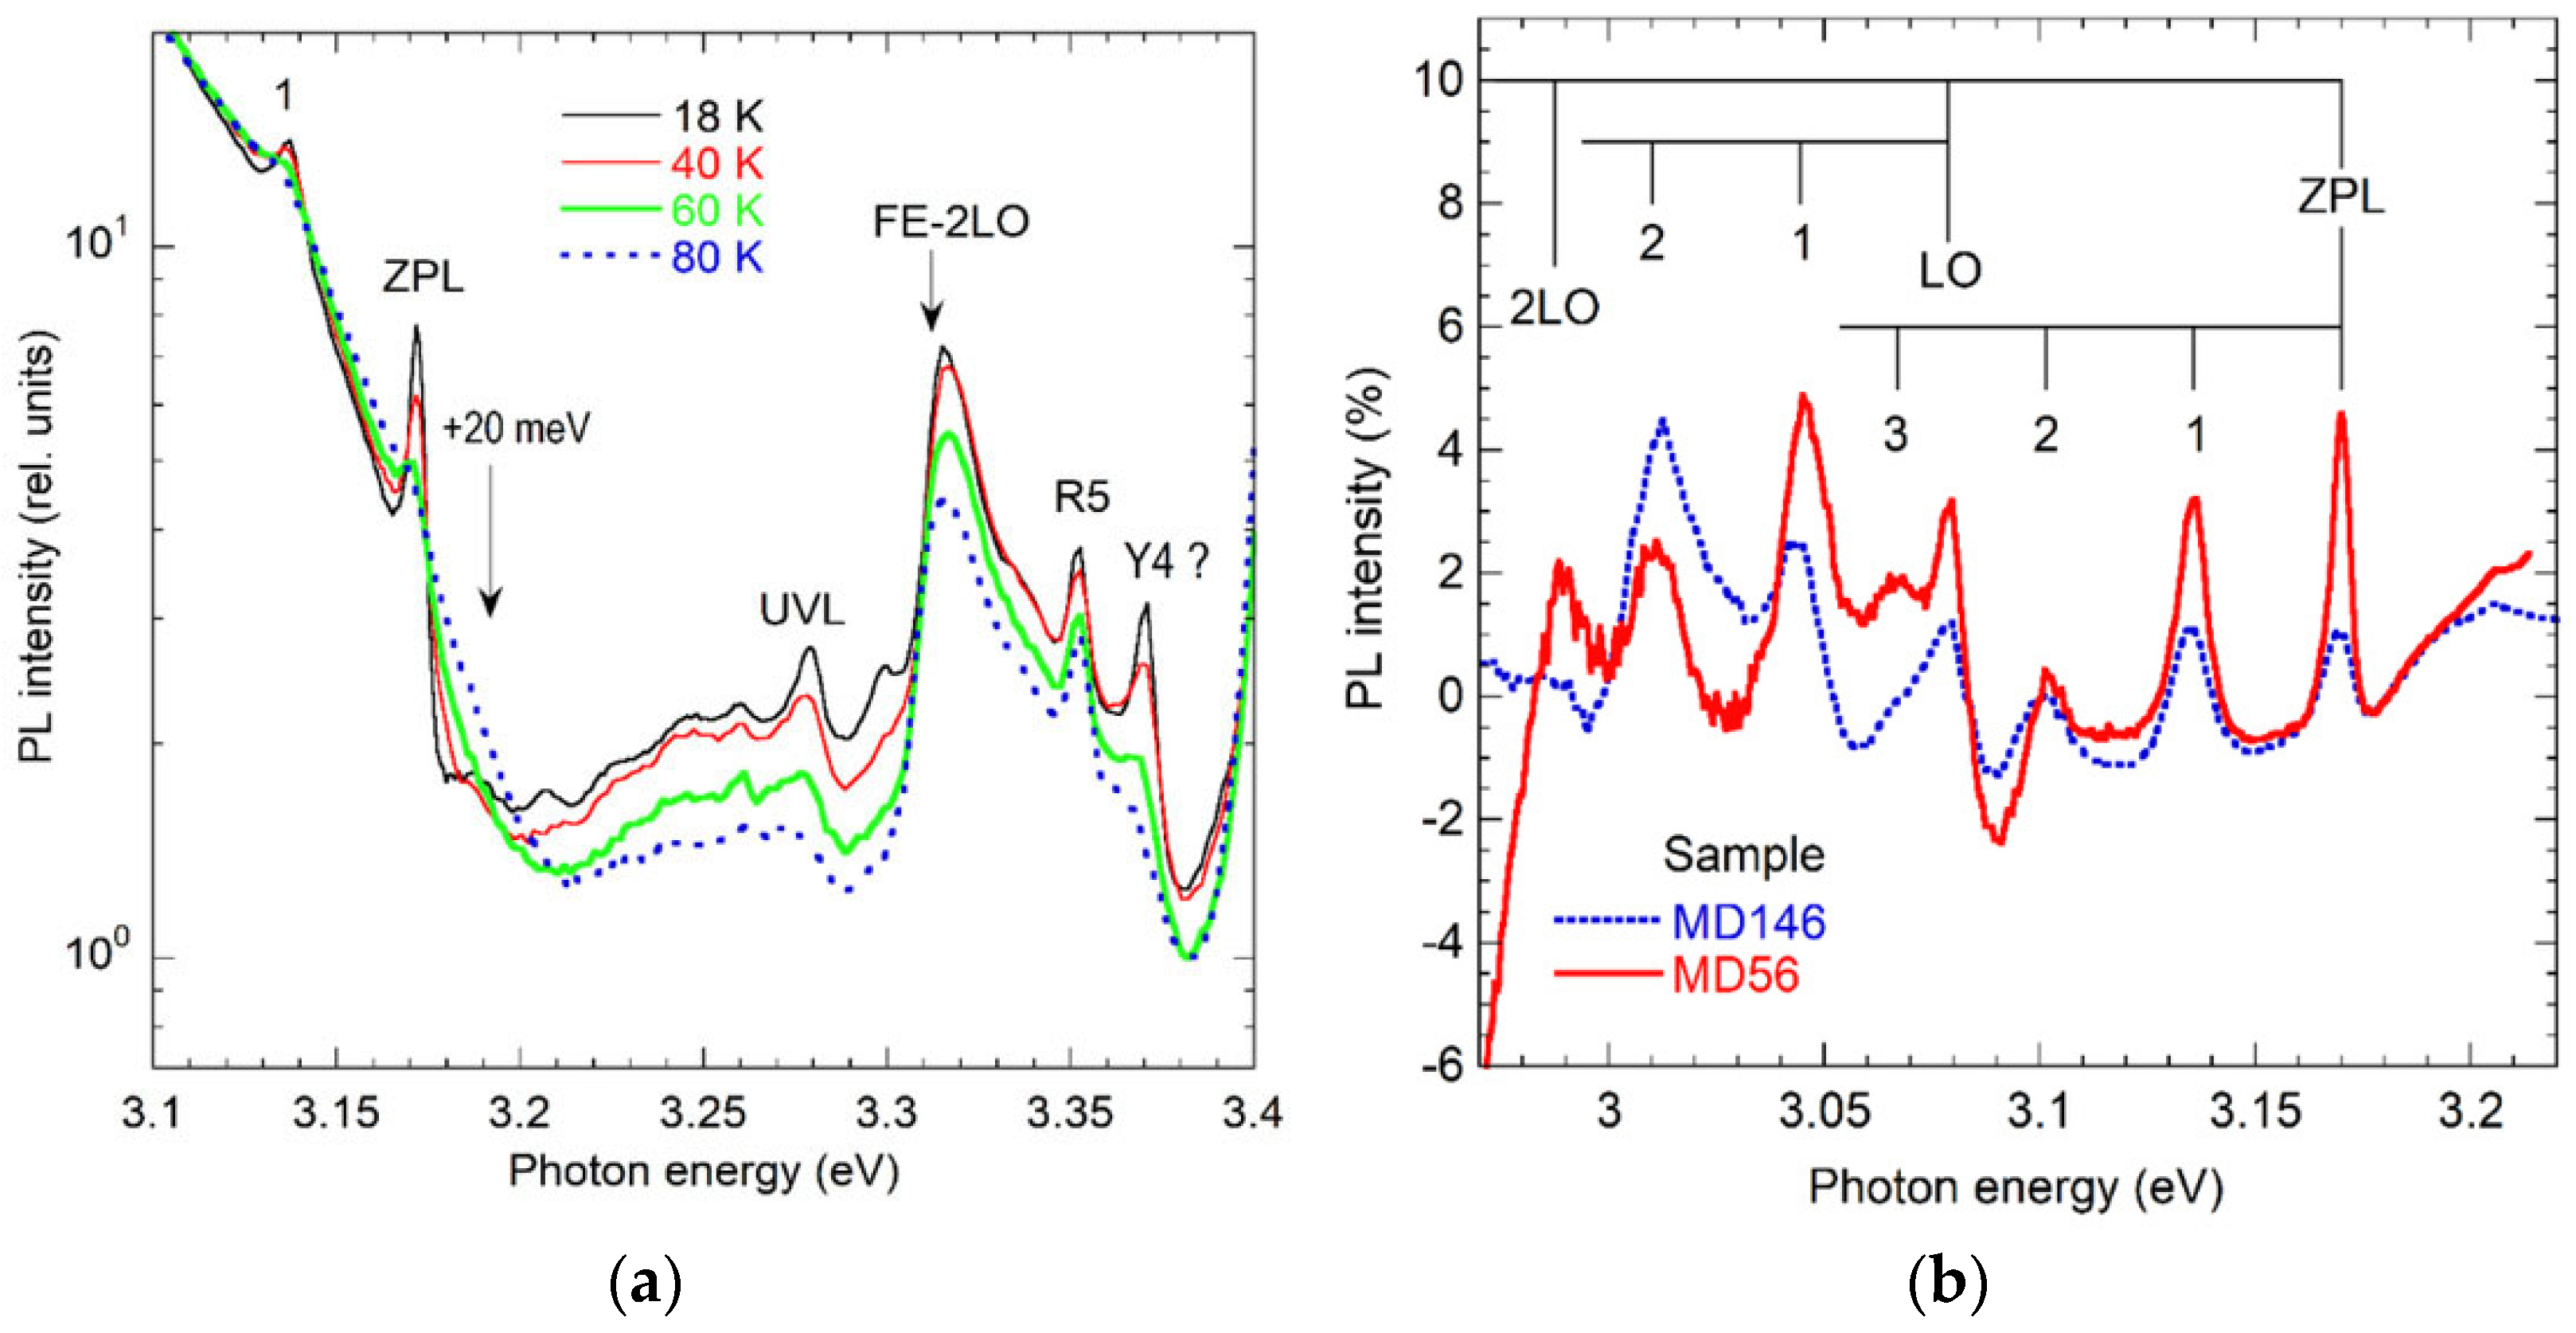
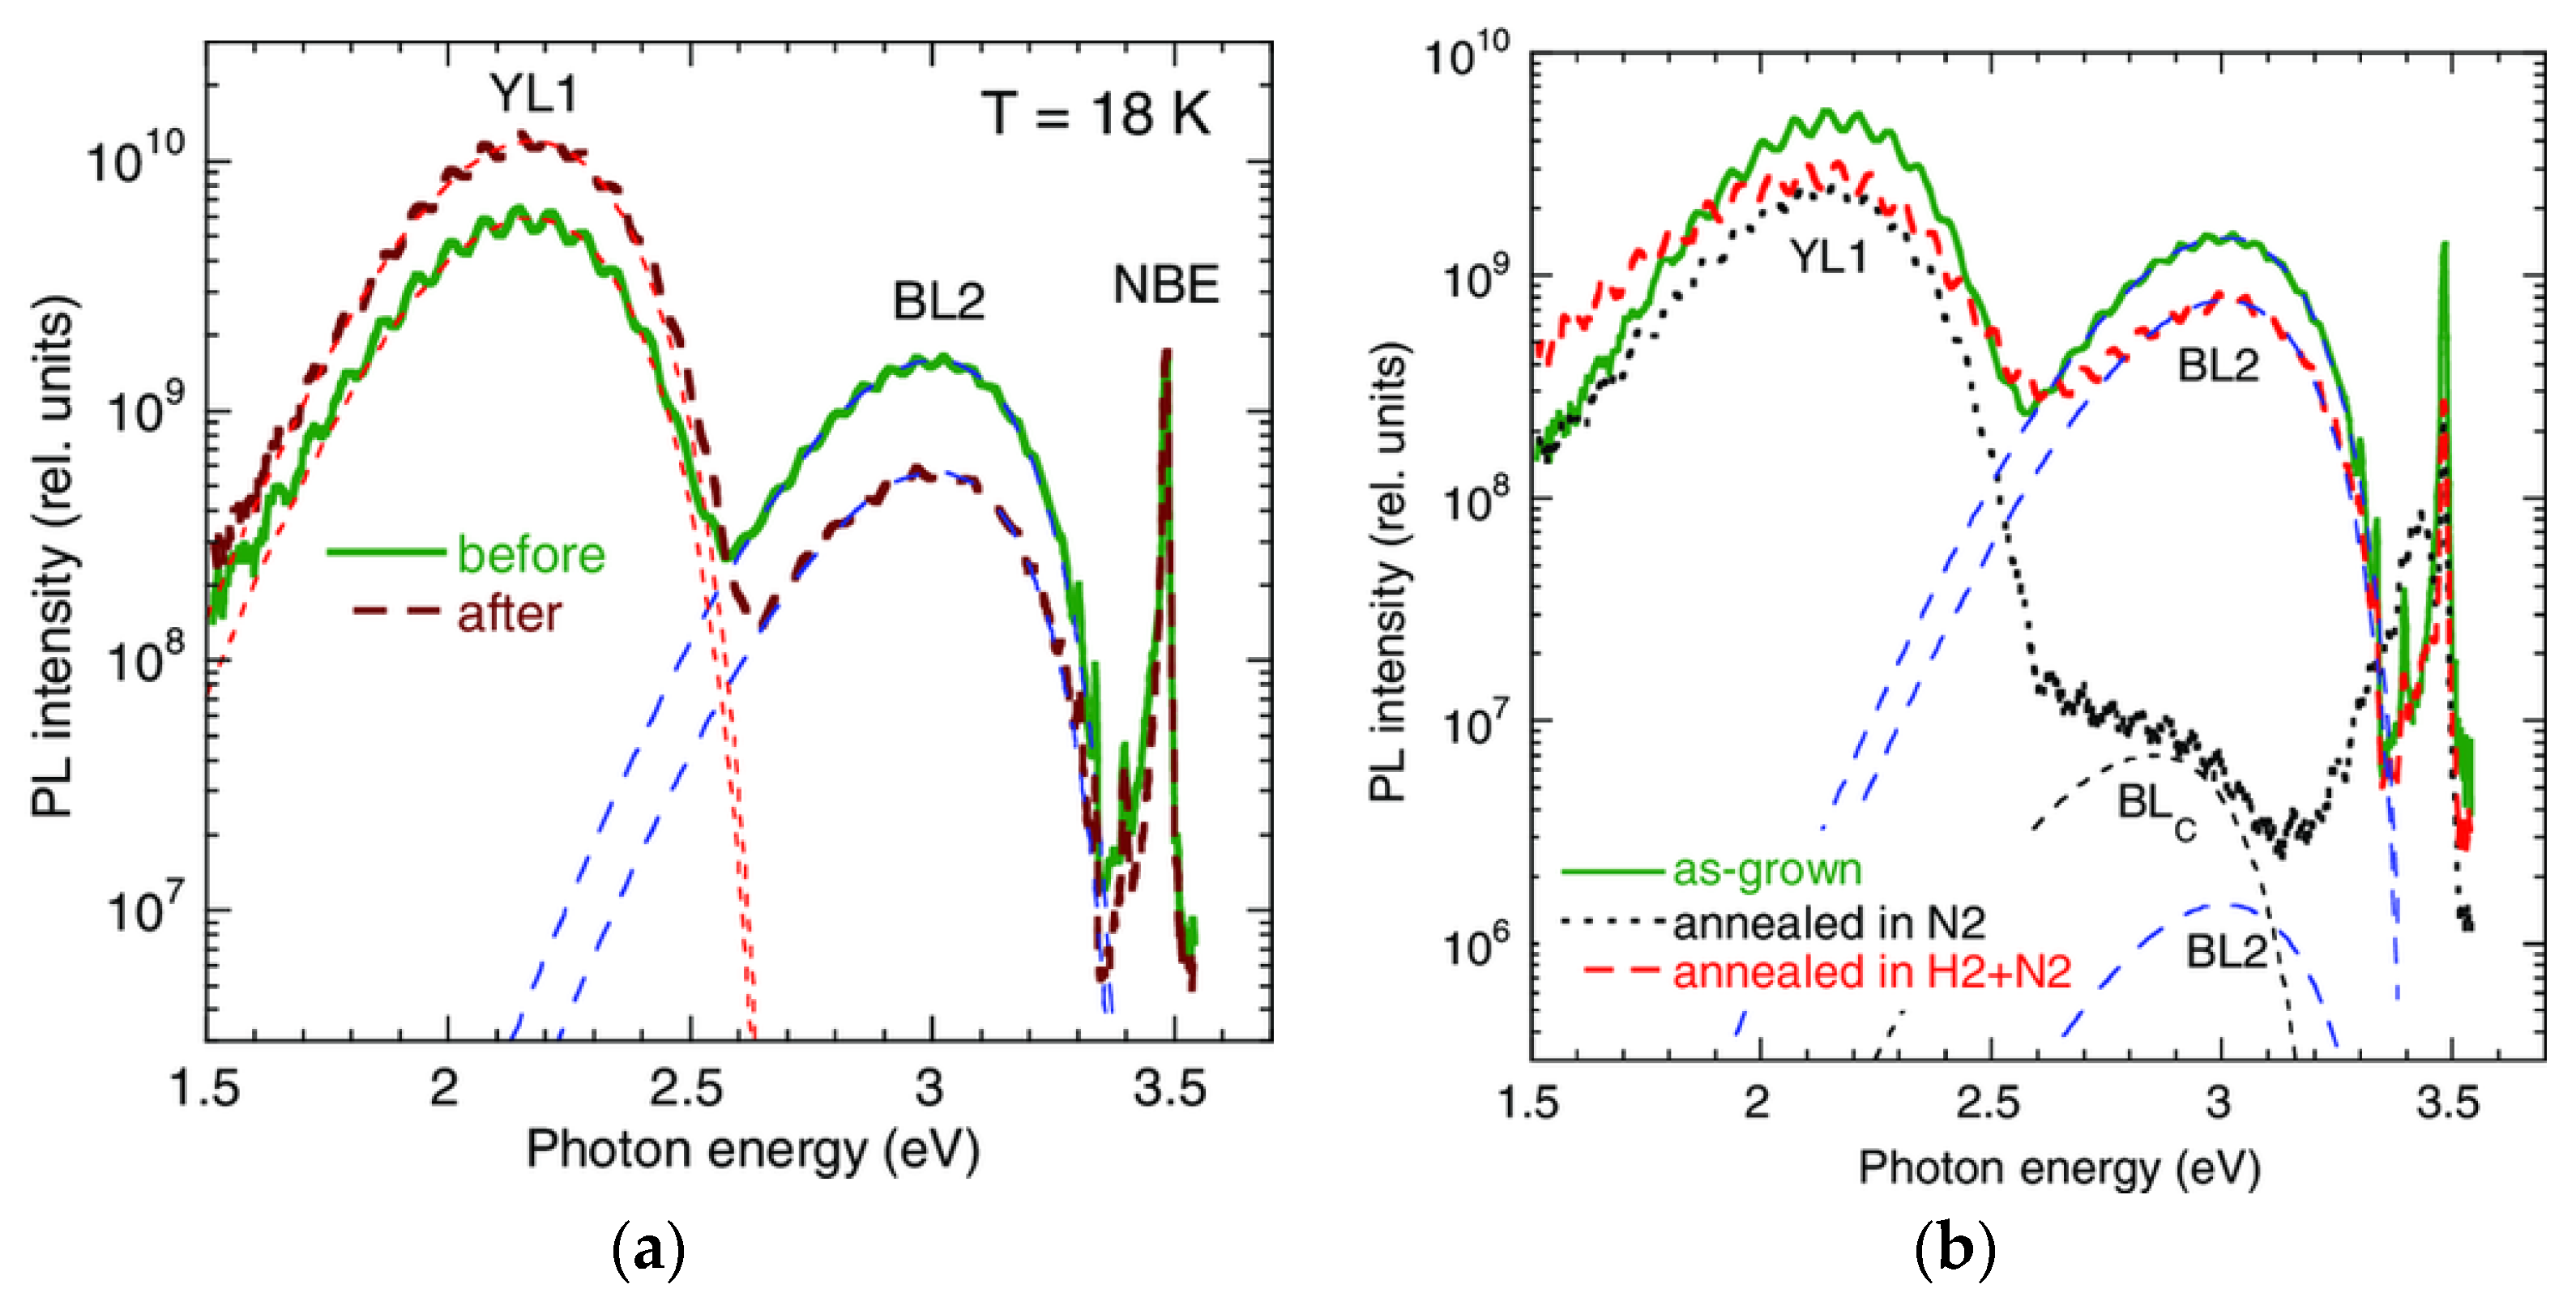
The BL2 band, peaking at 3.0 eV, with a ZPL at 3.33 eV, is distinguished by photo-induced metastability—specifically, PL bleaching under continuous UV laser exposure. In early studies, it was linked to Ga vacancies [159] and was often confused with Zn-related BL1. The concurrent bleaching of BL2 and the rise in the YL1 band upon UV illumination [159,160,161,162,163,164] suggested a relationship, later attributed to the dissociation of the CNHi complex [55]. Under UV exposure, CNHi complexes dissociate, the BL2 intensity decreases, and the CN-related YL1 intensity increases. This metastability is analyzed in Section 4.1.2, while other features of the BL2 band are briefly discussed below (Figure 19).
The BL2 band arises from internal transitions within the CNHi donor, specifically from an excited state ∼20 meV below the CBM to the ground state 0.15 eV above the VBM [55]. Its exponential decay after a laser pulse at low temperatures (τ ≈ 300 ns at T < 20 K) confirms the internal transition mechanism. At ∼60 K, a high-energy shoulder emerges near the ZPL, indicating contributions from CBM-to-defect transitions (Figure 19a). The ZPL energy remains constant (±0.2 meV) across three orders of magnitude in Pexc, further supporting the internal transition model over DAP-type recombination. The fine structure of the BL2 band exhibits phonon replicas involving the LO mode (91–92 meV) and two pseudo-local modes (35.4 and 61 meV) (Figure 18b and Table 3).
The thermal quenching of BL2 is tunable with Pexc but not abrupt (Figure 19b), driven by thermal hole emission from the 0/+ level of CNHi to the valence band. The hole-capture coefficient for this defect is estimated as Cp = (4.4 ± 2.0) × 10−8 cm3s−1 [55].

3.4.3. RY3-Related BL3 Band

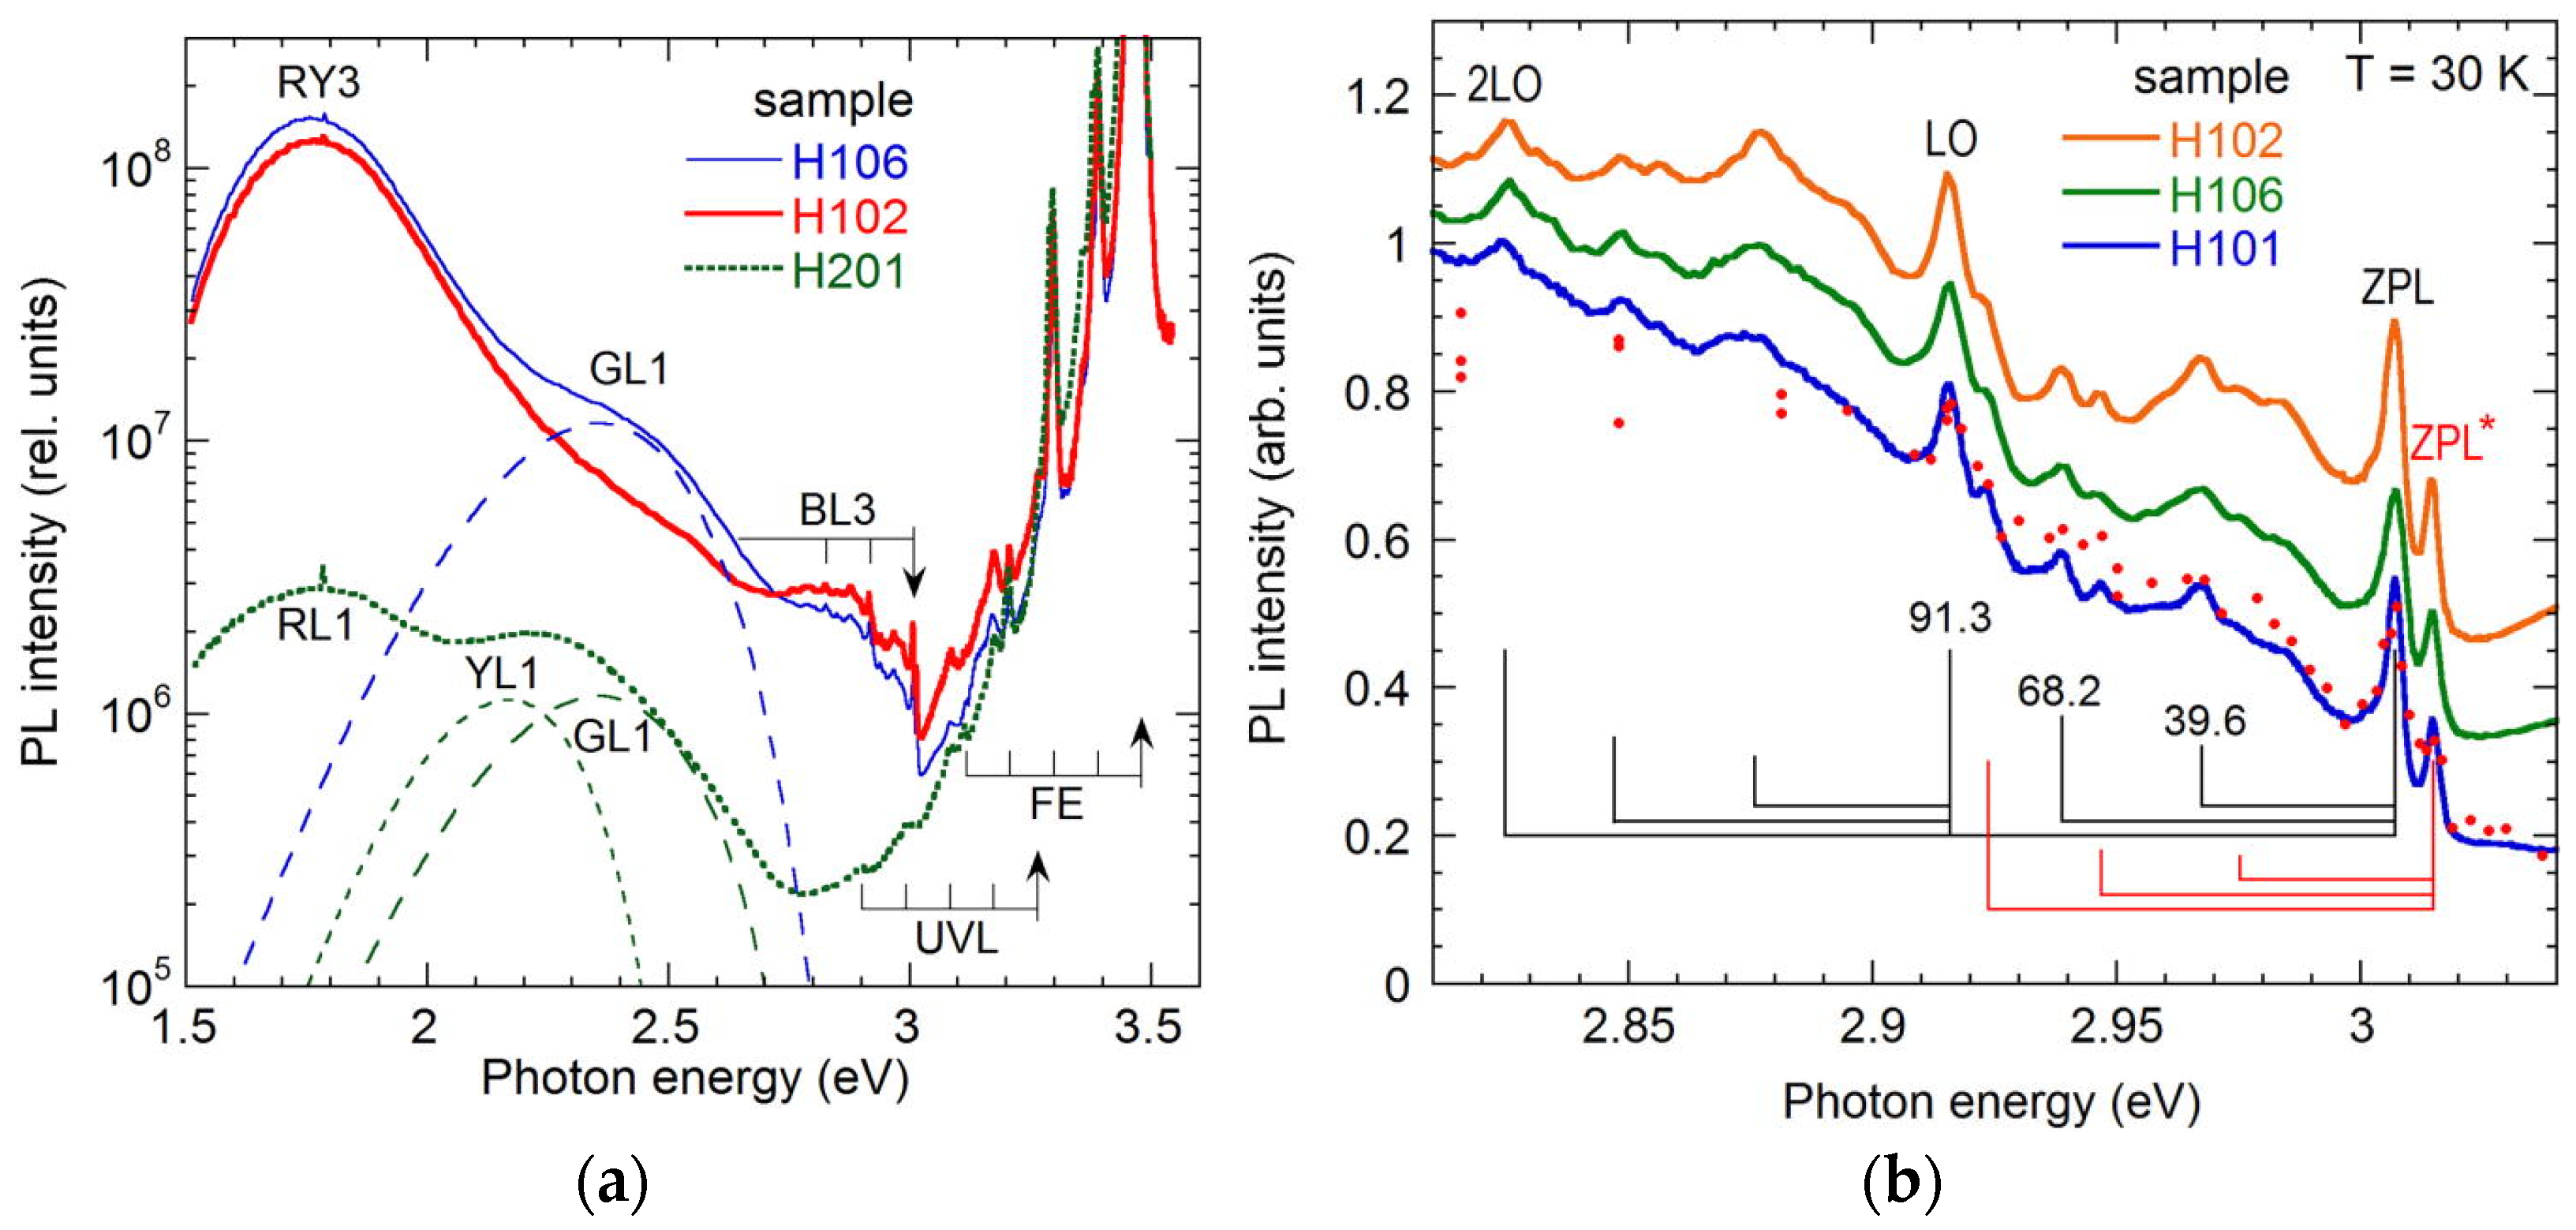
In undoped HVPE GaN samples exhibiting strong RL3 and YL3 bands (Section 3.1.4 and Section 3.2.3), a blue band, BL3, emerges at high Pexc (Figure 20a). It has super-linear dependence on Pexc, a signature of a secondary PL arising from radiative recombination following two-hole capture by a defect [56]. Two ZPLs at 3.0071 and 3.0147 eV are observed, followed by phonon replicas, including LO phonons (ħΩLO = 91.3 meV) and two pseudo-local vibrational modes (ħΩ1 = 39.6 meV, ħΩ2 = 68.2 meV) (Figure 20b). The BL3 band is attributed to transitions from excited states 20–30 meV below the CBM to the 0/+ level of the RY3 defect, located ∼0.47 eV above the VBM. The two ZPLs likely arise from excited states separated by 7.6 meV [56]. The PL lifetime is short (τ0 < 10 ns), further supporting a fast internal transition mechanism in a donor-type defect.

3.5. Ultraviolet Luminescence Band (UVL)

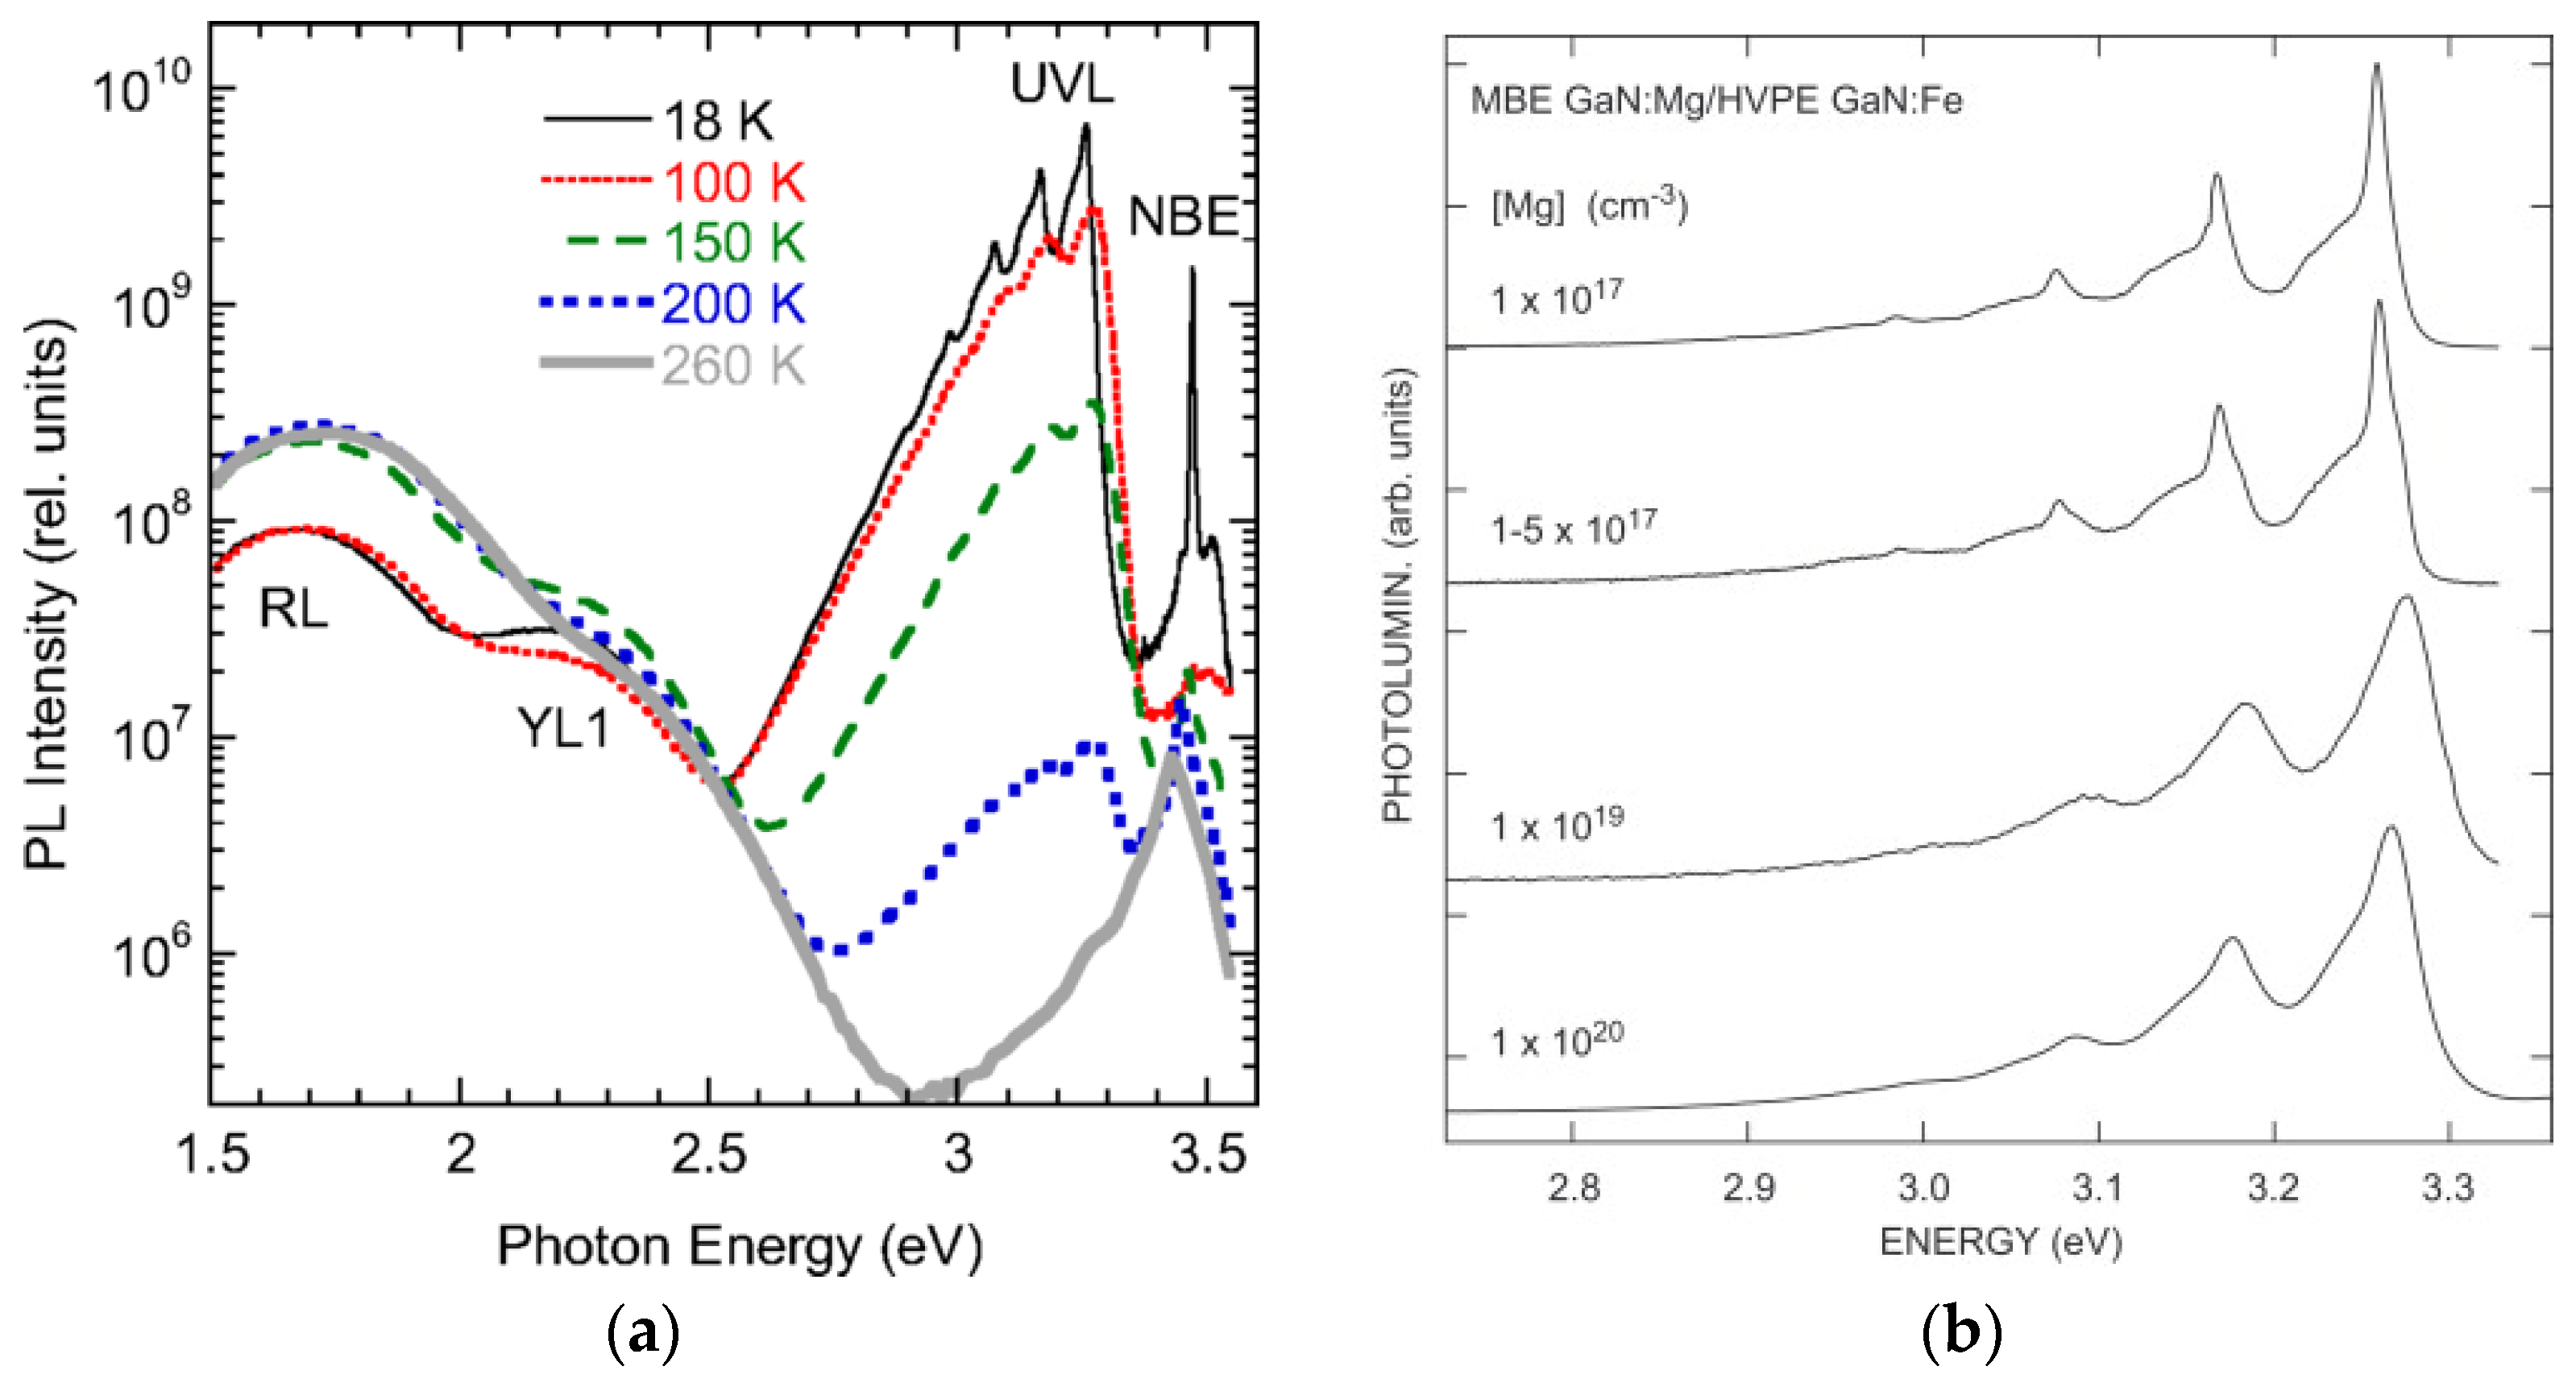
The UVL band peaking at ∼3.27 eV, is ubiquitous in undoped GaN grown by various techniques. It results from electron transitions from the conduction band (or shallow donors at low temperatures) to the shallow MgGa acceptor with a −/0 level at 0.223 eV above the VBM [40,62,165]. Also known as the shallow DAP or shallow donor-shallow acceptor (SD-SA) band [9,76,166], it is denoted hereafter UVL (or UVLMg to reflect its MgGa origin), as DAP transitions dominate all acceptor-related PL in GaN at low temperatures [66].
Early studies proposed alternative shallow acceptors, including VGa, CN, and SiN [16,166,167,168]. In particular, Glaser et al. [166] observed a UVL band in MOCVD-grown Si-doped GaN, indistinguishable from UVLMg in Mg-doped GaN. In those experiments, Si concentrations were (2–3) × 1017 cm−3, and the UVL intensity increased with increasing Si content [166,167]. Interestingly, ODMR studies revealed the identical behavior of the UVL band in both Mg- and Si-doped samples, suggesting the involvement of shallow effective-mass acceptors in both cases [166,169]. Note that early theoretical calculations also predicted that CN and SiN are shallow acceptors in GaN [17,18,19,20,21,22]. However, more recent hybrid functional DFT calculations have demonstrated that these impurities form deep acceptor levels: at 0.9 eV for CN [24] and 2.1 eV for SiN [103,170].
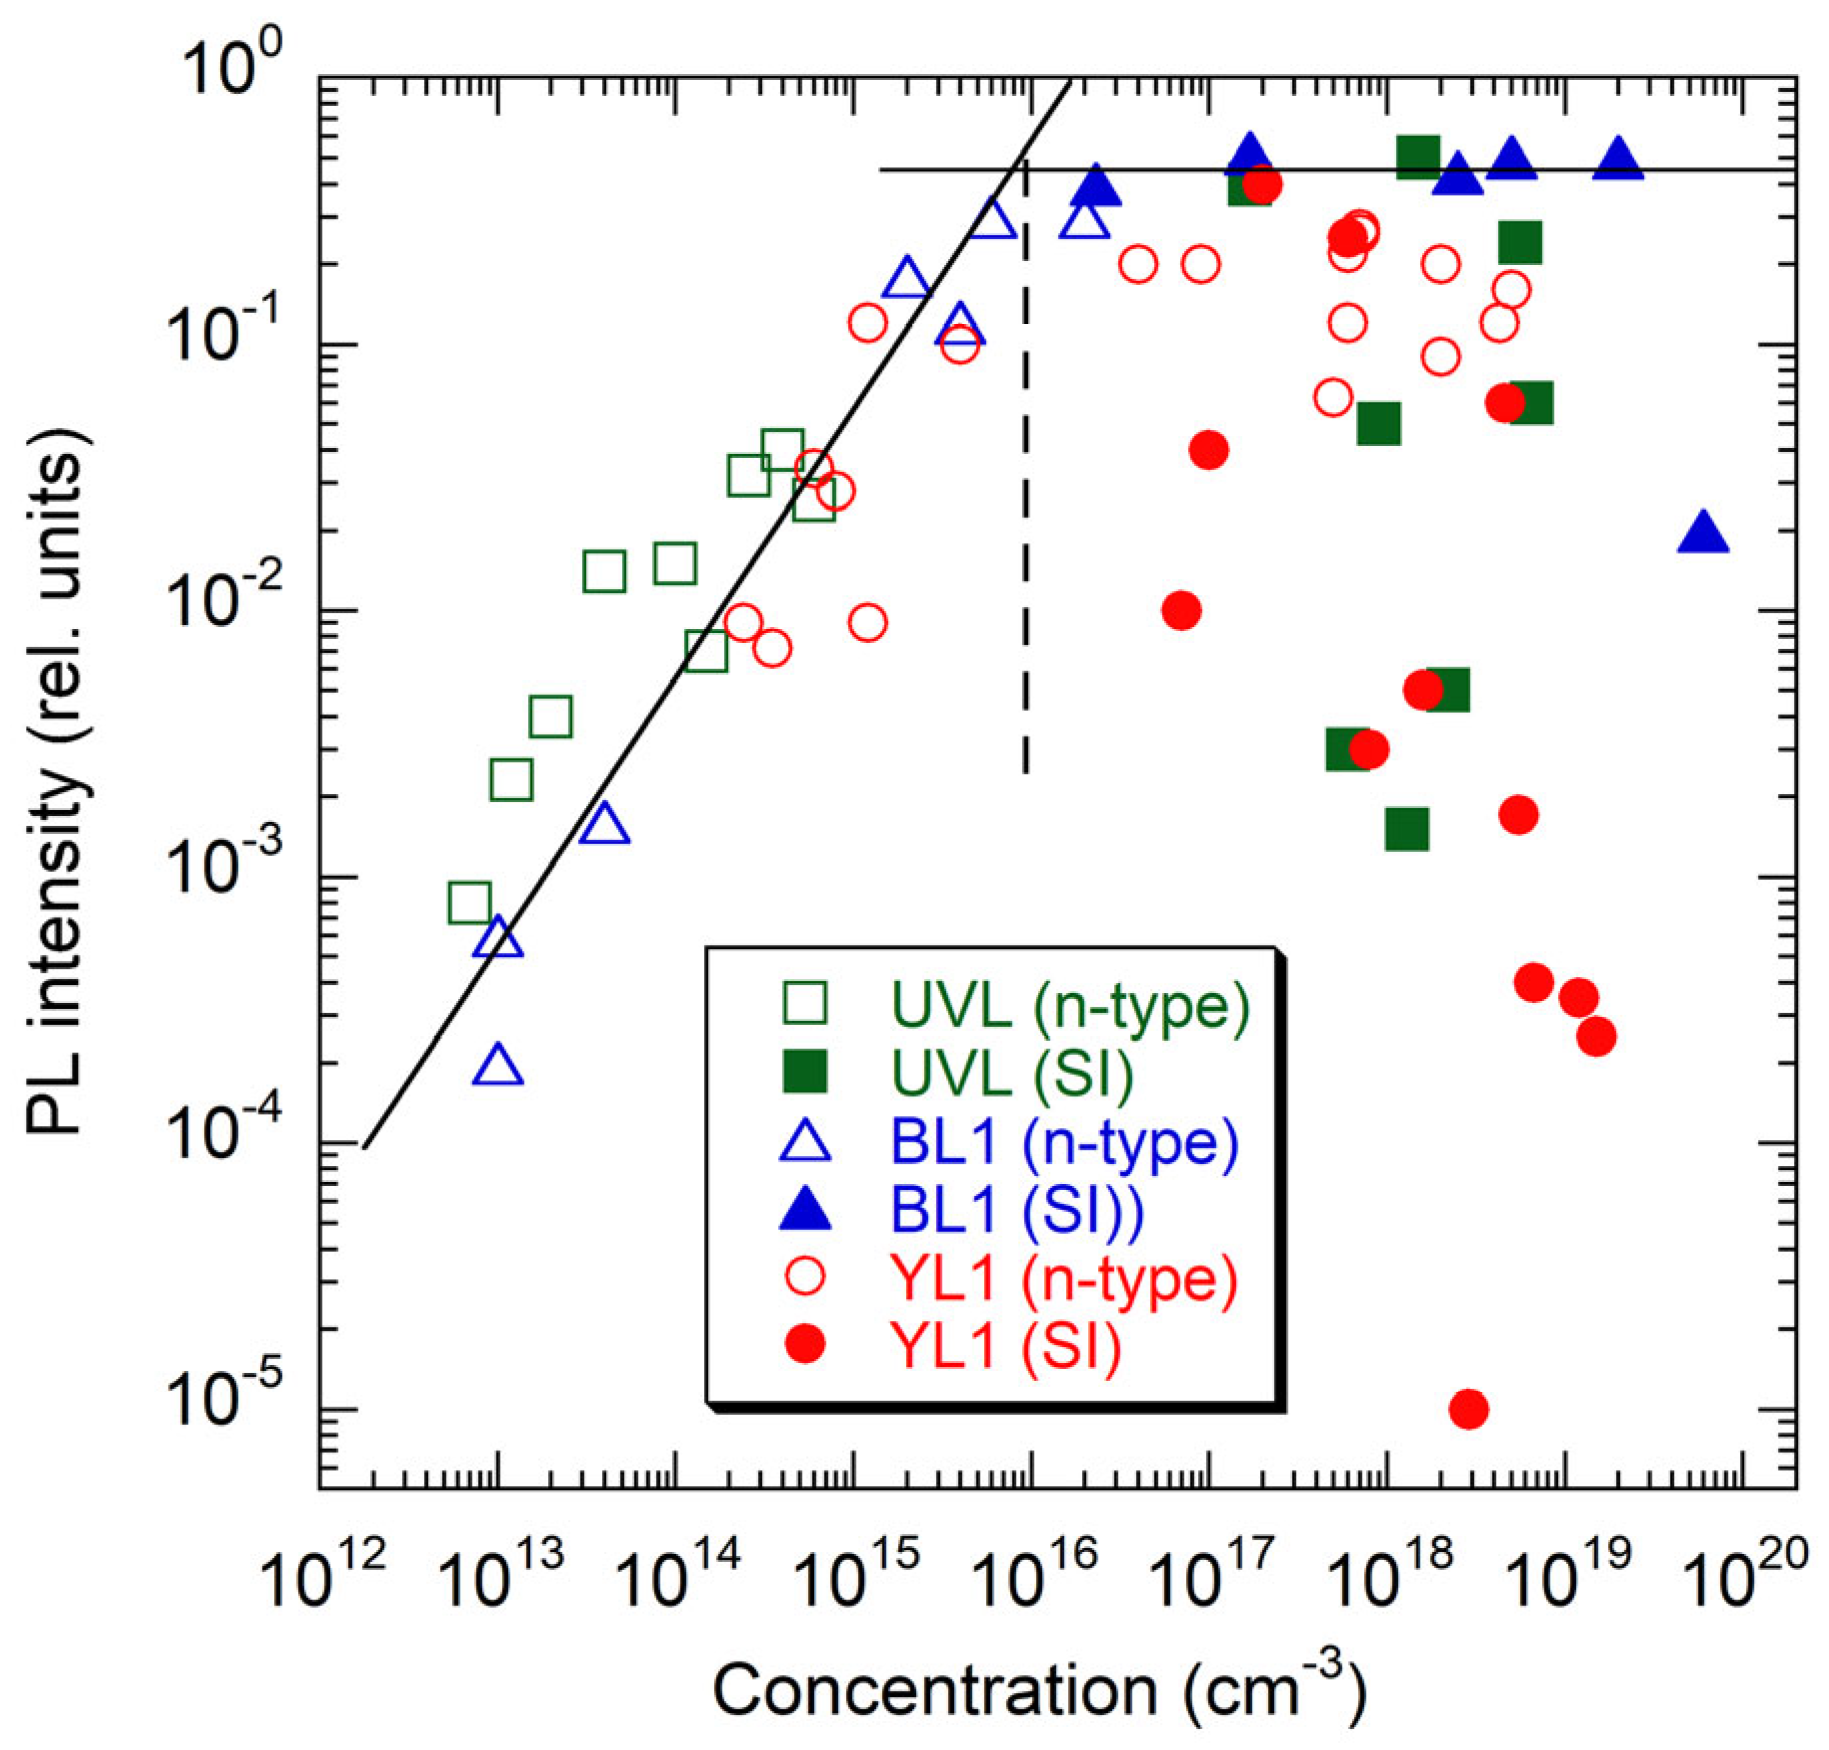
Based on analysis of a variety of undoped and doped GaN samples grown by various techniques, we concluded that the MgGa acceptor is the sole source of the UVL band in undoped GaN (see also Section 4.3.2). Its large hole-capture coefficient (Cp = 10−6 cm3s−1) enables efficient hole capture in conductive n-type GaN, allowing UVL detection at Mg concentrations as low as 1013 cm−3 [83], well below the SIMS detection limit (~1015 cm−3).
In AT GaN, the UVLMg band exhibits an atypical shape, particularly reduced ZPL intensity [39,42]. This distortion of the UVLMg band shape can be explained by self-absorption of PL originating from deeper regions of bulk, high-quality GaN templates, where the diffusion length of photogenerated carriers is relatively large.

3.6. Role of VGa in GaN Luminescence

Gallium vacancies and related complexes were historically considered the primary origin of the YL band in undoped GaN [16]. However, recent studies have revised this view. Given their high mobility at typical GaN growth temperatures, isolated VGa are unlikely to persist in as-grown material; instead, they tend to form stable complexes with donors during the cooling phase [14,171,172]. PAS studies by Chichibu et al. [14] identified VGaVN complexes as the dominant vacancy-type defects in n-type GaN grown by HVPE, MOCVD, and MBE, with concentrations ranging from 1016 to 5 × 1017 cm−3, lowest in freestanding HVPE templates (<1 × 1016 cm−3). Tuomisto et al. [172] also concluded that isolated VGa do not persist in as-grown GaN. In samples with a high concentration of O, they form the VGaON complexes that are stable at growth temperatures [171,172,173,174,175]. Interestingly, in Si-doped HVPE GaN ([Si] = 1017–1019 cm−3), VGa concentrations remain below 1016 cm−3 [176]. VGa may also associate with H [139,177,178] and form multi-component complexes, which is common for GaN grown by the AT method [139,179,180]. Nevertheless, in high-quality GaN samples grown by HVPE, MOCVD, and MBE, VGa-related defects are generally at or below the PAS detection limit (~1016 cm−3) [172].
VGa-related defects are often regarded as nonradiative defects [14,179]. No PL bands in HVPE- or MOCVD-grown GaN could be attributed to the VGa or the complexes mentioned above [66]. Hybrid functional DFT calculations place the 2−/− level of the VGaVN complex at 1.75–1.97 eV above the VBM [30,181,182], which excludes it as a candidate for producing PL bands in n-type GaN between 1.3 and 3.5 eV. However, a broad band at 0.93 eV, observed after electron irradiation [183], may originate from transitions via this defect. The VGaON complexes are likely nonradiative [35,39,118]. The YL2, OL3, and RL4 bands in AT GaN (Section 3.1.3 and Section 3.2.4) are tentatively linked to VGa3Hi, VGaON2Hi, VGa2ONHi, and VGa3ON. Nevertheless, these assignments remain speculative and require further experimental validation.

4. Luminescence from Intentionally Introduced Defects

This section examines the PL characteristics of defects intentionally introduced in GaN, with a focus on C, Be, Mg, and Zn.

4.1. Carbon-Related Defects (YL1, BLC, BL2, RLC)

Carbon impurities in GaN form CN acceptors, responsible for the YL1 band, and CNHi complexes, associated with the BL2 band. Another blue luminescence (BLC) band arises as a secondary PL process from CN upon capturing two holes. The red RLC band is attributed to C-containing complexes.

4.1.1. PL from the −/0 and 0/+ States of CN (YL1 and BLC)

The YL1 band, peaking at ~2.2 eV, is a dominant defect-related PL feature in undoped, Si-doped, or C-Si co-doped n-type GaN thanks to efficient hole capture by CN acceptors (Section 3.1.2). Its long PL lifetime (∼100 µs for n ≈ 1017 cm−3) leads to saturation at low excitation intensities. Subsequent capture of a second hole activates the 0/+ level, located 0.33 eV above the VBM, producing the BLC band at 2.85 eV [25]. Figure 21a shows the BLC emerging superlinearly with Pexc as YL1 saturates in conductive n-type GaN co-doped with Si and C. Comparing PL efficiencies of YL1 (pre-saturation) and BLC (after its IQE stops rising) yields a hole-capture coefficient for the 0/+ level of Cp ≈ 10−10 cm3s−1, significantly lower than values from DLTS [184] or first-principles calculations [185]. This unexpectedly low radiative efficiency could be attributed to the trap-assisted Auger-Meitner (TAAM) recombination, which may become dominant at high Pexc [185].
TRPL reveals fast (~1 ns) and exponential BLC decay, with only YL1 persisting beyond 0.1 μs after a laser pulse (Figure 21b). Across samples with free electron concentrations between 3 × 1016 cm−3 and 3.8 × 1018 cm−3, BLC lifetimes range from 0.27 to 1.3 ns [25]. This short and almost insensitive to n PL lifetime is modeled by competing internal transitions (from an excited state near the CBM to the 0/+ level) and transitions from the conduction band, with contributions varying with n (Figure 22a). The model yields a high electron-capture coefficient for BLC (Cn ≈ 10−9 cm3s−1). A configuration-coordinate diagram in Figure 22b illustrates transitions leading to YL1 and BLC in C-doped GaN. The experiments supported theoretical predictions of two charge transition levels for CN [105,107] and confirmed that the YL1 band is caused by the isolated CN [24,25]. The CNON complexes, erroneously considered as the origin of YL1 [105,106,142], are either weakly radiative or not formed in sufficient concentration, and therefore are absent in PL spectra (Section 4.1.4).
DLTS studies provided independent evidence that the CN defect in GaN possesses two charge transition levels. Employing low-frequency capacitance DLTS for MOCVD-grown p-type GaN:Mg, Narita et al. [26] found the 0/+ level of the CN at 0.29 eV above the VBM at T ≈ 135 K by correlating the DLTS signals with C concentration. The most precise determination of the 0/+ level at low temperatures was achieved via PL measurements (Figure 23). From the ZPL at 3.172 eV, the 0/+ transition level of CN is found at 0.33 ± 0.01 eV above the VBM [60]. Phonon-related fine structure reveals coupling to the LO crystal mode and a pseudo-local mode of 34.3 meV (Figure 23b). The experimentally determined 0/+ level of the CN agrees with values of 0.23–0.36 eV obtained from first-principles calculations [25,107,182].

4.1.2. PL from the CN and CNHi (YL1 and BL2)

In high-resistivity or SI GaN, particularly in MOCVD-grown samples, the YL1 and BL2 bands are dominant features in the defect-related low-temperature PL spectrum (Section 3.1.2 and Section 3.4.2). These bands originate from carbon-related defects: substitutional carbon (CN) and its hydrogenated form (CNHi). Hydrogen is a ubiquitous impurity in GaN, especially in samples grown by MOCVD. Hydrogen is mobile at growth temperatures only in the form of H+ ions [186,187], and it is positively charged when the Fermi level lies more than ~0.5 eV below the CBM [55]. Consequently, CNHi complexes are formed, and the BL2 band is observed only in high-resistivity n-type and in p-type GaN. The metastable behavior of PL in such samples—specifically, the interplay between the YL1 and BL2 bands, driven by reversible formation and dissociation of CNHi complexes and influenced by UV exposure or thermal annealing—is analyzed below [55,188].
Under continuous above-bandgap excitation at low temperatures (T < 80 K), BL2 band bleaches, while the YL1 intensity increases simultaneously (Figure 24a) [55,159,160,161,162,163,164,188,189,190,191]. This behavior is explained by photo-induced dissociation of CNHi, with a dissociation probability per recombination event of γ = 5 × 10⁻⁸ [55], implying one dissociation per 107–108 radiative recombination events involving the complex, in agreement with earlier estimates [164]. This bleaching is permanent at low temperatures but can be reversed at room temperature after a few days, implying a barrier of ~1 eV for the complex formation [188]. Quantitative analysis of these processes yields a hole-capture coefficient ratio of Cp,BL2/Cp,YL1 = 0.12 and also allows for the extraction of defect concentrations [55].
Thermal annealing has a pronounced effect on the stability of CNHi complexes in GaN. Annealing in N2 ambient at Tann > 700 °C leads to the dissociation of CNHi and the subsequent removal of hydrogen from MOCVD-grown GaN samples, resulting in a drastic reduction in the BL2 intensity (Figure 24b). Remarkably, the BL2 band can be fully restored by annealing in an H2 + N2 atmosphere at 650–850 °C, confirming the incorporation of H and restoration of CNHi complexes [55].
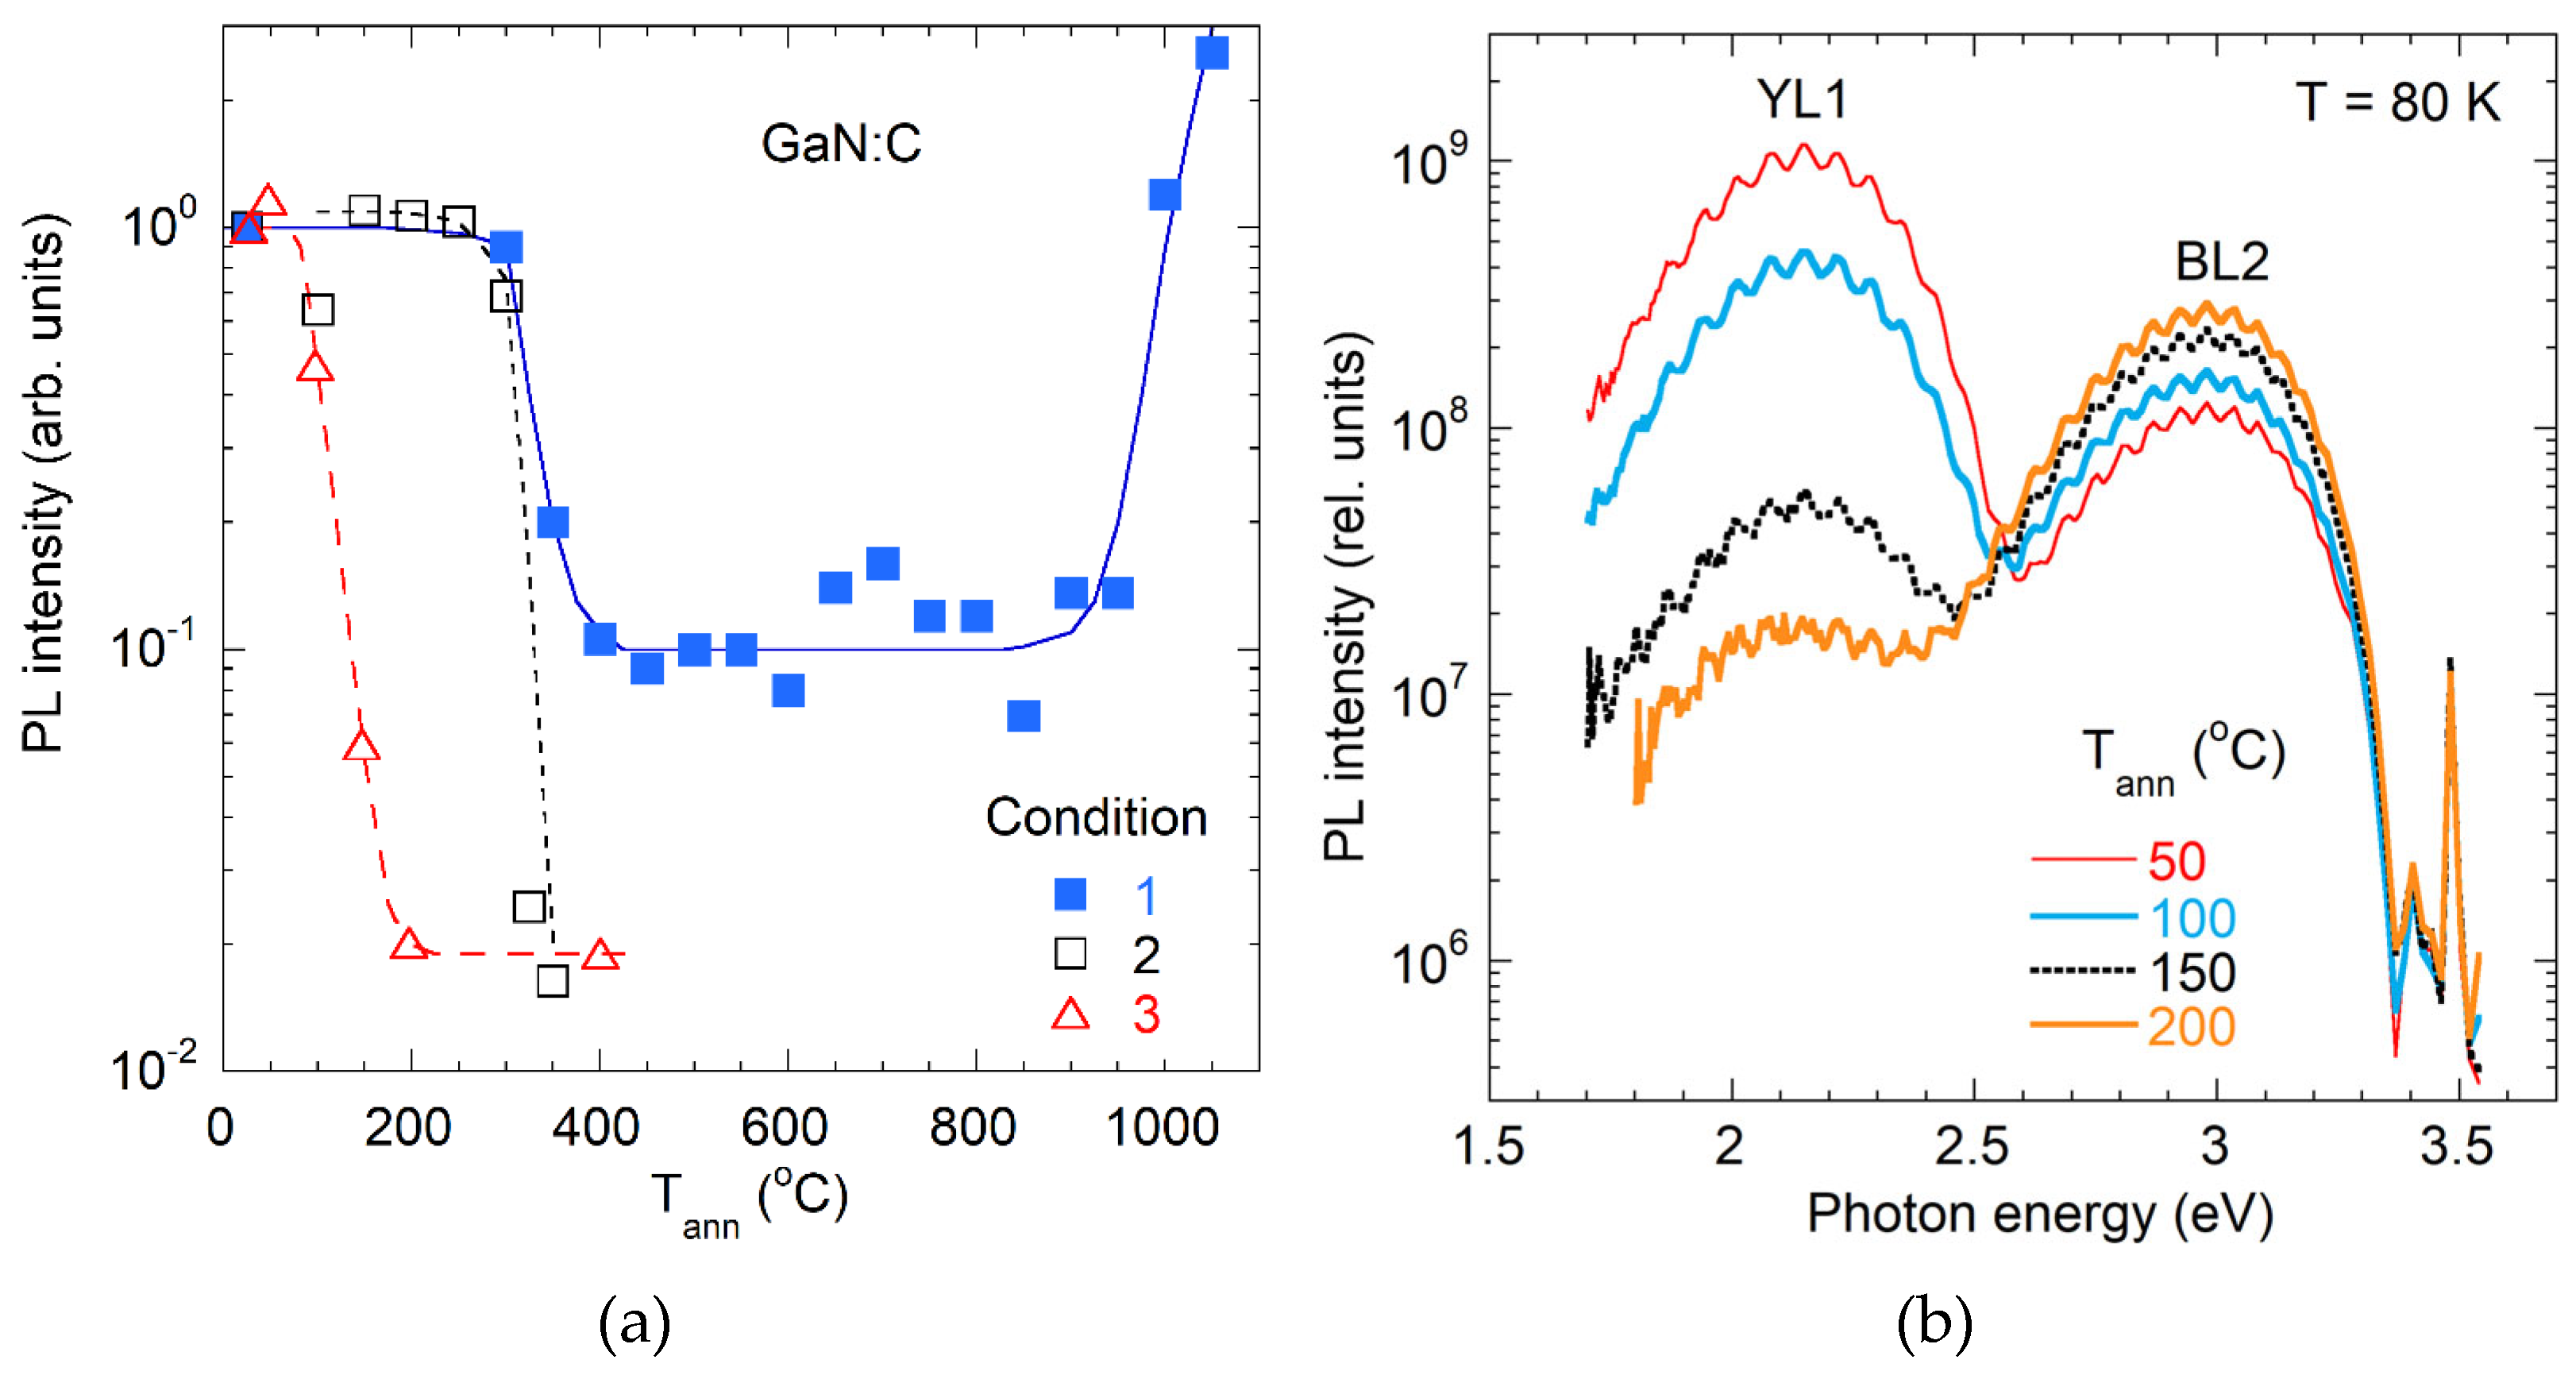
The effect of annealing (in N2 ambient at Tann between 300 and 1000 °C) on the YL1 band in MOCVD-grown undoped GaN was studied in detail in [188] (filled blue squares in Figure 25a). The drop in the YL1 intensity at Tann = 350–400 °C corresponds to a ~2 eV activation energy. This behavior was explained by the release of hydrogen from unidentified nonradiative defects and its subsequent capture by CN [188]. One of the samples was isochronally annealed in vacuum (for 30 min with 25 °C steps up to Tann = 400 °C) and exhibited a similar trend (empty squares in Figure 25a). Annealing at Tann > 900 °C permanently removed H from the samples (as evidenced by the disappearance of BL2) and restored YL1 intensity.
Interestingly, when CN defects were initially passivated by H (through annealing at 400–800 °C) and subsequently reactivated via photo-induced dissociation of CNHi at cryogenic temperatures, additional annealing at significantly lower temperatures (Tann = 100–150 °C) resulted in a pronounced decrease in YL1 intensity and a concurrent increase in BL2 intensity (Figure 25b and empty triangles in Figure 25a). These observations suggest that after low-temperature photo-induced dissociation of CNHi, H remains in close proximity to CN, separated by an energy barrier of ~1 eV, and readily re-passivates the CN upon mild annealing or even at room temperature (after a couple of days) [188].
A similar annealing response (except for the photo-induced activation) was observed for the BeGa-related YLBe band [188]. The YLBe intensity dropped by up to an order of magnitude at Tann ≈ 400 °C, which was attributed to the release of hydrogen from unknown traps and passivation of BeGa acceptors. Interestingly, the YLBe intensity slowly recovered at room temperature (on a timescale of months) [188].

4.1.3. RLC Band in C-Doped GaN

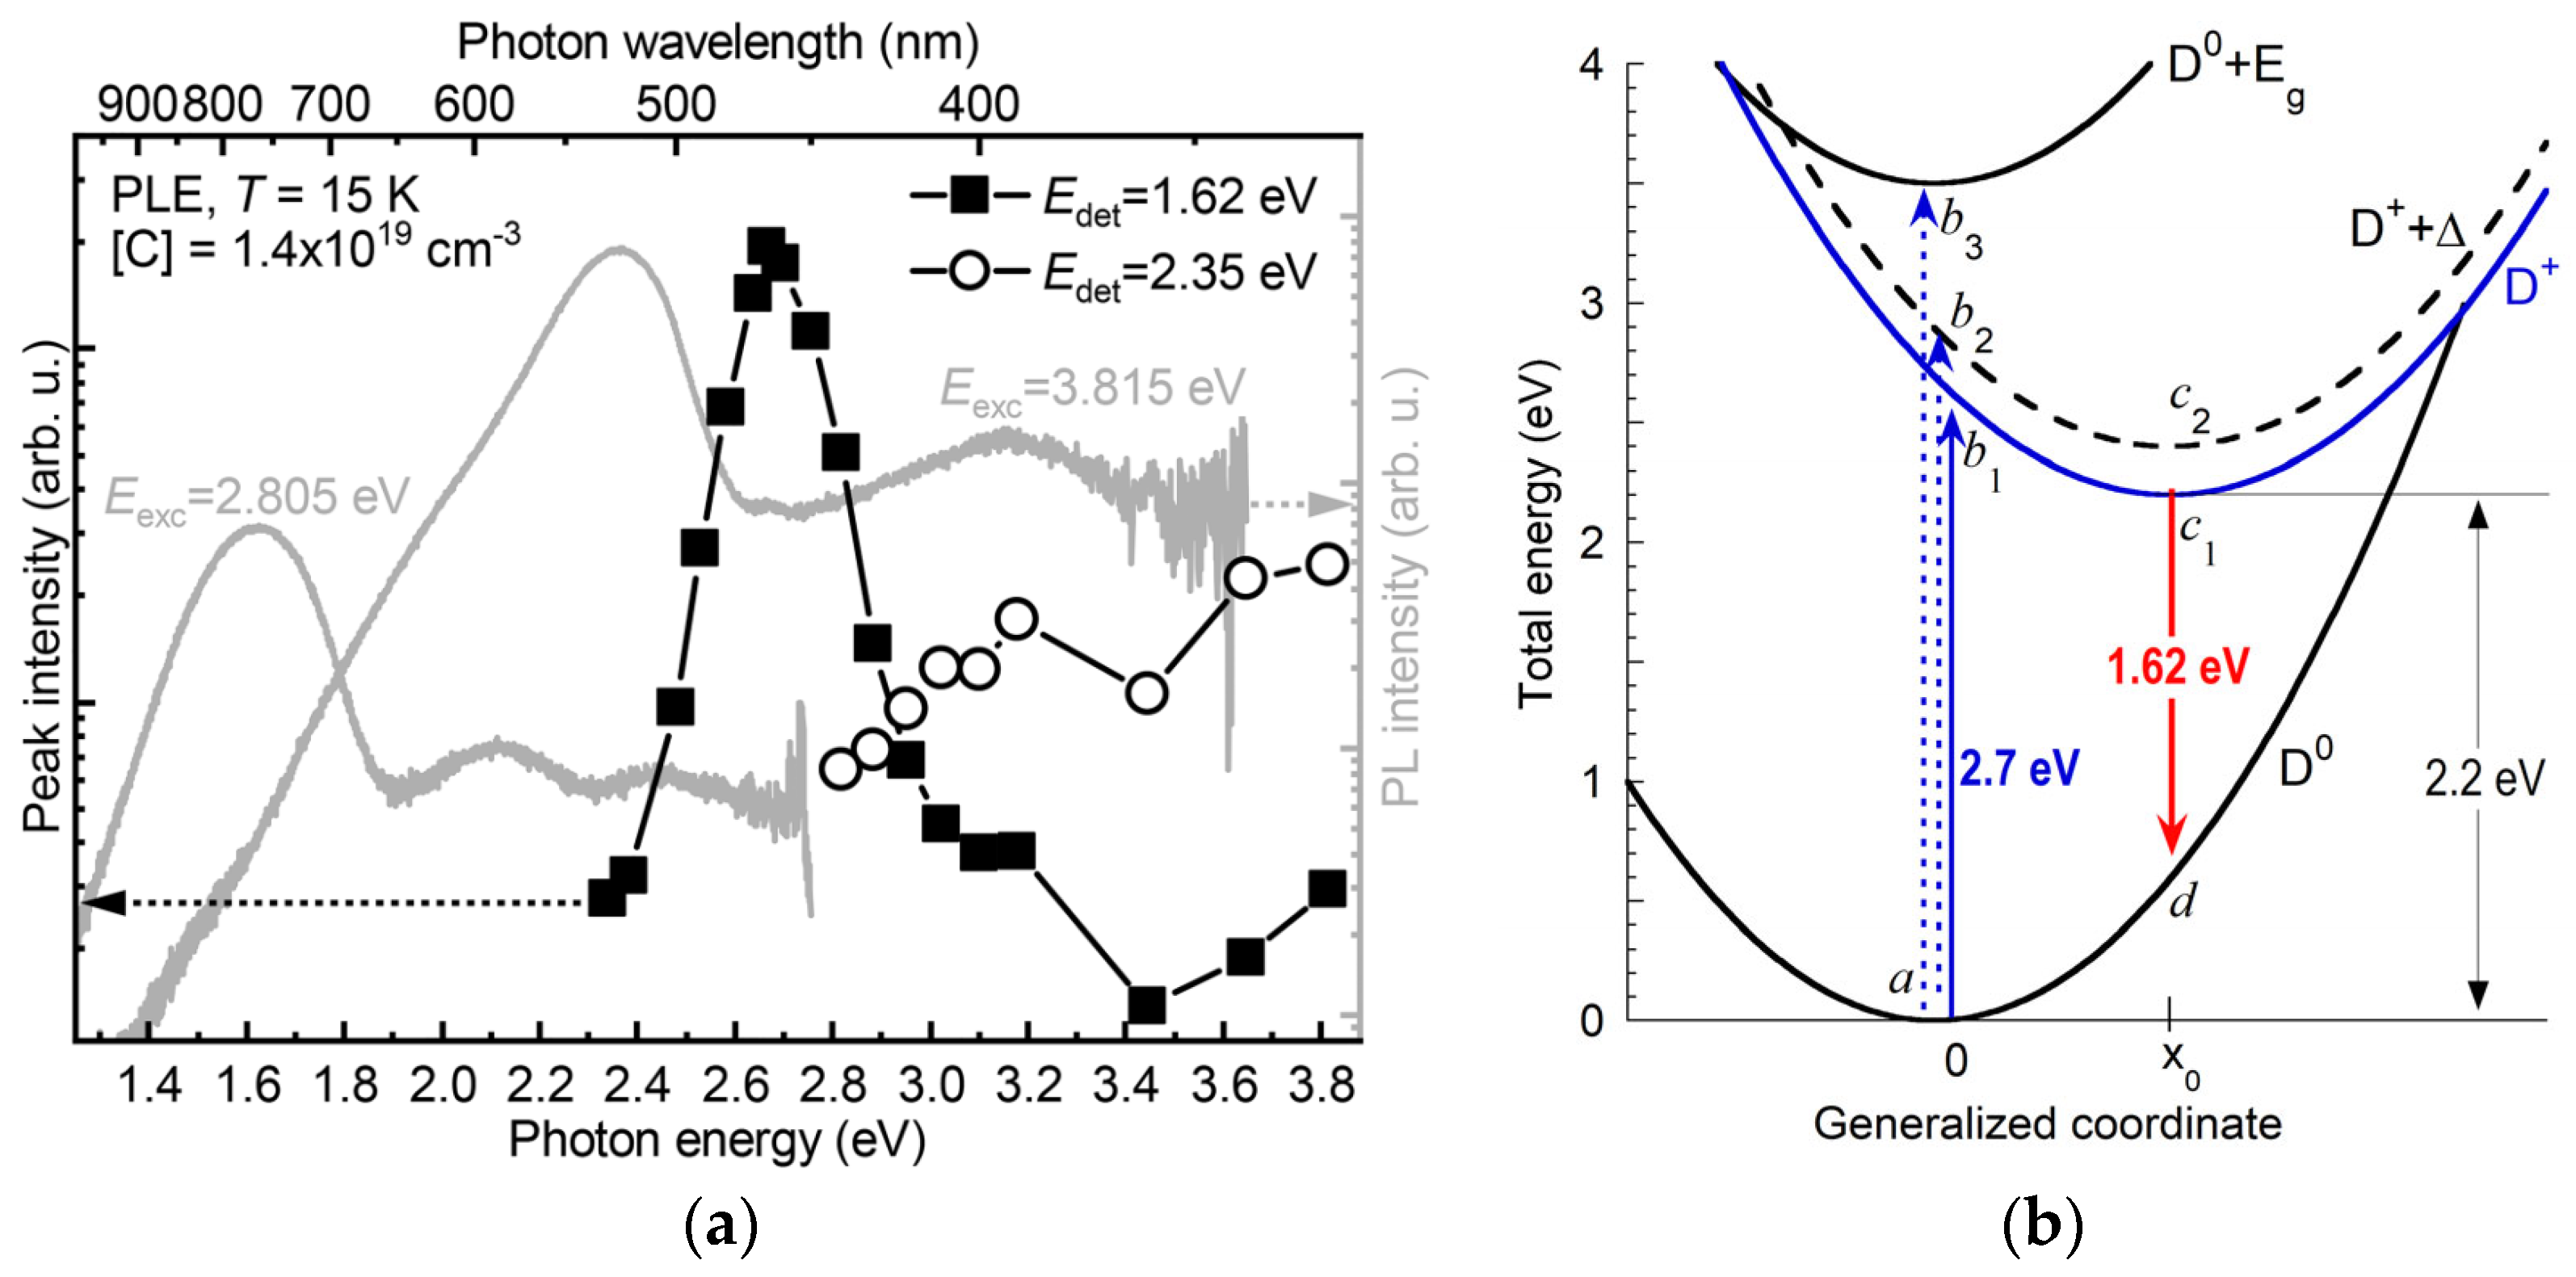
In HVPE-grown GaN doped with carbon, the intensities of the YL1 and BL2 bands decrease markedly as the concentration of C increases from ~1018 to 3 × 1019 cm−3 [33]. This trend has been attributed to the formation of tri-carbon complexes that outnumber isolated CN centers in heavily doped GaN [33,192]. At these high carbon concentrations, a red luminescence (RLC) band, peaking at 1.62 eV, emerges [33,193]. The RLC band is mostly excited under below-bandgap excitation (resonantly), and its PLE spectrum has a Gaussian shape with a maximum at 2.7 eV (Figure 26a). The RLC is quenched above 80 K, revealing an activation energy of ~0.1 eV. Based on these observations, Zimmermann et al. [33] attributed RLC to tri-carbon complexes. They proposed that this defect has a ground state at about 1.1 eV above the VBM and an excited state at 0.1 eV below the CBM.
Figure 26b illustrates a configuration coordinate diagram adapted from [33] to explain the PL and PLE characteristics of the RLC band. In the ground state, the defect is a neutral donor D0 (the lowest parabola). Resonant excitation (transition a-b1) promotes an electron from the donor ground state to an excited state located at Δ = 0.1 eV below the CBM, producing the PLE peak at 2.7 eV. The system then relaxes (b1-c1) to a new equilibrium position x0 via phonon emission. Radiative recombination (c1-d) produces the RLC band with a maximum at 1.62 eV, and the defect system returns (d-a) via phonon emission to the initial state. Such internal transitions, not involving the valence or conduction band, are known to produce nearly Gaussian PLE spectra [94], consistent with experimental observations (Figure 26a).
If electrons were excited to the conduction band (transition a-b2), the PLE spectrum would show a stepwise rise (instead of a Gaussian shape) due to continuous states in the conduction band [94]. According to the results shown in Figure 26a, such contributions are negligible, suggesting that electrons excited to the conduction band predominantly recombine nonradiatively via some other defects.
The transition a-b3 in Figure 26b corresponds to the above-bandgap excitation of an electron-hole pair when the defect is in the ground state D0. It appears that the capture of holes (transition b3-c2) is inefficient for these defects (because they are donors, and there may also be a potential barrier for the hole capture). This would explain why the RLC band is very weak (or not observed) under above-bandgap excitation [33].
A similar behavior was observed for F centers that are deep donors in alkali halides, with excited states near the CBM [194,195,196,197]. The shapes of PL and PLE bands for F centers are Gaussian. PL quenching begins at T ≈ 100 K, and the quenching is attributed to thermal emission of electrons from the excited state to the conduction band. Similar to the RLC band in GaN, PL from F centers is efficiently excited via resonant excitation, but remains undetectable under above-bandgap excitation [198].

4.1.4. Other Carbon-Related Complexes

Although CNON complexes were initially suggested as potential contributors to the YL band [105,106], more recent hybrid functional DFT calculations indicated insufficient binding energies for CNON and CNSiGa to form at concentrations comparable to isolated CN [98]. Specifically, for GaN grown at 1300 K and co-doped with C and Si, the predicted concentration of CNSiGa complexes is less than 1% of the isolated CN concentration when the concentration of shallow SiGa donors is ~1018 cm−3. The CNON, with lower binding energy, is expected to be present at even lower levels [98].
Figure 27 presents SSPL and TRPL spectra at T = 17 K from a MOCVD-grown GaN sample co-doped with C (7 × 1017 cm−3) and Si (1.4 × 1018 cm−3). The only emission observed below 3 eV is the YL1 band. Its characteristic features (the band shape, hole- and electron-capture coefficients, the ZPL at 2.59 eV, and BLC band emerging at high Pexc) confirm its origin from the isolated CN. The SSPL and TRPL spectra are identical (the simulated lineshape is shown with the orange dashed line), further confirming that no other PL bands contribute to the broad yellow band. The residual background observed between 2.7 and 3.0 eV is attributed to monochromator stray light, as confirmed by the use of interference filters. A hypothetical CNSiGa band, predicted to occur in the 2.3–2.7 eV range [98,103], is not observed. Its estimated intensity, represented with the dotted line in Figure 27, is at least four orders of magnitude lower than YL1. Thus, CNON and CNSiGa complexes are not observable in PL, due to low concentrations [98] and relatively low hole-capture coefficients, as these complexes are donors.

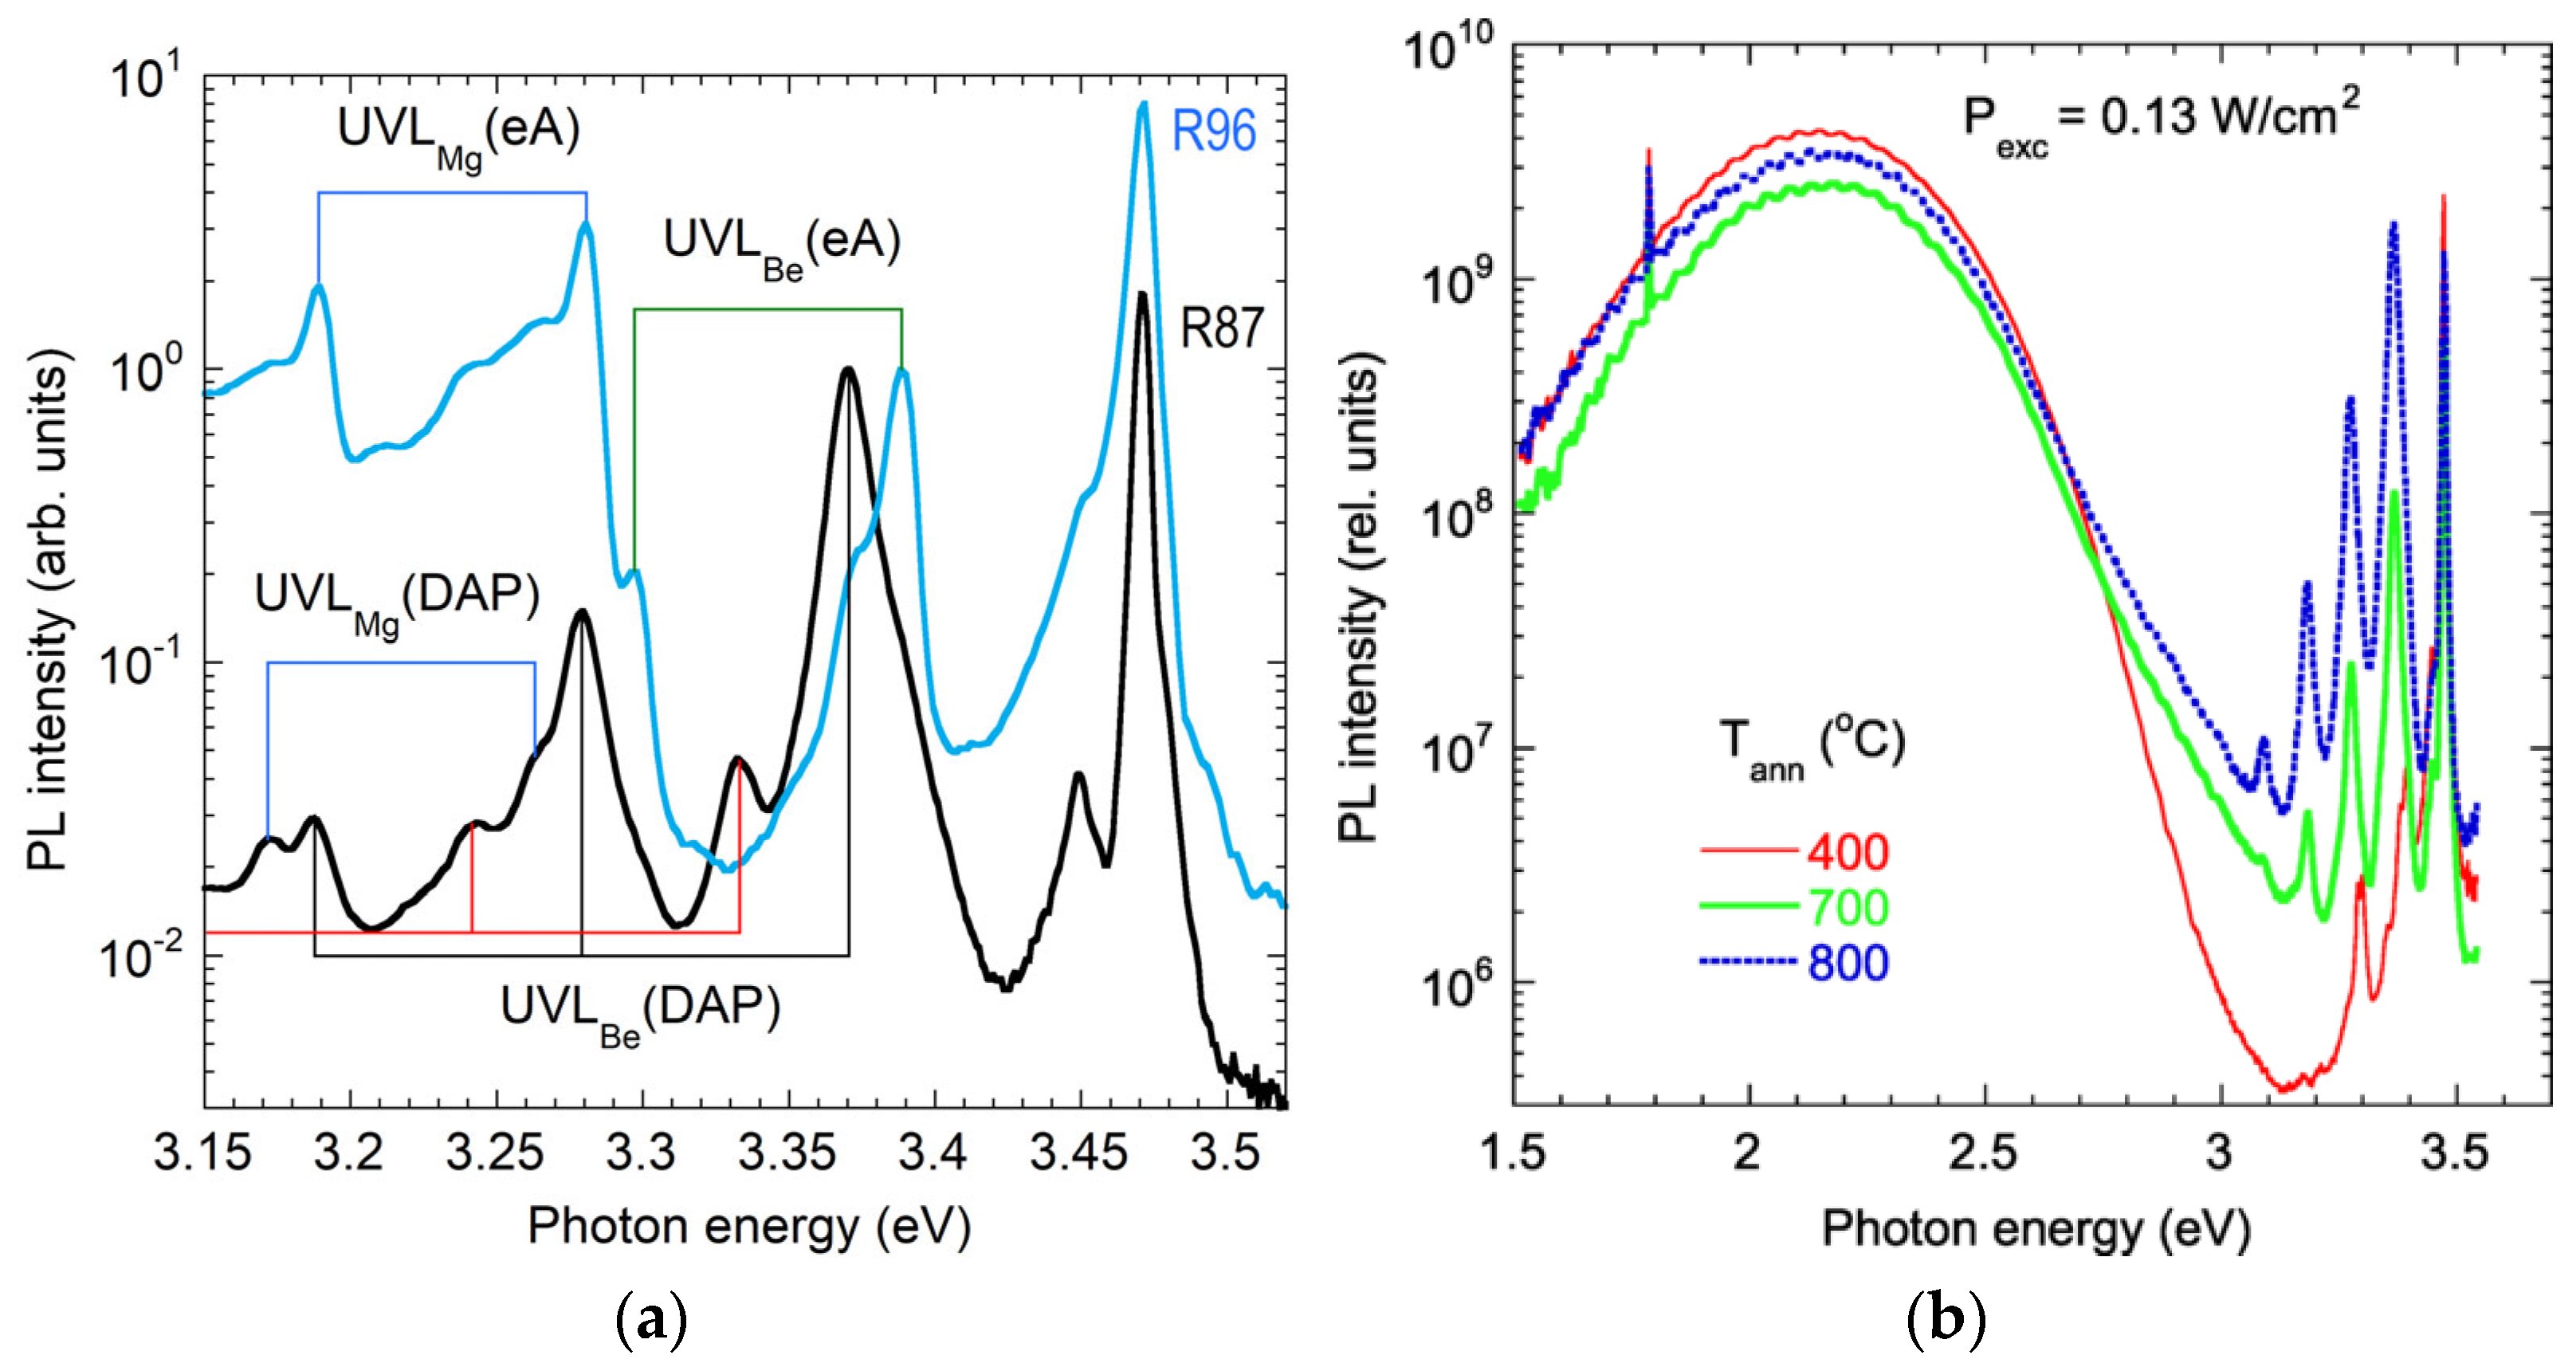
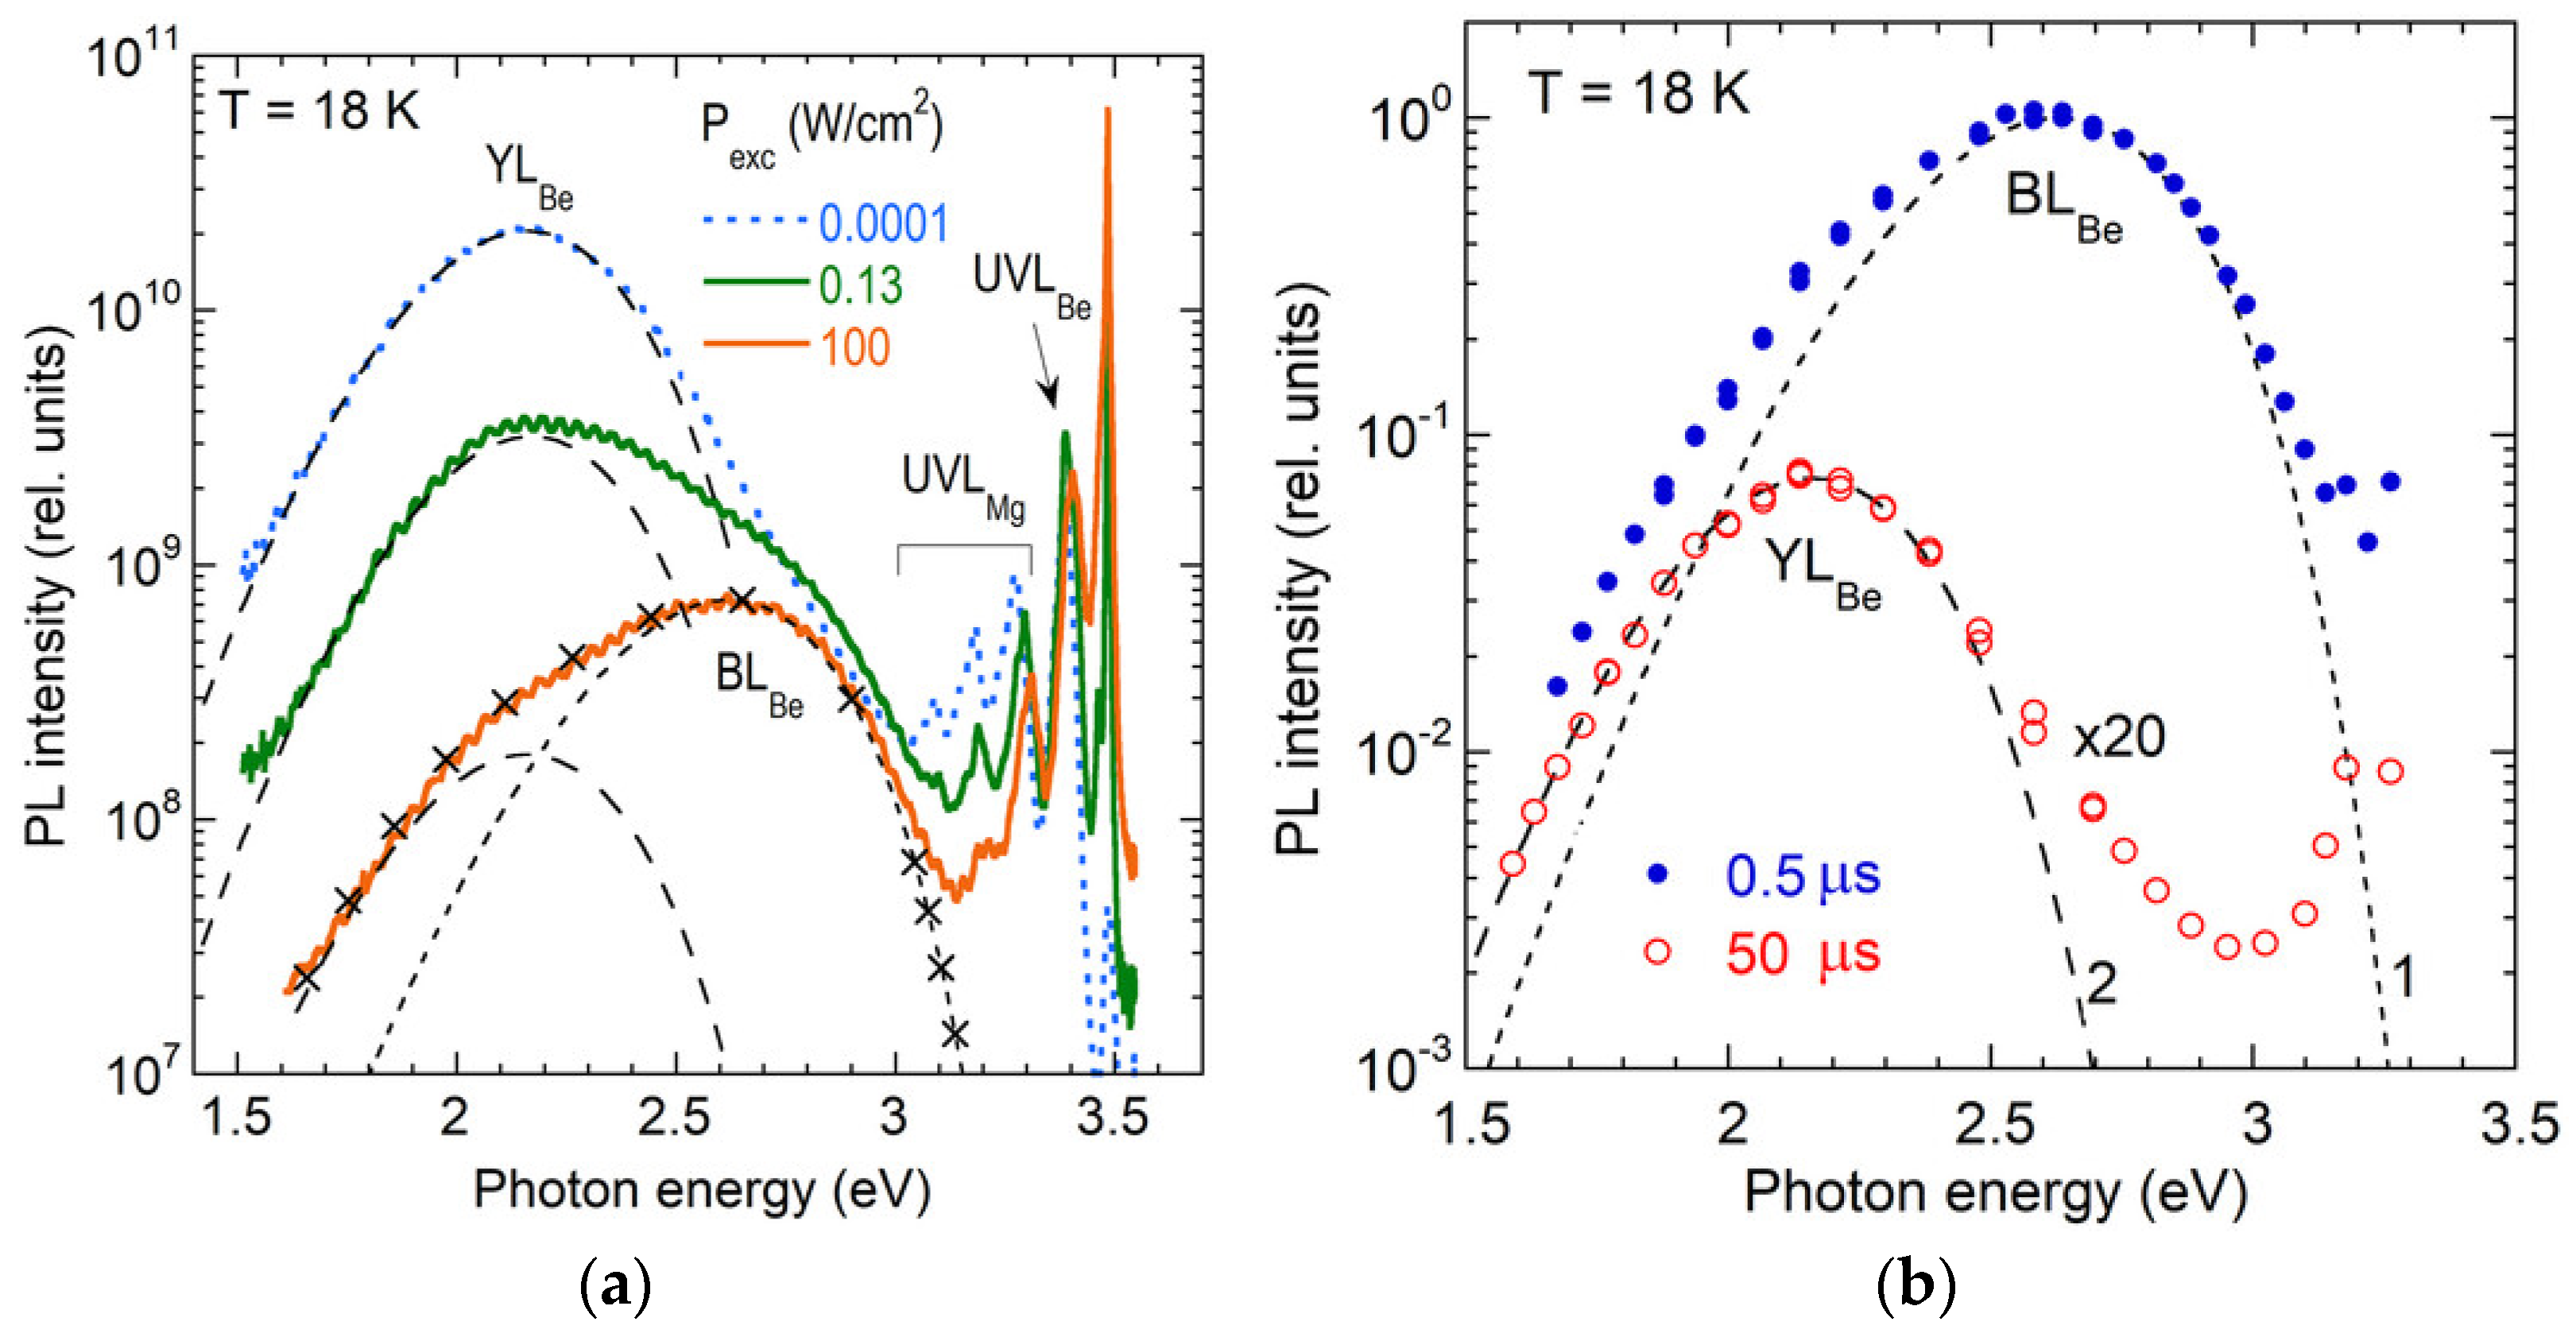
4.2. Beryllium-Related Defects (YLBe, UVLBe3, UVLBe, RLBe, BLBe, GLBe)

Beryllium (Be) doping in GaN introduces a variety of defect-related PL bands, including YLBe, UVLBe3, UVLBe, RLBe, BLBe, and GLBe. This section summarizes their experimental characteristics, theoretical interpretations, and associated defect models.

4.2.1. Historical Overview

For a long time, the BeGa acceptor was regarded by experimentalists and theorists as the shallowest acceptor in GaN and was proposed as an alternative to MgGa for achieving p-type doping [199,200,201,202,203,204,205]. However, more recent first-principles calculations have demonstrated that BeGa is a deep acceptor with the predicted −/0 level at 0.45–0.65 eV above the VBM [206,207,208,209]. In addition to this deep state, the theory also predicted a shallow state with a delocalized hole [206,210]. Early experimental PL studies revealed two primary Be-related bands (Figure 28a): a broad yellow band with a maximum at 2.15 eV (YLBe) and a UVL band consisting of a sharp peak at 3.38 eV accompanied by a few LO phonon replicas (UVLBe). Initially, YLBe was attributed to various Be-containing complexes, including BeGaON donors [211], BeGaVNBeGa acceptors [150], and BeiVGa complexes [212]. The UVLBe band was erroneously attributed to the shallow BeGa acceptor [150,199,200,201,202,203,210]. PL bands in Be-doped GaN were the subject of continued debate until the dual nature of the BeGa acceptor was experimentally verified [45]. Comprehensive PL studies [45,46,213,214], in fair agreement with early theoretical predictions [206], have led to a consistent model of the BeGa acceptor in GaN (Figure 28b).
According to this model, the BeGa acceptor forms two deep, polaronic states (Be1 and Be2) in which the hole is localized on adjacent nitrogen atoms, and a shallow state (Be3) with a delocalized hole. The −/0 transition levels for these states are experimentally found at 0.35 ± 0.03 eV (Be1), 0.39 ± 0.02 eV (Be2), and 0.24 ± 0.01 eV (Be3) above the VBM [45,46]. Recent temperature-dependent Hall-effect measurements on MOCVD-grown GaN:Be samples have confirmed the p-type conductivity associated with the BeGa acceptor level at 0.40 ± 0.02 eV above the VBM [215]. Electron transitions from the conduction band to Be1 and Be2 levels are responsible for the YLBe1 and YLBe2 components of the YLBe band. Transitions via the shallow Be3 level result in a distinct PL band (labeled UVLBe3) with a peak at 3.26 eV followed by LO phonon replicas. In bulk GaN:Be grown by the high nitrogen pressure solution (HNPS) method, these PL bands can also be found. However, a significant contribution of the CN-related YL1 band in those samples and blurred PL bands can complicate the attribution of individual PL features [46].
The UVLBe band at 3.38 (initially thought to be caused by isolated BeGa) has recently been attributed to the BeGaONBeGa complex [64]. The BLBe band with a maximum at 2.6 eV is preliminarily attributed to the 0/+ transition level of BeGa [61].

4.2.2. Three States of Isolated BeGa (YLBe1, YLBe2, UVLBe3)

At temperatures below T1 ≈ 80–100 K, photogenerated holes in GaN:Be are efficiently captured by the shallow Be3 level (0.24 eV above the VBM). These holes rapidly relax, via barrier-free transition, into the Be1 level at 0.35 eV. A significant energy barrier (>0.17 eV) between Be1 and Be2 polaronic states prevents hole transfer to the deepest BeGa level (Be2) at these temperatures. Consequently, the YLBe band is observed, caused by electron transitions from the CBM (or from shallow donors at T < 50 K) to the Be1 level (YLBe1). According to ODMR studies on MBE-grown GaN:Be [216], the BeGa polaronic state (apparently Be1 causing the YLBe at T = 1.6 K) is characterized by isotropic g = 2.004 ± 0.002.
At TT1, a thermally activated transition occurs: the hole relocates from an in-plane N atom to the c-axis N atom, corresponding to the lowest energy configuration Be2, and the YLBe1 component (transitions to Be1) is replaced by YLBe2 (transitions to Be2). As a result, the YLBe band redshifts by about 40 meV at TT1. Though the radiative lifetimes of the two components are comparable (τn1/τn2 = 1.2 ± 0.2), a noticeable discontinuity appears in the measured PL lifetime at TT1 (Figure 29a). This is due to rapid hole transfer from Be1 to Be2, occurring on a timescale shorter than the YLBe1 lifetime at T > T1.
The YLBe band consistently exhibits two-step quenching at temperatures T1 and T2 (Figure 29). In SI GaN:Be samples, both quenching steps are tunable with Pexc, i.e., T1 and T2 increase with increasing Pexc (the TAQ mechanism). Notably, the second step is abrupt in SI samples and exhibits an apparent activation energy (up to 1.5 eV) that is unrelated to the ionization energy. In contrast, in conductive n-type GaN:Be samples, the two-step quenching is neither tunable nor abrupt. The second quenching step in such samples is described by the Schön–Klasens quenching mechanism, and the activation energy of approximately 0.30 eV corresponds to the Be2 ionization energy, although thermal emission of holes from Be2 occurs via the Be3 level [45].
Interestingly, the IQE of the YLBe band remains unchanged when the temperature passes T1 [213]. The observed PL intensity drops at TT1 due to reduced light extraction efficiency from c-axis dipoles (Be2 polarons) [45], the axis of which in GaN:Be layers grown on c-plane sapphire coincides with the direction of PL observation. The magnitude of the PL drop during the first quenching step is sample-dependent and depends on the PL detection geometry (Figure 29b). In agreement with the prediction [45], the YLBe intensity rises at T > T1 in bulk GaN:Be crystals when PL is observed in a direction perpendicular to the GaN c-axis [217].
The dual nature of the BeGa acceptor, which possesses both deep polaronic and shallow delocalized hole states, was verified with PL experiments, where the UVLBe3 band emerging at T > 100 K (Figure 30) provided key evidence [45].
The UVLBe3 band was initially overlooked due to its similarity to the UVLMg band, which originates from the shallow MgGa acceptor (ZPL at 3.27–3.29 eV, followed by LO phonon replicas). The UVLMg band typically quenches at T > 100 K and disappears by 200 K in undoped GaN due to the low ionization energy of the MgGa acceptor (0.223 eV). However, in Be-doped GaN, a similar PL band emerges at T > 100 K, exponentially increasing with temperature (Figure 30a). In Mg-contaminated GaN:Be samples, both the UVLMg and UVLBe3 can be spectrally resolved, revealing that the UVLBe3 ZPL is ~15 meV below the UVLMg ZPL (Figure 30b).
The UVLBe3/YLBe2 intensity ratio increases exponentially with temperature (Figure 31a) and fits well the expression:
I B e 3 U V L I B e 2 Y L = δ exp Δ E 23 k T
where δ = τn2/τn3, τn2 and τn3 are intrinsic PL lifetimes of radiative transitions via Be2 and Be3, respectively, and ΔE23 is the energy difference between the respective levels. Fitting yields ΔE23 = 0.15 ± 0.02 eV and δ ≈ 10 across multiple GaN:Be samples grown by MBE and MOCVD. This behavior reflects Boltzmann population redistribution between Be2 and Be3 states [45]. Interestingly, the measured PL lifetimes of the UVLBe3 and YLBe2 bands are identical at all temperatures (Figure 29a). It was shown in Ref. [45] that the true PL lifetime of PL via the Be3 level is about 10 times shorter than that of the YLBe2 band, as is expected for shallow and deep acceptors [34]. However, thanks to dynamic feeding after a laser pulse, the Be3 state is continuously populated by hole transfer from Be2, resulting in synchronized PL decay [45].
Thermal quenching of UVLBe3 and YLBe2 begins at T = T2 ≈ 120–200 K. In SI and high-resistivity p-type GaN:Be samples, the quenching is tunable and abrupt (Figure 31b). In conductive n-type GaN:Be samples, the YLBe quenching begins at T2 ≈ 200 K, and the slope of the quenching reveals an activation energy of 0.30 eV. Initially, the activation energy was attributed to the deep level of BeGa. However, according to the above model, the quenching is primarily caused by the thermal emission of holes from the shallow Be3 level to the valence band [45]. The effective activation energy for the YLBe quenching corresponds to the sum of Be3 energy (about 0.20 eV at T = 200 K) and the energy difference between the Be3 and Be2 levels (~0.15 eV). It should be noted that activation energies extracted from PL quenching slopes are typically slightly lower than the true defect ionization energy, due to several factors [66,75].
The results of the hydrostatic pressure experiments [211] have been interpreted using a model in which the broad yellow band in HNPS-grown GaN:Be consists of a CN-related YL1 band and a yellow band caused by the BeGaON complex. According to first-principles calculations in [211], the polaronic 0/+ level of BeGaON shifts from 0.26 eV to 0.12 eV above the VBM as hydrostatic pressure increases from 0 to 8 GPa. At higher pressures, a UVL band (with a peak at ~0.2 eV below the bandgap) emerges and is attributed to the shallow 0/+ level of BeGaON with a delocalized hole, reflecting its dual nature. The model based on isolated BeGa was dismissed in [211], primarily because the calculated PL band maximum of the BeGa polaron (1.80 eV) markedly disagreed with the experimentally observed YLBe maximum. However, these experimental results can be well explained with the above-discussed model of the isolated BeGa, in which the deep Be1 level shifts toward the VBM (by ~0.17 eV under 8 GPa pressure [211]) and intersects with the shallow Be3 level, resulting in a sudden intensification of the UVLBe3 band [46].

4.2.3. Shallowest Acceptor in GaN (UVLBe)

The UVLBe band at 3.38 eV, initially misattributed to a shallow level of BeGa [210], arises from Be doping and exhibits all characteristic features of the shallowest acceptor in GaN [64]. Figure 32a shows two components of the UVLBe band (eA and DAP) observed in two GaN:Be samples grown by MOCVD. Both UVLMg and UVLBe bands feature a sharp ZPL followed by a few LO phonon replicas. The Huang–Rhys factor, S, defined as the intensity ratio of the first phonon replica to the ZPL, is 0.15 for the UVLBe—the lowest among GaN defects—indicating the lowest electron–phonon coupling strength [64].
Analysis of temperature and excitation-intensity dependences of the DAP and eA components yields the −/0 transition levels at 222 meV (MgGa) and 114 meV (Be-related defect) at T = 18 K [64]. Due to these low ionization energies, the UVLMg and UVLBe bands are quenched at relatively low temperatures (above 100 K and 70 K, respectively). Furthermore, it is known that the electron- and hole-capture coefficients generally decrease with increasing ionization energy for acceptors in GaN [34,66]. Consistent with this trend, UVLMg and UVLBe exhibit the highest Cn (3.2 × 10⁻¹² and 1 × 10⁻¹¹ cm3s−1, respectively) and Cp (both about 1 × 10⁻⁶ cm3s−1), see Figure 9.
The differences between the UVLMg and UVLBe bands offer insights into the origin of the latter. The UVLMg band is prevalent in undoped n-type GaN due to residual Mg contamination, with its intensity increasing markedly under moderate Mg doping while the material remains n-type [34,62]. In contrast, the UVLBe band is either very weak or absent in conductive n-type GaN:Be samples, regardless of Be concentration, as well as in SI GaN:Be if [Be] < 1018 cm−3. In MOCVD-grown GaN, Mg is passivated by hydrogen (with [Mg] ≈ [H]), and MgGa activation requires post-growth annealing above 500–600 °C to dissociate Mg-H complexes [218]. In contrast, both UVLBe and YLBe bands are present in as-grown MOCVD GaN:Be (annealing is not required), and [H] does not noticeably increase with Be doping.
On the other hand, in MBE-grown GaN:Be, the UVLBe appears only after annealing at Tann > 700 °C (Figure 32b). At higher annealing temperatures, the RLBe band at 1.8 eV appears (Section 4.2.4), and the YLBe band intensity decreases. The difference between the MOCVD and MBE GaN:Be can be explained as follows. During MOCVD growth in Ga-rich conditions, mobile species such as VGa and H are abundant at growth temperatures and promote the formation of BeGa and BeGaONBeGa acceptors. In GaN grown by MBE under N-rich conditions, mobile nitrogen vacancies, which act as donors, are abundant and tend to passivate the BeGaONBeGa acceptors. Post-growth annealing at T = 700–900 °C activates BeGaONBeGa, while the released nitrogen vacancies passivate BeGa by forming VNBeGa complexes, thereby reducing YLBe emission and enhancing RLBe intensities.
First-principles calculations predict that BeGaONBeGa complex acts as a dual-nature acceptor with shallow and deep levels at 0.12 and 0.34 eV above the VBM, respectively [64]. However, no PL signal could be found from the deep level. One explanation is that the deep level is actually closer to the VBM than the shallow level. Alternatively, the deep state may not participate in electron-hole recombination if a substantial potential barrier exists between the shallow and deep states. Finally, it remains possible that the UVLBe band originates from a distinct Be-containing complex that has not yet been identified.

4.2.4. BeGaVN-Related RLBe Band

In GaN:Be samples grown by MBE, annealing at Tann ≈ 900 °C induces a strong RLBe band with a maximum at 1.8 eV (Figure 33a). This band is attributed to transitions involving the BeGaVN complex donors [36,150]. In PL spectra from these samples, the VN-related GL2 band (Section 3.3.2) is also observed. First-principles calculations predict a PL band with a maximum at 1.69 eV for transitions from the CBM to the 0/+ level of the BeGaVN complex, which is close to the experimentally determined value of 1.77 eV [36].
The SSPL intensity of the RLBe band remains constant up to ~70 K and decreases at higher temperatures, with an activation energy of about 0.1 eV (Figure 33b). In TRPL experiments, exponential decay of RLBe is observed at the lowest temperatures, in line with its attribution to internal transition from an excited state of the deep donor. The PL lifetime of the RLBe decreases from 2 μs at T = 18 K to 1 μs at T ≈ 70 K (Figure 33b). The PL quenching at T > 70 K is explained by thermal emission of electrons from an excited state located at 0.1 eV below the CBM to the conduction band [36]. These IPL(T) and τ(T) dependences resemble those of the RL2 band in undoped GaN (Section 3.2.2), and the exponential decrease in PL lifetime at T < 70 K can be explained by two excited states with closely spaced levels. However, the slope of the τ(T) dependence is much smaller, and the separation between the levels is smaller for the BeGaVN (2.5 meV) than for the RL2-related defect in undoped GaN (10 meV).

4.2.5. Deep Donor PL (BLBe)

At elevated excitation intensities, the YLBe band becomes saturated, and a new band (BLBe) emerges at 2.6 eV (Figure 34). Its shape can be fitted using Equation (6) with parameters from Table 2. The BLBe band is tentatively attributed to transitions via the 0/+ level of the BeGa defect [61]. When the Fermi level is above the −/0 level of BeGa, two-hole capture may lead to radiative recombination via the 0/+ level of BeGa, making BLBe prominent only at high Pexc, when the BeGa defects are saturated with holes. In p-type GaN:Be, a significant fraction of the neutral BeGa defects are expected to be neutral even at low Pexc; however, the BLBe intensity remains low. This is likely due to a low hole-capture coefficient for the 0/+ level of BeGa, similar to what has been observed for the CN defect (Section 4.1.1).
After a laser pulse, the BLBe intensity decays exponentially at T = 18 K, with a characteristic lifetime of 0.75 ± 0.15 μs, indicative of an internal transition from an excited state to the ground state [61]. The behavior is typical for deep donors in GaN. The quenching of the BLBe band at T > 100 K is attributed to thermal emission of bound holes to the valence band. Concurrently, the PL lifetime decreases with the same activation energy. From these dependences, the 0/+ level was estimated to lie 0.15 ± 0.05 eV above the VBM, and this value agrees with the position and shape of the BLBe band [61]. Note that hybrid functional calculations for BeGa in GaN do not find the 0/+ transition level of this defect [61], possibly because of the close location of this level to the VBM.

4.2.6. Other Be-Related Defects

In MOCVD-grown GaN samples, heavily doped with Be, a weak green luminescence (GLBe) band with a maximum at ~2.4 eV may contribute to the high-energy side of the stronger YLBe band. However, this GLBe component remains unresolved in SSPL and TRPL measurements when the excitation intensity and temperature are varied over wide ranges [61]. This band could be caused by a complex defect containing one or more Be atoms.
BeGaON complexes are expected to form readily in GaN samples containing high concentrations of Be and O, such as bulk GaN crystals grown by the HNPS method with [Be] ≈ [O] ≈ 3 × 1019 cm−3 [46,211]. In hydrostatic pressure experiments on such samples, Teisseyre et al. [211] attributed a broad yellow band, which blue-shifted markedly with pressure, to the BeGaON complex. However, as discussed in Section 4.2.2, these results may also be explained by the assumption that the yellow band originated from isolated BeGa.
Recent PL studies of bulk HNPS GaN:Be,O revealed the BeGa-related YLBe band and the CN-related YL1 band, but no distinct emission band could be conclusively assigned to the BeGaON complex [46]. These results were explained by the assumption that the BeGaON complexes, even when they are present with high concentrations (~3 × 1019 cm−3), are either electrically neutral or exhibit poor hole-capture efficiency, such that their emission is overshadowed by stronger YLBe and YL1 bands. Calculations using Heyd-Scuseria-Ernzerhof (HSE) hybrid functional predict that the BeGaON complex is either a deep donor with the 0/+ level at 0.26 eV above the VBM [211], or it is electrically neutral and does not have transition levels in the band gap [150]. Similarly, the BeGaHi complex has been predicted to be electrically neutral [219].

4.3. Magnesium-Related Defects (UVLMg, BLMg, RLMg)

Magnesium is currently the only impurity reliably used to achieve conductive p-type GaN. This section reviews the PL characteristics of Mg-related defects, focusing on the ultraviolet (UVLMg), blue (BLMg), and red (RLMg) luminescence bands. These bands are discussed in terms of spectral features, defect assignments, and theoretical interpretations.

4.3.1. Historical Overview

Maruska et al. [220] were the first to report Mg doping in GaN, for use in m-i-n diodes emitting violet light. PL measurements at 77 K revealed a blue band with a maximum at 2.925 eV, which the authors attributed to an Mg-related defect with a level at ~0.5 eV above the VBM. However, the Mg-doped GaN samples retained their highly resistive nature, and the realization of effective p-type conductivity remained elusive for several years. It was not until 1989 that a breakthrough was achieved by the team at Nagoya University, who demonstrated conductive p-type GaN through post-growth low-energy electron beam irradiation (LEEBI) treatment of Mg-doped layers [221]. This advance resolved a critical obstacle and ultimately paved the way for the development of bright blue LEDs [222]. Low-temperature (4.2 K) PL spectra from early p-type GaN:Mg samples grown by MOCVD showed the UVLMg band at 3.27 eV (for [Mg] = 1.6 × 1019 cm−3) and a blue band with a maximum at 2.95 eV ([Mg] = 7.1 × 1019 cm−3), both attributed to the Mg acceptor [223,224].
Since then, the Mg-doped GaN has been extensively studied. In particular, it was found that MgGa acceptors, passivated by H during MOCVD growth, can be activated not only via LEEBI treatment [221] but also by thermal annealing at temperatures above 500 °C [225,226]. Early studies of MOCVD-grown GaN:Mg, using room-temperature PL, revealed two PL bands: blue and red [226]. The red band was observed in as-grown, high-resistivity GaN:Mg samples and attributed to Mg-H complexes. The blue band was initially assigned to Mg levels [226]. Later, compelling evidence supported the deep DAP nature of transitions, involving a deep donor and the shallow MgGa acceptor [63,227,228]. The identity of the deep donor remains uncertain (Section 4.3.3).
Conductive p-type GaN can also be achieved without post-growth annealing by MBE technique [169,229,230]. Such samples exhibit the UVLMg band with a maximum at about 3.27 eV (Section 4.3.2). The BLMg band at ~2.9 eV is typically observed in GaN grown by MOCVD heavily doped with Mg and less often in HVPE GaN:Mg (Section 4.3.3). Mg-doped GaN often exhibits the VN-related GL2 band (Section 3.3.2) and the RLMg band (Section 4.3.5).

4.3.2. Shallow or Dual-Nature Acceptor?

Lany and Zunger [206] proposed that MgGa is a dual-nature acceptor. A shallow level with a delocalized hole was predicted at 0.18 eV, and a deep level with a localized hole is calculated at 0.21 eV above the VBM. Transitions of electrons via the shallow level produce the UVLMg band, whereas the BLMg band was hypothesized to arise from the deep level. According to this model, at room temperature and in the dark, holes predominantly populate the deep level, which is therefore responsible for p-type conductivity [206]. Several theoretical studies supported this dual nature [231,232], though others identify only the deep state [233,234]. In particular, Lyons et al. [233] proposed that the MgGa with the calculated deep level at 0.26 eV is responsible for the blue band with a maximum at 2.7 eV, while the UVLMg band is caused by the MgGaHi complexes with the 0/+ level at 0.13 eV above the VBM.
PL experiments consistently identify only the shallow MgGa level producing the UVLMg band (Figure 35).
The BLMg band, observed in heavily Mg-doped MOCVD-grown samples, cannot be attributed to the predicted deep-state of MgGa. Indeed, PL intensities from shallow and deep states of dual-nature acceptors must correlate [45]. In particular, their relative contribution may vary with temperature according to the Boltzmann occupation of levels with holes, but the ratio should remain consistent across samples, as it was observed for BeGa (Section 4.2.2). However, in n-type GaN:Mg and in MBE-grown p-type GaN:Mg, only the UVLMg band is found (Figure 35). If MgGa is a dual-nature acceptor, the absence of deep-level PL suggests either identical transition energies for both states or a substantial potential barrier separating them [45,235].
Heavily Mg-doped GaN contains a variety of defects that affect PL. The analysis of PL is complicated by the fact that even p-type GaN:Mg becomes semi-insulating at low temperatures due to an insufficiently shallow MgGa level. In such material, potential fluctuations due to nonuniform distribution of charged defects or local electric fields associated with structural defects may lead to unstable PL [236,237,238], significant shifts and broadening of PL bands (Section 4.3.4). PL results from GaN:Mg are often difficult to reproduce, and misinterpretations are common.
Pozina et al. [239] initially proposed that two distinct Mg-related acceptors exist in GaN: A1 is responsible for the UVLMg band at 3.27 eV, and A2 is responsible for a broader band at 3.15 eV. However, later these researchers attributed only the 3.27 eV peak to the isolated MgGa acceptor, whereas the 3.15 eV band was explained as PL from MgGa perturbed by a nearby basal plane stacking fault [165].
Callsen et al. [240] proposed that the UVLMg band consists of three components related to three acceptor states, with levels EA = 164, 176, and 195 meV. In their opinion, these results supported the dual nature of the MgGa acceptor proposed earlier [206]. However, these components were not clearly resolved, and variations in the UVLMg peak position across samples are more plausibly explained by donor variability, strain or local electric fields. Even if the proposed states are real, they all look like shallow states with delocalized holes, distinct from the broad blue band expected for the deep MgGa state [206,233].

4.3.3. BLMg Band in Heavily Doped GaN:Mg

The BLMg band, peaking between 2.7 and ~3.0 eV, is commonly observed in MOCVD-grown GaN when Mg concentrations exceed ~1018 cm−3 [16,226,241]. This band exhibits a pronounced blue shift with increasing excitation intensity in SSPL and a red shift with time delay in TRPL (Figure 36). Such behavior is characteristic of deep DAP transitions, specifically involving deep donors and shallow MgGa acceptors [63,227,228].
In contrast, DAP transitions, involving shallow donors (SiGa or ON) and various acceptors in GaN, show only minor spectral shifts (<10 meV) [66]. The large shifts observed for deep DAPs are attributed to the strongly localized nature of the carrier wavefunctions [63,242]. For deep donors with energy levels 0.4–0.6 eV below the CBM, the electron wavefunction is highly confined. In such cases, tunneling to nearby MgGa acceptors is efficient only at high acceptor concentrations (>1018 cm−3). Strong Coulomb interactions between closely spaced DAPs result in a broad distribution of recombination energies, thereby explaining the substantial spectral shifts observed in both SSPL and TRPL.
The BLMg band is notably absent in GaN implanted with Mg, even for Mg concentrations above 1019 cm−3 [243,244,245,246,247], and also in samples co-implanted with Mg and H ions [248]. It is rarely observed in HVPE-grown GaN:Mg [62,249] and is absent in MBE-grown p-type GaN:Mg [169,229,230]. The specific conditions in MOCVD, particularly the abundance of hydrogen, likely facilitate the formation of the responsible deep donor. In particular, Kamiura et al. [250] reported an enhanced BL band in MOCVD-grown GaN:Mg ([Mg] ≈ 1 × 1020 cm−3) after hydrogen plasma treatment. The VNH complex has been proposed as the associated deep donor [165,251,252]. Alternatively, Mg interstitial (Mgi) and Mg-related donors such as MgGaMgi have been suggested by first-principles calculations [47,234,253]. Although earlier reports proposed the VNMgGa complex as the deep donor associated with BLMg [227], it is now more reliably attributed to the RLMg band [36,254] (Section 4.3.5). It is important to note that distinguishing PL bands in Mg-doped GaN, particularly UVLMg and BLMg, can be challenging, as their spectral positions and shapes are sensitive to experimental conditions in SI samples (Section 4.3.4).

4.3.4. Giant Shifts in PL Bands in GaN:Mg

Large spectral shifts in PL bands can result not only from deep DAP transitions but also from screening with photogenerated carriers of potential fluctuations or local electric fields [63,242,255]. This is more typical for SI materials with nonuniformly distributed charged impurities. Diagonal tunnel transitions with reduced energies dominate in PL from a sample with potential fluctuations. The transition energy increases with increasing Pexc (as photogenerated carriers partly screen potential fluctuations), and it eventually becomes equal to the energy in an ideal semiconductor. An example is shown in Figure 37. The UVLMg band (labeled UVL*) redshifts by up to 0.4 eV with decreasing Pexc. Interestingly, the shifting UVL* band coexists with the stable UVLMg at 3.27 eV (Figure 37a). The UVL* band in this case likely originates from a near-surface layer, where band bending may remain significant even at low temperatures (despite being screened by photogenerated charge carriers), whereas stable UVLMg arises from bulk regions [62].
Distinguishing between energy shifts caused by deep DAP nature and those due to the electric-field mechanism is not straightforward. In both cases, a PL band blue-shifts with increasing Pexc and redshifts with time delay after a laser pulse. Nevertheless, there are important differences. For DAP transitions, the total shift is typically limited by the ionization energy of the shallower component [84,158,242]. Shallow DAP shifts are small (<10 meV for a variety of acceptors in n-type GaN [16,62,66]), whereas the BLMg shifts are large, but still limited by the MgGa ionization energy (0.2 eV). In Figure 37b, the BLMg band shift is fitted with a DAP model [158], where the ionization energies of the deep donor and shallow MgGa acceptor are 0.4 and 0.2 eV, respectively. The total shift in the BLMg band in a very wide range of Pexc does not exceed 0.2 eV. On the other hand, shifts due to potential fluctuations or local electric fields may reach magnitudes comparable to the bandgap [242]. In Figure 37b, the UVLMg band redshifts by ~0.5 eV with decreasing Pexc, and the trend does not show any saturation.

4.3.5. MgGaVN-Related RLMg Band

The RLMg band, peaking at 1.6–1.7 eV, is occasionally observed in Mg-doped GaN (Figure 38). It has been attributed to the MgGaVN complex [36,254] and often appears alongside the VN-related GL2 band. ODMR studies of MOCVD-grown Mg-doped GaN revealed a sharp and isotropic signal with a g factor of 2.003 ± 0.003 associated with the RLMg band [256].
PL studies indicate that the RLMg band, with a maximum at 1.68 eV at T = 18 K, originates from electron transitions between an excited state located near the CBM and the ground state ~0.8 eV above the VBM [36]. The PL decay is exponential at T < 50 K, with a lifetime of about 1 μs (Figure 38b). At T > 70 K, both PL intensity and PL lifetime decrease due to the thermal emission of electrons from the excited state to the conduction band. The extracted activation energy of 35 meV corresponds to the energy separation between the excited state and the CBM.
According to first-principles calculations, the MgGaVN defect has the +/2+ and 0/+ levels ~0.8 eV above the VBM [36,234,254], with the +/2+ level possibly 50 meV higher (negative U behavior) [254]. Optical transitions from the CBM to the +/2+ and 0/+ levels are predicted to produce two red PL bands with maxima at 1.83 and 1.81 eV, respectively [254].
When the Fermi level (F) lies above ~0.8 eV, the MgGaVN defects are predominantly neutral under dark conditions or at low Pexc. In this case, hole capture at the 0/+ level, followed by electron capture into the excited state, leads to an internal transition that produces a red PL band (RLMg1). In conductive n-type GaN:Mg samples (overcompensated by shallow donors), the RLMg1 intensity is expected to be significantly lower than the UVLMg intensity, by a factor NRLCpRL/NUVLCpUVL, where N and Cp are the concentrations and hole-capture coefficients for defects responsible for the RLMg1 and UVLMg bands.
In conductive p-type GaN:Mg samples (F ≈ 0.2 eV), the MgGaVN defects are in the 2+ charge state in the dark, and transitions via the +/2+ level can produce another red PL band (RLMg2). In such samples, an electron must first be captured by the excited state, after which a hole is captured at the +/2+ level; their recombination then produces RLMg2. This mechanism is similar to the one suggested for the VN-related GL2 band (Section 3.3.2).
Although theoretical predictions suggest two distinct red PL bands associated with the 0/+ and +/2+ transition levels in Mg-doped GaN, experimental validation is still lacking. The RLMg band with ħωmax = 1.68 eV and τ0 = 1 μs (Figure 38) is likely caused by transitions via the 0/+ level (RLMg1) in SI GaN:Mg because the GL2 band is also observed. According to limited experimental reports, a weak red band is observed in conductive p-type GaN, sometimes together with the GL2 band [47,257]. Note that GaN:Mg samples may be nonuniform, with conductive p-type and SI regions [47]. In such samples, p-type conductivity can be confirmed by the Hall effect, while the PL response may predominantly arise from SI regions.
The red band reported by Nakamura et al. [225,226] in GaN:Mg may differ from RLMg1 and RLMg2, as it was observed at room temperature in SI GaN:Mg and was absent in conductive p-type samples. Bayer et al. [258,259] observed a weak red band at T = 5 K in MOCVD-grown p-type GaN:Mg, but they did not provide its temperature dependence. In our measurements, a weak red band consistent with RLMg1 was detected at T = 18 K in MBE-grown GaN:Mg. At room temperature, it could not be resolved (completely quenched), whereas the UVLMg band remained strong [47]. The quenching of that RLMg band with an activation energy of ~0.1 eV is attributed to electron thermal escape from the excited state to the conduction band [36].

4.4. Zinc (BLZn)

The ZnGa acceptor, with the −/0 level at 0.40 eV above the VBM, efficiently captures photogenerated holes, producing the BL1 band in undoped GaN contaminated with Zn (Section 3.4.1). In Zn-doped GaN, this band, referred to as BLZn, is the dominant defect-related PL feature.

4.4.1. BLZn Band in Zn-Doped GaN

The BLZn band exhibits ZPL at 3.10 eV, followed by phonon replicas (Figure 18a and Figure 39a). At T < 50 K, the band arises from DAP transitions involving shallow donors and ZnGa acceptors. At higher temperatures, e-A transitions dominate thanks to thermal emission of electrons from shallow donors to the conduction band. In Zn-doped GaN, BLZn is the strongest defect-related band (Figure 39a). In the NBE region, excitons bound to neutral ZnGa acceptors (ZnXA) are resolved. Zn-doped GaN samples are typically semi-insulating, although p-type conductivity is occasionally confirmed [260].

4.4.2. Tunable and Abrupt Quenching

The BLZn band in SI and p-type GaN:Zn displays remarkable features, such as quenching by the TAQ mechanism, two-step quenching, and strongly superlinear dependence on excitation intensity [52,261,262]. The BLZn quenching occurs at a critical temperature T0, which increases with excitation intensity (Figure 39b). The quenching is abrupt, with a slope much larger than any reasonable activation energy. The TAQ is explained by a transition from an inverse carrier population regime at T < T0 to an equilibrium population regime (p-type or SI) at T > T0. At low temperatures, photogenerated electrons and holes rapidly populate donors and acceptors, respectively, saturating nonradiative deep donors with electrons, even at very low excitation intensities. This suppresses nonradiative recombination, enabling efficient radiative recombination. Under SSPL conditions, the concentration of electrons in the conduction band can greatly exceed the concentration of holes in the valence band (photo-induced n-type conductivity). With increasing temperature, holes from acceptors are thermally emitted to the valence band. At TT0, the excess of these thermal holes over photogenerated holes unblocks nonradiative recombination channels, causing an abrupt reduction in radiative recombination efficiency, including the BLZn and NBE emissions. Since the concentration of photogenerated holes is proportional to the excitation intensity, a higher temperature T0 is needed at higher Pexc to activate nonradiative recombination channels. Figure 39b shows the IPL(T) dependences and their fit with numerical solutions of rate equations for a p-type semiconductor with three types of defects: shallow donors D, radiative acceptors A (ZnGa), and unknown nonradiative donors S.

4.4.3. Two-Step Quenching

When two acceptor species with comparable concentrations coexist, two-step quenching by the TAQ mechanism is possible [261]. An example is shown in Figure 40a for a Zn-doped GaN sample contaminated with Mg. The first quenching step at T1 occurs due to hole emission from the MgGa acceptor (EA = 0.2 eV) to the valence band, partially unblocking the nonradiative channel. An abrupt drop at T2 (the second step) is caused by thermal emission of holes from the ZnGa acceptor (EA = 0.4 eV) to the valence band and complete activation of the nonradiative channel. Both T1 and T2 are tunable with Pexc.

4.4.4. Superlinear Excitation Intensity Dependence

The excitation intensity dependences in samples exhibiting the TAQ mechanism demonstrate strongly superlinear behavior [262]. Figure 40b shows the quantum efficiency of the BLZn band at selected temperatures. In contrast to a linear IPL(Pexc) dependence in conductive n-type GaN samples, PL intensity sharply increases at a critical Pexc, which itself increases with temperature. The TAQ and superlinear rise in PL intensity represent two aspects of the same underlying mechanism: the suppression or reactivation of nonradiative recombination channels as a function of carrier population dynamics.

4.4.5. Other PL Bands in Zn-Doped GaN

Early studies of Zn-doped GaN reported, in addition to BLZn at 2.87 eV, three other PL bands (at 2.6, 2.2, and 1.8 eV), attributed to Zn-related defects [263,264]. The 2.6 eV band appeared as a shoulder on the low-energy side of the BLZn band and is likely the BLZn band red-shifted due to local electric fields (shifts by up to 0.2 eV were observed for other PL bands with increasing Pexc in [263]). Note that the BLZn band may red-shift by up to 0.8 eV with decreasing Pexc in SI GaN:Zn and could be confused with other PL bands [54]. The 2.2 eV band is most likely the YL1 band, caused by carbon contamination. The band at 1.8 eV aligns with predictions from first-principles calculations for the ZnGaVN complex [36]. A similar PL band with a maximum at 1.8 eV has also been observed in Zn-doped GaN grown by HVPE [36]. However, careful analysis of SSPL and TRPL indicated that it is the RL3 band, likely caused by contamination with Fe (Section 3.2.3). It is also probable that the ZnGaVN complex is a nonradiative defect [265]. Thus, BLZn with a maximum at ~2.9 eV is the only PL band in GaN that can be reliably attributed to Zn.

4.5. Cadmium (BLCd)

The CdGa acceptor, with the −/0 level at 0.55 eV above the VBM [48,59,266], produces the blue (BLCd) band with a maximum at 2.7 eV (Figure 41a). Lagerstedt and Monemar [59] observed a ZPL at 2.937 eV at T = 1.6 K, followed by phonon replicas. Assuming that this ZPL originates from DAP transitions involving shallow donors and CdGa acceptors, the CdGa acceptor ionization energy was estimated to be EA = 0.55 eV [48], consistent with earlier assessments [266]. In conductive n-type GaN:Cd (overcompensated with SiGa donors), the BLCd band quenches at T > 310 K (Figure 41b). The quenching can be fitted using Equation (2) with EA = 0.435 eV, a value slightly lower than the low-temperature spectroscopic value of 0.55 eV [48,59,266].
The electron- and hole-capture coefficients for the CdGa acceptor have been estimated from TRPL and SSPL analyses to be Cn = 2.6 × 10⁻¹³ and Cp = 3 × 10⁻⁷ cm3s−1, respectively [48]. The PL properties of CdGa resemble those of ZnGa [48,59,266]. The attribution of the BLCd band to Cd has also been confirmed via PL experiments involving radioactive isotopes [267,268]. In these experiments, the decay of the 111Ag isotope to 111Cd (half-life = 7.6 days) correlated with the emergence of the BLCd band at the same temporal rate.
First-principles calculations using HSE hybrid functional, parametrized to fulfill the generalized Koopmans’ conditions, predict a ZPL at 3.0 eV and a band maximum at 2.57 eV, in close agreement with experimental observations [235]. Additionally, these calculations predict a yellow band at 2.12 eV, attributed to electron transitions from the CBM (or an excited state close to it) to the 0/+ level of the CdGaVN complex. However, this band has not been observed experimentally [48].

4.6. Calcium (GLCa, RLCa)

The CaGa is a deep acceptor in GaN, with the −/0 level at 0.50 ± 0.02 eV above the VBM [49]. It causes the green luminescence band (GLCa) with a maximum at 2.5 eV [49,87,269]. In the presence of nitrogen vacancies, CaGaVN complexes form, producing a red luminescence (RLCa) band with a maximum at 1.82 eV [36]. The properties of both bands are reviewed below.

4.6.1. CaGa-Related GLCa Band

The GLCa band is typically observed in GaN implanted with Ca [49,87,269], although it may also appear in undoped GaN grown at low temperatures due to unintentional contamination with Ca [49]. The PL band is broad and structureless, and its shape can be modeled using Equation (6) with parameters listed in Table 2 (Figure 42a).
HSE hybrid functional calculations, tuned to satisfy the generalized Koopmans’ condition, accurately reproduce the GLCa band features [235]. In particular, they predict ħωmax and ZPL at 2.53 eV and 3.08 eV, closely matching the experimental values of ħωmax = 2.5 eV and E0 = 3.0 eV. Note that other HSE parametrizations yield poorer agreement, predicting: ħωmax = 2.23 eV and E0 = 2.80 eV [49], or ħωmax = 2.07 eV and E0 = 2.49 eV [270,271].
In SI GaN:Ca samples, the quenching of the GLCa band by the TAQ mechanism is observed at T > 200 K [49]. In n-type GaN:Ca samples, the GLCa quenching occurs by the Schön–Klasens mechanism [74]. The following parameters of the CaGa acceptor have been determined from SSPL and TRPL dependences: EA = 0.49 ± 0.01 eV, Cp = (6 ± 2) × 10−7 cm3s−1, and Cn = (9.5 ± 2) × 10−14 cm3s−1 [49].

4.6.2. GLCa Band in Undoped GaN

The GLCa band was also found in undoped GaN grown by MBE on freestanding GaN substrates (Figure 42b). It was originally referred to as the aquamarine luminescence (AL) band [153]. Young et al. [155] demonstrated that undoped GaN samples grown by the MBE method may contain Ca concentrations as high as 1018 cm−3. From the analysis of excitation intensity dependences, the concentrations of CaGa defects in MBE GaN samples analyzed in [49,153] (Figure 42b) were estimated to be 2 × 1016 cm−3 (MBE-1) and 6 × 1014 cm−3 (MBE-2). The GLCa band is strong even for low concentrations of Ca because the CaGa acceptors efficiently capture photogenerated holes.

4.6.3. CaGaVN-Related RLCa Band

In SI GaN samples implanted with Ca, the RLCa and GL2 bands are observed at 1.82 and 2.33 eV, respectively (Figure 43a). The GL2 band originates from isolated VN (Section 3.3.2), while the RLCa band is attributed to the CaGaVN complex [36,49]. The RLCa band arises from electron transitions between an excited state located 0.25 ± 0.05 eV below the CBM and the 0/+ level of the CaGaVN donor, which lies at about 1 eV above the VBM [36]. The PL decay after a laser pulse is exponential, with τ ≈ 2 ms at T = 18–160 K. This PL lifetime is three orders of magnitude longer than for other AVN complexes (A = BeGa and MgGa), suggesting a forbidden transition. At higher temperatures, the RLCa intensity and its lifetime decrease with an activation energy of about 0.25 eV (Figure 43b). The PL quenching is explained by thermal emission of electrons from the excited state to the conduction band, followed by capture by nonradiative defects.
In contrast to other AVN complexes (Section 3.2.2, Section 4.2.4, and Section 4.3.5), but similar to isolated VN (Section 3.3.2), the RLCa band is relatively narrow (W0 = 0.25 eV). First-principles calculations, using the HSE hybrid functional tuned to fulfill the generalized Koopmans’ condition [36], disagree with the experimental results. Specifically, the CaGaVN-related PL band is predicted to be broad (W0 ≈ 0.48 eV), and the calculated optical transition level is expected at 1.47 eV below the CBM, whereas the experimental value (after correcting for the excited state location) is 2.07 eV.

4.7. Mercury (GLHg)

The HgGa acceptor is responsible for the green luminescence (GLHg) band with a maximum at ~2.5 eV [87,267,272] or, more precisely, at 2.44 eV (Figure 44a) [48]. A sharp intensity drop at 2.73 eV (marked by an arrow in Figure 44a) is attributed to the GLHg band ZPL [48]. Based on this assignment, the −/0 level of HgGa is estimated at 0.77 eV above the VBM. From the GLHg band quenching at T > 500 K (Figure 44b), EA = 0.62–70 eV and Cp = (1–5) × 10−7 cm3s−1 have been determined for the HgGa acceptor [48]. From TRPL experiments, the electron-capture coefficient was found as Cn = 3 × 10⁻¹³ cm3s−1 [48].
The assignment of the ~2.5 eV band to Hg was also confirmed in PL experiments involving radioactive isotopes [267]. Specifically, in samples doped with 197Hg, which decays to 197Au with a half-life of 64 h, the GLHg band diminished at the same rate, affirming its origin from HgGa centers.
HSE hybrid functional calculations tuned to fulfill the generalized Koopman’s condition, reproduce the shape and position of the HgGa-related GLHg band relatively well [48,235]. The band maximum and ZPL are calculated at 2.45 eV and 2.83 eV, respectively, in close agreement with experimental observations (2.44 eV and 2.73 eV) [235].

4.8. PL from Other Defects

4.8.1. Isoelectronic Impurities

Isoelectronic defects, AsN and PN, are responsible for the BLAs and BLP bands with maxima at 2.6 and 2.9 eV, respectively. In high-quality GaN samples, both bands exhibit sharp ZPLs (at 2.952 eV for BLAs and 3.197 eV for BLP) followed by phonon replicas [57]. These PL bands are often interpreted as excitons bound to isoelectronic defects [57]. Note that exciton binding energy cannot be directly compared to charge transition levels. For example, the −/0 transition level of ZnGa lies 400 meV above the VBM and is responsible for the BLZn band with a maximum at 2.9 eV and ZPL at 3.10 eV, whereas an exciton bound to ZnGa, with a binding energy of ~24 meV, produces a line at 3.455 eV in GaN [16].
According to early DFT calculations, the AsN defect is neutral in n-type GaN (as expected for isoelectronic impurities), and it acts as a donor with a 0/+ transition level at 0.31 eV [273] or 0.41 eV [274] above the VBM. Similar to other deep donors in GaN, after capturing a photogenerated hole, an electron can be captured at an excited state of As+ near the CBM, followed by an internal transition that produces the BLAs band. Gil et al. [275] observed exponential decay of the blue band (at ~2.6 eV) in MBE-grown GaN:As, with τ0 = 92 ns at T = 8 K. Assuming the excited state lies ~0.02 eV below the CBM [55], and using the ZPL at 2.952 eV (with Eg ≈ 3.512 eV) [57], the 0/+ level of AsN can be estimated to lie 0.54 eV above the VBM. Thermal quenching of the BLAs band with an activation energy of ~50 meV at temperatures between 100 and 300 K was attributed to thermal release of electrons from AsN [276].
Similarly, the 0/+ level of PN can be calculated at 0.29 eV above the VBM from the experimentally observed ZPL for the BLP band, closely matching early DFT predictions (0.22 eV) [274]. The related BLP band is quenched with an activation energy of 0.28 eV at T > 290 K [58], consistent with thermal release of holes bound to PN.
Interestingly, the intensity of the BLAs band in GaN:As samples varies significantly between reports. In HVPE GaN implanted with As ([As] = 1017 cm−3), the BLAs band was well resolved (yet ~3000 times weaker than the NBE emission at Pexc = 0.26 Wcm−2), and no other defect-related PL bands were observed between 2.4 and 3.4 eV [57]. In contrast, As-doped GaN samples grown by MOCVD with [As] = (0.3–5) × 1017 cm−3 (from SIMS) remained conductive n-type with n = (1–5) × 1017 cm−3, and no BLAs band could be found [277,278]. In Ref. [277], the PL spectra were dominated by the CN-related YL1 and MgGa-related UVL bands (which could be recognized by their positions and shapes). The YL1 intensity decreased by a factor of ~100, while the UVL intensity increased by ~100-fold with increasing As concentration [277]. From these results, one could conclude that As either contributes to the UVL band or acts as a nonradiative defect. In fact, it is likely that the BLAs was too weak in that work because AsN donors in n-type material are expected to capture photogenerated holes very inefficiently compared to negatively charged CN and MgGa acceptors. The C, Mg, and possibly some nonradiative defects could be introduced due to specific growth or doping conditions. We observed relatively strong YL1 and UVLMg bands in GaN samples with concentrations of C and Mg below the SIMS detection limit [83].

4.8.2. PL from Implantation Damage

GaN, implanted with various elements, becomes non-luminescent due to the creation of numerous nonradiative defects. For example, simulations indicate that implantation of Zn ions into GaN with a fluence of 1016 cm−2 creates ~1022 cm−3 of VGa and over 1023 cm−3 of VN defects [279]. Post-implantation annealing partially repairs this damage, though some defects remain. Pankove and Hutchby [87] implanted 35 elements into GaN and observed yellow and red PL bands in nearly all samples after annealing for one hour at 1000–1050 °C in flowing ammonia. Although the YL band at 2.15 eV was thought to be implantation-damage-related [87], it is highly likely that it was the CN-related YL1 band due to contamination with C (except for the YLBe band in Be-implanted GaN). The red band at ~1.75 eV, however, was linked to a defect forming during thermal annealing (appearing even in unimplanted GaN) [87]. Chen and Skromme [57,280] investigated GaN implanted with various elements and attributed a similar red band (at 1.73–1.78 eV) to implantation-induced damage, as the band was absent in annealed unimplanted GaN.
We observed a red band with a maximum at ~1.6 eV (Positions of the broad band maxima reported by various authors must be compared with caution. In particular, the RL5 band maximum redshifts by about 0.1 eV after applying the λ3 correction) (denoted RL5) in GaN implanted with Cd, Ca, Hg, F, or Cl ions (Figure 45a). Due to limitations of the measurement setup, the full RL5 band shape could not be studied at ħω < 1.5 eV. Nevertheless, its consistent appearance in GaN implanted with various ions suggests a common origin—implantation damage.
The RL5 intensity decreases modestly (by a factor of 2–3) with increasing temperature from 18 to 300 K. At least in the cases of implantations with F, Cl, or co-implantation with Be and F, the RL5 band was observed only in conductive n-type GaN samples (HVPE GaN with [Si] ≈ 3 × 1018 cm−3) [214]. TRPL measurements reveal nonexponential decay of RL5 at T = 18–100 K (as t−m with m = 0.8–1.0 between 0.02 and 1000 μs), while nearly exponential decay was observed for YL1 and BL1 in the same samples, with lifetimes corresponding to n = 1018 cm−3. The RL5 band could not be excited by the 2.805 eV line of the HeCd laser, unlike the RLC band in C-doped GaN (Section 4.1.3). It is likely that the RL5 band is caused by deep DAP transitions involving implantation-induced defects.
In SI GaN implanted with F, Cl, or co-implanted with Be and F, an orange luminescence (OL1) band with a maximum at ~1.9 eV was observed [214]. The OL1 was particularly strong in PL spectra of SI GaN:Be,F with [Be] < [F] (Figure 45b). The same OL1 band also appears in GaN samples implanted with only F, and possibly the same band contributes to the PL spectrum from SI GaN implanted with Cl (Figure 45b). The defect responsible for OL1 is unlikely to include Be, as the band is absent in GaN:Be,F samples with [Be] > [F] or in Be-implanted GaN [151]). It may involve F (because the OL1 band appears only when [Be] < [F] or in F-implanted GaN). However, the OL1 band could also originate from a defect unrelated to F if the OL1 band in F- and Cl-implanted samples is identical, which is premature to conclude because the OL1 band in Cl-implanted GaN overlaps with the CN-related YL1 band and is poorly resolved. First-principles calculations suggest that the OL1 band may originate from the VGaFN complex, with transitions via its 0/+ level at about 1.0 eV above the VBM (if the Fermi level is lower than ~2 eV above the VBM) [151]. However, in n-type GaN, the FNVGa defect is predicted to be negatively charged and is not expected to contribute to visible PL. The identity of the shoulder at ~2.5 eV in Cl-implanted GaN (the GLX band in Figure 45b) remains unresolved.

5. Advances in Defect-Related Photoluminescence in GaN Since 2005

This section reviews key developments in understanding defect-related PL in GaN since 2005, focusing on the identification of PL bands, quenching mechanisms, recombination processes, multi-charged defects, and advances in computational modeling. While significant progress has been made, persistent challenges remain in defect identification and establishing a quantitative understanding of their optical activity.

5.1. PL Bands in Undoped GaN

As of 2005, the origins of several major PL bands in undoped GaN were under debate. In particular, the YL band at 2.2 eV was commonly attributed to carbon-related defects (excluding isolated CN) or to VGa-related complexes, such as VGaON. The UVL band at 3.28 eV was linked to a variety of candidates, including MgGa, CN, SiGa, and structural defects. The RL2 and GL2 bands in SI GaN were incorrectly assigned to GaN antisite defects, while the GL1 band observed in HVPE GaN was interpreted as a secondary emission from YL-related centers. The BL2 band in high-resistivity GaN was often linked to Ga vacancies or confused with the Zn-related BL1 band.
Recent studies have clarified the assignments of most PL bands (Table 1). The YL band (YL1) is now firmly attributed to the CN acceptor, which forms readily due to residual carbon contamination. Its -/0 and 0/+ charge transition levels give rise to the YL1 and BLC bands, respectively, in agreement with modern theoretical predictions. The UVL band (UVLMg) at ~3.28 eV is unambiguously attributed to MgGa; no evidence supports the presence of other shallow acceptors in undoped GaN (an exception is the shallow Be-related acceptor in Be-doped GaN). The BL2 band originates from the CNHi complex, which can dissociate under UV exposure, subsequently giving rise to the YL1 band. The GL2 and RL2 bands are attributed to VN-related centers, specifically isolated VN and AVN complexes, respectively.
In conductive n-type GaN, PL bands, such as RL1, YL1, BL1, and UVL, result from electron transitions involving acceptor levels. Hole capture at these acceptors occurs without an energy barrier. At low temperatures, DAP-type recombination occurs, involving these acceptors and shallow donors. Above 50 K, transitions from the CBM become dominant. These PL bands are strong due to efficient hole capture by negatively charged acceptors. In high-resistivity or SI GaN samples, competition for photogenerated electrons enables PL from deep donors, such as RL2, GL2, BL2, via internal transitions.

5.2. Mechanisms of PL Quenching

Before ~2010, quenching of PL from defects in semiconductors was attributed to two mechanisms, both modeled with Equation (2): (i) conversion of a radiative defect to a nonradiative state (Seitz–Mott mechanism), where the activation energy EA represents a potential barrier in adiabatic potentials, and (ii) thermal emission of bound carriers to the conduction or valence band, followed by recapture at nonradiative defects (Schön–Klasens mechanism), where EA in Equation (2) is an ionization energy. In fact, no examples of the first mechanism can be found for defects in GaN. The quenching of the GL2 and RL2 bands, erroneously explained with the Seitz–Mott mechanism [16], is now attributed to thermal emission of electrons from an excited state ~0.1 eV below the CBM to the conduction band (Section 3.2.2 and Section 3.3.2).
A significant development came in 2011 with the discovery of the TAQ mechanism, initially observed in Zn-doped GaN [52]. Although the IPL(T) dependences could be formally fitted with Equation (2), the extracted parameters C and EA are anomalously large, lacking physical meaning. Subsequent studies demonstrated that the TAQ mechanism is a general phenomenon, applicable to GaN doped with various acceptors, including Zn, Mg, C, Be, Cd, and Hg, as well as other SI semiconductors [74]. The essence of the TAQ mechanism is a conversion from population inversion at low temperatures to near-equilibrium population above a critical temperature, which increases with excitation intensity—hence the term “tunable”.
Furthermore, it is sometimes challenging to explain PL quenching and interpret associated activation energies. For example, when PL from acceptors in n-type GaN is quenched by the Schön–Klasens mechanism, the EA found from fits with Equation (2) is often lower than the true ionization energy. This discrepancy can arise from inadequate experimental conditions (e.g., very high Pexc), nonexponential PL decay, or the presence of local electric fields [75].
An additional phenomenon, known as “negative thermal quenching”, where the PL intensity increases with temperature, has been observed and explained by a competition between radiative and nonradiative recombination channels for photogenerated carriers [53,81]. A special case of two-step quenching of the YLBe band in Be-doped GaN samples is explained by a sudden reduction in light extraction efficiency from BeGa centers after temperature-activated reorientation of related defect dipoles (Section 4.2.2).

5.3. Radiative and Nonradiative Recombination

5.3.1. Internal Quantum Efficiency

While quantum efficiency is a key parameter to quantify PL, determining the EQE of PL remains technically challenging, and the IQE η cannot be measured directly. The EQE can be obtained using integrating sphere techniques, which require careful calibration and analysis [67,68,69,70,71]. IQE exceeds EQE by the light extraction efficiency, which depends on various sample-specific parameters, including surface morphology, crystal polarity, and refractive index contrast at interfaces.
Nevertheless, several phenomenological models have been developed to estimate the absolute IQE from temperature- or excitation-dependent PL measurements, particularly in samples exhibiting strong PL [53,81]. One such approach is based on analyzing the competition among radiative channels when an intense PL band (with a close to unity η) undergoes quenching via the Schön–Klasens mechanism. Under these conditions, the intensities of all other PL bands increase by a factor of R (the negative thermal quenching), and the absolute IQE of the quenched band can be expressed as η = 1 − R−1 [53]. The method is particularly efficient in conductive n-type, where PL intensities are proportional to the product of hole-capture coefficients and defect concentrations [39]. Once absolute IQEs are found, the concentrations of defects responsible for specific PL bands can also be estimated [80]. While foundational concepts for quantifying PL in this manner were introduced earlier [16], these methods have been substantially refined and extended in recent studies [38,39,52,53,80,81,83].

5.3.2. Nonradiative Recombination

Nonradiative recombination in GaN originates from both point defects and extended structural defects, including dislocations, domain boundaries, interfaces, and surfaces. Point defects responsible for nonradiative recombination are typically deep-level centers characterized by strong electron–phonon coupling, where the recombination energy of electrons and holes is dissipated through multiphonon emission. Recent studies have also suggested that radiative defects may become nonradiative under high carrier concentrations or intense optical excitation via the TAAM recombination mechanism [185,281,282].
Structural defects, particularly threading dislocations, have long been implicated in nonradiative losses. Spatially resolved micro-CL and micro-PL studies consistently reveal reduced emission at dislocation sites, observed as “dark spots” in PL or CL maps [283,284,285]. The suppression of emission at these locations can be attributed to either nonradiative recombination at dislocation sites or local carrier depletion induced by electric fields from charged dislocations.
Phenomenological models of carrier recombination typically describe the recombination rate as a sum of parallel radiative and nonradiative processes, where each recombination channel is associated with a specific recombination center. Nonradiative recombination through a large number of unresolved pathways is commonly modeled by an effective deep-level defect characterized by empirical electron- and hole-capture coefficients, as well as an effective concentration [52,53].

5.3.3. Surface Effects on PL

The surface of GaN can significantly affect its PL, especially at elevated temperatures and in oxygen- or water-containing ambient. For example, the NBE intensity in undoped n-type GaN has been observed to increase by a factor of 3–14 after photoelectrochemical oxidation [286], and by 4–6 times after sulfide treatment [287]. In contrast, prolonged exposure to HeCd laser irradiation in air can reduce the NBE intensity due to photoinduced surface oxidation [288]. Under high-vacuum conditions at T = 10 K, however, continuous HeCd laser exposure enhances the NBE intensity, which is attributed to photoinduced desorption of surface oxygen [289]. Similarly, the YL1 intensity in SI GaN:C was found to decrease by a factor of ~300 in ambient air or oxygen compared to vacuum [290]. These observations illustrate the strong influence of surface conditions on PL, which are typically attributed to nonradiative recombination at surface states and/or changes in the width of the near-surface depletion region.
In n-type GaN, an upward band bending (~1 eV at room temperature) is observed due to the accumulation of negative charges at the surface [291,292,293]. The associated depletion region in such material extends up to ~0.1 μm (for n ≈ 1017 cm−3). Within this region, photogenerated electrons and holes are rapidly separated by the strong built-in electric field and subsequently recombine nonradiatively—a phenomenon described as the field-effect mechanism [294]. Modifying the surface charge changes the width of the depletion region and, consequently, the PL intensity. Although the minority hole diffusion length in GaN is short (0.2 µm or less [291,295]), accurate modeling of PL intensity variations must account for both carrier drift and diffusion within the depletion layer [296]. Nevertheless, in many GaN samples, the field-effect mechanism plays only a minor role. Instead, significant changes in PL intensity arise primarily from nonradiative recombination at surface states, the concentration of which depends on ambient atmosphere and surface treatment conditions [297]. High density of nonradiative defects near the surface can also significantly suppress PL. For example, mechanical polishing of freestanding GaN templates with diamond slurries, ending with ~1 μm particle size, reduced the PL intensity by four orders of magnitude despite minimal changes in band bending [123].
In p-type GaN, surface band bending is downward and can reach up to 2 eV at elevated temperatures [298,299]. However, the depletion region is narrow (<10 nm) because of the high concentration of uncompensated Mg acceptors. At low temperatures, band bending is expected to be small in conditions of PL (< 10 kT). Nevertheless, surface effects in such samples can still significantly influence the PL intensity and its temperature behavior. Notably, large shifts (up to 0.6 eV) of the UVLMg band with varying excitation power have been observed in Mg-doped GaN at low temperatures (Section 4.3.4). These shifts were attributed to diagonal electron transitions occurring within the near-surface depletion region [54,62].

5.4. Electronic Structure

5.4.1. Multi-Charged Defects

Transitions via different charge transition levels of multi-charged defects in GaN are expected to produce distinct PL bands. A well-established example is the CN defect responsible for the YL1 and BLC bands, associated with electron transitions via the −/0 and 0/+ levels, respectively [25,60] (Section 4.1.1). Preliminary results also suggest that the −/0 and 0/+ levels of the BeGa defect produce the YLBe and BLBe bands [61] (Section 4.2.5). In another case, the BL3 band, observed in HVPE GaN at high Pexc, is presumably a secondary emission from the RY3 defect, occurring after the capture of two holes. The GL1 band is a secondary emission from yet unknown defects.
Distinct charge transition levels for other multi-charged defects, such as VGa, VN, and complexes containing these vacancies, have not been clearly identified in PL experiments. Attributions of the GL2 band to transitions via the +/2+ level of VN and RLA bands to transitions via the 0/+ level of AVN complexes (with A representing cation acceptors) are also preliminary, as more than one transition level of a multi-charged defect may contribute to the observed PL bands.

5.4.2. Dual-Nature Defects

The concept of dual-nature defects, where a single charge state exhibits multiple transition levels due to different carrier localization configurations, has been theoretically proposed [206]. This phenomenon is believed to be potentially widespread in wide-bandgap semiconductors. Experimentally, however, dual-nature behavior has been unambiguously confirmed for only one defect in GaN: the BeGa acceptor [45]. In its neutral charge state, this defect exhibits two polaronic configurations, with the −/0 transition levels located at 0.35 and 0.39 eV above the VBM. In the higher-energy state (0.39 eV), the hole is localized on a neighboring nitrogen atom along the c-axis, whereas in the lower-energy state (0.35 eV), the hole is localized on one of the three basal-plane nitrogen atoms. Additionally, a third, shallow −/0 level at 0.24 eV above the VBM corresponds to a weakly localized hole. First-principles calculations also predict dual-nature behavior for other acceptors, including MgGa [206,231,232,235], ZnGa [206,235], and BeGaONBeGa complex [64]. To date, however, these predictions remain experimentally unverified, and PL associated with only shallow levels has been observed for these defects.

5.4.3. Excited States

Excited states associated with deep donors have recently been identified by PL for several centers in GaN, including CNHi (BL2), VN (GL2), and AVN complexes (RLA bands with A = BeGa, MgGa, and CaGa). Donor-like states of multi-charged defects also exhibit excited states near the CBM, as observed for CN (BLC), BeGa (BLBe), and RY3 center (BL3). Among acceptor-like defects, only the RY3 center exhibits an excited state near the VBM (Section 3.2.3). Excited states have also been predicted for multi-charged defects, such as VGaON and VGaHi [118], though these states have not yet been directly confirmed experimentally.
An unusual behavior, where PL lifetime significantly increases with temperature, has been observed for the GL1 band. This effect is attributed to nonradiative capture of electrons via a ladder of excited states by the Lax mechanism and subsequent radiative recombination producing the GL1 band (Section 3.3.1). By analogy with the so-called giant traps in Ge and Si, the related defects have been termed optically generated giant traps.

5.5. Identification of Defects

5.5.1. Conventional Approaches

PL spectroscopy is an indispensable tool for identifying defect-related emission bands and probing their properties. However, it often fails to provide direct information about the chemical composition or atomic structure of the underlying defects. Historically, in undoped semiconductors and insulators, PL bands were typically attributed to native point defects (e.g., cation vacancies in crystals grown under anion-rich conditions), whereas in doped materials they were commonly linked to impurity dopants [300,301]. A widely used strategy for defect identification involves correlating PL intensities with impurity concentrations obtained from SIMS measurements. Another approach compares the positions and shapes of PL bands with theoretical databases generated from first-principles calculations to propose defect assignments.
However, extensive studies of GaN have revealed serious limitations of these approaches. In particular, the assumption that PL intensity scales linearly with defect concentration holds only under restricted conditions, such as low concentrations of radiative defects, weak excitation, and in conductive n-type material. As illustrated in Figure 46, the intensities of the UVLMg (UVL), BLZn (BL1), and YL1 bands are proportional, respectively, to the concentrations of Mg, Zn, and C impurities only up to ~1016 cm−3, where the IQE of these PL bands approaches unity. Note that the SIMS detection limit for these impurities is in the 1015–1016 cm−3 range. Beyond these limits, the lack of proportionality (and sometimes even anticorrelation) between PL intensity and impurity concentration often leads to erroneous defect assignments.
Modern first-principles calculations can predict the properties of point defects with relatively high accuracy (Section 5.6). When combined with reliable experimental data, they provide a powerful framework for defect identification in GaN. Although PL offers the most direct and accurate information on defects in GaN, complementary experimental techniques supply essential corroborative evidence. In particular, temperature-dependent Hall effect measurements have confirmed the spectroscopically found −/0 levels of the BeGa, ZnGa, and CN acceptors in SI (p-type) GaN [215,260,302]. Photo-EPR studies of C-doped GaN have verified the model of the CN acceptor (Section 3.1.2), for which an isotropic g-value of 1.987 ± 0.001 has been found [302,303,304]. It is worth noting that g factors for acceptors are generally expected to exceed the free-electron value (ge = 2.0023) [122,216,305]; however, exceptions exist (including the case of CN), and relying solely on the g-value for defect identification may lead to misassignments.
Capacitance-based techniques, such as DLTS and DLOS, have revealed numerous electrically active defects in GaN, providing key parameters, including thermal ionization energies and carrier-capture cross-sections [5,306,307]. For brevity, only a few examples, closely related to the PL data discussed in this review, are highlighted here. The presence of two charge states of the CN defect has been conclusively verified by DLTS [26,184]. Horita et al. [308] identified the 0/+ level of VN at 0.13 eV below the CBM and the −/0 level of Ni at 0.98 eV below the CBM in n-type GaN irradiated with 137 keV electrons. In similarly irradiated p-type GaN, a DLTS peak, corresponding to a hole trap with an ionization energy of 0.52 eV above the VBM, was observed and tentatively attributed to either the +/3+ level of VN or the +/2+ level of Ni [309]. Zajac et al. [310] investigated Mg-doped p-type GaN grown by the AT method. Using Laplace-transform photoinduced transient spectroscopy, they revealed hole traps at 0.43–0.45 eV above the VBM, with hole-capture coefficients Cp ≈ 3 × 10⁻¹¹–10−10 cm3s−1. These traps were attributed to the 3+/+ and 2+/+ transition levels of VN. An electron trap at 0.6 eV below the CBM, detected by DLTS in Si-doped n-type GaN grown by MOCVD, was attributed to the FeGa acceptor [311]. A Be-related electron trap with a level at 0.24–0.39 eV below the CBM was found by thermal admittance spectroscopy and DLTS in GaN implanted with radioactive 7Be isotopes [312], likely corresponding to the Bei donor.
Despite these advances, correlating PL with DLTS (or other capacitance techniques) remains challenging [5]. In DLTS, activation energies correspond to carrier emission from a defect to the conduction band (electron traps) or to the valence band (hole traps), and are accompanied by measurements of electron or hole-capture coefficients (or capture cross-sections). This approach is conceptually similar to the extraction of EA and Cp from PL quenching (Section 2.2.2), with the difference that DLTS detects both radiative and nonradiative defects. As with PL quenching, the uncertainties in extracted EA and Cp may be significant. Moreover, both EA and Cp may be temperature-dependent, and the activation energies measured by DLTS may differ from actual ionization energies if a capture barrier exists [101]. Although numerous electron and hole traps in GaN have been reported in DLTS studies [2,5,313], and databases of defect levels have been compiled [314], the large scatter in the reported parameters often makes it difficult to reliably correlate DLTS data with PL results.

5.5.2. Identification from Radioactive Isotopes

One of the most reliable methods for revealing the chemical origin of luminescence centers in GaN involves implantation of radioactive isotopes, where the parent or daughter nucleus is directly responsible for a specific PL band. As discussed in Section 4.5 and Section 4.7, the BLCd and GLHg bands were conclusively attributed to Cd and Hg, respectively, through the decay of implanted 111Ag isotope into 111Cd, and 197Hg isotope into 197Au [267,268]. In the same experiments, PL bands near 1.5 eV with characteristic fine structures were assigned to Ag and Au impurities.
From decays of radioactive 72Se and 71As isotopes, undergoing chemical transmutation, the BLAs band, with the ZPL at 2.945 eV and characteristic phonon-related fine structure, was confirmed as originating from AsN. Additional PL bands at 1.49 eV and 3.398 eV were attributed to recombination centers involving Se and Ge, respectively [315]. From the decay of radioactive 191Pt isotopes, sharp lines at 1.461, 1.446, and 1.273 eV, followed by phonon replicas, were attributed to Pt [316].

5.5.3. Confidence Levels

The defect attributions summarized in Table 1 represent the current state of understanding and are subject to change as new experimental and theoretical evidence emerges. Nonetheless, the following confidence levels reflect the author’s assessment.
  • High Confidence (90–99%): YL1 and BLC (CN), UVL or UVLMg (MgGa), BL1 or BLZn (ZnGa), YLBe and UVLBe3 (BeGa), BL2 (CNHi), BLCa or AL (CaGa), BLCd (CdGa), GLHg (HgGa).
  • Moderate Confidence (50–80%): GL2 (+/2+ level of VN), RLMg (+/0 level of MgGaVN), RLCa (+/0 level of CaGaVN), RLBe (+/0 level of BeGaVN), BLMg (Deep DAP), BLAs (AsN), BLP (PN), UVLBe (BeGaONBeGa). The VGa, VGaON, VGaHi, BeGaON, CNON, and CNSiGa defects do not contribute to PL, at least at ħω > 1.5 eV.
  • Low Confidence (20–40%): YL2, OL3, and RL4 (VGaxONyH donors with x, y = 1,2), RLC (tri-carbon complex), BLBe (0/+ level of BeGa).
  • Speculative (<10%): RL3, YL3, and BL3 (FeGa or FeGa-containing complex), RL1 and GL1 (Cl), RL2 (AVN, with A being an acceptor other than Be, Mg, or Ca), GLBe (Be-containing complex), RL5 (unknown defect from implantation damage), OL1 (F or implantation damage-related defects).

5.6. Advances in First-Principles Calculations

Early first-principles calculations of defects in semiconductors relied on local or semi-local approximations within DFT, which significantly underestimated the calculated bandgap and required corrections that introduced large uncertainties in defect levels [17,21,22,317]. As a result, inaccurate predictions of defect transition levels, combined with the limited reliability of experimental identification methods, often led to incorrect assignments of PL bands.
In recent years, major progress has been made in improving the accuracy of defect calculations in GaN and other wide-bandgap semiconductors [318]. The adoption of hybrid functionals, particularly the widely used HSE functional [319], has provided a practical compromise between computational cost and accuracy. By incorporating a portion of Hartree–Fock exchange energy, these methods yield more reliable predictions of defect formation energies and transition levels. A common tuning of the HSE functional includes adjusting the fraction of Hartree-Fock exchange to 0.31, along with a range separation parameter of 0.2 Å−1, to reproduce the experimental GaN bandgap of 3.5 eV [24,182,234,320]. An alternative approach is to tune the HSE functional using the Koopmans’ theorem, which ensures that the self-interaction energy in the defect state orbitals is canceled by wavefunction relaxation [232,235,321]. While this improves defect transition energies referenced to the VBM, it also tends to underestimate the bandgap. Since different parametrizations can yield different outcomes, careful and consistent calibration is essential [104]. Most calculations employ periodic boundary conditions in supercells, which require a posteriori corrections to the total energy. The most common correction is the Freysoldt-Neugebauer-Van de Walle (FNV) [322,323] scheme.
Despite these improvements, theoretical predictions of PL band maxima and their ZPLs still exhibit typical uncertainties of 0.1–0.5 eV [235]. Overconfidence in theoretical predictions and the unreliability of some experimental data continue to hinder accurate defect identification. In practice, many reported assignments are based on a superficial agreement between calculated transition energies and experimental PL maxima or DLTS peaks [96,103,324]. Given the large number of unidentified PL bands and traps in GaN and the even greater number of theoretically predicted transitions via all possible defects, the likelihood of accidental matches is high. To improve reliability, PL band identification must go beyond a formal energy comparison. Detailed spectroscopic analysis (which includes revealing ZPL and fine structure), consideration of temperature dependence, recombination dynamics, isotope effects, and corroborating evidence from complementary methods (e.g., DLTS, Hall effect, ODMR, PAS) are essential.
A case study involving the BeGa acceptor highlights both the progress and pitfalls of theory-experiment comparison [45,46]. Although first-principles theory correctly predicted the dual nature of this acceptor [206], advanced HSE hybrid functional calculations suggested that its polaronic states should produce a PL band with a maximum at 1.67–1.80 eV [207,208,209,210]. The closest match for this prediction would be the RLBe band at 1.77 eV, observed in some Be-doped GaN samples (Section 4.2.4). However, comprehensive PL studies conclusively demonstrated that the polaronic states of BeGa are instead responsible for the YLBe band with a maximum at 2.15 eV [45].

6. Conclusions

Substantial progress has been made in recent years toward understanding PL from defects in GaN. Most notably, the origin of the long-debated yellow band (YL1) has now been definitively resolved. In the majority of undoped GaN samples, YL1 arises from unintentional carbon contamination and is associated with electron transitions from the CBM (or from shallow donors at T < 50 K) to the CN acceptor. The discovery of ZPLs for the YL1 and BLC bands at 2.59 eV and 3.15 eV, respectively, enabled precise determination of the CN defect’s −/0 and 0/+ charge transition levels: at 0.916 ± 0.003 and 0.33 ± 0.01 eV above the VBM in the low-temperature limit. Several other PL bands in undoped GaN have also been reliably identified, including the BL2 band at 3.0 eV (attributed to CNHi) and the GL2 band at 2.33 eV (associated with VN).
To facilitate consistent classification and discussion, a new nomenclature has been introduced, in which PL bands are designated and recognized according to their peak position (or color), shape, and other distinctive properties (Table 1, Table 2 and Table 3). The accurate identification of PL bands requires careful experimental characterization, since band positions and shapes may vary substantially with temperature and excitation intensity, particularly in semi-insulating samples.
The temperature dependence of PL has long been used to estimate defect ionization energies, in a manner analogous to the DLTS method. However, this approach is valid only when PL quenching follows the Schön–Klasens (multicenter) mechanism. To date, no clear cases of the Seitz–Mott (one-center) mechanism have been identified in GaN. Instead, a third mechanism—tunable and abrupt quenching—has been found for many defects in semi-insulating GaN. This abrupt quenching occurs at a critical temperature T0, which increases with excitation intensity. The phenomenon is reminiscent of a phase transition, in which population inversion and photo-induced n-type conductivity at T < T0 are replaced by near-equilibrium carrier population and p-type conductivity at T > T0.
Recent PL studies have also elucidated the electronic structures of several important defects in GaN. In particular, the theoretically predicted dual nature of the BeGa acceptor has been experimentally confirmed. Three distinct −/0 transition levels, corresponding to different hole localizations, have been identified for the BeGa acceptor. The growing body of high-quality experimental data from PL studies now provides a critical foundation for refining first-principles calculations, ultimately aiming at reliable predictions of defect properties in GaN and other wide-bandgap semiconductors.

Funding

The research of M.A.R. leading to these results was partly supported by the National Science Foundation under grant DMR-2423874.

Data Availability Statement

Not applicable.

Acknowledgments

The author is grateful to D. O. Demchenko (VCU) for fruitful discussions.

Conflicts of Interest

The author declares no conflicts of interest.

Abbreviations

The following abbreviations are used in this manuscript (in alphabetical order):
ALAquamarine luminescence
ATAmmonothermal
BLBlue luminescence
CLCathodoluminescence
DAPDonor-acceptor pair
DFTDensity functional theory
DLOSDeep level optical spectroscopy
DLTSDeep level transient spectroscopy
EQEExternal quantum efficiency
EPRElectron paramagnetic resonance
FTIRFourier transform infrared
FWHMFull width at half maximum
GLGreen luminescence
HSEHeyd-Scuseria-Ernzerhof
HNPSHigh nitrogen pressure solution
HVPEHydride vapor phase epitaxy
IQEInternal quantum efficiency
LEDLight-emitting diode
LEEBILow energy electron beam irradiation
LOLongitudinal optical
MBEMolecular beam epitaxy
MOCVDMetalorganic chemical vapor deposition
NBENear-band-edge
NDFNeutral density filter
ODMROptically detected magnetic resonance
OLOrange luminescence
PASPositron annihilation spectroscopy
PLPhotoluminescence
PLEPhotoluminescence excitation
PMTPhotomultiplier tube
RLRed luminescence
SD-SAShallow donor-shallow acceptor
SISemi-insulating
SIMSSecondary ion mass spectrometry
SSPLSteady-state photoluminescence
TAAMTrap-assisted Auger-Meitner
TAQTunable and abrupt quenching
TRPLTime-resolved photoluminescence
UVUltraviolet
UVLUltraviolet luminescence
VBMValence band maximum
YLYellow luminescence
ZPLZero-phonon line

References

  1. Nakamura, S.; Fosol, G. The Blue Laser Diode; Springer: Berlin/Heidelberg, Germany, 1998. [Google Scholar]
  2. Morkoç, H. Handbook of Nitride Semiconductors and Devices; Wiley: New York, NY, USA, 2008. [Google Scholar]
  3. Mishra, U.K.; Shen, L.; Kazior, T.E.; Wu, Y. GaN-Based RF Power Devices and Amplifiers. Proc. IEEE 2008, 96, 287–305. [Google Scholar] [CrossRef]
  4. Nakamura, S.; Krames, M.R. History of Gallium–Nitride-Based Light-Emitting Diodes for Illumination. Proc. IEEE 2013, 101, 2211–2220. [Google Scholar] [CrossRef]
  5. Reshchikov, M.A. Point defects in GaN. In Semiconductors and Semimetals: Defects in Semiconductors; Jagadish, C., Privitera, V., Romano, L., Eds.; Academic Press: Burlington, UK, 2015; Volume 91, pp. 315–367. [Google Scholar]
  6. Monemar, B.; Paskov, P.P.; Bergman, J.P.; Toropov, A.A.; Shubina, T.V. Recent developments in the III-nitride materials. Phys. Status Sol. B 2007, 244, 1759–1768. [Google Scholar] [CrossRef]
  7. Kornitzer, K.; Ebner, T.; Thonke, K.; Sauer, R.; Kirchner, C.; Schwegler, V.; Kamp, M.; Leszczynski, M.; Grzegory, I.; Porowski, S. Photoluminescence and reflectance spectroscopy of excitonic transitions in high-quality homoepitaxial GaN films. Phys. Rev. B 1999, 60, 1471–1473. [Google Scholar] [CrossRef]
  8. Monemar, B.; Paskov, P.P.; Bergman, J.P.; Toropov, A.A.; Shubina, T.V.; Malinauskas, T.; Usui, A. Recombination of free and bound excitons in GaN. Phys. Stat. Sol. B 2008, 245, 1723–1740. [Google Scholar] [CrossRef]
  9. Freitas, J.A., Jr.; Culbertson, J.C.; Glaser, E.R. Characterization of Defects in GaN: Optical and Magnetic Resonance Techniques. Crystals 2022, 12, 1294. [Google Scholar] [CrossRef]
  10. Callsen, G.; Kure, T.; Wagner, M.R.; Butte, R.; Grandjean, N. Excited states of neutral donor bound excitons in GaN. J. Appl. Phys. 2018, 123, 215702. [Google Scholar] [CrossRef]
  11. Freitas, J.A., Jr.; Moore, W.J.; Shanabrook, B.V.; Braga, G.C.B.; Koleske, D.D.; Lee, S.K.; Park, S.S.; Han, J.Y. Shallow donors in GaN. Phys. Stat. Sol. B 2003, 240, 330–336. [Google Scholar] [CrossRef]
  12. Wysmolek, A.; Stepniewski, R.; Potemski, M. Magneto-spectroscopy of donor-bound excitons in GaN. Phys. B 2007, 401–402, 441–446. [Google Scholar] [CrossRef]
  13. Ishitani, Y.; Takeuchi, K.; Oizumi, N.; Sakamoto, H.; Ma, B.; Morita, K.; Miyake, H.; Hiramatsu, K. Excitation and deexcitation dynamics of excitons in a GaN film based on the analysis of radiation from high-order states. J. Phys. D Appl. Phys. 2016, 49, 245102. [Google Scholar] [CrossRef]
  14. Chichibu, S.F.; Uedono, A.; Kojima, K.; Ikeda, H.; Fujito, K.; Takashima, S.; Edo, M.; Ueno, K.; Ishibashi, S. The origins and properties of intrinsic nonradiative recombination centers in wide bandgap GaN and AlGaN. J. Appl. Phys. 2018, 123, 161413. [Google Scholar] [CrossRef]
  15. Rodina, A.V.; Dietrich, M.; Göldner, A.; Eckey, L.; Hoffmann, A.; Efros, A.L.; Rosen, M.; Meyer, B.K. Free excitons in wurtzite GaN. Phys. Rev. B 2001, 64, 115204. [Google Scholar] [CrossRef]
  16. Reshchikov, M.A.; Morkoç, H. Luminescence properties of defects in GaN. J. Appl. Phys. 2005, 97, 061301. [Google Scholar] [CrossRef]
  17. Van de Walle, C.G.; Neugebauer, J. First-principles calculations for defects and impurities: Applications to III-nitrides. J. Appl. Phys. 2004, 95, 3851–3879. [Google Scholar] [CrossRef]
  18. Boguslawski, P.; Bernholc, J. Doping properties of C, Si, and Ge impurities in GaN and AlN. Phys. Rev. B 1997, 56, 9496–9505. [Google Scholar] [CrossRef]
  19. Ramos, L.E.; Furthmüller, J.; Leite, J.R.; Scolfaro, L.M.; Bechstedt, F. Carbon-Based Defects in GaN: Doping Behavior. Phys. Stat. Sol. B 2002, 234, 864–867. [Google Scholar] [CrossRef]
  20. Eberlein, T.A.G.; Jones, R.; Öberg, S.; Briddon, P.R. Shallow acceptors in GaN. Appl. Phys. Lett. 2007, 91, 132105. [Google Scholar] [CrossRef]
  21. Wright, A.F. Substitutional and interstitial carbon in wurtzite GaN. J. Appl. Phys. 2002, 92, 2575–2585. [Google Scholar] [CrossRef]
  22. Neugebauer, J.; Van de Walle, C.G. Gallium vacancies and the yellow luminescence in GaN. Appl. Phys. Lett. 1996, 69, 503–505. [Google Scholar] [CrossRef]
  23. Fischer, S.; Wetzel, C.; Haller, E.E.; Meyer, B.K. On p-type doping in GaN-acceptor binding energies. Appl. Phys. Lett. 1995, 67, 1298–1300. [Google Scholar] [CrossRef]
  24. Lyons, J.L.; Janotti, A.; Van de Walle, C.G. Carbon impurities and the yellow luminescence in GaN. Appl. Phys. Lett. 2010, 97, 152108. [Google Scholar] [CrossRef]
  25. Reshchikov, M.A.; Vorobiov, M.; Demchenko, D.O.; Özgür, Ü.; Morkoç, H.; Lesnik, A.; Hoffmann, M.P.; Hörich, F.; Dadgar, A.; Strittmatter, A. Two charge states of the CN acceptor in GaN: Evidence from photoluminescence. Phys. Rev. B 2018, 98, 125207. [Google Scholar] [CrossRef]
  26. Narita, T.; Tomita, K.; Tokuda, Y.; Kogiso, T.; Horita, M.; Kachi, T. The origin of carbon-related carrier compensation in p-type GaN layers grown by MOVPE. J. Appl. Phys. 2018, 124, 215701. [Google Scholar] [CrossRef]
  27. Zimmermann, F.; Beyer, J.; Röder, C.; Beyer, F.C.; Richter, E.; Irmscher, K.; Heitmann, J. Current Status of Carbon-Related Luminescence in GaN. Phys. Stat. Sol. A 2021, 218, 2100235. [Google Scholar] [CrossRef]
  28. Saarinen, K.; Laine, T.; Kuisma, S.; Nissilä, J.; Hautojärvi, P.; Dobrzynski, L.; Baranowski, J.M.; Pakula, K.; Stepniewski, R.; Wojdak, M.; et al. Observation of Native Ga Vacancies in GaN by Positron Annihilation. Phys. Rev. Lett. 1997, 79, 3030–3033. [Google Scholar] [CrossRef]
  29. Lyons, J.L.; Alkauskas, A.; Janotti, A.; Van de Walle, C.G. First-principles theory of acceptors in nitride semiconductors. Phys. Stat. Sol. B 2015, 252, 900–908. [Google Scholar] [CrossRef]
  30. Diallo, I.C.; Demchenko, D.O. Native Point Defects in GaN: A Hybrid-Functional Study. Phys. Rev. Appl. 2016, 6, 064002. [Google Scholar] [CrossRef]
  31. Edwards, A.H.; Schultz, P.A.; Dobzynski, R.M. Electronic structure of intrinsic defects in c-gallium nitride: Density functional theory study without the jellium approximation. Phys. Rev. B 2022, 105, 235110. [Google Scholar] [CrossRef]
  32. Miceli, G.; Pasquerello, A. Energetics of native point defects in GaN: A density-functional study. Microelectron. Eng. 2015, 147, 51–54. [Google Scholar] [CrossRef]
  33. Zimmermann, F.; Beyer, J.; Beyer, F.C.; Gärtner, G.; Gamov, I.; Irmscher, K.; Richter, E.; Weyers, M.; Heitmann, J. A carbon-doping related luminescence band in GaN revealed by below bandgap excitation. J. Appl. Phys. 2021, 130, 055703. [Google Scholar] [CrossRef]
  34. Reshchikov, M.A. Photoluminescence from defects in GaN. In Gallium Nitride Materials and Devices XVIII; Fujioka, H., Morkoç, H., Schwarz, U., Eds.; Proceedings SPIE: San Francisco, CA, USA, 2023; Volume 12421, p. 1242109. [Google Scholar]
  35. Reshchikov, M.A. Photoluminescence from Vacancy-Containing Defects in GaN. Phys. Stat. Sol. A 2023, 220, 2200402. [Google Scholar] [CrossRef]
  36. Vorobiov, M.; Andrieiev, O.; Demchenko, D.O.; Reshchikov, M.A. Nitrogen vacancy-acceptor complexes in GaN. J. Appl. Phys. 2024, 135, 155701. [Google Scholar] [CrossRef]
  37. Reshchikov, M.A. Red luminescence band in undoped GaN. J. Lumin. 2025, 286, 121370. [Google Scholar] [CrossRef]
  38. Reshchikov, M.A.; Sayeed, R.M.; Özgür, Ü.; Demchenko, D.O.; McNamara, J.D.; Prozheeva, V.; Tuomisto, F.; Helava, H.; Usikov, A.; Makarov, Y. Unusual properties of the RY3 center in GaN. Phys. Rev. B 2019, 100, 045204. [Google Scholar] [CrossRef]
  39. Reshchikov, M.A.; Demchenko, D.O.; Ye, D.; Andrieiev, O.; Vorobiov, M.; Grabianska, K.; Zajac, M.; Nita, P.; Iwinska, M.; Bockowski, M.; et al. The effect of annealing on photoluminescence from defects in ammonothermal GaN. J. Appl. Phys. 2022, 131, 035704. [Google Scholar] [CrossRef]
  40. Reshchikov, M.A.; McNamara, J.D.; Zhang, F.; Monavarian, M.; Usikov, A.; Helava, H.; Makarov, Y.; Morkoç, H. Zero-phonon line and fine structure of the yellow luminescence band in GaN. Phys. Rev. B 2016, 94, 035201. [Google Scholar] [CrossRef]
  41. Reshchikov, M.A. On the Origin of the Yellow Luminescence Band in GaN. Phys. Stat. Sol. B 2023, 260, 2200488. [Google Scholar] [CrossRef]
  42. Reshchikov, M.A.; Vorobiov, M.; Grabianska, K.; Zajac, M.; Iwinska, M.; Bockowski, M. Defect-related photoluminescence from ammono GaN. J. Appl. Phys. 2021, 129, 095703. [Google Scholar] [CrossRef]
  43. Reshchikov, M.A.; Usikov, A.; Helava, H.; Makarov, Y. Fine structure of the red luminescence band in GaN. Appl. Phys. Lett. 2014, 104, 032103. [Google Scholar] [CrossRef]
  44. Reshchikov, M.A.; McNamara, J.D.; Helava, H.; Usikov, A.; Makarov, Y. Two yellow luminescence bands in GaN. Sci. Rep. 2018, 8, 8091. [Google Scholar] [CrossRef]
  45. Reshchikov, M.A.; Vorobiov, M.; Andrieiev, O.; Demchenko, D.O.; McEwen, B.; Shahedipour-Sandvik, F. Dual Nature of the BeGa Acceptor in GaN: Evidence from Photoluminescence. Phys. Rev. B 2023, 108, 075202. [Google Scholar] [CrossRef]
  46. Reshchikov, M.A.; Bockowski, M. The Origin of the Yellow Luminescence Band in Bulk Be-doped GaN. Solids 2024, 5, 29–44. [Google Scholar] [CrossRef]
  47. Reshchikov, M.A.; Demchenko, D.O.; McNamara, J.D.; Fernández-Garrido, S.; Calarco, R. Green luminescence in Mg-doped GaN. Phys. Rev. B 2014, 90, 035207. [Google Scholar] [CrossRef]
  48. Reshchikov, M.A.; Andrieiev, O.; Vorobiov, M.; Demchenko, D.O.; McEwen, B.; Shahedipour-Sandvik, F. Photoluminescence from CdGa and HgGa acceptors in GaN. J. Appl. Phys. 2024, 135, 155706. [Google Scholar] [CrossRef]
  49. Reshchikov, M.A.; Demchenko, D.O.; Vorobiov, M.; Andrieiev, O.; McEwen, B.; Shahedipour-Sandvik, F.; Sierakowski, K.; Jaroszynski, P.; Bockowski, M. Photoluminescence related to Ca in GaN. Phys. Rev. B 2022, 106, 035206. [Google Scholar] [CrossRef]
  50. Reshchikov, M.A.; Shahedipour, F.; Korotkov, R.Y.; Ulmer, M.P.; Wessels, B.W. Photoluminescence band near 2.9 eV in undoped GaN epitaxial layers. J. Appl. Phys. 2000, 87, 3351–3354. [Google Scholar] [CrossRef]
  51. Demchenko, D.O.; Reshchikov, M.A. Blue luminescence and Zn acceptor in GaN. Phys. Rev. B 2013, 88, 115204. [Google Scholar] [CrossRef]
  52. Reshchikov, M.A.; Kvasov, A.A.; Bishop, M.F.; McMullen, T.; Usikov, A.; Soukhoveev, V.; Dmitriev, V.A. Tunable and abrupt thermal quenching of photoluminescence in high-resistivity Zn-doped GaN. Phys. Rev. B 2011, 84, 075212. [Google Scholar] [CrossRef]
  53. Reshchikov, M.A.; Foussekis, M.A.; McNamara, J.D.; Behrends, A.; Bakin, A.; Waag, A. Determination of the absolute internal quantum efficiency of photoluminescence in GaN co-doped with Zn and Si. J. Appl. Phys. 2012, 111, 073106. [Google Scholar] [CrossRef]
  54. Reshchikov, M.A. Giant shifts of photoluminescence bands in GaN. J. Appl. Phys. 2020, 127, 055701. [Google Scholar] [CrossRef]
  55. Reshchikov, M.A.; Andrieiev, O.; Vorobiov, M.; McEwen, B.; Shahedipour-Sandvik, F.; Ye, D.; Demchenko, D.O. Stability of the CNHi complex and the blue luminescence band in GaN. Phys. Stat. Sol. B 2021, 258, 2100392. [Google Scholar] [CrossRef]
  56. Reshchikov, M.A. Fine structure of another blue luminescence band in undoped GaN. Appl. Phys. Lett. 2019, 115, 262102. [Google Scholar] [CrossRef]
  57. Chen, L.; Skromme, B.J. Spectroscopic Characterization of Ion Implanted GaN. MRS Online Proc. Libr. (OPL) 2003, 743, L11.35. [Google Scholar] [CrossRef]
  58. Ogino, T.; Aoki, M. Photoluminescence in P-doped GaN. Jpn. J. Appl. Phys. 1979, 18, 1049–1052. [Google Scholar] [CrossRef]
  59. Lagerstedt, O.; Monemar, B. Luminescence in epitaxial GaN:Cd. J. Appl. Phys. 1974, 45, 2266–2271. [Google Scholar] [CrossRef]
  60. Reshchikov, M.A. Fine Structure of the Carbon-Related Blue Luminescence Band in GaN. Solids 2022, 3, 231–236. [Google Scholar] [CrossRef]
  61. Reshchikov, M.A.; McEwen, B.; Shahedipour-Sandvik, F. Photoluminescence from Defects in Be-Doped GaN. Phys. Stat. Sol. B 2025, 202400656, Early View. [Google Scholar] [CrossRef]
  62. Reshchikov, M.A.; Ghimire, P.; Demchenko, D.O. Magnesium acceptor in gallium nitride: I. Photoluminescence from Mg-doped GaN. Phys. Rev. B 2018, 97, 20520. [Google Scholar] [CrossRef]
  63. Reshchikov, M.A.; Yi, G.-C.; Wessels, B.W. Behavior of 2.8-and 3.2-eV photoluminescence bands in Mg-doped GaN at different temperatures and excitation densities. Phys. Rev. B 1999, 59, 13176–13183. [Google Scholar] [CrossRef]
  64. Reshchikov, M.A.; Demchenko, D.O.; McEwen, B.; Shahedipour-Sandvik, F. Identity of the shallowest acceptor in GaN. Phys. Rev. B 2025, 111, 045202. [Google Scholar] [CrossRef]
  65. Reshchikov, M.A.; McNamara, J.D.; Toporkov, M.; Avrutin, V.; Morkoç, H.; Usikov, A.; Helava, H.; Makarov, Y. Determination of the electron-capture coefficients and the concentration of free electrons in GaN from photoluminescence. Sci. Rep. 2016, 6, 37511. [Google Scholar] [CrossRef] [PubMed]
  66. Reshchikov, M.A. Measurement and analysis of photoluminescence in GaN. J. Appl. Phys. 2021, 129, 121101. [Google Scholar] [CrossRef]
  67. Kojima, K.; Ohtomo, T.; Ikemura, K.-I.; Yamazaki, Y.; Saito, M.; Ikeda, H.; Fujito, K.; Chichibu, S.F. Determination of absolute value of quantum efficiency of radiation in high quality GaN single crystals using an integrating sphere. J. Appl. Phys. 2016, 120, 015704. [Google Scholar] [CrossRef]
  68. Kojima, K.; Ikeda, H.; Fujito, K.; Chichibu, S.F. Demonstration of omnidirectional photoluminescence (ODPL) spectroscopy for precise determination of internal quantum efficiency of radiation in GaN single crystals. Appl. Phys. Lett. 2017, 111, 032111. [Google Scholar] [CrossRef]
  69. Kojima, K.; Ikemura, K.; Chichibu, S.F. Quantification of the quantum efficiency of radiation of a freestanding GaN crystal placed outside an integrating sphere. Appl. Phys. Express 2019, 12, 062010. [Google Scholar] [CrossRef]
  70. Kojima, K.; Ikemura, K.; Chichibu, S.F. Temperature dependence of quantum efficiency of radiation for the near-band-edge emission of GaN crystals quantified by omnidirectional photoluminescence spectroscopy. Appl. Phys. Express 2020, 13, 105504. [Google Scholar] [CrossRef]
  71. Kojima, K.; Chichibu, S.F. Correlation between the internal quantum efficiency and photoluminescence lifetime of the near-band-edge emission in a ZnO single crystal grown by the hydrothermal method. Appl. Phys. Express 2020, 13, 121005. [Google Scholar] [CrossRef]
  72. Shockley, W.; Read, J.W.T. Statistics of the recombinations of holes and electrons. Phys. Rev. 1952, 87, 835–842. [Google Scholar] [CrossRef]
  73. Hall, R.N. Germanium rectifier characteristics. Phys. Rev. 1951, 83, 228. [Google Scholar]
  74. Reshchikov, M.A. Temperature dependence of defect-related photoluminescence in III-V and II-VI semiconductors. J. Appl. Phys. 2014, 115, 012010. [Google Scholar] [CrossRef]
  75. Reshchikov, M.A. Mechanisms of Thermal Quenching of Defect-Related Luminescence in Semiconductors. Phys. Stat. Sol. A 2020, 218, 2000101. [Google Scholar] [CrossRef]
  76. Reshchikov, M.A.; Korotkov, R.Y. Analysis of the temperature and excitation intensity dependencies of photoluminescence in undoped GaN films. Phys. Rev. B 2001, 64, 115205. [Google Scholar] [CrossRef]
  77. Reshchikov, M.A. Time-resolved photoluminescence from defects in GaN. J. Appl. Phys. 2014, 115, 103503. [Google Scholar] [CrossRef]
  78. Korotkov, R.Y.; Reshchikov, M.A.; Wessels, B.W. Acceptors in undoped GaN studied by transient photoluminescence. Phys. B 2003, 325, 1–7. [Google Scholar] [CrossRef]
  79. Klasens, H.A. The temperature-dependence of the fluorescence of photoconductors. J. Phys. Chem. Solids 1959, 9, 185–197. [Google Scholar] [CrossRef]
  80. Reshchikov, M.A. Determination of acceptor concentration in GaN from photoluminescence. Appl. Phys. Lett. 2006, 88, 202104. [Google Scholar]
  81. Reshchikov, M.A. Internal Quantum Efficiency of Photoluminescence in Wide-Bandgap Semiconductors. In Photoluminescence: Applications, Types and Efficacy; Case, M.A., Stout, B.C., Eds.; Nova Science Publishers Inc.: Hauppauge, NY, USA, 2012; pp. 53–120. ISBN 978-1-61942-426-5. [Google Scholar]
  82. Muth, J.F.; Lee, J.H.; Shmagin, I.K.; Kolbas, R.M.; Casey, H.C., Jr.; Keller, B.P.; Mishra, U.K.; DenBaars, S.P. Absorption coefficient, energy gap, exciton binding energy, and recombination lifetime of GaN obtained from transmission measurement. Appl. Phys. Lett. 1997, 71, 2572–2574. [Google Scholar] [CrossRef]
  83. Reshchikov, M.A.; Usikov, A.; Helava, H.; Makarov, Y.; Prozheeva, V.; Makkonen, I.; Tuomisto, F.; Leach, J.H.; Udwary, K. Evaluation of the concentration of point defects in GaN. Sci. Rep. 2017, 7, 9297. [Google Scholar] [CrossRef] [PubMed]
  84. Williams, F. Donor-acceptor pairs in semiconductors. Phys. Stat. Sol. 1968, 25, 493–512. [Google Scholar] [CrossRef]
  85. Thomas, D.G.; Hopfield, J.J.; Augustyniak, W.M. Kinetics of radiative recombination at randomly distributed donors and acceptors. Phys. Rev. 1965, 140, A202–A220. [Google Scholar] [CrossRef]
  86. Ogino, T.; Aoki, M. Mechanism of Yellow Luminescence in GaN. Jpn. J. Appl. Phys. 1980, 19, 2395–2405. [Google Scholar] [CrossRef]
  87. Pankove, J.I.; Hutchby, J.A. Photoluminescence of ion-implanted GaN. J. Appl. Phys. 1976, 47, 5387–5390. [Google Scholar] [CrossRef]
  88. Kucheyev, S.O.; Toth, M.; Phillips, M.R.; Williams, J.S.; Jagadish, C.; Li, G. Chemical origin of the yellow luminescence in GaN. J. Appl. Phys. 2002, 91, 5867–5874. [Google Scholar] [CrossRef]
  89. Armitage, R.; Hong, W.; Yang, Q.; Feick, H.; Gebauer, J.; Weber, E.R.; Hautakangas, S.; Saarinen, K. Contributions from gallium vacancies and carbon-related defects to the “yellow luminescence” in GaN. Appl. Phys. Lett. 2003, 82, 3457–3459. [Google Scholar] [CrossRef]
  90. You, W.; Zhang, X.D.; Zhang, L.M.; Yang, Z.; Bian, H.; Ge, Q.; Guo, W.X.; Wang, W.X.; Liu, Z.M. Effects of different ions implantation on yellow luminescence from GaN. Phys. B 2008, 403, 2666–2670. [Google Scholar] [CrossRef]
  91. Xu, F.J.; Shen, B.; Lu, L.; Miao, Z.L.; Song, J.; Yang, Z.J.; Zhang, G.Y.; Hao, X.P.; Wang, B.Y.; Shen, X.Q.; et al. Different origins of the yellow luminescence in as-grown high-resistance GaN and unintentional-doped GaN films. J. Appl. Phys. 2010, 107, 023528. [Google Scholar] [CrossRef]
  92. Reurings, F.; Tuomisto, F. Interplay of Ga vacancies, C Impurities and Yellow Luminescence in GaN. In Gallium Nitride Materials and Devices II; Morkoç, H., Litton, C.W., Eds.; Proceedings SPIE: San Francisco, CA, USA, 2007; Volume 6473, p. 64730M. [Google Scholar]
  93. Reshchikov, M.A.; Morkoç, H.; Park, S.S.; Lee, K.Y. Photoluminescence study of deep-level defects in undoped GaN. Mat. Res. Soc. Symp. Proc. 2002, 693, 596–601. [Google Scholar] [CrossRef]
  94. Alkauskas, A.; McCluskey, M.; Van de Walle, C.G. Tutorial: Defects in semiconductors–Combining experiment and theory. J. Appl. Phys. 2016, 119, 181101. [Google Scholar] [CrossRef]
  95. Reshchikov, M.A.; Albarakati, N.M.; Monavarian, M.; Avrutin, V.; Morkoç, H. Thermal quenching of the yellow luminescence in GaN. J. Appl. Phys. 2018, 123, 161520. [Google Scholar] [CrossRef]
  96. Matsubara, M.; Bellotti, E. A first-principles study of carbon-related energy levels in GaN. I. Complexes formed by substitutional/imterstitial carbons and gallium/nitrogen vacancies. J. Appl. Phys. 2017, 121, 195701. [Google Scholar] [CrossRef]
  97. Deak, P.; Lorke, M.; Aradi, B.; Frauenheim, T. Carbon in GaN: Calculations with an optimized hybrid functional. Phys. Rev. B 2019, 99, 085206. [Google Scholar] [CrossRef]
  98. Christenson, S.G.; Xie, W.; Sun, Y.Y.; Zhang, S.B. Carbon as a source for yellow luminescence in GaN: Isolated CN defect or its complexes. J. Appl. Phys. 2015, 118, 135708. [Google Scholar] [CrossRef]
  99. Dreyer, C.E.; Alkauskas, A.; Lyons, J.L.; Van de Walle, C.G. Radiative capture rates at deep defects from electronic structure calculations. Phys. Rev. B 2020, 102, 085305. [Google Scholar] [CrossRef]
  100. Alkauskas, A.; Yan, Q.; Van de Walle, C.G. First-principles theory of nonradiative carrier capture via multiphonon emission. Phys. Rev. B 2014, 90, 075202. [Google Scholar] [CrossRef]
  101. Wickramaratne, D.; Dreyer, C.E.; Monserrat, B.; Shen, J.-X.; Lyons, J.L.; Alkauskas, A.; Van de Walle, C.G. Defect identification based on first-principles calculations for deep level transient spectroscopy. Appl. Phys. Lett. 2018, 113, 192106. [Google Scholar] [CrossRef]
  102. Alkauskas, A.; Lyons, J.L.; Steiauf, D.; Van de Walle, C.G. First-Principles Calculations of Luminescence Spectrum Line Shapes for Defects in Semiconductors: The Example of GaN and ZnO. Phys. Rev. Lett. 2012, 109, 267401. [Google Scholar] [CrossRef]
  103. Matsubara, M.; Bellotti, E. A first-principles study of carbon-related energy levels in GaN. II. Complexes formed by carbon and hydrogen, silicon or oxygen. J. Appl. Phys. 2017, 121, 195702. [Google Scholar] [CrossRef]
  104. Reshchikov, M.A.; Demchenko, D.O. Roadmap for Point Defects in GaN. In Semiconductors and Semimetals; Mi, Z., Tan, H.H., Eds.; Elsevier: Amsterdam, The Netherlands, 2022; Volume 111, pp. 133–152. [Google Scholar]
  105. Demchenko, D.O.; Diallo, I.C.; Reshchikov, M.A. Yellow luminescence of gallium nitride generated by carbon defect complexes. Phys. Rev. Lett. 2013, 110, 087404. [Google Scholar] [CrossRef]
  106. Zhang, H.-S.; Shi, L.; Yang, X.-B.; Zhao, Y.-J.; Xu, K.; Wang, L.-W. First-Principles Calculations of Quantum Efficiency for Point Defects in Semiconductors: The Example of Yellow Luminance by GaN: CN+ ON and GaN: CN. Adv. Opt. Mater. 2017, 5, 1700404. [Google Scholar] [CrossRef]
  107. Lyons, J.L.; Janotti, A.; Van de Walle, C.G. Effects of carbon on the electrical and optical properties of InN, GaN, and AlN. Phys. Rev. B 2014, 89, 035204. [Google Scholar] [CrossRef]
  108. Tuomisto, F.; Mäki, J.-M.; Zając, M. Vacancy defects in bulk ammonothermal GaN crystals. J. Cryst. Growth 2010, 312, 2620–2623. [Google Scholar] [CrossRef]
  109. Uedono, A.; Tsukada, Y.; Mikawa, Y.; Mochizuki, T.; Fujisawa, H.; Ikeda, H.; Kurihara, K.; Fujito, K.; Terada, S.; Ishibashi, S.; et al. Vacancies and electron trapping centers in acidic ammonothermal GaN probed by a monoenergetic positron beam. J. Cryst. Growth 2016, 448, 117–121. [Google Scholar] [CrossRef]
  110. Suihkonen, S.; Pimputkar, S.; Speck, J.S.; Nakamura, S. Infrared absorption of hydrogen-related defects in ammonothermal GaN. Appl. Phys. Lett. 2016, 108, 202105. [Google Scholar] [CrossRef]
  111. Zajac, M.; Kucharski, R.; Grabianska, K.; Gwardys-Bak, A.; Puchalski, A.; Wasik, D.; Litwin-Staszewska, E.; Piotrzkowski, R.; Domagala, J.Z.; Bockowski, M. Basic ammonothermal growth of Gallium Nitride—State of the art, challenges, perspectives. Prog. Cryst. Growth Charact. Mater. 2018, 64, 63–74. [Google Scholar] [CrossRef]
  112. Malguth, E.; Hoffmann, A.; Gehloff, W.; Gelhausen, O.; Phillips, M.R.; Xu, X. Structural and electronic properties of Fe3+ and Fe2+ centers in GaN from optical and EPR experiments. Phys. Rev. B 2006, 74, 165202. [Google Scholar] [CrossRef]
  113. Tanaka, D.; Iso, K.; Suda, J. Comparative study of electrical properties of semi-insulating GaN substrates grown by hydride vapor phase epitaxy and doped with Fe, C, or Mn. J. Appl. Phys. 2023, 133, 055701. [Google Scholar] [CrossRef]
  114. Richter, E.; Gridneva, E.; Weyers, M.; Tränkle, G. Fe-doping in hydride vapor-phase epitaxy for semi-insulating gallium nitride. J. Cryst. Growth 2016, 456, 97–100. [Google Scholar] [CrossRef]
  115. Laaksonen, K.; Ganchenkova, M.G.; Nieminen, R.M. Vacancies in wurtzite GaN and AlN. J. Phys. Condens. Matter 2009, 21, 015803. [Google Scholar] [CrossRef]
  116. Gao, Y.; Sun, D.; Jiang, X.; Zhao, J. Point defects in group III nitrides: A comparative first-principles study. J. Appl. Phys. 2019, 125, 215705. [Google Scholar] [CrossRef]
  117. Wang, Q.-J.; Zhang, H.-S.; Shi, L.; Gong, J. Origin of Ga vacancy-related YL center in n-type GaN: A first-principles study. J. Lumin. 2023, 255, 119561. [Google Scholar] [CrossRef]
  118. Alkauskas, A.; Dreyer, C.E.; Lyons, J.L.; Van de Walle, C.G. Role of excited states in Schockley-Read-Hall recombination in wide-band-gap semiconductors. Phys. Rev. B 2016, 93, 201304. [Google Scholar] [CrossRef]
  119. Dreyer, C.E.; Alkauskas, A.; Lyons, J.L.; Speck, J.S.; Van de Walle, C.G. Gallium vacancy complexes as a cause of Schockley-Read-Hall recombination in III-nitride light emitters. Appl. Phys. Lett. 2016, 108, 141101. [Google Scholar] [CrossRef]
  120. Suihkonen, S.; Nykänen, H.; Tanikawa, T.; Yamaguchi, M.; Honda, Y.; Amano, H. Effects of low energy e-beam irradiation on cathodoluminescence from GaN. Phys. Stat. Sol. A 2013, 210, 383–385. [Google Scholar] [CrossRef]
  121. Huber, M.; Silvestri, M.; Knuuttila, L.; Pozzovivo, G.; Andreev, A.; Kadashchuk, A.; Bonanni, A.; Lundskog, A. Impact of residual carbon impurities and gallium vacancies on trapping effects in AlGaN/GaN metal insulator semiconductor high electron mobility transistors. Appl. Phys. Lett. 2015, 107, 032106. [Google Scholar] [CrossRef]
  122. Glaser, E.R.; Freitas, J.A., Jr.; Braga, G.C.; Carlos, W.E.; Twigg, M.E.; Wickenden, A.E.; Koleske, D.D.; Henry, R.L.; Leszczynski, M.; Grzegory, I.; et al. Magnetic resonance studies of defects in GaN with reduced dislocation densities. Phys. B 2001, 310, 51–57. [Google Scholar] [CrossRef]
  123. McNamara, J.D.; Foussekis, M.A.; Baski, A.A.; Li, X.; Avrutin, V.; Morkoç, H.; Leach, J.H.; Paskova, T.; Udwary, K.; Preble, E.; et al. Electrical and optical properties of bulk GaN substrates studied by Kelvin probe and photoluminescence. Phys. Stat. Sol. C 2013, 10, 536–539. [Google Scholar]
  124. Reshchikov, M.A.; Zhang, M.H.; Cui, J.; Visconti, P.; Yun, F.; Morkoç, H. Photoluminescence study of defects in GaN grown by molecular beam epitaxy. Mat. Res. Soc. Symp. Proc. 2001, 639, 67. [Google Scholar] [CrossRef]
  125. Reshchikov, M.A.; Molnar, R.; Morkoç, H. Photoluminescence and excitation spectra of deep defects in GaN. Mat. Res. Soc. Symp. Proc. 2001, 680, E5.6. [Google Scholar] [CrossRef]
  126. Goldys, E.M.; Godlewski, M.; Paskova, T.; Pozina, G.; Monemar, B. Characterization of Red Emission in Nominally Undoped Hydride Vapor Phase Epitaxy. MRS Internet J. Nitride Semicond. Res. 2001, 6, 1. [Google Scholar] [CrossRef]
  127. Uehara, D.; Kikuchi, M.; Ma, B.; Miyake, H.; Ishitani, Y. Charge transfer processes related to deep levels in free standing n-GaN layer analyzed by above and sub-bandgap energy excitation. Appl. Phys. Express 2020, 13, 061003. [Google Scholar] [CrossRef]
  128. Wang, L.; Zeimer, U.; Richter, E.; Herms, M.; Weyers, M. Characterisation of free standing GaN grown by HVPE on a LiAlO2 substrate. Phys. Stat. Sol. A 2006, 203, 1663–1666. [Google Scholar]
  129. Wang, L.; Richter, E.; Weyers, M. Red luminescence from freestanding GaN grown on LiAlO2 substrate by hydride vapor phase epitaxy. Phys. Stat. Sol. A 2007, 204, 846–849. [Google Scholar] [CrossRef]
  130. Dingle, R. Luminescent transitions associated with divalent copper impurities and the green emission from semiconducting zinc oxide. Phys. Rev. Lett. 1969, 23, 579–581. [Google Scholar] [CrossRef]
  131. Dahan, P.; Fleurov, V.; Thurian, P.; Heitz, R.; Hoffmann, A.; Broser, I. Properties of the intermediately bound α-, β-, and γ-excitons in ZnO:Cu. J. Phys. Condens. Matter. 1998, 10, 2007–2019. [Google Scholar] [CrossRef]
  132. Garces, N.Y.; Wang, L.; Bai, L.; Giles, N.C.; Halliburton, L.E. Role of copper in the green luminescence from ZnO crystals. Appl. Phys. Lett. 2002, 81, 622–624. [Google Scholar] [CrossRef]
  133. Reshchikov, M.A.; Avrutin, V.; Izyumskaya, N.; Shimada, R.; Morkoç, H.; Novak, S.W. About the Cu-related green luminescence band in ZnO. J. Vac. Sci. Tech. B 2009, 27, 1749–1754. [Google Scholar] [CrossRef]
  134. Kuhnert, R.; Helbig, R. Vibronic structure of the green photoluminescence due to copper impurities in ZnO. J. Lumin. 1981, 26, 203–206. [Google Scholar] [CrossRef]
  135. Malguth, E.; Hoffmann, A.; Phillips, M.R. Fe in III-V and II-VI semiconductors. Phys. Stat. Sol. B 2008, 245, 455–480. [Google Scholar] [CrossRef]
  136. Wegscheider, M.; Simbrunner, C.; Przybylinska, H.; Kiecana, M.; Sawicki, M.; Navarro-Quezada, A.; Sitter, H.; Jantsch, W.; Dietl, T.; Bonanni, A. Photoluminescence and Hall studies of GaN:Fe and (Ga,Fe)N:Mg layers. Phys. Stat. Sol. A 2007, 204, 86–91. [Google Scholar] [CrossRef]
  137. Freitas, J.A., Jr.; Culbertson, J.C.; Glaser, E.R.; Richter, E.; Weyers, M.; Oliveira, A.C.; Garg, V.K. Efficient iron doping of HVPE GaN. J. Cryst. Growth 2018, 500, 111–116. [Google Scholar] [CrossRef]
  138. Jiang, W.; Nolan, M.; Ehrentraut, D.; D’Evelyn, M.P. Electrical and optical properties of gallium vacancy complexes in ammonothermal GaN. Appl. Phys. Express 2017, 10, 075506. [Google Scholar] [CrossRef]
  139. Suihkonen, S.; Pimputkar, S.; Sintonen, S.; Tuomisto, F. Defects in single crystalline ammonothermal gallium nitride. Adv. Electron. Mater. 2017, 3, 1600496. [Google Scholar] [CrossRef]
  140. Reshchikov, M.A.; Morkoç, H.; Park, S.S.; Lee, K.Y. Two charge states of dominant acceptor in unintentionally doped GaN: Evidence from photoluminescence study. Appl. Phys. Lett. 2002, 81, 4970–4972. [Google Scholar] [CrossRef]
  141. Reshchikov, M.A.; Morkoç, H.; Park, S.S.; Lee, K.Y. Unusual properties of the dominant acceptor in freestanding GaN. Phys. B 2003, 340–342, 448–451. [Google Scholar] [CrossRef]
  142. Reshchikov, M.A.; Demchenko, D.O.; Usikov, A.; Helava, H.; Makarov, Y. Carbon defects as sources of the yellow and green luminescence bands in undoped GaN. Phys. Rev. B 2014, 90, 235203. [Google Scholar] [CrossRef]
  143. Reshchikov, M.A.; Usikov, A.; Helava, H.; Makarov, Y. Defect-related luminescence in undoped GaN grown by HVPE. J. Electron. Mater. 2015, 44, 1281–1286. [Google Scholar] [CrossRef]
  144. Reshchikov, M.A.; McNamara, J.D.; Usikov, A.; Helava, H.; Makarov, Y. Optically-generated giant traps in high-purity GaN. Phys. Rev. B 2016, 93, 081202. [Google Scholar] [CrossRef]
  145. Lax, M. Cascade Capture of Electrons in Solids. Phys. Rev. 1960, 119, 1502–1523. [Google Scholar] [CrossRef]
  146. Reshchikov, M.A.; Vorobiov, M.; Andrieiev, A.; Ding, K.; Avrutin, V.; Usikov, A.; Helava, H.; Makarov, Y. Determination of the concentration of impurities in GaN from photoluminescence and secondary-ion mass spectrometry. Sci. Rep. 2020, 10, 2223. [Google Scholar] [CrossRef] [PubMed]
  147. Takahashi, M.; Tanaka, A.; Ando, Y.; Watanabe, H.; Deki, M.; Kushimoto, M.; Nitta, S.; Honda, Y.; Shima, K.; Kojima, K.; et al. Suppression of Green Luminescence of Mg-Ion-Implanted GaN by Subsequent Implantation of Fluorine Ions at High Temperature. Phys. Stat. Sol. B 2020, 257, 1900554. [Google Scholar] [CrossRef]
  148. Meyers, V.; Rocco, E.; Hogan, K.; McEwen, B.; Shevelev, M.; Sklyar, V.; Jones, K.; Derenge, M.; Shahedipour-Sandvik, F. P-type conductivity and suppression of green luminescence in Mg/N co-implanted GaN by gyrotron microwave annealing. J. Appl. Phys. 2021, 130, 085704. [Google Scholar] [CrossRef]
  149. Kojima, K.; Takashima, S.; Edo, M.; Ueno, K.; Shimizu, M.; Takahashi, T.; Ishibashi, S.; Uedono, A.; Chichibu, S.F. Nitrogen vacancies as a common element of the green luminescence and nonradiative recombination centers in Mg-implanted GaN layers formed on a GaN substrate. Appl. Phys. Express 2017, 10, 061002. [Google Scholar] [CrossRef]
  150. Vorobiov, M.; Andrieiev, O.; Demchenko, D.O.; Reshchikov, M.A. Point Defects in Beryllium Doped GaN. Phys. Rev. B 2021, 104, 245203. [Google Scholar] [CrossRef]
  151. Reshchikov, M.A.; Andrieiev, O.; Vorobiov, M.; Ye, D.; Demchenko, D.O.; Sierakowski, K.; Bockowski, M.; McEwen, B.; Meyers, V.; Shahedipour-Sandvik, F. Thermal annealing of GaN implanted with Be. J. Appl. Phys. 2022, 131, 125704. [Google Scholar] [CrossRef]
  152. Reshchikov, M.A.; Morkoç, H. Unusual Properties of the Red and Green Luminescence Bands in Ga-rich GaN. MRS Online Proc. Libr. (OPL) 2005, 831, E3.7. [Google Scholar] [CrossRef]
  153. Reshchikov, M.A.; He, L.; Molnar, R.J.; Park, S.S.; Lee, K.Y.; Morkoç, H. Aquamarine luminescence band in undoped GaN. MRS Online Proc. Libr. 2005, 831, 537–542. [Google Scholar] [CrossRef]
  154. Reshchikov, M.A.; Yun, F.; Huang, D.; He, L.; Morkoç, H.; Park, S.S.; Lee, K.Y. Photoluminescence of GaN grown by molecular beam epitaxy on freestanding GaN template. MRS Online Proc. Libr. 2002, 722, 14. [Google Scholar] [CrossRef]
  155. Young, E.C.; Grandjean, N.; Mates, T.E.; Speck, J.S. Calcium impurity as a source of non-radiative recombination in (In,Ga)N layers grown by molecular beam epitaxy. Appl. Phys. Lett. 2016, 109, 212103. [Google Scholar] [CrossRef]
  156. Chèze, C.; Feix, F.; Lahnemann, J.; Flissikowski, T.; Krysko, M.; Wolny, P.; Turski, H.; Skierbiszewski, C.; Brandt, O. Luminescent N-polar (In,Ga)N/GaN quantum wells achieved by plasma-assisted molecular beam epitaxy at temperatures exceeding 700 °C. Appl. Phys. Lett. 2018, 112, 022102. [Google Scholar] [CrossRef]
  157. Auzelle, T.; Sinito, C.; Lähnemann, J.; Gao, G.; Flissikowski, T.; Trampert, A.; Brandt, O.; Fernández-Garrido, S. Interface Recombination in Ga- and N-Polar GaN/(Al,Ga)N Quantum Wells Grown by Molecular Beam Epitaxy. Phys. Rev. Appl. 2022, 17, 044030. [Google Scholar] [CrossRef]
  158. Zacks, E.; Halperin, A. Dependence of the Peak Energy of the Pair-Photoluminescence Band on Excitation Intensity. Phys. Rev. B 1972, 6, 3072–3075. [Google Scholar] [CrossRef]
  159. Xu, S.J.; Li, G.; Chua, S.J.; Wang, X.C.; Wang, W. Observation of optically-active metastable defects in undoped GaN epilayers. Appl. Phys. Lett. 1998, 72, 2451–2453. [Google Scholar] [CrossRef]
  160. Brown, S.A.; Reeves, R.J.; Haase, C.S.; Cheung, R.; Kirchner, C.; Kamp, M. Reactive-ion-etched gallium nitride: Metastable defects and yellow luminescence. Appl. Phys. Lett. 1999, 75, 3285–3287. [Google Scholar] [CrossRef]
  161. Kim, B.; Kuskovsky, I.; Herman, I.P.; Li, D.; Neumark, G.F. Reversible ultraviolet-induced photoluminescence degradation and enhancement in GaN films. J. Appl. Phys. 1999, 86, 2034–2037. [Google Scholar] [CrossRef]
  162. Dhar, S.; Ghosh, S. Optical metastability in undoped GaN grown on Ga-rich GaN buffer layers. Appl. Phys. Lett. 2002, 80, 4519–4521. [Google Scholar] [CrossRef]
  163. Ryan, B.J.; Henry, M.O.; McGlynn, E.; Fryar, J. Investigation of optical metastability in GaN using photoluminescence spectroscopy. Phys. B Condens. Matt. 2003, 340–342, 452–456. [Google Scholar] [CrossRef]
  164. Reshchikov, M.A.; Moon, Y.T.; Morkoç, H. Origin of unstable photoluminescence in GaN: Metastable defects or surface states? Phys. Stat. Sol. C 2005, 2, 2716–2719. [Google Scholar] [CrossRef]
  165. Monemar, B.; Paskov, P.P.; Pozina, G.; Hemmingsson, C.; Bergman, J.P.; Khromov, S.; Izyumskaya, V.N.; Avrutin, V.; Li, X.; Morkoç, H.; et al. Properties of the main Mg-related acceptors in GaN from optical and structural studies. J. Appl. Phys. 2014, 115, 053507. [Google Scholar] [CrossRef]
  166. Glaser, E.R.; Freitas, J.A., Jr.; Shanabrook, B.V.; Koleske, D.D.; Lee, S.K.; Park, S.S.; Han, J.Y. Optically detected magnetic resonance of (effective-mass) shallow acceptors in Si-doped GaN homoepitaxial layers. Phys. Rev. B 2003, 68, 195201. [Google Scholar] [CrossRef]
  167. Murthy, M.; Freitas, J.A., Jr.; Kim, J.; Glaser, E.R.; Storm, D. Residual impurities in GaN substrates and epitaxial layers grown by various techniques. J. Cryst. Growth 2007, 305, 393–398. [Google Scholar] [CrossRef]
  168. Kamiura, Y.; Ogasawara, M.; Fukutani, K.; Ishiyama, T.; Yamashita, Y.; Mitani, T.; Mukai, T. Enhancement of blue emission from GaN films and diodes by water vapor remote plasma treatment. Phys. B 2007, 401–402, 331–334. [Google Scholar] [CrossRef]
  169. Glaser, E.R.; Murthy, M.; Freitas, J.A., Jr.; Storm, D.F.; Zhou, L.; Smith, D.J. Optical and magnetic resonance studies of Mg-doped GaN homoepitaxial layers grown by molecular beam epitaxy. Phys. B 2007, 401–402, 327–330. [Google Scholar] [CrossRef]
  170. Lyons, J.L.; Janotti, A.; Van de Walle, C.G. Effects of hole localization on limiting p-type conductivity in oxide and nitride semiconductors. J. Appl. Phys. 2014, 115, 012014. [Google Scholar] [CrossRef]
  171. Saarinen, K.; Suski, T.; Grzegory, I.; Look, D.C. Thermal stability of isolated and complexed Ga vacancies in GaN bulk crystals. Phys. Rev. B 2001, 64, 233201. [Google Scholar] [CrossRef]
  172. Tuomisto, F.; Mäki, J.-M.; Rauch, C.; Makkonen, I. On the formation of vacancy defects in III-nitride semiconductors. J. Cryst. Growth 2012, 350, 93–97. [Google Scholar] [CrossRef]
  173. Oila, J.; Kivioja, J.; Ranki, V.; Saarinen, K.; Look, D.C.; Molnar, R.J.; Park, S.S.; Lee, S.K.; Han, J.Y. Ga vacancies as dominant intrinsic acceptors in GaN grown by hydride vapor phase epitaxy. App. Phys. Lett. 2003, 82, 3433–3435. [Google Scholar] [CrossRef]
  174. Tuomisto, F.; Hautakangas, S.; Makkonen, I.; Ranki, V.; Puska, M.J.; Saarinen, K.; Bockowski, M.; Suski, T.; Paskova, T.; Monemar, B.; et al. Dissociation of VGa-ON complexes in HVPE GaN by high pressure and high temperature annealing. Phys. Stat. Sol. B 2006, 243, 1436–1440. [Google Scholar] [CrossRef]
  175. Tuomisto, F.; Saarinen, K.; Paskova, T.; Monemar, B.; Bockowski, M.; Suski, T. Thermal stability of in-grown vacancy defects in GaN grown by hydride vapor phase epitaxy. J. Appl. Phys. 2006, 99, 066105. [Google Scholar] [CrossRef]
  176. Prozheev, I.; Iwinska, M.; Sochacki, T.; Bockowski, M.; Bes, R.; Tuomisto, F. Origins of Electrical Compensation in Si-doped HVPE GaN. Phys. Stat. Sol. B 2023, 260, 2200568. [Google Scholar] [CrossRef]
  177. Hautakangas, S.; Makkonen, I.; Ranki, V.; Puska, M.J.; Saarinen, K.; Xu, X.; Look, D.C. Direct evidence of impurity decoration of Ga vacancies in GaN from positron annihilation spectroscopy. Phys. Rev. B 2006, 73, 193301. [Google Scholar] [CrossRef]
  178. Nykänen, H.; Suihkonen, S.; Kilanski, L.; Sopanen, M.; Tuomisto, F. Low energy beam induced vacancy activation in GaN. Appl. Phys. Lett. 2012, 100, 122105. [Google Scholar] [CrossRef]
  179. Chichibu, S.F.; Shima, K.; Uedono, A.; Ishibashi, S.; Iguchi, H.; Narita, T.; Kataoka, K.; Tanaka, R.; Takashima, S.; Ueno, K.; et al. Impacts of vacancy complexes on the room-temperature photoluminescence lifetimes of state-of-the-art GaN substrates, epitaxial layers, and Mg-implanted layers. J. Appl. Phys. 2024, 135, 185701. [Google Scholar] [CrossRef]
  180. Uedono, A.; Takino, J.; Sumi, T.; Okayama, Y.; Imanishi, M.; Ishibashi, S.; Mori, Y. Vacancy-type defects in bulk GaN grown by oxide vapor phase epitaxy probed using positron annihilation. J. Cryst. Growth 2021, 570, 126219. [Google Scholar] [CrossRef]
  181. Li, H.; Huang, M.; Chen, S. First-principles exploration of defect-pairs in GaN. J. Semicond. 2020, 41, 032104. [Google Scholar] [CrossRef]
  182. Jiang, H.; Wan, P.; Yang, J.; Xu, X.; Li, W.; Li, X. Analysis of radiation defects in gallium nitride using deep level transient spectra and first principles methods. Nuclar Instr. Meth. Phys. Res. B 2023, 545, 105120. [Google Scholar] [CrossRef]
  183. Linde, M.; Uftring, S.J.; Watkins, G.D.; Härle, V.; Scholz, F. Optical detection of magnetic resonance in electron-irradiated GaN. Phys. Rev. B 1997, 55, 10177–10180. [Google Scholar] [CrossRef]
  184. Kogiso, T.; Narita, T.; Yoshida, H.; Tokuda, Y.; Tomita, K.; Kachi, T. Characterization of hole traps in MOVPE-grown p-GaN layers using low-frequency capacitance deep-level transient spectroscopy. Jap. J. Appl. Phys. 2019, 58, SCCB36. [Google Scholar] [CrossRef]
  185. Zhao, F.; Guan, H.; Turiansky, M.E.; Van de Walle, C.G. Carbon in GaN as a nonradiative recombination center. Appl. Phys. Lett. 2025, 126, 201106. [Google Scholar] [CrossRef]
  186. Neugebauer, J.; Van de Walle, C.G. Hydrogen in GaN: Novel Aspects of a Common Impurity. Phys. Rev. Lett. 1995, 75, 4452–4455. [Google Scholar] [CrossRef] [PubMed]
  187. Limpijumnong, S.; Van de Walle, C.G. Stability, diffusivity, and vibrational properties of monoatomic and molecular hydrogen in wurtzite GaN. Phys. Rev. B 2003, 68, 235203. [Google Scholar] [CrossRef]
  188. Reshchikov, M.A.; Andrieiev, O.; Vorobiov, M.; Ye, D.; Demchenko, D.O.; McEwen, B.; Shahedipour-Sandvik, F. Passivation of defects in GaN by hydrogen and their activation by annealing. Nanotechnology 2025, 36, 105704. [Google Scholar] [CrossRef]
  189. Demchenko, D.O.; Diallo, I.C.; Reshchikov, M.A. Hydrogen-carbon complexes and the blue luminescence band in GaN. J. Appl. Phys. 2016, 119, 035702. [Google Scholar] [CrossRef]
  190. Wu, S.; Yang, X.; Zhang, Q.; Shang, Q.; Huang, H.; Shen, J.; He, X.; Xu, F.; Wang, X.; Ge, W.; et al. Direct evidence of hydrogen interaction with carbon: C-H complex in semi-insulating GaN. Appl. Phys. Lett. 2020, 116, 262101. [Google Scholar] [CrossRef]
  191. Richter, E.; Beyer, F.C.; Zimmermann, F.; Gärtner, G.; Irmscher, K.; Gamov, I.; Heitmann, J.; Weyers, M.; Tränkle, G. Growth and Properties of Intentionally Carbon-Doped GaN Layers. Cryst. Res. Technol. 2020, 55, 1900129. [Google Scholar] [CrossRef]
  192. Gamov, I.; Richter, E.; Weyers, M.; Gärtner, G.; Irmscher, K. Carbon doping of GaN: Proof of the formation of electrically active tri-carbon defects. J. Appl. Phys. 2020, 127, 205701. [Google Scholar] [CrossRef]
  193. Reuter, E.E.; Zhang, R.; Kuech, T.F.; Bishop, S.G. Photoluminescence excitation spectroscopy of carbon-doped gallium nitride. MRS Internet J. Nitride Semicond. Res. 1999, 4S1, G3.67. [Google Scholar] [CrossRef]
  194. Stoneham, A.M. Theory of Defects in Solids; Oxford University Press: New York, NY, USA, 1975; 955p. [Google Scholar]
  195. Baldacchini, G. Radiative and nonradiative processes in color centers. In Advances in Nonradiative Processes in Solids; Di Bartolo, B., Ed.; Plenum Press: New York, NY, USA, 1991; pp. 219–259. [Google Scholar]
  196. Asami, K.; Naka, T.; Ishiguro, M. Luminescence quenching in F centers under pressure. Phys. Rev. B 1986, 34, 5658–5664. [Google Scholar] [CrossRef] [PubMed]
  197. Swank, R.K.; Brown, F.C. Lifetime of the Excited F Center. Phys. Rev. 1963, 130, 34–41. [Google Scholar] [CrossRef]
  198. Timusk, T.; Martienssen, W. Recombination Luminescence in Alkali Halides. Phys. Rev. 1962, 128, 1656–1663. [Google Scholar] [CrossRef]
  199. Sánchez, F.J.; Calle, F.; Sánchez-Garcia, M.A.; Calleja, E.; Munoz, E.; Molloy, C.H.; Somerford, D.J.; Serrano, J.J.; Blanco, J.M. Experimental evidence for a Be shallow acceptor in GaN grown on Si(111) by molecular beam epitaxy. Semicond. Sci. Technol. 1998, 13, 1130–1133. [Google Scholar] [CrossRef]
  200. Jaworek, M.; Wysmolek, A.; Kaminska, M.; Twardowski, A.; Bockowski, M.; Grzegory, I. Photoluminescence study of bulk GaN doped with beryllium. Acta Phys. Pol. 2005, 108, 705–710. [Google Scholar] [CrossRef]
  201. Kawaharazuka, A.; Tanimoto, T.; Nagai, K.; Tanaka, Y.; Horikoshi, Y. Be and Mg co-doping in GaN. J. Cryst. Growth 2007, 301–302, 414. [Google Scholar] [CrossRef]
  202. Teisseyre, H.; Gorczyca, I.; Christensen, N.E.; Svane, A.; Naranjo, F.B.; Calleja, E. Pressure behavior of beryllium-acceptor level in gallium nitride. J. Appl. Phys. 2005, 97, 043704. [Google Scholar] [CrossRef]
  203. Al Tahtamouni, T.M.; Sedhain, A.; Lin, J.Y.; Jiang, H.X. Beryllium Doped p-type GaN Grown by Metal-Organic Chemical Vapor Deposition. Jordan. J. Phys. 2010, 3, 77–81. [Google Scholar]
  204. Van de Walle, C.G.; Limpijumnong, S. First-Principles studies of beryllium doping of GaN. Phys. Rev. B 2001, 63, 245205. [Google Scholar] [CrossRef]
  205. Wang, H.; Chen, A.-B. Calculations of acceptor ionization energies in GaN. Phys. Rev. B 2001, 63, 125212. [Google Scholar] [CrossRef]
  206. Lany, S.; Zunger, A. Dual nature of acceptors in GaN and ZnO: The curious case of the shallow MgGa deep state. Appl. Phys. Lett. 2010, 96, 142114. [Google Scholar] [CrossRef]
  207. Lyons, J.L.; Janotti, A.; Van de Walle, C.G. Impact of group-II acceptors on the electrical and optical properties of GaN. Jap. J. Appl. Phys. 2013, 52, 08JJ04. [Google Scholar] [CrossRef]
  208. Cai, X.; Yang, J.; Zhang, P.; Wei, S.-H. Origin of Deep Be Acceptor Levels in Nitride Semiconductors: The Roles of Chemical and Strain Effects. Phys. Rev. Appl. 2019, 11, 034019. [Google Scholar] [CrossRef]
  209. Jin, S.; Li, X.; Yang, W.; Zhao, Y.; Bian, L.; Lu, S. Electrical and optical properties of Beryllium Deep Acceptors in GaN. J. Electron. Mater. 2020, 49, 7472–7478. [Google Scholar] [CrossRef]
  210. Demchenko, D.O.; Vorobiov, M.; Andrieiev, O.; Myers, T.H.; Reshchikov, M.A. Shallow and deep states of beryllium acceptor in GaN: Why photoluminescence experiments do not reveal small polarons for defects in semiconductors. Phys. Rev. Lett. 2021, 126, 027401. [Google Scholar] [CrossRef]
  211. Teisseyre, H.; Lyons, J.L.; Kaminska, A.; Jankowski, D.; Jarosz, D.; Bockowski, M.; Suchocki, A.; Van de Walle, C.G. Identification of yellow luminescence centers in Be-doped GaN through pressure-dependent studies. J. Phys. D: Appl. Phys. 2017, 50, 22LT03. [Google Scholar] [CrossRef]
  212. Naranjo, F.B.; Sánchez-García, M.A.; Pau, J.L.; Jiménez, A.; Calleja, E.; Muñoz, E.; Oila, J.; Saarinen, K.; Hautojärvi, P. Study of the Effects of Mg and Be Co-doping in GaN Layers. Phys. Stat. Sol. A 2000, 180, 97–102. [Google Scholar] [CrossRef]
  213. Reshchikov, M.A.; Vorobiov, M.; Andrieiev, O.; McEwen, B.; Rocco, E.; Meyers, V.; Demchenko, D.O.; Shahedipour-Sandvik, F. Photoluminescence from Be-Doped GaN Grown by Metal-Organic Chemical Vapor Deposition. Phys. Stat. Sol. B 2023, 260, 2200487. [Google Scholar] [CrossRef]
  214. Reshchikov, M.A.; Andrieiev, O.; Vorobiov, M.; Demchenko, D.O.; McEwen, B.; Shahedipour-Sandvik, F. Photoluminescence from GaN implanted with Be and F. Phys. Stat. Sol. B 2023, 260, 2300131. [Google Scholar] [CrossRef]
  215. Zajac, M.; Reshchikov, M.A.; McEwen, B.; Shahendipour-Sandvik, F. P-type conductivity in GaN:Be epitaxial layers. J. Appl. Phys. 2025, 138, 095705. [Google Scholar] [CrossRef]
  216. Glaser, E.R.; Carlos, W.; Braga, G.; Freitas, J.; Moore, W.; Shanabrook, B.; Wickenden, A.; Koleske, D.; Henry, R.; Bayerl, M.; et al. Characterization of nitrides by electron paramagnetic resonance (EPR) and optically detected magnetic resonance (ODMR). Mater. Sci. Eng. B 2002, 93, 39–48. [Google Scholar] [CrossRef]
  217. Reshchikov, M.A.; Sierakowski, K.; Jakiela, R.; Fijalkowski, M.; Sochacki, T.; Demchenko, D.O.; Bockowski, M. Photoluminescence from a- and m-plane GaN:Be,O. In Proceedings of the International Conference on Nitride Semiconductors (ICNS-15), Malmö, Sweden, 6–11 July 2025. [Google Scholar]
  218. Takeya, M.; Ikeda, M. Novel Methods of p-type Activation in Mg-doped GaN. Jpn. J. Appl. Phys. 2001, 40, 6260–6262. [Google Scholar] [CrossRef]
  219. Demchenko, D.O.; Reshchikov, M.A. Passivation of the beryllium acceptor in GaN and a possible route for p-type doping. Appl. Phys. Lett. 2021, 118, 142103. [Google Scholar] [CrossRef]
  220. Maruska, H.P.; Stevenson, D.A.; Pankove, J.I. Violet luminescence of Mg-doped GaN. Appl. Phys. Lett. 1973, 22, 303–305. [Google Scholar] [CrossRef]
  221. Amano, H.; Kito, M.; Hiramatsu, K.; Akasaki, I. P-Type Conduction in Mg-Doped GaN Treated with Low-Energy Electron Beam Irradiation (LEEBI). Jap. J. Appl. Phys. 1989, 28, L2112–L2114. [Google Scholar] [CrossRef]
  222. Nakamura, S.; Mukai, T.; Senoh, M. Candela-class high-brightness InGaN/AIGaN double-heterostructure blue-light-emitting diodes. Appl. Phys. Lett. 1994, 64, 1687–1689. [Google Scholar] [CrossRef]
  223. Akasaki, I.; Amano, H.; Kito, M.; Hiramatsu, K. Photoluminescence of Mg-doped p-type GaN and electroluminescence of GaN p-n junction LED. J. Lumin. 1991, 48–49, 666–670. [Google Scholar] [CrossRef]
  224. Amano, H.; Kito, M.; Hiramatsu, K.; Akasaki, I. Growth and Luminescence Properties of Mg- Doped GaN Prepared by MOVPE. J. Electrochem. Soc. 1990, 137, 1639–1641. [Google Scholar] [CrossRef]
  225. Nakamura, S.; Mukai, T.; Senoh, M.; Iwasa, N. Thermal annealing effects on p-type Mg-doped GaN films. Jpn. J. Appl. Phys. 1992, 31 Pt 2, L139–L142. [Google Scholar] [CrossRef]
  226. Nakamura, S.; Iwasa, N.; Senoh, M.; Mukai, T. Hole compensation mechanism of p-type GaN films. Jpn. J. Appl. Phys. 1992, 31 Pt 2, 1258–1266. [Google Scholar] [CrossRef]
  227. Kaufmann, U.; Kunzer, M.; Maier, M.; Obloh, H.; Ramakrishnan, A.; Santic, B. Nature of the 2.8 eV photoluminescence band in Mg doped GaN. Appl. Phys. Lett. 1998, 72, 1326–1328. [Google Scholar] [CrossRef]
  228. Eckey, L.; Von Gfug, U.; Holst, J.; Hoffmann, A.; Kaschner, A.; Siegle, H.; Thomsen, C.; Schineller, B.; Heime, K.; Heuken, M.; et al. Photoluminescence and Raman study of compensation effects in Mg-doped GaN epilayers. J. Appl. Phys. 1998, 84, 5828–5830. [Google Scholar] [CrossRef]
  229. Bhattacharyya, A.; Li, W.; Cabalu, J.; Moustakas, T.D.; Smith, D.J.; Hervig, R.L. Efficient p-type doping of GaN films by plasma-assisted molecular beam epitaxy. Appl. Phys. Lett. 2004, 85, 4956–4958. [Google Scholar] [CrossRef]
  230. Fischer, A.M.; Wang, S.; Ponce, F.A.; Gunning, B.P.; Fabien, C.A.; Doolittle, W.A. Origin of high hole concentrations in Mg-doped GaN films. Phys. Stat. Sol. B 2017, 254, 1600668. [Google Scholar] [CrossRef]
  231. Sun, Y.Y.; Abtew, A.; Zhang, P.; Zhang, S.B. Anisotropic polaron localization and spontaneous symmetry breaking: Comparison of cation-site acceptors in GaN and ZnO. Phys. Rev. B. 2014, 90, 165301. [Google Scholar] [CrossRef]
  232. Demchenko, D.O.; Diallo, I.; Reshchikov, M.A. Magnesium acceptor in gallium nitride: II. Koopmans tuned HSE hybrid functional calculations of dual nature and optical properties. Phys. Rev. B 2018, 97, 205205. [Google Scholar] [CrossRef]
  233. Lyons, J.L.; Janotti, A.; Van de Walle, C.G. Shallow versus Deep Nature of Mg Acceptors in Nitride Semiconductors. Phys. Rev. Lett. 2012, 108, 156403. [Google Scholar] [CrossRef] [PubMed]
  234. Miceli, G.; Pasquarello, A. Self-compensation due to point defects in Mg-doped GaN. Phys. Rev. B 2016, 93, 165207. [Google Scholar] [CrossRef]
  235. Demchenko, D.O.; Vorobiov, M.; Andrieiev, O.; Reshchikov, M.A.; McEwen, B.; Shahedipour-Sandvik, F. Koopmans-tuned Heyd-Scuseria-Ernzerhof hybrid functional calculations of acceptors in GaN. Phys. Rev. B 2024, 110, 035203. [Google Scholar] [CrossRef]
  236. Monemar, B.; Paskov, P.P.; Pozina, G.; Hemmingsson, C.; Bergman, J.P.; Kawashima, T.; Amano, H.; Akasaki, I.; Paskova, T.; Figge, S.; et al. Evidence for Two Mg Related Acceptors in GaN. Phys. Rev. Lett. 2009, 102, 235501. [Google Scholar] [CrossRef]
  237. Pozina, G.; Hemmingsson, C.; Paskov, P.P.; Bergman, J.P.; Monemar, B.; Kawashima, T.; Amano, H.; Akasaki, I.; Usui, A. Effect of annealing on metastable shallow acceptors in Mg-doped GaN layers grown on GaN substrates. Appl. Phys. Lett. 2008, 92, 151904. [Google Scholar] [CrossRef]
  238. Gelhausen, O.; Phillips, M.R.; Goldys, E.M.; Paskova, T.; Monemar, B.; Strassburg, M.; Hoffmann, A. Dissociation of H-related defect complexes in Mg-doped GaN. Phys. Rev. B 2004, 69, 125210. [Google Scholar] [CrossRef]
  239. Pozina, G.; Paskov, P.P.; Bergman, J.P.; Hemmingsson, C.; Hultman, L.; Monemar, B.; Amano, H.; Akasaki, I.; Usui, A. Metastable behavior of the UV luminescence in Mg-doped GaN layers grown on quasibulk GaN templates. Appl. Phys. Lett. 2007, 91, 221901. [Google Scholar] [CrossRef]
  240. Callsen, G.; Wagner, M.R.; Kure, T.; Reparaz, J.S.; Bügler, M.; Brunnmeier, J.; Nenstiel, C.; Hoffmann, A.; Hoffmann, M.; Tweedie, J.; et al. Optical signature of Mg-doped GaN: Transfer processes. Phys. Rev. B 2012, 86, 075207. [Google Scholar] [CrossRef]
  241. Liu, H.; Su, P.-Y.; Wu, Z.; Liu, R.; Ponce, F.A. Influence of substrate misorientation on the optical properties of Mg-doped GaN. J. Appl. Phys. 2020, 127, 195701. [Google Scholar] [CrossRef]
  242. Levanyuk, A.P.; Osipov, V.V. Edge luminescence of direct-gap semiconductors. Sov. Phys. Usp. 1981, 24, 187–215. [Google Scholar] [CrossRef]
  243. Takahashi, M.; Tanaka, A.; Ando, Y.; Watanabe, H.; Deki, M.; Kushimoto, M.; Nitta, S.; Honda, Y.; Shima, K.; Kojima, K.; et al. Impact of high-temperature implantation of Mg ions into GaN. Jap. J. Appl. Phys. 2020, 59, 056502. [Google Scholar] [CrossRef]
  244. Kumar, A.; Yi, W.; Uzuhashi, J.; Ohkubo, T.; Chen, J.; Sekiguchi, T.; Tanaka, R.; Takashima, S.; Edo, M.; Hono, K. Influence of implanted Mg concentration on defects and Mg distribution in GaN. J. Appl. Phys. 2020, 128, 065701. [Google Scholar] [CrossRef]
  245. Itoh, Y.; Watanabe, H.; Ando, Y.; Kano, E.; Deki, M.; Nitta, S.; Honda, Y.; Tanaka, A.; Ikarashi, N.; Amano, H. Effect of beam current on defect formation by high-temperature implantation of Mg ions into GaN. Appl. Phys. Express 2022, 15, 021003. [Google Scholar] [CrossRef]
  246. Sukarai, H.; Omori, M.; Yamada, S.; Furukawa, Y.; Suzuki, H.; Narita, T.; Kataoka, K.; Horita, M.; Bockowski, M.; Suda, J.; et al. Highly effective activation of Mg-implanted p-type GaN by ultra-high-pressure annealing. Appl. Phys. Lett. 2019, 115, 142104. [Google Scholar] [CrossRef]
  247. Tsuge, H.; Ikeda, K.; Kato, S.; Nishimura, T.; Nakamura, T.; Kuriyama, K.; Mishima, T. Impact of Mg-ion implantation with various fluence ranges on optical properties of n-type GaN. Nucl. Instr. Meth. Phys. Res. B 2017, 409, 50–52. [Google Scholar] [CrossRef]
  248. Uedono, A.; Iguchi, H.; Narita, T.; Kataoka, K.; Egger, W.; Koschine, T.; Hugenschmidt, C.; Dickmann, M.; Shima, K.; Kojima, K.; et al. Annealing Behavior of Vacancy-Type Defects in Mg- and H-Implanted GaN Studied Using Monoenergetic Positron Beams. Phys. Stat. Sol. B 2019, 256, 1900104. [Google Scholar] [CrossRef]
  249. Monemar, B.; Paskov, P.P.; Bergman, J.P.; Paskova, T.; Figge, S.; Dennemarck, J.; Hommel, D. The dominant shallow 0.225 eV acceptor in GaN. Phys. Stat. Sol. B 2006, 243, 1604–1608. [Google Scholar] [CrossRef]
  250. Kamiura, Y.; Kaneshiro, M.; Tamura, J.; Ishiyama, T.; Yamashita, Y.; Mitani, T.; Mukai, T. Enhancement of blue emission from Mg-doped GaN using remote plasma containing atomic hydrogen. Jap. J. Appl. Phys. 2005, 44, L926–L928. [Google Scholar] [CrossRef]
  251. Alves, H.; Leiter, F.; Pfisterer, D.; Hofmann, D.M.; Meyer, B.K.; Einfeld, S.; Heinke, H.; Hommel, D. Mg in GaN: The structure of the acceptor and the electrical activity. Phys. Stat. Sol. C 2003, 1770–1782. [Google Scholar] [CrossRef]
  252. Shahedipour, F.; Wessels, B.W. Investigation of the formation of the 2.8 eV luminescence band in p-type GaN:Mg. Appl. Phys. Lett. 2000, 76, 3011–3013. [Google Scholar] [CrossRef]
  253. Nayak, S.; Gupta, M.; Waghmare, U.V.; Shivaprasad, S.M. Origin of Blue Luminescence in Mg-Doped GaN. Phys. Rev. Appl. 2019, 11, 014027. [Google Scholar] [CrossRef]
  254. Yan, Q.; Janotti, A.; Scheffler, M.; Van de Walle, C.G. Role of nitrogen vacancies in the luminescence of Mg-doped GaN. Appl. Phys. Lett. 2012, 100, 142110. [Google Scholar] [CrossRef]
  255. Shklovskii, B.I.; Efros, A.L. Electronic Properties of Doped Semiconductors; Springer: Berlin/Heidelberg, Germany, 1984; pp. 53–73, 253–313. [Google Scholar]
  256. Zeng, S.; Aliev, G.N.; Wolverson, D.; Davies, J.J.; Bingham, S.J.; Abdulmalik, D.A.; Coleman, P.G.; Wang, T.; Parbrook, P.J. The role of vacancies in the red luminescence from Mg-doped GaN. Phys. Stat. Sol. C 2006, 3, 1919–1922. [Google Scholar] [CrossRef]
  257. Shima, K.; Tanaka, R.; Takashima, S.; Ueno, K.; Edo, M.; Kojima, K.; Uedono, A.; Ishibashi, S.; Chichibu, S.F. Improved minority carrier lifetime in p-type GaN segments prepared by vacancy-guided redistribution of Mg. Appl. Phys. Lett. 2021, 119, 182106. [Google Scholar] [CrossRef]
  258. Bayerl, M.W.; Brandt, M.S.; Glaser, E.R.; Wickenden, A.E.; Koleske, D.D.; Henry, R.L.; Stutzmann, M. The Origin of Red Luminescence from Mg-doped GaN. Phys. Stat. Sol. B 1999, 216, 547–550. [Google Scholar] [CrossRef]
  259. Bayerl, M.W.; Brandt, M.S.; Ambacher, O.; Stutzmann, M.; Glaser, E.R.; Henry, R.L.; Wickenden, A.E.; Koleske, D.D.; Suski, T.; Grzegory, I.; et al. Optically detected magnetic resonance of red and near-infrared luminescence in Mg-doped GaN. Phys. Rev. B 2001, 63, 125203. [Google Scholar] [CrossRef]
  260. Zajac, M.; Konczewicz, L.; Litwin-Staszewska, E.; Iwinska, M.; Kucharski, R.; Juillaguet, S.; Contreras, S. P-type conductivity in GaN:Zn monocrystals grown by ammonothermal method. J. Appl. Phys. 2021, 129, 135702. [Google Scholar] [CrossRef]
  261. Reshchikov, M.A. Two-step thermal quenching of photoluminescence in Zn-doped GaN. Phys. Rev. B 2012, 85, 245203. [Google Scholar] [CrossRef]
  262. Reshchikov, M.A.; Olsen, A.J.; Bishop, M.F.; McMullen, T. Superlinear increase of photoluminescence with excitation intensity in Zn-doped GaN. Phys. Rev. B. 2013, 88, 075204. [Google Scholar] [CrossRef]
  263. Monemar, B.; Lagerstedt, O.; Gislason, H.P. Properties of Zn-doped VPE-grown GaN. I. Luminescence data in relation to doping conditions. J. Appl. Phys. 1980, 51, 625–639. [Google Scholar] [CrossRef]
  264. Pankove, J.I. Luminescence in GaN. J. Lumin. 1973, 7, 114–126. [Google Scholar] [CrossRef]
  265. Shi, L.; Xu, K.; Wang, L.-W. Comparative study of ab initio nonradiative recombination rate calculations under different formalisms. Phys. Rev. B 2015, 91, 205315. [Google Scholar] [CrossRef]
  266. Bergman, P.; Ying, G.; Monemar, B.; Holtz, P.O. Time-resolved spectroscopy of Zn- and Cd-doped GaN. J. Appl. Phys. 1987, 61, 4589–4592. [Google Scholar] [CrossRef]
  267. Henry, M.O.; Deicher, M.; Magerle, R.; McGlynn, E.; Stötzler, A. Photoluminescence analysis of semiconductors using radioactive isotopes. Hyperfine Interact. 2000, 129, 443–460. [Google Scholar] [CrossRef]
  268. Stötzler, A.; Weissenborn, R.; Deicher, M.; The ISOLDE Collaboration. Identification of Ag and Cd in photoluminescence in 111Ag-doped GaN. Phys. B 1999, 273–274, 144–147. [Google Scholar] [CrossRef]
  269. Monteiro, T.; Boemare, C.; Soares, M.J.; Alves, E.; Liu, C. Green and red emission in Ca implanted GaN samples. Phys. B 2001, 308–310, 42–46. [Google Scholar] [CrossRef]
  270. Shen, J.-X.; Wickramaratne, D.; Dreyer, C.E.; Alkauskas, A.; Young, E.; Speck, J.S.; Van de Walle, C.G. Calcium as a nonradiative recombination center in InGaN. Appl. Phys. Express 2017, 10, 021001. [Google Scholar] [CrossRef]
  271. Lyons, J.L.; Wickramaratne, D.; Van de Walle, C.G. A first-principles understanding of point defects and impurities in GaN. J. Appl. Phys. 2021, 129, 111101. [Google Scholar] [CrossRef]
  272. Eider, E.; Grimmeiss, H.G. Optical Investigations of Zn, Hg and Li Doped GaN. Appl. Phys. 1974, 5, 275–279. [Google Scholar]
  273. Van de Walle, C.G.; Neugebauer, J. Arsenic impurities in GaN. Appl. Phys. Lett. 2000, 76, 1009–1011. [Google Scholar] [CrossRef]
  274. Mattila, T.; Zunger, A. Deep electronic gap levels induced by isovalent P and As impurities in GaN. Phys. Rev. B 1998, 58, 1367–1373. [Google Scholar] [CrossRef]
  275. Gil, B.; Morel, A.; Taliercio, T.; Lefebre, P.; Foxon, C.T.; Winser, A.J.; Novikov, S.V. Carrier relaxation dynamics for As defects in GaN. Appl. Phys. Lett. 2001, 79, 69–71. [Google Scholar] [CrossRef]
  276. Li, X.; Kim, S.; Reuter, E.E.; Bishop, S.G.; Coleman, J.J. The incorporation of arsenic in GaN by metalorganic chemical vapor deposition. Appl. Phys. Lett. 1998, 72, 1990–1992. [Google Scholar] [CrossRef]
  277. Jin, S.R.; Ramsteiner, M.; Grahn, H.T.; Ploog, K.H.; Zhu, Z.Q.; Shen, D.X.; Li, A.Z.; Metev, P.; Guido, L.J. Suppression of yellow luminescence in As-doped GaN epilayers grown by metalorganic chemical vapor deposition. J. Cryst. Growth 2000, 212, 56–60. [Google Scholar] [CrossRef]
  278. Guido, L.J.; Mitev, P.; Gherasimova, M.; Gaffey, B. Electronic properties of arsenic-doped gallium nitride. Appl. Phys. Lett. 1998, 72, 2005–2007. [Google Scholar] [CrossRef]
  279. Sierakowski, K.; Jakiela, R.; Jaroszynski, P.; Fijalkowski, M.; Sochacki, T.; Iwinska, M.; Turek, M.; Uedono, A.; Reshchikov, M.A.; Bockowski, M. Analysis of Zn diffusion in various crystallographic directions of GaN grown by HVPE. Mater. Sci. Semicond. Process. 2023, 167, 107808. [Google Scholar] [CrossRef]
  280. Skromme, B.J.; Martinez, G.L.; Suvkhanov, A.; Krasnobaev, L.; Poker, D.B. Optical characterization of acceptor implantation in GaN. In High-Speed Compound Semiconductor Devices for Wireless Applications and State-of-the-Art Program on Compound Semiconductors (XXXIII); Baca, A.G., Kopf, R.F., Eds.; The Electrochemical Society, Inc.: Pennington, NJ, USA, 2000; Volume 2000-18, pp. 120–131. ISBN 1-56677-285-0. [Google Scholar]
  281. Zhao, F.; Turiansky, M.E.; Alkauskas, A.; Van de Walle, C.G. Trap-Assisted Auger-Meitner Recombination from First Principles. Phys. Rev. Lett. 2023, 131, 056402. [Google Scholar] [CrossRef] [PubMed]
  282. Espenlaub, A.C.; Myers, D.J.; Young, E.C.; Marcinkevičius, S.; Weisbuch, C.; Speck, J.S. Evidence of trap-assisted Auger recombination in low radiative efficiency MBE-grown III-nitride LEDs. J. Appl. Phys. 2019, 126, 184502. [Google Scholar] [CrossRef]
  283. Lähnemann, J.; Kaganer, V.M.; Sabelfeld, K.K.; Kireeva, A.E.; Jahn, U.; Chèze, C.; Calarco, R.; Brandt, O. Carrier Diffusion in GaN: A Cathodoluminescence Study. III. Nature of Nonradiative Recombination at Threading Dislocations. Phys. Rev. Appl. 2022, 17, 024019. [Google Scholar] [CrossRef]
  284. Xu, Z.; Daeumer, M.; Cho, M.; Yoo, J.-H.; Detchprohm, T.; Bakhtiary-Noodeh, M.; Shao, Q.; Laurence, T.A.; Key, D.; Letts, E.; et al. Breakdown characteristics analysis of kV-class vertical GaN PIN rectifiers by wafer-level sub-bandgap photoluminescence mapping. J. Appl. Phys. 2024, 135, 205704. [Google Scholar] [CrossRef]
  285. Pauc, N.; Phillips, M.R.; Aimez, V.; Drouin, D. Carrier recombination near threading dislocations in GaN epilayers by low voltage cathodoluminescence. Appl. Phys. Lett. 2006, 89, 161905. [Google Scholar] [CrossRef]
  286. Shiozaki, N.; Hashizume, T. Improvements of electronic and optical characteristics of n-GaN-based structures by photoelectrochemical oxidation in glycol solution. J. Appl. Phys. 2009, 105, 064912. [Google Scholar] [CrossRef]
  287. Martinez, G.L.; Curiel, M.R.; Skromme, B.J.; Molnar, R.J. Surface recombination and sulfide passivation of GaN. J. Electron. Mat. 2000, 29, 325–331. [Google Scholar] [CrossRef]
  288. Liu, W.; Sun, X.; Zhang, S.; Chen, J.; Wang, H.; Wang, X.; Zhao, D.; Yang, H. Photoluminescence degradation in GaN induced by light enhanced surface oxidation. J. Appl. Phys. 2007, 102, 076112. [Google Scholar] [CrossRef]
  289. Pfüller, C.; Brandt, O.; Grosse, F.; Flissikowski, T.; Cheze, C.; Consonni, V.; Geelhaar, L.; Grahn, H.T.; Riechert, H. Unpinning the Fermi level of GaN nanowires by ultraviolet radiation. Phys. Rev. B 2010, 82, 045320. [Google Scholar] [CrossRef]
  290. Reshchikov, M.A. Strong suppression of the yellow luminescence in GaN in air ambient. Appl. Phys. Lett. 2006, 89, 232106. [Google Scholar] [CrossRef]
  291. Reshchikov, M.A.; Foussekis, M.; Baski, A.A. Surface photovoltage in undoped n-type GaN. J. Appl. Phys. 2010, 107, 113535. [Google Scholar] [CrossRef]
  292. Reshchikov, M.A.; Sabuktagin, S.; Johnstone, D.K.; Morkoç, H. Transient photovoltage in GaN as measured by atomic force microscope tip. J. Appl. Phys. 2004, 96, 2556–2560. [Google Scholar] [CrossRef]
  293. Barbet, S.; Aubry, R.; di Forte-Poisson, M.A.; Jacquet, J.-C.; Deresmes, D.; Melin, T.; Theron, D. Surface potential of n- and p-type GaN measured by Kelvin force microscopy. Appl. Phys. Lett. 2008, 93, 212107. [Google Scholar] [CrossRef]
  294. Wolkenstein, T.; Peka, G.P.; Malakhov, V.V. The influence of adsorption on the luminescence of semiconductors. Part II. Exciton luminescence. J. Lumin. 1972, 5, 261–268. [Google Scholar] [CrossRef]
  295. Kumakura, K.; Makimoto, T.; Kobayashi, N.; Hashizume, T.; Fukui, T.; Hasegawa, H. Minority carrier diffusion length in GaN: Dislocation density and doping concentration dependence. Appl. Phys. Lett. 2005, 86, 052105. [Google Scholar] [CrossRef]
  296. Matys, M.; Adamowicz, B.; Kachi, T.; Hashizume, T. Effect of carrier drift-diffusion transport process on thermal quenching of photoluminescence in GaN. J. Phys. D: Appl. Phys. 2021, 54, 055106. [Google Scholar] [CrossRef]
  297. Foussekis, M.A.; Baski, A.A.; Reshchikov, M.A. Electrical and optical properties of GaN studied by surface photovoltage and photoluminescence. Phys. Stat. Sol. C 2011, 8, 2148–2150. [Google Scholar] [CrossRef]
  298. Foussekis, M.; McNamara, J.D.; Baski, A.A.; Reshchikov, M.A. Temperature-dependent Kelvin probe measurements of band bending in p-type GaN. Appl. Phys. Lett. 2012, 101, 082104. [Google Scholar] [CrossRef]
  299. Long, J.P.; Bermudez, V.M. Band bending and photoemission-induced surface photovoltages on clean n- and p-GaN (0001) surfaces. Phys. Rev. B 2002, 66, 121308. [Google Scholar] [CrossRef]
  300. Curie, D.; Garlick, G.F.J. Luminescence in Crystals; Methuen and Co., Ltd.: London, UK, 1963; 332p. [Google Scholar]
  301. Riehl, N. Intrinsic defects and luminescence in II-VI compounds. J. Lumin. 1981, 24/25, 335–342. [Google Scholar] [CrossRef]
  302. Zvanut, M.E.; Paudel, S.; Glaser, E.R.; Iwinska, M.; Sochacki, T.; Bockowski, M. Incorporation of Carbon in Free-Standing HVPE-Grown GaN Substrates. J. Electron. Mater. 2019, 48, 2226–2232. [Google Scholar] [CrossRef]
  303. Zvanut, M.E.; Paudel, S.; Sunay, U.R.; Willoughby, W.R.; Iwinska, M.; Sochacki, T.; Bockowski, M. Charge transfer process for carbon-related center in semi-insulating carbon-doped GaN. J. Appl. Phys. 2018, 124, 075701. [Google Scholar] [CrossRef]
  304. Paudel, S.; Zvanut, M.E.; Iwinska, M.; Sochacki, T.; Bockowski, M. A Deep Carbon-Related Acceptor Identified through Photoinduced Electron Paramagnetic Resonance. Phys. Stat. Sol. B 2020, 257, 1900593. [Google Scholar] [CrossRef]
  305. Hofmann, D.M.; Kovalev, D.; Steude, G.; Meyer, B.K.; Hoffmann, A.; Eckey, L.; Heitz, R.; Detchprom, T.; Amano, H.; Akasaki, I. Properties of the yellow luminescence in undoped GaN epitaxial layers. Phys. Rev. B 1995, 52, 16702–16706. [Google Scholar] [CrossRef] [PubMed]
  306. Honda, U.; Yamada, Y.; Tokuda, Y.; Shiojima, K. Deep levels in n-GaN doped with carbon studied by deep level and minority carrier transient spectroscopies. Jap. J. Appl. Phys. 2012, 51, 04DF04. [Google Scholar] [CrossRef]
  307. Look, D.C. Defect-Related Donors, Acceptors, and Traps in GaN. Phys. Stat. Sol. B 2001, 228, 293–302. [Google Scholar] [CrossRef]
  308. Horita, M.; Narita, T.; Kachi, T.; Suda, J. Nitrogen displacement-related electron traps in n-type GaN grown on a GaN freestanding substrate. Appl. Phys. Lett. 2021, 118, 012106. [Google Scholar] [CrossRef]
  309. Endo, M.; Horita, M.; Suda, J. Hole traps related to nitrogen displacement in p-type GaN grown by metalorganic vapor phase epitaxy on freestanding GaN. Appl. Phys. Lett. 2022, 120, 142104. [Google Scholar] [CrossRef]
  310. Zajac, M.; Kaminski, P.; Kozlowski, R.; Litwin-Staszewska, E.; Piotrzkowski, R.; Grabianska, K.; Kucharski, R.; Jakiela, R. Formation of Grown-In Nitrogen Vacancies and Interstitials in Highly Mg-Doped Ammonothermal GaN. Materials 2024, 17, 1160. [Google Scholar] [CrossRef]
  311. Narita, T.; Horita, M.; Tomita, K.; Kachi, T.; Suda, J. Why do electron traps at EC-0.6 eV have inverse correlation with carbon concentrations in n-type GaN layer? Jap. J. Appl. Phys. 2020, 59, 105505. [Google Scholar] [CrossRef]
  312. Albrecht, F.; Reislöhner, U.; Hülsen, C.; Witthuhn, W.; Grillenberger, J.; Dietrich, M.; the ISOLDE collaboration. Observation of a Be-correlated donor state in GaN. Appl. Phys, Lett. 2004, 84, 3876–3878. [Google Scholar] [CrossRef]
  313. Polyakov, A.Y.; Lee, I.-H. Deep traps in GaN-based structures as affecting the performance of GaN devices. Mater. Sci. Eng. R Rep. 2015, 94, 1–56. [Google Scholar] [CrossRef]
  314. Bisi, D.; Meneghini, M.; De Santi, C.; Chini, A.; Dammann, M.; Brückner, P.; Mikulla, M.; Meneghesso, G.; Zanoni, E. Deep-Level Characterization in GaN HEMTs-Part I: Advantages and Limitations of Drain Current Transient Measurements. IEEE Trans. Electron. Devices 2013, 60, 3166–3175. [Google Scholar] [CrossRef]
  315. Stötzler, A.; Weissenborn, R.; Deicher, M.; The ISOLDE Collaboration. Identification of As, Ge and Se Photoluminescence in GaN Using Radioactive Isotopes. MRS Internet J. Nitride Semicond. Res. 2000, 5, 990–996. [Google Scholar] [CrossRef]
  316. Stötzler, A.; Deicher, M.; The ISOLDE Collaboration. Photoluminescence in platinum doped GaN. Phys. B 2003, 340–342, 377–380. [Google Scholar] [CrossRef]
  317. Neugebauer, J.; Van de Walle, C.G. Chemical trends for acceptor impurities in GaN. J. Appl. Phys. 1999, 85, 3003–3005. [Google Scholar] [CrossRef]
  318. Freysoldt, C.; Grabowski, B.; Hickel, T.; Neugebauer, J.; Kresse, G.; Janotti, A.; Van de Walle, C.G. First-principles calculations for point defects in solids. Rev. Mod. Phys. 2014, 86, 253–305. [Google Scholar] [CrossRef]
  319. Heyd, J.; Scuseria, G.E.; Ernzerhof, M. Hybrid functionals based on a screened Coulomb potential. J. Chem. Phys. 2003, 118, 8207–8215. [Google Scholar] [CrossRef]
  320. Nichols, L.R.; Li, G.; Yu, Y.; Jiang, J.; O’Hara, A.; Barmparis, G.D.; Pantelides, S.; Zhang, X.-G. Multiphonon carrier capture by defects in semiconductors. Phys. Rev. B 2025, 111, 045201. [Google Scholar] [CrossRef]
  321. Deák, P.; Aradi, B.; Frauenheim, T.; Janzén, E.; Gali, A. Accurate defect levels obtained from the HSE06 range-separated hybrid functional. Phys. Rev. B 2010, 81, 153203. [Google Scholar] [CrossRef]
  322. Freysoldt, C.; Neugebauer, J.; Van de Walle, C.G. Fully Ab Initio Finite-Size Corrections for Charged-Defect Supercell Calculations. Phys. Rev. Lett. 2009, 102, 016402. [Google Scholar] [CrossRef] [PubMed]
  323. Freysoldt, C.; Neugebauer, J.; Van de Walle, C.G. Electrostatic interactions between charged defects in supercells. Phys. Stat. Sol. B 2010, 248, 1067–1076. [Google Scholar] [CrossRef]
  324. Meneghini, M.; De Santi, C.; Abid, I.; Buffolo, M.; Cioni, M.; Abdul Khadar, R.; Nela, L.; Zagni, N.; Chini, A.; Medjdoub, F.; et al. GaN-based power devices: Physics, reliability, and perspectives. J. Appl. Phys. 2021, 130, 181101. [Google Scholar] [CrossRef]
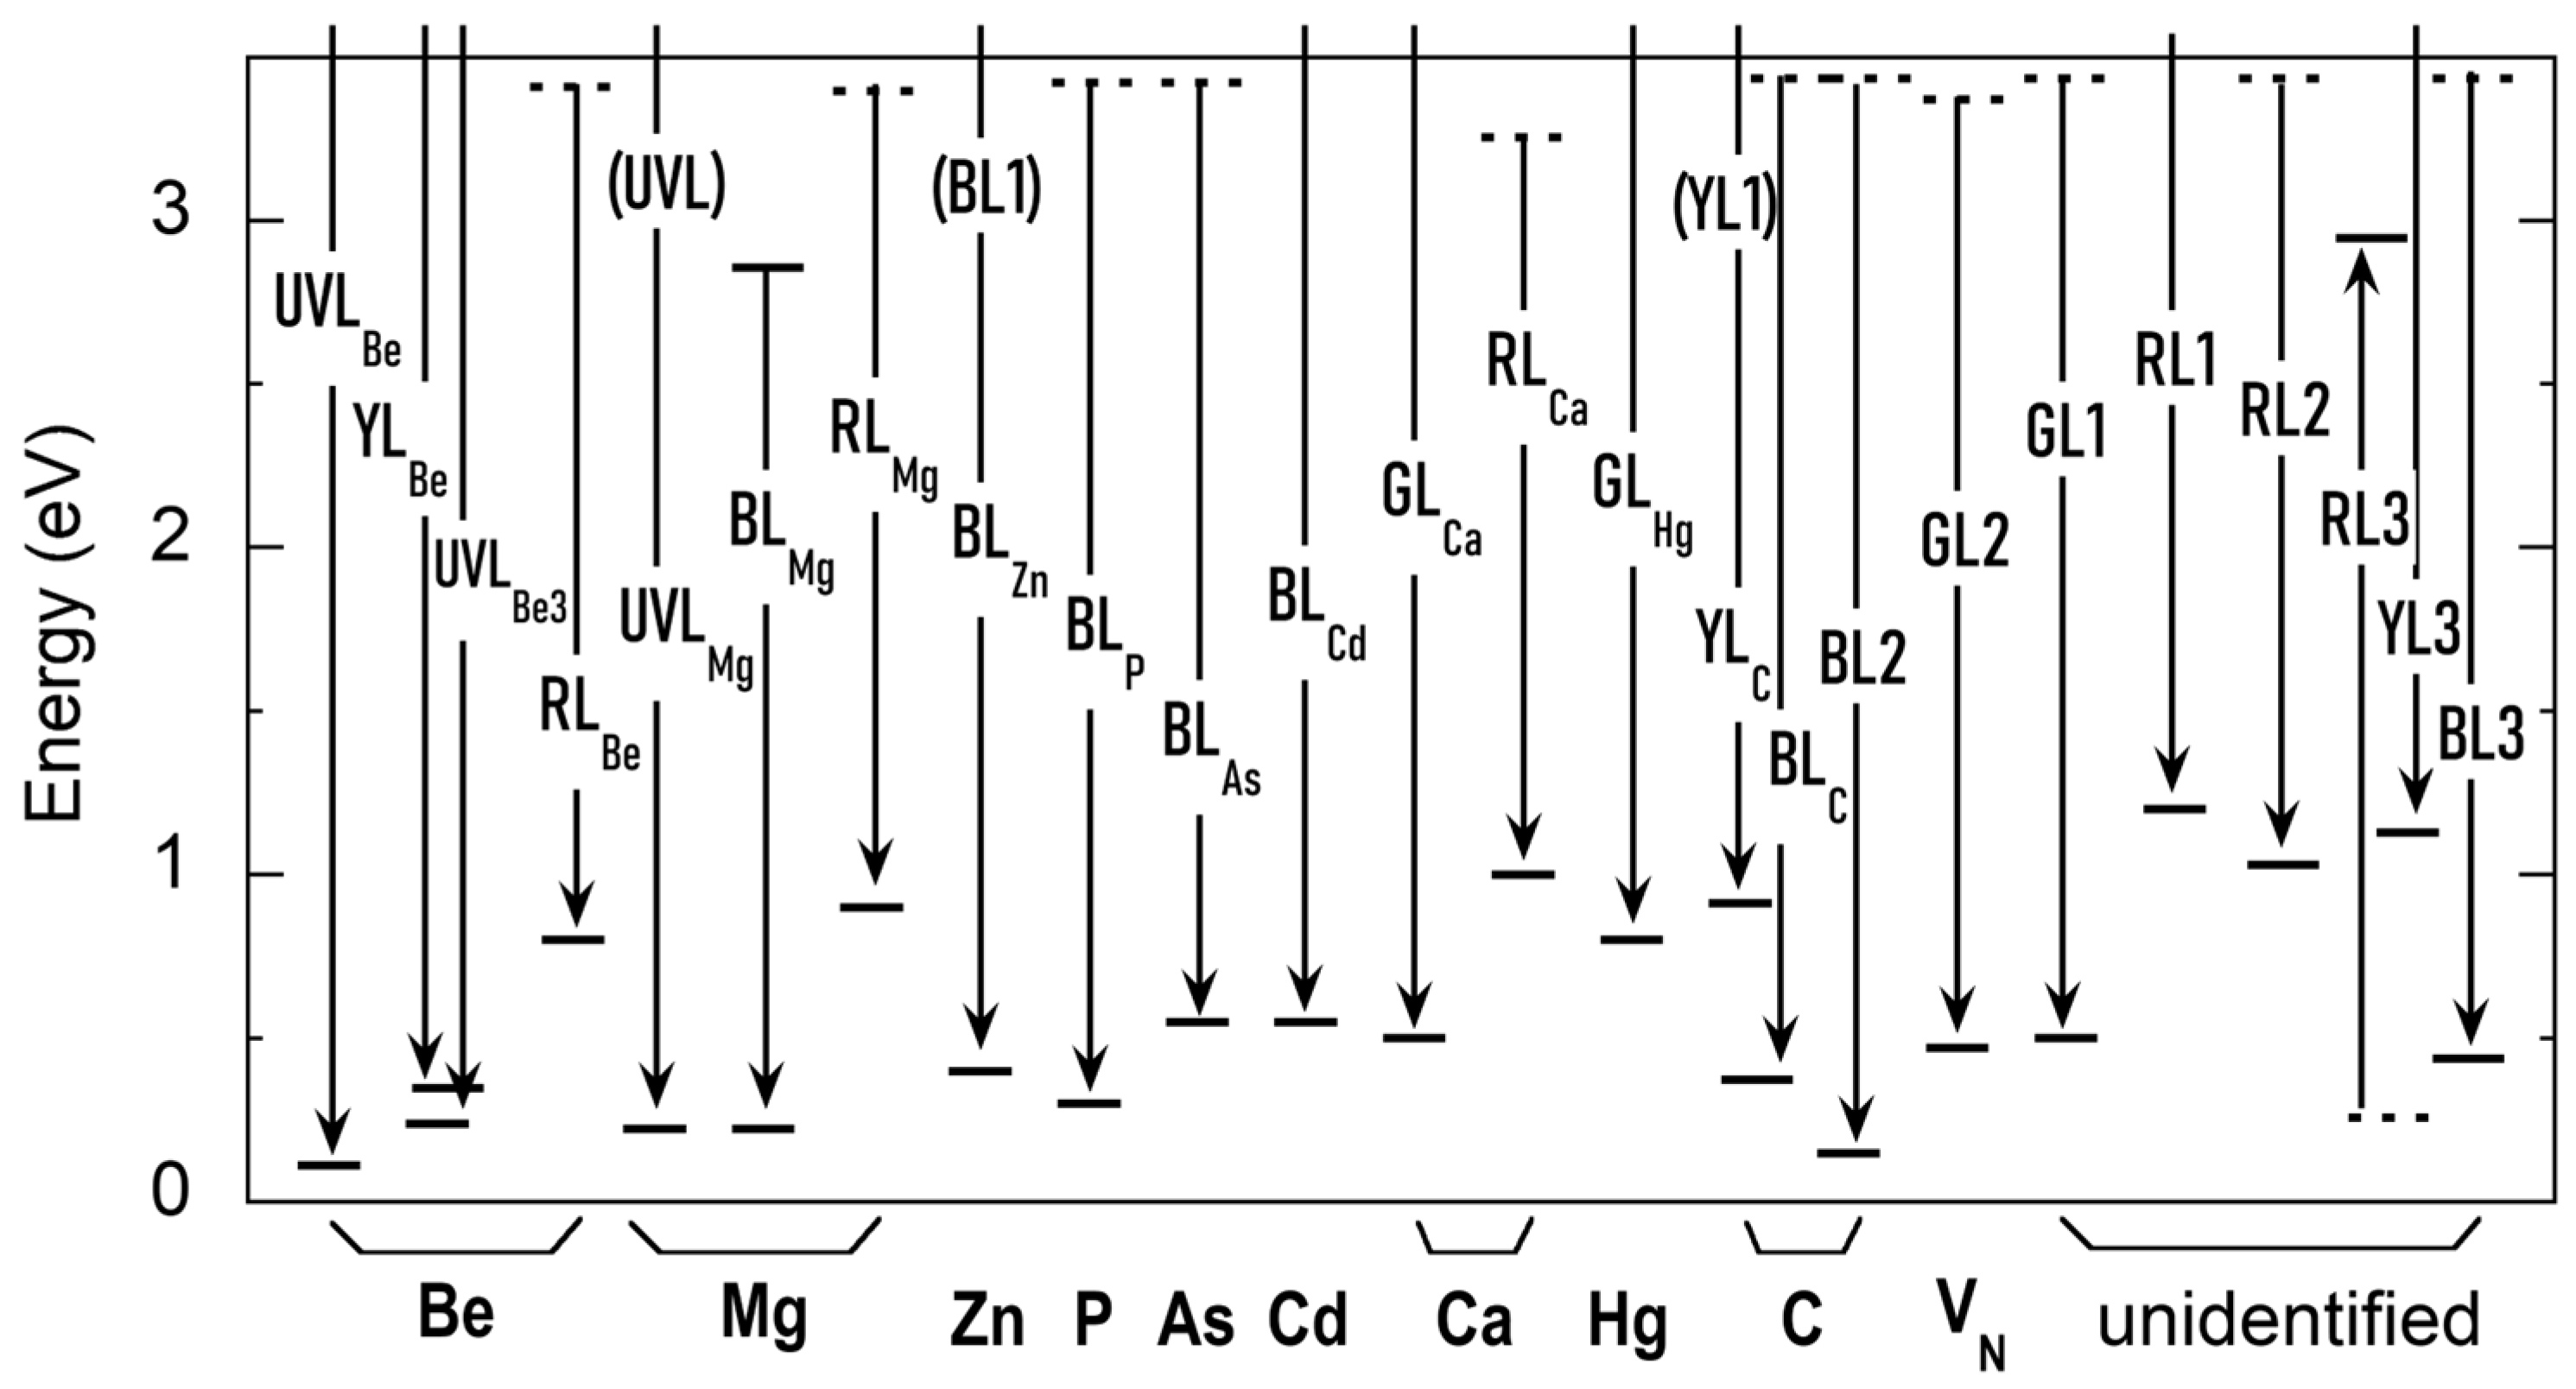
Figure 1. Band diagram with main radiative transitions and names of PL bands in undoped GaN and GaN doped with major impurities (limited to GaN grown by MOCVD, MBE, and HVPE).
Solids 06 00052 g001
Figure 2. Schematics of the PL experiment. NDF is a neutral density filter, and PMT is a photomultiplier tube.
Solids 06 00052 g002
Figure 3. The YL1 band in GaN. (a) Normalized PL spectra measured at T = 18 K for two n-type GaN samples grown by MOCVD. The dashed line is calculated using Equation (6) with parameters from Table 2. The inset shows the region near the ZPL. (b) Configurational coordinate diagram. (c) Band diagram. Excitation and PL transitions are shown with blue and red arrows, respectively. Reproduced with permission from [41].
Solids 06 00052 g003
Figure 4. Difference spectra between the experimental normalized PL and simulated with Equation (6) PL band shape for HVPE GaN (sample H2057) and two MOCVD GaN samples (s1587 and s1562a) at T = 18 K. Curves for MOCVD samples are offset by 0.005 for clarity. ZPL and its phonon replicas are labeled as mn, where m and n denote the number of emitted pseudo-local phonons (with energy 39.6 meV) and LO phonons (91.5 meV), respectively. Reproduced with permission from [41].
Solids 06 00052 g004
Figure 5. Temperature dependence of PL lifetime for the YL1 band in GaN samples with the following concentrations of free electrons at room temperature, n (cm−3): 5 × 10¹⁶ (H1007), 7 × 10¹⁶ (H2057), 4 × 10¹⁷ (cvd3540), 2 × 10¹⁸ (cvd4044 and cvd3784). Reproduced with permission from [41].
Solids 06 00052 g005
Figure 6. PL spectra from ammonothermal GaN samples at T = 18 K. (a) Comparison of the YL2 band in AT GaN (Ammono) with the YL1 band in MOCVD GaN. (b) PL spectra from two AT GaN samples. Solid lines in (a) and dashed lines in (b) are calculated using Equation (6) with parameters from Table 2. Reprinted with permission from [39,42].
Solids 06 00052 g006
Figure 7. PL spectra of the YL3 band at T = 18 K. Solid circles represent the normalized TRPL spectrum (at time delay of 100 µs), and the thin black solid line shows the SSPL spectrum at Pexc = 0.007 Wcm−2. The thick light green line is calculated as a superposition of PL involving three phonon modes. Reprinted from [44].
Solids 06 00052 g007
Figure 8. The RL1 band in HVPE GaN. (a) Low-temperature PL spectrum at low Pexc. The shapes of the RL1, YL1, and GL1 bands, shown with dashed lines, are calculated using Equation (6) with parameters from Table 2. The thick dotted line shows the sum of these three components. (b) Temperature dependence of the RL1 lifetime (open circles) and its SSPL intensity (filled triangles). The lines are calculated using Equation (2) with EA = 1.0 eV (solid line), EA = 1.1 eV (dashed line), and the following other parameters (for both lines): Cp = 3 × 10⁻⁷ cm3s−1, τ0 = 150 μs, (1 − η0) = 1.
Solids 06 00052 g008
Figure 9. Parameters of defect-related PL bands in GaN. (a) Hole-capture coefficients. (b) Electron-capture coefficients. Reprinted from [34].
Solids 06 00052 g009
Figure 10. RL2 band in MBE GaN. (a) SSPL spectra at T = 17 K. The spectral components are fitted using Equation (6) with parameters from Table 2. (b) Temperature dependence of SSPL intensity and PL lifetime for the RL2 band. Lines are the fits with equations obtained with a phenomenological model described in [37]. Reprinted with permission from [37].
Solids 06 00052 g010
Figure 11. RY3 defect in HVPE GaN. (a) Evolution of the PL spectrum with temperature. (b) Temperature dependence of the PL quantum efficiency for the RL3 and YL3 components of the RY3 band. Reprinted with permission from [38].
Solids 06 00052 g011
Figure 12. Electron and hole transitions associated with the RY3 defect in GaN. (a) Band diagram. (b) Configuration coordinate diagram. A is the ground state of the RY3 center in n-type GaN (negatively charged acceptor); A10 is the ground state of the neutral acceptor with a strongly localized hole; A20 is the deep excited state with a localized hole; A30 is the shallow excited state with a weakly localized hole. Transitions 3 and 4 are responsible for the RL3 and YL3 components of the RY3 band. Reprinted with permission from [38].
Solids 06 00052 g012
Figure 13. PL bands in AT GaN. (a) Low-temperature PL spectra from AT n+-GaN annealed in N2 under atmospheric pressure at selected Tann. Dashed lines are calculated using Equation (6) with parameters from Table 2. (b) Calculated charge transition levels of defect complexes containing VGa, Hi, and ON. Solid horizontal bars represent levels that participate in electron-hole recombination and possible PL in conductive n-type GaN. Dashed bars correspond to levels inactive under these conditions and therefore unobservable in PL. Vertical arrows show candidate radiative transitions, with indicated photon energies corresponding to ħωmax (not the ZPL). Reprinted with permission from [39].
Solids 06 00052 g013
Figure 14. The GL1 band in HVPE GaN (sample AH1177 from Kyma). (a) SSPL spectra at two excitation intensities, normalized by Pexc. Dashed lines are calculated using Equation (6) with parameters from Table 2. Empty circles show the sum of three calculated components at Pexc = 2 × 10⁻⁶ Wcm−2. (b) TRPL spectra at selected time delays. Lines are calculated using Equation (6) with parameters from Table 2.
Solids 06 00052 g014
Figure 15. GL1 band in HVPE GaN. (a) Schematics of transitions. The defect becomes positively charged after capturing two holes. In the electron-hole recombination process, a free electron is first captured at the excited state (level 1) by the Lax mechanism, a nonradiative process. Then, the internal transition from level 1 to level 2 causes the GL1 band. The PL lifetime in TRPL experiments is dictated by the slower of these two processes. The inset shows the shape of the GL1 band at 30 K (note the log scale). (b) The temperature dependence of the PL lifetime (solid triangles) and the peak PL intensity after a laser pulse (empty squares) for the GL1 band. The solid lines are τ(T) = τ1 + τ2 and IPLmax(T) calculated using Equation (8). The calculated τ1 and τ2 components are shown with the dashed and dotted lines, respectively. The inset shows the decay kinetics at 100 K. Reprinted with permission from [144].
Solids 06 00052 g015
Figure 16. GL2 band. (a) SSPL spectra form undoped MBE-grown GaN at T = 17 K and two excitation intensities (Pexc = 0.00065 and 0.13 Wcm−2). The dashed line is calculated using Equation (6) with parameters from Table 2. (b) Normalized PL spectra at T = 18 K for two GaN:Mg samples. W0 = 0.234 eV. Reproduced with permission from [47].
Solids 06 00052 g016
Figure 17. GL2 band in GaN. (a) Configuration coordinate diagram for the GL2 band. Potential 1 is the ground state. Potential 2 is identical to 1 but shifted up by Eg. Potential 2* describes the defect that captured an electron at a shallow excited state located at E1 below the CBM. Potential 3 corresponds to the excited state of the defect after it additionally captured a hole at the +/2+ level located at E2 above the VBM. (b) Temperature dependence of the GL2 intensity at three excitation intensities (divided by Pexc) and the GL2 lifetime. The line is calculated using Equation (2) with EA = E1 = 0.15 eV and C = 4 × 10⁶.
Solids 06 00052 g017
Figure 18. Blue PL bands in undoped GaN grown by MOCVD. (a) The ZnGa-related BL1 band at T = 13 K. The filled circles are the experiment, and the line is the simulation. The superposition of two phonon modes (ħΩLO = 91.5 meV and ħΩ1 = 36 meV) explains the fine structure. The inset shows the BL1 shift with Pexc. Reproduced with permission from [50]. (b) Normalized PL spectra of the CNHi-related BL2 band. The dashed black curve is calculated using Equation (6) with parameters from Table 2. The inset shows the extracted fine structure (solid black curve) and its deconvolution into Gaussian peaks (dashed orange curve). The BL2 fine structure is formed by a superposition of three phonon modes (ħΩLO = 91.2 meV, ħΩ1 = 35.4 meV, and ħΩ2 = 61 meV).
Solids 06 00052 g018
Figure 19. BL2 band in undoped GaN. (a) Evolution of the high-energy side of the BL2 band in MOCVD GaN:C (sample MD9856) with increasing temperature at Pexc = 0.02 Wcm−2. A high-energy shoulder, labeled e-D, is attributed to electron transitions from the CBM to the ground state of the CNHi donor. (b) Temperature dependence of the BL2 intensity (normalized at T = 30 K) for selected Pexc. Lines are calculated using Equation (2) with EA = 165 meV. The inset shows the dependence of the critical temperature T0 on the electron-hole generation rate G fitted with Equation (3). Reproduced with permission from [55].
Solids 06 00052 g019
Figure 20. The BL3 band in undoped HVPE GaN at Pexc = 100 Wcm−2 and T = 30 K. (a) SSPL spectra from samples with strong (H102 and H106) and weak (H201) RY3 band. The ZPL and LO phonon replicas of the free exciton (FE), UVLMg, and BL3 are indicated by arrows and vertical bars, respectively. The long-dashed and short-dashed lines show the contribution of the GL1 and YL1 bands to the spectra simulated using Equation (6) with parameters from Table 2. (b) Fine structure at the high-energy side of the BL3 band. The solid curves are SSPL spectra, and the filled circles depict the TRPL spectrum obtained at a time delay of ~5 ns. Two sets of phonon replicas of the ZPL and ZPL* peaks are observed: the LO phonon mode with ħΩLO = 91.3 meV and two pseudo-local phonon modes with ħΩ1 = 39.6 meV and ħΩ2 = 68.2 meV. Reproduced with permission from [56].
Solids 06 00052 g020
Figure 21. The YL1 and BLC bands in GaN:C,Si (n0 = 7.5 × 1017 cm−3) at T = 18 K. (a) SSPL spectra at low and high excitation intensity. PL intensity is normalized to Pexc for the convenience of comparison. (b) Comparison of SSPL (Pexc = 150 Wcm−2) and TRPL (at indicated time delays) spectra. Dashed lines are calculated using Equation (6) with parameters from Table 2. Reproduced with permission from [25].
Solids 06 00052 g021
Figure 22. Transitions leading to YL1 and BLC in C-doped GaN. (a) Schematic band diagram with transitions leading to YL1 and BLC. (b) Configuration coordinate diagram for the CN defect in GaN. E01 and E02 are the ZPLs of the YL1 and BLC bands, respectively. The upward red and purple arrows correspond to the generation of free electrons and holes by photons with the energy equal to Eg. Reproduced with permission from [25].
Solids 06 00052 g022
Figure 23. Fine structure of the BLC band in C-doped GaN. (a) Transformation of PL spectrum at Pexc = 100 Wcm−2 with temperature. The ZPL of the BLC band at 3.172 eV decreases, and a shoulder “+20 meV” increases with temperature. (b) Fine structure of the BLC band after subtracting the smooth component. Two LO phonon replicas of the ZPL at distances integer of ħΩLO = 91.2 meV and several pseudo-local phonon replicas (labeled with n = 1, 2, 3) with ħΩ1 = 34.3 meV are indicated. Reproduced from [60].
Solids 06 00052 g023
Figure 24. Interplay between YL1 and BL2 in MOCVD-grown GaN at T = 18 K, Pexc = 10−4 Wcm−2. (a) PL spectra before and after 80 min of continuous excitation with a HeCd laser at Pexc = 0.13 Wcm−2. The thin dashed lines are calculated using Equation (6) with parameters from Table 2. (b) Thermal annealing effects: annealing in N2 at 850 °C for one hour quenches BL2 (by > 103), while additional annealing in H2 + N2 at 850 °C for 1 h restores its intensity. Dashed lines are calculated using Equation (6) with parameters from Table 2. The BLc band is caused by electron transitions via the 0/+ level of the CN defect (Section 4.1.1). Reprinted with permission from [55].
Solids 06 00052 g024
Figure 25. The effect of thermal annealing on the YL1 and BL2 bands in MOCVD GaN. (a) The YL1 intensity (T = 18 K and Pexc = 10−4 Wcm−2) vs annealing temperature (lines are guides to the eye): (1) Solid squares—separate 5 × 5 mm pieces were annealed for one hour in N2 ambient at selected Tann (350–1000 °C). (2) Empty squares—YL1 intensity in another piece after sequential 30 min annealing in vacuum at (100–350 °C). (3) Empty triangles—after annealing in vacuum at 400 °C, the YL1 intensity was fully restored by a 2 h HeCd laser exposure (Pexc = 0.13 Wcm−2) at T = 80 K, and the sample was in situ annealed in vacuum (25–400 °C). (b) Evolution of PL spectrum at 80 K after consecutive 30-min-long steps of in situ annealing in vacuum (corresponding to condition (3)) at indicated temperatures. Reprinted from [188].
Solids 06 00052 g025
Figure 26. The RLC band in C-doped GaN. (a) PL spectra excited with above-bandgap (3.815 eV) and below-bandgap (2.805 eV) light are shown with light gray curves. The PLE spectrum of the 1.62 eV band is shown with filled squares. Reproduced from [33]. (b) Configuration-coordinate diagram with transitions explained in the text.
Solids 06 00052 g026
Figure 27. Normalized SSPL and TRPL spectra at T = 17 K from MOCVD-grown GaN co-doped with C (7 × 1017 cm−3) and Si (1.4 × 1018 cm−3). The orange dashed line is calculated using Equation (6) with parameters for the YL1 band from Table 2. The dotted curve with a maximum at 2.5 eV illustrates the maximum possible contribution from CNSiGa complexes.
Solids 06 00052 g027
Figure 28. PL bands in Be-doped GaN. (a) Normalized PL spectra at T = 18 K from MBE-grown GaN:Be (as-grown and annealed at 800 °C) and two MOCVD GaN:Be (R68 and R87). The dashed line is calculated using Equation (6) with parameters from Table 2. The UVLBe band appears in MBE GaN:Be samples only after thermal annealing. In MOCVD GaN:Be, the UVLBe band is strong in some samples (such as R87) but cannot be resolved in others (R68). The MgGa-related UVLMg band in MOCVD GaN:Be samples is from Mg contamination. Reproduced from [46]. (b) Schematic energy level diagram of main Be-related defects. Electron transitions from the conduction band (or shallow donors at T < 50 K) to Be1 and Be2 levels of BeGa produce the YLBe band; transitions to the shallow Be3 level of BeGa yield the UVLBe3 band. The UVLBe band at 3.38 eV is attributed to BeGaONBeGa complexes. The BLBe band is proposed to originate from transitions via the 0/+ level of BeGa.
Solids 06 00052 g028
Figure 29. Two-step quenching of the YLBe band in GaN:Be. (a) Temperature dependences of PL lifetimes for the YLBe (filled circles) and UVLBe3 (empty squares) and the YLBe intensity (solid line) in n-type GaN:Be. (b) Temperature dependence of the YLBe intensity (normalized at 18 K) in SI GaN:Be for two detection geometries. The YLBe intensity decrease at T > T1 for the “PL from face” case is caused by the drop in extraction efficiency, not IQE loss. Reproduced with permission from [45].
Solids 06 00052 g029
Figure 30. TheUVLBe3 band in GaN:Be. (a) SSPL spectra from MBE-grown n-type GaN:Be (sample 0020–1) at selected temperatures. (b) Temperature dependence of UVL peak position in MOCVD-grown SI GaN:Be (sample R134). The UVLMg band is quenched at T ≈ 130 K (Pexc = 0.0047 W/cm2) or T ≈ 170 K (Pexc = 0.13 W/cm2) by the TAQ mechanism. At these temperatures, the UVLMg band is replaced with the UVLBe3 band. Reproduced with permission from [45,46].
Solids 06 00052 g030
Figure 31. Effect of temperature on PL from the BeGa acceptor in GaN. (a) Temperature dependence of the integrated UVLBe3 and YLBe intensities ratio in two GaN:Be samples. The lines are calculated using Equation (9) with the following parameters: ΔE = 140 meV, δ = 18 (solid line), and ΔE = 145 meV, δ = 35 (dashed line). The dotted line is calculated using Equation (2) with C = 2 × 10⁸ and EA = 200 meV. The arrows show the critical temperature of the YLBe quenching. Reproduced from [46]. (b) Tunable and abrupt quenching of the YLBe band in p-type GaN:Be.
Solids 06 00052 g031
Figure 32. The UVLBe band in GaN:Be. (a) SSPL spectra at T = 18 K and Pexc = 0.005 Wcm−2 (normalized to the UVLBe peak) for two Be-doped GaN samples grown by MOCVD (R87 is as-grown GaN:Be and R96 is GaN:Be annealed at 1000 °C). The spectra are red-shifted by 8 meV to compensate for shifts due to biaxial strain in GaN/sapphire layers. The blue, green and black vertical lines indicate ZPLs and their LO-phonon replicas. The red vertical lines show the phonon replicas of the UVLBe (DAP) ZPL associated with the pseudo-local phonon mode (37.5 meV, see Table 3). (b) SSPL spectra at T = 18 K from MBE-grown GaN:Be (sample 0408a) annealed in N2 for one hour at selected temperatures. For Tann = 400 °C, the PL spectrum between 3.2 and 3.4 eV reveals LO phonon replicas of excitonic lines and no trace of the UVLBe band. Reproduced with permission from [64].
Solids 06 00052 g032
Figure 33. The RLBe band associated with the BeGaVN complex in MBE GaN:Be. (a) SSPL and TRPL (at 1 μs) spectra. The dashed lines are calculated using Equation (6) with parameters from Table 2. (b) IPL(T) and τ(T) dependences for the RLBe band. The solid line is calculated using Equation (2) with C = 1.5 × 10⁴ and EA = 70 meV, and the dashed line is 0.55·exp(2.5meV/kT).
Solids 06 00052 g033
Figure 34. The BLBe band in GaN:Be. (a) SSPL spectra at T = 18 K (divided by Pexc). Dashed lines are calculated using Equation (6) with parameters from Table 2. The × symbols show the sum of calculated YLBe and BLBe spectra at Pexc = 100 Wcm−2. (b) TRPL spectra at t = 0.5 μs (filled symbols) and t = 50 μs (empty symbols) at T = 18 K and P0 = 5 × 1023 cm−2s−1. The data at 50 μs is multiplied by a factor of 20. Dashed lines are calculated using Equation (6) with parameters from Table 2. Reproduced with permission from [61].
Solids 06 00052 g034
Figure 35. The UVLMg band in Mg-doped GaN. (a) Evolution of the PL spectrum with temperature for n-type GaN:Mg ([Mg] = 1.3 × 1017 cm−3) grown by HVPE. Reproduced with permission from [62]. (b) PL spectra at T = 2 K for p-type GaN:Mg samples grown by MBE. Reproduced with permission from [169].
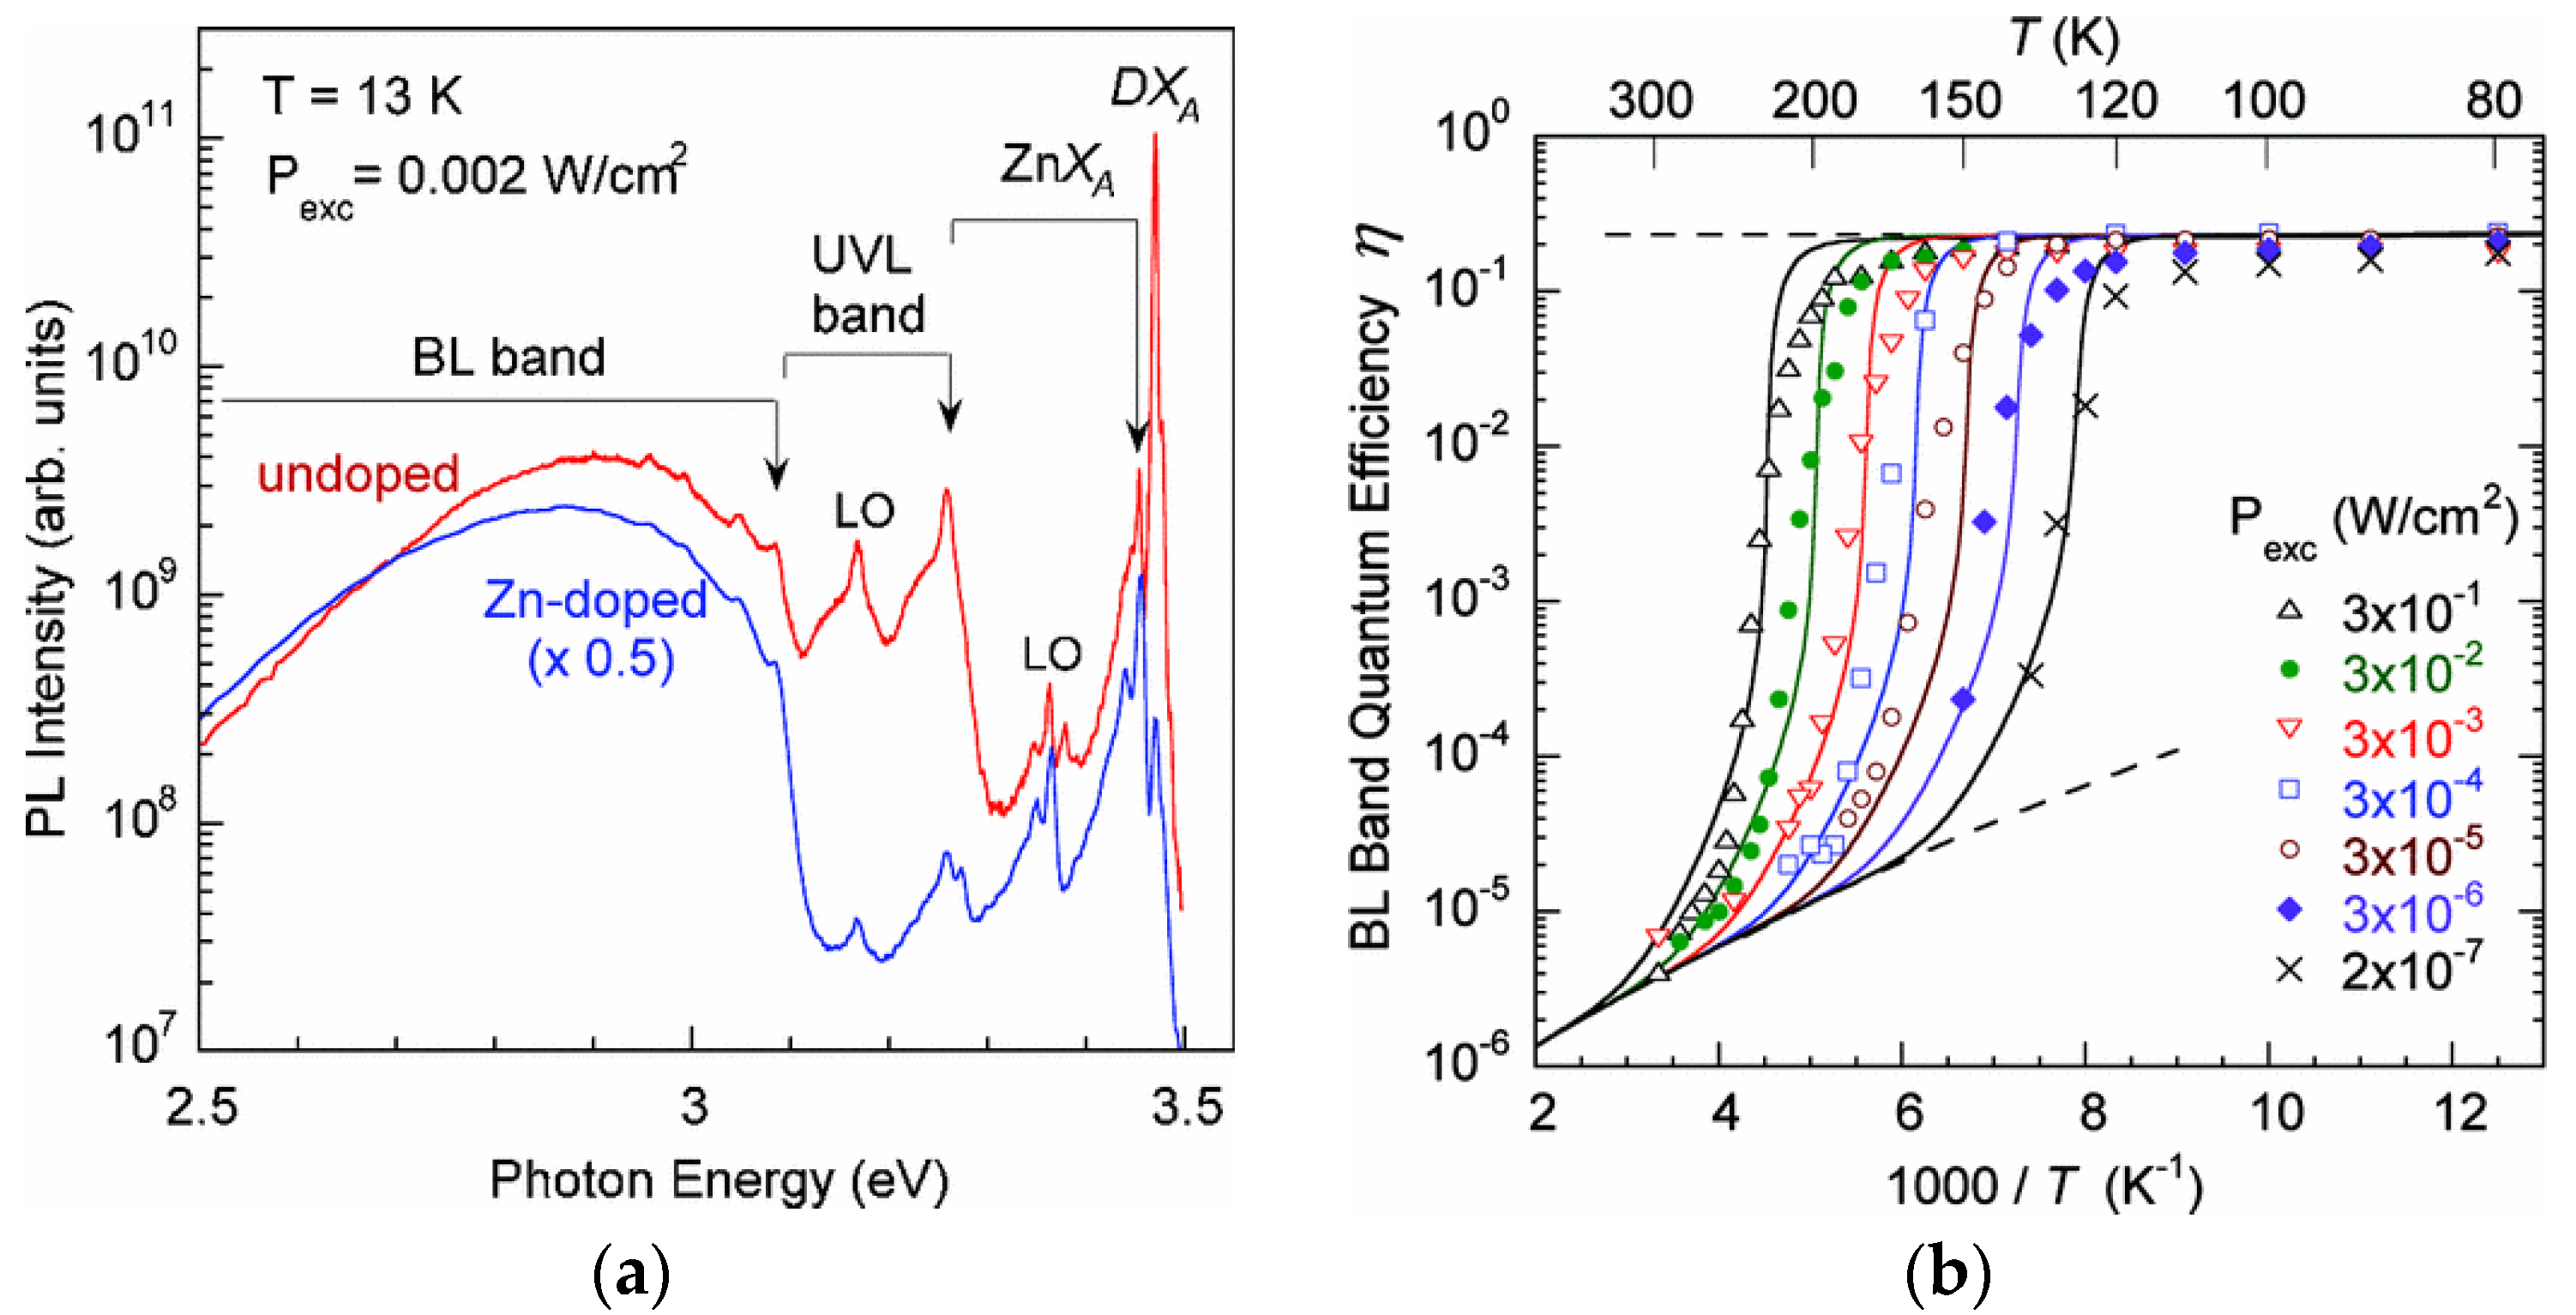
Solids 06 00052 g035
Figure 36. The BLMg band at 130 K in Mg-doped p-type GaN ([Mg] = 2 × 1019 cm−3) grown by HVPE. (a) Normalized SSPL spectra at selected excitation intensities. (b) Evolution of the TRPL spectrum after a laser pulse. Reproduced with permission from [62].
Solids 06 00052 g036
Figure 37. Excitation-induced shifts in PL bands in HVPE-grown GaN:Mg (a) PL spectra from SI GaN:Mg at T = 100 K and selected excitation power densities. PL intensity is normalized by Pexc. The UVL band does not shift, while the UVL* band shifts monotonously to lower energies with decreasing Pexc. (b) Shift in PL band maxima with excitation intensity at T = 18 and 130 K. The BLMg band in p-type GaN:Mg (sample 1840) and the UVL* band in SI GaN:Mg (sample 3589). Reproduced with permission from [62].
Solids 06 00052 g037
Figure 38. The RLMg band in MBE-grown GaN:Mg. (a) Comparison of normalized SSPL and TRPL spectra (time delay is 1 μs). Dashed lines are calculated using Equation (6) with parameters from Table 2. (b) Temperature dependence of SSPL intensity and PL lifetime. The line is calculated using Equation (2) with C = 100 and EA = 35 meV.
Solids 06 00052 g038
Figure 39. The BLZn band in Zn-doped GaN. (a) PL spectra from undoped GaN and Zn-doped GaN at T =13 K (not multiplied by λ3). Arrows indicate the ZPLs for the BLZn and UVLMg bands, as well as the ZnXA exciton. (b) Tunable and abrupt quenching of the BLZn band in high-resistivity Zn-doped GaN for excitation power densities Pexc between 2 × 10⁻⁷ and 0.3 W cm−2. Solid curves represent numerical solutions of rate equations. Reproduced with permission from [52].
Solids 06 00052 g039
Figure 40. Tunable and abrupt quenching of the BLZn band in GaN. (a) Temperature dependence of BLZn intensity at selected excitation intensities for Zn-doped GaN unintentionally contaminated with Mg. Solid curves represent numerical solutions of rate equations. Reproduced with permission from [261]. (b) Dependence of the BLZn quantum efficiency on excitation power density at selected temperatures in high-resistivity GaN:Zn. Solid and dashed curves are calculated for p-type and n-type, respectively. Reproduced with permission from [262].
Solids 06 00052 g040
Figure 41. CdGa-related BLCd band. (a) Normalized SSPL (at selected Pexc) and TRPL (at selected delay times) spectra for GaN:Cd at T = 18 K. Dashed and solid lines correspond to Pexc = 0.13 Wcm−2 and 10−4 Wcm−2, respectively. (b) Temperature dependences of SSPL intensity and PL lifetime of the BLCd, NBE, and UVLMg bands in Cd-implanted n-type GaN annealed at 1100 °C. Solid lines are calculated using Equation (2) with the following parameters: τ0 = 3 × 10⁻⁶ s, Cp = 3 × 10⁻⁷ cm3s−1, and EA = 435 meV (BLCd); τ0 = 3.5 × 10⁻⁷ s, Cp = 1 × 10⁻⁶ cm3s−1, and EA = 170 meV (UVLMg). Reproduced from [48].
Solids 06 00052 g041
Figure 42. CaGa-related GLCa band. (a) PL spectra from n-type GaN samples implanted with Ca. Dashed lines are calculated using Equation (6) with parameters from Table 2. Circles show the TRPL spectrum for sample F at 20 μs delay (shifted vertically to align with the SSPL). (b) PL spectra from undoped MBE GaN samples. Dashed lines are calculated using Equation (6) with parameters from Table 2. The × symbols show the sum of the two calculated curves. Reproduced with permission from [49].
Solids 06 00052 g042
Figure 43. CaGaVN-related RLCa band in GaN implanted with Ca. (a) Comparison of normalized SSPL and TRPL (time delay is 1 ms) spectra. Dashed lines are calculated using Equation (6) with parameters from Table 2. (b) Temperature dependence of SSPL intensity and PL lifetime for the RLCa band in two GaN:Ca samples (implanted at room temperature and at 500 °C). The line is calculated using Equation (2) with C = 106 and EA = 250 meV.
Solids 06 00052 g043
Figure 44. HgGa-related GLHg band in GaN. (a) Comparison of the SSPL (at Pexc = 0.005 Wcm−2) and TRPL (time delays of 1 and 3 μs) spectra at T = 18 K. The arrow indicates the expected position of the ZPL (2.73 eV), where the PL intensity abruptly drops. The dashed line is calculated using Equation (6) with parameters from Table 2. (b) Temperature dependences of PL intensity and PL lifetime of the GLHg band in Si-doped GaN implanted with Hg and annealed at 1200 °C. Solid line is calculated using Equation (2) with τ0 = 1.3 µs and the following fitting parameters: Cp = 1.2 × 10⁻⁷ cm3s−1, and EA = 630 meV. The inset shows PL spectra at selected temperatures. Reproduced from [48].
Solids 06 00052 g044
Figure 45. Low-temperature PL spectra from ion-implanted GaN. (a) RL5 band (~1.6 eV) in GaN samples implanted with Cd, Ca, Hg, F, and Cl. (b) Normalized PL spectra from SI GaN implanted with F, Cl, and co-implanted with Be and F. Dashed lines show deconvolution of the PL spectrum for GaN:Cl using Equation (6). Parameters for OL1 and YL1 bands are given in Table 2, and parameters for the GLX component are: Se = 3, E0* = 3 eV, and ħωmax = 2.5 eV.
Solids 06 00052 g045
Figure 46. Dependences of PL intensity on defect concentration. The UVL, BL1, and YL1 bands are related to the MgGa, ZnGa, and CN acceptors, respectively. Reproduced from [34].
Solids 06 00052 g046
Table 1. Classification and main parameters of defect-related PL bands in GaN.
DopantPL Bandħωmax (eV)ZPL (eV)EA (eV)FWHM (eV)Cp (cm3s−1)Cn (cm3s−1)τ (μs) a)AttributionCommentsRef.
CRLC1.62 CN-CGa-CN ? [C] > 1018 cm−3[33]
RL11.75 ~1.10.423 × 10−74.3 × 10⁻¹⁴ Cl? (−/0)?HVPE GaN[34]
RL21.74 ~10.35 1000AVN? (0/+)?SI, Ga-rich GaN[16,35,36,37]
MgRLMg1.67 ~0.90.41 1.3MgGaVN (0/+) [36]
BeRLBe1.77 ~0.80.44 3BeGaVN (0/+) [36]
CaRLCa1.82 ~1.00.43 1900CaGaVN (0/+) [36]
RL31.77 ~2.80.38~10−5 0.010RY3 (−/0)HVPE GaN[38]
RL41.6–1.7 ~1.2~0.44 VGa3ON ? (0/+)?AT GaN[39]
F,Cl,Cd,Ca,HgRL5~1.6 ?Implantation damage
FOL11.88 ~0.47 VGaFN?
-OL32.09 ~0.47 VGaON2Hi? (0/+)?AT GaN[39]

C
YL1, YLC2.192.590.9160.433.7 × 10−71.1 × 10⁻¹³ CN (−/0)Omnipresent, MOCVD[25,40,41]
YL22.3 ~0.6~0.49 VGa3Hi ? (0/+)?AT GaN[39,41,42]
YL32.072.381.1300.40~10−72 × 10−13 RY3 (−/0)HVPE GaN[38,41,43,44]
BeYLBe2.15 0.340.57~1 × 10−61 × 10−13 BeGa (−/0) YLBe1, YLBe2[45,46]
GL12.35 ~0.50.48 1? (0/+)HVPE GaN[34]
GL22.33 ~0.50.24 300VN (+/2+)SI, Ga-rich GaN[34,47]
HgGLHg2.44 0.80.39(1–5) × 10−73 × 10−13 HgGa (−/0) [48]

Ca
GLCa2.49 0.500.436 × 10−71 × 10−13 CaGa (−/0)undoped MBE[49]

Zn
BL1, BLZn2.863.100.4000.365 × 10−76.8 × 10⁻¹³ ZnGa (−/0)Dual nature?[34,50,51,52,53,54]

C
BL23.003.330.150.424.5 × 10−8 0.3CNHi (0/+)Bleaching[55]
BL32.83.01~0.460.45~10−9 0.001RY3 (0/+)HVPE GaN[56]
PBLP2.893.200.290.37 PN (0/+) [57,58]
AsBLAs2.62.950.54~0.4 0.09AsN (0/+) [57]
CdBLCd2.702.950.550.353 × 10−72.6 × 10⁻¹³ CdGa (−/0) [48,59]
CBLC2.853.150.33~0.4310−10 ? 0.001CN (0/+) [25,60]
BeBLBe2.6 0.150.57~10−8 0.8BeGa (0/+) ? [61]
MgBLMg~2.8 0.22~0.3 DD→MgGaLarge shifts[62,63]

Mg
UVL, UVLMg3.283.280.2230.011 × 10−63.2 × 10⁻¹² MgGa (−/0)Dual nature?[40,62,63]
BeUVLBe3.383.380.1130.01~1 × 10−61 × 10−11 BeGaONBeGa (−/0)Dual nature?[64]
a) τ at T ≈ 18 K for internal transitions, independent of n.
Table 2. Vibrational parameters of broad PL bands (at low temperatures).
PL Bandħωmax (eV)E0* (eV)SedFCg (eV)W0 (eV)ħΩe (eV)
RL11.732.39.50.570.42
RL21.742.312.50.560.350.033
RLMg1.672.6270.930.41
RLBe1.782.65200.870.440.042
RLCa1.822.23150.410.250.027
RL41.6–1.72.2690.56–0.660.44
OL11.882.6120.720.47
OL32.092.8130.710.47
YL1 2.172.677.80.500.430.056
YL22.302.867.30.560.49
YL32.072.455.00.380.400.06
YLBe2.153.2241.050.520.038
GL12.352.9710.30.620.480.041
GL22.332.7013.50.240.240.023
GLHg2.442.750.260.390.053
GLCa2.493.028.50.530.430.041
BL12.863.103.20.360.360.043
BL23.003.384.60.380.42
BL32.813.082.00.270.45
BLCd2.703.04.00.30.350.053
BLC2.853.203.70.350.43
BLP2.88 0.370.050
BLBe2.63.4120.80.57
BLMg2.83.15.00.40.31
Table 3. Pseudo-local and bulk crystal (LO) phonon modes for PL bands in GaN.
PL BandAttributionE0
(eV)
ħωmax (eV)ħΩLO (meV)ħΩ1 (meV)ħΩ2 (meV)ħΩ3 (meV)Reference
YL1 CN (−/0)2.572.1791.539.5[40]
YL3Fe? (−/0)2.382.07911936[43,44]
BL1ZnGa (−/0)3.102.869136[50]
BL2CNHi (0/+)3.333.091.235.461[55]
BL3Fe? (0/+)3.012.8191.339.668.2[56]
BLCCN (0/+)3.152.8591.234.3[60]
BLCdCdGa (−/0)2.952.70913974[48,59]
BLAsAsN (0/+)2.952.60913875[57]
BLPPN (0/+)3.202.899137–3973–77[57]
UVLMgMgGa (−/0)3.283.2891.5[62]
UVLBe3BeGa (−/0)3.263.2691.5[45,46]
UVLBeBeGaONBeGa (−/0)3.383.3891.537.5[64]
Disclaimer/Publisher’s Note: The statements, opinions and data contained in all publications are solely those of the individual author(s) and contributor(s) and not of MDPI and/or the editor(s). MDPI and/or the editor(s) disclaim responsibility for any injury to people or property resulting from any ideas, methods, instructions or products referred to in the content.