Article

Low-Temperature Synthesis and Photoluminescence Properties of Mg2TiO4:Mn4+ Phosphor Prepared by Solid-State Reaction Methods Assisted by LiCl Flux

1
Coloege of Rare Earth, Jiangxi University of Science and Technology, Ganzhou 341000, China
2
Guorui Kechuang Rare Earth Functional Materials (Ganzhou) Co., Ltd. (National Rare Earth Functional Materials Innovation Center), Ganzhou 341100, China
3
School of Materials Science and Engineering, Jiangxi University of Science and Technology, Ganzhou 341000, China
*
Author to whom correspondence should be addressed.
Solids 2025, 6(3), 53; https://doi.org/10.3390/solids6030053
Submission received: 14 August 2025 / Revised: 6 September 2025 / Accepted: 9 September 2025 / Published: 11 September 2025

Abstract

Mg2TiO4:Mn4+ (MTO:Mn4+) red phosphor has important applications in areas such as red LEDs and forensic science, but the preparation of MTO:Mn4+ through the solid-state reaction method requires a high sintering temperature. Herein, MTO:Mn4+ red phosphor was synthesized using the solid-state reaction method with LiCl flux, and its crystallographic structure and photoluminescence properties were studied to determine the influence of experimental parameters like the amount of fluxing agent added and sintering temperature in producing a bright red phosphor suitable for LEDs. The experimental results showed that samples with added LiCl could form pure MTO after sintering at 950 °C, whereas those without LiCl still contained a mixture of MTO and MgTiO3, even when sintered at 1400 °C. The optimal performance was achieved with a sample doped with 0.2 mol% Mn4+, synthesized using 50 wt% LiCl flux and sintered at 950 °C for 12 h. This sample exhibited a broad excitation band and a narrow red emission band peaking at 662 nm, confirming its excellent luminescence properties. Furthermore, a prototype red LED fabricated with a 377 nm chip and MTO:0.2% Mn4+ phosphor achieved photoelectric conversion efficiency of 78.5% at a 100 mA drive current, confirming its viability for high-performance red LED manufacturing.

Graphical Abstract

1. Introduction

Mn4+-doped oxide luminescent materials not only exhibit intense photoluminescence in the red band under blue–violet excitation but also have the advantages of inexpensive materials, environmentally friendly synthesis processes, and stable products [1,2,3]. These advantages make these luminescent materials promising candidates to replace Eu2+-doped silicate nitrides and nitrides as red phosphors for white light-emitting diodes (LEDs) [4]. The spin-allowed transitions 4A24T1 and 4A24T2 of Mn4+ ions in the octahedral sites result in two broad excitation bands in the ultraviolet and blue–green regions, while the spin-forbidden transition 2Eg4A2g causes the emission peaks of Mn4+ to present relatively narrow or broad emission bands in the red region [5]. Since the 3d electrons of Mn4+ are in the outermost shell of the atom, the positions and intensities of the emission peaks of Mn4+ ions are highly sensitive to the crystal field strength. Therefore, by choosing appropriate materials, the emission peak positions of Mn4+ ions can be adjusted within the range of 620 to 730 nm [1]. This indicates that Mn4+-activated luminescent materials have great application prospects in the field of lighting LEDs.
Among various oxide matrix materials, titanates not only possess excellent chemical and thermal stability but also do not require charge compensation when Ti4+ ions are replaced by Mn4+ ions, making them suitable as good hosts for Mn4+ doping. In recent years, various Mn4+-activated titanates have been developed as red phosphors, such as MTO:Mn4+ [6], LaTiO3:Mn4+ [7], Li2MgTiO4:Mn4+ [8], La2MgTiO6:Mn4+ [9], and BaMg6Ti6O19:Mn4+ [10]. Notably, the emission peak of MTO:Mn4+ phosphor is located near 660 nm, which is the shortest emission wavelength among different oxide matrices [11]. The MTO compound has an inverse spinel structure, where the octahedral sites are randomly occupied by Ti4+ and Mg2+ ions, while the tetrahedral sites are all occupied by Mg2+ ions. It has been reported that Mn4+ can replace Ti4+ ions and occupy the octahedral sites [12]. MTO:Mn4+ red phosphor is widely used in various fields, such as plant lighting, temperature measurement, the visualization of hidden fingerprints, the temperature imaging of living cells, and optical temperature sensors [13,14]. The previous literature has reported the preparation of MTO:Mn4+ red phosphors through both solid-state reaction and liquid-phase methods [3,5,12]. However, the liquid-phase method of preparing inorganic materials has disadvantages, such as a complex process, high costs, poor repeatability, and a low raw material utilization rate [15,16,17]. Although solid-state reaction is a convenient method of producing large quantities of phosphors, it has problems such as high sintering temperatures and large and uneven particle sizes. For fluorescent powders, adding a flux agent in the solid-phase reaction is an effective approach to reduce the sintering temperature and improve the morphologies and luminescent properties of the samples [18,19,20,21].
The synthesis of a pure MTO:Mn4+ compound by solid-state reaction is usually carried out at a temperature of 1300–1400 °C [13,22]. If the sintering temperature is too low, MTO:Mn4+ will show a strong tendency to decompose into MgO and MgTiO3. This study aims to synthesize a single-phase Mn4+-doped MTO phosphor using the solid-state reaction method, assisted by LiCl flux at a temperature below 1000 °C, and to improve the morphology and luminescence properties of the phosphor. By utilizing XRD, SEM, and other characterization techniques, this research systematically investigates the influence of the LiCl flux content and sintering temperature on the structural and morphological characteristics of the product, as well as its luminescence performance and corresponding CIE color coordinates. Additionally, the study offers insights into the potential mechanism underlying the formation of a secondary phase induced by the addition of excessive LiCl flux.

2. Materials and Methods

2.1. Sample Preparation

MnCO3 (99.95%, Macklin, Shanghai, China) and nanopowders of MgO (99.9%, Macklin, Shanghai, China) and anatase TiO2 (99.8%, Aladdin, Shanghai, China) were used as the raw materials, with LiCl (AR, Aladdin, Shanghai, China) serving as the fluxing agent (melting point ≈ 630 °C). All materials were used as received. TiO2, MgO, and MnCO3 were weighed according to the stoichiometric ratio for MTO:Mn4+ phosphors. An appropriate amount of anhydrous ethanol was added, and the mixture was ground thoroughly in an agate mortar. Subsequently, x wt% LiCl (relative to the precursor mass) was added and mixed rapidly and homogeneously. The mixed powder was transferred into a corundum crucible and sintered in a muffle furnace at 800–1400 °C for 12 h. After the furnace had naturally cooled to room temperature, all products were washed several times with deionized water to completely remove residual LiCl salts.
For comparison, parallel experiments were conducted where LiCl was replaced by Li2CO3 (AR, Aladdin, Shanghai, China) as the flux agent, following the same preparation steps described above. The sample designations and corresponding preparation parameters are listed in Table 1.

2.2. Property Characterization

The XRD pattern was recorded using a diffractometer (Bruker D8 Advanced, Karlsruhe, Germany) with Cu Kα radiation (λ = 0.154056 nm). Diffuse reflection (DR) spectra were measured in the ultraviolet–visible region using a UV–vis spectrophotometer equipped with an integrating sphere (Shimadzu UV-3100, Kyoto, Japan). Sample morphology was examined using an SEM (Quanta FEG 250, Waltham, MA, USA). Emission and excitation spectra were recorded using a fluorescence spectrometer (Edinburgh Instruments, FLS 980, Edinburgh, UK) equipped with a 450 W xenon lamp. All of the measurements were performed at room temperature.

2.3. Device Fabrication and Performance Measurements

Red LEDs were fabricated using 377 nm LED chips (3 W max) and MTO:Mn4+ red phosphor. The red phosphors were mixed with epoxy resin in certain proportions, and the mixture was evenly applied on a 377 nm ultraviolet chip to fabricate the red LED device. The electro-optical properties of the red LEDs, including the electroluminescence spectra and photoelectric efficiency, were characterized using an integrated photometric system, which was equipped with an array spectrophotometer (350–1100 nm, HAAS-2000 array spectrophotometer, Hangzhou, China) coupled to a Φ15 in integrating sphere (Labsphere Optics, North Sutton, NH, USA).

3. Results and Discussion

3.1. Structural and Morphological Properties

Figure 1 shows the XRD patterns of samples synthesized via solid-state reactions with and without LiCl flux at varying temperatures. Specifically, Figure 1a displays the patterns of samples sintered without LiCl flux within the temperature range of 950–1400 °C, while Figure 1b presents patterns from samples sintered with 50 wt% LiCl flux at 800–1050 °C. As shown in Figure 1a, the XRD patterns of samples MOT-1 and MOT-2, obtained by directly sintering the precursor at 950 °C and 1100 °C, respectively, without LiCl flux addition, do not belong to the material MTO, but they completely match the diffraction peaks of the standard card for MgTiO3 (JCPDS No. 06-0494). Although increasing the sintering temperature to 1300 °C leads to the emergence of MTO diffraction peaks in the XRD pattern, diffraction peaks corresponding to MgTiO3 persist. Even when the sintering temperature is raised to 1400 °C, these secondary-phase peaks remain clearly observable. These results collectively demonstrate the inherent difficulty in obtaining phase-pure MTO through conventional high-temperature solid-state synthesis. However, introducing LiCl flux during the reaction significantly promotes MTO formation. As demonstrated in Figure 1b, the XRD pattern of sample MTO-11, synthesized at 950 °C with 50 wt% LiCl flux, displays predominant diffraction peaks matching the standard MTO reference card (JCPDS No. 73-1723) with high fidelity, apart from minor impurity peaks at 43.3°, 63°, and 79.6°. These residual peaks are attributed to either MgO or intermediate compounds, and the specific details will be discussed later. Due to its relatively low melting point (approximately 630 °C), LiCl establishes a liquid-phase medium that facilitates precursor dissolution during sintering. This accelerates the nucleation kinetics of MTO and promotes the target reaction MgO + TiO2 → Mg2TiO4 (suppressing the parasitic formation of MgTiO3), thereby significantly lowering the synthesis temperature of MTO. When increasing the sintering temperature to 1050 °C, the more pronounced diffraction peaks indicate that the crystallinity of sample MTO-1 is higher. In addition, the positions of all diffraction peaks are consistent with those of MTO-11.
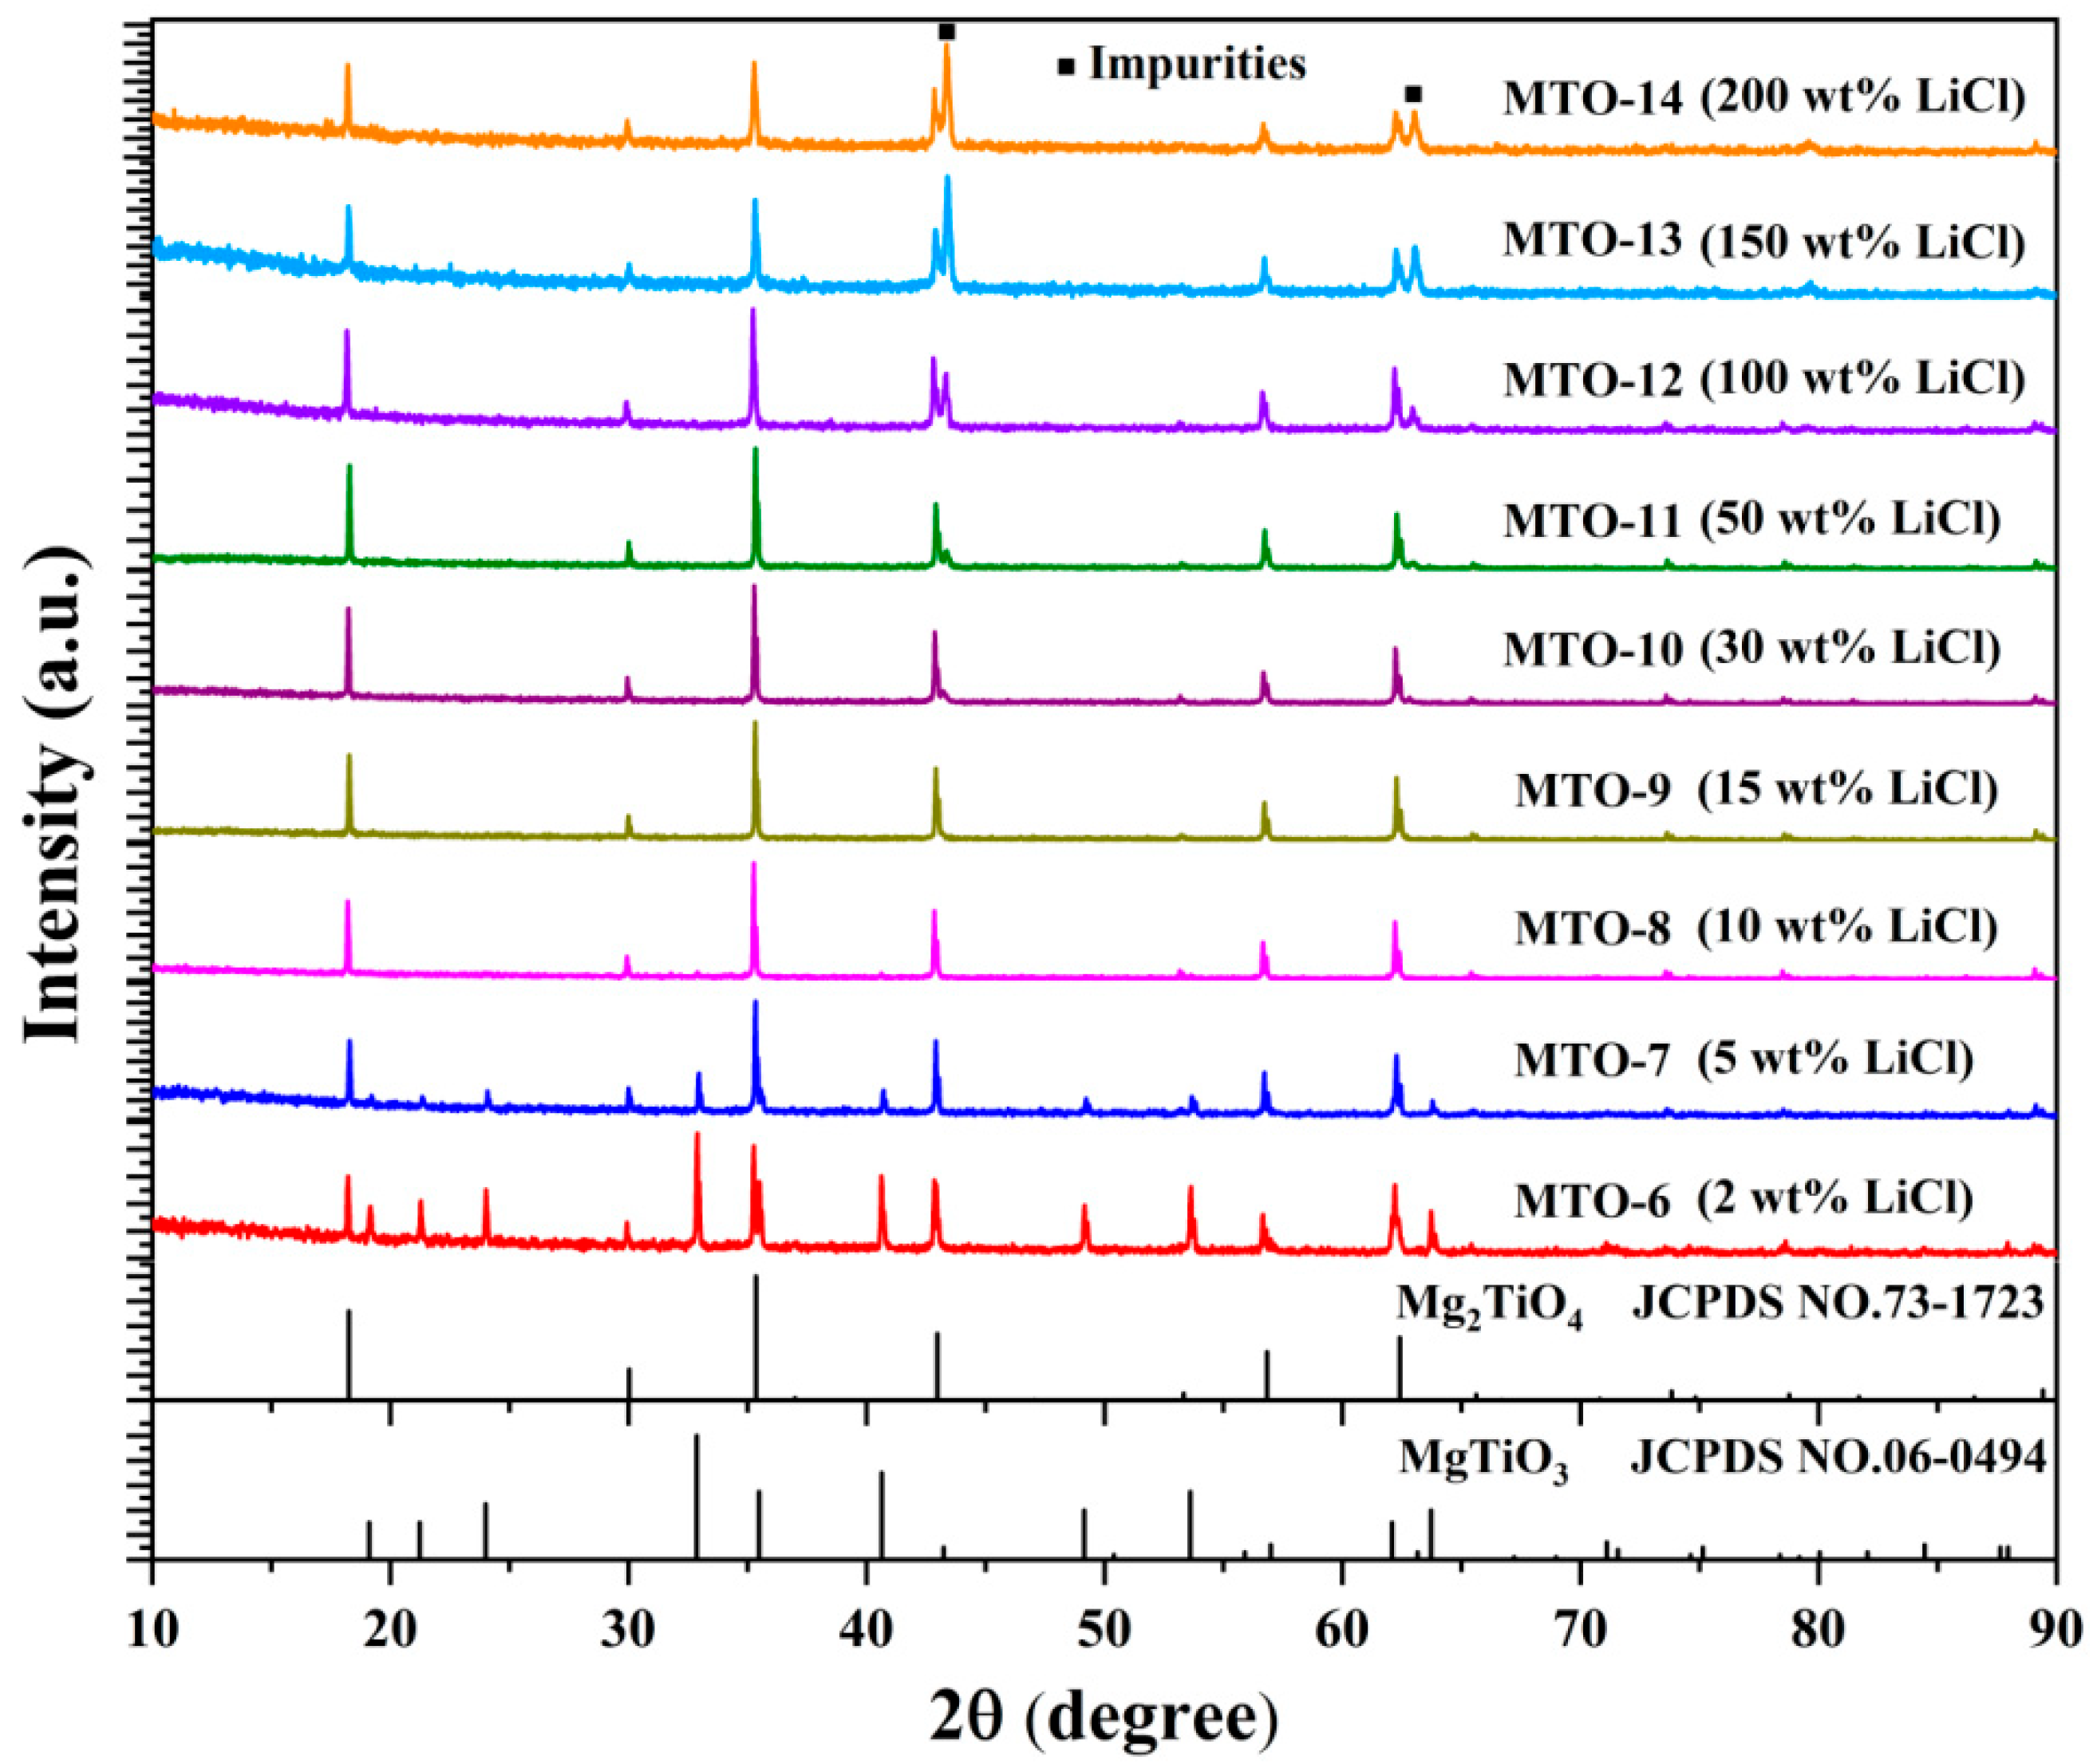
To investigate the influence of LiCl flux on MTO formation, samples with varying LiCl concentrations (2–200 wt%) were prepared. Figure 2 displays their XRD patterns after sintering at 950 °C. As can be seen from Figure 2, all samples with added LiCl flux contain only one or both of the MTO and MgTiO3 phases. Specifically, sample MTO-6, prepared with 2 wt% LiCl, is a mixture of MTO and MgTiO3. As the amount of LiCl increases, the content of MTO in the samples gradually increases until the LiCl addition reaches 15wt%, at which point sample MTO-9 becomes pure MTO. Its diffraction peaks completely match those of the MTO standard card, and the strong and sharp diffraction peaks of the samples indicate good crystallinity, which is conducive to enhancing the luminescence performance. Correspondingly, the MgTiO3 phase in the sample gradually weakens and disappears slowly as the LiCl addition amount increases from 2 wt% to 15 wt%. When LiCl addition was further increased to 30 wt%, impurity peaks began to appear in the XRD patterns of the resulting samples at diffraction angles of 43.3°, 63°, and 79.6°. The intensity of these impurity peaks progressively increased as the amount of LiCl addition rose from 30 wt% to 200 wt%, eventually becoming the strongest diffraction peak. The origin of these peaks will be shown later. The above results indicate that the addition of LiCl can effectively promote the formation of MTO, but excessive amounts will induce new phases.
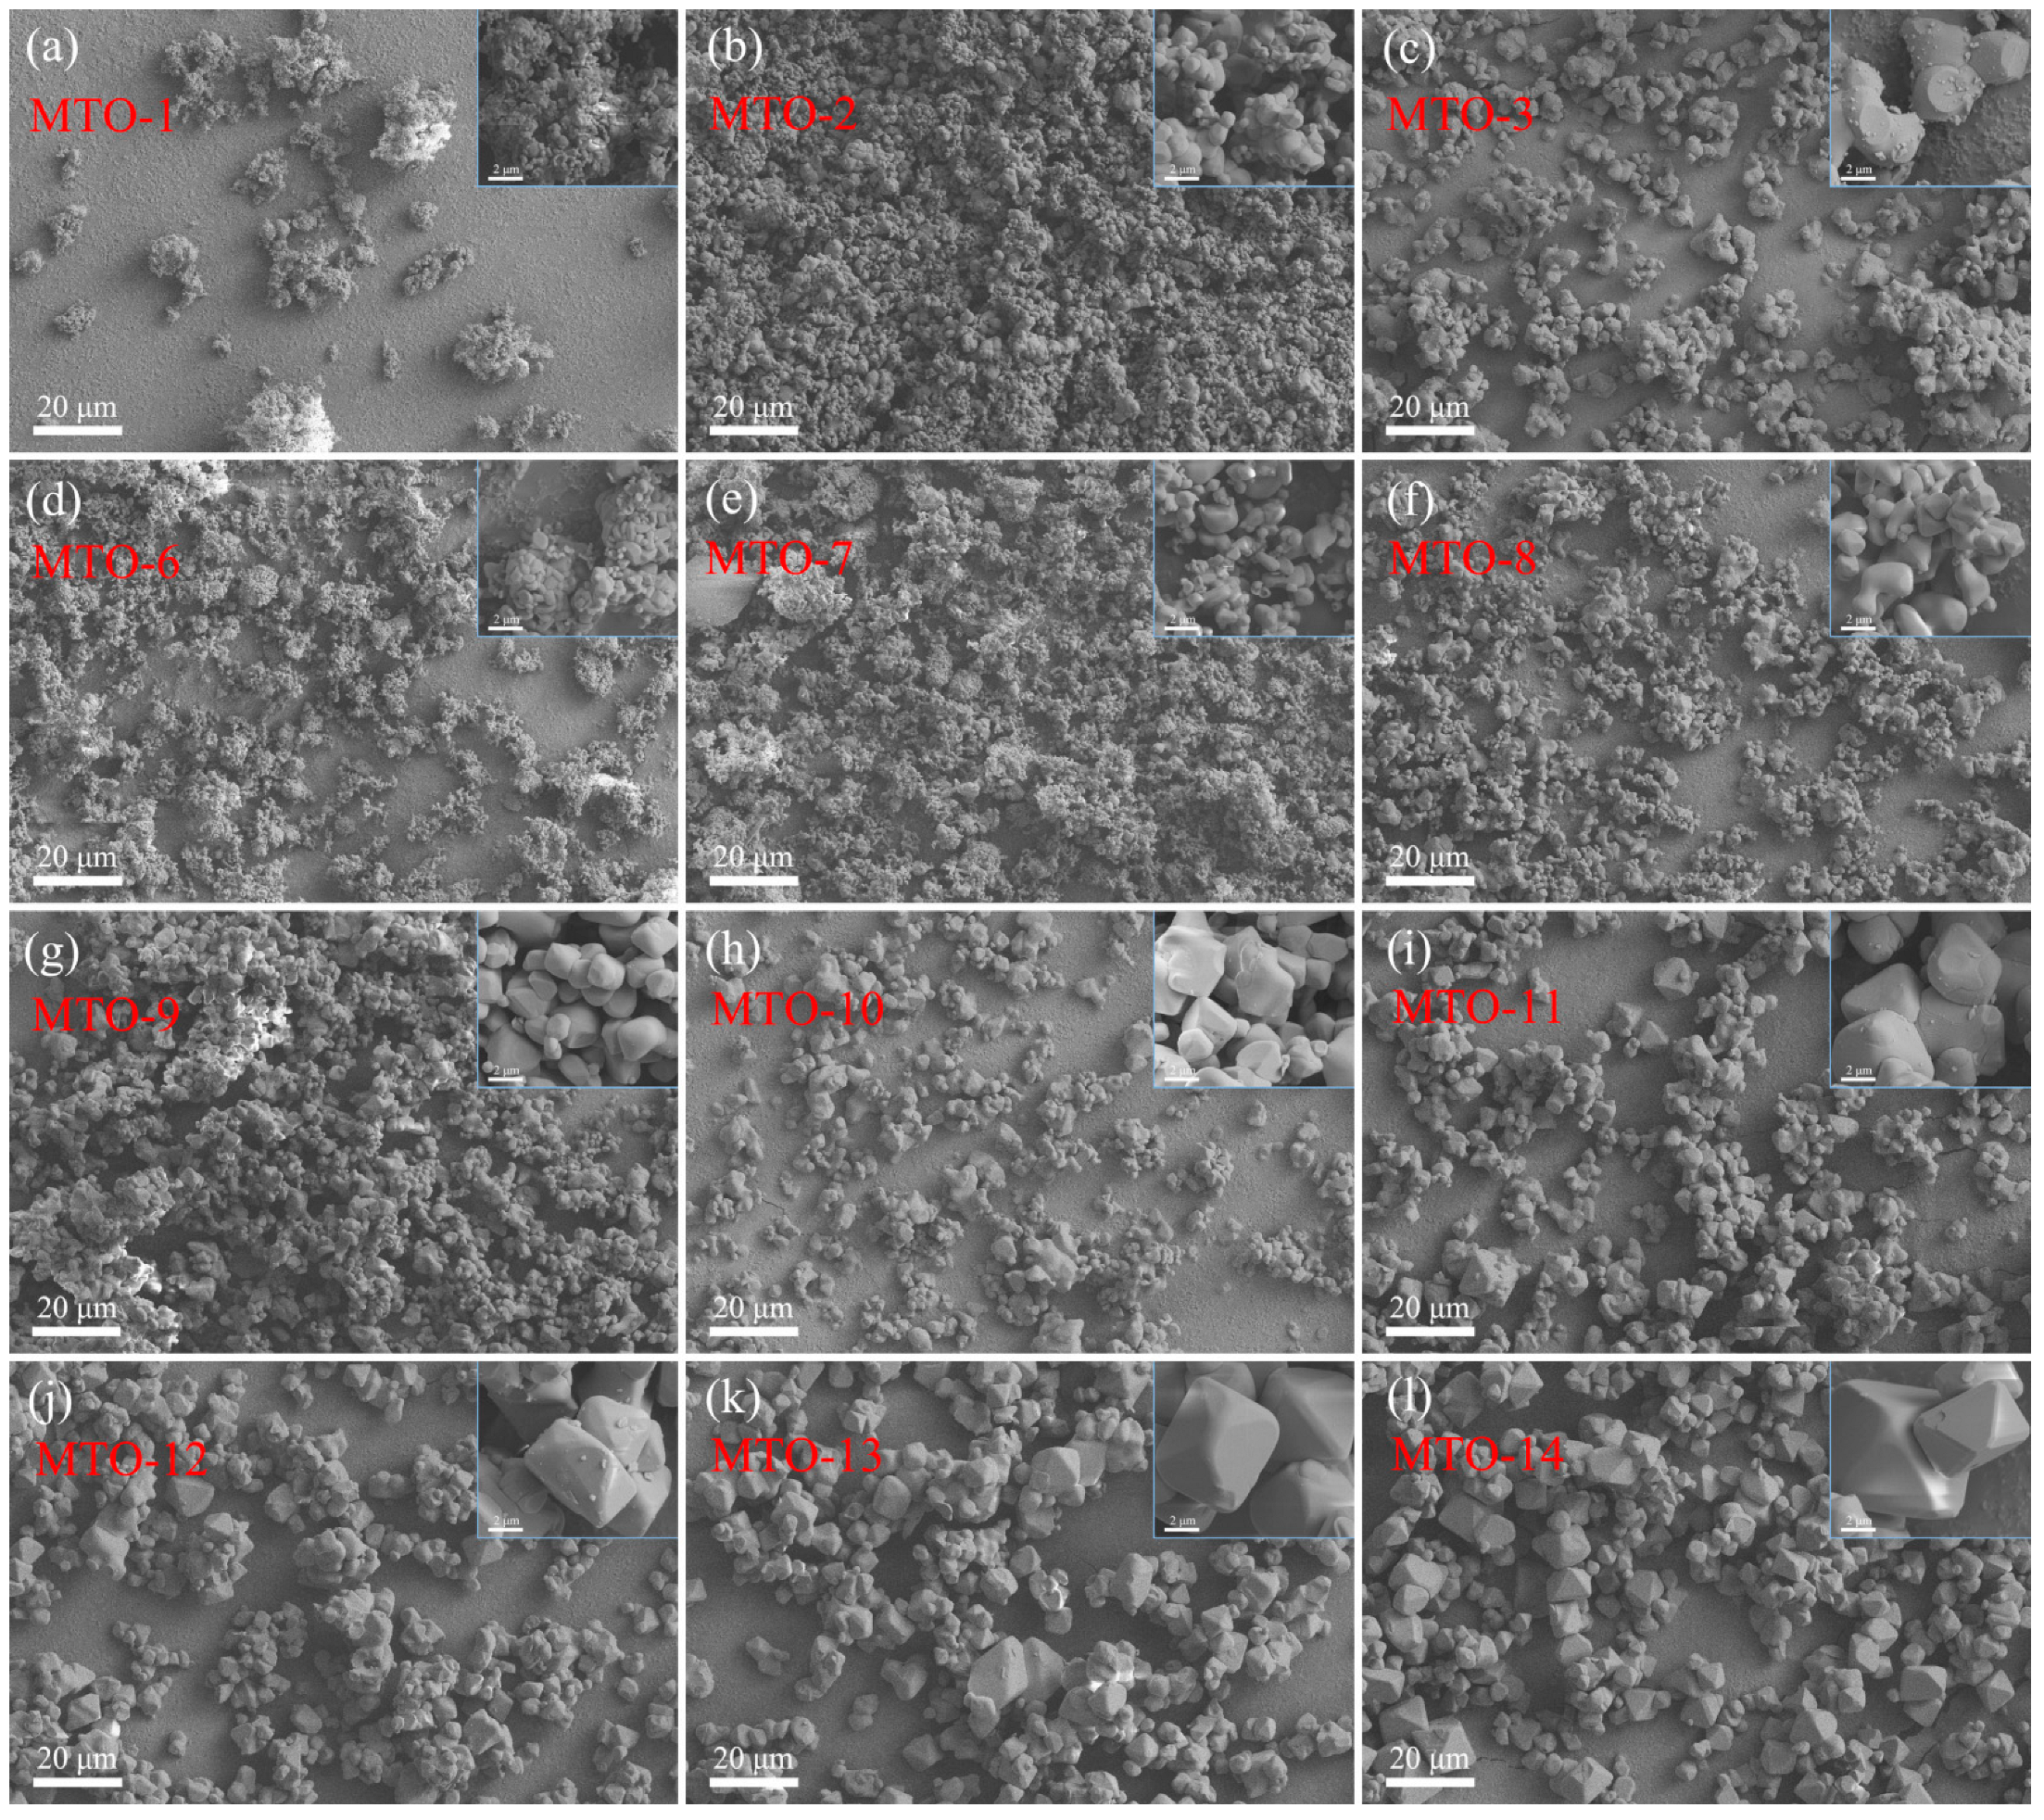
As shown in Figure 3, SEM analysis was employed to investigate the combined effects of the temperature and LiCl flux content on the morphological evolution of the obtained samples. Figure 3a–c show the SEM images of samples sintered at 950 °C (MTO-1), 1100 °C (MTO-2), and 1300 °C (MTO-3), without the utilization of LiCl flux, respectively. The results show that MTO-1 retained the precursor morphology due to insufficient thermal energy. Upon heating to 1100 °C, sample MTO-2 underwent significant particle agglomeration, resulting in an increased particle size (in the inset of Figure 3b), and the grain boundaries became indistinct and unresolvable. Further increasing the sintering temperature to 1300 °C yielded sample MTO-3, featuring spherical particles approximately 3 μm in diameter (in the inset of Figure 3c). These spheres exhibited interparticle coalescence with an evident coarsening tendency. Figure 3d–l illustrate the morphological evolution of samples sintered at a fixed temperature of 950 °C with varying LiCl flux content (2–200 wt%). The results show that when 2 wt% LiCl is incorporated, the obtained sample, MTO-6, exhibits relatively uniform spherical particles with a diameter of approximately 600 nm (in the inset of Figure 3d). As the LiCl content increased from 2 to 50 wt%, it was clearly observed that the samples underwent agglomeration and growth. At the addition amount of 50 wt% LiCl, nearly octahedral-shaped micron-sized particles, approximately 5 microns in diameter, were obtained. Further increasing the LiCl content from 50 to 200 wt% maintained morphological invariance but induced particle growth to approximately 10 μm at maximum loading. Obviously, the preparation of MTO:Mn4+ phosphor by the LiCl flux-assisted solid-state reaction method not only reduces the sintering temperature of the phosphor but also results in a more uniform and ordered particle morphology in the obtained samples.
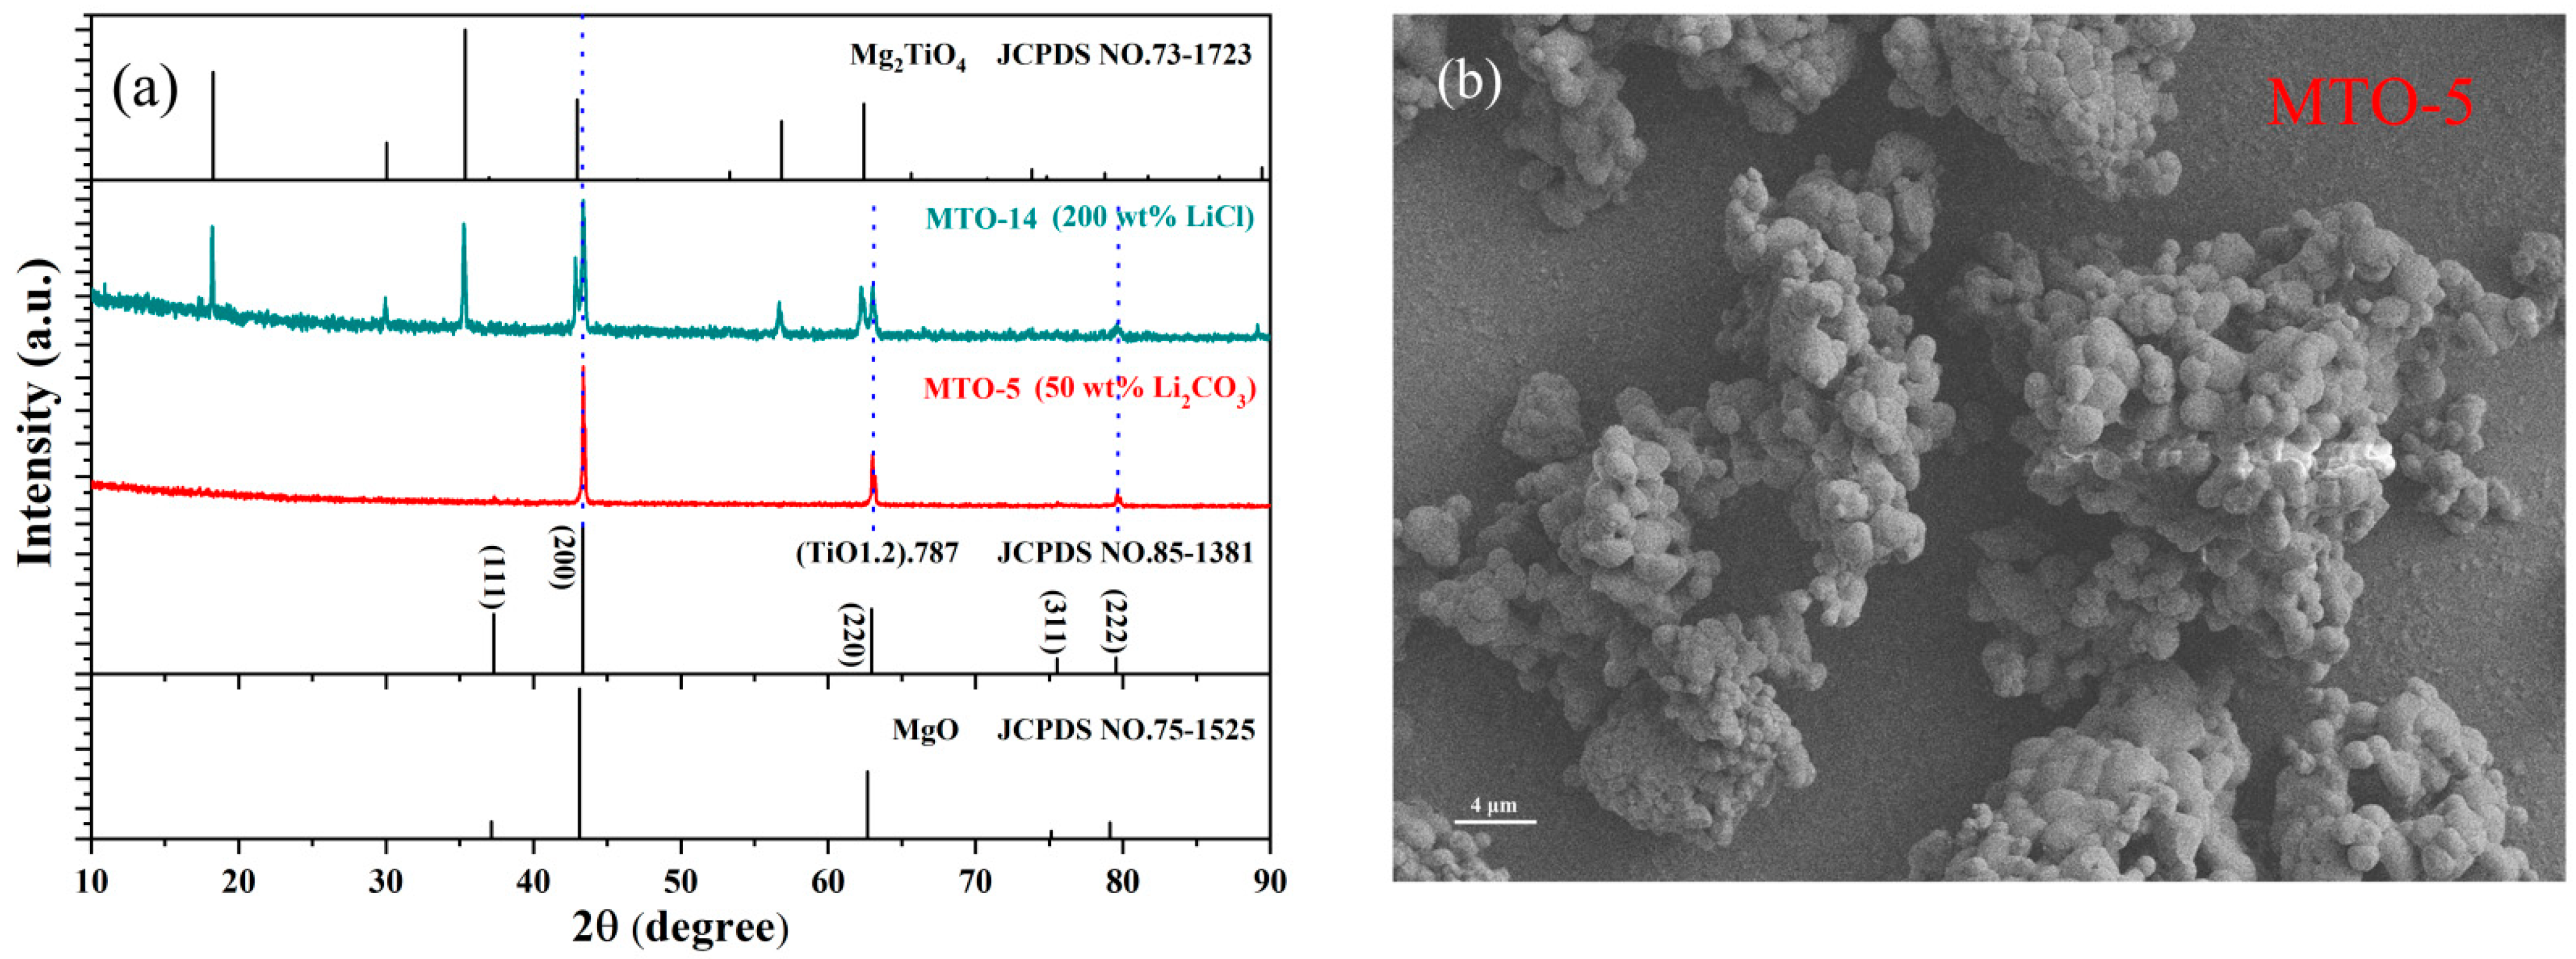
LiCl effectively reduces the synthesis temperature of MTO:Mn4+ phosphors, but other low-melting-point compounds like the conventional flux agent Li2CO3 (melting point 720 °C) show no similar effect. Figure 4a presents the XRD pattern of sample MTO-5, prepared at 950 °C using Li2CO3 as a flux agent instead of LiCl. The diffraction peaks of MTO-5 in the figure correspond neither to MgTiO3 nor MTO standards but may be derived from the diffraction peaks of the residual MgO or (TiO1.2).787 or a novel intermediate compound. Interestingly, the diffraction peaks of MTO-5 are precisely aligned with the impurity phases formed after adding high-concentration LiCl, shown in Figure 2 (see the dashed line in Figure 4a), indicating that the compound corresponding to these diffraction peaks may be a result of the introduction of the Li element. This suggests lithium-induced phase formation, although exact identification requires further study. Figure 4b is an SEM image of MTO-5, showing that the microstructure of MTO-5 consists of agglomerated spherical particles. These particles differ from those in the microstructures of samples prepared with and without LiCl added at the same temperature (as shown in Figure 3a,d). Collectively, the XRD and SEM data demonstrate that Li2CO3 promotes novel lithium-containing compound formation rather than target MTO crystallization.

3.2. Optical Properties

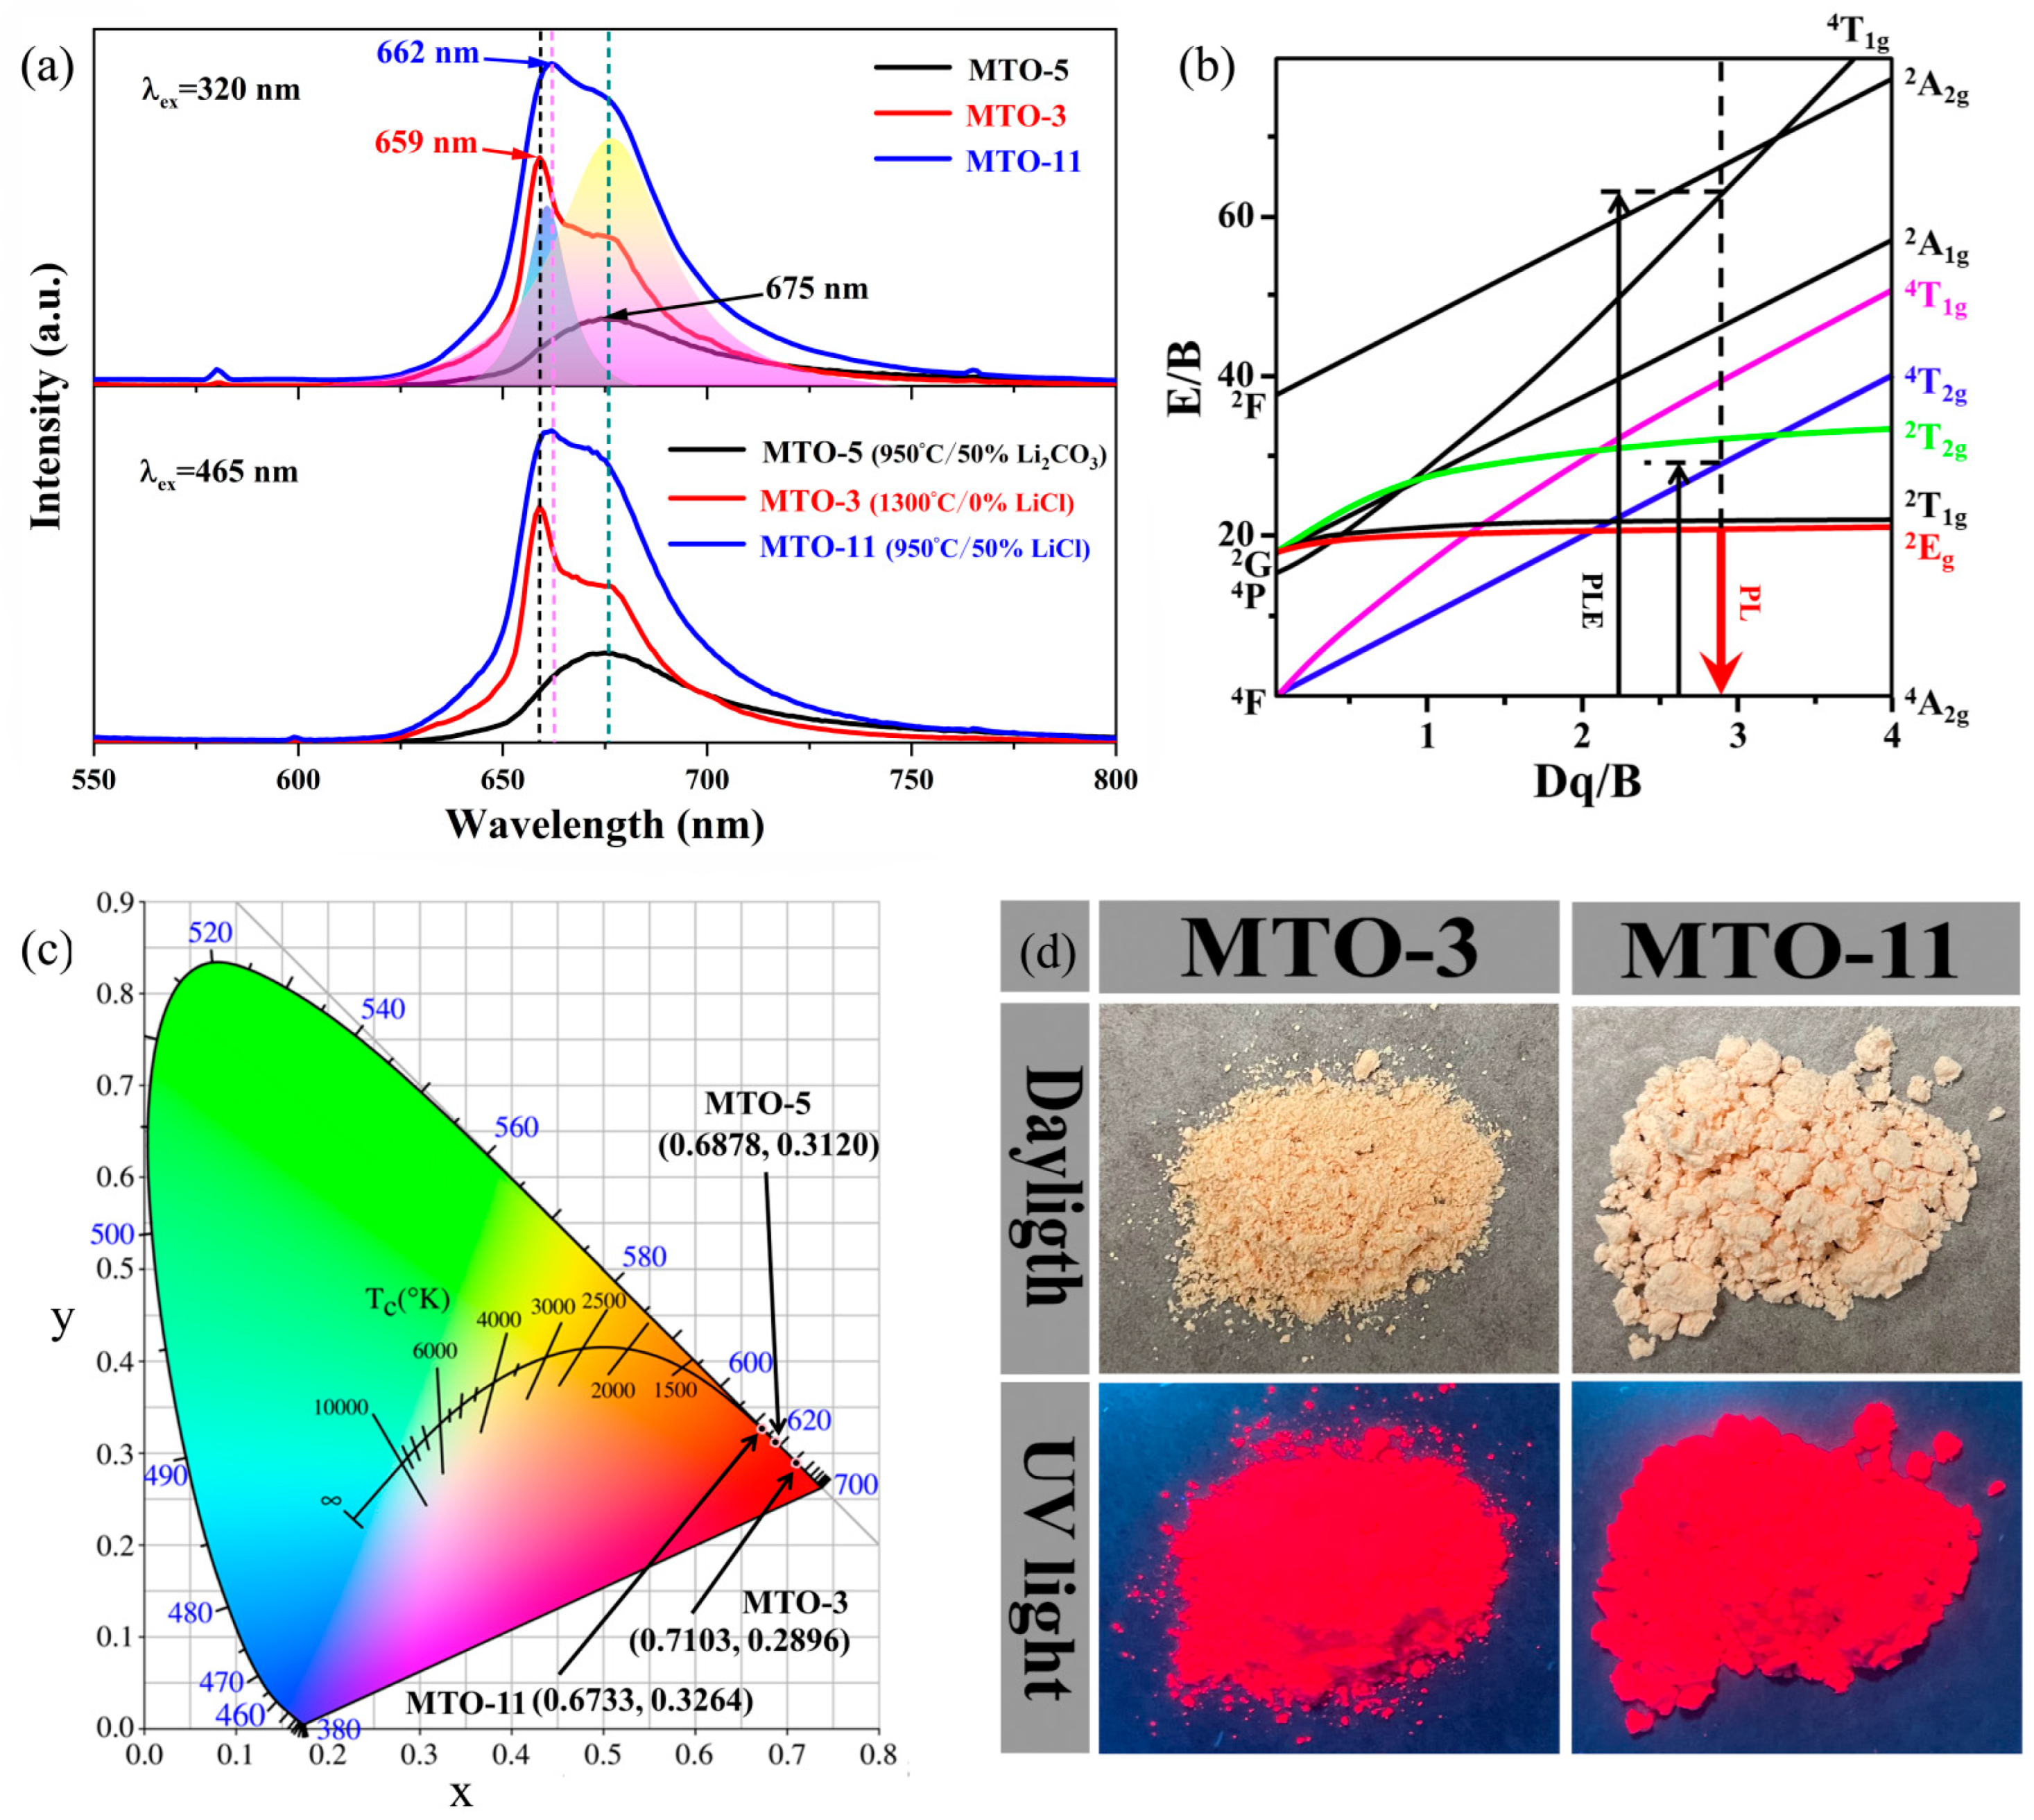
Figure 5a presents the photoluminescence (PL) spectra of MTO-3, MTO-5, and MTO-11 under excitation by 320 nm ultraviolet light and 465 nm blue light, respectively. Under light excitation, a characteristic emission band ranging from 625 nm to 750 nm was detected in all samples, which originated from the luminescence of Mn4+ ions, indirectly indicating that Mn4+ ions were successfully doped into the matrix [14]. The PL spectra of MTO-3 and MTO-11 display two prominent emission spectral bands spanning from 625 to 725 nm, which can be identified through Gaussian fitting. The emission band centered at 660 nm corresponds to the 2Eg4A2g transition of Mn4+ ions, whereas the shoulder band centered at 675 nm arises from the phonon-assisted sideband transition and impurity-related luminescence [14,23,24,25]. Among the PL spectra of the three samples, the broad emission band of MTO-5 is centered at 675 nm, suggesting the absence of MTO:Mn4+ compound formation in MTO-5, which is consistent with the conclusion drawn from Figure 4. Compared with the emission spectrum of MTO-11, the main emission band of MTO-3 is located at 659 nm, which is blue-shifted by 3 nm from that of MTO-11, and the intensity of the shoulder peak at 675 nm is also weaker.
In order to illustrate the relationship between the crystal field splitting energy (Dq) of the MTO matrix and the energy levels of Mn4+ (3d3 configuration), Figure 5b depicts the Tanabe–Sugano diagram of Mn4+ ions in an octahedral crystal field. In the MTO matrix with a strong crystal field, the 2E energy level of Mn4+ is the most stable excited state. Under ultraviolet or blue light excitation, the electrons are pumped from the ground-state energy level 4A2g to the excited-state energy levels 4T1g and 4T2g and then relax to the 2Eg energy level through non-radiative transition pathways; they finally transition back to the ground state and release red light with a central wavelength near 660 nm [26]. Figure 5c shows the CIE chromaticity diagrams of MTO-3, MTO-5, and MTO-11 phosphors under 320 nm light excitation. The corresponding chromaticity coordinates are (0.7103, 0.2896), (0.6878, 0.3120), and (0.6733, 0.3264), respectively. The emission spectra of all samples are within the red spectral range. Figure 5d presents photos of samples MTO-3 and MTO-11. The upper part of the figure shows photos taken under daylight, and the visual difference in the photos is due to the fact that MTO-11 was washed several times with water to remove the LiCl flux. The lower part shows digital photos taken under 365 nm light excitation, and both samples emitted bright red light under ultraviolet light.
To evaluate the luminescence efficiency, the internal quantum efficiency (IQE), absorption rate (A), and external quantum efficiency (EQE) of the MTO-11 phosphor were measured using an integrating sphere. The EQE was calculated according to the equation EQE = A × IQE. As shown in Figure S1, under 320 nm excitation, the MTO-11 phosphor exhibited IQE, A, and EQE values of 21%, 80%, and 17%, respectively.
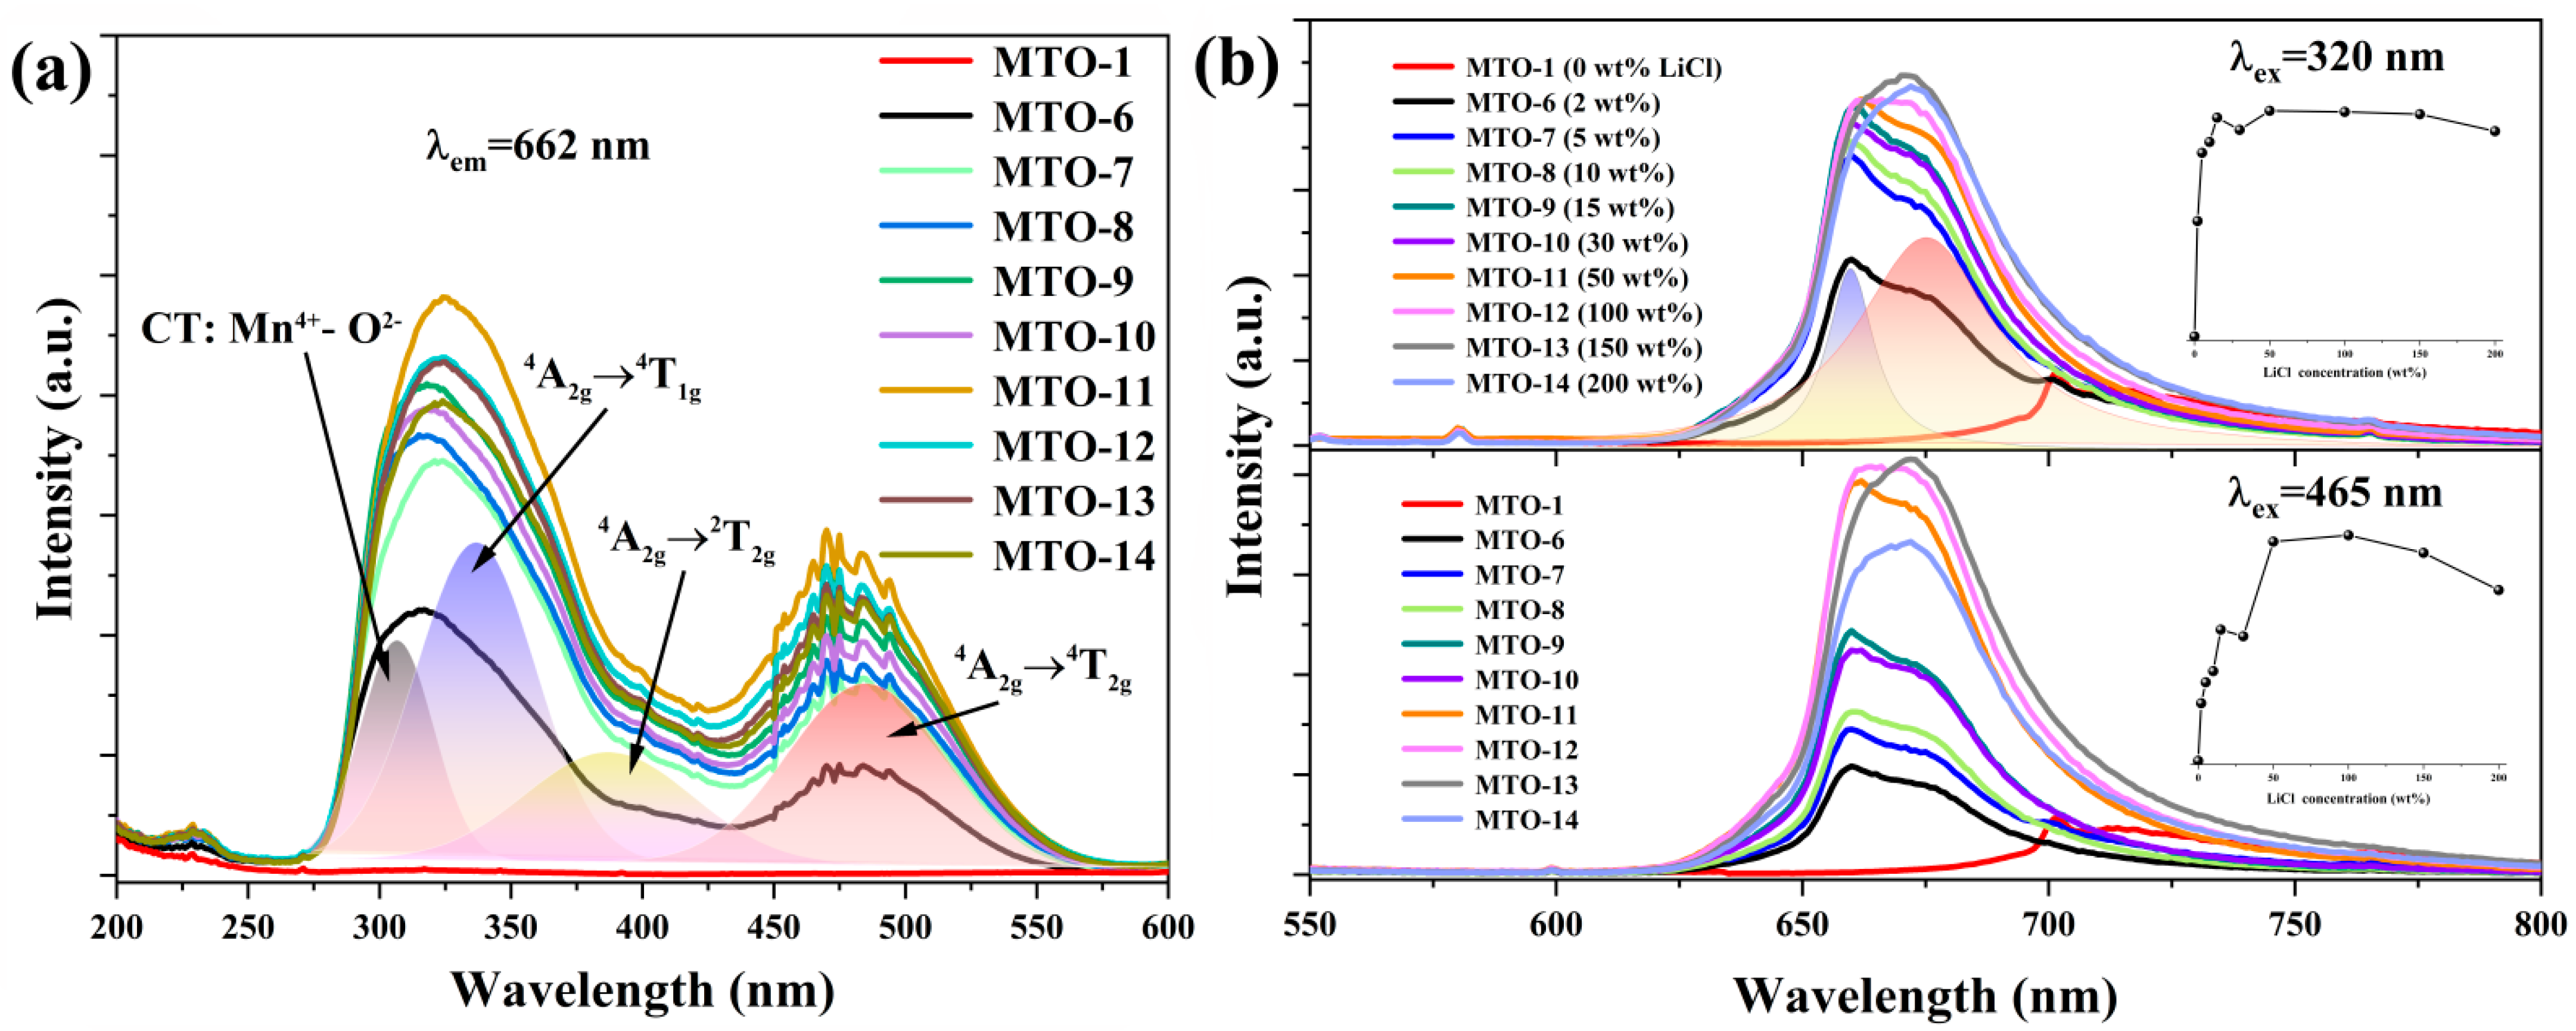
Figure 6a shows the photoluminescence excitation (PLE) spectra monitored at 662 nm for samples MTO-1 and MTO-6 to MTO-14. The PLE spectra of all samples display two prominent excitation bands spanning from 275 to 550 nm, which can be identified through Gaussian fitting. The first excitation band centered at 320 nm is attributed to the overlap of charge transfer between O2− and Mn4+ ions and transitions 4A2g4T1g and 4A2g2T2g of Mn4+ ions, encompassing the range of 275 to 480 nm. Another excitation band with a central wavelength at 483 nm stems from the 4A2g4T2g transition of Mn4+ ions, covering the range of 480 to 550 nm [5]. The DR spectrum of MTO-11 shows results that are consistent with those of the PLE spectrum (see Figure S2). Figure 6b illustrates the PL spectra of samples (MTO-1 and MTO-6 to MTO-14) sintered at a fixed temperature of 950 °C with varying LiCl flux content (0–200 wt%) under excitation with 320 nm ultraviolet light and 465 nm blue light. Similarly to the results shown in Figure 5a, the PL spectra of all samples display two distinct emission spectral bands, with the emission peaks centered at 662 nm and 675 nm, respectively, which can be identified through Gaussian fitting. For samples with LiCl addition below 50 wt%, the spectral characteristics remain consistent, except for the change in emission intensity. However, when the LiCl content exceeds 50 wt%, the emission band centered at 675 nm increases more significantly in intensity than the peak at 662 nm, eventually surpassing the latter. This behavior is attributed to the rising impurity content in the sample with increasing LiCl addition. These impurities emit red light centered at 675 nm under blue–ultraviolet excitation. The results are consistent with the trends shown in Figure 2, Figure 4 and Figure 5. Additionally, the inset of Figure 6b illustrates the relationship between the LiCl flux content and the emission intensity at 662 nm. The results demonstrate that the emission peak at 662 nm reaches its maximum intensity when the LiCl content is 50 wt%. Consequently, based on these findings, the optimal LiCl flux addition amount for the MTO system is determined to be 50 wt%.
Figure 7a presents the PL spectra of samples synthesized by adding 50 wt% LiCl flux at 950 °C, illustrating the effects of varying Mn4+ doping concentrations on the spectral characteristics. Given the comparable ionic radii of Mn4+ (0.59 Å) and Ti4+ (0.60 Å), the substitution of a small amount of Mn4+ for Ti4+ at octahedral lattice sites in the MTO matrix did not induce noticeable lattice volume changes. Consequently, despite the Mn4+ content increasing from 0.05 to 1 mol%, the XRD pattern of the resulting sample exhibited no significant shifts or alterations in the peak positions and shapes (Figure S3). All samples maintained the same spectral shape, with only differences in the emission intensities. Figure 7b shows the corresponding relationship between the intensity at 662 nm and the varying Mn4+ doping concentration. As shown in the figure, the emission intensity increases with the Mn4+ concentration up to 0.2%, beyond which further doping leads to a decrease in intensity due to the concentration quenching effect. This effect is attributed to the interactions among adjacent Mn4+ ions. When the doping concentration of Mn4+ is too high, the average distance between Mn4+ ions will decrease. Once the distance falls below the critical distance (Rc), resonance energy transfer occurs from a single Mn4+ ion to multiple nearby Mn4+ ions. This non-radiative energy transfer reduces the number of effective luminescent centers and triggers concentration quenching. Therefore, a Mn4+ doping concentration of 0.2% is determined to be optimal for the MTO matrix.
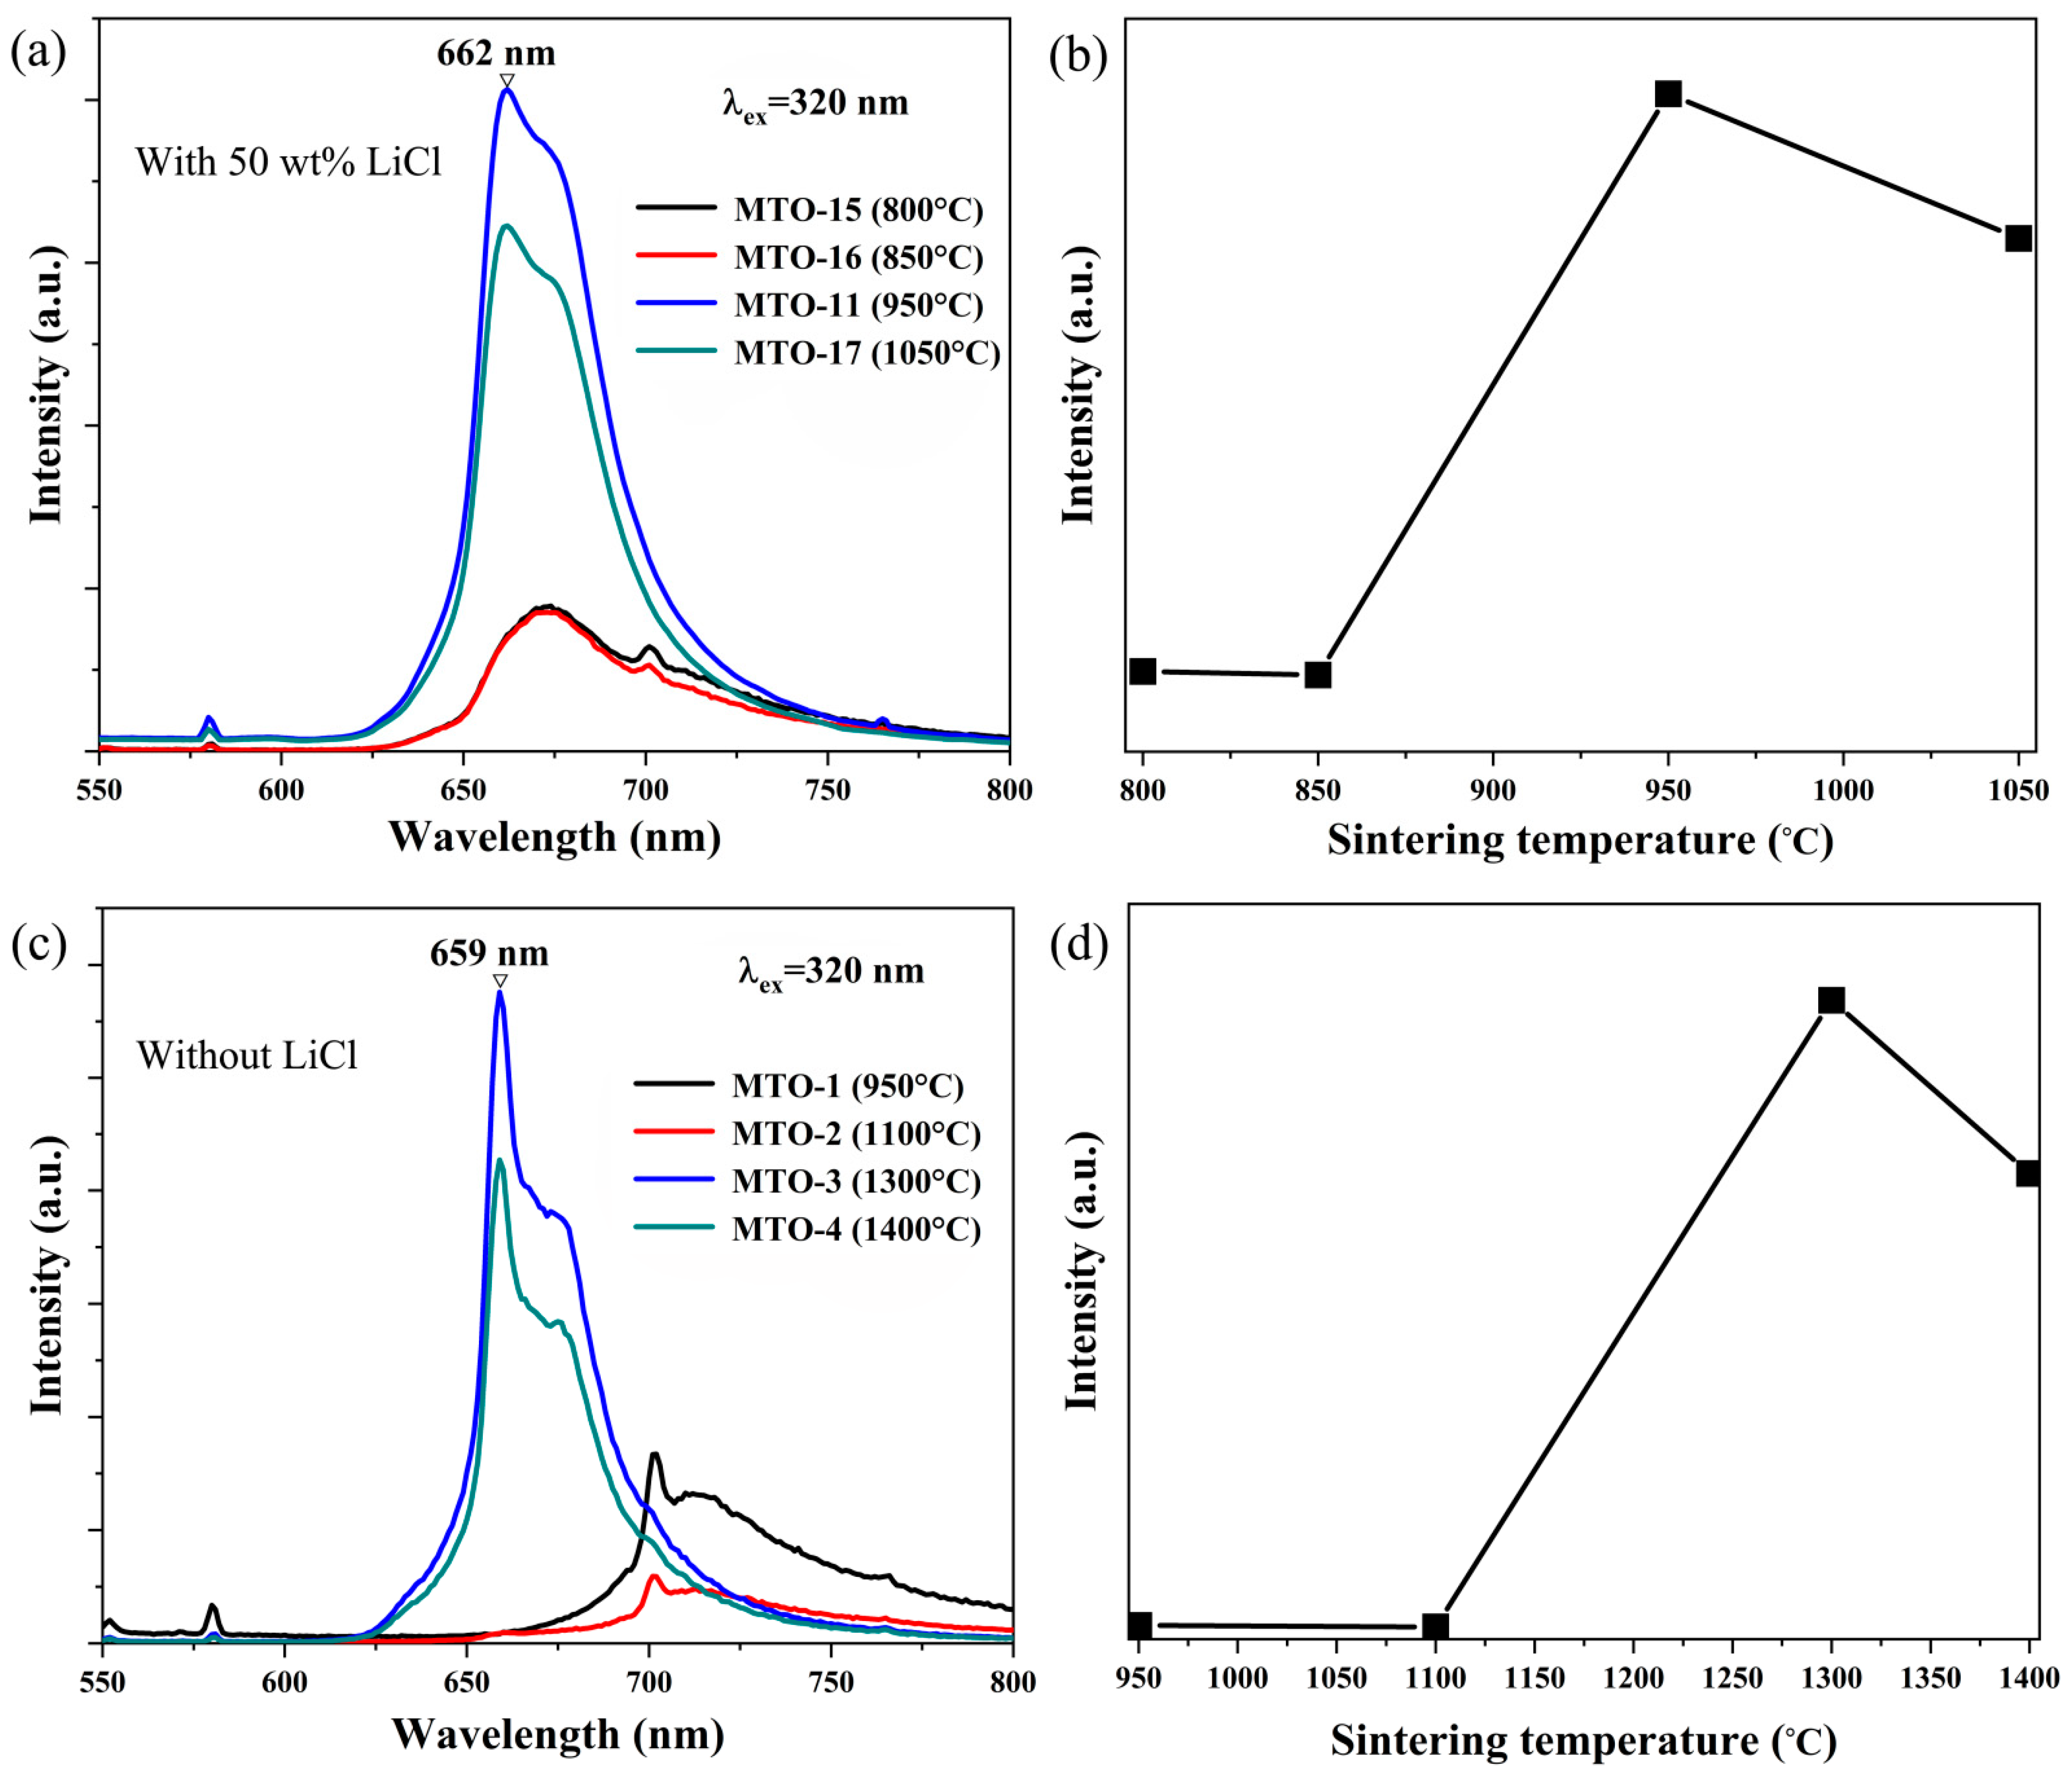
Figure 8a,c present the PL spectra of the samples synthesized at various temperatures with and without LiCl flux, respectively. The corresponding relationships between the emission intensity at 662 nm and the temperature are summarized in Figure 8b,d. The samples prepared at lower temperatures, shown in Figure 8a, exhibit a weak emission band centered at approximately 675 nm, primarily due to the formation of impurities and MgTiO3:Mn4+ without the generation of MTO:Mn4+. In contrast, the PL spectra of samples synthesized at temperatures above 950 °C display the strong characteristic emission of Mn4+ ions in an octahedral crystal field. According to the data in Figure 8b, the highest emission intensity is achieved when the sintering temperature reaches 950 °C. Therefore, 950 °C is determined to be the optimal sintering temperature for the synthesis of the MTO:Mn4+ system with 50 wt% LiCl flux. In the absence of LiCl flux (Figure 8c), samples sintered below 1100 °C lack sufficient MTO phases, leading to a weak emission band peaking at around 701 nm, which corresponds to the emission peak of MgTiO3:Mn4+ phosphor [27,28]. Upon increasing the sintering temperature, the emission intensity significantly improves due to the successful synthesis of MTO:Mn4+ phosphor.

3.3. Device Performance

Considering the excellent comprehensive characteristics of MTO:0.2%Mn4+ phosphors, further evaluation of their performance in LED devices was conducted. A phosphor-converted red LED was fabricated by coating an epoxy resin containing MTO:Mn4+ phosphor onto a 377 nm LED chip. Figure 9a presents the electroluminescence spectra of the red LED under various driving currents (ranging from 50 to 500 mA), and the inset is a digital image of the LED operating in a dark environment with a current of 50 mA. Figure 9b displays the CIE color coordinates and digital photographs of the LED in both on and off states under daylight conditions at a driving current of 50 mA. The corresponding CIE chromaticity coordinates are (0.6354, 0.3006), which fall within the red light region. Figure 9c illustrates the relationship between the photoelectric conversion efficiency, defined as the ratio of the red light output power to the input electrical power, and the driving current. The output power as a function of the driving current is shown in Figure 9d. The results indicate that the photoelectric conversion efficiency reaches a notable 78.5% at a driving current of 100 mA. As the current increases, the decline in efficiency can be attributed to the inherent “efficiency droop” phenomenon commonly observed in LED chips [29]. These findings suggest that MTO:0.2% Mn4+ phosphor holds significant potential as a red-emitting material for LED applications.

4. Conclusions

In conclusion, this study represents the first successful application of LiCl as a flux agent to facilitate the solid-state reaction method for the synthesis of a pure Mn4+-doped MTO phosphor at relatively low temperatures. The appropriate addition of LiCl not only enables the synthesis of MTO at reduced temperatures but also enhances both the microstructural morphologies and luminescent performance of the resulting phosphors. However, excessive LiCl can lead to the formation of secondary phases, a phenomenon also observed when Li2CO3 is used as the flux agent. The newly formed secondary phase will enable the powder to exhibit broadband luminescence centered at a wavelength of 675 nm under blue–violet light excitation. The optimal conditions for the synthesis of MTO:Mn4+ phosphor were determined to be a Mn4+ doping level of 0.2mol%, LiCl addition of 50 wt%, and a sintering temperature of 950 °C. The resulting phosphor displays a characteristic Mn4+ ion emission spectrum centered at 662 nm, with CIE chromaticity coordinates of (0.6733, 0.3264). The LED lamp prepared by coating MTO:0.2% Mn4+ onto a 377nm LED chip emitted bright red light under various driving currents. The photoelectric conversion efficiency of this LED reached 78.5% at a driving current of 100 mA, demonstrating the promising potential of MTO:Mn4+ as a red-emitting phosphor for use in phosphor-converted LED applications.

Supplementary Materials

The following supporting information can be downloaded at: https://www.mdpi.com/article/10.3390/solids6030053/s1, Figure S1. The quantum yield of MTO-11; Figure S2. DR spectrum of MTO-11 phosphor; Figure S3. The XRD patterns of MTO-11, MTO-18, MTO-19, MTO-20, and MTO-21.

Author Contributions

Conceptualization, C.L. and L.Z.; methodology, C.L. and H.C.; software, C.L. and H.C.; validation, C.L., H.C. and D.D.; formal analysis, C.L. and H.C.; investigation, C.L., H.C. and D.D.; resources, C.L. and L.Z.; data curation, C.L. and L.Z.; writing—original draft preparation, C.L. and L.Z.; writing—review and editing, C.L. and L.Z.; visualization, C.L.; supervision, C.L. and L.Z.; project administration, L.Z.; funding acquisition, C.L. and L.Z. All authors have read and agreed to the published version of the manuscript.

Funding

This research was funded by the National Natural Science Foundation of China, grant number 21701067, and the Jiangxi Provincial Natural Science Foundation, grant numbers 20242BAB25220 and 20171BBB216016.

Data Availability Statement

The original contributions presented in this study are included in the article.

Acknowledgments

This research was conducted using the equipment of Jiangxi University of Science and Technology: School of Materials Science and Engineering, Center for Analysis and Testing.

Conflicts of Interest

Authors Chenxing Liao, Huihuang Cai and Liaolin Zhang were employed by the company Guorui Kechuang Rare Earth Functional Materials (Ganzhou) Co., Ltd. The remaining authors declare that the research was conducted in the absence of any commercial or financial relationships that could be construed as a potential conflict of interest.

References

  1. Chen, D.; Zhou, Y.; Zhong, J. A review on Mn4+ activators in solids for warm white light-emitting diodes. RSC Adv. 2016, 6, 86285–86296. [Google Scholar] [CrossRef]
  2. Fan, N.; Du, Q.; Guo, R.; Luo, L.; Wang, L. Sol-Gel Synthesis and Photoluminescence Properties of a Far-Red Emitting Phosphor BaLaMgTaO6:Mn4+ for Plant Growth LEDs. Materials 2023, 16, 4029. [Google Scholar] [CrossRef] [PubMed]
  3. Borkovska, L.; Kozoriz, K.; Gudymenko, O.; Vorona, I.; Marchylo, O.; Kryshtab, T. Comparative study of Mn4+ activated magnesium titanate red phosphors synthesized by sol–gel and solid-state reaction methods. Emergent Mater. 2025, 8, 1267–1278. [Google Scholar] [CrossRef]
  4. He, S.A.; Xu, F.F.; Wu, D.; Wang, Z.W.; Peng, J.Q.; Ye, X.Y. Effects of introducing cations on the luminescence performance of CsPF6:Mn4+ phosphor. Nonferr. Met. Sci. Eng. 2020, 11, 111–117. [Google Scholar]
  5. Han, M.; Tang, H.; Liu, L.; Wang, Y.; Zhang, X.; Lv, L.J. Tuning the Mn4+ coordination environment in Mg2TiO4 through a codoping strategy for enhancing luminescence performance. J. Phys. Chem. C. 2021, 125, 15687–15695. [Google Scholar] [CrossRef]
  6. Li, C.; Fang, Z.; Yan, Y.; Li, H.; Luo, X.; Wang, X.; Zhou, P. Study on the Performance of Deep Red to Near-Infrared pc-LEDs by the Simulation Method Considering the Distribution of Phosphor Particles. Micromachines 2024, 15, 1035. [Google Scholar] [CrossRef]
  7. Zhang, Y.; Zhou, C.; Zhang, Q.; Yin, P.; Sun, X.; Wang, K.; Wang, J.; Feng, X. Change from La2Ti2O7 to LaTiO3 induced by Li2CO3 addition: Higher local symmetry and particle uniformity achieved an efficient Mn4+ activated far red phosphor for agricultural cultivation. J. Lumin. 2022, 248, 119000. [Google Scholar] [CrossRef]
  8. Chai, X.J.; Wang, M.H.; Li, J.Q.; Han, Z.; Peng, G.H.; Liao, J.S.; Wen, H.R. Preparation and near-infrared luminescence properties of Y2MgTiO6: Mn4+/ Nd3+. Nonferr. Met. Sci. Eng. 2020, 11, 48–56. [Google Scholar]
  9. Hu, M.; Liao, C.; Xia, L.; You, W.; Li, Z. Low temperature synthesis and photoluminescence properties of Mn4+-doped La2MgTiO6 deep-red phosphor with a LiCl flux. J. Lumin. 2019, 211, 114–120. [Google Scholar] [CrossRef]
  10. Sasaki, T.; Fukushima, J.; Hayashi, Y.; Takizawa, H. Photoluminescence Properties of the Magnetoplumbite-Type BaMg6Ti6O19:Mn4+ and Spinel-Type Mg2TiO4:Mn4+. Mater. Sci. Forum 2016, 868, 73–78. [Google Scholar] [CrossRef]
  11. Lv, L.; Wang, S.; Wang, X.; Han, L. Compounds. Inducing luminescent properties of Mn4+ in magnesium titanate systems: An experimental and theoretical approach. J. Alloy. Compd. 2018, 750, 543–553. [Google Scholar] [CrossRef]
  12. Ye, T.; Li, S.; Wu, X.; Xu, M.; Wei, X.; Wang, K.; Bao, H.; Wang, J.; Chen, J. Sol–gel preparation of efficient red phosphor Mg2TiO4:Mn4+ and XAFS investigation on the substitution of Mn4+ for Ti4+. J. Mater. Chem. C 2013, 1, 4327–4333. [Google Scholar] [CrossRef]
  13. Wang, Z.; Lin, H.; Zhang, D.; Shen, Y.; Li, Y.; Hong, R.; Tao, C.; Han, Z.; Chen, L.; Zhou, S. Deep-red emitting Mg2TiO4:Mn4+ phosphor ceramics for plant lighting. J. Adv. Ceram. 2021, 10, 88–97. [Google Scholar] [CrossRef]
  14. Park, J.Y.; Jung, J.Y.; Ramaraju, G.S.; Yang, H.K. Development of Mg2TiO4:Mn4+ phosphors for enhanced red LED emission and forensic fingerprint analysis. Mater. Today Chem. 2024, 41, 102308. [Google Scholar] [CrossRef]
  15. Liao, C.; Ma, Z.; Dong, G.; Qiu, J. Flexible porous SiO2–Bi2WO6 nanofibers film for visible-light photocatalytic water purification. J. Am. Ceram. Soc. 2015, 98, 957–964. [Google Scholar] [CrossRef]
  16. Hu, Z.; Ma, Z.; He, X.; Liao, C.; Li, Y.; Qiu, J. Preparation and characterization of flexible and thermally stable CuO nanocrystal-decorated SiO2 nanofibers. J. Sol.-Gel. Sci. Techn. 2015, 76, 492–500. [Google Scholar] [CrossRef]
  17. Liao, C.; Ma, Z.; Chen, X.; He, X.; Qiu, J. Controlled synthesis of bismuth oxyiodide toward optimization of photocatalytic performance. Appl. Surf. Sci. 2016, 387, 1247–1256. [Google Scholar] [CrossRef]
  18. Meng, X.; Wang, Z.; Yan, Z.; Guo, D.; Liu, M.; Gong, J.; Feng, X.; Zhang, T.; Li, X.; Li, P. Flux induced highly efficient and stable phosphor Sr2ScSbO6: Mn4+ for plant growth lighting. J. Mater. Chem. C 2023, 11, 5064–5072. [Google Scholar] [CrossRef]
  19. Wang, L.S.; Chen, J.J.; Zhou, J.; Lai, H.S. Influences of Flux on Properties of Y3Al5O12:Ce Phosphor. Nonferr. Met. Sci. Eng. 2011, 2, 28–31. [Google Scholar]
  20. Zhu, F.; Gao, Y.; Lu, X.; Qiu, J. Orthoboric acid as sintering flux improved emission efficiency and thermal stability of Ni2+-doped SrTiO3 perovskite NIR-II phosphor. Ceram. Int. 2025, 51, 9124–9130. [Google Scholar] [CrossRef]
  21. Wang, X.; Cao, Y.; Yan, X.; Li, G.; Li, X.; Zhang, J.; Chen, B. Outstanding pure green upconversion luminescence in LaZrTa3O11: Er3+/Yb3+ phosphors prepared by molten salt synthesis with B2O3 flux. J. Am. Ceram. Soc. 2025, 108, e20262. [Google Scholar] [CrossRef]
  22. Borkovska, L.; Stara, T.; Vorona, I.; Nosenko, V.; Gudymenko, O.; Kladko, V.; Kozoriz, K.; Labbé, C.; Cardin, J.; Doualan, J.-L.; et al. Optical and structural properties of Mn4+-activated (ZnxMg1–x)2TiO4 Red Phosphors. Phys. Status Solidi A 2021, 219, 509. [Google Scholar] [CrossRef]
  23. Cao, R.; Wang, W.; Zhang, J.; Jiang, S.; Chen, Z.; Li, W.; Yu, X. Compounds. synthesis and luminescence properties of Li2SnO3: Mn4+ red-emitting phosphor for solid-state lighting. J. Alloy. Compd. 2017, 704, 124–130. [Google Scholar] [CrossRef]
  24. Borkovska, L.; Khomenkova, L.; Markevich, I.; Osipyonok, M.; Stara, T.; Gudymenko, O.; Kladko, V.; Baran, M.; Lavoryk, S.; Portier, X. Effect of Li+ co-doping on structural and luminescence properties of Mn4+ activated magnesium titanate films. J. Mater. Sci. 2018, 29, 15613–15620. [Google Scholar] [CrossRef]
  25. Han, M.; Liu, L.; Zhang, D.; Du, Y.; Zhao, L.; Wang, Y.; Lv, L. Tuning the morphology of Mg2TiO4: Mn4+ for luminescence performance and latent fingerprint visualization. J. Lumin. 2022, 252, 119417. [Google Scholar] [CrossRef]
  26. Yuan, J.; Zhao, G.; Ren, S.; Wu, Y.; Hu, F.; Wang, Q.; Shi, Q.; Yang, B.; Li, S.; Zhang, D. Multimode fluorescence intensity ratio thermometer based on synergistic luminescence from Eu3+ to Mn4+ of SrTiO3:Eu3+-ZnTiO3:Mn4+ nanocomposites. Ceram. Inter. 2023, 49, 17699–17708. [Google Scholar] [CrossRef]
  27. Long, J.; Ma, C.; Wang, Y.; Yuan, X.; Du, M.; Ma, R.; Wen, Z.; Zhang, J.; Cao, Y. Luminescent performances of Mn4+ ions during the phase evolution from MgTiO3 to Mg2TiO4. Mater. Res. Bull. 2017, 85, 234–239. [Google Scholar] [CrossRef]
  28. Cao, R.; Cheng, X.; Zhang, F.; Su, L.; Chen, T.; Ao, H.; Yu, X.; Ruan, W. Enhanced luminescence properties of MgTO3: Mn4+ red-emitting phosphor by adding Ge4+ ion and H3BO3. J. Mater. Sci.-Mater. Electron. 2018, 29, 13005–13010. [Google Scholar] [CrossRef]
  29. Wu, X.; Luo, Z.; Zhuang, Y.; Liu, Z.; Sun, P.; Liu, Y.; Zhang, L.; Qin, H.; Jiang, J. The co-optimization of efficiency and emission bandwidth in GSAGG:Cr3+ NIR ceramic phosphors. Ceram. Int. 2023, 49, 21688–21694. [Google Scholar] [CrossRef]
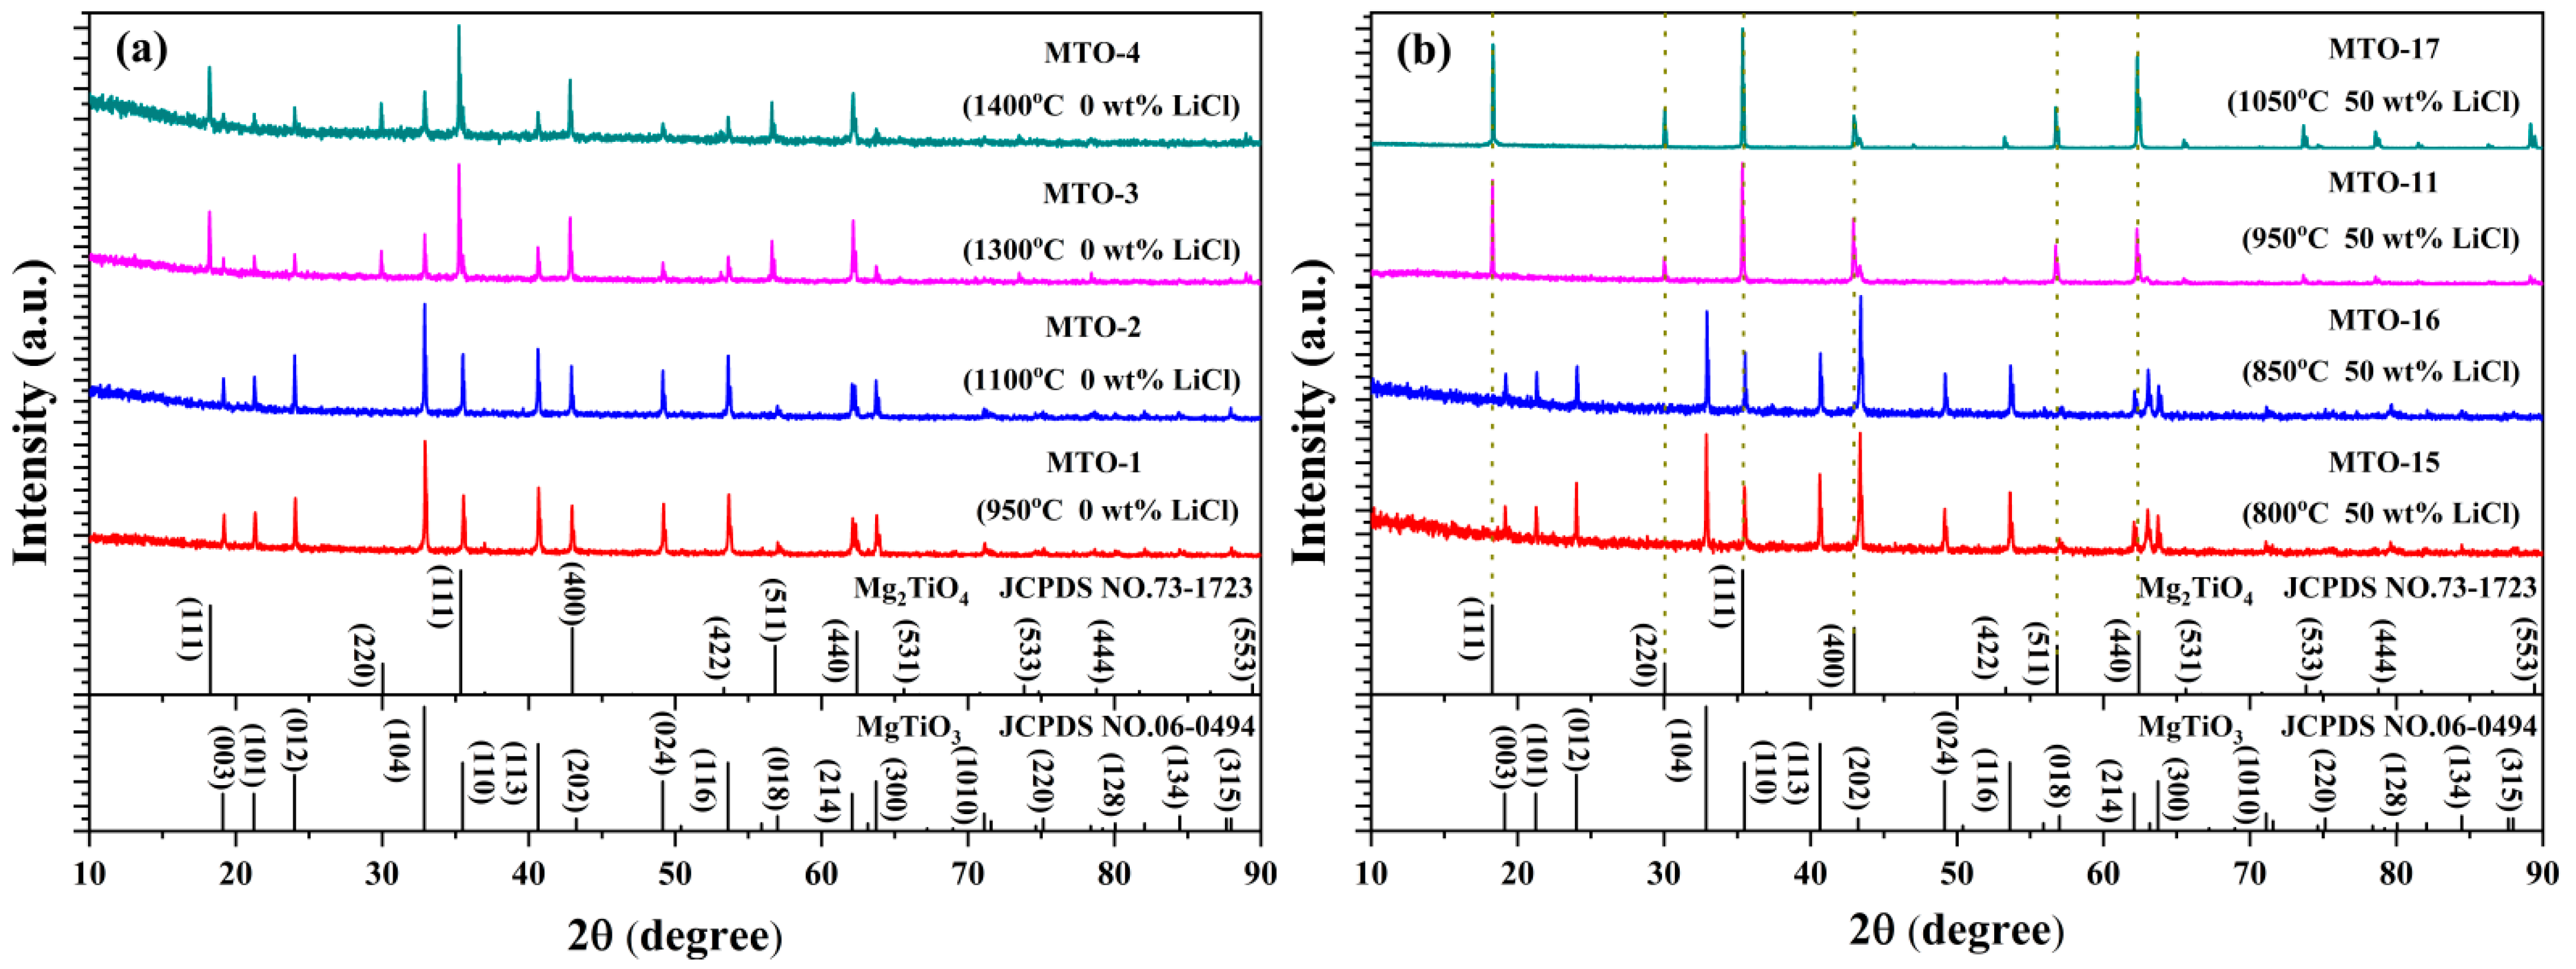
Figure 1. XRD patterns of the powders sintered at different temperatures: (a) without LiCl flux, (b) with 50 wt% LiCl flux.
Solids 06 00053 g001
Figure 2. XRD patterns of MTO:0.2%Mn4+ phosphors sintered at 950 °C as a function of LiCl content.
Solids 06 00053 g002
Figure 3. SEM images of samples prepared (ac) at different temperatures without LiCl flux, namely (a) 950 °C, (b) 1100 °C, and (c) 1300 °C, and (dl) with varying amounts of LiCl flux at 950 °C, namely (d) 2 wt%, (e) 5 wt%, (f) 10 wt%, (g) 15 wt%, (h) 30 wt%, (i) 50 wt%, (j) 100 wt%, (k) 150 wt%, and (l) 200 wt%.
Solids 06 00053 g003
Figure 4. (a) XRD patterns of samples MTO-5 and MTO-14. (b) SEM image of sample MTO-5.
Solids 06 00053 g004
Figure 5. (a) PL emission spectra MTO-3, MTO-5, and MTO-11 phosphors excited at 320 nm excitation, and the shaded area represents the Gaussian peak fitting of the excitation peak of MTO-11. (b) Tanabe–Sugano energy-level diagram for Mn4+ (d3) electron configuration in octahedral site of MTO host. (c) CIE diagram of MTO-3, MTO-5, and MTO-11 phosphors under 320 nm excitation, here the x-axis represents the proportion of red-purple spectral components in the color, while the y-axis represents the proportion of green spectral components. (d) Photographs of samples MTO-3 and MTO-11 under daylight and UV light (365 nm).
Solids 06 00053 g005
Figure 6. (a) PLE spectra monitored at 662 nm and (b) PL spectra (λex = 320 and 465nm) of samples prepared with varying amounts of LiCl flux at 950 °C, and the shaded area represents the Gaussian peak fitting of the excitation peak of MTO-7.
Solids 06 00053 g006
Figure 7. (a) PL spectra (λex = 320 nm) for various concentrations of Mn4+ ion-doped samples. (b) The correlation between the Mn4+ ion concentration and the emission intensity at 662 nm.
Solids 06 00053 g007
Figure 8. PL spectra under 320 nm excitation for samples prepared at different sintering temperatures: (a) with 50 wt% LiCl flux and (c) without LiCl flux. (b,d) are the corresponding plots of the emission intensity at 662 nm as a function of the sintering temperature.
Solids 06 00053 g008
Figure 9. (a) Electroluminescence spectra of red LED device under different driving currents. (b) On the left is the CIE diagram of the LED device under a 100 mA driving current; on the right are photographs of the as-fabricated red LED device and the lighted one in darkness and daylight. (c) Red light power and (d) photoelectric efficiency as a function of the operating current.
Solids 06 00053 g009
Table 1. The numbers and corresponding preparation processes of samples.
No.Main ComponentsLiCl Content (wt%)Li2CO3 Content (wt%)Sintering Temperature (°C)Doping Content (mol%)
MTO-1MgTiO3:Mn009500.2
MTO-2MgTiO3:Mn0011000.2
MTO-3Mg2TiO4:Mn0013000.2
MTO-4Mg2TiO4:Mn0014000.2
MTO-5(TiO1.2).787/MgO0509500.2
MTO-6MgTiO3:Mn209500.2
MTO-7MgTiO3:Mn509500.2
MTO-8Mg2TiO4:Mn1009500.2
MTO-9Mg2TiO4:Mn1509500.2
MTO-10Mg2TiO4:Mn3009500.2
MTO-11Mg2TiO4:Mn5009500.2
MTO-12Mg2TiO4:Mn10009500.2
MTO-13Mg2TiO4:Mn15009500.2
MTO-14Mg2TiO4:Mn20009500.2
MTO-15MgTiO3:Mn5008000.2
MTO-16MgTiO3:Mn5008500.2
MTO-17Mg2TiO4:Mn50010500.2
MTO-18Mg2TiO4:Mn5009500.05
MTO-19Mg2TiO4:Mn5009500.1
MTO-20Mg2TiO4:Mn5009500.5
MTO-21Mg2TiO4:Mn5009501
Disclaimer/Publisher’s Note: The statements, opinions and data contained in all publications are solely those of the individual author(s) and contributor(s) and not of MDPI and/or the editor(s). MDPI and/or the editor(s) disclaim responsibility for any injury to people or property resulting from any ideas, methods, instructions or products referred to in the content.