Article

Effect of Heat Treatment on the Microstructure and Mechanical Properties of Vanadis 60 Steel: A Statistical Design Approach

by
Florentino Alvarez-Antolin
* and
Alejandro González-Pociño
Advanced Metal Alloys, Metal Forming and Optimization of Industrial Processes (AMPIplus), East Departmental Building, Gijón Campus, University of Oviedo, Gijón 33007, Spain
*
Author to whom correspondence should be addressed.
Solids 2025, 6(3), 46; https://doi.org/10.3390/solids6030046
Submission received: 15 July 2025 / Revised: 5 August 2025 / Accepted: 18 August 2025 / Published: 19 August 2025

Abstract

This study investigates the influence of key heat treatment parameters on the microstructure and mechanical properties of the powder metallurgy tool steel Vanadis 60. A fractional factorial design of experiments was applied to evaluate the effects of austenitising temperature, quenching medium, tempering temperature, and number of tempering cycles on hardness, flexural strength, and microstructure, using detailed phase characterisation by X-ray diffraction. The results reveal two distinct processing routes tailored to different performance objectives. Maximum hardness was achieved by combining austenitisation at 1180 °C, rapid oil quenching, and tempering at 560 °C. These conditions enhance the solubility of carbon and other alloying elements, promote secondary hardening, and reduce retained austenite. Conversely, higher toughness and ductility were obtained by austenitising at 1020 °C, air cooling, and tempering at 560 °C. These parameters favour the formation of a bainitic microstructure, together with lower martensite tetragonality and minimal retained austenite. A statistically significant interaction was identified between the austenitising temperature and the number of tempering cycles; three temperings were sufficient to compensate for the lower hardness associated with reduced austenitising temperatures. The results provide a robust guidance for optimising thermal processing in highly alloyed tool steels, enabling the precise tailoring of microstructure and properties in accordance with specific mechanical service requirements.

1. Introduction

Vanadis 60 is a tool steel specifically designed for applications requiring high wear resistance, hardness, and dimensional stability at elevated temperatures [1]. This steel is used in the production of industrial components operating under sliding, rolling, or abrasive friction at high loads [2]. It is also employed in the manufacture of cold work tools and for the high-speed machining of steels, thus classifying it as a high-speed steel [3]. These steels must retain their hardness during service at temperatures approaching 600 °C and must therefore be suitable for high-temperature tempering that induces structural hardening [4].
The production of these steels by powder metallurgy prevents dendritic segregation and the formation of eutectic carbide networks during solidification [5,6,7,8,9,10,11,12]. High-speed steels contain elevated levels of carbon and alloying elements. In the case of Vanadis 60, significant contents of Cr, Mo, W, V, and Co are noteworthy. Chromium promotes the formation of mixed carbides of the M23C6 and M7C3 types [5,13,14,15,16,17], while W and Mo can form mixed carbides of the MC and M2C types [13,18,19,20]. In addition, W and Mo, together with Fe, can form M6C-type carbides [19,21,22,23,24,25]. Vanadium tends to form MC-type carbides [23,26]. High-speed steels generally do not exhibit cementite-type M3C carbides. However, it should be noted that in this type of carbide, Cr and Co can partially substitute Fe, forming a ternary carbide with an M3C structure [25].
The effects provided by W in high-speed steels can also be achieved with Mo. The atomic weight of Mo (95.9 g/mol) is nearly half that of W (183.8 g/mol), so substituting W with half the weight of Mo results in an equivalent atomic ratio. However, Mo-containing high-speed steels are more prone to decarburisation than their W-containing counterparts. The addition of Co raises the melting temperature of these steels, allowing the use of higher austenitising temperatures. Higher austenitising temperatures promote greater carbon solubility, leading to the formation of martensite with very high hardness. Nevertheless, increased carbon solubility also reduces the martensite start temperature (Ms), increasing the amount of retained austenite after quenching.
Slow cooling rates after austenitising may favour the nucleation and growth of secondary carbides, mainly of the M7C3 type, potentially causing austenite to transform at higher temperatures than under faster cooling conditions, thus reducing the retained austenite content [27]. Cobalt stabilises austenite, so Co-containing high-speed steels typically exhibit high levels of retained austenite. For this reason, multiple tempering cycles after quenching are recommended in such steels.
If alloying elements such as Cr, V, Mo, or W are dissolved during austenitising, they remain as a solid solution in the martensite, occupying substitutional sites within the crystal lattice. When high-temperature tempering (near 600 °C) is applied, these carbide-forming elements diffuse towards ferrite dislocations, where they react with carbon and precipitate as nanometric carbides, inducing secondary hardening [28,29,30,31,32,33,34,35,36,37,38,39]. The main carbides responsible for this type of hardening are M2C (associated with W and Mo) [40] as well as M7C3 and M23C6 (both associated with Cr) [32,34,41].
At secondary hardening temperatures, ferrite contains virtually no carbon in solid solution, as most of it has already been consumed at lower temperatures to form tempering cementite. Therefore, the precipitation of secondary hardening carbides requires the prior dissolution of such cementite at elevated temperatures [41]. This process consequently demands high tempering temperatures and sufficient holding time.
In addition to hardness and wear resistance, flexural strength is a critical property for high-speed steels, especially in applications where tools are subjected to high loads [42]. The presence of fine carbides and a homogeneous martensitic microstructure are key factors for achieving a high flexural strength [11,38,43,44].
In this context, from an industrial heat treatment perspective, certain uncertainties emerge that merit clarification. For example, during austenitising, is it preferable to dissolve as much carbon and alloying elements from finely dispersed carbides as possible, or not? The former would favour the formation of harder martensite but increase retained austenite content. During quenching, should the precipitation of secondary carbides be promoted? Doing so would increase the Ms temperature and reduce retained austenite content. However, this would produce less tetragonal martensite, probably with lower secondary hardening potential during tempering. During tempering, are high temperatures preferable to promote secondary hardening? If prior thermal processing has destabilised austenite, the resulting martensite may have limited potential for secondary hardening, and high tempering temperatures could lead to excessive softening.
To address these questions, a fractional factorial design of experiments with four factors and eight experimental conditions was applied in this study [45,46,47]. Various heat treatment parameters were modified to induce changes in the microstructure, hardness, and flexural strength of Vanadis 60 steel. The statistical analysis of these changes aims to identify the optimal heat treatment combinations to maximise in-service mechanical performance, while providing a quantitative and systematic insight into microstructure–property relationships in this type of powder-metallurgy steel. To the best of the authors’ knowledge, this study represents one of the first experimental approaches to Vanadis 60 steel that combines metallographic and X-ray diffraction characterisation techniques with a systematic statistical design, allowing for the establishment of direct quantitative relationships between thermal processing parameters, phase fractions, and mechanical properties.

2. Materials and Methods

Table 1 presents the chemical composition of the Vanadis 60 alloy [2,3,23]. The experimental methodology was based on a design of experiments (DOE) with four factors, each at two levels, resulting in eight experimental conditions. Table 2 summarises the factors and levels considered. All selected factors correspond to heat treatment parameters that are industrially applicable to this type of steel. Other variables, such as sub-zero treatments, were excluded, as their implementation is not common in standard industrial processes. It should be noted that the selected quenching media—furnace cooling, air cooling, and oil quenching—are among the most commonly used in industrial practice for high-alloy tool steels, including Vanadis 60. According to the manufacturer recommendations, air and oil are preferred cooling methods depending on the geometry and size of the components, as they provide an optimal balance between hardness and dimensional stability while minimising the risk of cracking. More severe quenching media such as water or polymer solutions are generally avoided in this class of steels due to their high susceptibility to thermal stresses and cracking. Therefore, the present study focuses on representative and industrially relevant cooling conditions, rather than on an exhaustive comparison of all possible media. Table 3 shows the experimental matrix. Column D = ABC was generated from columns A, B, and C [48]. The aim of applying a DOE approach is to modify specific processing conditions to induce changes in selected material properties. In this case, the properties studied included hardness, retained austenite content, carbide fraction, and flexural strength. This analysis enables the identification of factors that have a statistically significant influence on the investigated properties. Fractional factorial designs allow the study of multiple factors simultaneously, optimising time and resources, especially in industrial contexts [49]. However, such fractional designs imply that some second-order and higher-order interactions are confounded with the effects of the main factors [50]. The effect of a given factor is calculated from the variation in the response when this factor shifts between its −1 and +1 levels. This calculated variation is referred to as the main effect [46,51]. It is also possible to determine the effects of interactions between two or more factors [52]. Table 3 also includes a column indicating the effects that will be assessed during the analysis. Second-order interaction effects appear as confounded. For instance, the effect of the AB interaction is confounded with that of the CD interaction [53]. An effect is considered statistically significant when it is sufficiently “uncommon” to be attributed to random variation.
Pareto charts were used to rank the effects under analysis in order of importance [46,54,55], and normal probability plots were employed to identify factors with statistically significant effects [56,57,58]. This reasoning is equivalent to that of an analysis of variance (ANOVA), whereby the effect of a particular factor is deemed significant when its p-value is sufficiently low—typically below 0.05 [56,59,60,61,62]. Statistical analyses were carried out using the STATGRAPHICS Centurion XVI, version 16.1.03 The Plains, VA, USA) [58,63].
In this study, main effects and interactions were estimated from the differences in experimental means corresponding to the coded levels of each factor. Consequently, the effects are expressed in the same units as the response variable, which facilitates their direct interpretation. The statistical significance of these effects was assessed using standardised t-values, calculated from the experimental standard error derived from the mean square error in the ANOVA, considering three replicates per experimental condition. This value reflects the variability associated with the repeatability of measurements within each treatment [48,56].
The sums of squares and F-ratios provided in the ANOVA table serve to statistically validate the quality of the model and to confirm the significance of the effects. However, they were not used to estimate the effects directly, since they describe variability in quadratic terms and are therefore not comparable with the linear effects obtained from differences in means. A significance threshold of t = ±2.145 was adopted, corresponding to the critical value of Student’s t-distribution with 14 degrees of freedom and a 95% confidence level [56,64,65].
In cases where experimental replicates were not performed—such as for the quantification of retained austenite or the relative carbide content—it was not possible to estimate the experimental error or apply inferential statistics based on t-values. Instead, a qualitative graphical analysis was conducted using normal probability plots, identifying as significant those effects that deviated clearly from the general alignment [56,64,65]. This approach is commonly applied in experimental designs without replication and allows relevant trends to be detected when a quantitative statistical basis is insufficient.
Finally, since some second-order interaction effects are confounded in fractional designs, whenever a confounded effect was found to be significant, separate graphical representations were used for each of the implicated interactions. By observing the mean response values for each combination of coded factor levels, it was possible to infer which of the confounded interactions was actually responsible for the observed effect.
All specimens were subjected to heat treatments according to a fractional factorial experimental design. Austenitisation was carried out at either 1020 °C or 1180 °C for 15 min in a conventional muffle furnace under air atmosphere. After austenitisation, samples were cooled by either air cooling at 23 °C or oil quenching, also at 23 °C. Subsequent tempering was performed at either 500 °C or 560 °C, with each cycle lasting 1 hour. Depending on the experimental condition, two or three tempering cycles were applied. All heat treatments were conducted on bulk material blocks, which were later machined into test specimens to eliminate possible surface decarburization.
To determine the critical transformation temperatures of Vanadis 60 steel, a type K thermocouple was inserted into a machined slot at the core of each block, and temperature data were collected using a SE521 data logger at 1 s intervals. Four different thermal cycles were analysed: heating in a furnace up to 1100 °C, cooling in the same furnace, cooling in still air, and quenching in oil at 23 °C. For each condition, a conventional temperature–time cooling curve was recorded. Subsequently, a thermal analysis curve was constructed, in which the x-axis represented the time required for each 5 °C temperature change and the y-axis the lower temperature of each interval. This approach enhances the visibility of transformation reactions during fast cooling by increasing the sensitivity to slope variations.
The weight fractions of the precipitated phases were determined by X-ray diffraction (XRD) using a Seifert XRD 3000 T/T diffractometer (Baker Hughes, Celle, Germany), operating in a θ–θ configuration with a Mo X-ray source (λ = 0.7107 Å), at 40 kV and 40 mA. The instrument was equipped with primary and secondary monochromators to isolate the Kα1 line, and the scanning range was set from 8° to 37° in 2θ, with a step size of 0.03° and a counting time of 22 s per step. Measurements were performed on 50 × 30 × 5 mm specimens, whose surfaces were ground to 800 grit to minimise topographic effects. Phase quantification was conducted by Rietveld refinement [66], using crystallographic data from the ICSD (Inorganic Crystal Structure Database, FIZ Karlsruhe, Eggenstein-Leopoldshafen, Germany). Background correction and instrumental broadening were managed using the multipattern-capable software FullProf.2k (version 8.10, October 2024) [67,68,69,70]. Peak broadening was modelled using the Stephens formalism, as implemented in the software [71].
Three-point bending tests were carried out in accordance with UNE-EN-ISO 178:2020, using an Instron 5582 universal testing machine (Instron, Norwood, MA, USA) at a crosshead speed of 1 mm/min and a maximum load capacity of 100 kN. The specimens had a thickness of 3 mm and a width of 10 mm, with a support span of 60 mm.

3. Results and Discussion

Thermal analysis is a key tool for identifying critical transformation points in metallic alloys during heating and cooling. However, when the cooling rate is not sufficiently slow, conventional time—temperature curves may lack the sensitivity needed to accurately detect these transitions. To enhance the identification of phase changes under rapid thermal conditions, Figure 1 presents an alternative representation in which the x-axis denotes the time required for the temperature to increase or decrease by 5 °C, rather than the absolute process time. This method improves the visibility of inflexion points associated with phase transformations. The curves span the heating process up to 1100 °C and the cooling phase from that temperature under different conditions. Based on this approach, the austenitisation temperature was identified at approximately 860 °C. During furnace cooling, the formation of eutectoid constituents appears to initiate near 805 °C. In the case of oil quenching, the start of martensitic transformation (Ms) occurs around 280–290 °C. Under air cooling, the first transformation from austenite to bainite is observed at ~390 °C, followed by a secondary martensitic transformation at ~300 °C.
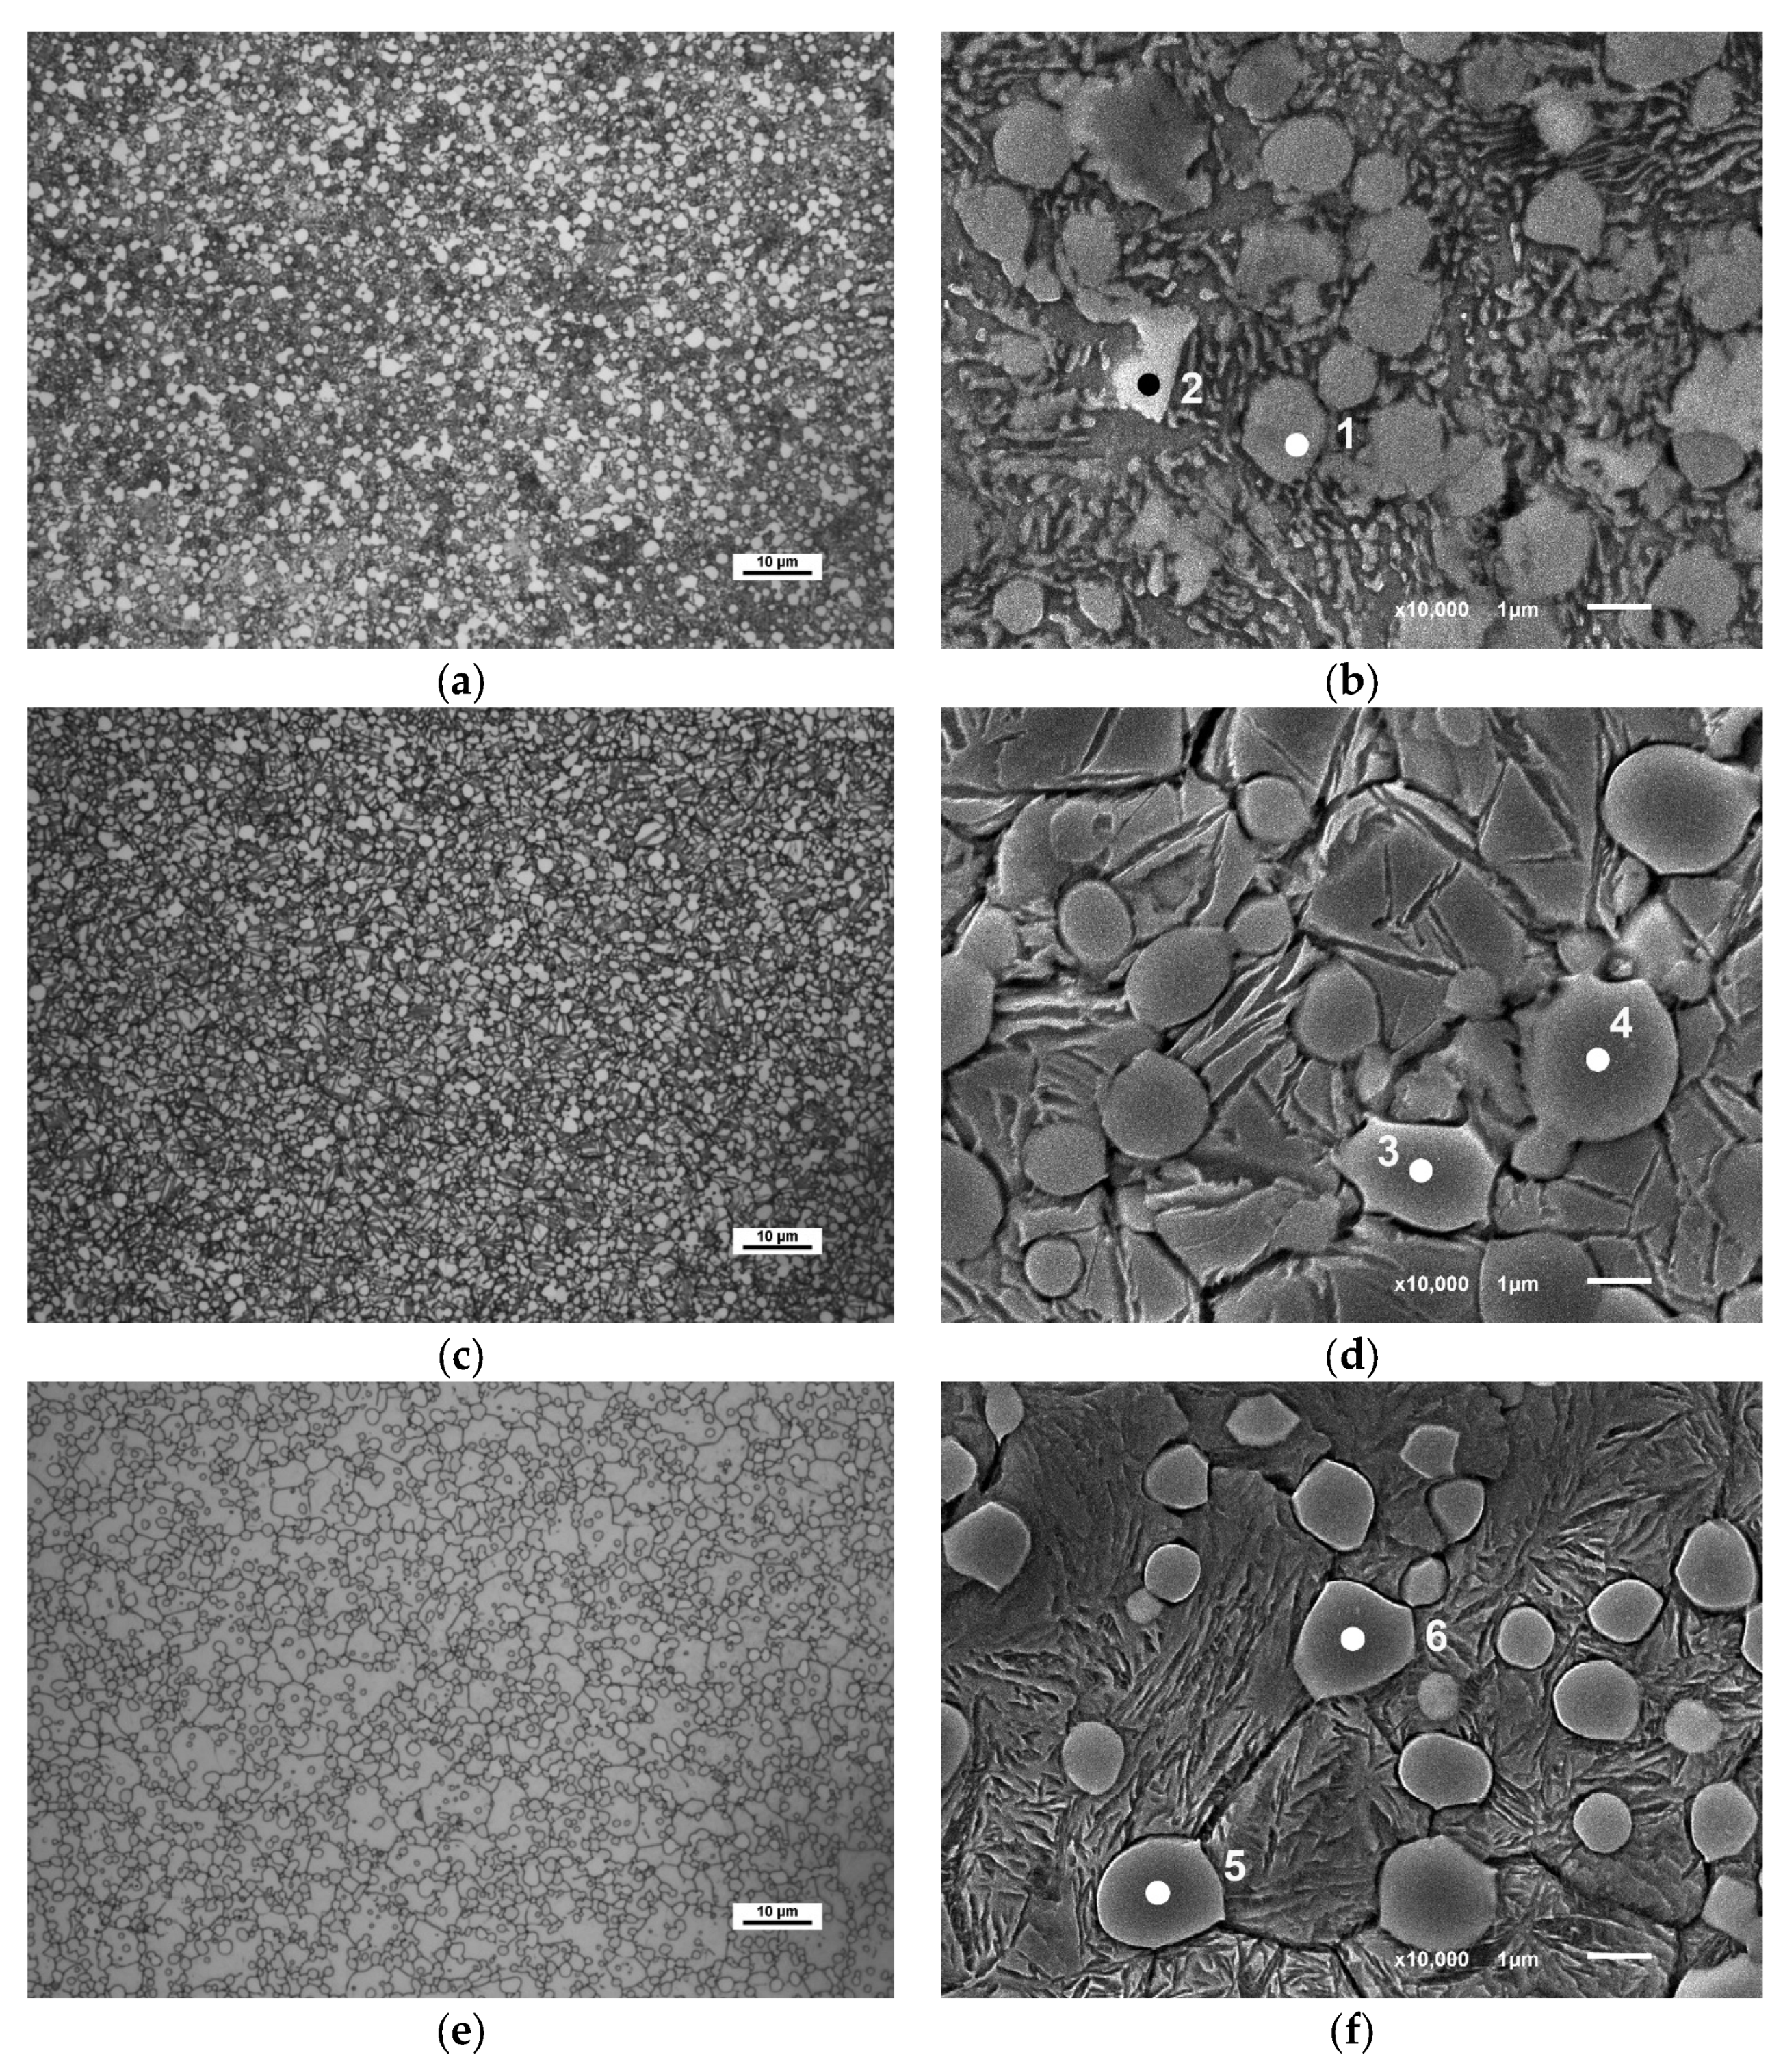
Figure 2 shows the resulting microstructures for each of these cooling conditions, confirming that the observed phases correspond to the previously described austenite transformations.
Table 4 presents the results of the chemical analysis performed by Energy-Dispersive X-ray Spectroscopy (EDX) on the carbides present in the microstructure after different cooling rates. This analysis enabled the identification of the main constituent elements of the carbides, as well as their semiquantitative atomic percentages.
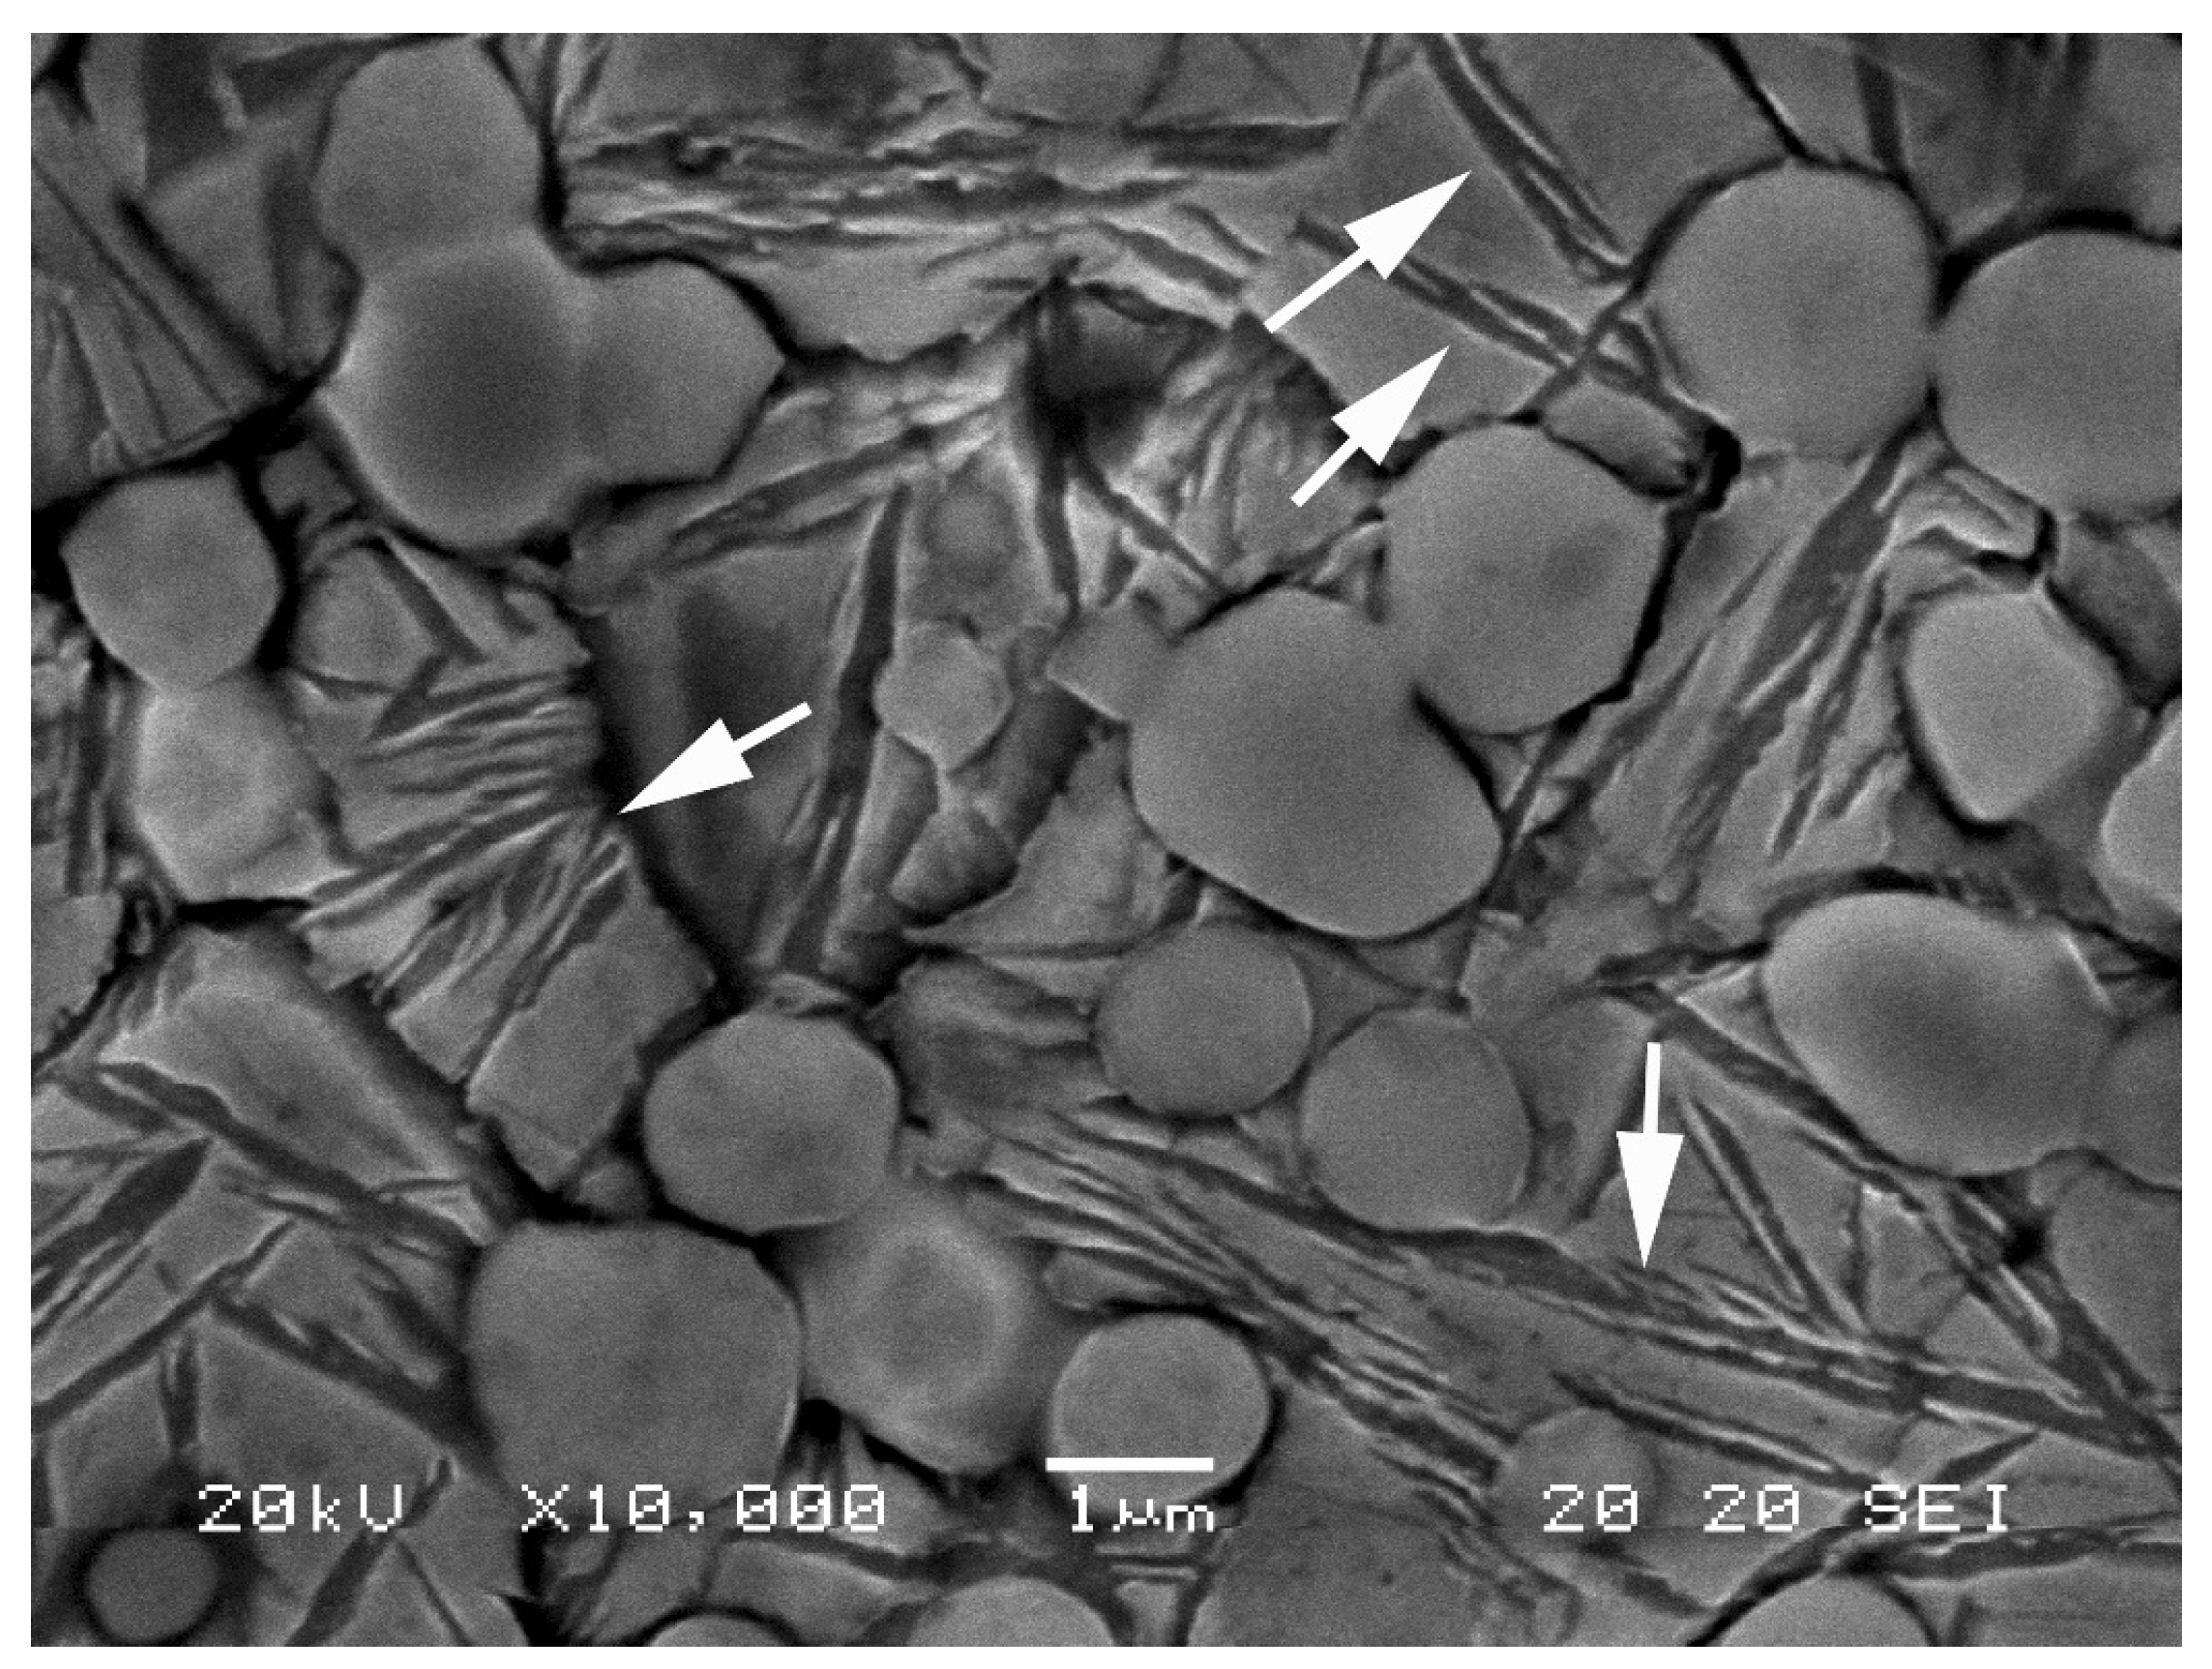
Figure 3 highlights the presence of bainite in the microstructure obtained after air cooling. Fine white plates of carbides can be observed, aligned parallel to the ferrite needles—features that are characteristic of upper bainite.
Figure 4 displays the measured hardness values. The results for each material condition were highly consistent, resulting in very narrow error margins.
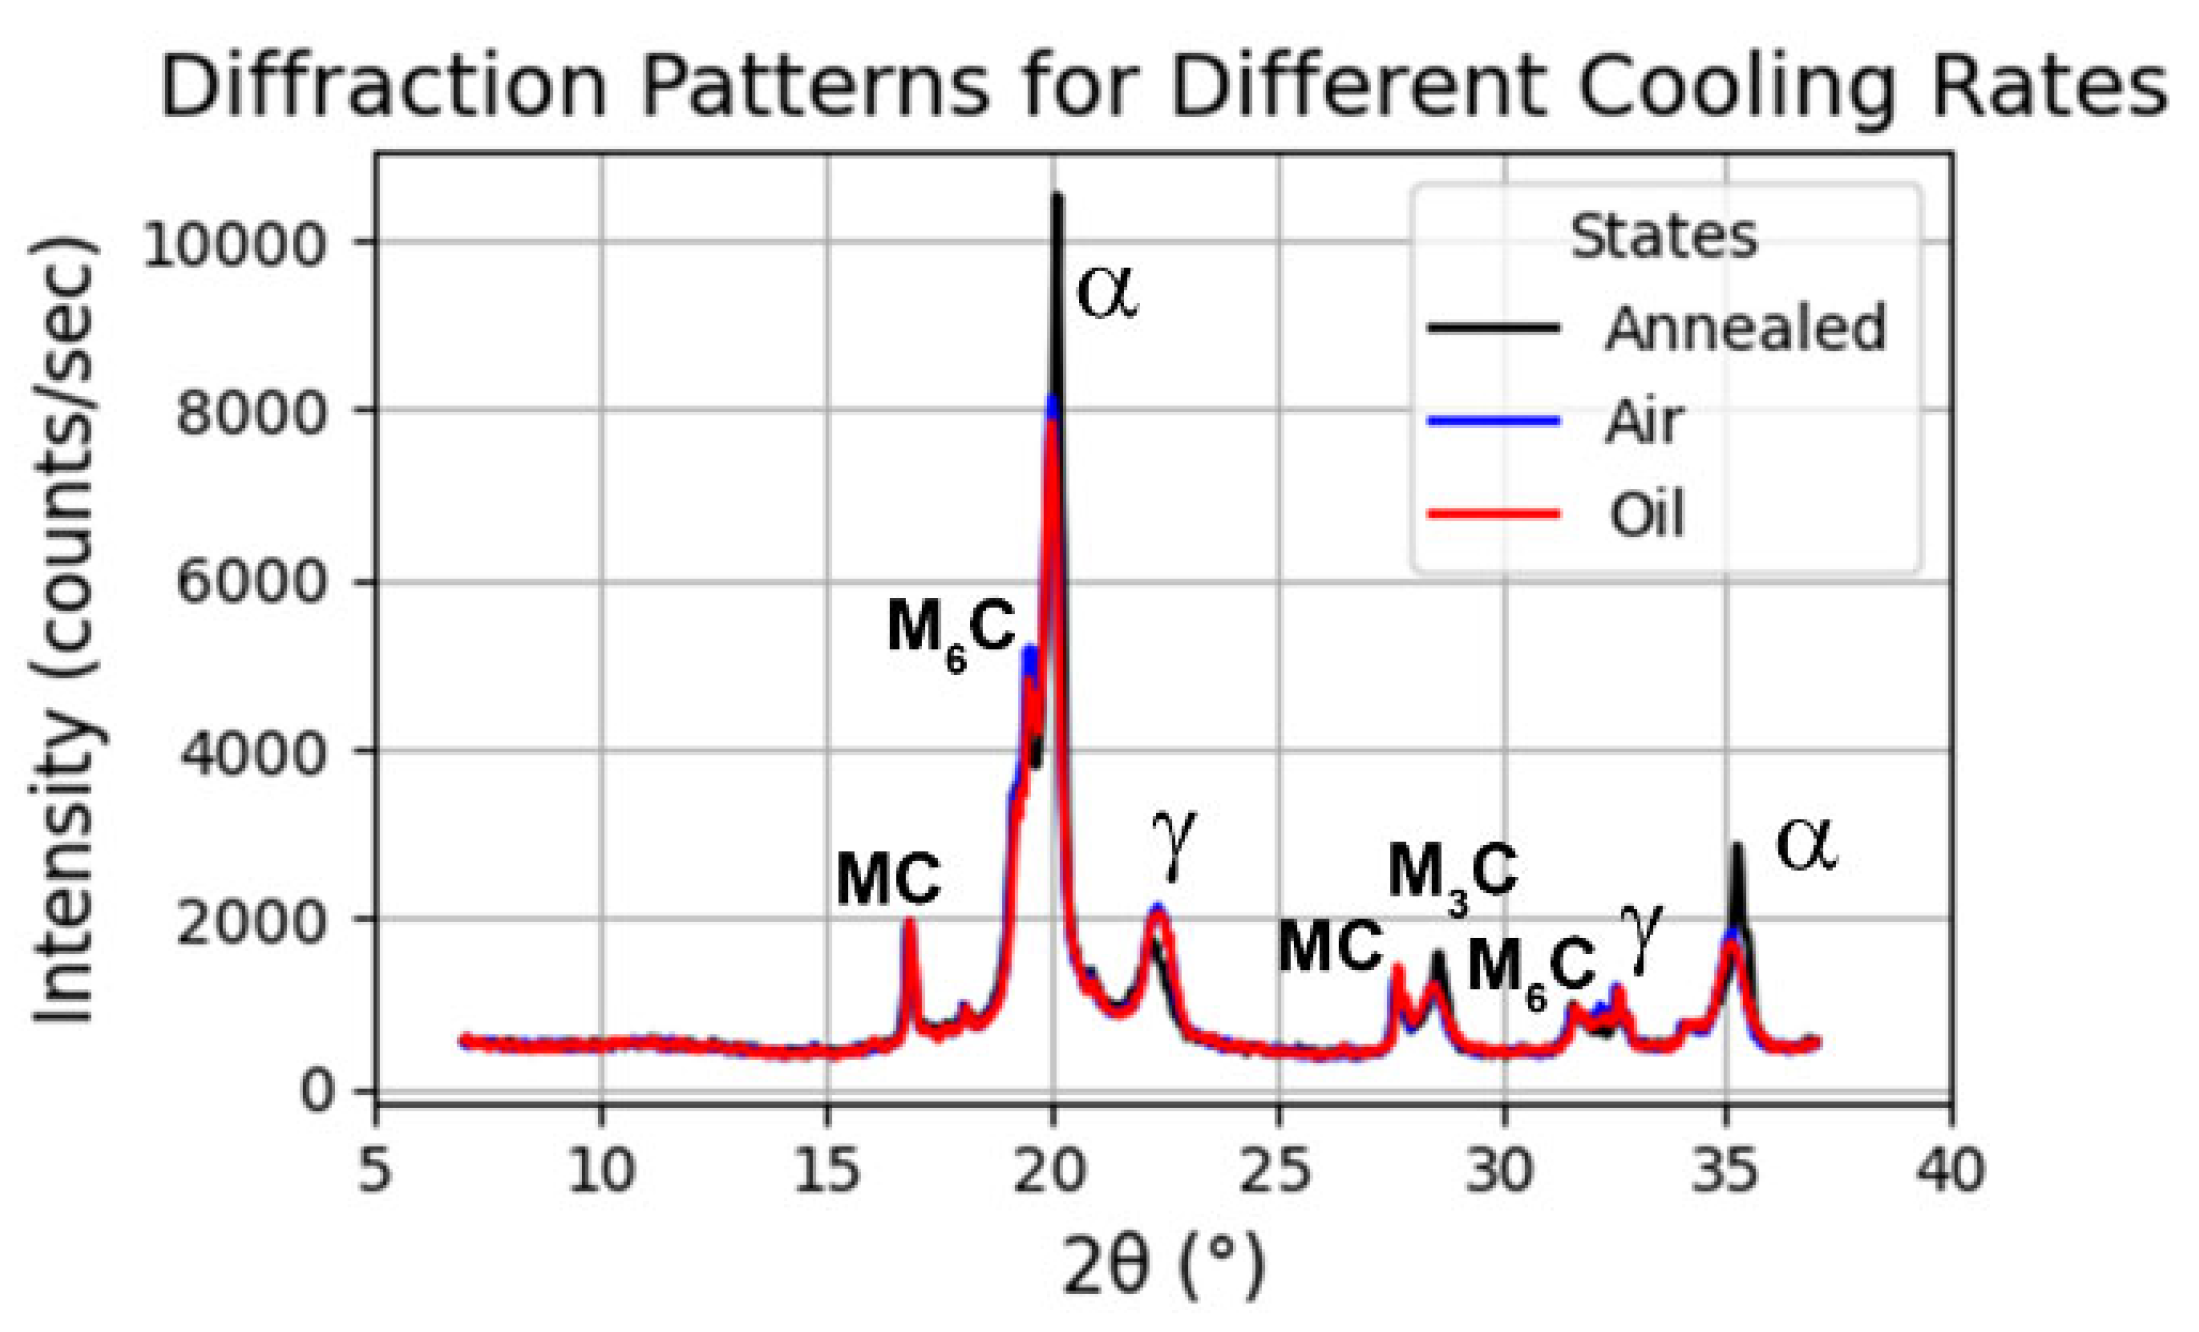
Table 5 presents the weight fractions of the crystalline phases determined by Rietveld refinement for three cooling conditions: furnace cooling (annealed), air cooling, and oil quenching. The results confirm that the cooling rate significantly influences the phase distribution. In the annealed condition, the ferritic phase (α) predominates over retained austenite, whereas faster cooling rates increase the retained austenite (γ) content, in agreement with the changes observed in the relative intensities of the diffraction patterns (Figure 5). Slow furnace cooling promotes the precipitation of secondary carbides—preferably of the cementite type—which contributes to a lower amount of retained austenite. In contrast, air and oil cooling reduce the amount of cementitic carbides compared with furnace cooling.
Figure 5 shows the X-ray diffraction patterns obtained for the material after heat treatment under the three different cooling conditions. The characteristic peaks of ferrite (α) and austenite (γ) appear at 2θ positions consistent with values reported in the literature, while additional peaks indicate the presence of secondary carbides (M3C, M6C, and MC). The variation in relative intensities reflects an increase in the proportion of retained austenite as the cooling rate increases, underscoring the influence of the thermal process on the material’s microstructure.
From a microstructural standpoint, the relative distribution of ferrite, retained austenite, and carbides is similar in the air-cooled and oil-quenched samples. However, significant differences in hardness are observed between these two conditions (Figure 4). Additionally, the refined lattice parameter of the ferrite phase increases progressively from the annealed condition to the air-cooled and oil-quenched conditions. This trend is interpreted as an indication of an increased solid solution of alloying elements, which is characteristic of martensite. It is therefore inferred that the “ferrite” in the air-cooled sample consists of a mixture of upper bainite and some martensite, while in the oil-quenched condition, it corresponds primarily to martensite. This interpretation is consistent with the higher hardness observed in the oil-quenched samples. It should be noted that although martensite exhibits slight tetragonality, this distortion could not be distinguished by XRD as the analysis was performed assuming a BCC structure, which is common practice when tetragonality is low or peaks are overlapped.
Although the retained austenite contents may seem relatively high, they are consistent with the alloy’s chemical composition—particularly its high cobalt content—and with the presence of multiple alloying elements that delay the martensitic transformation [72]. Furthermore, the XRD analyses were conducted prior to tempering, when retained austenite typically reaches its maximum level.
The experimental results for the Vickers hardness of Vanadis 60 steel under the eight heat treatment conditions are presented in Table 6. Each value corresponds to the mean of three replicates. Based on these data, the estimated effects of the factors and their interactions are summarised in Table 7. The statistical analysis indicates that several factors significantly influence hardness, as confirmed by their p-values below 0.05. Table 8 presents the ANOVA results, showing that the model explained 99.33% of the variability in hardness (adjusted R2 = 98.90%), confirming the robustness of the analysis and the reliability of the observed trends.
Figure 6 presents the Pareto chart of standardised t-effects obtained for Vickers hardness. The main effects and interactions were normalised using the experimental error (MSerror = 69.484) derived from the ANOVA, considering the number of replicates per condition. The statistical significance threshold was set at ±2.145, corresponding to the critical value of Student’s t-distribution with 14 degrees of freedom and 95% confidence. Effects exceeding this absolute value are considered statistically significant.
The analysis of the standardised t-values reveals that factors B (quenching medium), A (austenitising temperature), C (tempering temperature), and D (number of tempering cycles) exert a statistically significant influence on Vickers hardness. In addition, the aliased interaction AD + BC also exceeds the threshold. In fractional factorial designs, aliased interactions represent the superposition of two or more effects that cannot be separated with the available data. In this case, the graphical analysis (Figure 7) suggests that the A × D interaction is primarily responsible for the observed effect, indicating that the negative influence of austenitising at 1020 °C may be mitigated by applying three tempering cycles. Indeed, the average hardness for specimens austenitised at 1020 °C and subjected to two tempering cycles is 837 HV, whereas increasing the number of tempering cycles to three raises the average hardness to 940 HV.
It is also worth noting that, although factor D is statistically significant (t ≈ 2.19), its standardised t-value lies very close to the threshold, suggesting a modest yet potentially relevant influence, particularly when considered alongside interaction effects. Overall, maximum hardness was achieved under the following conditions: austenitising at 1180 °C, oil quenching, and tempering at 560 °C with two or three cycles. Tempering at 560 °C can contribute to the reduction in retained austenite, particularly in specimens quenched from elevated austenitising temperatures. It should be noted that cobalt tends to stabilise austenite after quenching, thus requiring two or three tempering cycles to reduce the retained austenite content. A relatively high tempering temperature, such as 560 °C, is also needed to promote secondary hardening. Additionally, austenitising temperatures close to 1200 °C are required to achieve greater carbon solubility in austenite. All these factors contribute to the hardening of this steel [73].
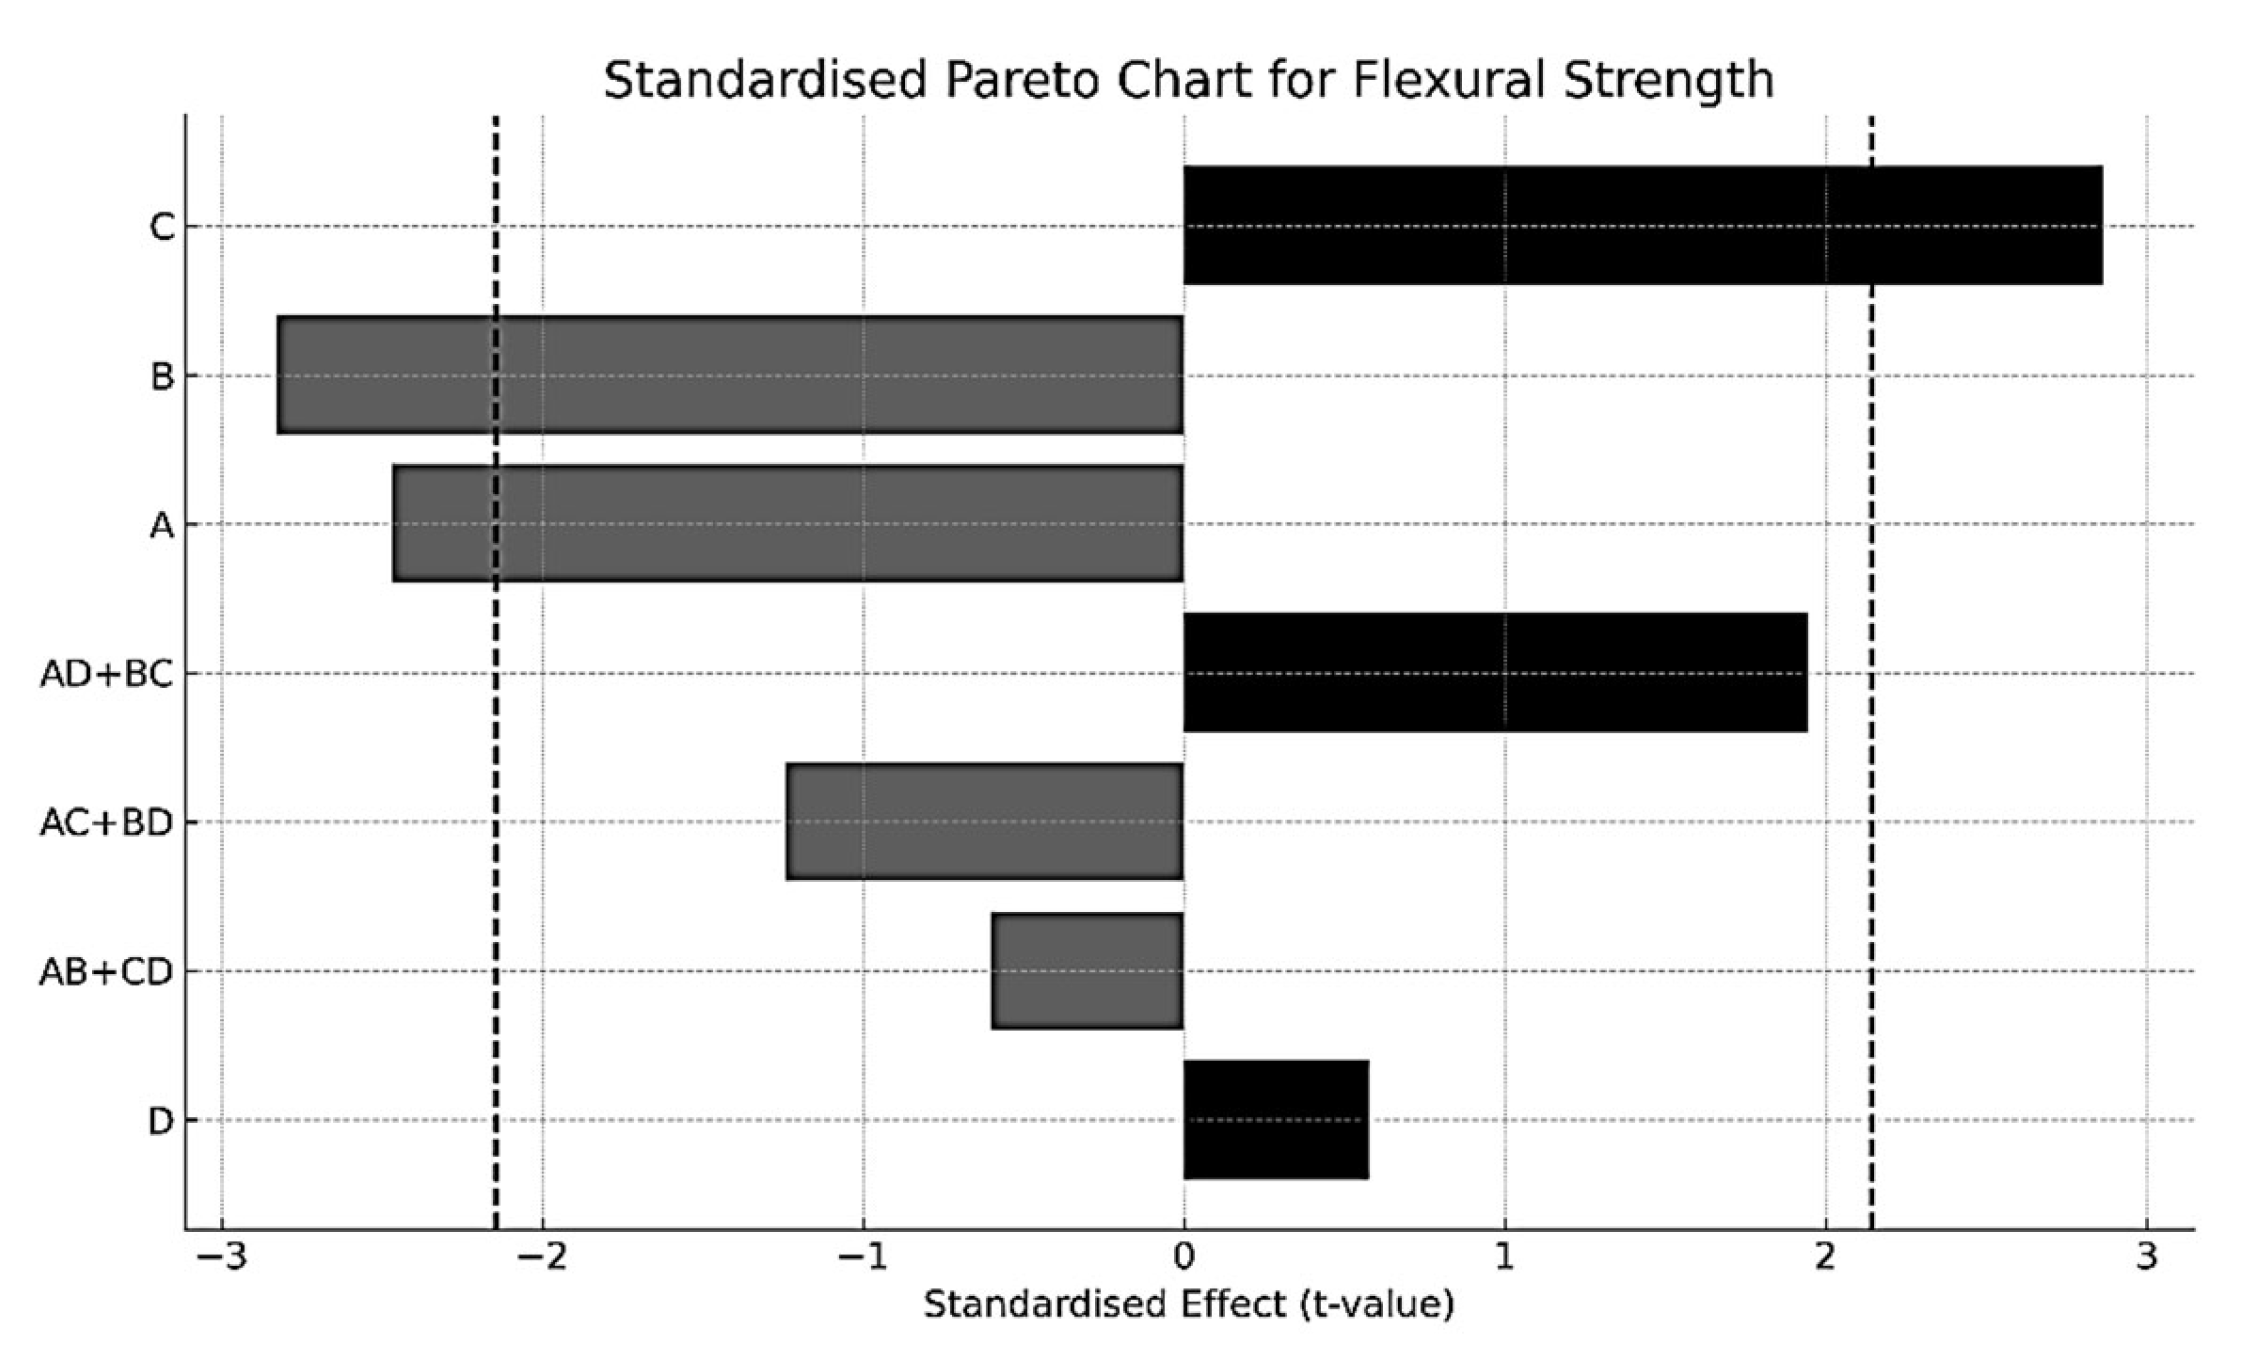
The experimental results for three-point bending strength are summarised in Table 9. Mean values were calculated from three replicates per experimental condition. Table 10 presents the estimated effects and their 95% confidence intervals. The corresponding ANOVA is shown in Table 11, with a high coefficient of determination (R2 = 94.27%) and an adjusted R2 of 90.59%, confirming the good fit of the model.
Figure 8 presents the Pareto chart of the standardised t-effects obtained for bending strength. The statistical analysis enabled a robust identification of the factors that significantly influenced bending performance. The main effects A (austenitising temperature), B (quenching medium), and C (tempering temperature) exhibited standardised t-values exceeding the bilateral significance threshold (t = ±2.145), thereby confirming their statistically relevant impact on the response variable. The aliased interaction AD + BC approached the significance threshold but did not exceed it and thus is considered statistically inconclusive. The remaining interactions were clearly non-significant, as reflected in both the ANOVA and the standardised Pareto chart.
In this case, it may be concluded that austenitising at 1020 °C, air cooling, and tempering at 560 °C significantly increase bending strength. This improvement can be attributed to the formation of a bainitic structure (resulting from austenitising at 1020 °C and air cooling), combined with conditions that reduce the retained austenite content. Lower austenitising temperatures, such as 1020 °C, promote a reduced carbon solubility in austenite and, consequently, lower hardenability. When combined with air cooling—as previously discussed (Figure 1 and Figure 3)—this condition favours the formation of a predominantly bainitic matrix instead of a fully martensitic one [74,75]. This microstructure appears to be beneficial for enhancing flexural strength.
The experimental results for displacement at fracture are summarised in Table 12. Table 13 presents the estimated effects and their standardised t-values, which allow the identification of the most influential factors based on the experimental error and replication level. The ANOVA results shown in Table 14 confirm the robustness of the model, which explains 93.32% of the response variability (R2), with an adjusted coefficient of determination (adjusted R2) of 89.03%.
Figure 9 shows the standardised Pareto chart, providing a hierarchical visualisation of the relative magnitude and statistical significance of the effects, distinguishing positive and negative effects through a greyscale, and including a reference line at t = ±2.145 as the statistical significance threshold.
The statistical analysis conducted on the maximum deflection values obtained from the three-point bending tests reveals that factors B (cooling medium), A (austenitising temperature), and the aliased interaction AD + BC exhibit statistically significant effects as they exceed the bilateral standardised t threshold (|t| > 2.145). Indeed, relatively low austenitising temperatures, such as 1020 °C, combined with air cooling, promote a microstructure in which the matrix consists of a mixture of bainite and martensite. In contrast, higher austenitising temperatures (e.g., 1180 °C) followed by oil quenching result in a fully martensitic matrix. These results suggest that conditions favouring a bainitic structure over a martensitic one tend to enhance ductility under bending loads.
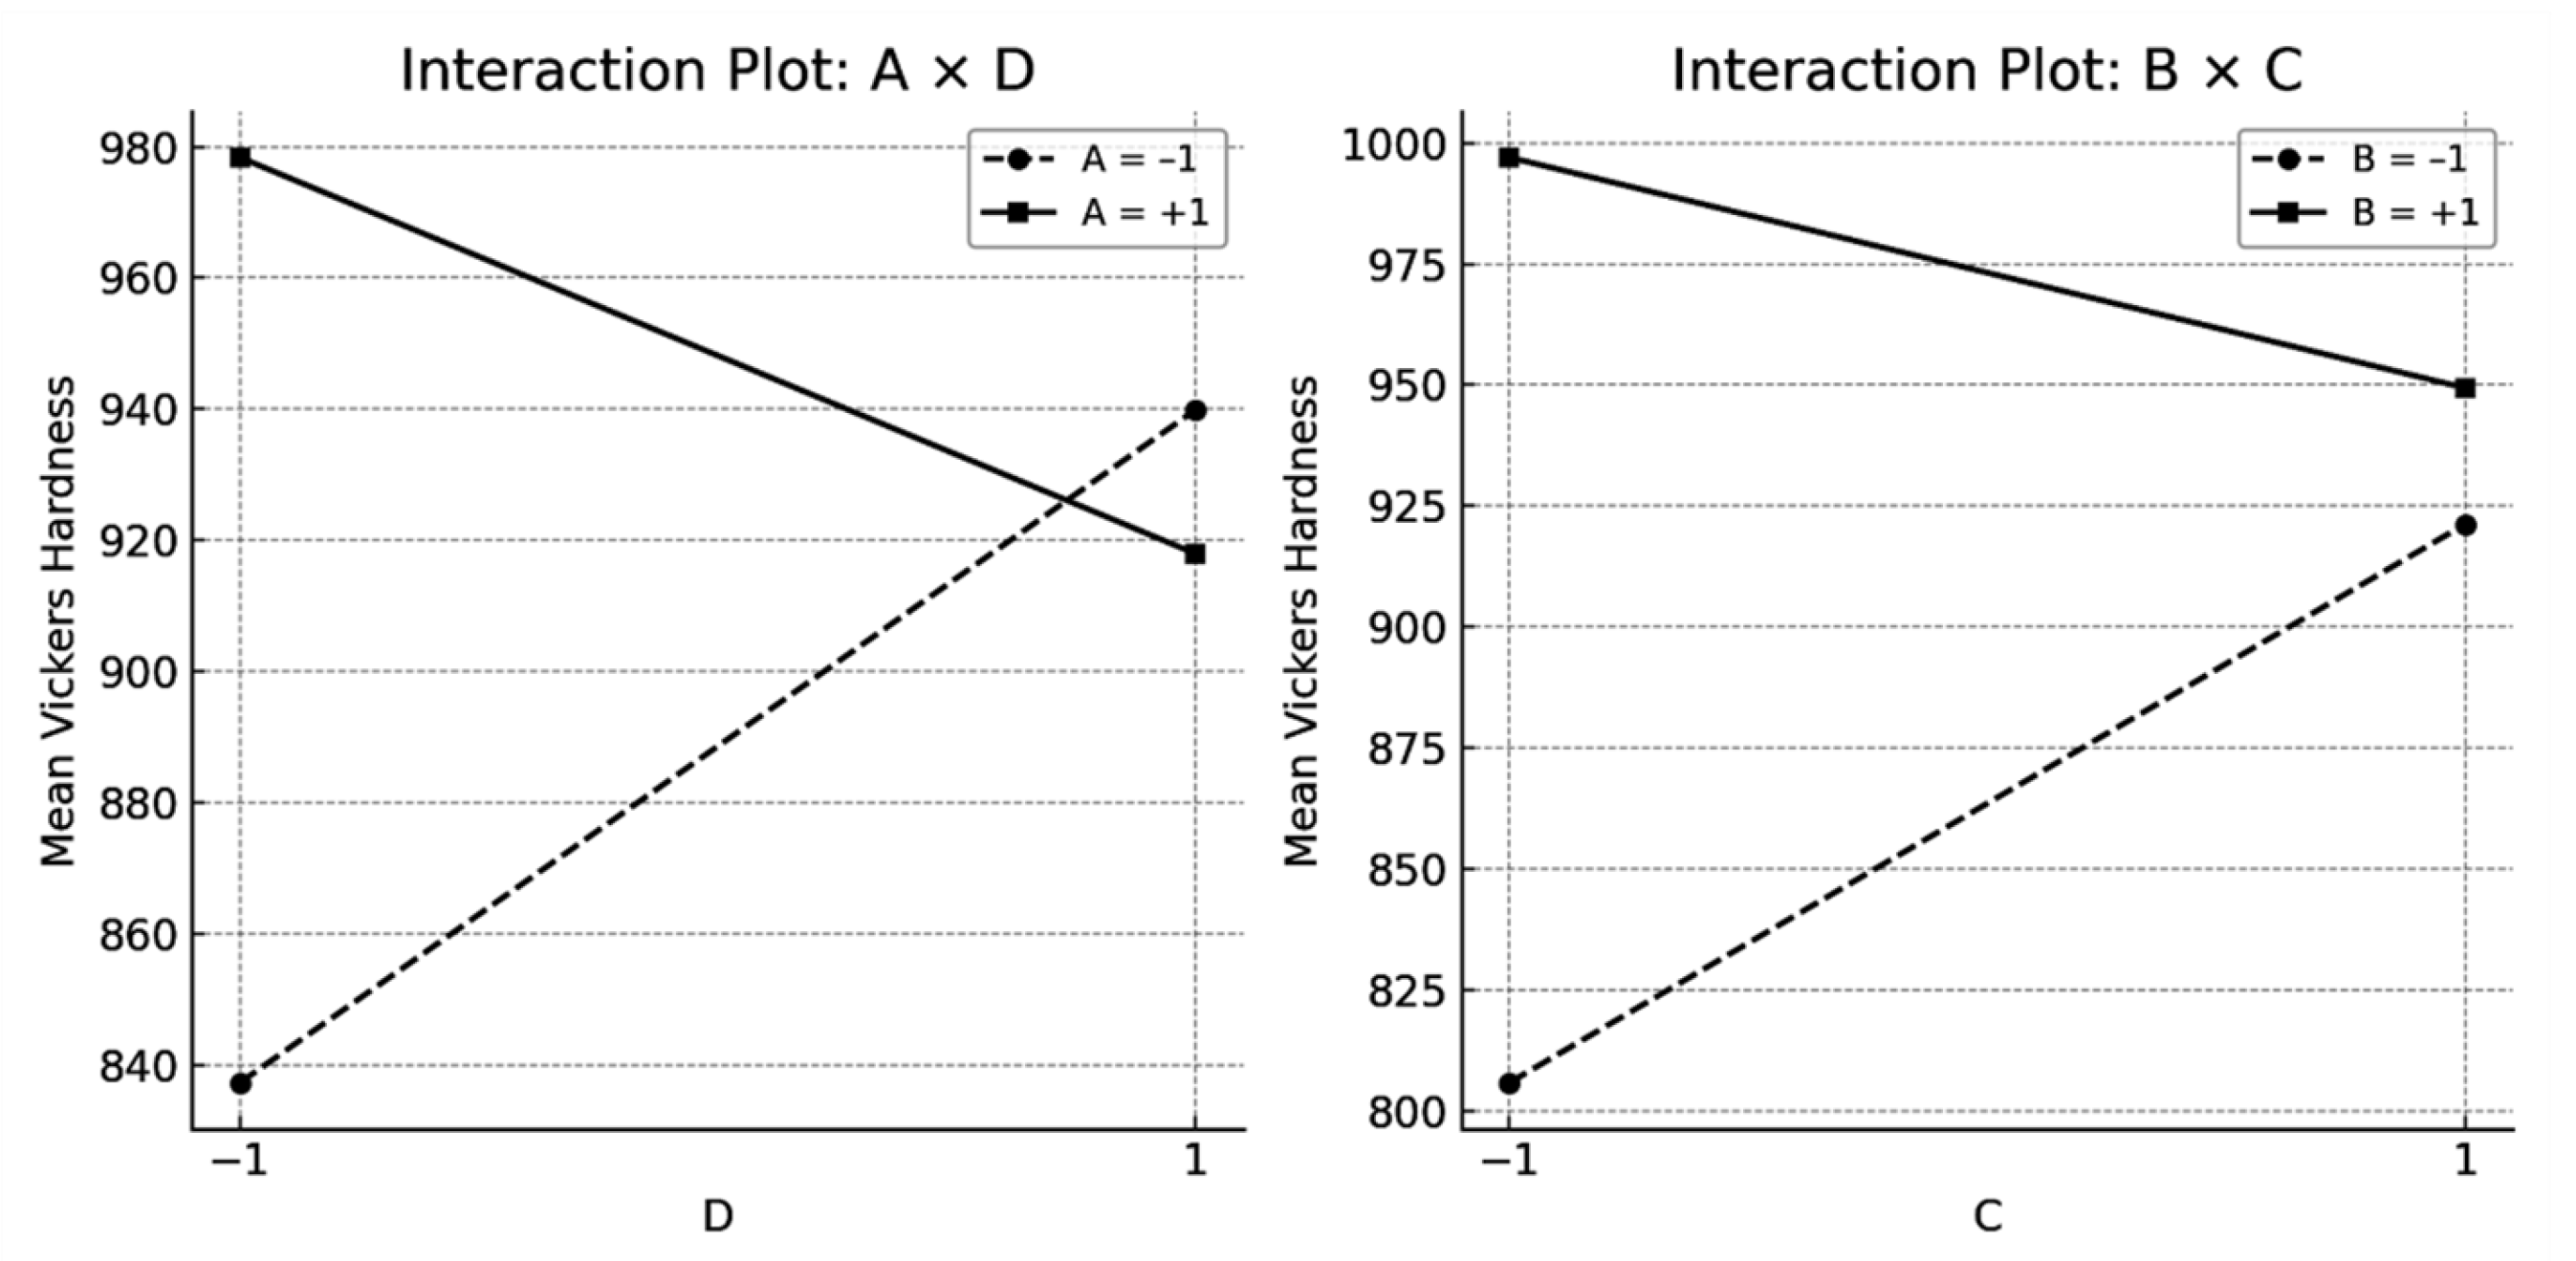
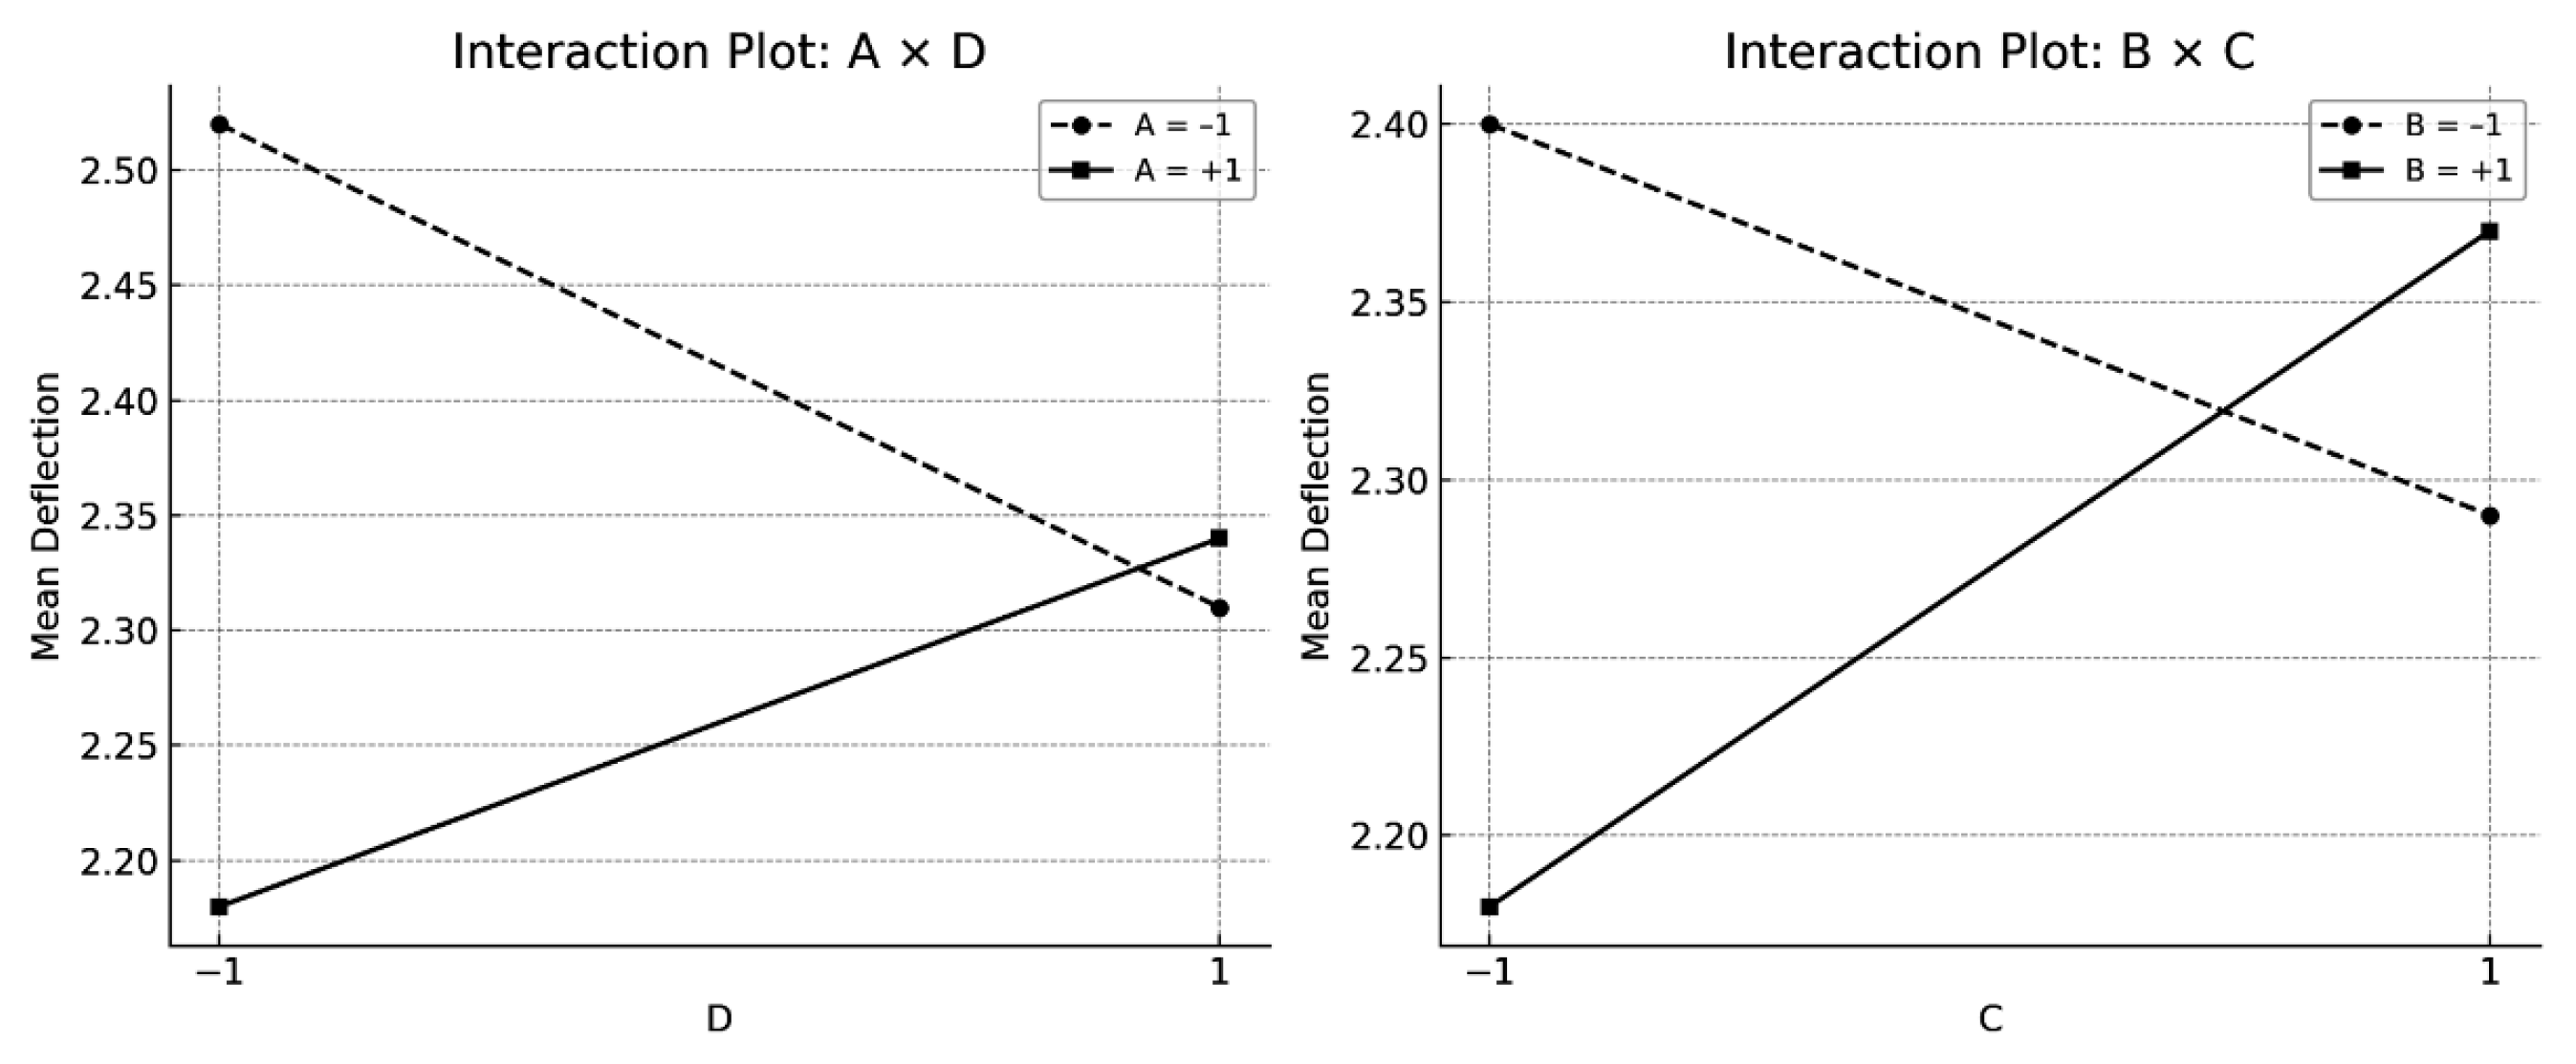
Figure 10 shows the interaction plots corresponding to the factor pairs A × D and B × C, whose combined interaction proved to be statistically significant. In both cases, the presence of clear non-parallelism between the lines indicates that the effect of one factor depends on the level of the other. For the A × D interaction, it is observed that the negative effect of austenitising at 1180 °C (Factor A at level +1) is mitigated when the number of tempering cycles is increased to three (Factor D at level +1). This could be attributed to more ‘intense’ tempering of the martensite or, in other words, a more pronounced transformation of martensite into ferrite. Similarly, in the case of the B × C interaction, the detrimental effect of oil quenching (Factor B at level +1) appears to be alleviated by tempering at 560 °C (Factor C at level +1). Indeed, high tempering temperatures seem to favour the destabilisation of retained austenite and its subsequent transformation into martensite [35,76].
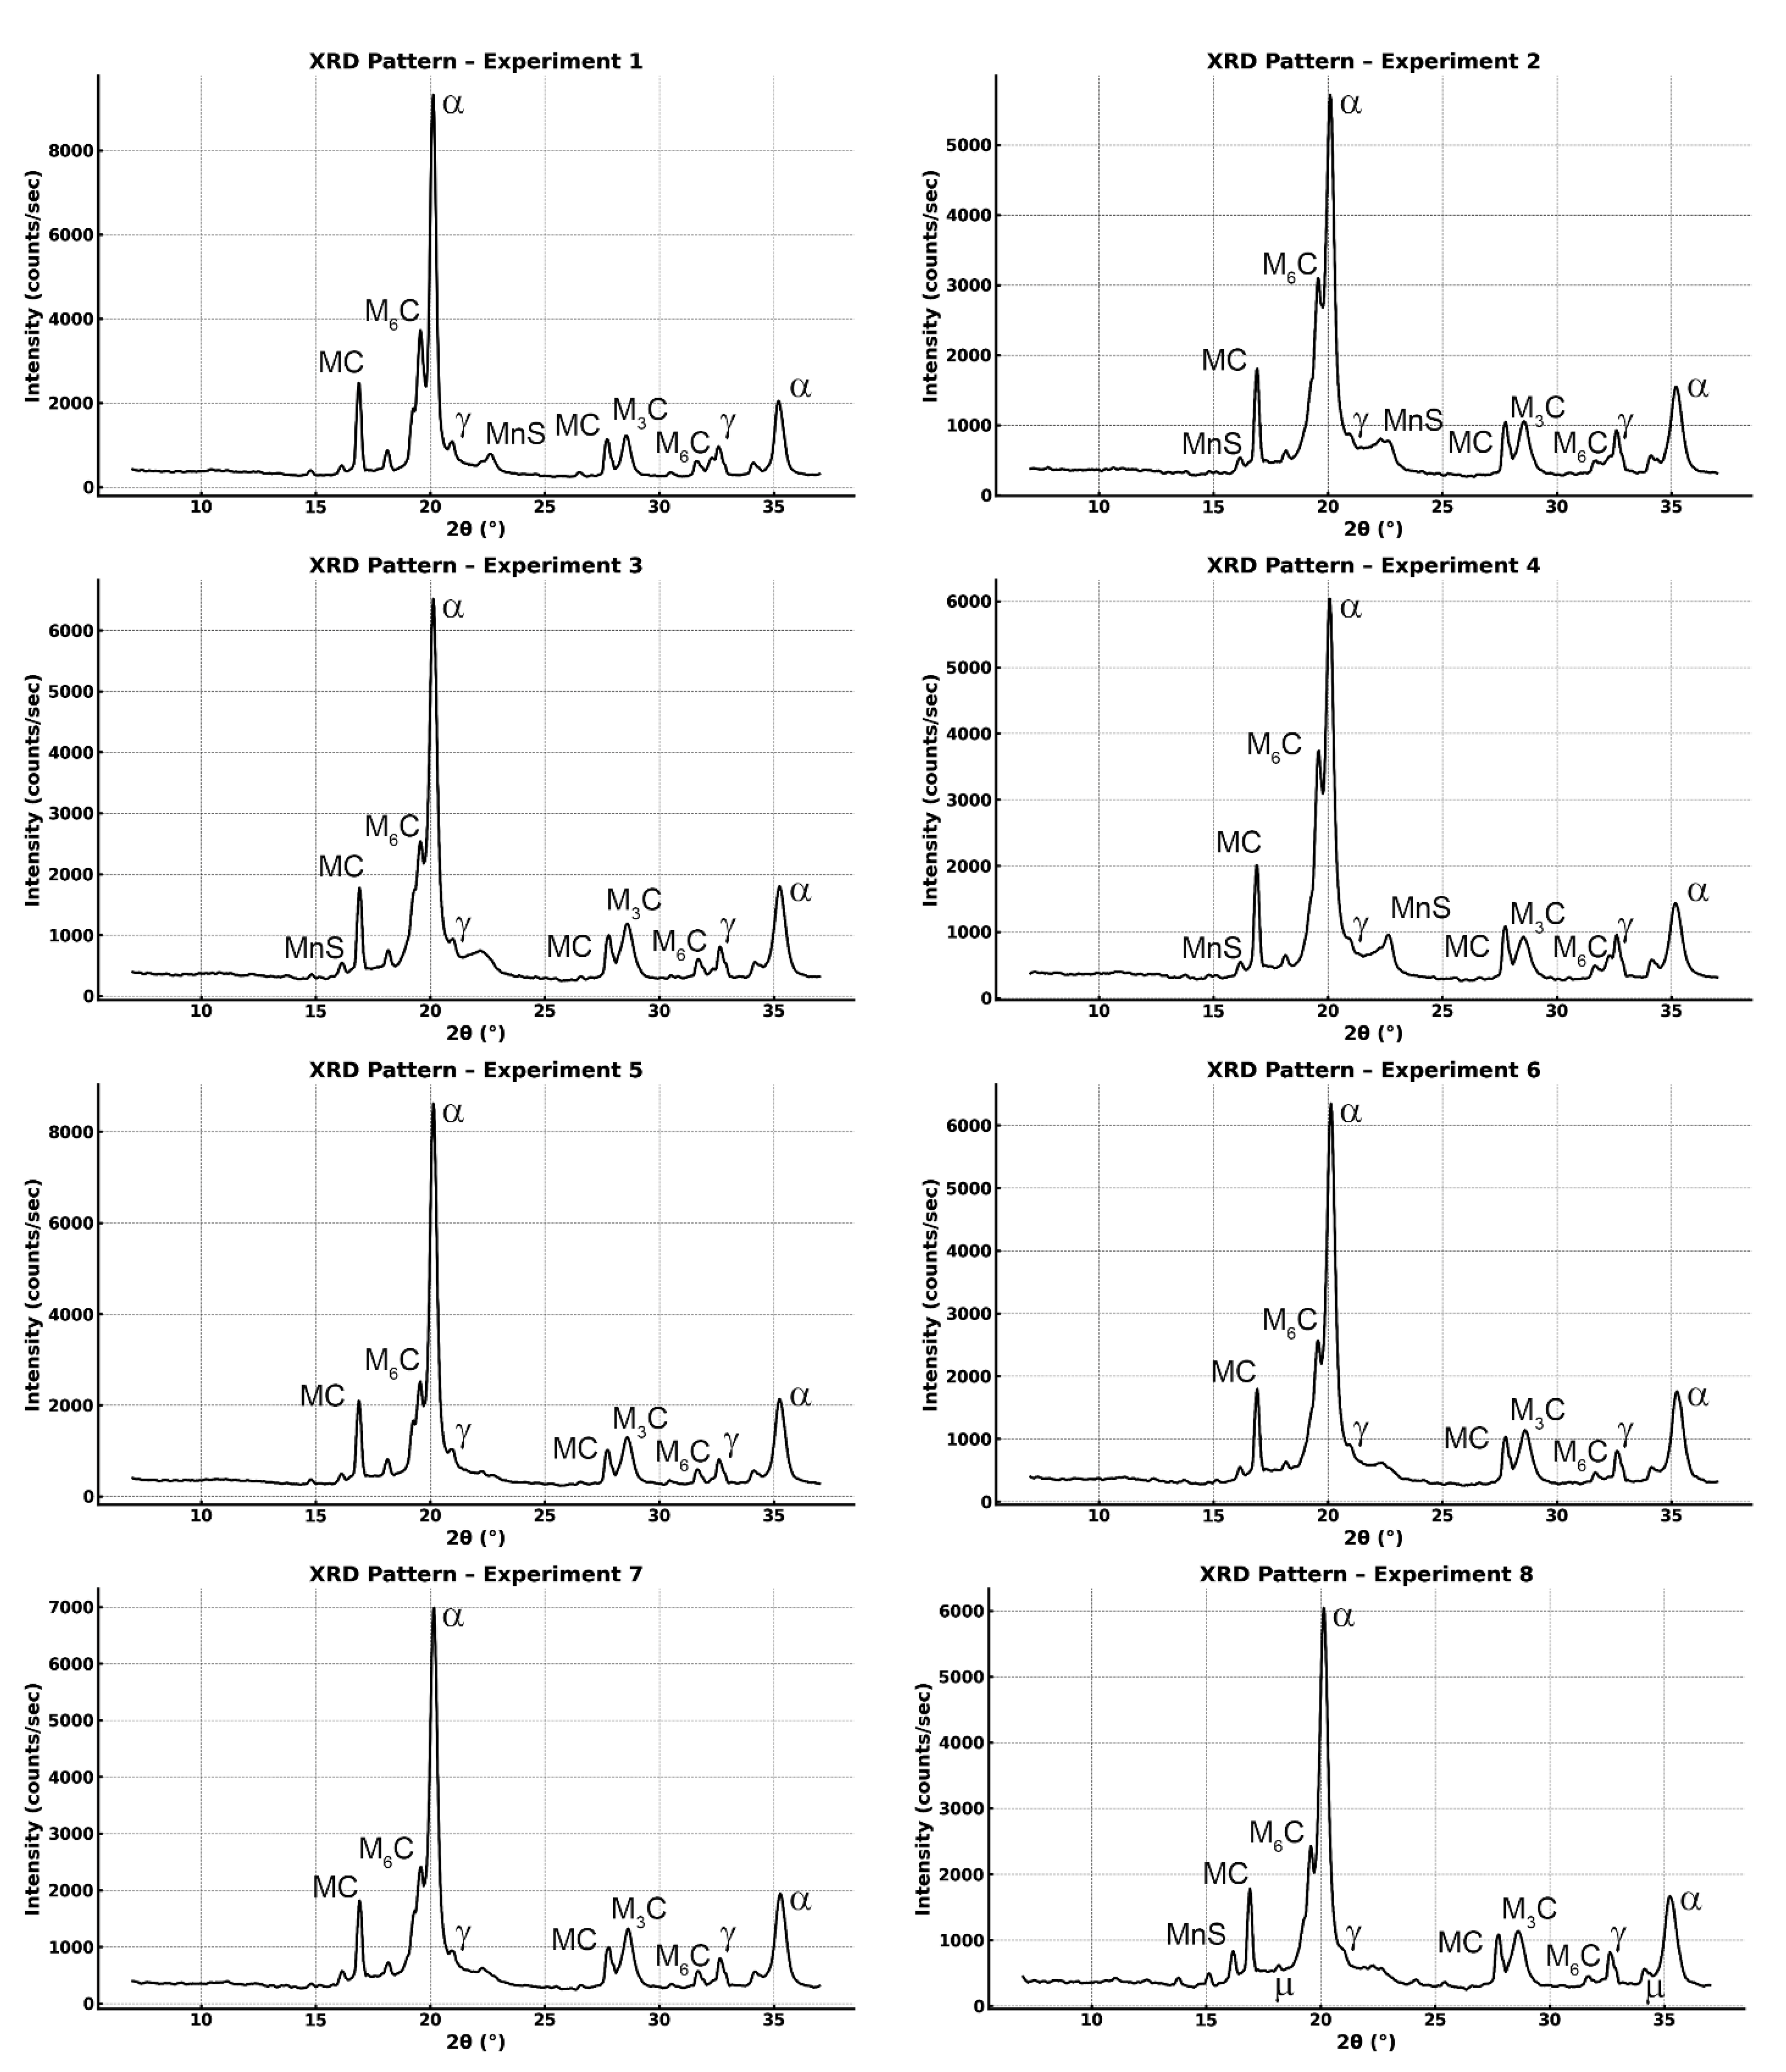
Table 15 presents the weight percentages of the main crystalline phases identified by X-ray diffraction in each of the eight experiments. It should be noted that ferrite (α) is the majority phase in all cases, and the primary carbides detected are of the MC, M6C, and M3C types. Retained austenite was only detected in experiments 1, 2, and 4. Figure 11 displays the corresponding diffractograms for these experiments. During the analysis of these diffractograms, a secondary phase with hexagonal symmetry was identified in experiment 8, whose peak positions and interplanar spacings closely match those characteristics of the μ-phase (Fe7W6). This intermetallic phase is known to form in steels with high tungsten and molybdenum contents under specific thermal conditions [77,78]. Its estimated weight fraction, calculated by Rietveld refinement, was 1.97 % ± 0.57 %, and it was detected exclusively in experiment 8. Although it was not quantified in the remaining experiments, it is plausible that this phase may also be present in other conditions, but in amounts below the detection limit of the Rietveld method. It is important to emphasise that in X-ray diffraction, a peak may be visible in the diffractogram without being recognised as a significant phase by the Rietveld refinement, due to model constraints and the relatively low intensity of the peak. Although its presence was only confirmed in one condition, the formation of the μ-phase (Fe7W6) is typically favoured in high-alloy tool steels containing elevated levels of W and Mo, particularly under prolonged tempering or exposure to intermediate temperatures, usually ranging between 500 and 700 °C [77,78]. This intermetallic phase can precipitate both in the matrix and along grain boundaries. Despite its high intrinsic hardness, its incoherent interfaces and brittle nature make it a potential site for crack nucleation. Consequently, its presence has been associated with a reduction in fracture toughness and impact resistance in various high-performance steels. These aspects should be considered when interpreting the mechanical behaviour of specimens subjected to heat treatments that promote its formation.
The same rationale applies to the potential presence of manganese sulphides (MnS). Although they were not identified through Rietveld refinement, several diffractograms exhibit signals consistent with this phase, and its presence has been confirmed by scanning electron microscopy (SEM). MnS was identified as a non-metallic inclusion with a crystalline structure, although it is not considered a carbide phase and therefore was excluded from phase-related mechanical interpretations.
Consequently, the qualitative inclusion of these phases in the analysis is justified, explicitly stating that their identification is based on the match of diffraction peaks and complementary microstructural observations, even when their quantification by Rietveld is not significant in all cases.
When comparing these results with those obtained before tempering (Table 4), it can be observed that tempering leads to a significant reduction in the retained austenite content and a marked increase in both the weight percentage of ferrite and MC and M3C-type carbides.
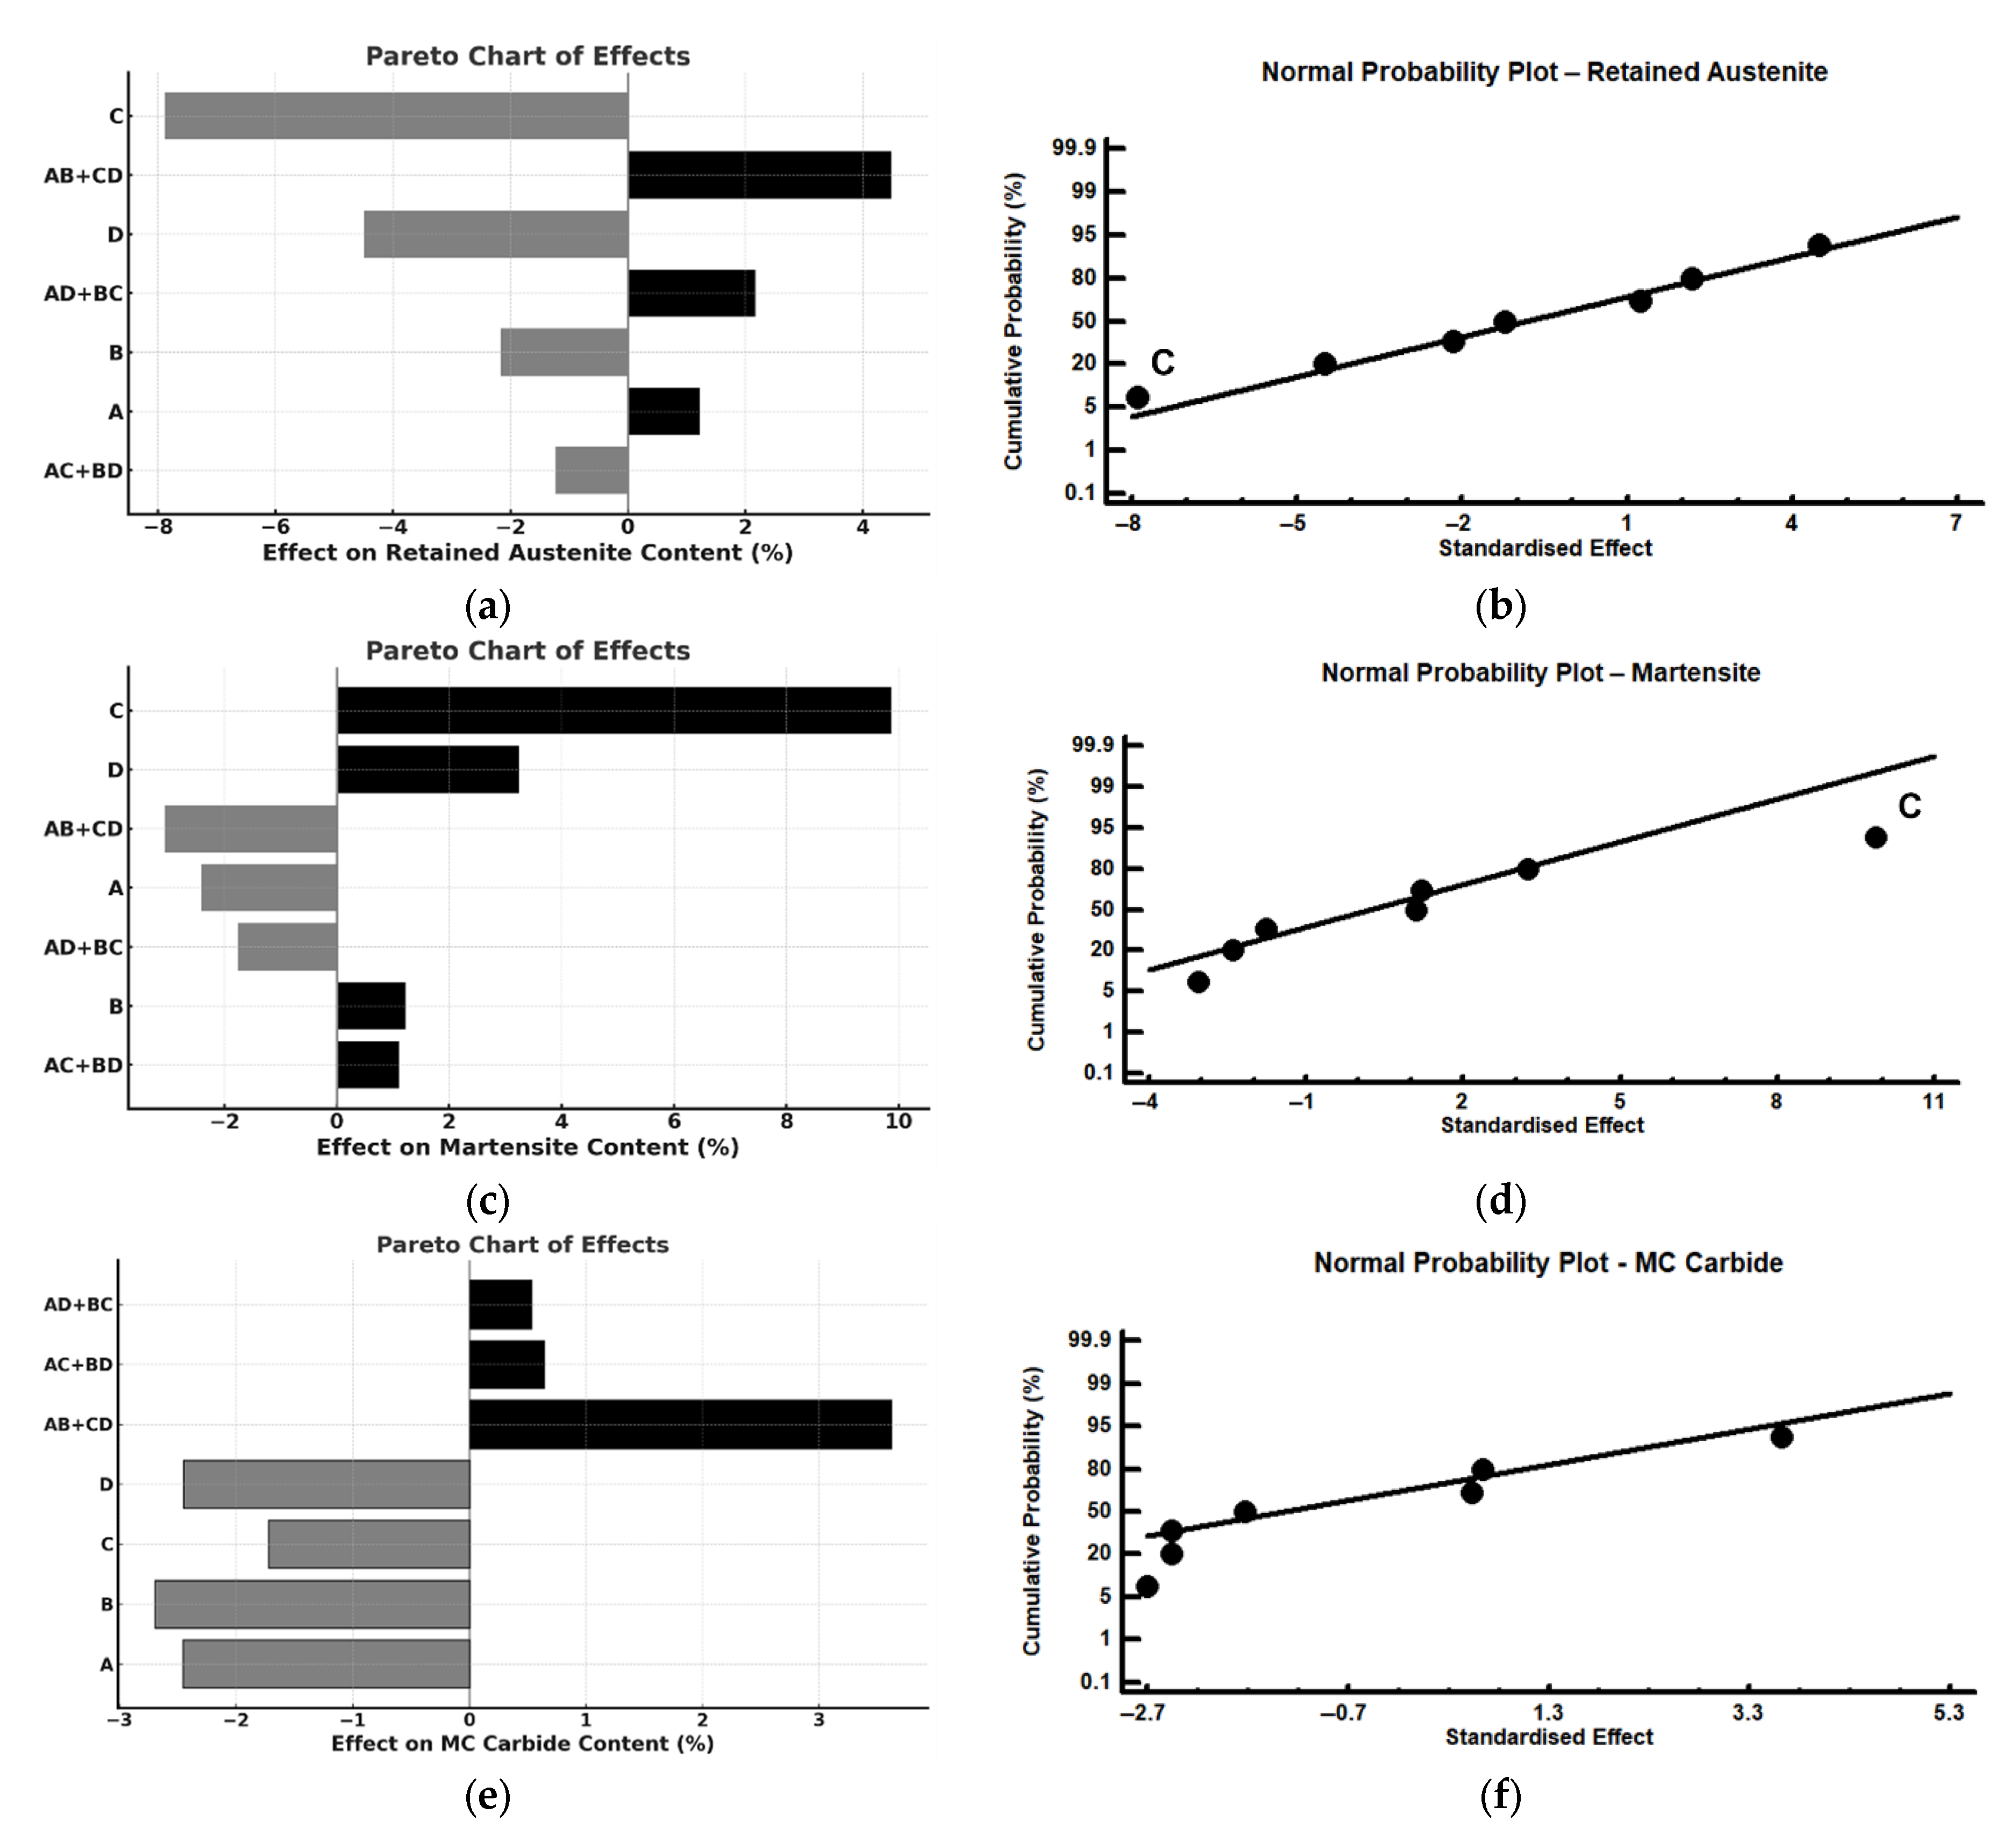
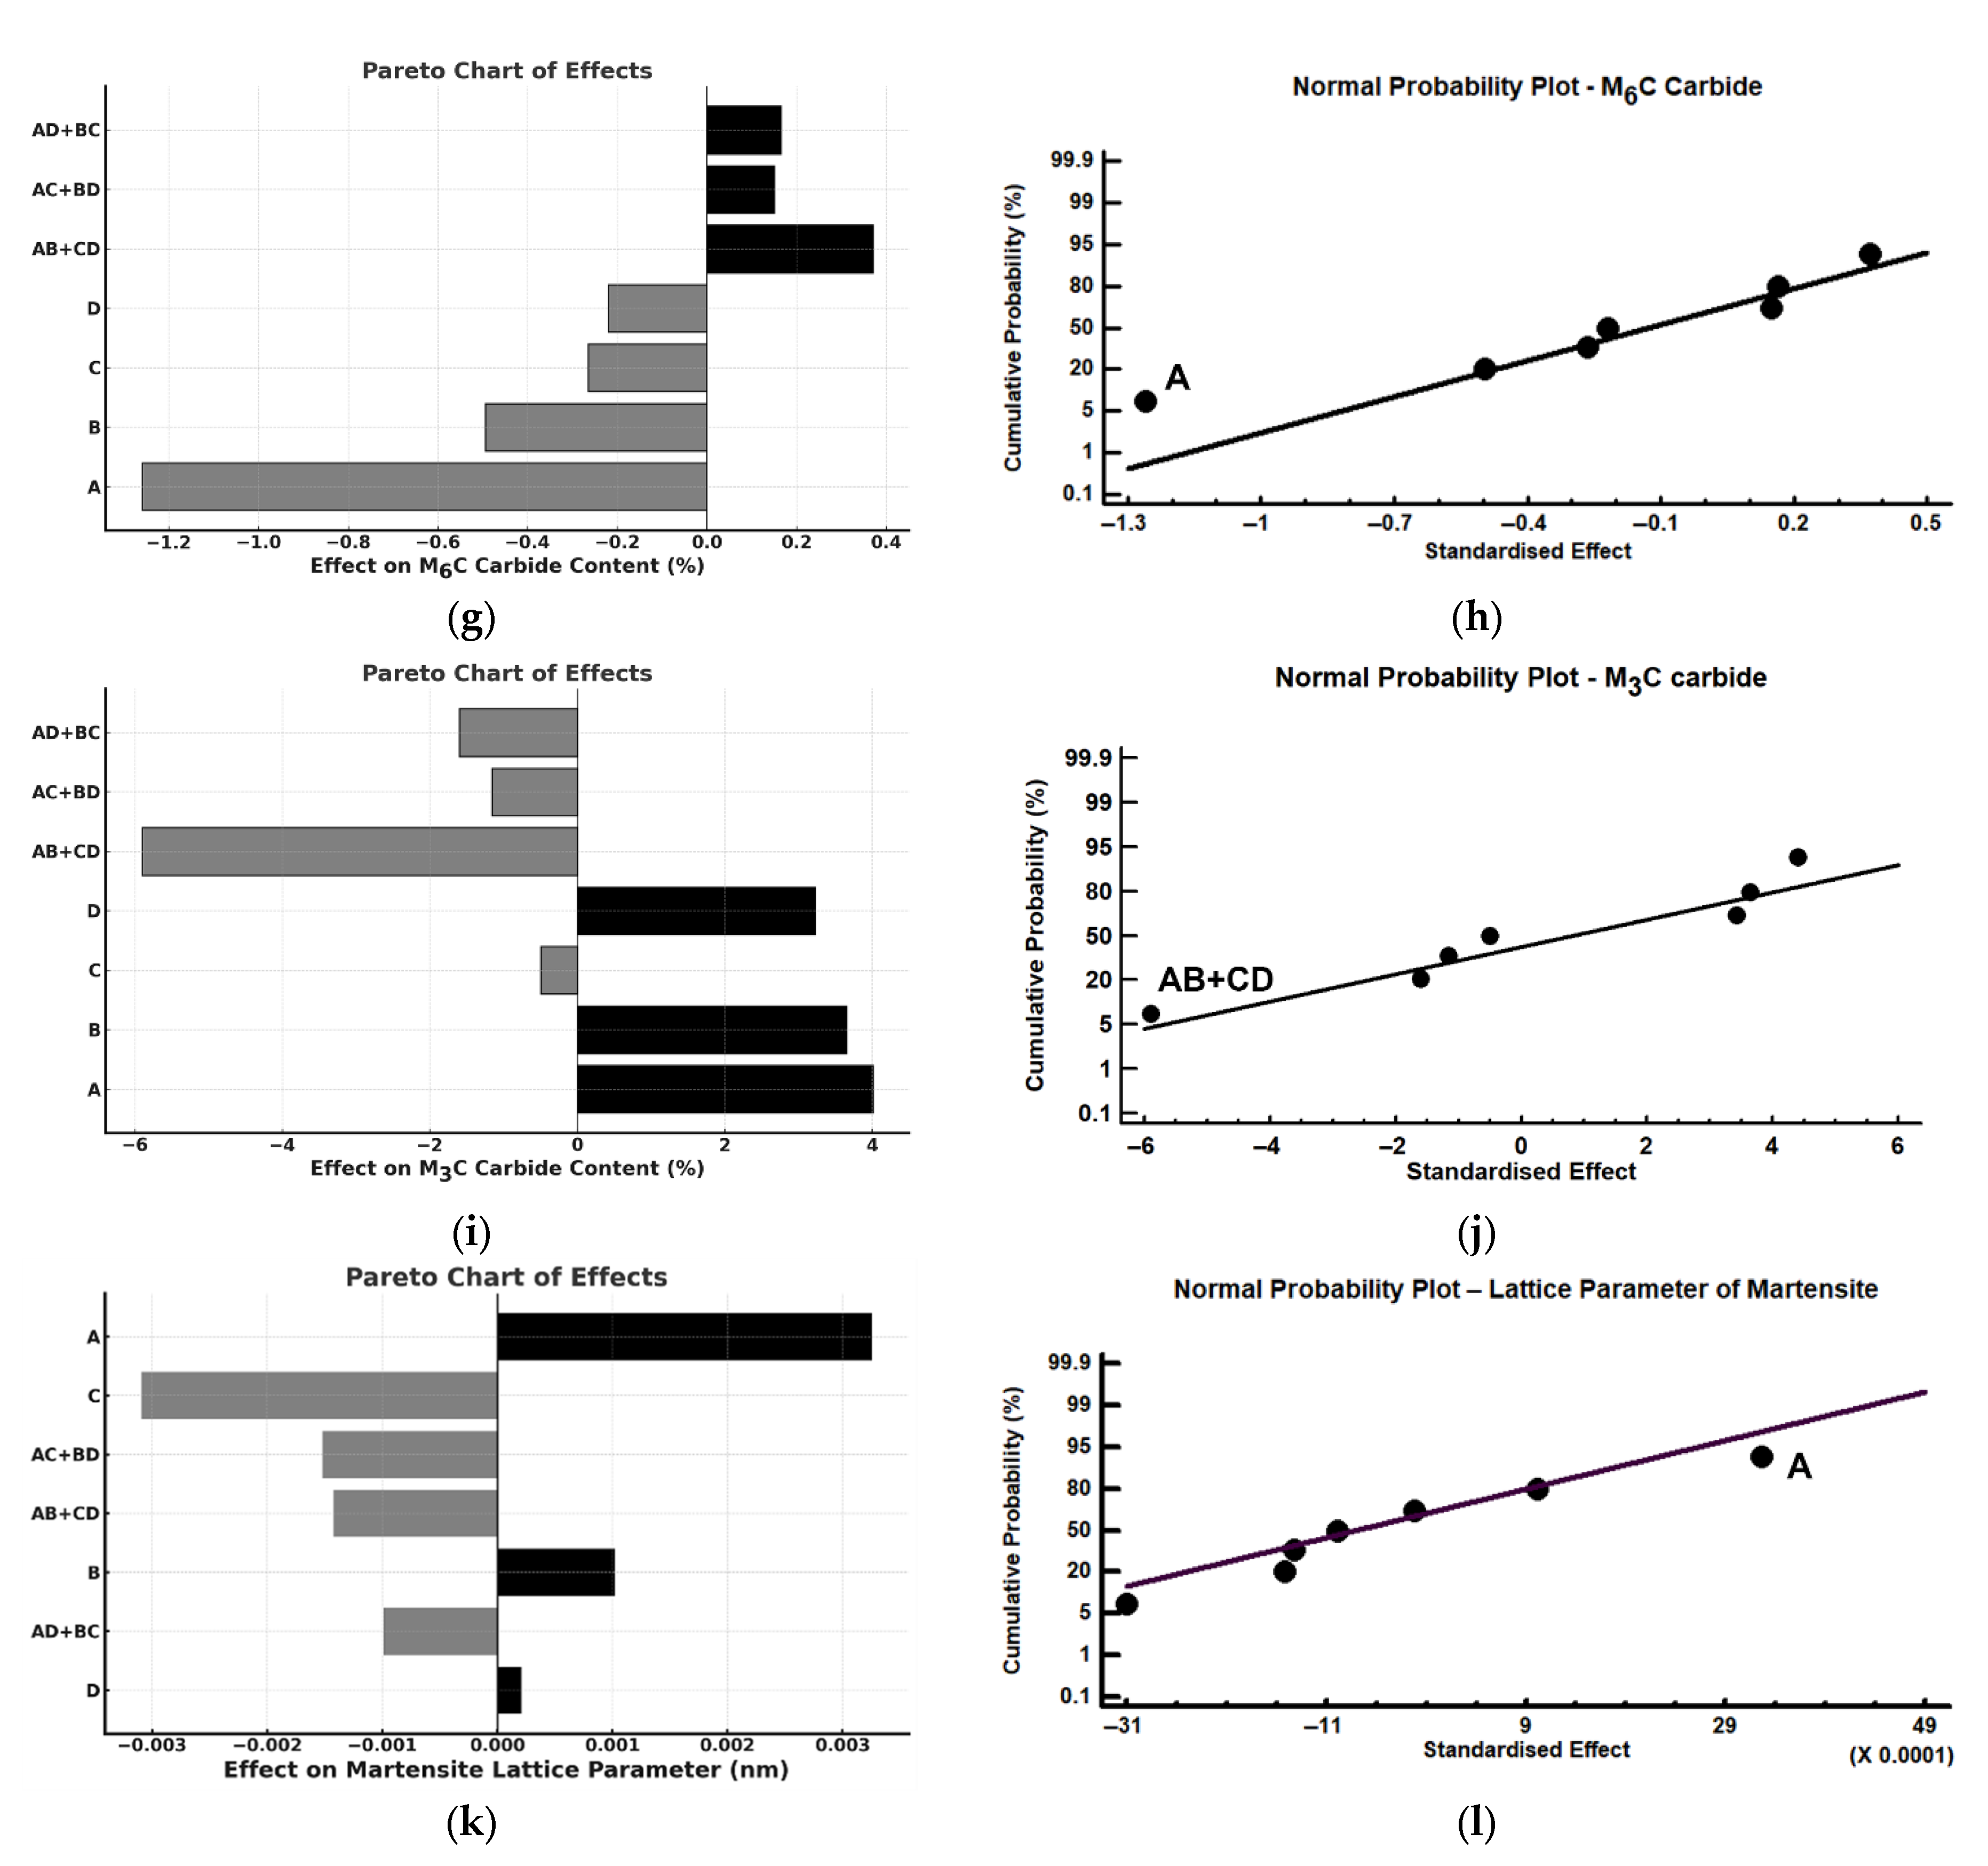
The statistical analysis of the weight fraction of the phases present was carried out based on a single XRD analysis per condition. As no experimental replications were performed, the main and interaction effects were estimated without calculation of the standard error, and therefore, their statistical significance was not evaluated. The discussion of results is based on the relative magnitude of the observed effects. Table 16 summarises the estimated effects on the weight fractions of the different crystalline phases (wt.%) and on the lattice parameter of tempered martensite (Å), as obtained from the experimental design. To identify the factors with significant effects, a normal probability plot of standardised effects was used. This graphical approach allows for the visual identification of those effects that deviate from the expected pattern under a normally distributed noise model. Figure 12 shows the Pareto charts and the normal probability plots, identifying the factors with significant effects.
For the weight percentage of retained austenite, factor C (tempering temperature) was found to have a significant effect, with a more pronounced reduction observed when tempering was carried out at 560 °C. Likewise, tempering at this temperature led to an increase in the weight percentage of ferrite. Additionally, the austenitising temperature was the only factor with a significant effect on the lattice parameter of tempered martensite (α-ferrite), which increased when this factor reached its high level (+1, 1180 °C). This could be due to greater carbon dissolution prior to the martensitic transformation. It is worth noting that these same factor levels (austenitising at 1180 °C and tempering at 560 °C) were also associated with a significant increase in hardness. Furthermore, tempering at 560 °C may promote a secondary hardening of tempered martensite (ferrite).
None of the factors analysed had a significant effect on the formation of MC-type carbides. However, factor A (austenitising temperature) showed a significant effect on the amount of M6C carbides present in the microstructure. Although this type of carbide appeared in minor quantities, lower austenitising temperatures (1020 °C, A = −1) promoted a significant increase in their presence. Lower austenitising temperatures may enhance their precipitation kinetics via nucleation and growth during austenite destabilisation. This suggests that the ‘nose’ of the TTT curve for the precipitation of this type of carbide is located closer to 1020 °C than to 1180 °C, thereby facilitating their nucleation and growth during heat treatment at the lower austenitising temperature.
The interaction AB + CD showed a significant effect on the formation of M3C-type carbides. To determine which of the confounded interactions was responsible for the observed effect, the mean values of the M3C carbide content for each combination of coded factor levels were graphically analysed. This analysis is shown in Figure 13. It was deduced that when tempering was carried out at 500 °C (C = −1), three tempering cycles (D = +1) were required to increase the amount of this type of carbide. It was also implicitly deduced that austenite destabilisation at 1180 °C (A = +1) was favourable for increasing the content of these carbides, regardless of the cooling medium employed. A comparison of the results presented in Table 5 and Table 15 reveals a substantial reduction in retained austenite content following the tempering cycles, alongside a notable increase in the volume fraction of M3C- and MC-type carbides—nearly doubling compared with the pre-tempering condition. These findings suggest that the precipitation of both carbides during tempering may be a general consequence of austenite destabilisation. The interaction analysis further indicates that the formation of M3C carbides is particularly favoured under triple tempering cycles at 500 °C. Similarly, austenitising at 1180 °C appears to promote the formation of both M3C and MC carbides during tempering, although only the effect on M3C was found to be statistically significant. By contrast, M6C carbides seem to form predominantly during austenite destabilisation at elevated temperatures (e.g., during austenitising), and not during the tempering stages, at least within the time–temperature window investigated in this study.
Figure 14 presents a representative set of micrographs corresponding to different heat treatment conditions. Specifically, Figure 14a–d shows the microstructure observed in experiments 1, 4, 5, and 8, respectively. Figure 14e,f illustrates, for experiment 8, the same analysis area observed by secondary electrons (SEI) and backscattered electrons (BEI), enabling a comparison between the topographical and compositional contrast. In the BEI image, two predominant contrast levels can be clearly distinguished among the carbides: brighter carbides, with a higher average atomic number (Z), mainly associated with the presence of W and Mo, and darker ones, corresponding to lower Z values. The bright (white) carbides were not observed before tempering treatments.
Table 17 summarises the results of chemical analyses carried out using Energy-Dispersive X-ray Spectroscopy (EDX) on some of these carbides. Spectrum 4 from Figure 14b also reveals the localised presence of MnS inclusions. The EDX spectra confirm the existence of at least two distinct compositional families among both the bright and grey carbides observed in the SEM images. Among the bright carbides, some particles display high concentrations of W and Mo along with moderate amounts of Co and Fe (e.g., spectra 5, 7 and 9), whereas others exhibit lower Co and Fe contents (e.g., spectrum 1), indicating a lower average atomic number. These compositional variations support the presence of both M6C and M3C carbides. Similarly, the grey carbides reveal two distinguishable groups: Vanadium-rich MC carbides (e.g., spectra 3 and 8), and others with higher Fe content and no detectable Mo or W (e.g., spectrum 6), attributed to M3C-type carbides. This diversity in composition and backscattered electron contrast is consistent with the XRD results and confirms the coexistence of multiple carbide phases in the microstructure.
Finally, it should be noted that in the micrographs corresponding to experiments 1 and 4 (Figure 14a,b), the presence of retained austenite is visible, apparently more abundant in the sample from experiment 4. However, this phase is not distinguishable in the micrographs from experiments 5 and 8 (Figure 14c,d).
It is worth noting that, when comparing these results with those presented in Table 4, the EDX analyses reveal certain changes in the chemical composition of the carbides following tempering at 500 and 560 °C. Although the general morphology and distribution of the particles remain unchanged, local variations in composition were observed, which are consistent with thermally activated diffusion phenomena, such as partial dissolution, local enrichment, or depletion, as well as with possible secondary hardening processes. The latter may be associated with the precipitation of nanometric carbides rich in Mo, W, and Cr, which are commonly observed in highly alloyed tool steels.

4. Conclusions

This study has systematically evaluated the effect of multiple heat treatment parameters on the microstructure and mechanical performance of Vanadis 60 steel using a fractional factorial design of experiments. The main conclusions are summarised as follows:
  • Vickers hardness increased significantly when austenitisation was carried out at 1180 °C, followed by oil quenching and tempering at 560 °C. This thermal sequence promotes the dissolution of carbon and alloying elements into austenite, enhancing the tetragonality of martensite and favouring secondary hardening during tempering. It also reduces the amount of retained austenite.
  • A statistically significant interaction was identified between the austenitisation temperature and the number of tempering cycles. Three temperings were sufficient to compensate for the reduced hardness associated with lower austenitisation temperatures.
  • Flexural strength increased after austenitisation at 1020 °C, followed by air cooling, and tempering at 560 °C. This condition promotes the development of a bainitic microstructure and a lower tetragonality of martensite. A marked reduction in the retained austenite content was also observed as a result of the tempering temperature. Ductility, assessed via the maximum deflection, was significantly enhanced under bainitic microstructures. Moreover, tempering at 560 °C proved effective in mitigating the embrittling effect of oil quenching, contributing to a balanced mechanical behaviour.
  • XRD analysis confirmed that tempering at 560 °C reduced the retained austenite and promoted martensite stabilisation, in line with the observed increase in hardness. The analysis of lattice parameters showed that austenitisation at 1180 °C increased the unit cell parameter of tempered martensite, due to greater dissolution of carbon and alloying elements and the higher cooling rate.
  • Thermal analysis allowed the identification of the characteristic transformation temperatures for Vanadis 60 steel: austenitisation at 860 °C, formation of upper bainite at 390 °C by air cooling, and the onset of martensitic transformation at 280−300 °C.
Overall, the use of a factorial design has enabled a statistically rigorous correlation between mechanical properties and microstructure, the latter being derived from thermal processing. The results provide a practical guidance for tailoring heat treatment routes depending on whether hardness, strength, or ductility is prioritised in service. This methodological approach also demonstrates the potential of a statistical design to optimise heat treatments in highly alloyed tool steels.

Author Contributions

Conceptualization, F.A.-A. and A.G.-P.; methodology, F.A.-A. and A.G.-P.; software, F.A.-A.; validation, F.A.-A. and A.G.-P.; formal analysis, F.A.-A. and A.G.-P.; investigation, F.A.-A. and A.G.-P.; resources, F.A.-A. and A.G.-P.; data curation, F.A.-A. and A.G.-P.; writing—original draft preparation, F.A.-A.; writing—review and editing, A.G.-P.; visualisation, F.A.-A. and A.G.-P.; supervision, F.A.-A. and A.G.-P.; project administration, F.A.-A. and A.G.-P. All authors have read and agreed to the published version of the manuscript.

Funding

This research received no external funding.

Data Availability Statement

The original contributions presented in this study are included in the article Material. Further inquiries can be directed at the corresponding author.

Conflicts of Interest

The authors declare no conflicts of interest.

References

  1. Chang, S.-H.; Chen, C.-Y.; Huang, K.-T. Microstructure, retained austenite, and mechanical properties evaluation of Vanadis 60-HfC-Ta0.6Nb0.4C steel matrix composite by vacuum sintering, sub-zero, and heat treatments. Vacuum 2023, 210, 111885. [Google Scholar] [CrossRef]
  2. Lemecha, M.; Napiorkowski, J.; Ligier, K.; Tarasiuk, W.; Sztukowski, K. Analysis of Wear Properties of Powder Metallurgy Steel in Abrasive Soil Mass. Materials 2022, 15, 6888. [Google Scholar] [CrossRef]
  3. Huang, K.-T.; Chang, S.-H.; Chang, C.-W. Microstructure, Strengthening Mechanism and Mechanical Properties of Vanadis 60-Ta0.5Nb0.5C-B4C High-speed Steel Composite via Vacuum Sintering, Sub-zero, and Heat Treatments. ISIJ Int. 2024, 64, 154–164. [Google Scholar] [CrossRef]
  4. Alvarez-Antolin, F.; Gonzalez-Pociño, A.; Cofiño-Villar, A.; Alvarez-Perez, C.H. Optimisation of Thermal Processes with Plasma Nitriding on Vanadis 4 High Speed Steel. Materials 2022, 15, 906. [Google Scholar] [CrossRef]
  5. Halfa, H.; Seikh, A.H.; Abdo, H.S.; Alnaser, I.A.; Soliman, M.S.; Ragab, S.M. Study on the Microstructure of Vanadium-Modified Tungsten High-Speed Steel-Coded SAE-AISI T1 Steel. Adv. Mater. Sci. Eng. 2022, 2022, 1–18. [Google Scholar] [CrossRef]
  6. Scholl, L.M.; Bezold, A.; Broeckmann, C. Influences of Manufacturing-Related Microstructural Variations on Fatigue in Carbide-Rich Tool Steels. Steel Res. Int. 2023, 94, 2200578. [Google Scholar] [CrossRef]
  7. Akhmetov, A.S.; Eremeeva, Z.V. Investigation of the Structure of Sintered Blanks from Powder Mixture of R6M5K5 High-Speed Steel Containing Diffusion-Alloyed Powder. Metallurgist 2022, 66, 299–303. [Google Scholar] [CrossRef]
  8. Bombač, D.; Terčelj, M.; Fazarinc, M.; Kugler, G. On the Increase of Intrinsic Workability and Hot Working Temperature Range of M42 Ledeburitic Super High Steel in As-Cast and Wrought States. Mater. Sci. Eng. A 2017, 703, 438–450. [Google Scholar] [CrossRef]
  9. Zhang, J.; Huang, J.; Wang, H.; Lu, L.; Cui, H.; Zhang, J. Microstructures and Mechanical Properties of Spray Formed H13 Tool Steel. Acta Metall. Sin. 2014, 50, 787–794. [Google Scholar]
  10. Pavlícková, M.; Vojtech, D.; Novák, P.; Gemperlová, J.; Gemperle, A.; Zárubová, N.; Lejcek, P.; Jurci, P.; Stolar, P. Thermal Treatment of PM-Tool Steel Alloyed with Niobium. Mater. Sci. Eng. A 2003, 356, 200–207. [Google Scholar] [CrossRef]
  11. Pan, Y.; Pi, Z.; Liu, B.; Xu, W.; Zhang, C.; Qu, X.; Lu, X. Influence of Heat Treatment on the Microstructural Evolution and Mechanical Properties of W6Mo5Cr4V2Co5Nb (825 K) High Speed Steel. Mater. Sci. Eng. A 2020, 787, 139480. [Google Scholar] [CrossRef]
  12. Liu, J.; Chi, H.; Wu, H.; Ma, D.; Zhou, J. Discussion of the Segregation and Low Hardness of Large-Diameter M3 High-Speed Steel Produced by Spray Forming. Materials 2023, 16, 482. [Google Scholar] [CrossRef] [PubMed]
  13. Li, Y.; Li, P.; Wang, K.; Li, H.; Gong, M.; Tong, W. Microstructure and Mechanical Properties of a Mo Alloyed High Chromium Cast Iron after Different Heat Treatments. Vacuum 2018, 156, 59–67. [Google Scholar] [CrossRef]
  14. Chang, S.-H.; Chang, C.-H.; Huang, K.-T. In Situ TEM Observation of the Microstructure Characteristics of the Vacuum Sintering, Sub-Zero and Heat Treatments of Vanadis 23 High-Speed Steel by Adding Cr3C2-TaC-TiC Powders. Powder Metall. 2023, 66, 151–163. [Google Scholar] [CrossRef]
  15. Wang, F.; Xu, L. Microstructure and Erosion Wear Characterization of a New Cast High-Vanadium-Chromium Alloy (HVCA). Int. J. Met. 2023, 17, 466–480. [Google Scholar] [CrossRef]
  16. Zinchenko, S.A. Thermocyclic treatment (TCT)–as a method to decrease carbide segregation of hypereutectoid steels. Eur. Phys. J.-Spec. Top. 2020, 229, 459–465. [Google Scholar] [CrossRef]
  17. Chen, K.-J.; Hung, F.-Y.; Lui, T.-S.; Shih, Y.-R. Wear Inducing Phase Transformation of Plasma Transfer Arc Coated Tools during Friction Stir Welding with Al Alloy. J. Eng. 2019, 2019, 1–10. [Google Scholar] [CrossRef]
  18. Zhou, X.; Liu, D.; Zhu, W.; Fang, F.; Tui, Y.; Jiang, J. Morphology, microstructure and decomposition behavior of M2C carbides in high speed steel. J. Iron Steel Res. Int. 2017, 24, 43–49. [Google Scholar] [CrossRef]
  19. Jin, J.; Gao, R.; Peng, H.; Guo, H.; Gong, S.; Chen, B. Rapid Solidification Microstructure and Carbide Precipitation Behavior in Electron Beam Melted High-Speed Steel. Metall. Mater. Trans. A 2020, 51, 2411–2429. [Google Scholar] [CrossRef]
  20. Guo, J.; Liu, L.; Feng, Y.; Liu, S.; Ren, X.; Yang, Q. Crystallographic Characterizations of Eutectic and Secondary Carbides in a Fe-12Cr-2.5Mo-1.5W-3V-1.25C Alloy. Met. Mater.-Int. 2017, 23, 313–319. [Google Scholar] [CrossRef]
  21. Jaworski, J.; Kluz, R.; Trzepiecinski, T. Influence of Heat Treatment on Content of the Carbide Phases in the Microstructure of High-Speed Steel. Arch. Foundry Eng. 2017, 17, 59–62. [Google Scholar] [CrossRef]
  22. Zhou, X.; Li, Y.; Sun, C.; Chen, L.; Fang, F.; Jiang, J. Optimization on mechanical properties of transition metal carbides: A combined experimental and theoretical study. Mater. Chem. Phys. 2022, 282, 125955. [Google Scholar] [CrossRef]
  23. Michalcova, A.; Pecinka, V.; Kacenka, Z.; Serak, J.; Kubasek, J.; Novak, P.; Vojtech, D. Microstructure, Mechanical Properties, and Thermal Stability of Carbon-Free High Speed Tool Steel Strengthened by Intermetallics Compared to Vanadis 60 Steel Strengthened by Carbides. Metals 2021, 11, 1901. [Google Scholar] [CrossRef]
  24. Rakhadilov, B.; Kurbanbekov, S.; Skakov, M.; Wieleba, W.; Zhurerova, L. Effect plasma beam irradiation on the microstructure and phase composition of high-speed steel R6M5. Mater. Test. 2020, 62, 1138–1142. [Google Scholar] [CrossRef]
  25. Shen, W.; Yu, L.; Li, Z.; He, Y.; Zhang, Q.; Zhang, H.; Jiang, Y.; Lin, N. In situ synthesis and strengthening of powder metallurgy high speed steel in addition of LaB6. Met. Mater.-Int. 2017, 23, 1150–1157. [Google Scholar] [CrossRef]
  26. Serna, M.M.; Rossi, J.L. MC complex carbide in AISI M2 high-speed steel. Mater. Lett. 2009, 63, 691–693. [Google Scholar] [CrossRef]
  27. Gonzalez-Pocino, A.; Asensio-Lozano, J.; Alvarez-Antolin, F.; Garcia-Diez, A. Improvement of Impact Toughness and Abrasion Resistance of a 3C-25Cr-0.5Mo Alloy Using a Design of Experiment Statistical Technique: Microstructural Correlations after Heat Treatments. Metals 2021, 11, 595. [Google Scholar] [CrossRef]
  28. Burja, J.; Nagode, A.; Medved, J.; Balasko, T.; Grabnar, K. Effect of microalloying on tempering of Mo-W high thermal conductivity steel. Metall. Ital. 2023, 114, 22–27. [Google Scholar]
  29. Zhang, C.; Li, J.; Zhang, Y.; Sun, Z.; Ren, S.; Lv, D.; Nian, B.; Zhao, Y.; Song, Y. Understanding of the Microstructure Evolution and Wear Resistance of Cr12MoV Die Steel during Deep Cryogenic Treatment. J. Mater. Eng. Perform. 2024, 34, 3064–3075. [Google Scholar] [CrossRef]
  30. Hofinger, M.; Seisenbacher, B.; Landefeld, A.; Ognianov, M.; Turk, C.; Leitner, H.; Schnitzer, R. Influence of thermomechanical fatigue loading conditions on the nanostructure of secondary hardening steels. Mater. Sci. Eng. A 2021, 802, 140672. [Google Scholar] [CrossRef]
  31. Amirabdollahian, S.; Deirmina, F.; Pellizzari, M.; Bosetti, P.; Molinari, A. Tempering behavior of a direct laser deposited hot work tool steel: Influence of quenching on secondary hardening and microstructure. Mater. Sci. Eng. A 2021, 814, 141126. [Google Scholar] [CrossRef]
  32. Liu, F.; Kang, C.; Qian, R.; Jiang, Z.; Geng, X.; Li, H. Effect of Tempering Temperature on Microstructure and Properties of a New Type of Nitrogen-Containing Hot-Work Die Steel 3Cr7Mo2NiSiVN. Steel Res. Int. 2022, 93, 2200013. [Google Scholar] [CrossRef]
  33. Bae, K.; Moon, H.-S.; Park, Y.; Jo, I.; Lee, J. Influence of Tempering Temperature and Time on Microstructure and Mechanical Properties of Additively Manufactured H13 Tool Steel. Materials 2022, 15, 8329. [Google Scholar] [CrossRef]
  34. Ozer, M. Influence of heat treatments on microstructure and wear behavior of AISI H13 tool steel. Kov. Mater.-Met. Mater. 2022, 60, 387–396. [Google Scholar] [CrossRef]
  35. Mochtar, M.A.; Putra, W.N.; Abram, M. Effect of tempering temperature and subzero treatment on microstructures, retained austenite, and hardness of AISI D2 tool steel. Mater. Res. Express 2023, 10, 056511. [Google Scholar] [CrossRef]
  36. Miyauchi, H.; Matsumoto, H.; Yokota, K. Development of a Periodic Laminate Structure in H13 Steel Using Laser Powder Bed Fusion: Effects of Tempering on Hardness Evolution. Steel Res. Int. 2023, 94, 00622. [Google Scholar] [CrossRef]
  37. Deirmina, F.; Quarzago, L.; Butcher, D.; Bettini, E.; Mehraban, S.; Hann, J.; Pettersson, N.H.; Lavery, N.; Rottger, A.; Pellizzari, M. General investigations on the heat treatment and thermal fatigue behavior of an experimental hot work tool steel tailored for laser powder bed fusion. Mater. Sci. Eng. A 2024, 901, 146554. [Google Scholar] [CrossRef]
  38. Wang, Y.; Chu, S.; Mao, B.; Xing, H.; Zhang, J.; Sun, B. Microstructure, residual stress, and mechanical property evolution of a spray-formed vanadium-modified high-speed steel processed by post-heat treatment. J. Mater. Res. Technol. 2022, 18, 1521–1533. [Google Scholar] [CrossRef]
  39. Jiao, W.-C.; Li, H.-B.; Feng, H.; Wang, H.-J.; Zhu, H.-C.; Zhang, S.-C.; Jiang, Z.-H.; Wu, W. Exploring the Influence Mechanisms of Tempering Temperature and N-alloying on Mechanical Properties of AISI M42 High-Speed Steel. Steel Res. Int. 2023, 94, 0824. [Google Scholar] [CrossRef]
  40. Zhou, T.; Spartacus, G.; Dahlstrom, A.; Babu, R.P.; Davydok, A.; Hedstrom, P. Computational thermodynamics and kinetics-guided re-engineering of a high-performance tool steel. Scr. Mater. 2023, 232, 115496. [Google Scholar] [CrossRef]
  41. Kumar, A.; Agarwal, G.; Petrov, R.; Goto, S.; Sietsma, J.; Herbig, M. Microstructural evolution of white and brown etching layers in pearlitic rail steels. Acta Mater. 2019, 171, 48–64. [Google Scholar] [CrossRef]
  42. Bergmueller, S.; Kaserer, L.; Fuchs, L.; Braun, J.; Weinberger, N.; Letofsky-Papst, I.; Leichtfried, G. Crack-free in situ heat-treated high-alloy tool steel processed via laser powder bed fusion: Microstructure and mechanical properties. Heliyon 2022, 8, e10171. [Google Scholar] [CrossRef]
  43. Firouzi, A.; Yazdani, S.; Tavangar, R.; Shakerifard, B.; Khan, F. Fracture Toughness Evaluation of Powder Metallurgical ASP2030 High-Speed Steels Using Flexural Specimens and Finite Element Method. Strength Mater. 2022, 54, 1064–1081. [Google Scholar] [CrossRef]
  44. Zhikai, Y.; Jianlin, B.; Xinyue, Z. Effect of heat treatment on microstructure and mechanical property of selective laser melted high speed steel. Cailiao Gongcheng 2022, 50, 135–142. [Google Scholar] [CrossRef]
  45. Jurkovic, K.; Cajner, H.; Mrvar, P.; Bauer, B. Analysis of Factor Effects in Process of Vertical Centrifugal Casting. Mater. Manuf. Process. 2023, 39, 386–397. [Google Scholar] [CrossRef]
  46. Fukuda, I.M.; Pinto, C.F.F.; Moreira, C.S.; Saviano, A.M.; Lourenço, F.R. Design of Experiments (DoE) applied to Pharmaceutical and Analytical Quality by Design (QbD). Braz. J. Pharm. Sci. 2018, 54, e01006. [Google Scholar] [CrossRef]
  47. Marco, L.; Tort-Martorell, X.; Cuadrado, J.A.; Pozueta, L. Optimization of a Car Brake Prototype as a Consequence of Successful DOE Training. Qual. Reliab. Eng. Int. 2004, 20, 469–480. [Google Scholar] [CrossRef]
  48. Monikandan, V.V.; Mandal, A. Application of the Statistical Method to Analyze the High-Temperature Tribological Properties of Aluminum Composites. Trans. Indian Inst. Met. 2022, 76, 2383–2389. [Google Scholar] [CrossRef]
  49. Beg, S.; Raza, K. Full Factorial and Fractional Factorial Design Applications in Pharmaceutical Product Development. In Design of Experiments for Pharmaceutical Product Development: Volume I: Basics and Fundamental Principles; Beg, S., Ed.; Springer: Singapore, 2021; pp. 43–53. [Google Scholar] [CrossRef]
  50. Weng, L.-C.; Elsawah, A.M.; Fang, K.-T. Cross-Entropy Loss for Recommending Efficient Fold-Over Technique. J. Syst. Sci. Complex 2021, 34, 402–439. [Google Scholar] [CrossRef]
  51. Barrionuevo, G.O.; Ramos-Grez, J.A.; Sánchez-Sánchez, X.; Zapata-Hidalgo, D.; Mullo, J.L.; Puma-Araujo, S.D. Influence of the Processing Parameters on the Microstructure and Mechanical Properties of 316L Stainless Steel Fabricated by Laser Powder Bed Fusion. J. Manuf. Mater. Process. 2024, 8, 35. [Google Scholar] [CrossRef]
  52. García-López, E.; Siller, H.R.; Rodríguez, C.A. Development of AISI 316L stainless steel coronary stent. In Proceedings of the Laser-Based Micro- and Nanoprocessing XII, Spie Lase, San Francisco, CA, USA, 27 January–1 February 2018; pp. 147–153. [Google Scholar] [CrossRef]
  53. Yang, Y.J.; Draper, N.R. Two-Level Factorial and Fractional Factorial Designs in Blocks of Size Two. J. Qual. Technol. 2003, 35, 294–305. [Google Scholar] [CrossRef]
  54. Srinivasan, P.; Dharmakkan, N.; Vishnu, S.; Prasath, H.; Gogul, R. Thermal conductivity analysis of Al2O3/water-ethylene glycol nanofluid by using factorial design of experiments in a natural convection heat transfer apparatus. Hem. Ind. 2021, 75, 341–352. [Google Scholar] [CrossRef]
  55. Mendonça, C.; Capellato, P.; Bayraktar, E.; Gatamorta, F.; Gomes, J.; Oliveira, A.; Sachs, D.; Melo, M.; Silva, G. Recycling Chips of Stainless Steel Using a Full Factorial Design. Metals 2019, 9, 842. [Google Scholar] [CrossRef]
  56. Mazen, A.; McClanahan, B.; Weaver, J.M. Factors affecting ultimate tensile strength and impact toughness of 3D printed parts using fractional factorial design. Int. J. Adv. Manuf. Technol. 2022, 119, 2639–2651. [Google Scholar] [CrossRef]
  57. Sahoo, A.K.; Panda, A.; Kumar, R.; Das, R.K.; Das, D. Investigation on machinability characteristics during turning Al6063 alloy using uncoated carbide insert. Mater. Today Proc. 2018, 5, 18120–18128. [Google Scholar] [CrossRef]
  58. Lauka, D.; Blumberga, D. Electrolysis Process Analysis by Using Low Carbon Content Additives: A Batch Test Study. Energy Procedia 2015, 72, 196–201. [Google Scholar] [CrossRef]
  59. Reddy, M.S.; Vinoth Kumar, M. Friction stir welding parameters optimization of naval grade AA5083 alloy: RSM. Int. J. Interact. Des. Manuf. 2023, 19, 25–36. [Google Scholar] [CrossRef]
  60. Ayele, M.; Abay, A.G. Analyzing the Effect of Various Sizing Machine Settings on Abrasion Resistance and Size Pick-Up of Polyester/Cotton Blend Sized Yarn Using Box-Behnken Design. J. Nat. Fibers 2023, 20, 2165591. [Google Scholar] [CrossRef]
  61. Desai, B.; Mokashi, P.; Anand, R.L.; Burli, S.B.; Khandal, S.V. Effect of Additives on Green Sand Molding Properties Using Design of Experiments and Taguchi’s Quality Loss Function—An Experimental Study. IOP Conf. Ser. Mater. Sci. Eng. 2016, 149, 012006. [Google Scholar] [CrossRef]
  62. Hosseinzadeh, M.; Hosseini, M.R. Investigation and Optimization of Influencing Parameters on the Copper Extraction from a Low-Grade Oxide Deposit by Acid Leaching. Metall. Res. Technol. 2019, 116, 305. [Google Scholar] [CrossRef]
  63. González-Pociño, A.; García-García, M.A.; Alvarez-Antolín, F.; Segurado-Frutos, E. Effect of Shot Peening and Nitriding on Toughness and Abrasive Wear Resistance of Powder Metallurgic Steels Highly Alloyed with Vanadium. Metals 2024, 14, 22. [Google Scholar] [CrossRef]
  64. Nassif, N.; Zeiada, W.; Al-Khateeb, G.; Haridy, S.; Altoubat, S. Assessment of Punching Shear Strength of Fiber-Reinforced Concrete Flat Slabs Using Factorial Design of Experiments. Jordan J. Civ. Eng. 2022, 16, 139–154. [Google Scholar]
  65. Nurulhuda, A.; Hafizzal, Y.; Izzuddin, M.; Sulawati, M.; Rafidah, A.; Suhaila, Y.; Fauziah, A. Analysis on Flexural Strength of A36 Mild Steel by Design of Experiment (DOE). IOP Conf. Ser. Mater. Sci. Eng. 2017, 226, 012153. [Google Scholar] [CrossRef]
  66. Gasan, H.; Erturk, F. Effects of a Destabilization Heat Treatment on the Microstructure and Abrasive Wear Behavior of High-Chromium White Cast Iron Investigated Using Different Characterization Techniques. Metall. Mater. Trans. A 2013, 44, 4993–5005. [Google Scholar] [CrossRef]
  67. Mamidi, S.; Gundeboina, R.; Kurra, S.; Velchuri, R.; Muga, V. Aurivillius Family of Layered Perovskites, BiREWO6 (RE = La, Pr, Gd, and Dy): Synthesis, Characterization, and Photocatalytic Studies. Comptes Rendus Chim. 2018, 21, 547–552. [Google Scholar] [CrossRef]
  68. Guje, R.; Ravi, G.; Palla, S.; Rao, K.N.; Vithal, M. Synthesis, Characterization, Photocatalytic Conductivity Studies of Defect Pyrochlore KM0.33Te1.67O6 (M = Al, Cr and Fe). Mater. Sci. Eng. B 2015, 198, 1–9. [Google Scholar] [CrossRef]
  69. Ravi, G.; Palla, S.; Veldurthi, N.K.; Reddy, J.R.; Padmasri, H.A.; Vithal, M. Solar Water-Splitting with the Defect Pyrochlore Type of Oxides KFe0.33W1.67O6 and Sn0.5Fe0.33W1.67O6·Xh2O. Int. J. Hydrogen Energy 2014, 39, 15352–15361. [Google Scholar] [CrossRef]
  70. Carbajal, L.; Sainz, M.A.; Serena, S.; Caballero, A.C.; Caballero, A. Solid-State Compatibility in Two Regions of the System ZnO–CaO–P2O5. J. Am. Ceram. Soc. 2011, 94, 2213–2219. [Google Scholar] [CrossRef]
  71. Stephens, P.W. Dealing with Anisotropic Peak Broadening in Rietveld Refinements. Acta Crystallogr. A 1999, 55, 90. [Google Scholar]
  72. Arıcı, M.; Demirtaş, M.; Yılmaz, R. Effect of Ni and Co Additions on Microstructure and Mechanical Properties of Fe–Mn–Al–C Steels. Eng. Sci. Technol. Int. J. 2021, 24, 479–489. [Google Scholar] [CrossRef]
  73. Pero-Sanz Elorz, J.A. Aceros: Metalúrgica Física, Selección y Diseño; CIE Inversiones Editoriales Dossat 2000: Madrid, Spain, 2004; pp. 539–551. [Google Scholar]
  74. Li, Z.; Li, P.; Luo, Y.; Zhou, X.; Qi, L.; Li, S.; Wang, Z. Effect of Austenitizing Temperature and Prior Martensite on Ultra-Fine Bainite Transformation Kinetics. Metals 2019, 9, 1309. [Google Scholar] [CrossRef]
  75. Zhang, Y.; Li, S.; Zhang, Z.; Li, Y.; Lv, B.; Zheng, C.; Zhang, P.; Zhang, F. A Review of Heat Treatment Processes for Bainitic Steel. J. Mater. Res. Technol. 2025, 37, 279–307. [Google Scholar] [CrossRef]
  76. Liu, B.; Qin, T.; Xu, W.; Jia, C.; Wu, Q.; Chen, M.; Liu, Z. Effect of Tempering Conditions on Secondary Hardening of Carbides and Retained Austenite in Spray-Formed M42 High-Speed Steel. Materials 2019, 12, 3714. [Google Scholar] [CrossRef]
  77. Pegues, J.W.; Melia, M.A.; Rodriguez, M.A.; Babuska, T.F.; Gould, B.; Argibay, N.; Greco, A.; Kustas, A.B. In Situ Synchrotron X-Ray Imaging and Mechanical Properties Characterization of Additively Manufactured High-Entropy Alloy Composites. J. Alloys Compd. 2021, 876, 159505. [Google Scholar] [CrossRef]
  78. Ding, J.; Zhu, W.; Ma, Y.; Liu, W.; Huang, Y.; Liang, C. Evaluation of Phase Relationship in the W–Fe–C Ternary System through Symmetry Principles and First-Principles Calculation. Mater. Des. 2022, 224, 111376. [Google Scholar] [CrossRef]
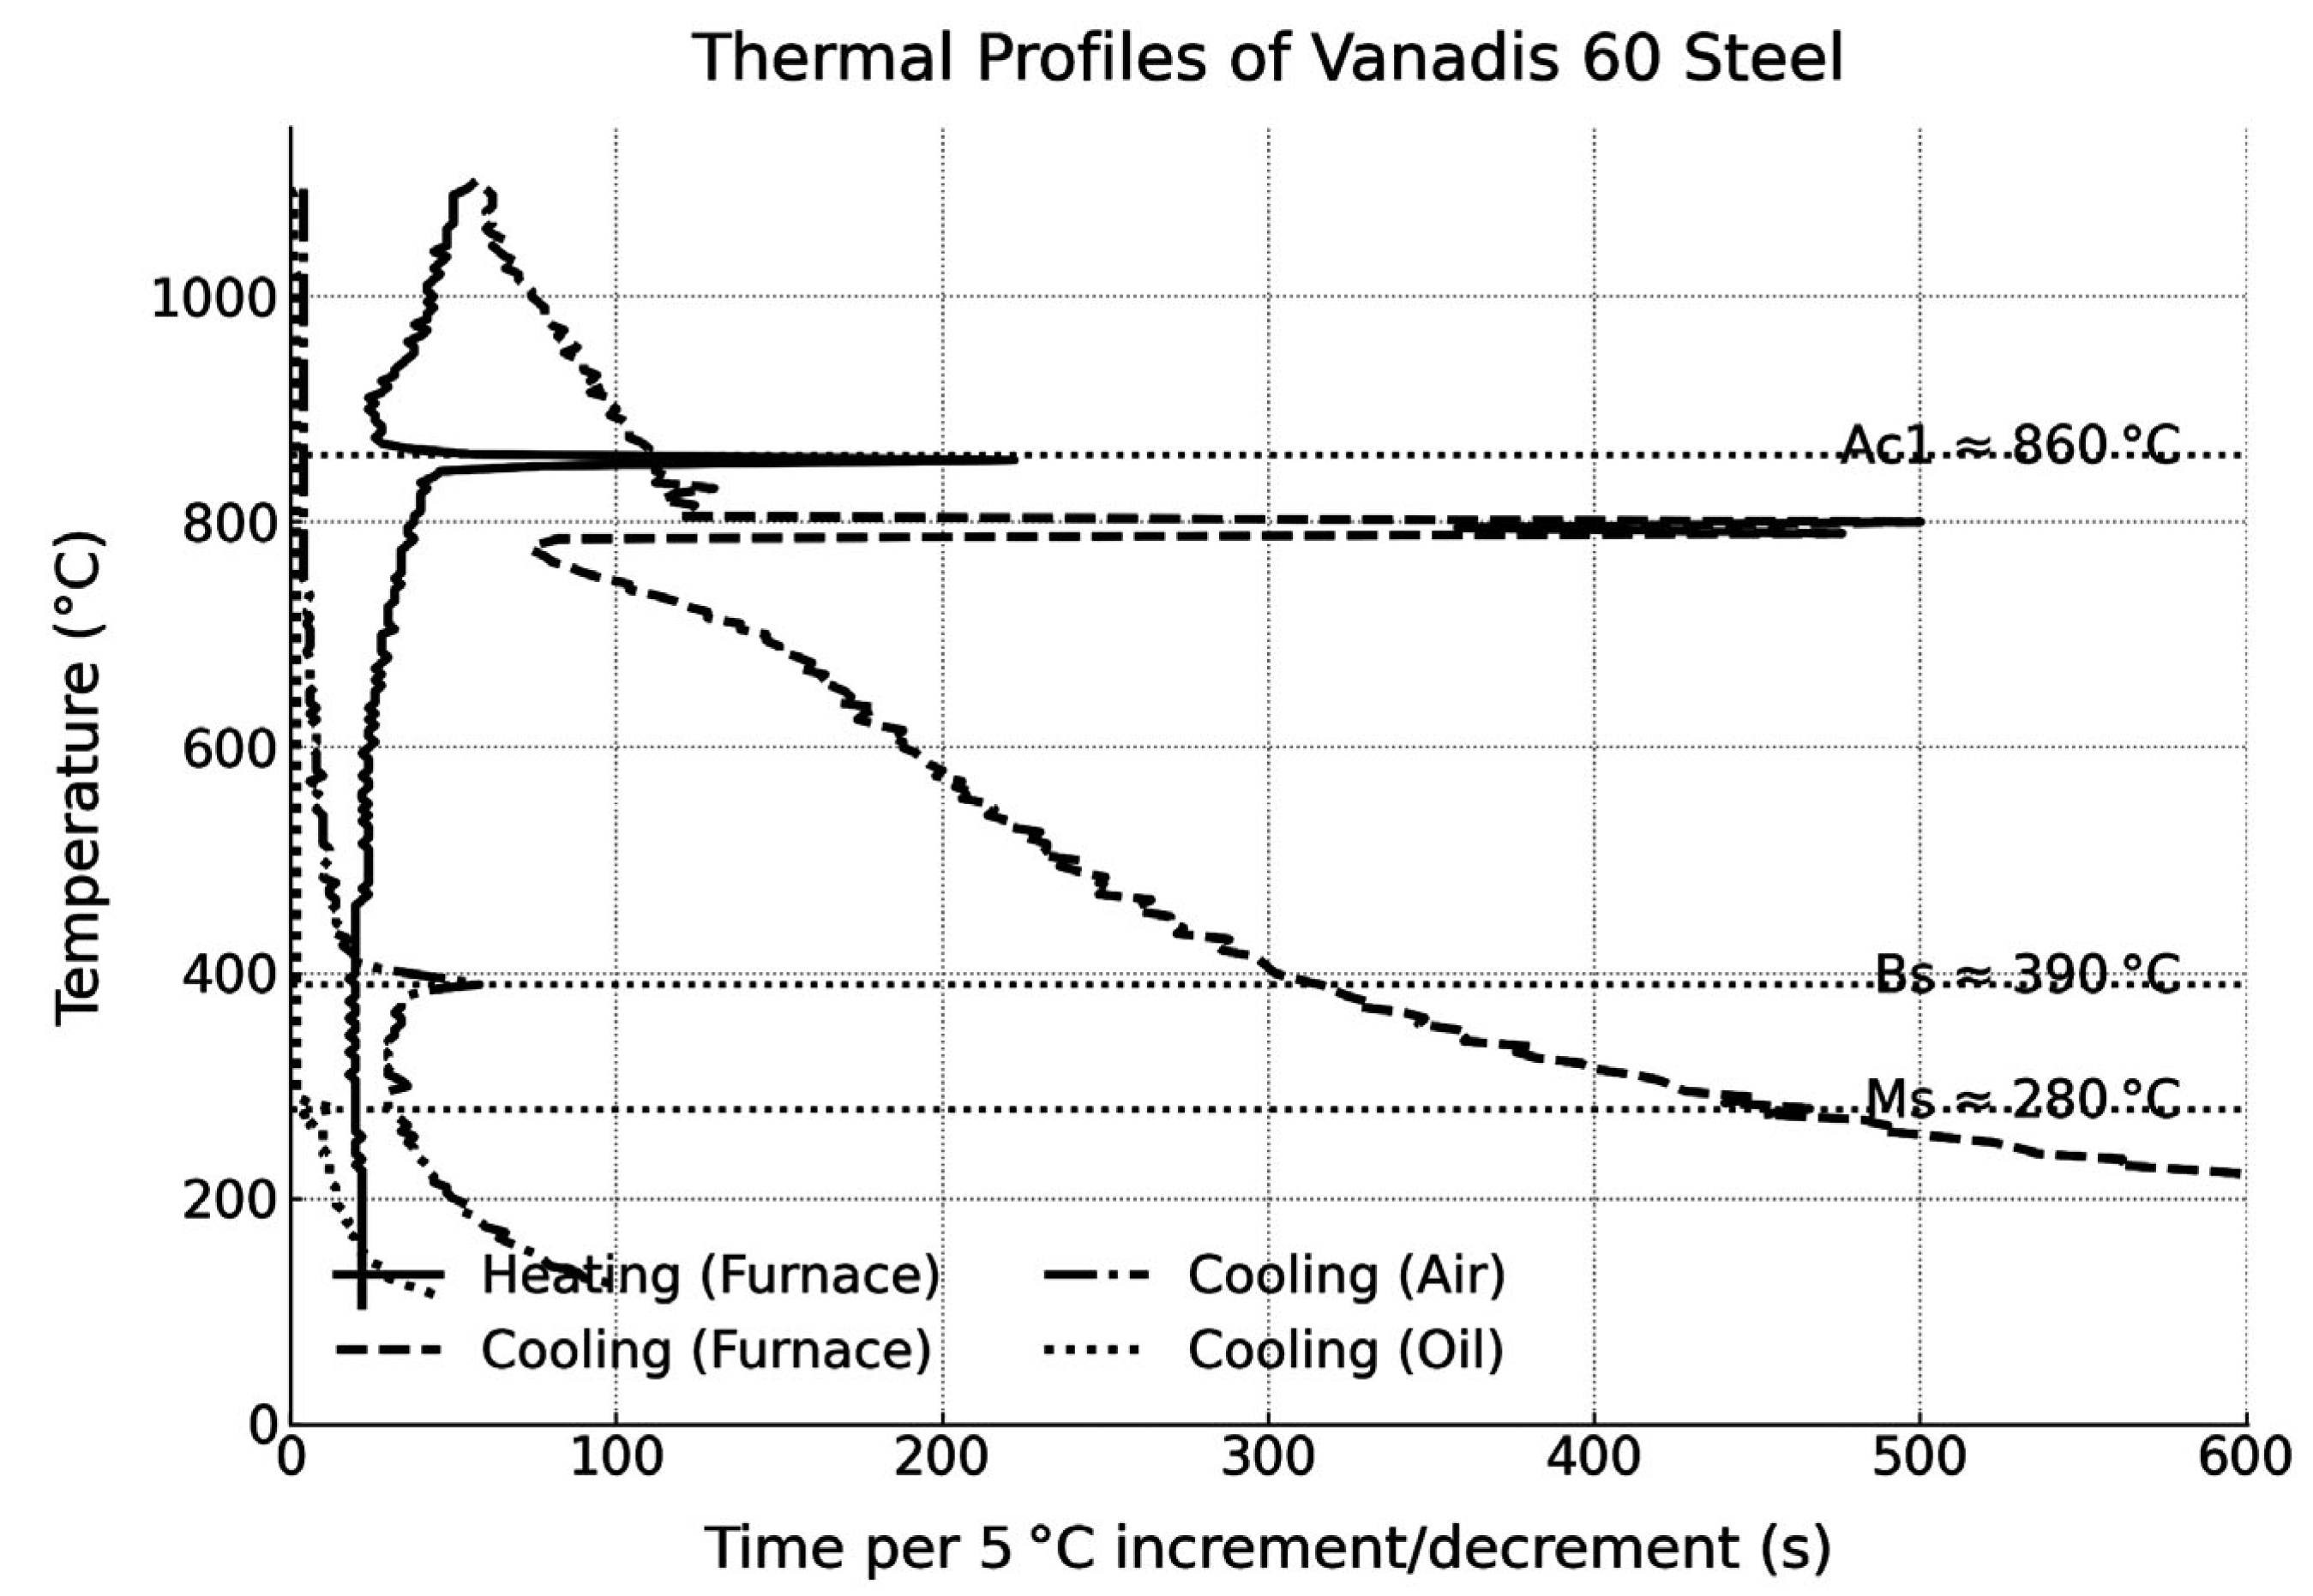
Figure 1. Heating and cooling profiles of Vanadis 60 steel during furnace heating, furnace cooling, air cooling, and oil quenching. Critical transformation temperatures (Ac1, Bs, and Ms) are indicated based on inflexion points in the thermal response.
Solids 06 00046 g001
Figure 2. Microstructural evolution after austenitising at 1100 °C and cooling under different conditions: (a,b)—furnace cooling; (c,d)—air cooling; (e,f)—oil quenching. Images (a,c,e) were obtained by optical microscopy, while (b,d,f) correspond to SEM micrographs. The numbers indicated in the SEM micrographs correspond to the locations where EDX spectra were acquired. The elemental compositions obtained from these points are reported in Table 4.
Solids 06 00046 g002
Figure 3. Microstructure after air cooling. Arrows indicate the presence of bainite. Fine carbide laths aligned with the ferrite needles, typical of upper bainite, can be observed.
Solids 06 00046 g003
Figure 4. Vickers hardness values. Error margins correspond to a 95% confidence level.
Solids 06 00046 g004
Figure 5. X-ray diffraction patterns of Vanadis 60 steel obtained after austenitising at 1100 °C followed by different cooling conditions: furnace cooling (black), air cooling (blue), and oil quenching (red). The patterns reveal the presence of α (martensite or ferrite), γ (retained austenite), and carbide phases (MC, M3C, and M6C).
Solids 06 00046 g005
Figure 6. Pareto chart of standardised effects for Vickers hardness. The threshold for statistical significance is ±2.145 (95% confidence). Standardisation was performed using an experimental error of 69.484 (MSerror from ANOVA).
Solids 06 00046 g006
Figure 7. Interaction plots for the aliased effects A × D and B × C. A × D shows a marked interaction, suggesting a combined effect of austenitising temperature and number of temperings on hardness. In contrast, B × C shows lines that do not cross, indicating minimal interaction between quenching medium and tempering temperature.
Solids 06 00046 g007
Figure 8. Pareto chart of standardised effects for flexural strength. The threshold for statistical significance is ±2.145 (95% confidence). Standardisation was performed using an experimental error of 72.832 (MSerror from ANOVA).
Solids 06 00046 g008
Figure 9. Pareto chart of standardised effects for maximum flexural. The threshold for statistical significance is ±2.145 (95% confidence). Standardisation was performed using an experimental error of 0.1164 (MSerror from ANOVA).
Solids 06 00046 g009
Figure 10. Interaction plots for the factor pairs A × D and B × C, corresponding to the maximum deflection in the three-point bending test.
Solids 06 00046 g010
Figure 11. X-ray diffractograms obtained in the different experiments.
Solids 06 00046 g011
Figure 12. Pareto charts and normal probability plots showing the factors and interactions with significant effects on: (a,b) weight percentage of retained austenite; (c,d) weight percentage of martensite; (ej) weight percentage of the different types of detected carbides; (k,l) lattice parameter of ferrite–martensite.
Solids 06 00046 g012aSolids 06 00046 g012b
Figure 13. Effect of the A × B and C × D interactions on the M3C-type carbide content. Significant interactions are indicated.
Solids 06 00046 g013
Figure 14. Microstructure after heat treatment, with 2 tempering cycles. (a) Experiment 1—austenitised at 1020 °C, air cooled, and tempered at 500 °C; (b) experiment 4—austenitised at 1180 °C, oil quenched, and tempered at 500 °C; (c) experiment 5—austenitised at 1020 °C, air cooled, and tempered at 560 °C; (d) experiment 8—austenitised at 1180 °C, oil quenched, and tempered at 560 °C; (e) image corresponding to experiment 8 obtained using secondary electrons; (f) same area imaged using backscattered electrons.
Solids 06 00046 g014
Table 1. Chemical composition of Vanadis 60 steel (wt.%).
CCrMoWVCoFe
2.34.27.06.56.510.5resto
Table 2. Analysed factors and levels.
CodeFactorsLevel −1Level +1
AAustenitising temperature1020 °C (15 min)1180 °C (15 min)
BQuenching mediumAirOil
CTempering temperature500 °C (1 h)560 °C (1 h)
DNumber of tempering cycles23
Table 3. Experimental matrix. The column D = ABC was generated from the coded values of columns A, B, and C. The final column indicates the effects to be evaluated. Second-order interactions appear confounded (e.g., AB with CD).
ExperimentABCDEffects
1−1−1−1−1A
B
C
D
AB + CD
AC + BD
AD + BC
2+1−1−1+1
3−1+1−1+1
4+1−1−1−1
5−1−1+1+1
6+1−1+1−1
7−1+1+1−1
8+1+1+1+1
Table 4. Semiquantitative EDX analysis of the carbides shown in Figure 2 (atomic%).
SpectrumCVCrFeCoMoWCarbide Most Likely
1Rem.2.82.241.48.52.61.6M3C
2Rem.11.22.89.321.476.13.25MC
3Rem.2.33.123.34.927.223.5M6C
4Rem.3.03.121.54.726.023.4M6C
5Rem.16.32.72.30.86.12.3MC
6Rem.16.42.62.40.46.32.3MC
Table 5. Weight fractions of the crystalline phases determined by Rietveld refinement for each cooling condition.
StateRietveld FittingPhaseswt.%Error (wt.%)Lattice Parameter (Å)
AnnealedRwp = 10.7
Rexp = 5.23
Chi2 = 4.16
Ferrite47.66±1.452.86747±0.00037
Austenite31.36±1.71
M3C carbide8.34±1.52
M6C carbide1.39±0.16
MC carbide11.26±0.69
AirRwp = 9.66
Rexp = 5.35
Chi2 = 3.27
Ferrite41.26±4.212.88274±0.00063
Austenite41.15±2.98
M3C carbide4.73±1.28
M6C carbide1.26±0.17
MC carbide11.59±0.95
OilRwp = 9.16
Rexp = 5.43
Chi2 = 3.47
Ferrite42.06±3.992.88697±0.00066
Austenite40.02±2.79
M3C carbide5.08±1.33
M6C carbide1.35±0.18
MC carbide11.49±0.90
Table 6. Vickers hardness values obtained for the eight experimental conditions. Each value represents the mean of three replicates.
ExperimentReplicate 1Replicate 2Replicate 3Mean
1755.13766.22768.41763.26
2855.97837.87851.20848.35
3981.14975.74996.21984.36
41023.061005.98999.911009.65
5888.89892.40904.67895.32
6954.17933.73953.31947.07
7910.69910.29912.71911.23
8986.12977.09999.45987.55
Table 7. Estimated main and interaction effects on hardness, with corresponding p-values indicating statistical significance (p < 0.05).
EffectEstimatedUpper IC (95%)Lower IC (95%)Standardised t-Value
A59.62566.92452.3267.15
B109.692116.991102.39313.16
C33.89141.19026.5934.07
D21.09128.39013.7932.53
AB + CD−8.808−1.509−16.107−1.06
AC + BD4.39211.690−2.9070.53
AD + BC−81.508−74.209−88.807−9.78
Table 8. ANOVA summary for hardness response. The model explains 99.33% of the variability (adjusted R2 = 98.90%).
SourceSum of SquaresdfMean SquareF-Ratiop-Value
A21,330.8121,330.8306.990.0000
B72,193.6172,193.61038.990.0000
C6891.8716891.8799.190.0000
D2669.1512669.1538.410.0000
AB + CD465.521465.526.70.0215
AC + BD115.721115.721.670.2178
AD + BC39,861.7139,861.7573.680.0000
Blocks480.9762240.4883.460.0601
Total error972.7771469.484
Table 9. Bending strength (MPa) for each heat treatment condition. Includes replica and average values.
ExperimentReplicate 1Replicate 2Replicate 3Mean
11690.616711775.81712.5
21659.51669.217971708.6
31315.11430.71483.41409.7
41208.21204.51211.11207.9
51908.31991.41927.91942.5
61647.31719.715311632.7
71775.718062030.21870.6
81560.315281580.51556.3
Table 10. Estimated effects for bending strength. Includes 95% confidence intervals and standardised t-values.
EffectEstimatedUpper IC (95%)Lower IC (95%)Standardised t-Value
A−207.483−143.756−271.210−2.849
B−237.917−174.190−301.644−3.268
C240.850304.577177.1233.307
D48.350112.077−15.3770.664
AB + CD−50.60013.127−114.327−0.693
AC + BD−104.633−40.906−168.360−1.437
AD + BC163.767227.494100.0402.248
Table 11. ANOVA summary for three-point bending strength.
SourceSum of SquaresdfMean SquareF-Ratiop-Value
A258,2961258,29648.690.0000
B339,6261339,62664.030.0000
C348,0521348,05265.610.0000
D14,026.3114,026.32.640.1262
AB + CD15,362.2115,362.22.900.1109
AC + BD65,688.8165,688.812.380.0034
AD + BC160,9171160,91730.340.0001
Blocks20,519.1210,259.61.930.1813
Total error74,264.0145304.57
Table 12. Displacement at fracture (mm) for each heat treatment condition. Includes replica and average values.
ExperimentReplicate 1Replicate 2Replicate 3Mean
12.842.812.852.83
22.682.642.902.74
31.932.232.162.11
41.891.871.931.90
52.642.732.702.69
62.332.512.182.34
72.522.582.852.65
81.952.222.232.13
Table 13. Estimated effects for displacement at fracture. Includes 95% confidence intervals and standardised t-values.
EffectEstimatedUpper IC (95%)Lower IC (95%)Standardised t-Value
A−0.2925−0.3516−0.2334−2.513
B−0.4542−0.5132−0.3950−3.901
C0.05920.00000.11820.508
D−0.0125−0.07160.0466−0.107
AB + CD−0.0708−0.1299−0.0117−0.608
AC + BD−0.1408−0.1999−0.0817−1.210
AD + BC0.33080.27170.38992.842
Table 14. ANOVA summary for displacement at fracture.
SourceSum of SquaresdfMean SquareF-Ratiop-Value
A0.51333810.51333837.880.0000
B1.237611.237691.320.0000
C0.021004210.02100421.550.2336
D0.000937510.00093750.070.7964
AB + CD0.030104210.03010422.220.1583
AC + BD0.11900410.1190048.780.0103
AD + BC0.65670410.65670448.450.0000
Blockss0.07252520.03626252.680.1037
Error0.189742140.013553
Table 15. Weight percentages of crystalline phases determined by Rietveld refinement.
No.Rietveld FittingPhaseswt.%Lattice Parameter (Å)
1
Austenitised at 1020 °C
Air cooled
Tempered at 500 °C (2 cycles)
Rwp = 12.8
Rexp = 6.48
Chi2 = 3.89
Ferrite57.57±4.352.87541±0.00036
Austenite13.31±1.20
MC carbide25.62±1.43
M6C carbide3.5±0.28
M3C carbide----
2
Austenitised at 1180 °C
Air cooled
Tempered at 500 °C (3 cycles)
Rwp = 11.1
Rexp = 7.06
Chi2 = 2.46
Ferrite60.37±4.852.88140±0.00056
Austenite6.79±0.96
MC carbide16.45±1.09
M6C carbide1.50±0.19
M3C carbide14.89±1.72
3
Austenitised at 1020 °C
Oil quenched
Tempered at 500 °C (3 cycles)
Rwp = 11.8
Rexp = 7.02
Chi2 = 2.85
Ferrite66.85±5.072.87863±0.00047
Austenite----
MC carbide16.32±1.07
M6C carbide2.25±0.22
M3C carbide14.57±1.60
4
Austenitised at 1180 °C
Oil quenched
Tempered at 500 °C (2 cycles)
Rwp = 10.6
Rexp = 6.88
Chi2 = 2.36
Ferrite57.04±4.892.88219±0.00055
Austenite11.43±1.25
MC carbide19.29±1.26
M6C carbide1.43±0.19
M3C carbide10.81±1.66
5
Austenitised at 1020 °C
Air cooled
Tempered at 560 °C (3 cycles)
Rwp = 10.5
Rexp = 6.68
Chi2 = 2.48
Ferrite71.34±5.202.87461±0.00041
Austenite----
MC carbide20.27±1.24
M6C carbide2.70±0.24
M3C carbide5.68±1.34
6
Austenitised at 1180 °C
Air cooled
Tempered at 560 °C (2 cycles)
Rwp = 10.8
Rexp = 7.00
Chi2 = 2.39
Ferrite69.86±5.262.87798±0.00054
Austenite----
MC carbide17.29±1.12
M6C carbide1.44±0.18
M3C carbide11.41±1.49
7
Austenitised at 1020 °C
Oil quenched
Tempered at 560 °C (2 cycles)
Rwp = 11.1
Rexp = 6.96
Chi2 = 2.54
Ferrite70.62±5.122.87628±0.00045
Austenite----
MC carbide16.94±1.07
M6C carbide2.22±0.21
M3C carbide10.21±1.41
8
Austenitised at 1180 °C
Oil quenched
Tempered at 560 °C (3 cycles)
Rwp = 12.2
Rexp = 7.06
Chi2 = 2.99
Ferrite69.50±5.912.87638±0.00055
Austenite----
MC carbide16.29±1.16
M6C carbide1.26±0.19
M3C carbide10.98±1.54
μ (Fe7W6)1.97±0.57
Table 16. Estimated effects on the proportions of crystalline phases (wt.%) and lattice parameter of tempered martensite (Å).
EffectAustenite (%)Martensite (%)MC (%)M6C (%)M3C (%)a (Å)
Mean3.9465.3918.562.039.822.878
A1.23−2.40−2.45−1.264.410.003
B−2.171.21−2.69−0.493.640.001
C−7.889.87−1.72−0.26−0.50−0.003
D−4.483.24−2.45−0.223.42−0.000
AB + CD4.48−3.063.610.37−5.90−0.001
AC + BD−1.231.100.640.15−1.16−0.001
AD + BC2.16−1.750.530.16−1.59−0.001
Table 17. Semiquantitative EDX analysis of the carbides shown in Figure 14 (atomic%).
SpectrumCVCrFeCoMoWSMnMost Likely Phase
1Rem.----7.8--4.73.0----M3C
2Rem.--2.732.05.95.33.2----M3C
3Rem.12.12.02.6--4.32.1----MC
4Rem.----24.8------39.036.2MnS
5Rem.----13.82.66.44.2----M6C
6Rem.2.8--26.14.2--------M3C
7Rem.----11.72.66.64.1----M6C
8Rem.14.4--3.3--4.82.1----MC
9Rem.--2.114.62.59.25.7----M6C
Disclaimer/Publisher’s Note: The statements, opinions and data contained in all publications are solely those of the individual author(s) and contributor(s) and not of MDPI and/or the editor(s). MDPI and/or the editor(s) disclaim responsibility for any injury to people or property resulting from any ideas, methods, instructions or products referred to in the content.