Article

Rotational Mobility of TEMPO Spin Probe in Polypropylene: EPR Spectra Simulation and Calculation via Approximated Formulas

by
Natalia A. Chumakova
1,2,*,
Tatiana S. Yankova
2 and
Alexander I. Kokorin
1,3,4
1
N. N. Semenov Federal Research Center for Chemical Physics, Russian Academy of Science, Kosygin St. 4, 119991 Moscow, Russia
2
Chemistry Department, M. V. Lomonosov Moscow State University, Leninskiye Gory, 1/3, 119991 Moscow, Russia
3
Chemistry Department, Plekhanov Russian University of Economics, Stremyanny per., 36, 115093 Moscow, Russia
4
Infochemistry Scientific Center, ITMO University, Lomonosova str. 9, 191002 St. Petersburg, Russia
*
Author to whom correspondence should be addressed.
Solids 2024, 5(4), 499-509; https://doi.org/10.3390/solids5040033
Submission received: 9 July 2024 / Revised: 13 September 2024 / Accepted: 12 October 2024 / Published: 15 October 2024
(This article belongs to the Special Issue Advances in the Study and Application of Polymers)

Abstract

:
The rotational correlation times of a small compact spin probe (2,2,6,6-tetramethylpiperidin-1-yl)oxyl in isotactic polypropylene were obtained over a wide temperature range by EPR spectra simulation taking into account rotational anisotropy as well as distribution of the probe molecules by rotational mobility. The averaged values of the rotational correlation times were compared with the corresponding values calculated using well-known approximated formulas based on the intensities and widths of the spectral lines. It was shown that the calculated values can be used as effective parameters to characterize the rotational mobility of the spin probe in the polymer matrix in a wide range of rotational correlation times.

1. Introduction

The spin probe technique has been widely used for a long time to characterize polymer mobility [1]. It is currently a routine method for polymer studies, and novel approaches based on pulsed and high-field EPR, as well as spatial EPR imaging, are constantly being proposed [2,3,4]. The spin probe technique is based on the introduction of stable paramagnetic molecules with strongly anisotropic spin–Hamiltonian parameters, more often, nitroxide radicals, into a polymer matrix. The molecular mobility of the probes inside the polymer, which can be determined by analyzing the shape of their EPR spectra, reflects the mobility of macromolecules. Of course, the information obtained in this way depends on the size and shape of the probe. Radicals with different geometries can exhibit various mobility in the same polymer under the same conditions. On the one hand, this makes the results obtained unambiguous; on the other hand, it is possible to characterize various dynamic processes in the polymer matrix using several probes with different structures (see, for example, [5]).
A common parameter used to characterize the molecular mobility of spin probes is the rotational correlation time (τc), which is related to the rotational diffusion coefficient as follows: τc = 1/(6·Drot). There are two methods to extract information about the rotational mobility of radicals from their EPR spectra. The first and the most common approach is to measure spectral features, such as intensities and widths of the spectral lines, and to derive correlation. A general theory of an EPR linewidth was developed in the 1960s by Kivelson [6]. According to the theory, the peak-to-peak Lorentzian linewidth of an individual hyperfine line of a nitroxide is given by
Δ H m = A + B m N + C m N 2
where mN is the magnetic quantum number equal to −1, 0, and 1 for 14N nucleus. The A, B, and C coefficients depend on the rotational correlation time. Substituting the three values of mN into the above equation and replacing Δ H 1 Δ H 0 by I 0 I 1 for the measurement convenience (it is valid for other mN values, I1, I0, and I−1 are intensities of the corresponding lines), one can derive several expressions for the rotational correlation time [7,8]:
τ c ( 1 ) = κ 1 · Δ H 0 · I 1 I 1 I 1 I 1
τ c ( 2 ) = κ 2 · Δ H 0 · I 0 I 1 + I 0 I 1 2
τ c ( 3 ) = κ 3 · Δ H 1 · I 1 I 1 1
τ c ( 4 ) = κ 4 · Δ H 0 · I 0 I 1 1
where the coefficients κ1, κ2, κ3, and κ4 are determined from the principal values of g- and A-tensors of the nitroxide (see Appendix A). The expressions (1)–(4) have been derived for isotropic rotation of a nitroxide in the fast motion regime (5 × 10⁻¹¹ < τc < 10−9). Another assumption of exp. (1)–(4) is that the individual line shape is Lorentzian. However, it was shown in [8] that these formulas are applicable in the case when the inhomogeneous Gaussian broadening contributes to the spectrum due to an unresolved proton hyperfine structure.
Another approach to the determination of rotational correlation times is the simulation of EPR spectra. The most widely used software is EasySpin [9] and the program package developed by Freed et al. [10]. These programs are based on the stochastic Liouville equation. The EPR spectra simulation have been broadly applied for various spin-probed or spin-labelled systems due to the high reliability of this approach. It should be noted that in the case of polymers, the probe molecules are distributed by their rotational mobility. Indeed, any polymer is a heterogeneous medium at the molecular level; it includes regions of tightly coiled and loosely arranged macromolecular fragments. The probes being localized in these regions would differ in their rotational mobility. When a polymer includes several regions that differ significantly in the packing density, more mobile and less mobile radicals contribute to the EPR spectrum as a set of characteristic lines (see, for example, [3]). Such a spectrum can be simulated as the sum of several signals related to the probes with different mobility. However, if the polymer is heterogeneous at the nanometer level, spin probes would be localized in regions with gradually changing packing density, and the EPR spectrum would differ significantly from the spectrum for a homogeneous sample. This is the most complicated case, when it is necessary to simulate the spectra considering the continuous distribution of the probes by their rotational correlation times. This approach was implemented in [11,12,13] for simulation of CW EPR spectra and in [14,15] for describing 2D ELDOR spectra with the use of lognormal radical distribution by rotational correlation times. In [11,13], it was shown that the width of distribution decreases with increasing temperature, which means more uniform radical mobility at higher temperatures.
Unfortunately, the simulation of EPR spectra using distribution of radicals by rotational mobility is a complicated procedure. For this reason, spectra simulation is rarely used to analyze the mobility of spin probes in polymers. Most researchers determine rotational correlation times from EPR spectra using the approximated Formulas (1)–(4). It should be noted that the formulas were proposed for the analysis of isotropic rotation and, generally speaking, were not intended for studying heterogeneous systems. However, since it is desirable to have a simple way to assess polymer mobility without complicated spectral simulation, the applicability of the formulas for the calculation of “effective” rotational correlation times (τc*) should be considered. In [16], we showed several examples of satisfactory agreement between the rotational correlation time values obtained by spectra simulation and the ones calculated by the formulas for TEMPO in polymer matrices.
It seems appropriate to establish the range of applicability of the approximated approach by comparing τc* values obtained using different formulas among themselves and with the values obtained by spectra simulation. That was the goal of this work. We chose a small compact nitroxide radical TEMPO as a spin probe and isotactic polypropylene (PP) as a matrix because of the absence of functional groups in this polymer that could interact specifically with the probe molecules. The EPR spectra of the probe inside the polymer were recorded in a wide temperature range and simulated, taking into account the lognormal distribution of the probe molecules by rotational mobility. The rotational correlation times obtained as a result of EPR spectra simulation were compared with the values calculated by Formulas (1)–(4). It was shown that in the case of strongly anisotropic rotation of radicals, different formulas return different results. The best approximation in a wide range 2 × 10⁻¹¹ < τc < 5 × 10⁻⁹ is given by Equation (4).

2. Materials and Methods

2.1. Materials

Isotactic polypropylene was kindly provided to us by Prof. P.M. Nedorezova (N.N. Semenov Federal Research Center for Chemical Physics, Russia). The polymer characteristics (stereoregularity, melting point, and degree of crystallinity) are given in [17].
The stable nitroxide radical (2,2,6,6-tetramethylpiperidin-1-yl)oxyl (TEMPO) was purchased from Sigma-Aldrich (Figure 1a). The optimized radical geometry (Figure 1b) was calculated using the ORCA 4.0.1 software package [18]. The B3LYP–6–31g(d,p) model was used for the calculation.

2.2. Sample Preparation

TEMPO was introduced into powdered PP by diffusion from the gas phase. The number of spins as well as their distribution in PP were monitored using EPR spectroscopy. The spectra at 295 K were recorded periodically within 1–3 weeks until the spectrum shape and the line width remained constant. The sample contained 2 × 10¹⁴ spins per 1 mg of PP. It should be noted that the probes were localized only in the amorphous phase of PP.

2.3. EPR Spectroscopy

EPR spectra were recorded with a Bruker EMXplus spectrometer equipped with a high-sensitive resonator ER 4119 HS and the temperature control unit (temperature setting accuracy ±1 K). The EPR measurements were performed at microwave power values of 0.5–1 mW and a magnetic field modulation amplitude of 0.05–0.10 mT.

2.4. EPR Spectra Simulation

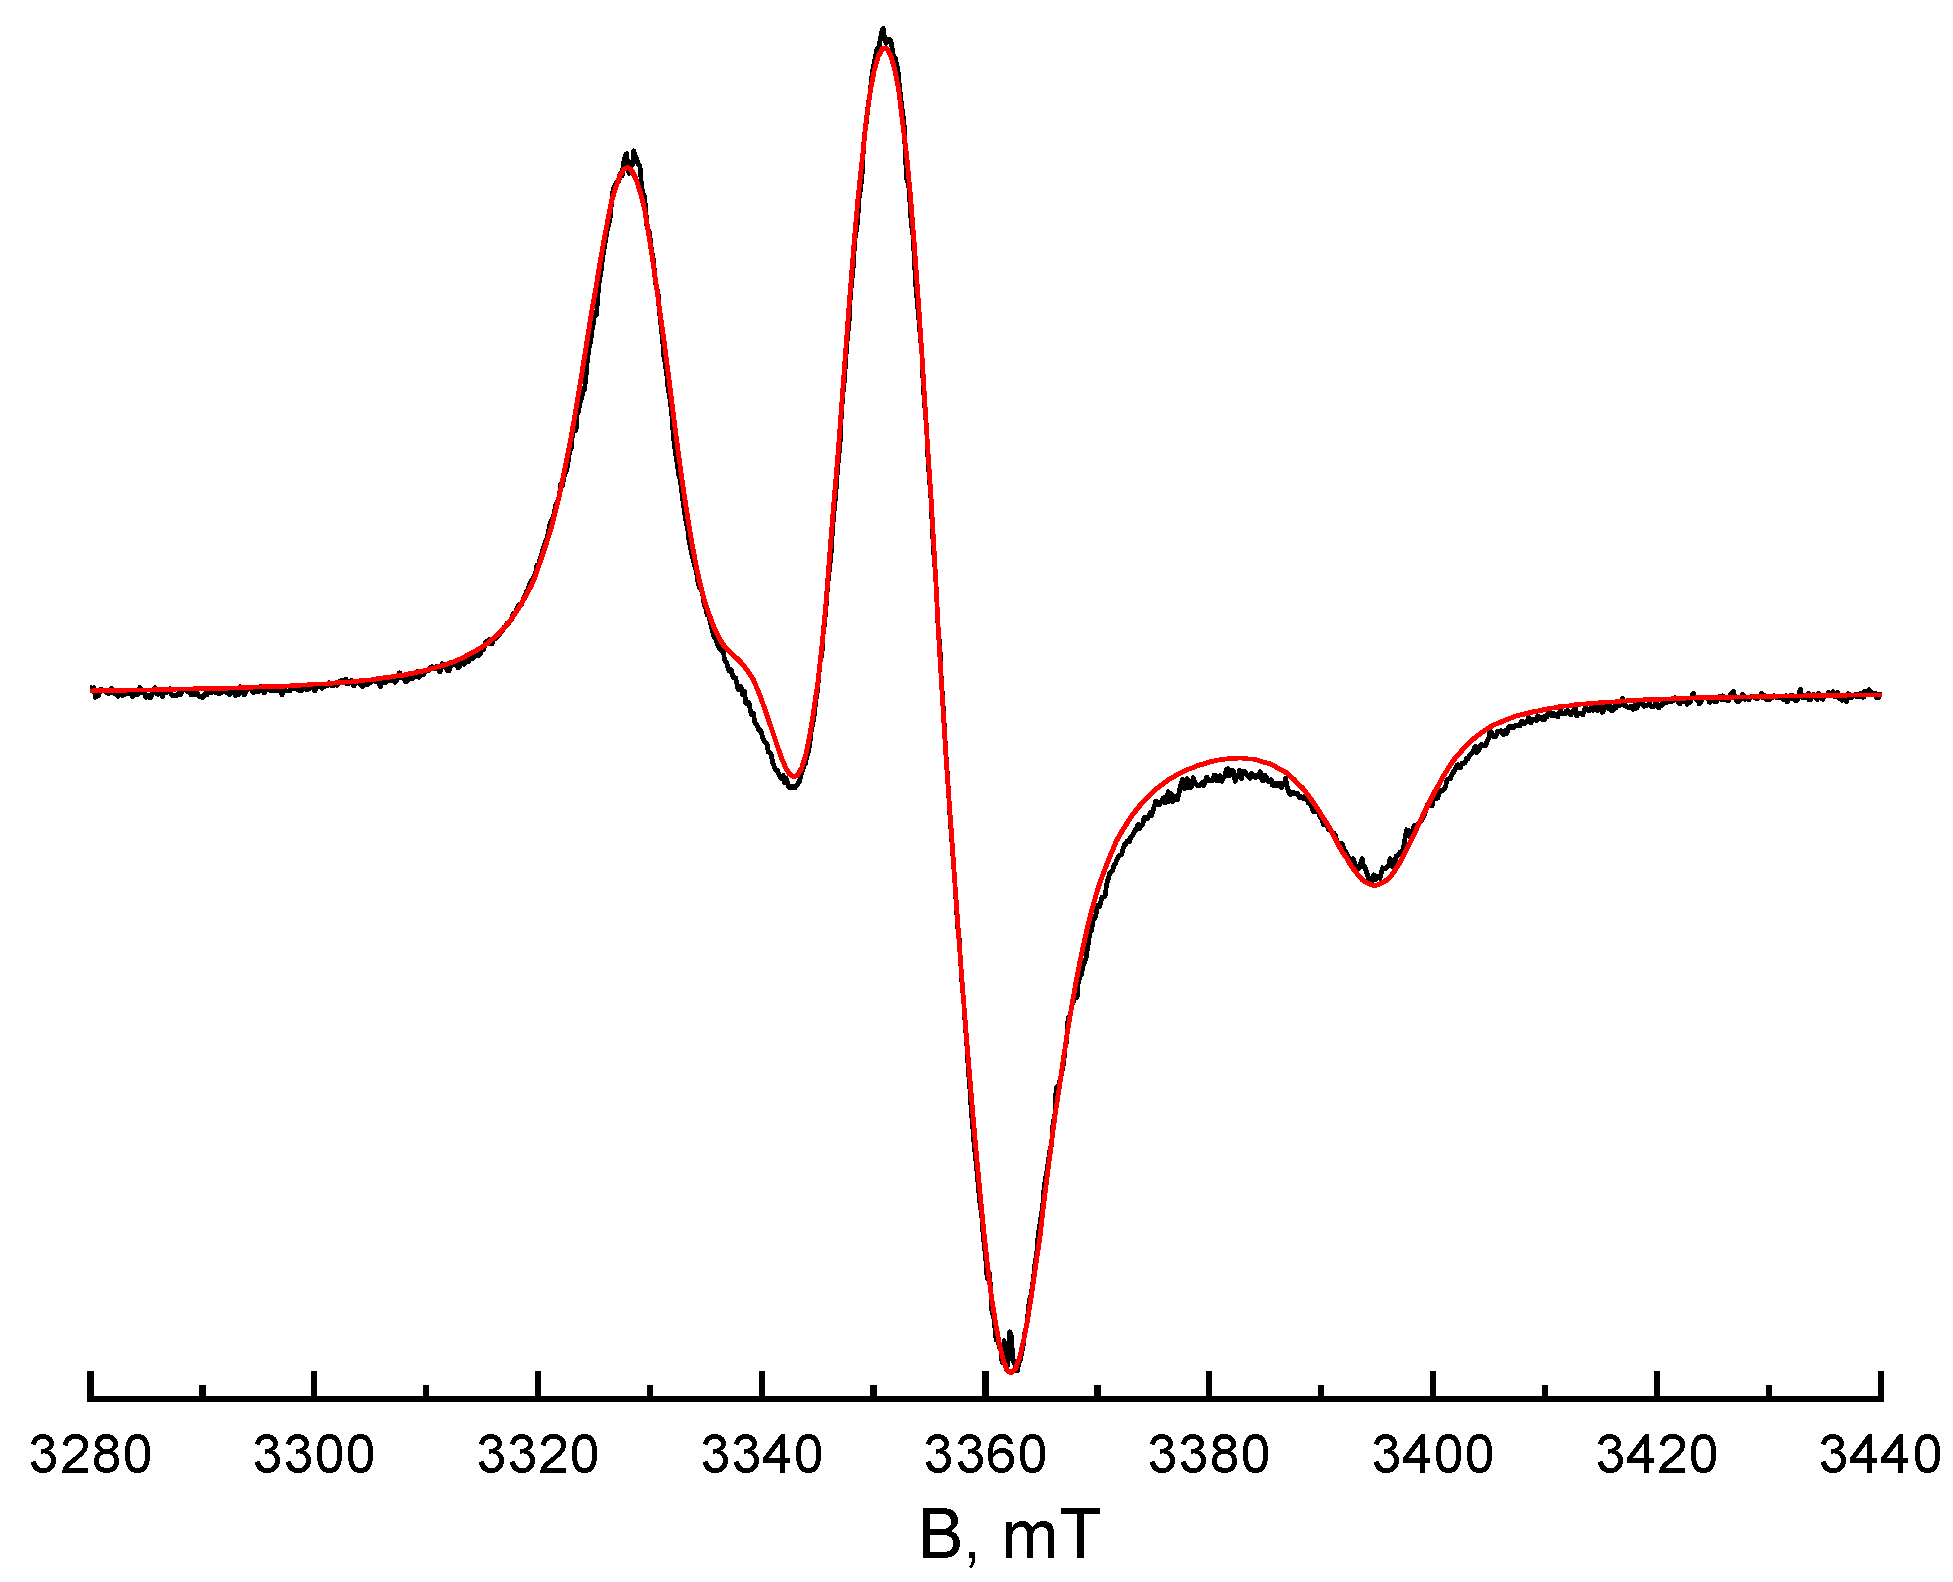
The spin–Hamiltonian parameters of TEMPO in PP were determined by simulation of the EPR spectrum recorded at a temperature of 100 K in the absence of mobility of the paramagnetic molecules (in the rigid limit). The software used for simulation as well its detailed description is available at http://www.chem.msu.ru/rus/lab/chemkin/ODF3 (accessed on 14 October 2024). The examples of application of this program for simulating EPR spectra of nitroxide radicals are given in [19]. The simulation result is shown in Figure 2. The magnetic resonance parameters of the spin probe in the polymer were found to be gxx = 2.0096 ± 0.0002, gyy = 2.0061 ± 0.0002, gzz = 2.0022 ± 0.0002, Axx = 0.67 ± 0.05 mT, Ayy = 0.73 ± 0.05 mT, Azz = 3.34 ± 0.01 mT.
The EPR spectra recorded in the temperature range 170–435 K were simulated, taking into consideration the lognormal distribution of the radicals by their rotational mobility, which is the normal (Gauss) distribution of lnDrot. The probability density function (ρ) is characterized by a center (lnDroto) and a width (σ) [13]:
ρ D r o t = 0 , D r o t < 0 ρ D r o t = 1 σ 2 π e x p ( ( l n D r o t l n D r o t 0 ) 2 2 σ 2 ) , D r o t > 0
The software developed by Prof. A. Kh. Vorobiev and Dr. D.A. Chernova (Moscow State University, Russia) was used. The principal axes of the g- and hyperfine interaction tensors of the unpaired electron with 14N nuclei were supposed to coincide. The shape of the individual resonance line was expressed by the Voigt function. The contributions of the Gauss and Lorentz functions were described by tensors of the second rank. The principal axes of the tensors coincided with the magnetic axes of the radical.
Generally speaking, the simulation of EPR spectra is an inverse ill-posed mathematical problem. The main difficulty in solving such a problem lies in the correlation between the varied parameters. Simulating the spectra of mobile radicals, one should take into account that τc significantly correlates with the contribution of the Lorentz function to the spectral line width [20]. According to our experience, in the case of the radicals’ distribution by rotational mobility, a correlation between the width of the distribution and the rotational correlation times may take place. To avoid the correlations, we simulated the spectra by varying the least number of parameters that yield an adequate simulation result, namely, the description of positions, widths, and intensities of the spectral lines. A perfect fitting of the spectra was not considered necessary. The optimal parameters should be physically meaningful, as well as independent of the initial approximation.

3. Results

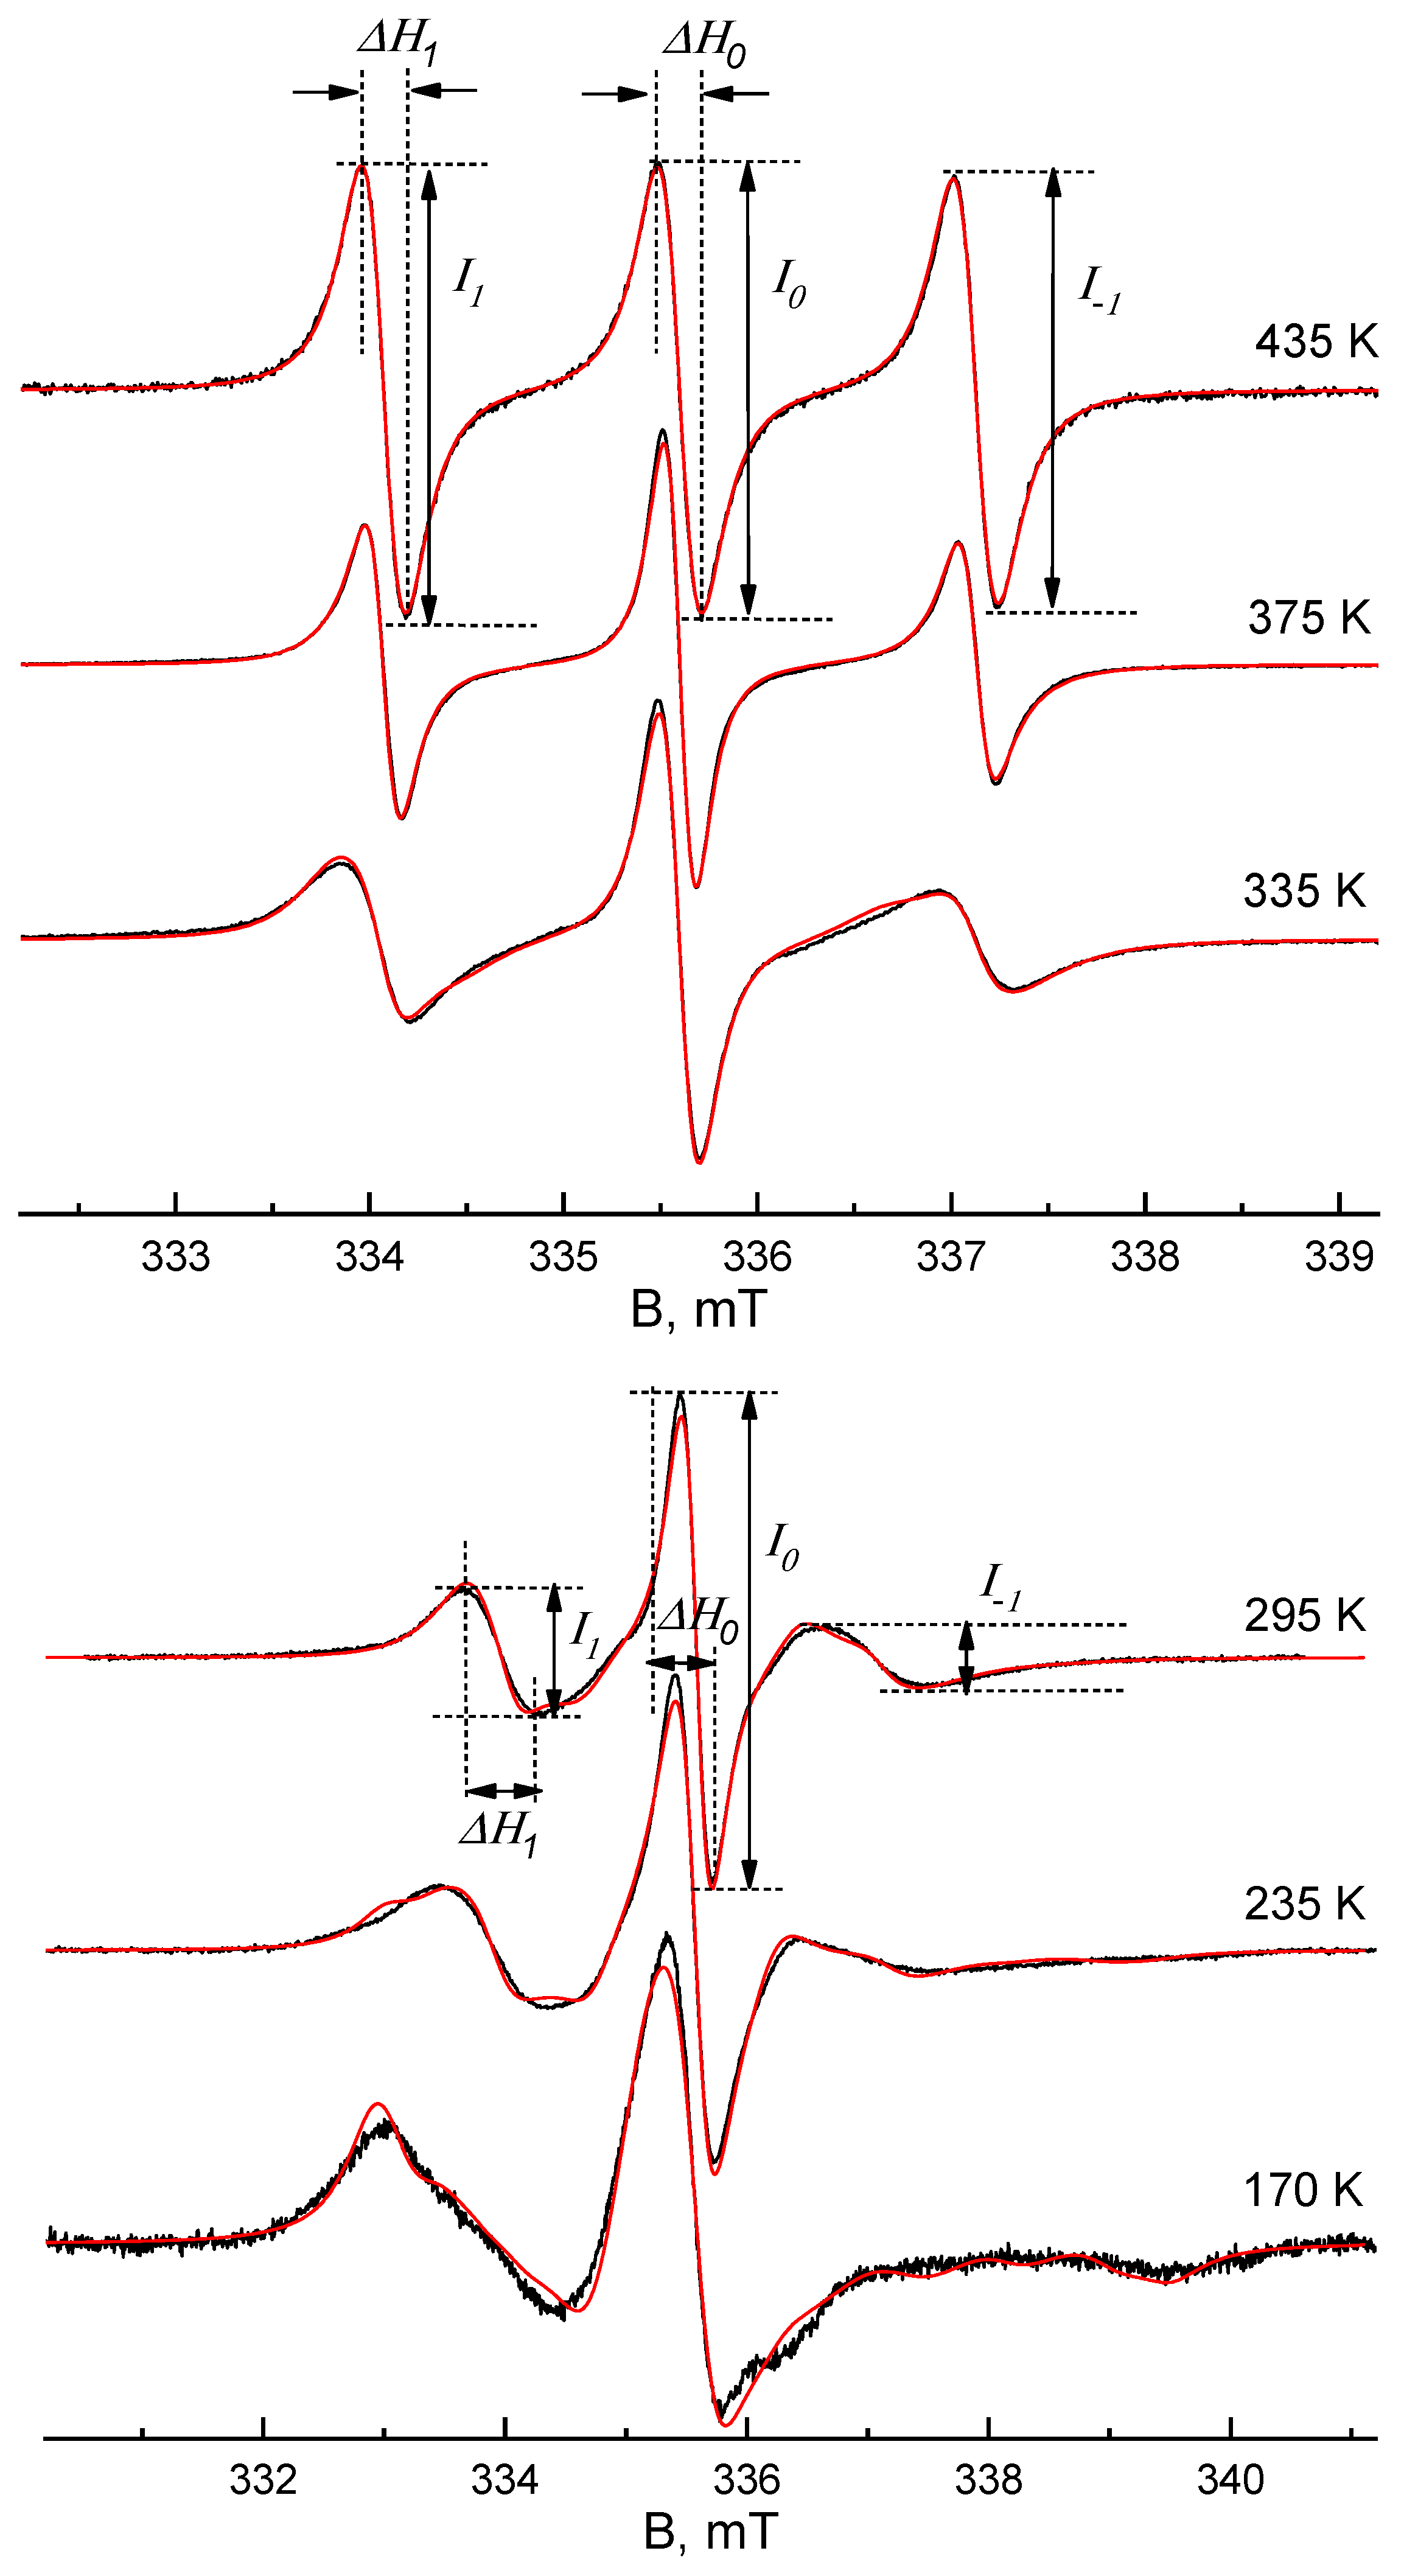
Figure 3 shows examples of the simulation of EPR spectra recorded at different temperatures in the range of 170–435 K. More spectra are given in the Supplementary Materials (Figure S1). For spectra recorded at temperatures below 170 K, it was impossible to measure the intensities and line widths necessary for calculations using Formulas (1)–(4). The spectrum recorded at 435 K corresponds to a fast limit motional regime when all three spectral lines have equal widths and intensities. Therefore, X-band EPR spectroscopy could not be sensitive to a difference between this spectrum and the spectra at higher temperatures. Additionally, an increase in temperature above 435 K leads to the appearance of spin–exchange distortions in the spectra, that is, to an additional complication of the spectral shape.
It is seen from Figure 3 that the simulation quality is quite good. In the high-temperature range, the spectra can be simulated perfectly. With temperature decrease, the simulation quality slightly worsens, but the positions, intensities, and shapes of the spectral lines are reproduced satisfactorily. It should be underlined that we did not strive for a perfect simulation, although that was possible through increasing the number of variable parameters, but such increasing could lead to a uniqueness decrease. Also, it should be noted that the small additional inflections in the calculated spectra (see Figure 3, spectra recorded at 235 K and 170 K) are the result of different correlation times about different axes.
In Table 1, one can see the parameters obtained as a result of EPR spectra simulation. Parameters that were not being varied during the simulation are marked with sharps. More detailed information, including the contributions of the Gauss and Lorentz functions to the Voigt function describing the shape of an individual spectral line, is given in Table S1 (Supplementary Materials). It should be noted that we simulated EPR spectra over a wide temperature range using almost the same distribution of TEMPO molecules by rotational mobility. It can be assumed that the mobility distribution reflects the distribution of the radicals by their localization in the polymer matrix. Another important result is that the rotational mobility of TEMPO around the molecular X-axis (bond N-O) (see Figure 1b) was found to be strongly hindered. Within the temperature range of 395–435 K, the rotational correlation time τx exhibited an increase with temperature decrease. At temperatures below 395 K, this value turned out to be outside the range of X-band EPR spectra sensitivity, so, we fixed it as 1.7 × 10⁻⁷ s. The phenomenon of hindered rotational mobility around the X-axis for piperidine-type nitroxide radical TEMPOL in polymer matrices was previously observed in [21,22]. The authors explained this observation by a weak complexation between the probe molecule and polymer fragments. However, in our work, the polymer does not contain any fragments other than fully saturated -CH3 groups; thus, the polymer contains only sp3-hybridized carbon atoms that are incapable of any specific interaction. We suppose that the strongly hindered rotational mobility of TEMPO around the X-axis can be explained by its molecular geometry. Indeed, in a confined space, four CH3-substituents would inhibit the rotation of the molecule around the X-axis to a greater extent compared to the rotation around the Y-axis. The results of the spectra simulation confirm this assumption—the fastest rotation of TEMPO in PP occurs around the Y-axis.
It should also be noted that in the temperature range of 245–345 K, the quasi-librations of the spin probes [13] were taken into consideration, which improved the quality of the spectra simulation. Quasi-librations are stochastic displacements of molecules with frequencies of 1010–1012 s−1 within a solid angle, which is referred to as libration amplitude. Quasi-librations of paramagnetic molecules lead to averaging of their spin–Hamiltonian parameters, as does rotational mobility. At temperatures above 345 K, the librations cannot be observed due to the intense rotational motion of the radicals. At temperatures below 243 K, the libration amplitudes become small and do not manifest themselves in the EPR spectra. The separation of rotational and librational mobility by EPR spectra simulation is an ill-posed problem. As was previously estimated [13], anisotropy of rotation and anisotropy of librations cannot be extracted simultaneously from EPR spectra. For this reason, we used the isotropic libration angle so as not to complicate the task.

4. Discussion

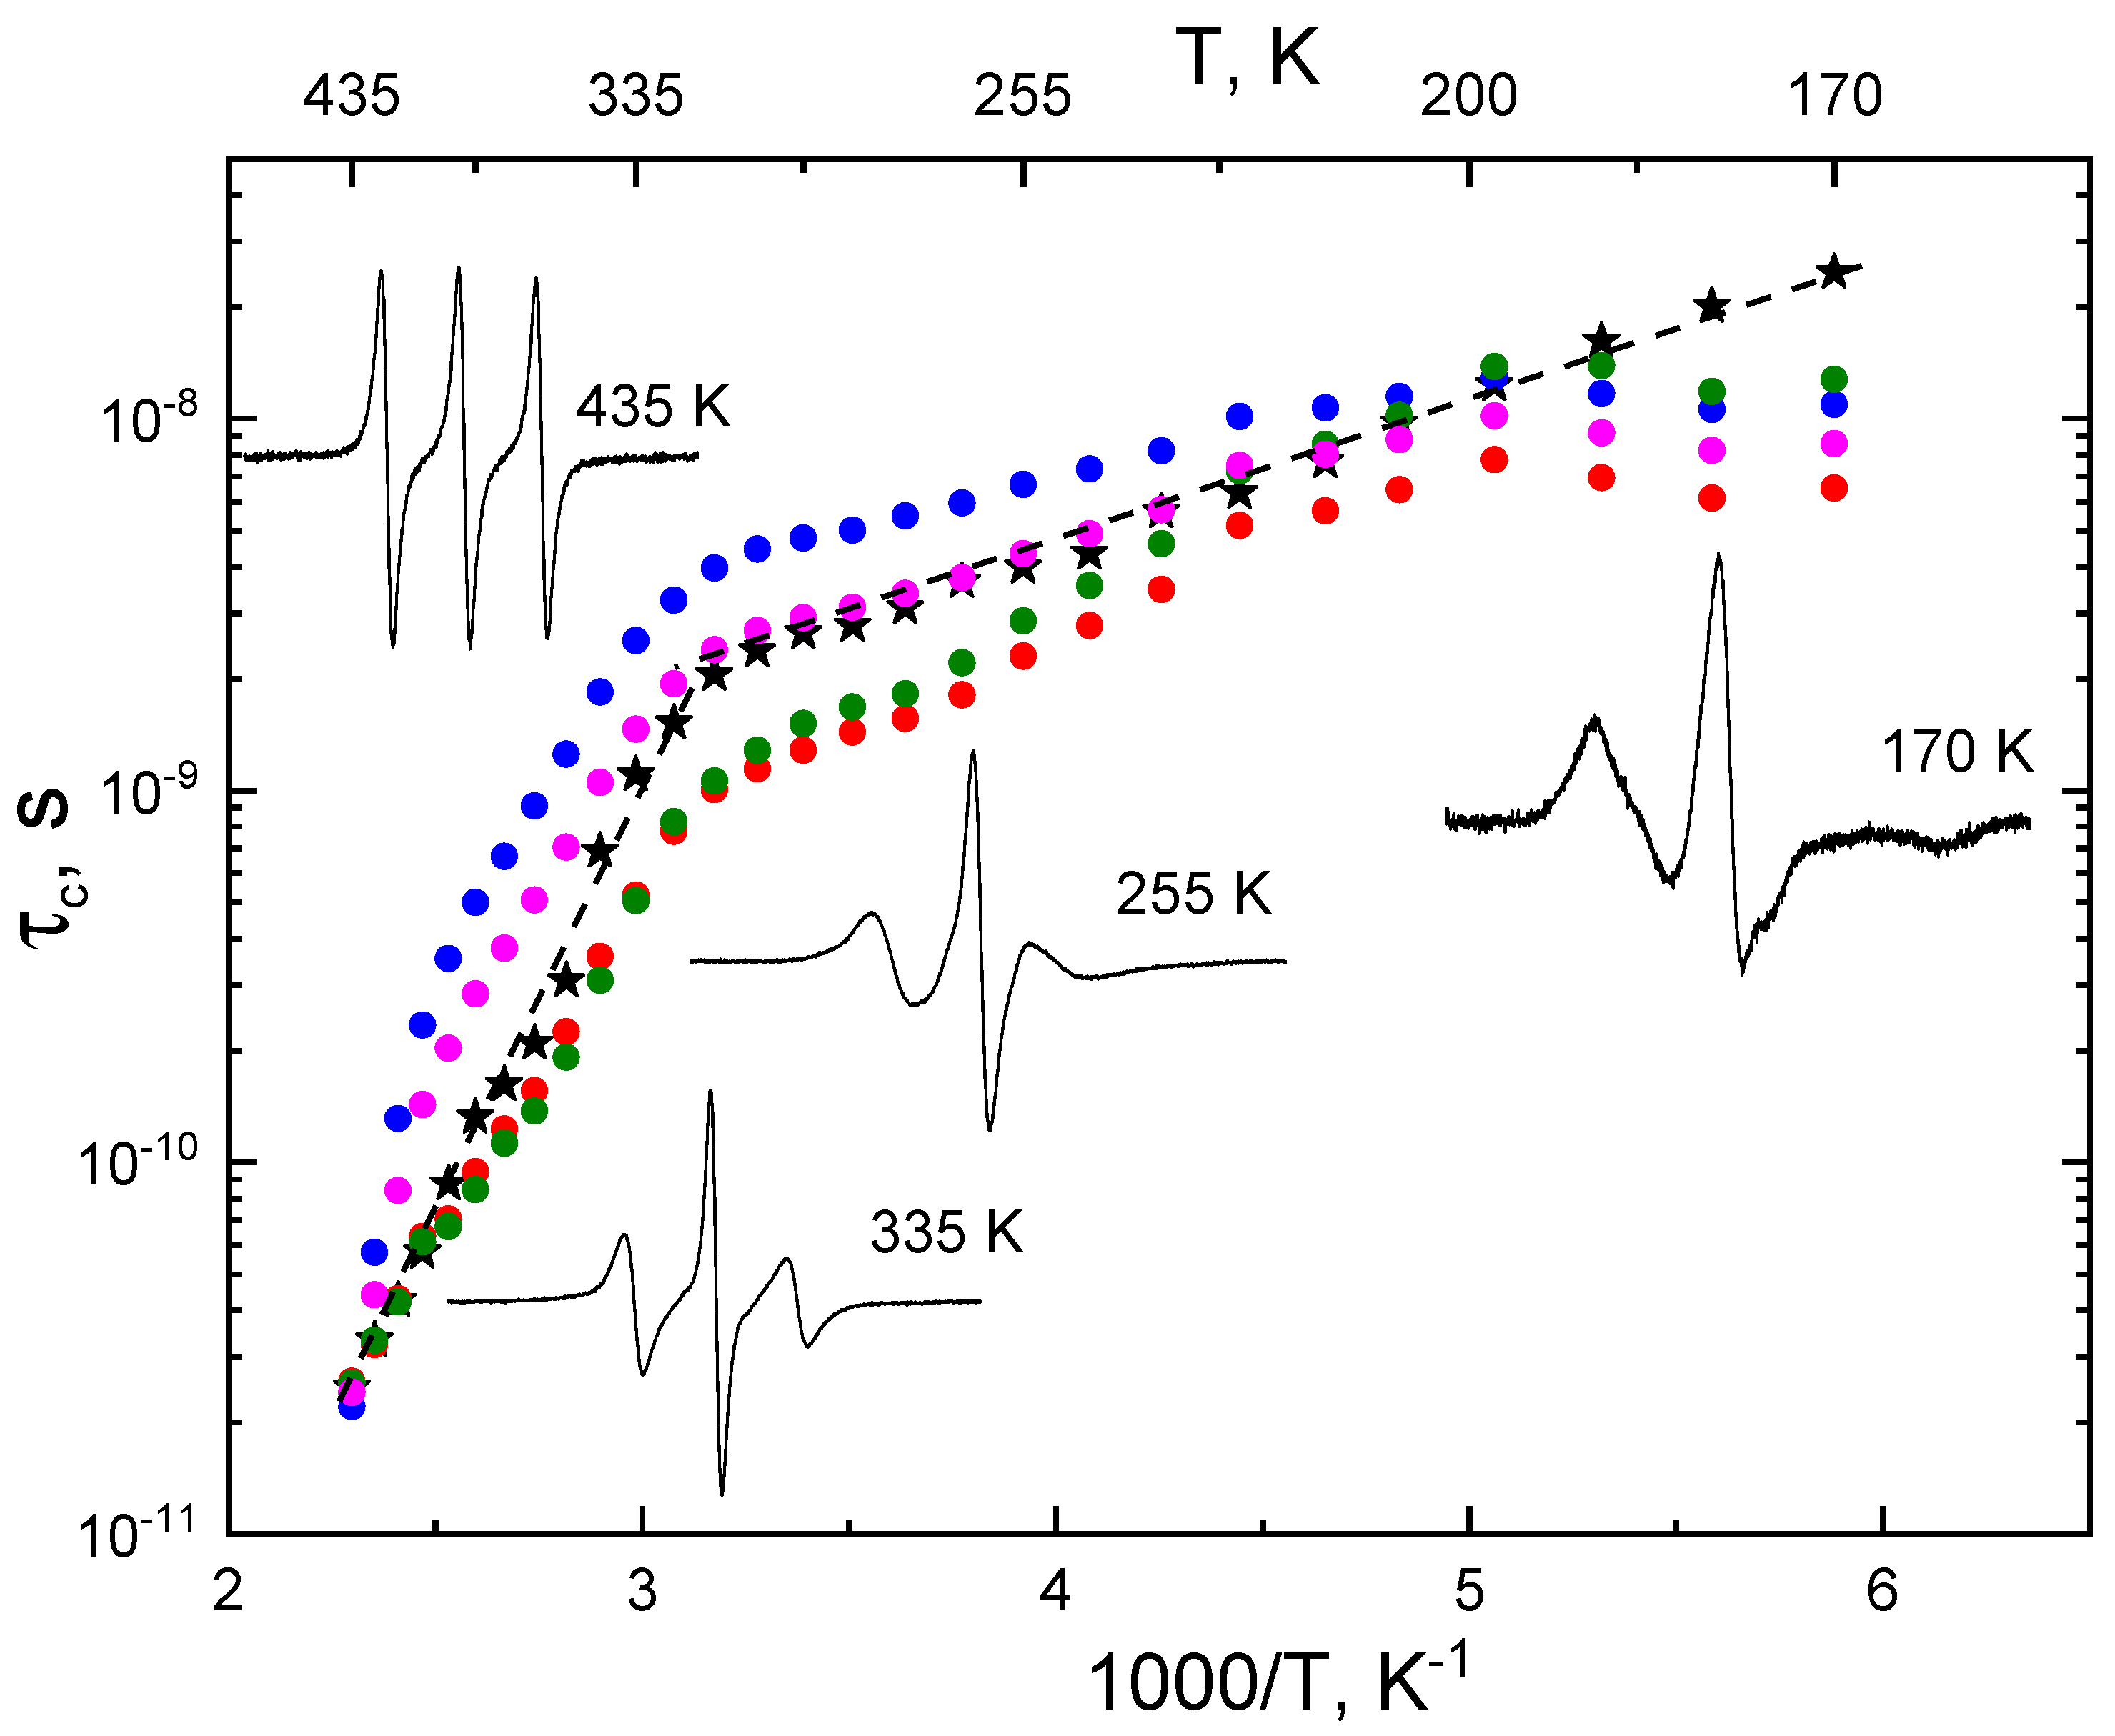
Simulation of the EPR spectra revealed high anisotropy of rotational mobility of TEMPO in PP. To compare the rotational correlation times obtained by simulation of the spectra and those calculated by approximated formulas, we calculated the average rotational correlation time of the radicals at each temperature as <τc> = (τx + τy + τz)/3. Figure 4 shows the temperature dependences of this value as well as the parameters τc*(1), τc*(2), τc*(3), and τc*(4), calculated by Formulas (1)–(4), respectively. The spectra, representative of different temperature intervals, are shown on the insets. The graphical illustration of the measurement of the spectral features required to use the formulas is shown in Figure 3. One can see that the shapes of all temperature dependencies shown in Figure 4 are similar. In all cases, the crossover between two modes of polymer mobility can be seen in the temperature range 305–315 K. These temperatures are higher than Tg for isotactic PP (~263 K). Similar patterns were observed previously in [23] for cis-1,4-poly(isoprene) using the spin probe method with TEMPO radical. The effective activation energies for TEMPO rotational diffusion (Erota), obtained from the temperature dependences, were found to be 43.5 kJ/Mol and 7.3 kJ/Mol for high and low-temperature regions, respectively. The second value is close to Erota for TEMPO in various polymers [24]. It should be noted that <τc> changes monotonically with temperature, while τc(1), τc(2), τc(3), and τc(4) demonstrate non-monotonic behavior below T = 200 K (<τc> > 1·10−8 s). It can be concluded that the approximated formulas are inapplicable at such a slow rotational mobility of the radical.
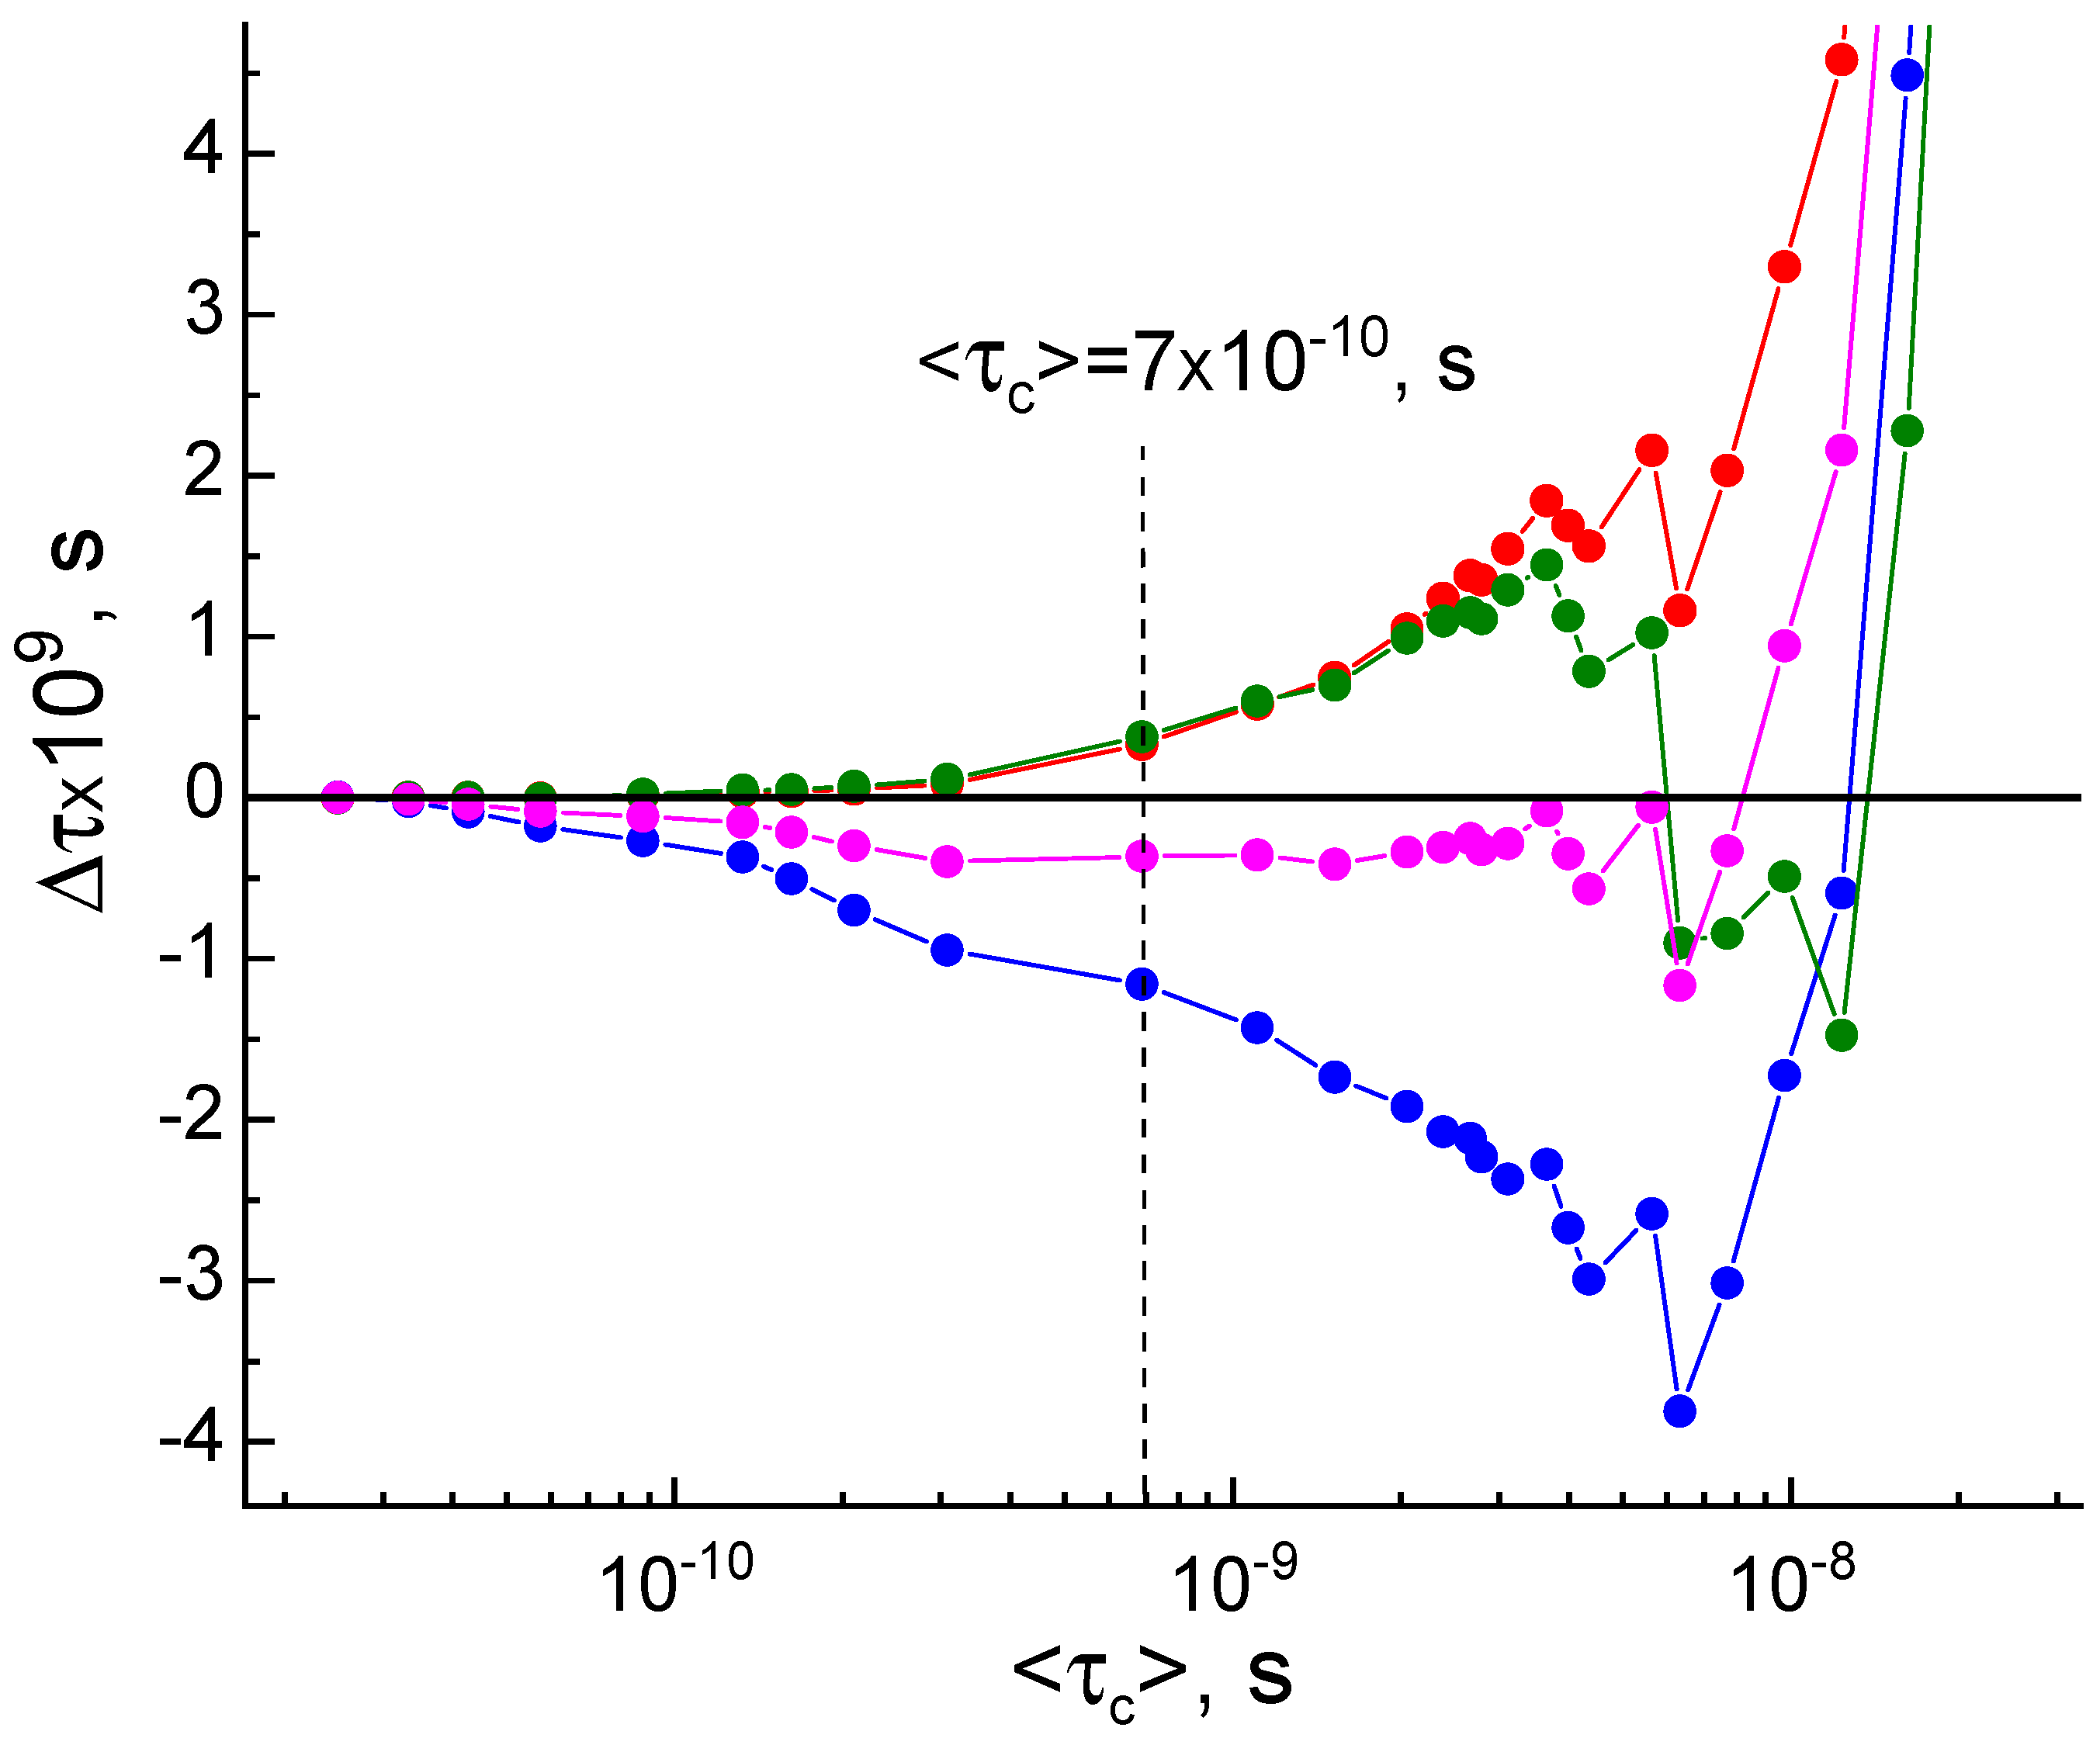
Figure 5 shows differences between the <τc> values determined via spectra simulation and τc*(1), τc*(2), τc*(3), and τc*(4) calculated by the formulas. One can see that Formulas (1) and (3) return values the closest to <τc> at τc < 7·10−10 s, while Formula (4) gives the best approximation at longer τc, up to 5·10−9 s. One can see that the shapes of EPR spectra within the range of 7·10−10 < τc < 5·10−9 are far from the fast-motional spectra, nevertheless, Formula (4) allows obtaining reasonable rotational correlation times. Formula (2) was shown to give results that significantly decline from <τc> in almost all mobility ranges; therefore, this formula is not suitable for analysis of EPR spectra of radicals with strongly anisotropic rotation in polymer matrices. It should be remembered that all the approximated formulas were proposed for the analysis of EPR spectra of isotropically rotating radicals (see Section 1).
The results obtained showed that, in the majority of cases, when a researcher is not interested in the fine details of a polymer organization but is looking for a way to determine the change in the mobility of macromolecules under an impact on the system, the reliable data can be obtained using the spin probe method without simulation of EPR spectra, which is complicated, time-consuming, and requires special qualification of the researcher. It should be underlined that, in the present work, we investigated the behavior of the spin probe, which did not contain any functional groups except for the paramagnetic N-O fragment. The studied polymer also did not contain groups capable of complexation with the probe molecules. In cases of polymers and/or probes bearing functional groups, the possibility of using the approximated formulas should be tested additionally.

5. Conclusions

The applicability of different approximated formulas for characterization of the mobility of a spin probe in a polymer matrix was analyzed on the example of the TEMPO spin probe and isotactic polypropylene. The calculated values of the rotational correlation times were compared with those obtained by simulation of EPR spectra, taking into account the rotational anisotropy as well as the lognormal distribution of radicals by their rotational mobility. It was shown that in the case of strongly anisotropic rotation of the probe molecules in the polymer matrix, different formulas give different results. In general, the approximated method can be used for the analysis of EPR spectra up to rotational correlation times τc < 5 × 10⁻⁹ s.

Supplementary Materials

The following supporting information can be downloaded at https://www.mdpi.com/article/10.3390/solids5040033/s1, Figure S1: EPR spectra of TEMPO in PP (black lines) and the results of their simulation (red lines); Table S1: Rotational characteristics of TEMPO in PP.

Author Contributions

Conceptualization and methodology, N.A.C.; formal analysis, N.A.C.; investigation, T.S.Y.; resources, A.I.K.; writing—original draft preparation, N.A.C.; writing—review and editing, T.S.Y. and A.I.K. All authors have read and agreed to the published version of the manuscript.

Funding

This work was funded within the framework of the Program of Fundamental Research of the Russian Federation (reg. № 122040500068-0). The authors acknowledge M.V. Lomonosov Moscow State University Program of Development for the EMXplus-10/12 PX X-band EPR Bruker spectrometer.

Data Availability Statement

All published data are available upon request.

Acknowledgments

The authors acknowledge A.L. Iordansky for fruitful discussion.

Conflicts of Interest

The authors declare no conflicts of interest.

Appendix A

In the case of nitroxide probes in the fast motion regime, as described in the main text, the equations derived by Kivelson [6] can be combined to obtain the rotational correlation time (see Equations (2)–(5)).
The rotation correlation times
κ 1 = κ 3 = π 3 b 4 Δ γ B 0 15 1 g 0 μ B h κ 2 = π 3 b b 8 1 g 0 μ B h κ 4 = π 3 b b 8 4 Δ γ B 0 15 1 g 0 μ B h
where h is the Planck constant, μB is the Bohr magneton, and g0 is the isotropic g-factor:
g 0 = g x x + g y y + g z z 3 b = 4 π 3 A z z A x x + A y y 2 Δ γ = 2 π μ B h g z z g x x + g y y 2
The magnetic parameters of the spin probe in the polymer were found to be gxx = 2.0096, gyy = 2.0061, gzz = 2.0022, Axx = 18.8 mHz, Ayy = 20.5 mHz, Azz = 93.78 mHz and central field B0 = 0.3356 T. Thus, κ1 = κ3 = 5.54 × 10⁻¹⁰ G/s, κ2 = 6.34 × 10⁻¹⁰ G/s, κ4 = 5.17 × 10⁻¹⁰ G/s.

References

  1. Rånby, B.; Rabek, J.F. ESR Spectroscopy in Polymer Research; Springer: Berlin/Heidelberg, Germany, 1977; Volume 1, ISBN 9783642666025. [Google Scholar]
  2. Naveed, K.-R.; Wang, L.; Yu, H.; Ullah, R.S.; Haroon, M.; Fahad, S.; Li, J.; Elshaarani, T.; Khan, R.U.; Nazir, A. Recent Progress in the Electron Paramagnetic Resonance Study of Polymers. Polym. Chem. 2018, 9, 3306–3335. [Google Scholar] [CrossRef]
  3. Veksli, Z. ESR Spectroscopy for the Study of Polymer Heterogeneity. Prog. Polym. Sci. 2000, 25, 949–986. [Google Scholar] [CrossRef]
  4. Schlick, S. (Ed.) Advanced ESR Methods in Polymer Research; John Wiley & Sons, Inc.: Hobokken, NJ, USA, 2006; ISBN 0471731897. [Google Scholar]
  5. Švajdlenková, H.; Račko, D.; Bartoš, J. Spin Probe Reorientation and Its Connections with Free Volume and Relaxation Dynamics: Diglycidyl-Ether of Bis-Phenol A. J. Non. Cryst. Solids 2008, 354, 1855–1861. [Google Scholar] [CrossRef]
  6. Kivelson, D. Theory of ESR Linewidths of Free Radicals. J. Chem. Phys. 1960, 33, 1094–1106. [Google Scholar] [CrossRef]
  7. Schreier, S.; Polnaszek, C.F.; Smith, I.C.P. Spin Labels in Membranes Problems in Practice. Biochim. Biophys. Acta—Rev. Biomembr. 1978, 515, 395–436. [Google Scholar] [CrossRef]
  8. Santangelo, M.G.; Levantino, M.; Cupane, A.; Jeschke, G. Solvation of a Probe Molecule by Fluid Supercooled Water in a Hydrogel at 200 K. J. Phys. Chem. B 2008, 112, 15546–15553. [Google Scholar] [CrossRef] [PubMed]
  9. Stoll, S.; Schweiger, A. EasySpin, a Comprehensive Software Package for Spectral Simulation and Analysis in EPR. J. Magn. Reson. 2006, 178, 42–55. [Google Scholar] [CrossRef]
  10. Budil, D.E.; Lee, S.; Saxena, S.; Freed, J.H. Nonlinear-Least-Squares Analysis of Slow-Motion EPR Spectra in One and Two Dimensions Using a Modified Levenberg–Marquardt Algorithm. J. Magn. Reson. Ser. A 1996, 120, 155–189. [Google Scholar] [CrossRef]
  11. Faetti, M.; Giordano, M.; Leporini, D.; Pardi, L. Scaling Analysis and Distribution of the Rotational Correlation Times of a Tracer in Rubbery and Glassy Poly(Vinyl Acetate): An Electron Spin Resonance Investigation. Macromolecules 1999, 32, 1876–1882. [Google Scholar] [CrossRef]
  12. Bercu, V.; Martinelli, M.; Massa, C.A.; Pardi, L.A.; Leporini, D. Signatures of the Fast Dynamics in Glassy Polystyrene: First Evidence by High-Field Electron Paramagnetic Resonance of Molecular Guests. J. Chem. Phys. 2005, 123, 174906. [Google Scholar] [CrossRef]
  13. Chernova, D.A.; Vorobiev, A.K. Molecular Mobility of Nitroxide Spin Probes in Glassy Polymers: Models of the Complex Motion of Spin Probes. J. Appl. Polym. Sci. 2011, 121, 102–110. [Google Scholar] [CrossRef]
  14. Dubinskii, A.A.; Maresch, G.G.; Spiess, H.-W. Two-Dimensional Electron Paramagnetic Resonance Spectroscopy of Nitroxides: Elucidation of Restricted Molecular Motions in Glassy Solids. J. Chem. Phys. 1994, 100, 2437–2448. [Google Scholar] [CrossRef]
  15. Saalmueller, J.W.; Long, H.W.; Volkmer, T.; Wiesner, U.; Maresch, G.G.; Spiess, H.W. Characterization of the Motion of Spin Probes and Spin Labels in Amorphous Polymers with Two-Dimensional Field-Step ELDOR. J. Polym. Sci. Part B Polym. Phys. 1996, 34, 1093–1104. [Google Scholar] [CrossRef]
  16. Karpova, S.G.; Chumakova, N.A.; Lobanov, A.V.; Olkhov, A.A.; Vetcher, A.A.; Iordanskii, A.L. Evaluation and Characterization of Ultrathin Poly(3-Hydroxybutyrate) Fibers Loaded with Tetraphenylporphyrin and Its Complexes with Fe(III) and Sn(IV). Polymers 2022, 14, 610. [Google Scholar] [CrossRef] [PubMed]
  17. Yankova, T.S.; Chumakova, N.A.; Nedorezova, P.M.; Palaznik, O.M.; Kokorin, A.I. Behavior of Spin Probe TEMPO in Composites Based on Polypropylene with Different Content of Single-Wall Carbon Nanotubes. Polym. Sci. Ser. A 2024, 66, 121–128. [Google Scholar] [CrossRef]
  18. Neese, F. The ORCA Program System. WIREs Comput. Mol. Sci. 2012, 2, 73–78. [Google Scholar] [CrossRef]
  19. Kokorin, A. (Ed.) Nitroxides—Theory, Experiment and Applications; InTech: Vienna, Austria, 2012; ISBN 978-953-51-0722-4. [Google Scholar]
  20. Vorobiev, A.K.; Bogdanov, A.V.; Yankova, T.S.; Chumakova, N.A. Spin Probe Determination of Molecular Orientation Distribution and Rotational Mobility in Liquid Crystals: Model-Free Approach. J. Phys. Chem. B 2019, 123, 5875–5891. [Google Scholar] [CrossRef]
  21. Chernova, D.A.; Vorobiev, A.K. Molecular Mobility of Nitroxide Spin Probes in Glassy Polymers. Quasi-libration Model. J. Polym. Sci. Part B Polym. Phys. 2009, 47, 107–120. [Google Scholar] [CrossRef]
  22. Vorobiev, A.K.; Gurman, V.S.; Klimenko, T.A. Rotational Mobility of Guest Molecules Studied by Method of Oriented Spin Probe. Phys. Chem. Chem. Phys. 2000, 2, 379–385. [Google Scholar] [CrossRef]
  23. Švajdlenková, H.; Šauša, O.; Adichtchev, S.V.; Surovtsev, N.V.; Novikov, V.N.; Bartoš, J. On the Mutual Relationships between Molecular Probe Mobility and Free Volume and Polymer Dynamics in Organic Glass Formers: Cis-1,4-Poly(Isoprene). Polymers 2021, 13, 294. [Google Scholar] [CrossRef]
  24. Vasserman, A.M.; Barashkova, I.I.; Yasina, L.L.; Pupov, V.S. Rotary and Progressive Diffusion of the Nitroxyl Radical in Amorphous Polymers. Polym. Sci. U.S.S.R. 1977, 19, 2389–2398. [Google Scholar] [CrossRef]
Figure 1. Structure (a) and optimized geometry (b) of TEMPO spin probe.
Solids 05 00033 g001
Figure 2. EPR spectrum of TEMPO in PP recorded at 100 K (black line) and the result of its simulation (red line).
Solids 05 00033 g002
Figure 3. EPR spectra of TEMPO in PP (black lines) and the results of their simulation (red lines).
Solids 05 00033 g003
Figure 4. Temperature dependences of averaged rotational correlation time <τc> = (τx + τy + τz)/3 obtained by EPR spectra simulation (black asterisks) and rotational correlation times τc(1) (red circles), τc(2) (blue circles), τc(3) (green circles), and τc(4) (magenta circles) calculated by Formulas (1)–(4), correspondently.
Solids 05 00033 g004
Figure 5. Differences between values of <τc> calculated via spectral simulation and τc*(1) (red circles), τc*(2) (blue circles), τc*(3) (green circles), and τc*(4) (magenta circles) via <τc>.
Solids 05 00033 g005
Table 1. Rotational characteristics of TEMPO in PP.
T,Kτx
(s)
τy
(s)
τz
(s)
c>
(s)
<σ> Librτc*(1)
(s)
τc*(2)
(s)
τc*(3)
(s)
τc*(4)
(s)
4352.5 × 10−112.5 × 10−110.70 #2.58 × 10−112.20 × 10−112.55 × 10−112.41 × 10⁻¹¹
4253.3 × 10−113.3 × 10−110.70 #3.24 × 10−115.72 × 10−113.32 × 10−114.40 × 10⁻¹¹
4154.25 × 10−91.53 × 10−112.09 × 10−104.26 × 10−110.70 #4.29 × 10−111.31 × 10−104.21 × 10−118.41 × 10⁻¹¹
4057.15 × 10−82.02 × 10−113.58 × 10−105.74 × 10−110.70 #6.31 × 10−112.34 × 10−106.10 × 10−111.43 × 10⁻¹⁰
3951.67 × 10−73.09 × 10−115.31 × 10−108.76 × 10−110.70 #7.05 × 10−113.54 × 10−106.72 × 10−112.03 × 10⁻¹⁰
3851.7 × 10−7 #4.68 × 10−117.72 × 10−101.32 × 10−100.70 #9.43 × 10−115.00 × 10−108.45 × 10−112.84 × 10⁻¹⁰
3751.7 × 10−7 #5.65 × 10−111.24 × 10−91.62 × 10−100.70 #1.23 × 10−106.66 × 10−101.13 × 10−103.77 × 10⁻¹⁰
3651.7 × 10−7 #7.31 × 10−111.59 × 10−92.10 × 10−100.70 #1.56 × 10−109.10 × 10−101.37 × 10−105.08 × 10⁻¹⁰
3551.7 × 10−7 #1.08 × 10−102.03 × 10−93.08 × 10−100.70 #2.24 × 10−101.25 × 10−91.92 × 10−107.05 × 10⁻¹⁰
3451.7 × 10−7 #2.43 × 10−104.31 × 10−96.88 × 10−100.70 #27°3.58 × 10⁻¹⁰ 1.84 × 10−93.09 × 10−101.05 × 10⁻⁹
3351.7 × 10−7 #3.92 × 10−106.41 × 10−91.11 × 10−90.70 #28°5.23 × 10−102.53 × 10−105.05 × 10−101.46 × 10⁻¹⁰
3251.7 × 10−7 #5.46 × 10−107.47 × 10−91.52 × 10−90.70 #25°7.76 × 10−103.26 × 10−108.25 × 10−101.94 × 10⁻¹⁰
3151.7 × 10−7 #5.44 × 10−109.06 × 10−92.05 × 10−90.70 #25°1.01 × 10−93.97 × 10−91.06 × 10−92.39 × 10−9
3051.7 × 10−7 #8.68 × 10−109.86 × 10−92.38 × 10−90.70 #21°1.14 × 10−94.45 × 10−91.28 × 10−92.69 × 10−9
2951.7 × 10−7 #9.80 × 10−109.98 × 10−92.66 × 10−90.70 #19°1.29 × 10−94.78 × 10−91.52 × 10−92.92 × 10−9
2851.7 × 10−7 #1.03 × 10−91.03 × 10−82.79 × 10−90.70 #20°1.44 × 10−95.02 × 10−91.68 × 10−93.11 × 10−9
2751.7 × 10−7 #1.16 × 10−91.05 × 10−83.11 × 10−90.70 #17°1.56 × 10−95.47 × 10−91.82 × 10−93.39 × 10−9
2651.7 × 10−7 #1.39 × 10−91.05 × 10−83.65 × 10−90.70 #15°1.81 × 10−95.92 × 10−92.21 × 10−93.73 × 10−9
2551.7 × 10−7 #1.54 × 10−91.02 × 10−83.99 × 10−90.70 #10°2.30 × 10−96.66 × 10−92.86 × 10−94.34 × 10−9
2451.7 × 10−7 #1.69 × 10−91.09 × 10−84.35 × 10−90.70 #<1°2.78 × 10−97.34 × 10−93.56 × 10−94.91 × 10−9
2351.7 × 10−7 #2.44 × 10−98.55 × 10−95.63 × 10−90.893.48 × 10−98.22 × 10−94.61 × 10−95.70 × 10⁻⁹
2251.7 × 10−7 #2.91 × 10−98.05 × 10−96.33 × 10−90.865.17 × 10−91.01 × 10−87.24 × 10−97.50 × 10⁻⁹
2151.7 × 10−7 #3.59 × 10−99.47 × 10−97.69 × 10−90.885.66 × 10−91.07 × 10−88.54 × 10−88.02 × 10⁻⁹
2071.7 × 10−7 #4.79 × 10−91.08 × 10−89.75 × 10−90.916.45 × 10−91.14 × 10−81.02 × 10−88.80 × 10⁻⁹
1981.7 × 10−7 #6.24 × 10−91.30 × 10−81.23 × 10−80.947.76 × 10−91.29 × 10−81.38 × 10−81.02 × 10⁻⁸
1881.7 × 10−7 #8.77 × 10−91.53 × 10−81.62 × 10−80.936.94 × 10−91.16 × 10−81.39 × 10−89.17 × 10⁻⁹
1791.7 × 10−7 #1.20 × 10−81.67 × 10−82.01 × 10−80.926.13 × 10−91.06 × 10−81.19 × 10−88.23 × 10⁻⁹
1701.7 × 10−7 #1.71 × 10−81.77 × 10−82.48 × 10−80.906.52 × 10−91.09 × 10−81.28 × 10−88.59 × 10⁻⁹
τx, τy, and τz are rotational correlation times corresponding to molecular axes of TEMPO X, Y, and Z (see Figure 1b); <τc> is averaged rotational correlation time <τc> = (τx + τy + τz)/3; τc*(1), τc*(2), τc*(3), and τc*(4) are rotational correlation times calculated by empirical Formulas (1)–(4); <σ> is width of the lognormal distribution of the rotational diffusion coefficient; Libr is the amplitude of quasi-librations [21]. Parameters that were not being varied during the simulation are marked with sharps. The average uncertainties of <σ> and Libr are ±0.05 and ±3°, correspondently. The uncertainties of τx, τy, and τz depend on their values; in the middle of the observed interval, they come to (1–5)·10−10 (s).
Disclaimer/Publisher’s Note: The statements, opinions and data contained in all publications are solely those of the individual author(s) and contributor(s) and not of MDPI and/or the editor(s). MDPI and/or the editor(s) disclaim responsibility for any injury to people or property resulting from any ideas, methods, instructions or products referred to in the content.