

Taguchi Robust Design of Phase Transfer Catalytic Hydrolysis of Polyethylene Terephthalate (PET) Waste in Mild Conditions: Application for the Preparation of Metal–Organic Frameworks


 and
and 
Abstract
1. Introduction
2. Materials and Methods
2.1. Materials
2.2. Taguchi Optimization of Depolymerisation of PET Waste
2.2.1. Taguchi Methodology
2.2.2. Taguchi Optimization of PET Depolymerization by Catalytic Hydrolysis
2.3. Synthesis of MOF-235 by the Hydrothermal Route Using Recovered TPA
2.4. MOF-235 Characterizations
3. Results and Discussion
3.1. Catalytic Depolymerization Mechanism
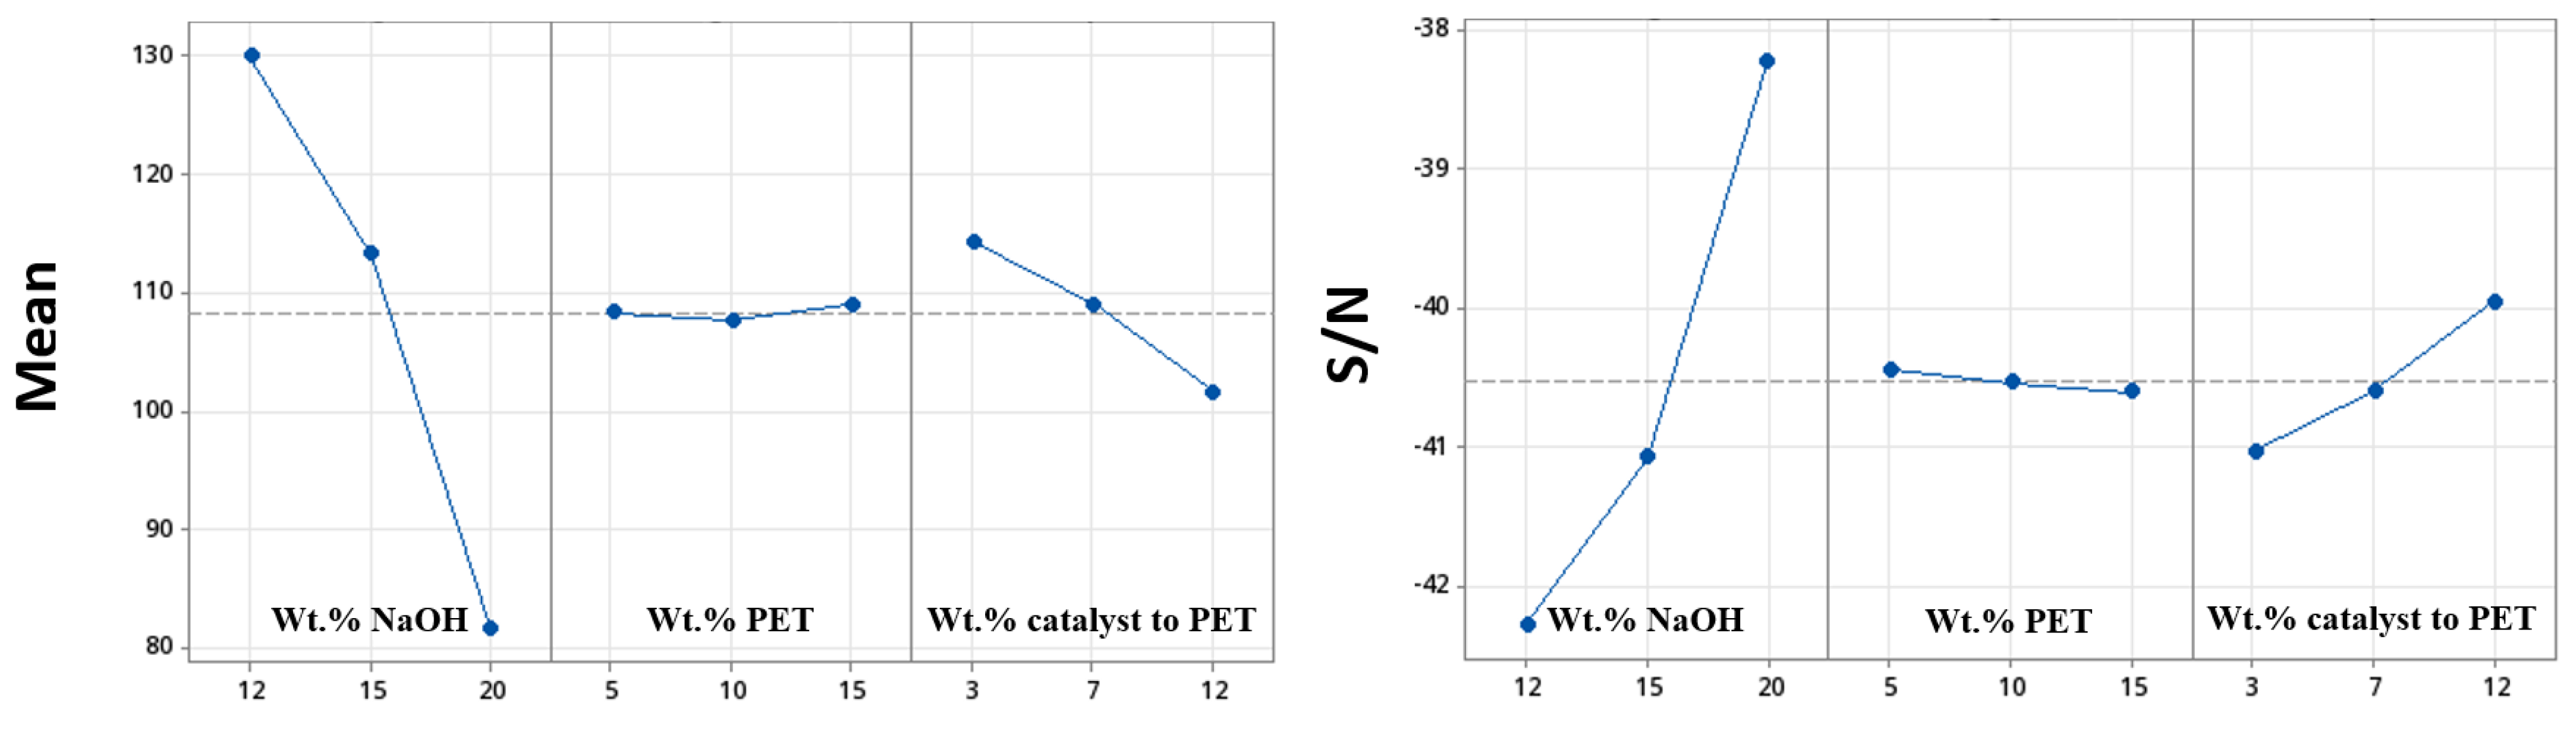
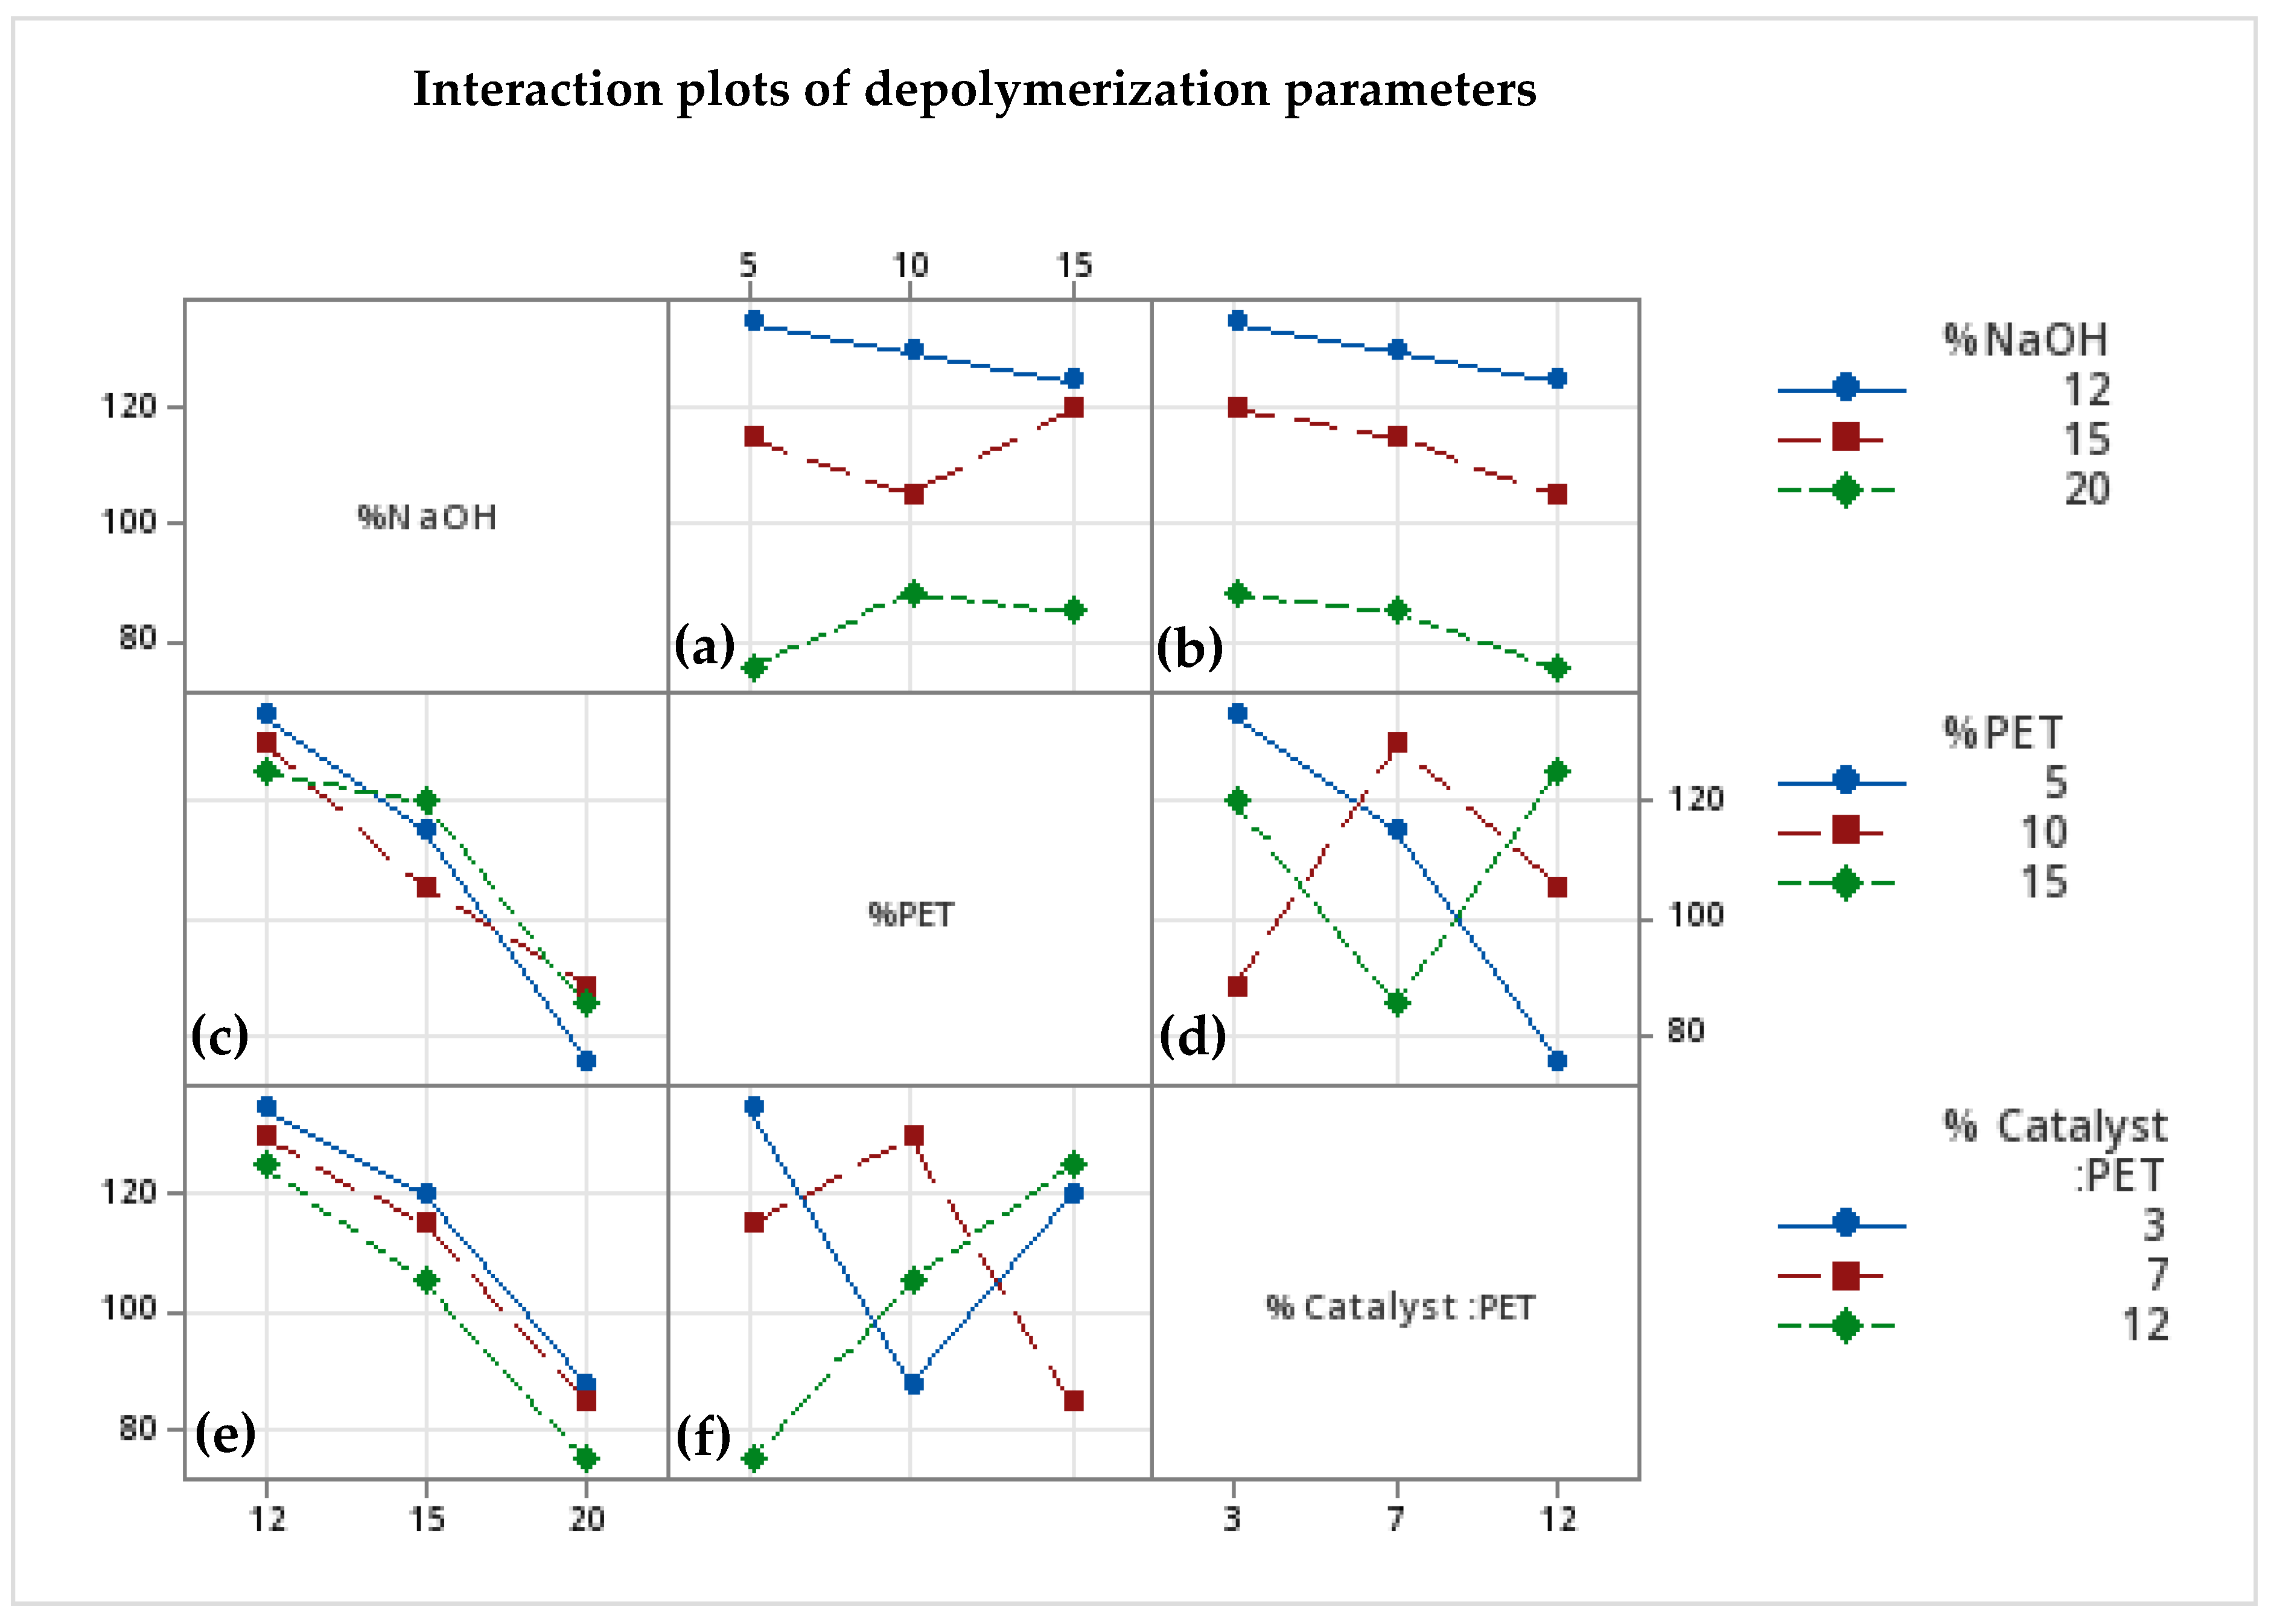
3.2. Taguchi Optimization Regression and ANOVA Study
3.3. Characterization of the Recuperated TPA
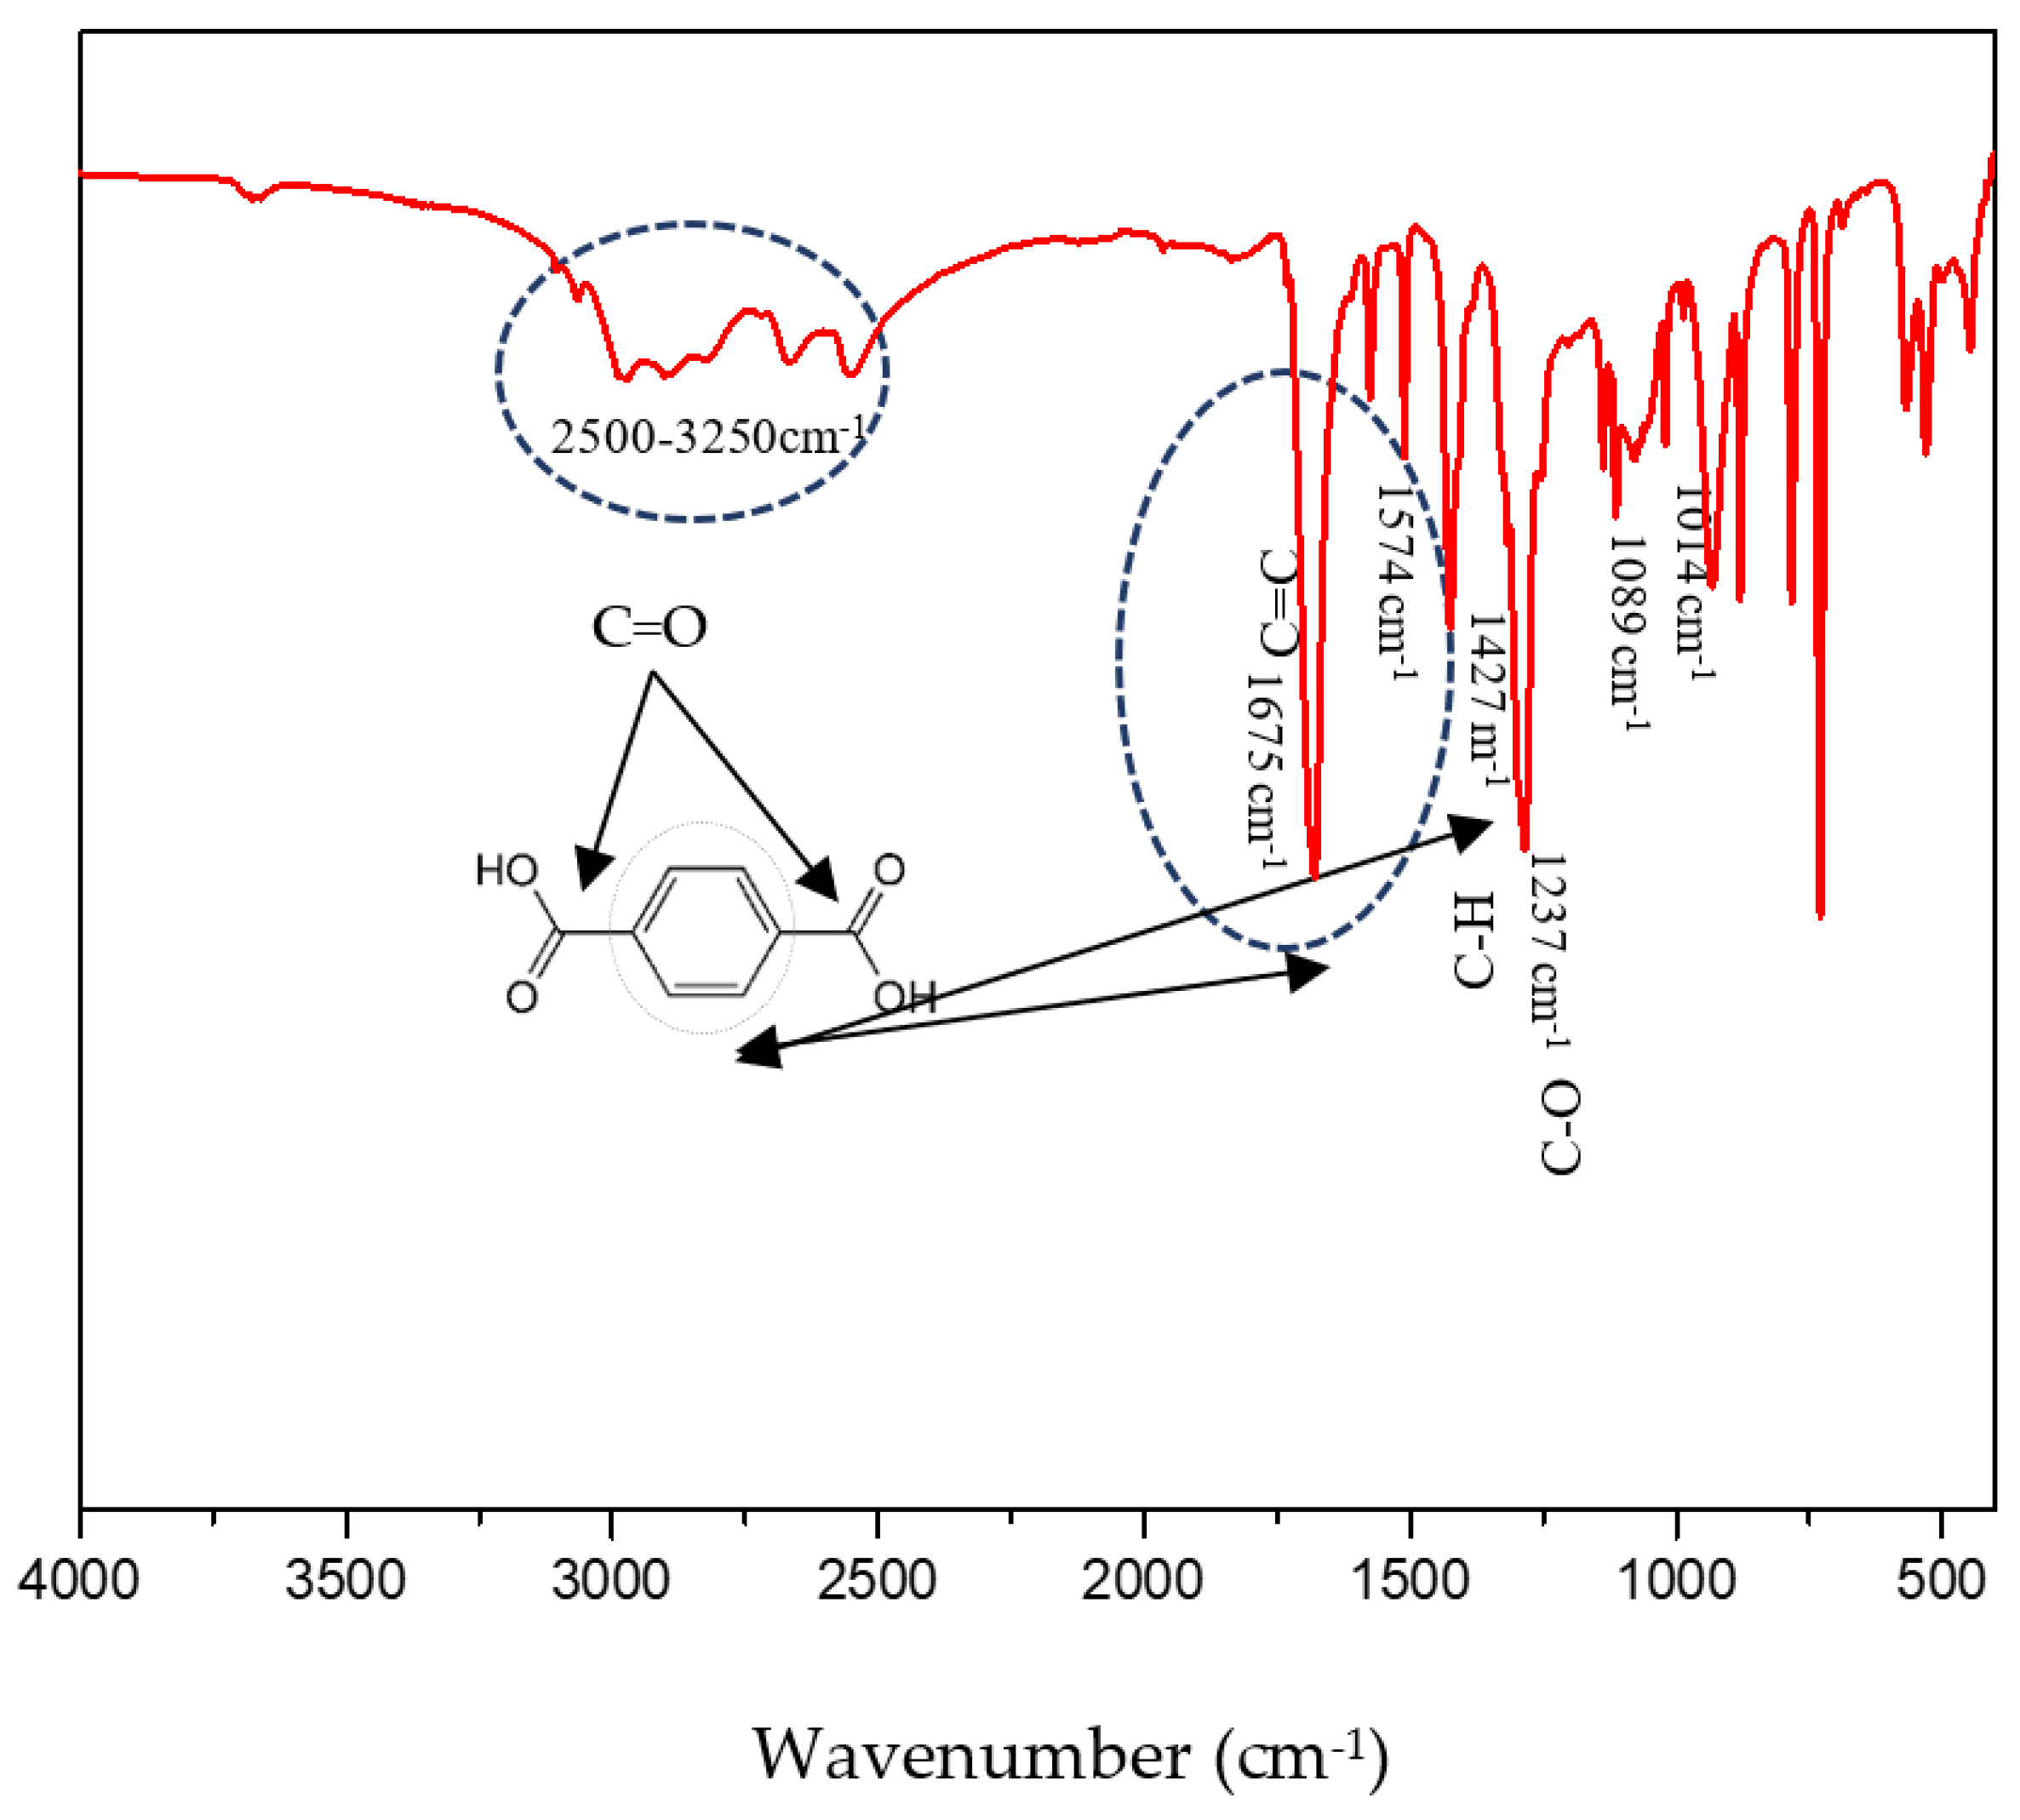
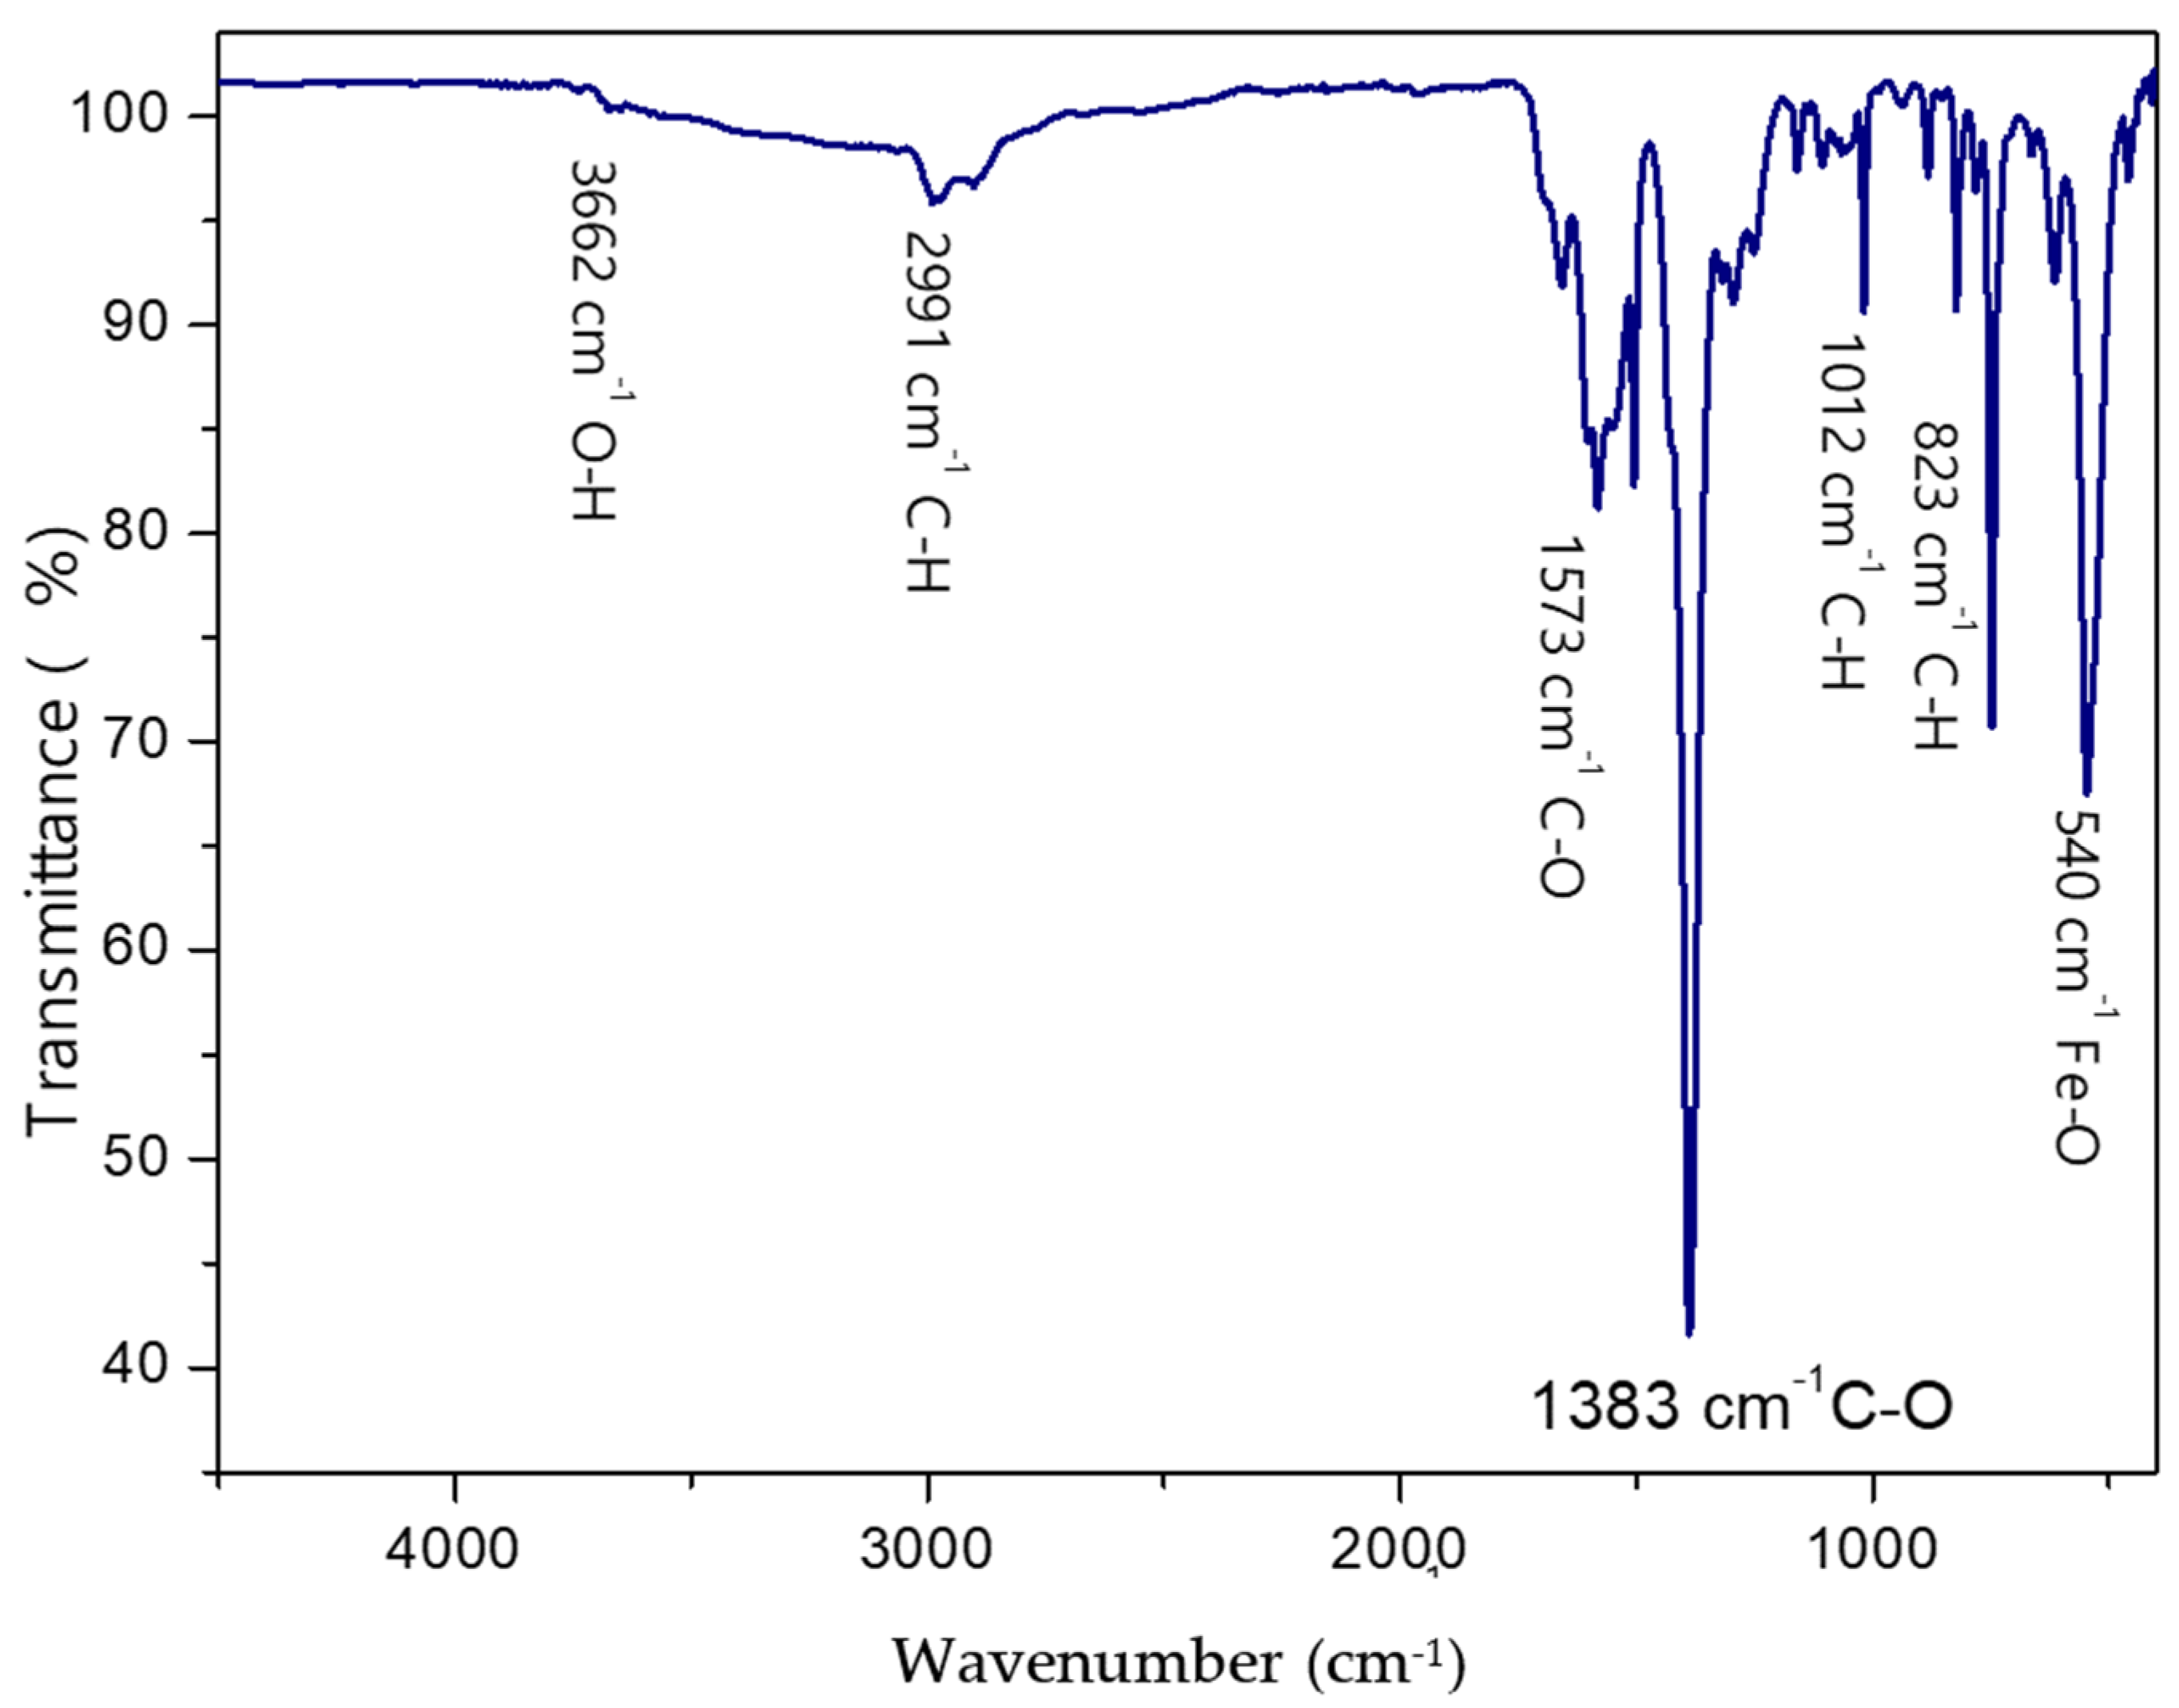
3.3.1. FT-IR Analysis
3.3.2. X-Ray Diffraction
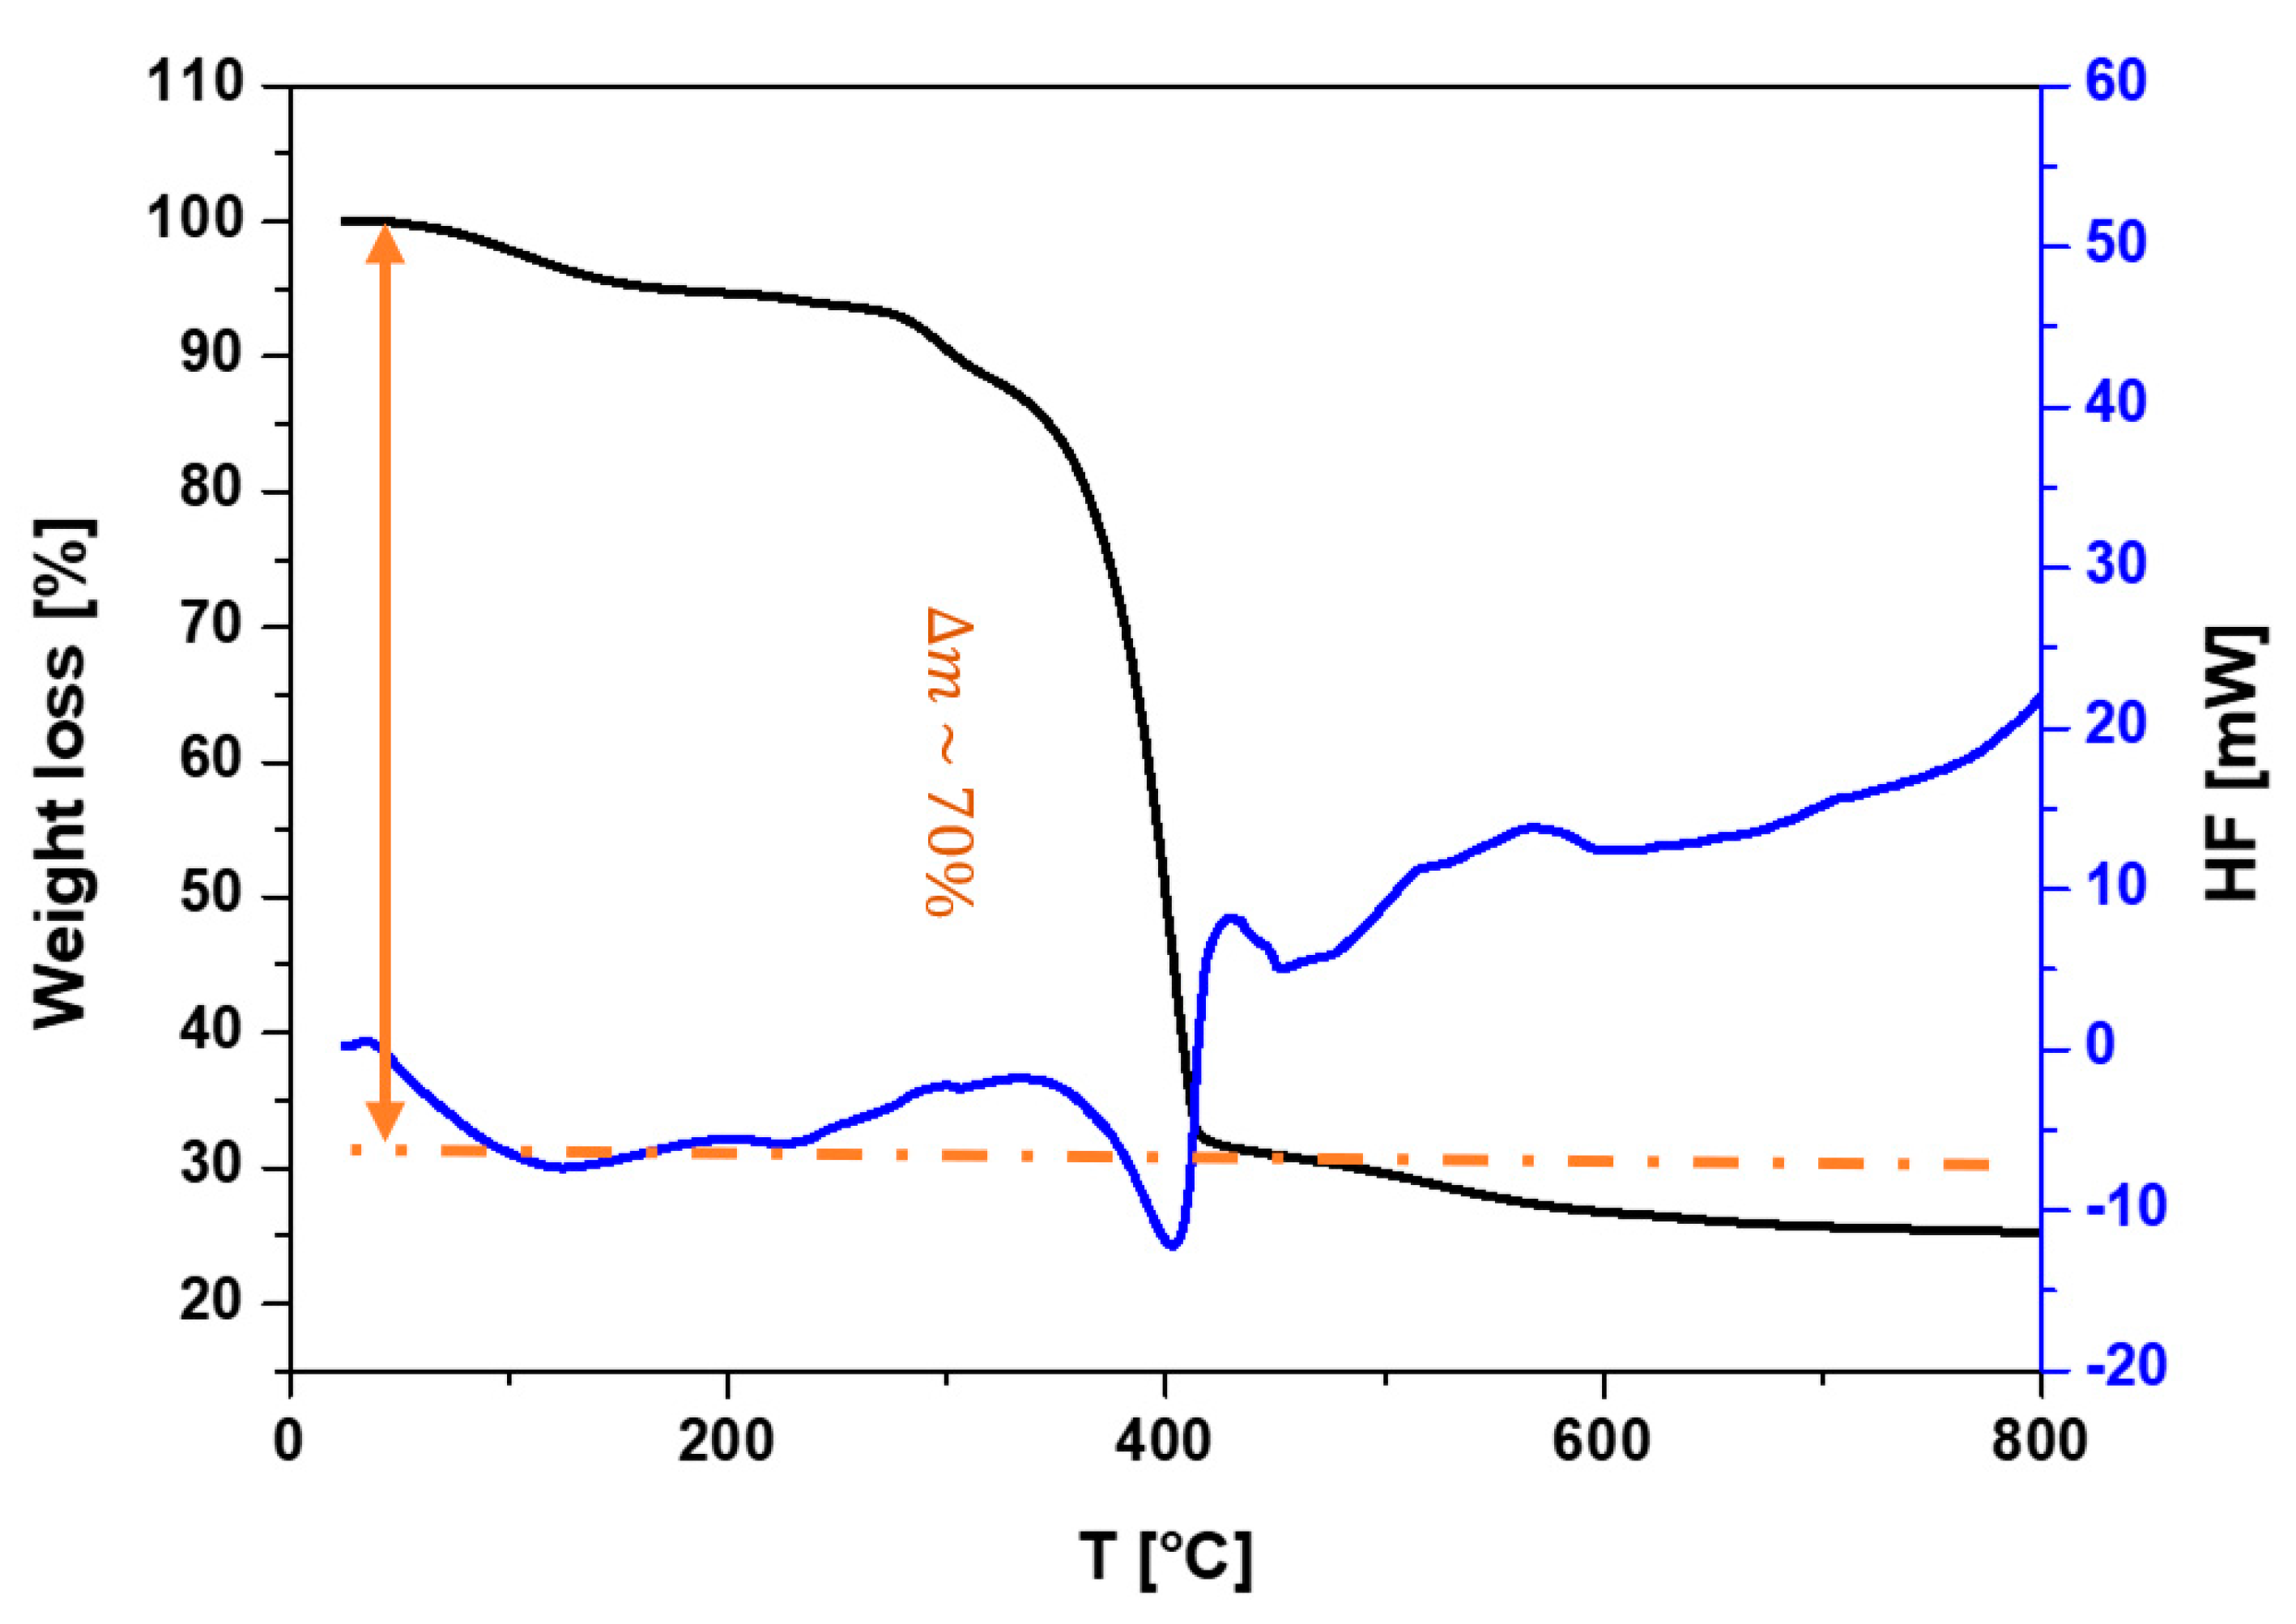
3.3.3. Thermal Characteristics of TPA
3.4. Application of the Recuperated TPA Used as Ligand to Prepare MOF-235
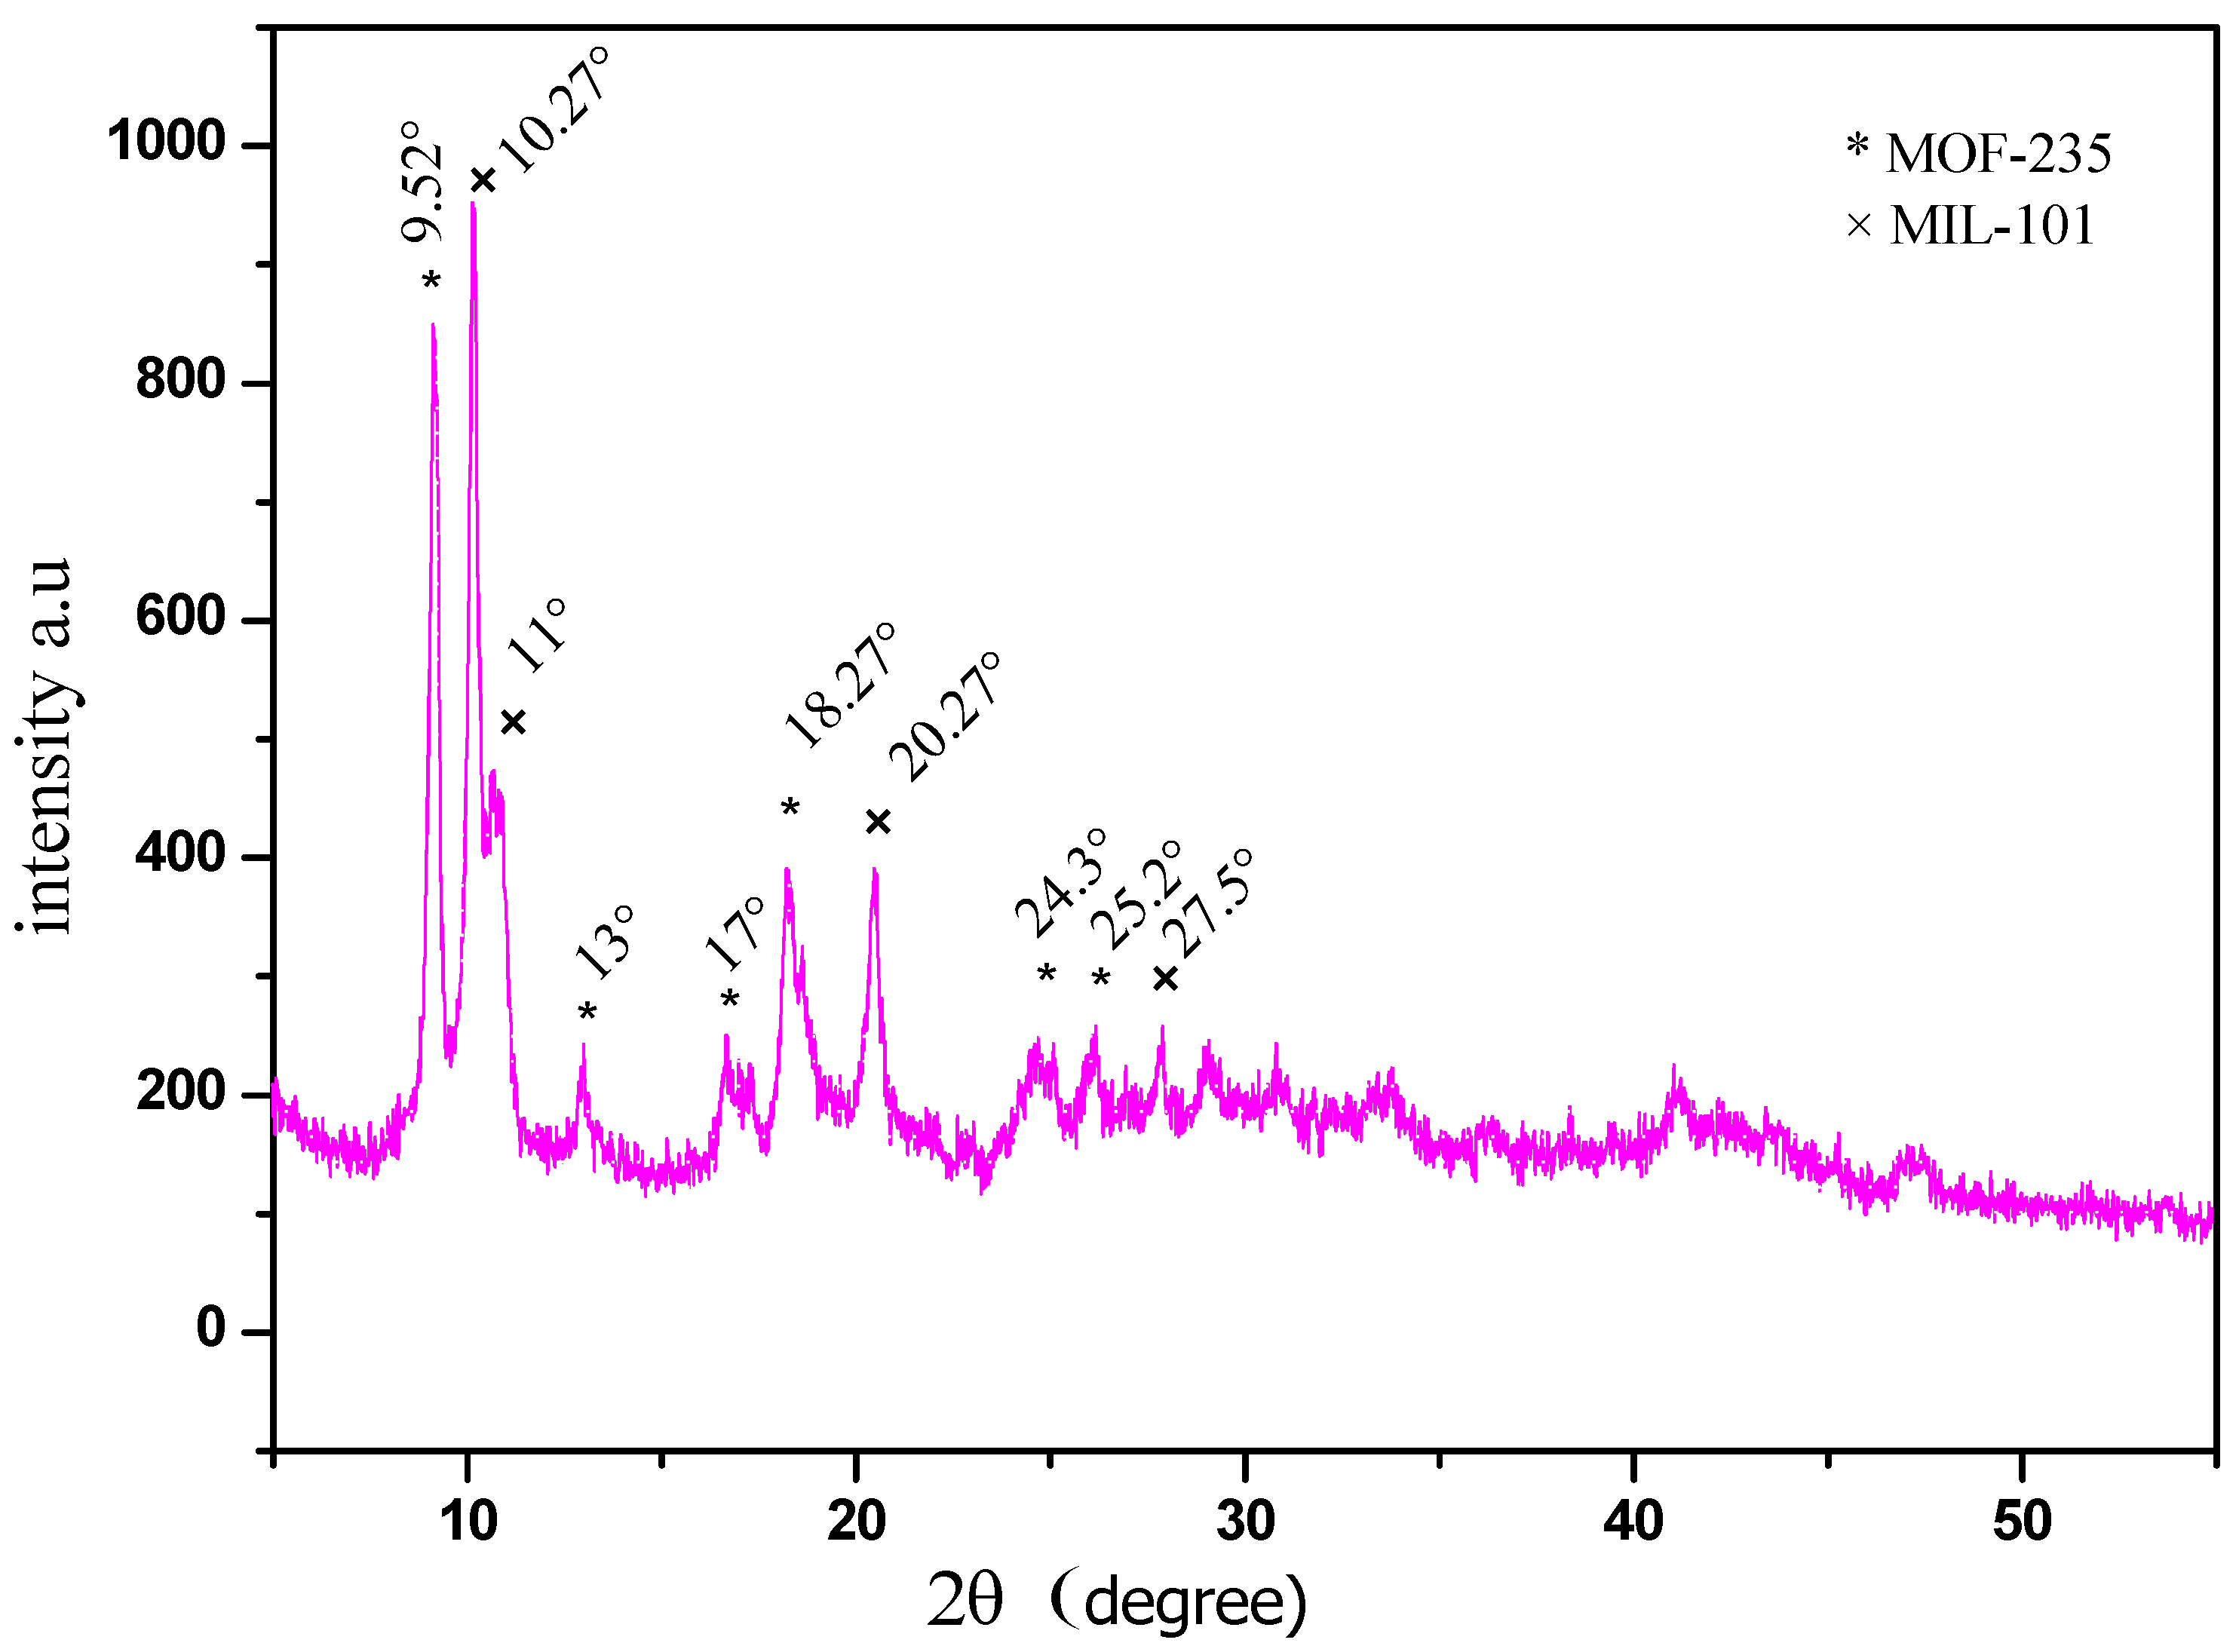
3.4.1. X-Ray Diffraction
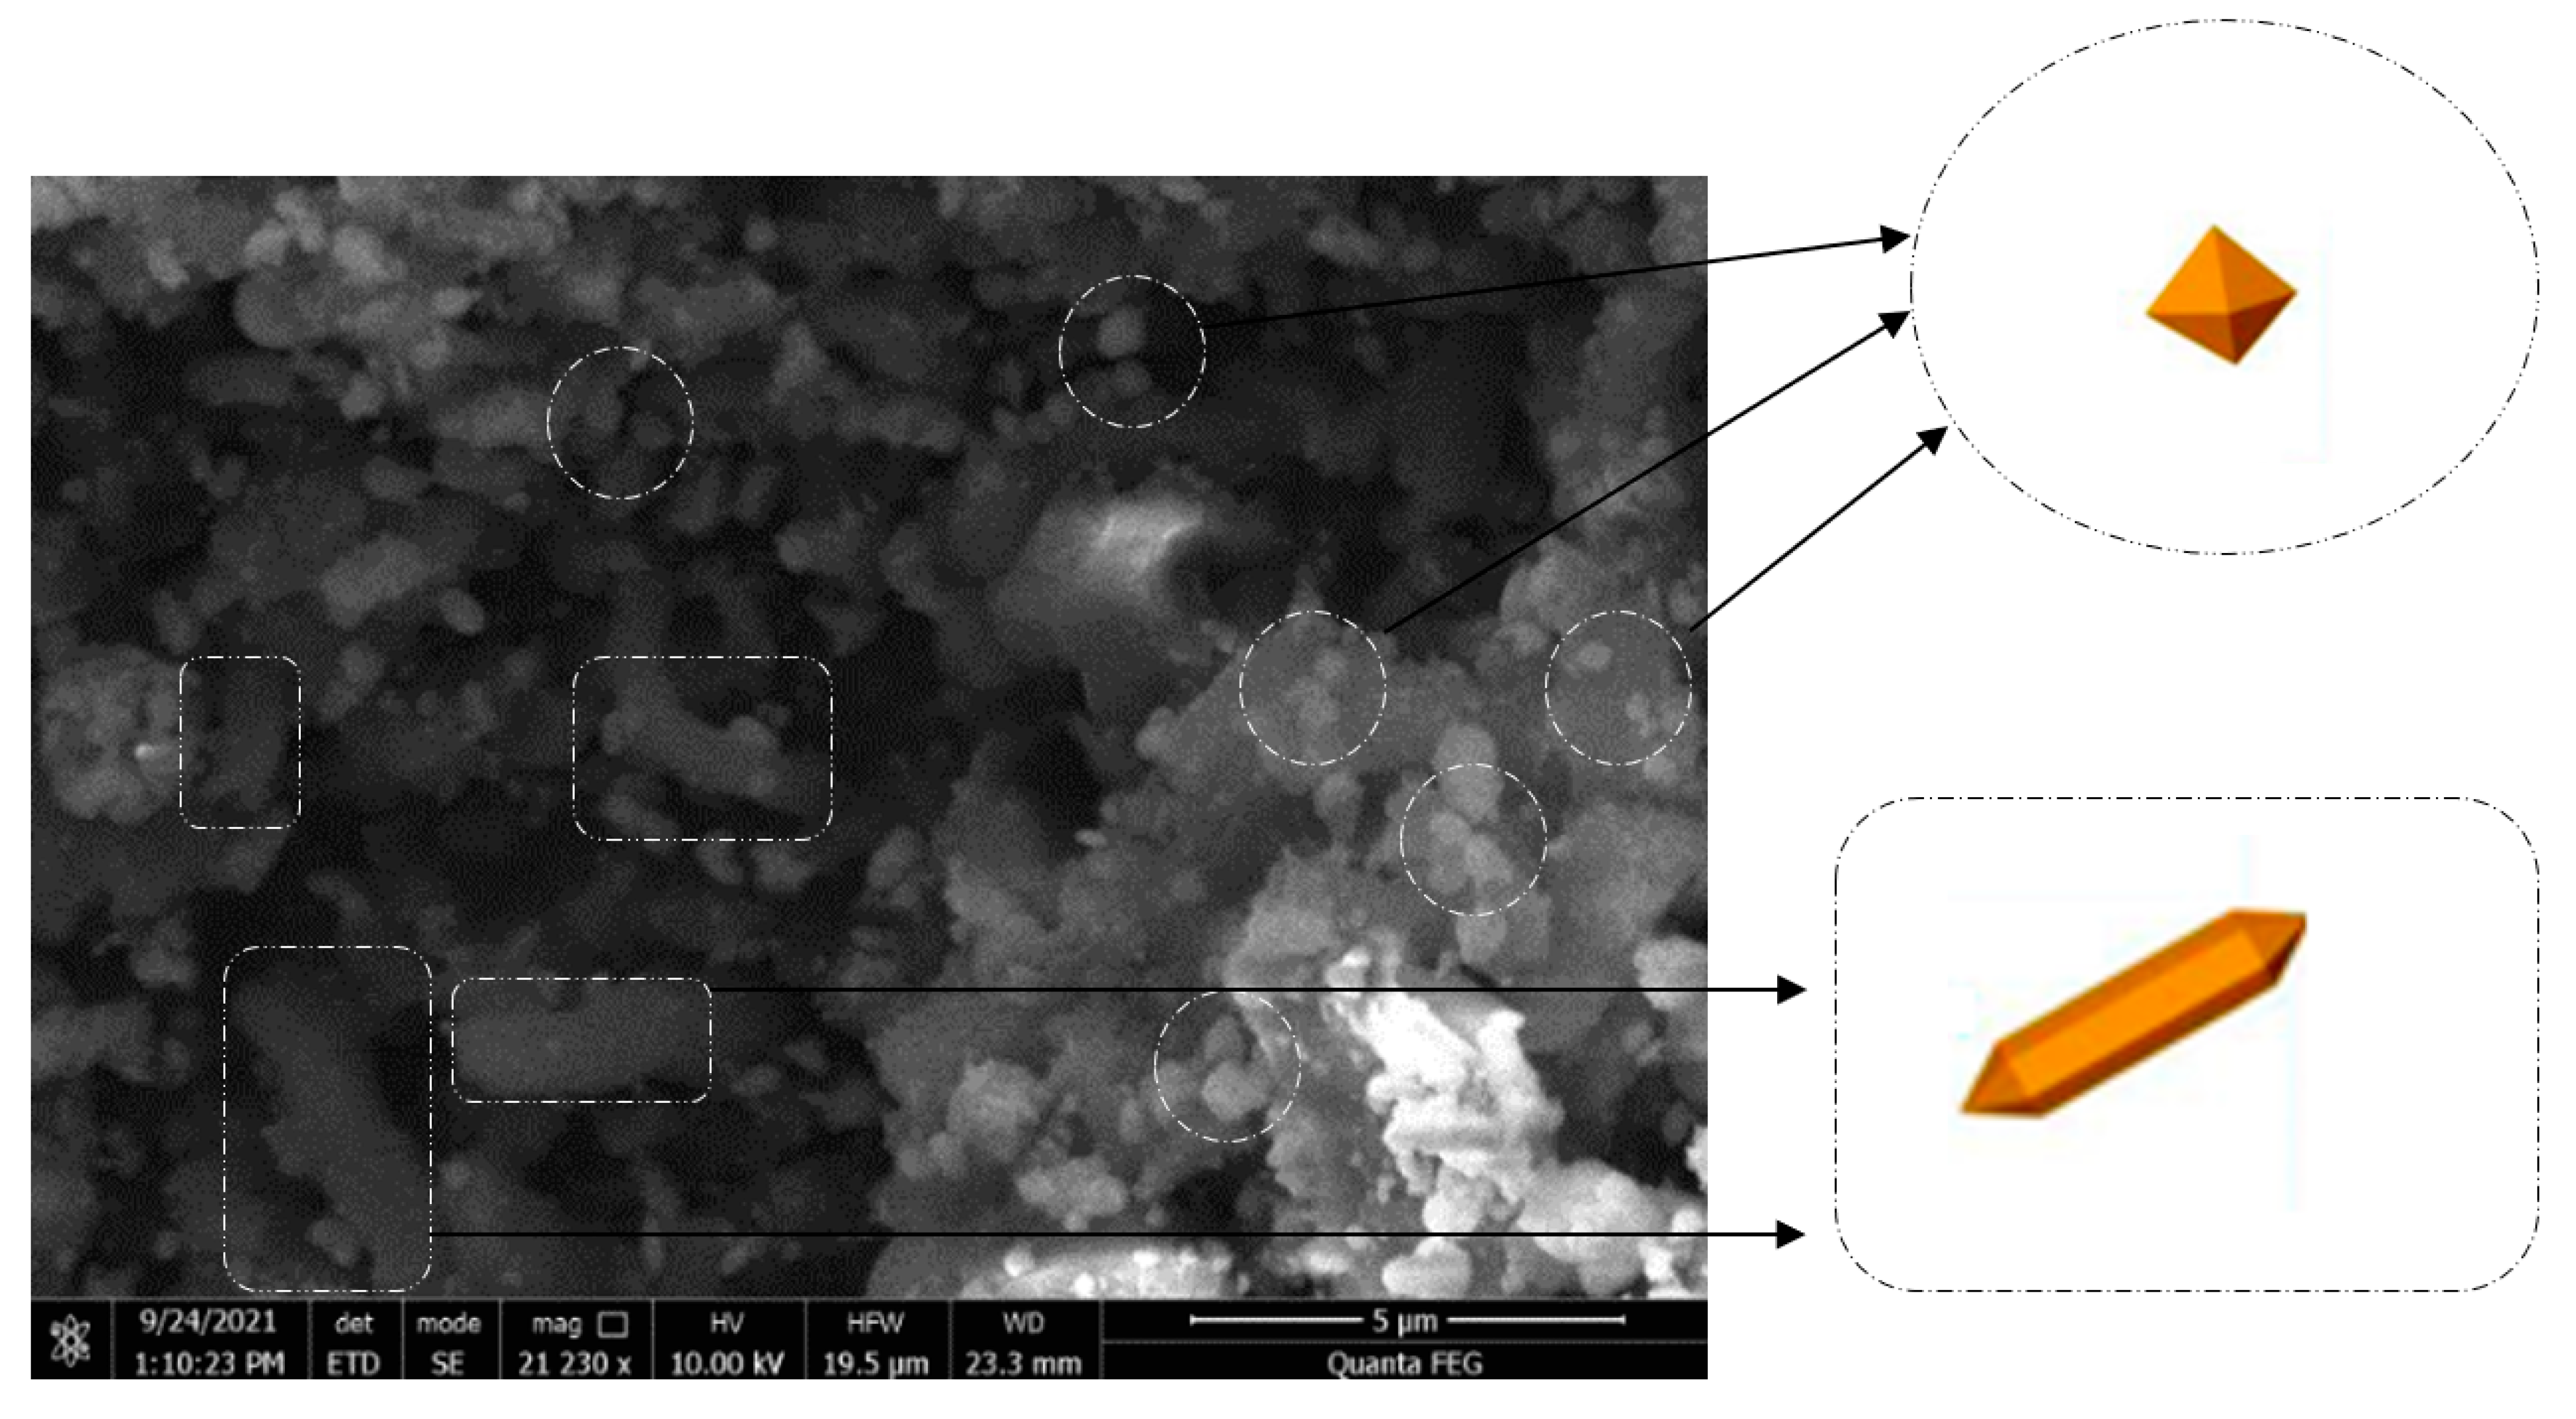
3.4.2. SEM Morphology
4. Conclusions
Supplementary Materials
Author Contributions
Funding
Data Availability Statement
Acknowledgments
Conflicts of Interest
References
- Worm, B.; Lotze, H.K.; Jubinville, I.; Wilcox, C.; Jambeck, J. Plastic as a persistent marine pollutant. Annu. Rev. Environ. Resour. 2017, 42, 1–26. [Google Scholar] [CrossRef]
- Nouira, A.; Bekri-Abbes, I.; Srasra, E.; Cansado, I.; Mourão, P. Valorisation of plastic waste from the beverage industry through its transformation into adsorbent and solid fuel materials. Comptes Rendus. Chim. 2022, 26, 77–93. [Google Scholar] [CrossRef]
- Allaf, A.W.; Al Lafi, A.G.; Alzier, A.; Ajaya, R.; Mougrabiya, M.A.; Ali, A.A.; Adriby, S. A study on microwave-assisted chemical recycling of polyethylene terephthalate (PET) waste. J. Polym. Res. 2024, 31, 41. [Google Scholar] [CrossRef]
- Lechuga-Islas, V.D.; Sánchez-Cerrillo, D.M.; Stumpf, M.; Guerrero-Santos, S.R.; Schubert, U.S.; Guerrero-Sánchez, C. Thermo-responsive polymer catalysts for polyester recycling processes: Switching from homogeneous catalysis to heterogeneous separations. Polym. Chem. 2023, 14, 1893–1904. [Google Scholar] [CrossRef]
- Abedsoltan, H. A focused review on recycling and hydrolysis techniques of polyethylene terephthalate. Polym. Eng. Sci. 2023, 63, 2651–2674. [Google Scholar] [CrossRef]
- Güçlü, G.; Yalçinyuva, T.; Özgümüs, S.; Orbay, M. Simultaneous glycolysis and hydrolysis of polyethylene terephthalate and characterization of products by differential scanning calorimetry. Polymer 2003, 44, 7609–7616. [Google Scholar] [CrossRef]
- Rosen, B.I. Preparation of Purified Terephthalic Acid from Waste Polyethylene Terephthalate. U.S. Patent 5,095,145, 10 March 1992. [Google Scholar]
- Aguado, J.; Serrano, D. Recycling of Plastic Wastes; University of York: York, UK, 1999. [Google Scholar]
- Nikolaevich, L.; Vladimirovna, I.; Zulfatovich, M. Method for Waste Pet Alkaline Hydrolysis with Terephthalic Acid Production. RU Patent RU2616299C1, 14 April 2017. [Google Scholar]
- Kosmidis, V.A.; Achilias, D.S.; Karayannidis, G.P. Poly (ethylene terephthalate) recycling and recovery of pure terephthalic acid. Kinetics of a phase transfer catalyzed alkaline hydrolysis. Macromol. Mater. Eng. 2001, 286, 640–647. [Google Scholar] [CrossRef]
- López-Fonseca, R.; González-Marcos, M.P.; González-Velasco, J.R.; Gutiérrez-Ortiz, J.I. Chemical recycling of PET by alkaline hydrolysis in the presence of quaternary phosphonium and ammonium salts as phase transfer catalysts. WIT Trans. Ecol. Environ. 2008, 109, 511–520. [Google Scholar] [CrossRef]
- Chen, J.; Ma, J.; Fan, Q.; Zhang, W.; Guo, R. A sustainable chrome-free tanning approach based on Zr-MOFs functionalized with different metals through post-synthetic modification. Chem. Eng. J. 2023, 474, 145453. [Google Scholar] [CrossRef]
- Chen, J.; Ma, J.; Fan, Q.; Zhang, W. An eco-friendly metal-less tanning process: Zr-based metal-organic frameworks as novel chrome-free tanning agent. J. Clean. Prod. 2023, 382, 135263. [Google Scholar] [CrossRef]
- Manousi, N.; Zachariadis, G.; Deliyanni, E.; Samanidou, V. Applications of metal-organic frameworks infood sample preparation. Molecules 2018, 23, 2896. [Google Scholar] [CrossRef] [PubMed]
- Giliopoulos, D.; Zamboulis, A.; Giannakoudakis, D.; Bikiaris, D.; Triantafyllidis, K. Polymer/Metal OrganicFramework (MOF) Nanocompositesfor biomedical applications. Molecules 2020, 25, 185. [Google Scholar] [CrossRef] [PubMed]
- Kampouraki, Z.; Giannakoudakis, D.; Nair, V.; Hosseini-Bandegharaei, A.; Colmenares, J.; Deliyanni, E. Metal organic frameworks as desulfurization adsorbents of dbt and 4,6-dmdbt from fuels. Molecules 2019, 24, 4525. [Google Scholar] [CrossRef]
- Boukayouht, K.; Bazzi, L.; Daouli, A.; Maurin, G.; Hankari, S.E. Ultrarapid and sustainable synthesis of trimetallic-based mof (crnife-mof) from stainless steel and disodium terephthalate-derived PET wastes. ACS Appl. Mater. Interfaces 2024, 16, 2497–2508. [Google Scholar] [CrossRef] [PubMed]
- Zhang, F.; Chen, S.; Nie, S.; Luo, J.; Lin, S.; Wang, Y.; Yang, H. Waste PET as a reactant for lanthanide MOF synthesis and application in sensing of picric acid. Polymers 2019, 11, 2015. [Google Scholar] [CrossRef]
- Sudik, A.C.; Côté, A.P.; Yaghi, O.M. Metal-organic frameworks based on trigonal prismatic building blocks and the new “acs” topology. Inorg. Chem. 2005, 44, 2998–3000. [Google Scholar] [CrossRef]
- Unal, R.; Dean, E.B. Taguchi approach to design optimization for quality and cost: An overview. In Proceedings of the 1991 Annual Conference of the International Society of Parametric Analysts, NASA Langley Research Center, Hampton, VA, USA, 1 January 1991. [Google Scholar]
- Barredo, A.; Asueta, A.; Amundarain, I.; Leivar, J.; Miguel-Fernández, R.; Arnaiz, S.; Epelde, E.; Lopez-Fonseca, R.; Gutierrez-Ortiz, I. Chemical recycling of monolayer PET tray waste by alkaline hydrolysis. J. Environ. Chem. Eng. 2023, 11, 109823. [Google Scholar] [CrossRef]
- Tseng, K.H.; Shiao, Y.F.; Chang, R.F.; Yeh, Y.T. Optimization of microwave-based heating of cellulosic biomass using Taguchi method. Materials 2013, 6, 3404–3419. [Google Scholar] [CrossRef]
- Ravichandran, S.A.; Rajan, V.P.; Aravind, P.V.; Seenivasan, A.; Prakash, D.G.; Ramakrishnan, K. Characterization of Terephthalic Acid Monomer Recycled from Post-Consumer PET Polymer Bottles. Macromol. Symp. 2016, 361, 30–33. [Google Scholar] [CrossRef]
- Chinglenthoiba, C.; Mahadevan, G.; Zuo, J.; Prathyumnan, T.; Valiyaveettil, S. Conversion of PET Bottle Waste into a Terephthalic Acid-Based Metal-Organic Framework for Removing Plastic Nanoparticles from Water. Nanomaterials 2024, 14, 257. [Google Scholar] [CrossRef]
- Kimyonok, A.B.E.; Ulutürk, M. Determination of the Thermal Decomposition Products of Terephthalic Acid by Using Curie-Point Pyrolyzer. J. Energetic Mater. 2016, 34, 113–122. [Google Scholar] [CrossRef]
- Salem, K.; Zarif, B.R.; Hosseini, F.; Karami, C. Iron terephthalate metal-organic framework (MOF-235) modified with zinc as an efficient adsorbent for removal of tetracycline from aqueous solution. Desalination Water Treat. 2024, 318, 100393. [Google Scholar] [CrossRef]
- Ge, J.; Wu, Z.; Huang, X.C.; Ding, M. An Effective Microwave-Assisted Synthesis of MOF235 with Excellent Adsorption of Acid Chrome Blue. J. Nanomater. 2019, 2019, 4035075. [Google Scholar] [CrossRef]
- Li, Y.; Hou, G.; Yang, J.; Xie, J.; Yuan, X.; Yang, H.; Wanga, M. Facile synthesis of MOF 235 and its superior photocatalytic capability under visible light irradiation. RSC Adv. 2016, 6, 16395–16403. [Google Scholar] [CrossRef]
- Huang, Y.; Lin, H.; Zhang, Y. Synthesis of MIL-101(Fe)/SiO2 composites with improved catalytic activity for reduction of nitroaromatic compounds. J. Solid State Chem. 2020, 283, 121150. [Google Scholar] [CrossRef]
- Simonsson, I.; Gärdhagen, P.; Andrén, M.; Tam, P.L.; Abbas, Z. Experimental investigations into the irregular synthesis of iron(III) terephthalate metal–organic frameworks MOF-235 and MIL-101. Dalton Trans. 2021, 50, 4976–4985. [Google Scholar] [CrossRef]
- Deng, Q.; Luo, Z.; Liu, H.; Zhou, Y.; Zhou, C.; Yang, R.; Wang, L.; Yan, Y.; Xu, Y. Facile synthesis of Fe-based metal-organic framework and graphene composite as an anode material for K-ion batteries. Ionics 2020, 26, 5565–5573. [Google Scholar] [CrossRef]
- Villarroel-Rocha, D.; García-Carvajal, C.; Amaya-Roncancio, S.; Villarroel-Rocha, J.; Torres-Ceron, D.A.; Restrepo-Parra, E.; Sapag, K. MIL-101(Fe)@ceramic-monolith for arsenic removal in aqueous solutions. Sci. Rep. 2024, 14, 29622. [Google Scholar] [CrossRef]


| Factors | Units | Levels | ||
|---|---|---|---|---|
| Level 1 | Level 2 | Level 3 | ||
| Concentration of NaOH | g/100 mL | 12 | 15 | 20 |
| Concentration of PET | g/100 mL | 5 | 10 | 15 |
| Wt.% of catalyst/ PET | % | 3 | 7 | 12 |
| Run | Concentration of NaOH | Concentration of PET | Wt% Catalyst to PET | Depolymerization Time (min) | S/N ratio |
|---|---|---|---|---|---|
| 1 | 12 | 5 | 3 | 135 | −42.61 |
| 2 | 12 | 10 | 7 | 130 | −42.29 |
| 3 | 12 | 15 | 12 | 125 | −41.94 |
| 4 | 15 | 5 | 7 | 115 | −41.21 |
| 5 | 15 | 10 | 12 | 105 | −40.42 |
| 6 | 15 | 15 | 3 | 120 | −41.58 |
| 7 | 20 | 5 | 12 | 75 | −37.50 |
| 8 | 20 | 10 | 3 | 88 | −38.89 |
| 9 | 20 | 15 | 7 | 82 | −38.28 |
| S/N | |||
|---|---|---|---|
| Level | Concentration of NaOH (g/100 mL) | Concentration of PET (g/100 mL) | Wt.% Catalyst to PET |
| 1 | −42.27 | −40.44 | −41.03 |
| 2 | −41.07 | −40.53 | −40.59 |
| 3 | −38.0 | −40.60 | −39.95 |
| Delta | 4.27 | 0.16 | 1.08 |
| Rank | 1 | 3 | 2 |
| Optimum | Level 3 | Level 2 | Level 1 |
| Mean | |||
| Level | Concentration of NaOH (g/100 mL) | Concentration of PET (g/100 mL) | Wt.% Catalyst to PET |
| 1 | 130 | 108 | 114 |
| 2 | 113.33 | 113.33 | 109 |
| 3 | 81.67 | 109 | 101.67 |
| Delta | 48.33 | 5.33 | 12.33 |
| Rank | 1 | 3 | 2 |
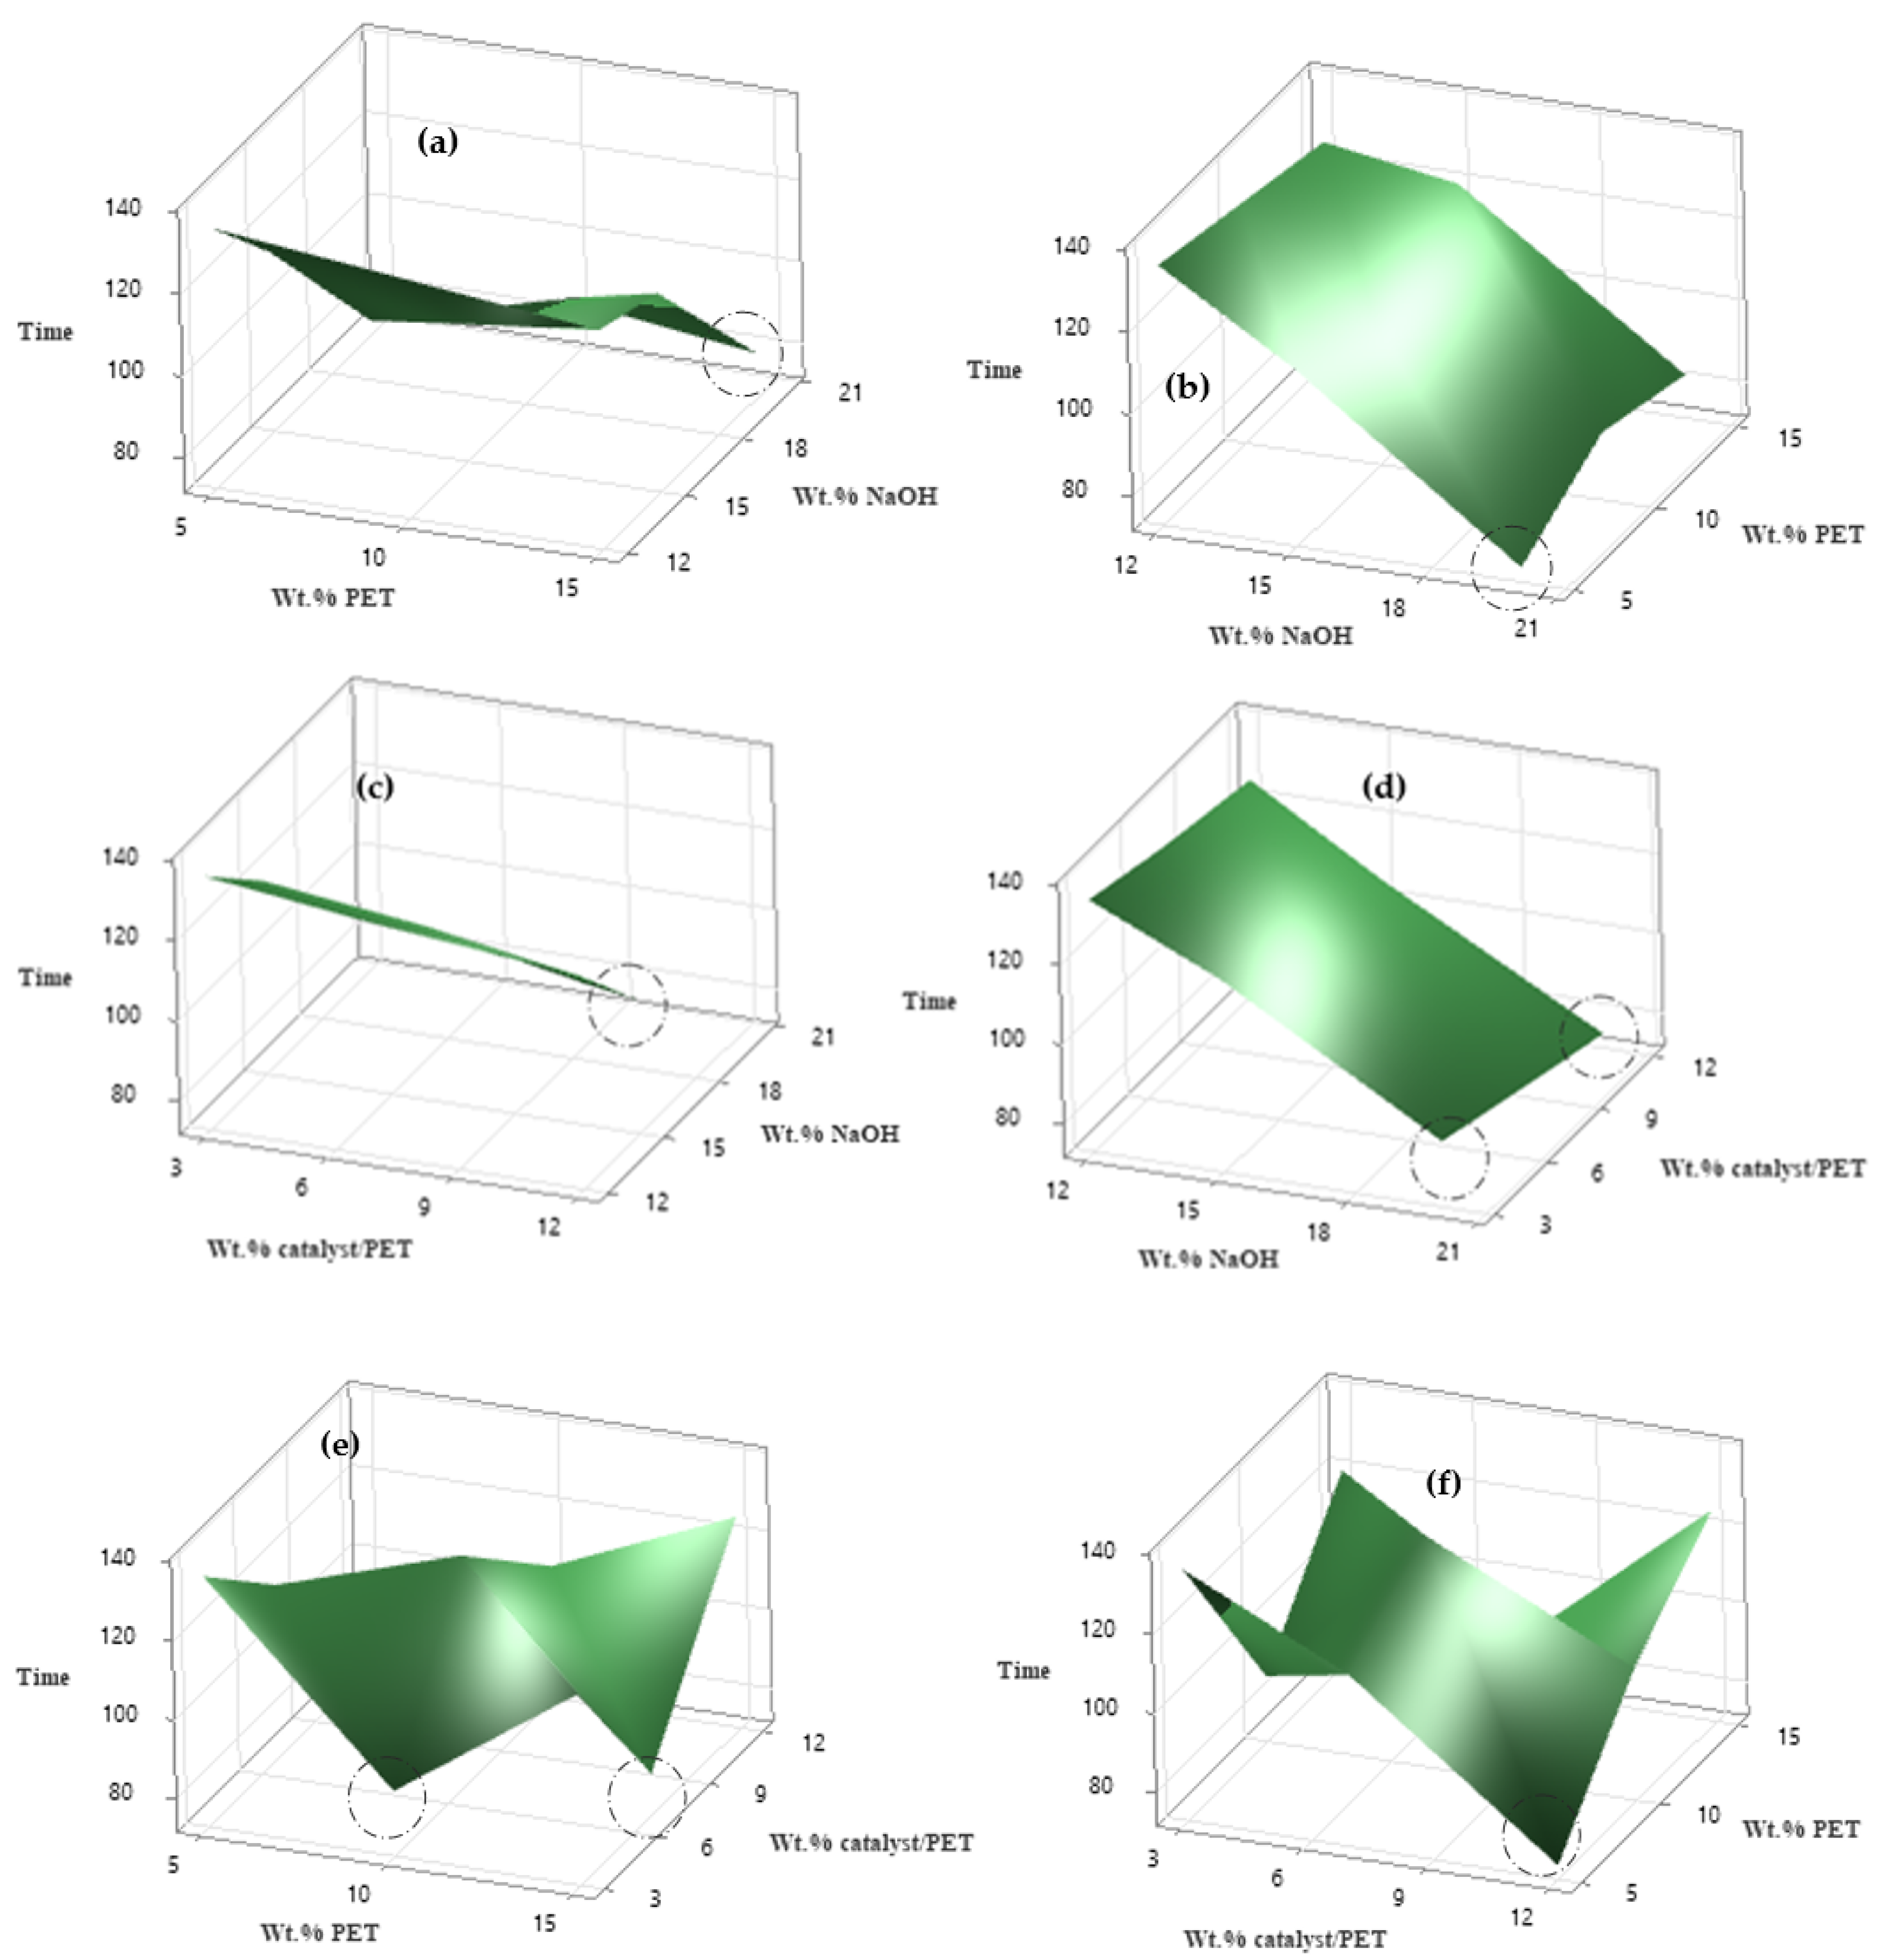
| Figure Factor | Figure 5a | Figure 5b | Figure 5c | Figure 5d | Figure 5e | Figure 5f |
|---|---|---|---|---|---|---|
| Concentration of PET | 4.5 | 5.75 | 5.5 | - | 8–13 | 5.5 |
| Concentration of NaOH | 20 | 20 | 20 | 19 | - | - |
| Wt% catalyst to PET | - | - | - | 5–12 | 11 | 11.5 |
Disclaimer/Publisher’s Note: The statements, opinions and data contained in all publications are solely those of the individual author(s) and contributor(s) and not of MDPI and/or the editor(s). MDPI and/or the editor(s) disclaim responsibility for any injury to people or property resulting from any ideas, methods, instructions or products referred to in the content. |
© 2025 by the authors. Licensee MDPI, Basel, Switzerland. This article is an open access article distributed under the terms and conditions of the Creative Commons Attribution (CC BY) license (https://creativecommons.org/licenses/by/4.0/).
Share and Cite
Nouira, A.; Bekri-Abbes, I.; Paixão Cansado, I.P.; Mourão, P.A.M. Taguchi Robust Design of Phase Transfer Catalytic Hydrolysis of Polyethylene Terephthalate (PET) Waste in Mild Conditions: Application for the Preparation of Metal–Organic Frameworks. Solids 2025, 6, 10. https://doi.org/10.3390/solids6010010
Nouira A, Bekri-Abbes I, Paixão Cansado IP, Mourão PAM. Taguchi Robust Design of Phase Transfer Catalytic Hydrolysis of Polyethylene Terephthalate (PET) Waste in Mild Conditions: Application for the Preparation of Metal–Organic Frameworks. Solids. 2025; 6(1):10. https://doi.org/10.3390/solids6010010
Chicago/Turabian StyleNouira, Asma, Imene Bekri-Abbes, Isabel Pestana Paixão Cansado, and Paulo Alexandre Mira Mourão. 2025. "Taguchi Robust Design of Phase Transfer Catalytic Hydrolysis of Polyethylene Terephthalate (PET) Waste in Mild Conditions: Application for the Preparation of Metal–Organic Frameworks" Solids 6, no. 1: 10. https://doi.org/10.3390/solids6010010
APA StyleNouira, A., Bekri-Abbes, I., Paixão Cansado, I. P., & Mourão, P. A. M. (2025). Taguchi Robust Design of Phase Transfer Catalytic Hydrolysis of Polyethylene Terephthalate (PET) Waste in Mild Conditions: Application for the Preparation of Metal–Organic Frameworks. Solids, 6(1), 10. https://doi.org/10.3390/solids6010010