Article

A Molecular Dynamics Study of Tungsten’s Interstitial Dislocation Loops Formation Induced by Irradiation under Local Strain

by
Mohammad Bany Salman
1,
Minkyu Park
2 and
Mosab Jaser Banisalman
2,*
1
Department of Civil Engineering, Incheon National University (INU), Incheon 22012, Korea
2
Virtual lab Inc., (04773) 6F, 38 Wangsimni-ro, Seongdong-gu, Seoul 08826, Korea
*
Author to whom correspondence should be addressed.
Solids 2022, 3(2), 219-230; https://doi.org/10.3390/solids3020015
Submission received: 7 March 2022 / Revised: 4 April 2022 / Accepted: 14 April 2022 / Published: 18 April 2022

Abstract

:
A molecular dynamics simulation was used to investigate the effect of applied strain on the formation of primary defects and the probability of interstitial dislocation loops (IDLs) formation of tungsten (W) during a collision cascade event. The research investigated primary knock-on atom energies of 1, 6, 10, and 14 keV, applied on a deformed W structure (form −1.4~1.6%). The peak and surviving number of Frenkel pairs (FPs) increased with increasing tension; however, these increases were more pronounced under higher strain due to the formation of IDLs. For 10 self-interstitial atoms (SIA) lengths, the strain effect reduces the clustering energy of the IDLs by about 7 eV. In general, the current findings suggest that strain effects should be carefully considered in radiation-damaged environments, particularly in low-temperature, high-radiation-energy environments. The compressed condition may advantage materials used in high-radiation-damage devices and power systems.

1. Introduction

Due to its excellent mechanical properties, high melting point, high thermal conductivity, and resistance to sputtering and erosion, tungsten (W) has garnered interest for use in plasma-facing components [1,2,3]. A material suitable for use in fusion reactors is the material that functions well in high-energy ion impact, high temperature, and strain environments [4,5,6,7,8]. The interaction of irradiation sources with the construction materials of fusion reactors affects their structural and mechanical properties [9,10]. Energetic particles such as protons, neutrons, electrons, and ions are more likely to produce recoils, which are high-energy primary knock-on atoms (PKA) that initiate the collision cascade events. These collisions generate localized point or line defects, including dislocations, that promote the formation of defect clusters, voids, and stacking faults, resulting in material integrity loss [10,11].
Dislocations are one of the most critical defect structures to examine when attempting to comprehend a material’s mechanical properties. Interstitial dislocation loops (IDLs) have been observed by the deformation and irradiation interactions with the structure.
IDLs can be considered mechanically as barriers that interact with dislocations based on the Orowan mechanism and result in the material’s hardening. IDLs are unwanted defects that contribute to irradiation creep, swelling, and other undesirable effects that compromise the long-term reliability and safety of a system’s structure. In W, there are mainly two types of IDLs observed along the following Burgers vectors (B): 1/2 <111> and <100> [12,13,14]. Based on previous investigations, both IDLs types likely start to occur at 150 keV of PKA [15].
However, W and its alloys have been subjected to many studies for their structural and mechanical properties exploration, while the strain is the topic of interest [16,17,18]. Several strain sources were observed during reactor operation, including the strain associated with void expansion generated by irradiation and the strain associated with solute segregation, which is also referred to as local strains. These local strains had a significant effect on the understanding of W’s defects formation, such as a decrease in the threshold displacement energy (TDE) due to tensile strain and an increase in the TDE due to compression strain [19,20,21]. Due to the volumetric expansion in one direction, void–metal interactions have the potential to introduce strains of up to 5% [22,23]. Local strains may influence the number, type, and shape of defects generated, thereby altering the material’s properties. Cascade in W and its alloys have been subjected to several studies by molecular dynamics (MD) simulations methods concerning the dynamics of cascade and defects production [24,25,26,27]. MD simulations can describe both the heat spike and the recombination of damage, and they are efficient enough to track the entire evolution of cascades in systems with millions of atoms.
Although high energetic cascade events have been proposed as a source of highly mobile IDLs, we believe that the creation probability of IDLs processed under local strain has not been observed in experiments or MD simulations for W.
We use an atomistic model to estimate the chances of IDLs development by irradiation under strain. Six strain magnitudes (−1.4, −0.8, −0.2, 0.4, 1.0, and 1.6 percent) were hydrostatically applied to each of the five distinct deposition energies of PKA (specifically, 1, 3, 6, 10, and 14 keV). Additionally, we examined the peak number of Frenkel pairs (FPs), which indicated the number of survived vacancies and self-interstitial atoms (SIAs) in the irradiated W structure. The number of FPs that survived the cascade’s events, as well as the efficiency of defects production, was of interest.

2. Simulation Methods

For all MD simulations, the large-scale atomic/molecular massively parallel simulator (LAMMPS) code [27] was used in conjunction with the materials square platform [28]. An embedded atom method (EAM) potential [29] was used to characterize the interatomic interactions. This potential was originally parameterized by Derlet et al. [30] and refined by Björkas et al. [31] (DB) for recoil modeling, and it was used in this study.
It has been demonstrated that this EAM potential has adequate accuracy in predicting TDE and defect energies [19,32,33,34] To begin the MD simulations, the simulation cell of a free deformation structure is first equilibrated with 30 K and 0 Pa under an NPT ensemble of the nose–hoover thermostat, which are the initial conditions that are employed before the strain is applied to the structure. Additionally, 30 K is within a typical temperature range for recoil calculations and for the TDE evaluation. The systems of 30 × 30 × 30, 45 × 45 × 45, 55 × 55 × 55, and 70 × 70 × 70 supercells of BCC, each containing 54,000, 182,250, 332,750, and 686,000 of W atoms (four intact structures), respectively, were designed utilizing the materials square platform. To calculate the dimension of each supercell’s side, multiply it by the W lattice constant, which is 3.16 Å (i.e., 3.16 × 30 = 94.8 Å). Cell sizes were set to ensure that the system’s average temperature after collision was less than 200 K on average, and that the displacement cascade would not cross cell boundaries. These four supercells were created to stand for the cascade energies of 1, 6, 10, and 14 keV. Next, each of the four structures was subjected into six strain values, each with an incremental hydrostatic strain of 0.6%, going from −1.6% to 1.4% (Table 1). The hydrostatic strain was applied in all directions, with negative values corresponding to compressive deformation and positive values corresponding to tensile deformation.
With a maximum displacement of 0.01 per step (xmax) and a maximum time step (tmax) of 0.02 ps, an adaptive time step was used. We determined that the settings were accurate enough to evaluate the formation of defects in comparison to numerous different xmax and tmax values after thorough examination and analysis. Each recoil MD simulation was initiated by imparting recoil energy to an atom located near the lattice center of the strained structures in one of four recoil directions (i.e., [111], [110], [100], and [321]), referred to as the primary knock-on atom (PKA). When recoil energy was introduced, it was converted to the velocity components of the PKA. Voronoi analysis [35] was utilized to identify whether or not a defect was generated: if the lattice site included two or more atoms, then an SIA was formed; if the site was empty, then a vacancy was formed.
The irradiation-induced displacement cascade was allowed to evolve for 20~30 ps for each PKA energy in a canonical NVT ensemble (i.e., constant atoms, volume, and temperature). The evolution time demonstrates that greater PKA energies required more evolution time to reach the stability state in comparison with the lower PKA energies, thus we confirmed that this setting was sufficient to observe the three ballistic phases.
The microcanonical/NVE ensemble was used for all cascade simulations (i.e., constant atoms, constant volume, and constant energy). Although the purpose of collision cascade simulation is to determine the number of FPs generated by the mean of MD, the standard number of atomic displacements can also be theoretically approximated using the Norgett–Robinson–Torrens (NRT) technique [33].
NRT   displacement = 0.8 E de 2 E d
where Ede is the nuclear deposition energy, which is about equivalent to the deposition energy collision carried by PKA for cascade, and Ed is the TDE of the material, which is 90 eV according to International American Society for Testing and Materials (ASTM) standards [36] and our previous work [37]. The modeling parameters employed and the standard NRT displacements obtained are summarized in Table 2. After analyzing the final atomic configurations using OVITO postprocessing and visualization software [38], its modifiers were used to derive the cascade configuration and the clusters’ sizes. The dislocation extraction algorithm (DXA) [39], which determines the burger vectors of interstitial dislocations and outputs as a line representation, was used to detect the presence of dislocations in a crystal.

3. Results and Discussion

The FP’s production number were conducted over 16 independent MD simulations (4 different timings of each of the 4 different directions) at specific strain values of specific PKA energy at 30 K. It is noted that error bars included in the figures denote the standard error of the mean (SEM) and is determined as SEM = σ n , where σ is the standard deviation of the average FP over the set of n = 16 independent simulations. The error bars in the figures show this SEM. Because each strain value showed a similar thermal spike trend for all PKA energies, only the typical response of damage evolution over time for 10 keV and 14 keV are depicted in Figure 1a,b, respectively. Peak onset occurred earlier in compressed strains, whereas peaks reached greater heights and lasted longer in tensile strains. A comparison of the number of defects generated under each PKA energy and strain condition was included to clearly determine the effects of each PKA energy and strain type.
After the PKA received its kinetic energy, the number of atomic displacements increased sharply during the ballistic phase and the highest number of FP was reached, but most of the resulting defects moved to the original crystal lattice sites—a process known as the recombination or stabilization phase—with time. The peak time, which is the period between event initiations until the maximum number of created defects is reached, is the main feature of the ballistic stage. Different cascade core volumes were observed for various strain levels, resulting in a different number of defects being generated [40]. When the W structure was compressed, the atoms became closer together, allowing the PKA energy to be dissipated over a smaller structure volume, resulting in fewer collisions without the generation of defects, as the PKA had a lower energy than the TDE [10]. Additionally, because the lattice distances between atoms are smaller in a compressed structure, the cascade atoms would move shorter distances. However, when the lattice distance between atoms increases, the atoms with more energy move freely and faster away from the cascade core, decreasing the possibility of recombination and generating more defects. The probability of secondary PKA occurrence increases with increasing PKA levels, and those secondary PKAs initiate the cascade with a lower energy level than the parent PKA.

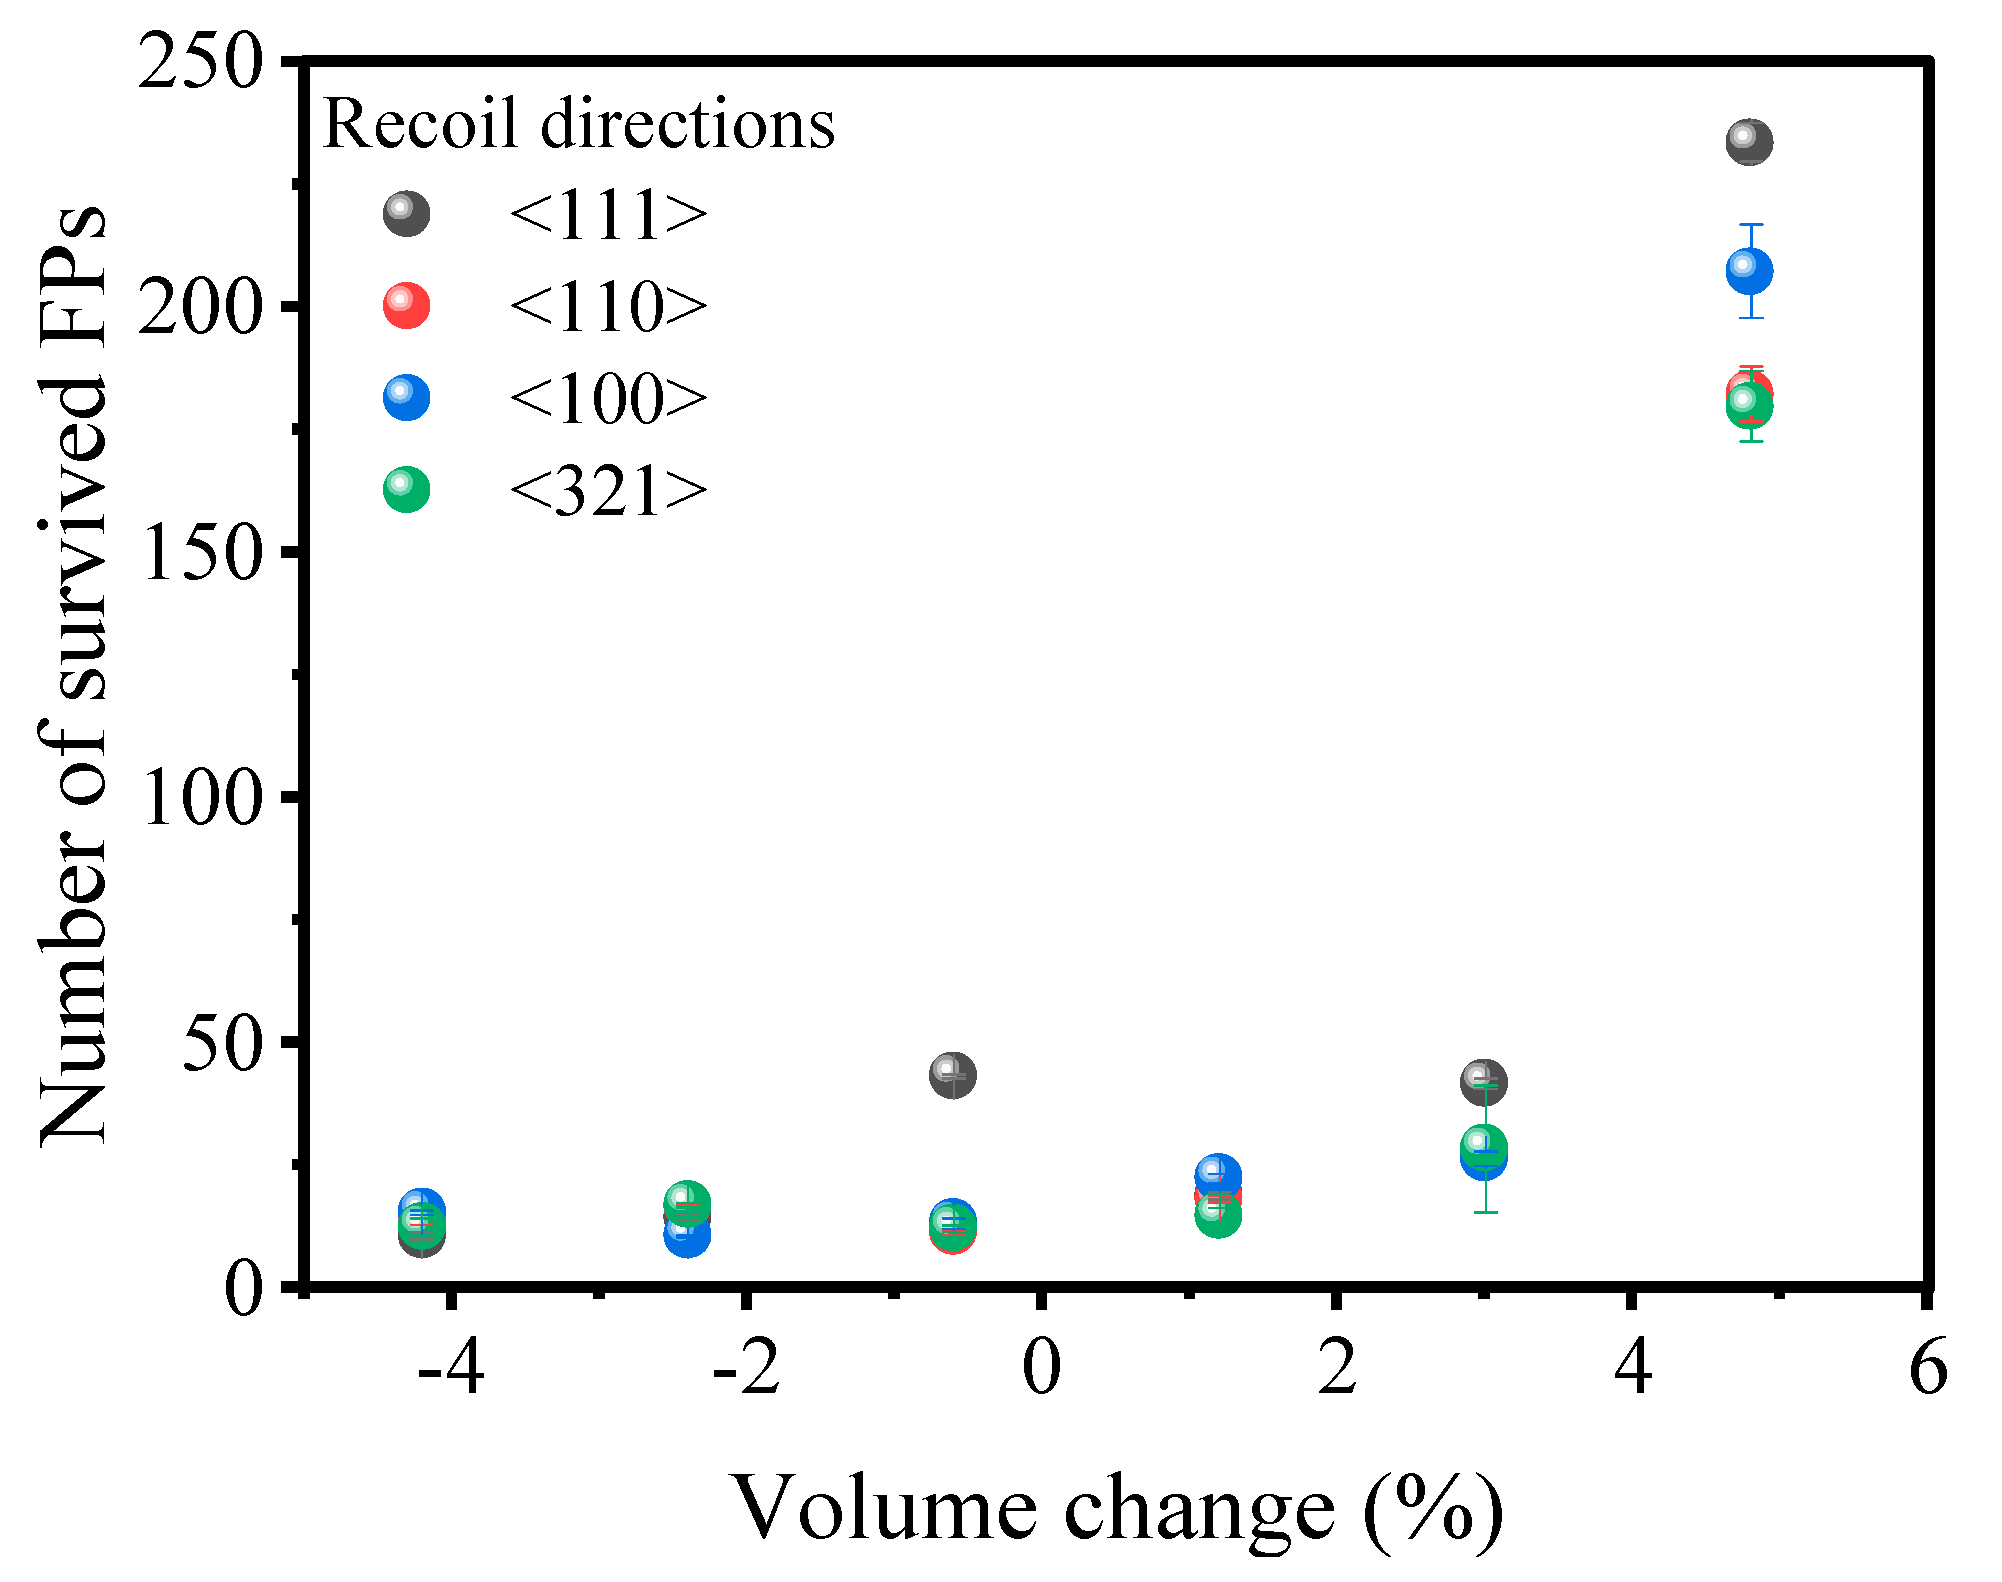
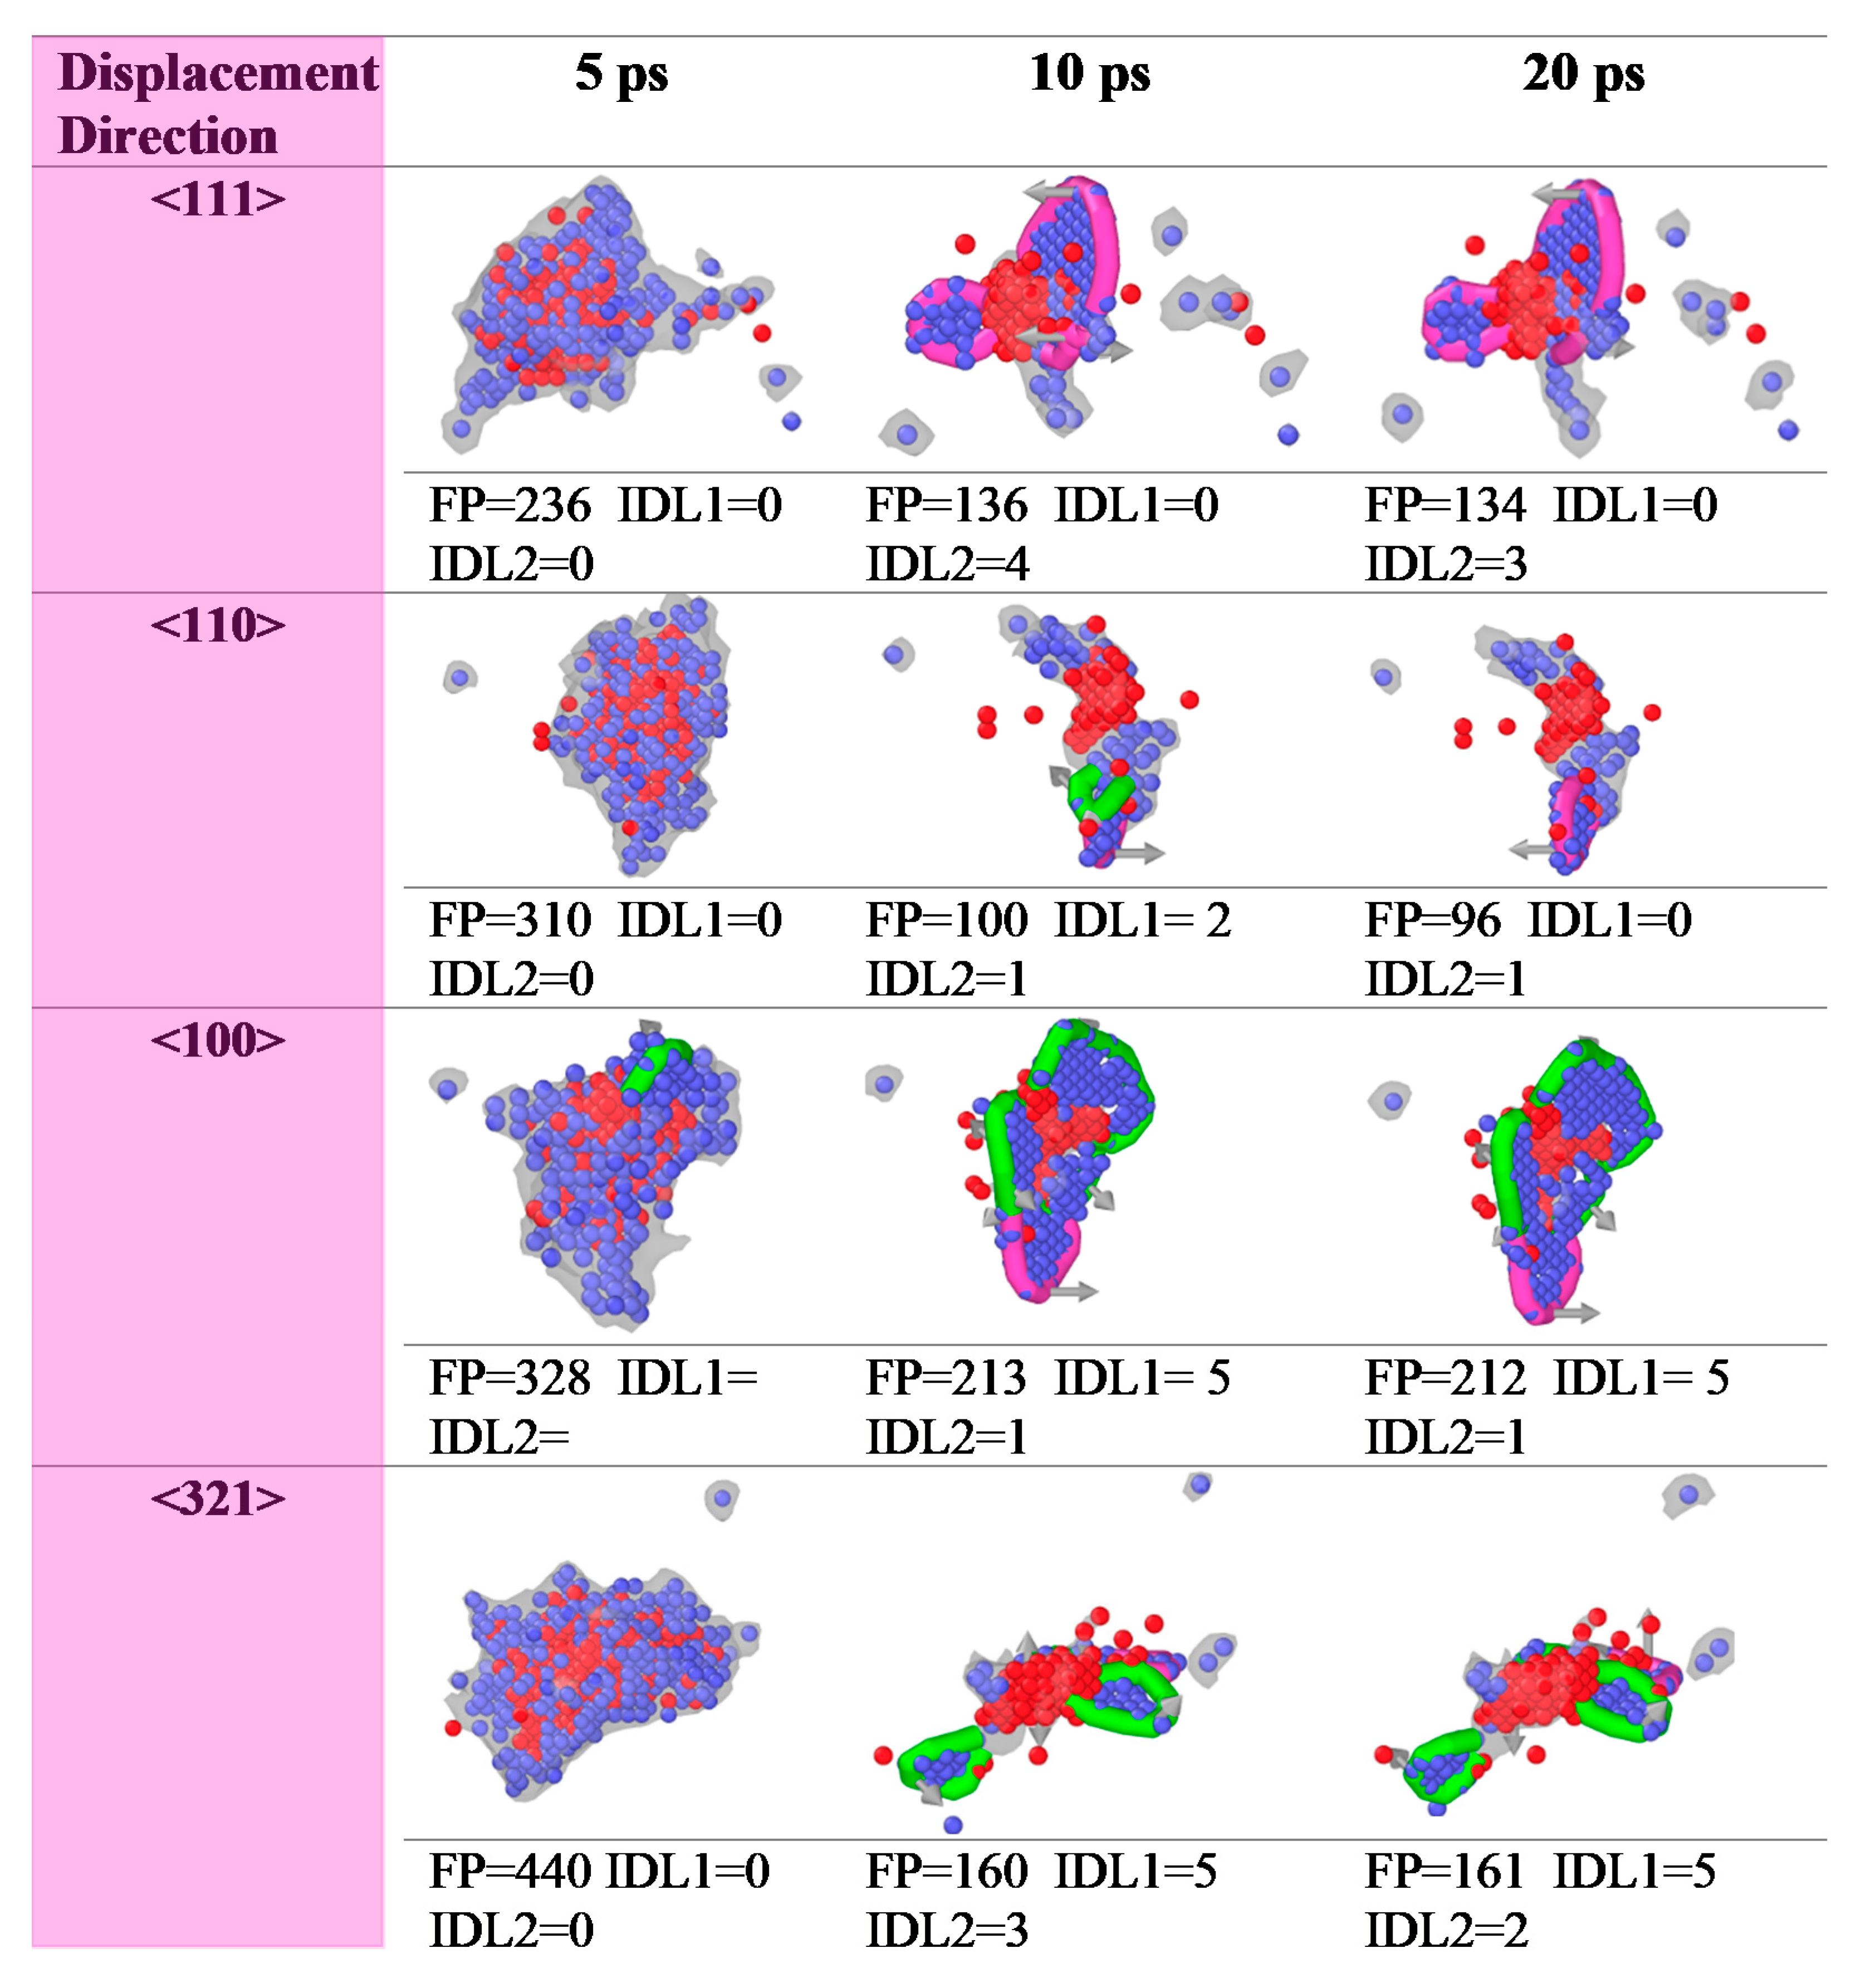
3.1. PKA Energy and Direction Effects

Aside from anisotropic crystal structure and strain application, the chaotic nature of collision events (such as subcascade generation and channeling) [41] complicates primary radiation damage morphology and distribution. As a result, where the cascade procedure varies in stochastic nature from case to case, deterministic redistribution of collided PKA energy is impossible. As a result, we managed to run 16 different displacement cascades of each PKA recoil energy of each strained structure. The PKA energy and PKA recoil direction dependence were evaluated in terms of the number of FPs that remained after the relaxation time at the end of the cascade simulations, as shown in Figure 2.
The dependence of the strained surviving FP on the [111], [110], [100], and [321] directions at 14 keV is shown in Figure 2. While the results obtained for different directions varied by 8 FPs for strains less than 1%, the variance is relatively larger for larger strains such as 1.6%. However, because the high-indexed direction <321> tends to avoid channeling [41], whereas <111> has a higher probability of channeling effects, and one of the highest numbers of FP generated would be with the <111> direction; consequently, <321> may produce fewer defects due to its higher TDE.

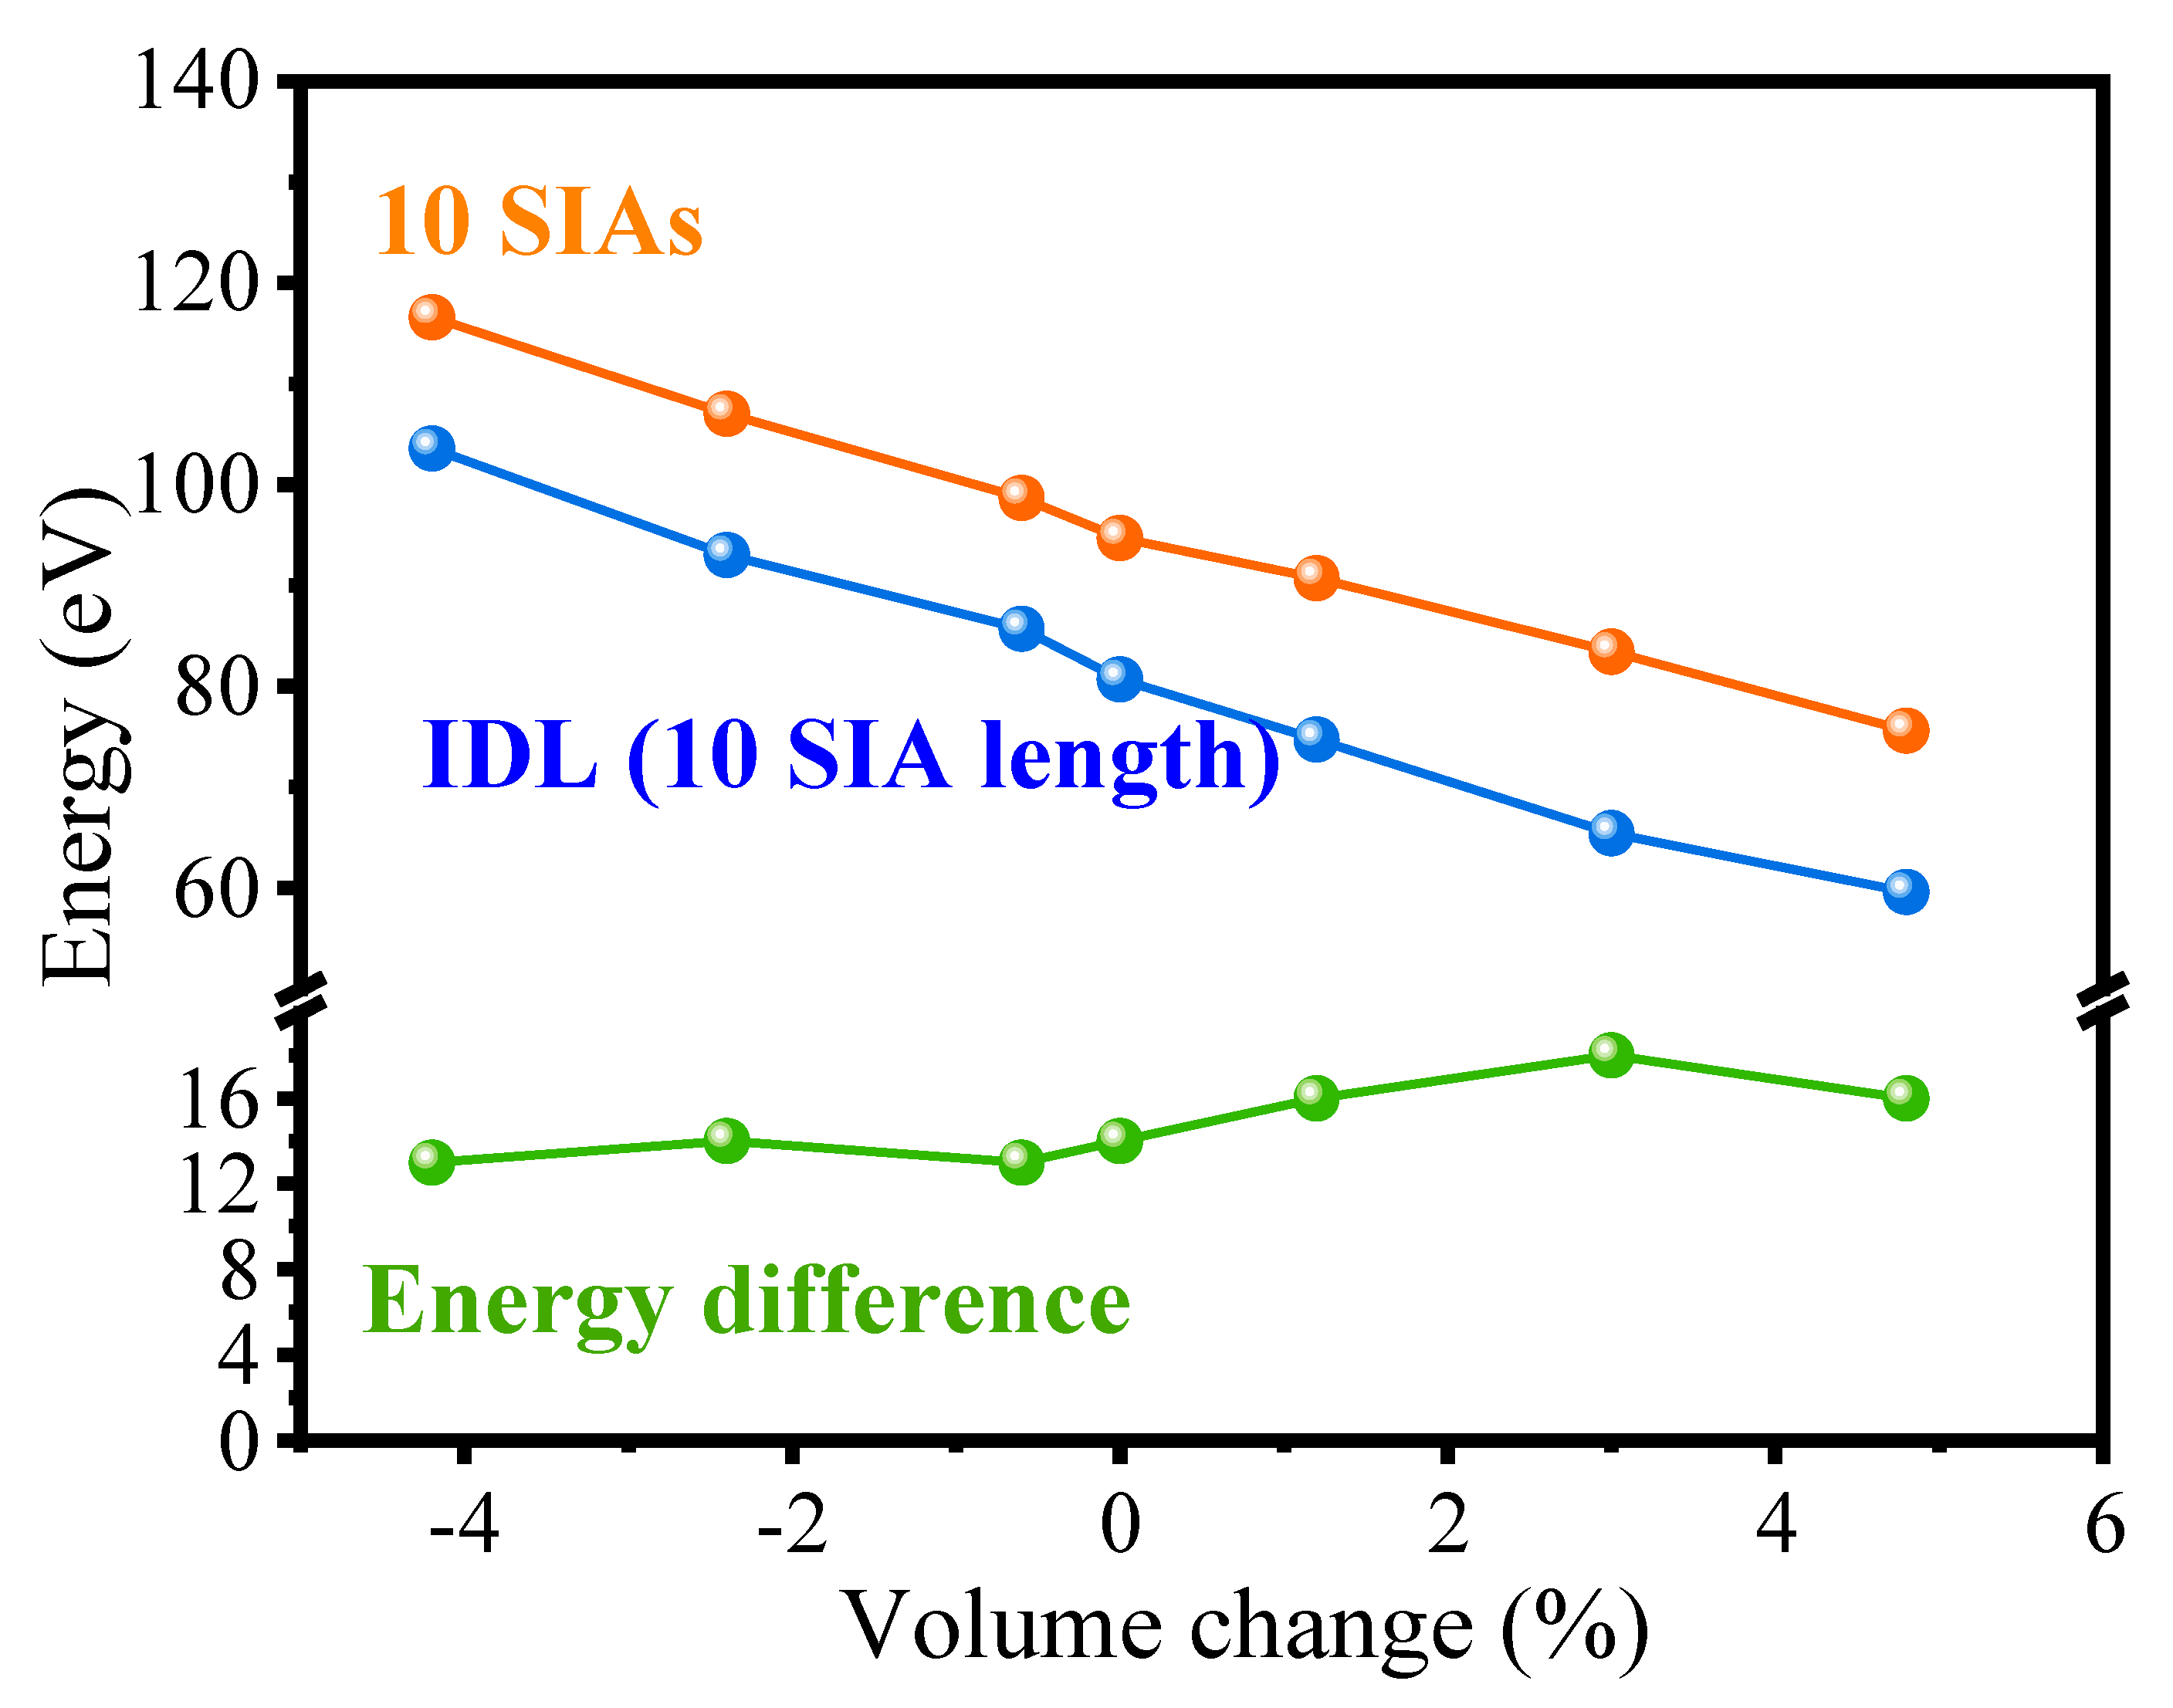
3.2. Strain Effects on Point Defects and IDLs

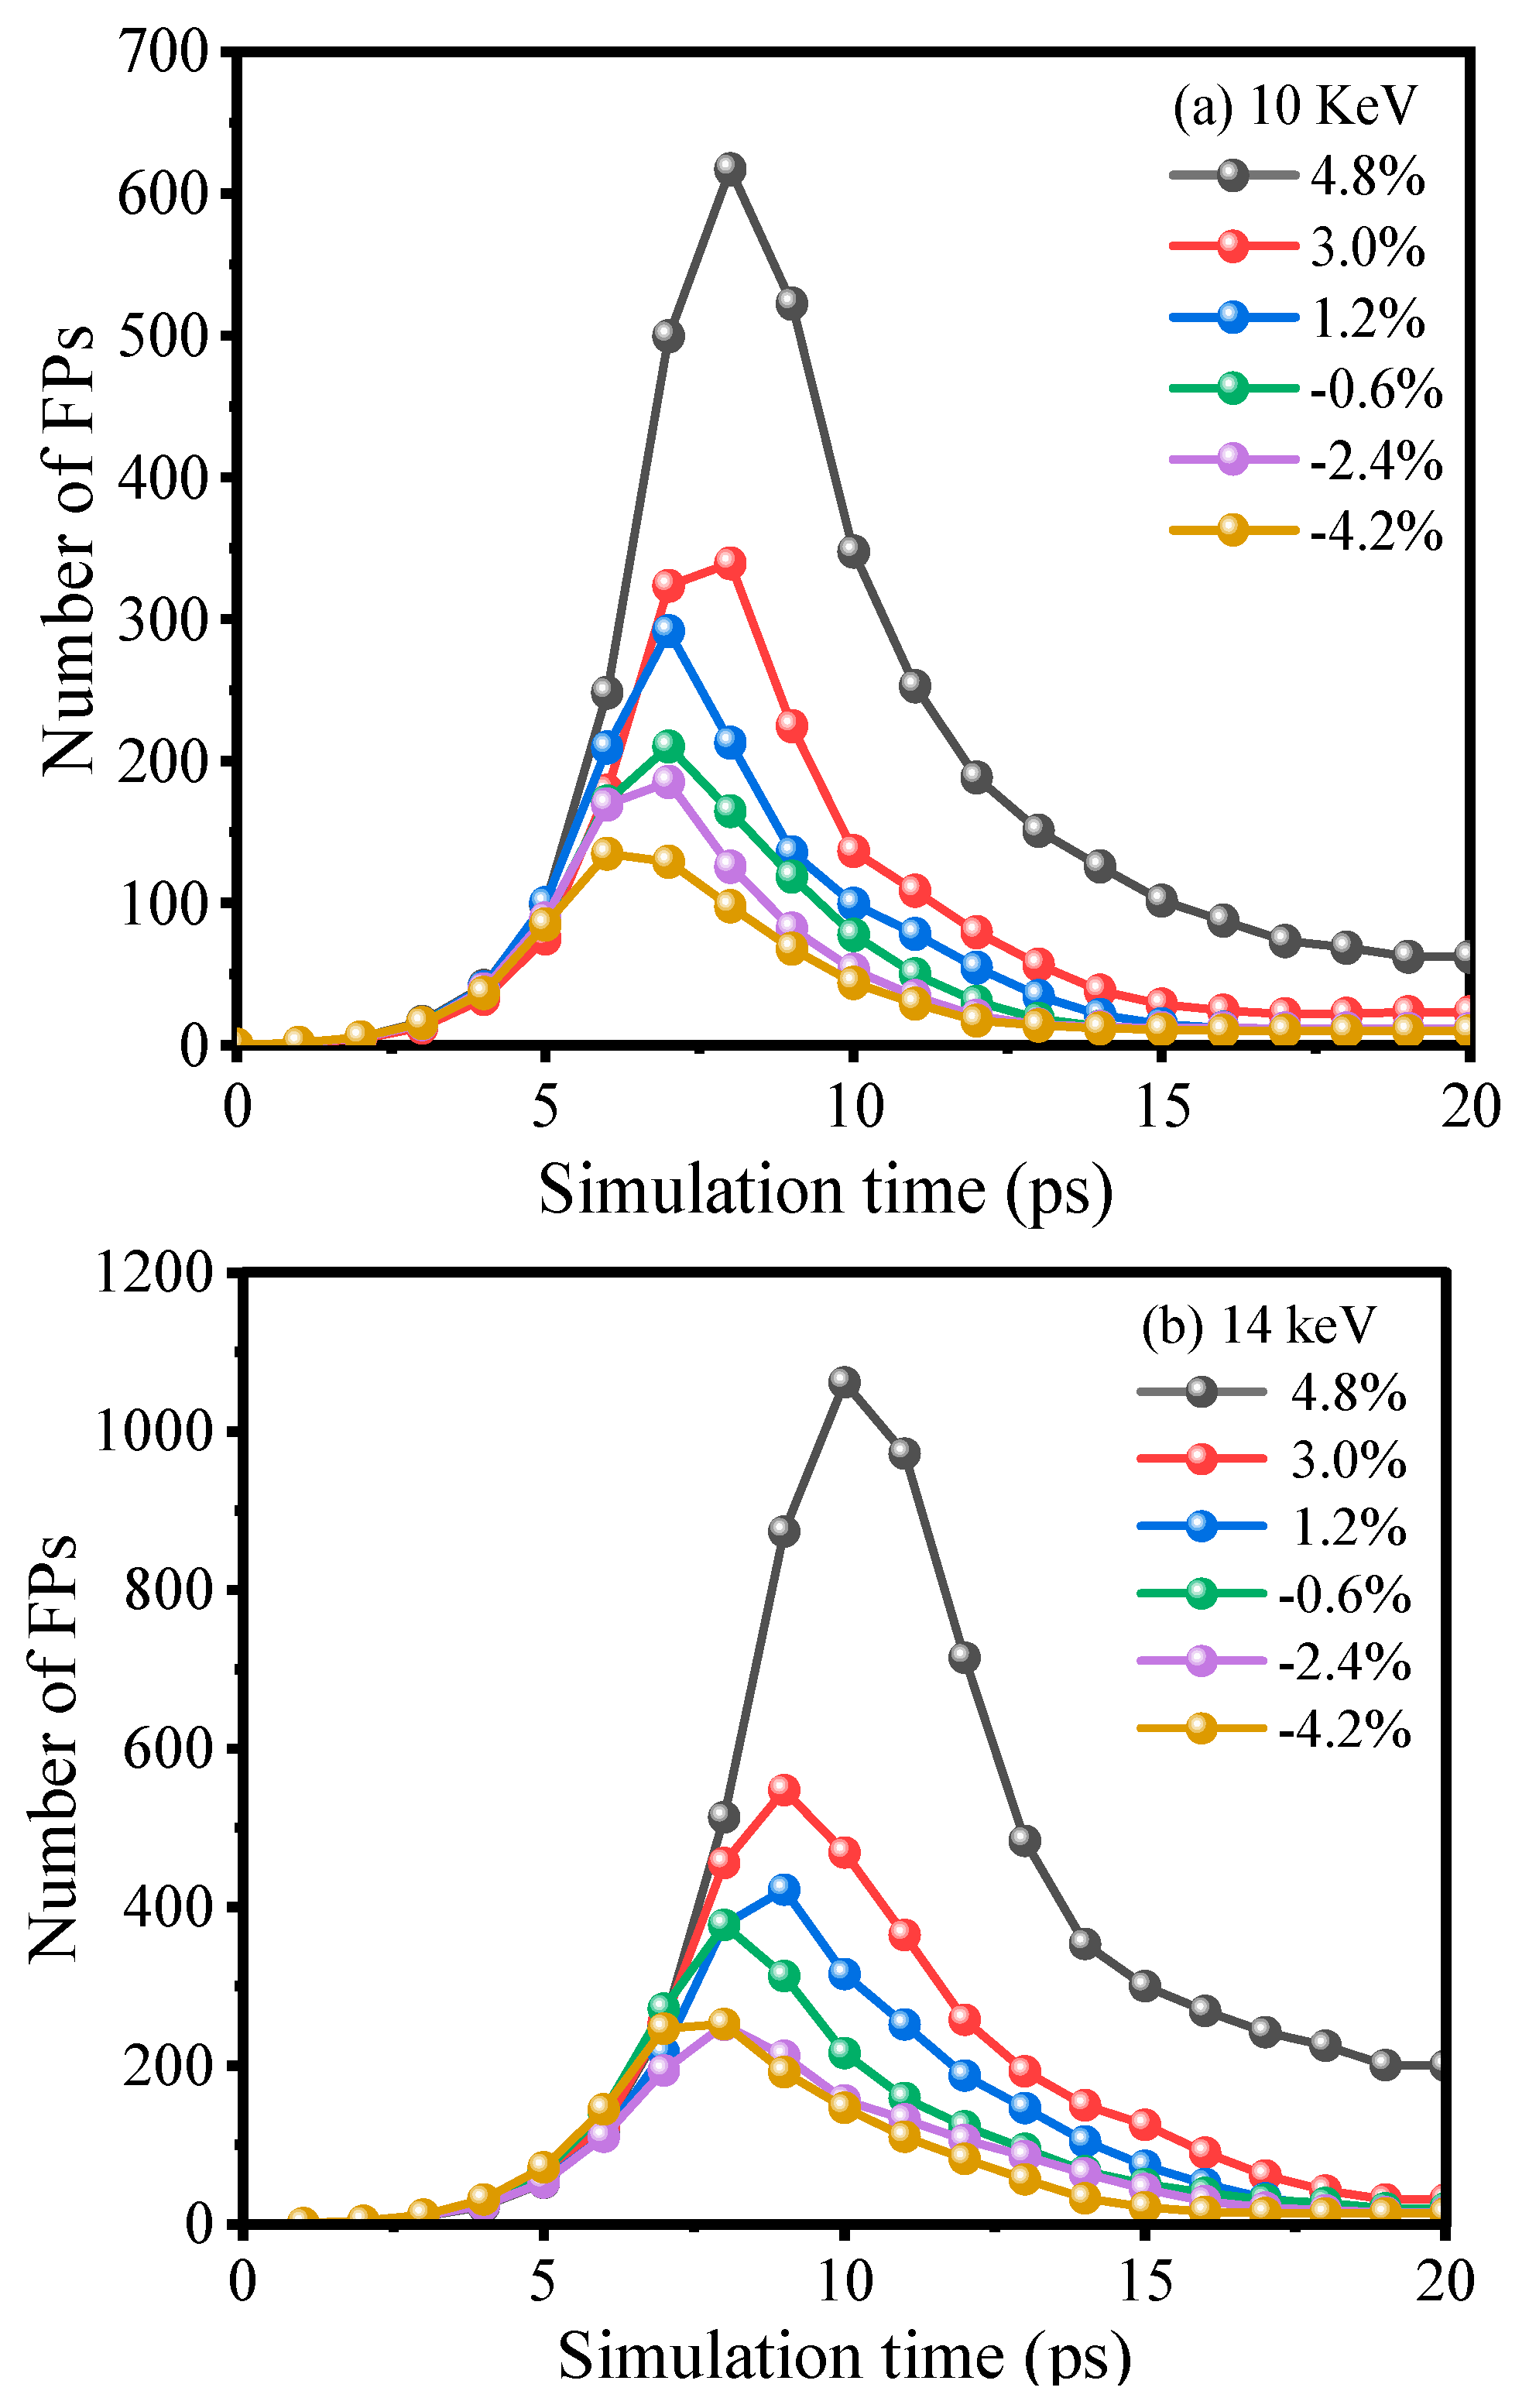
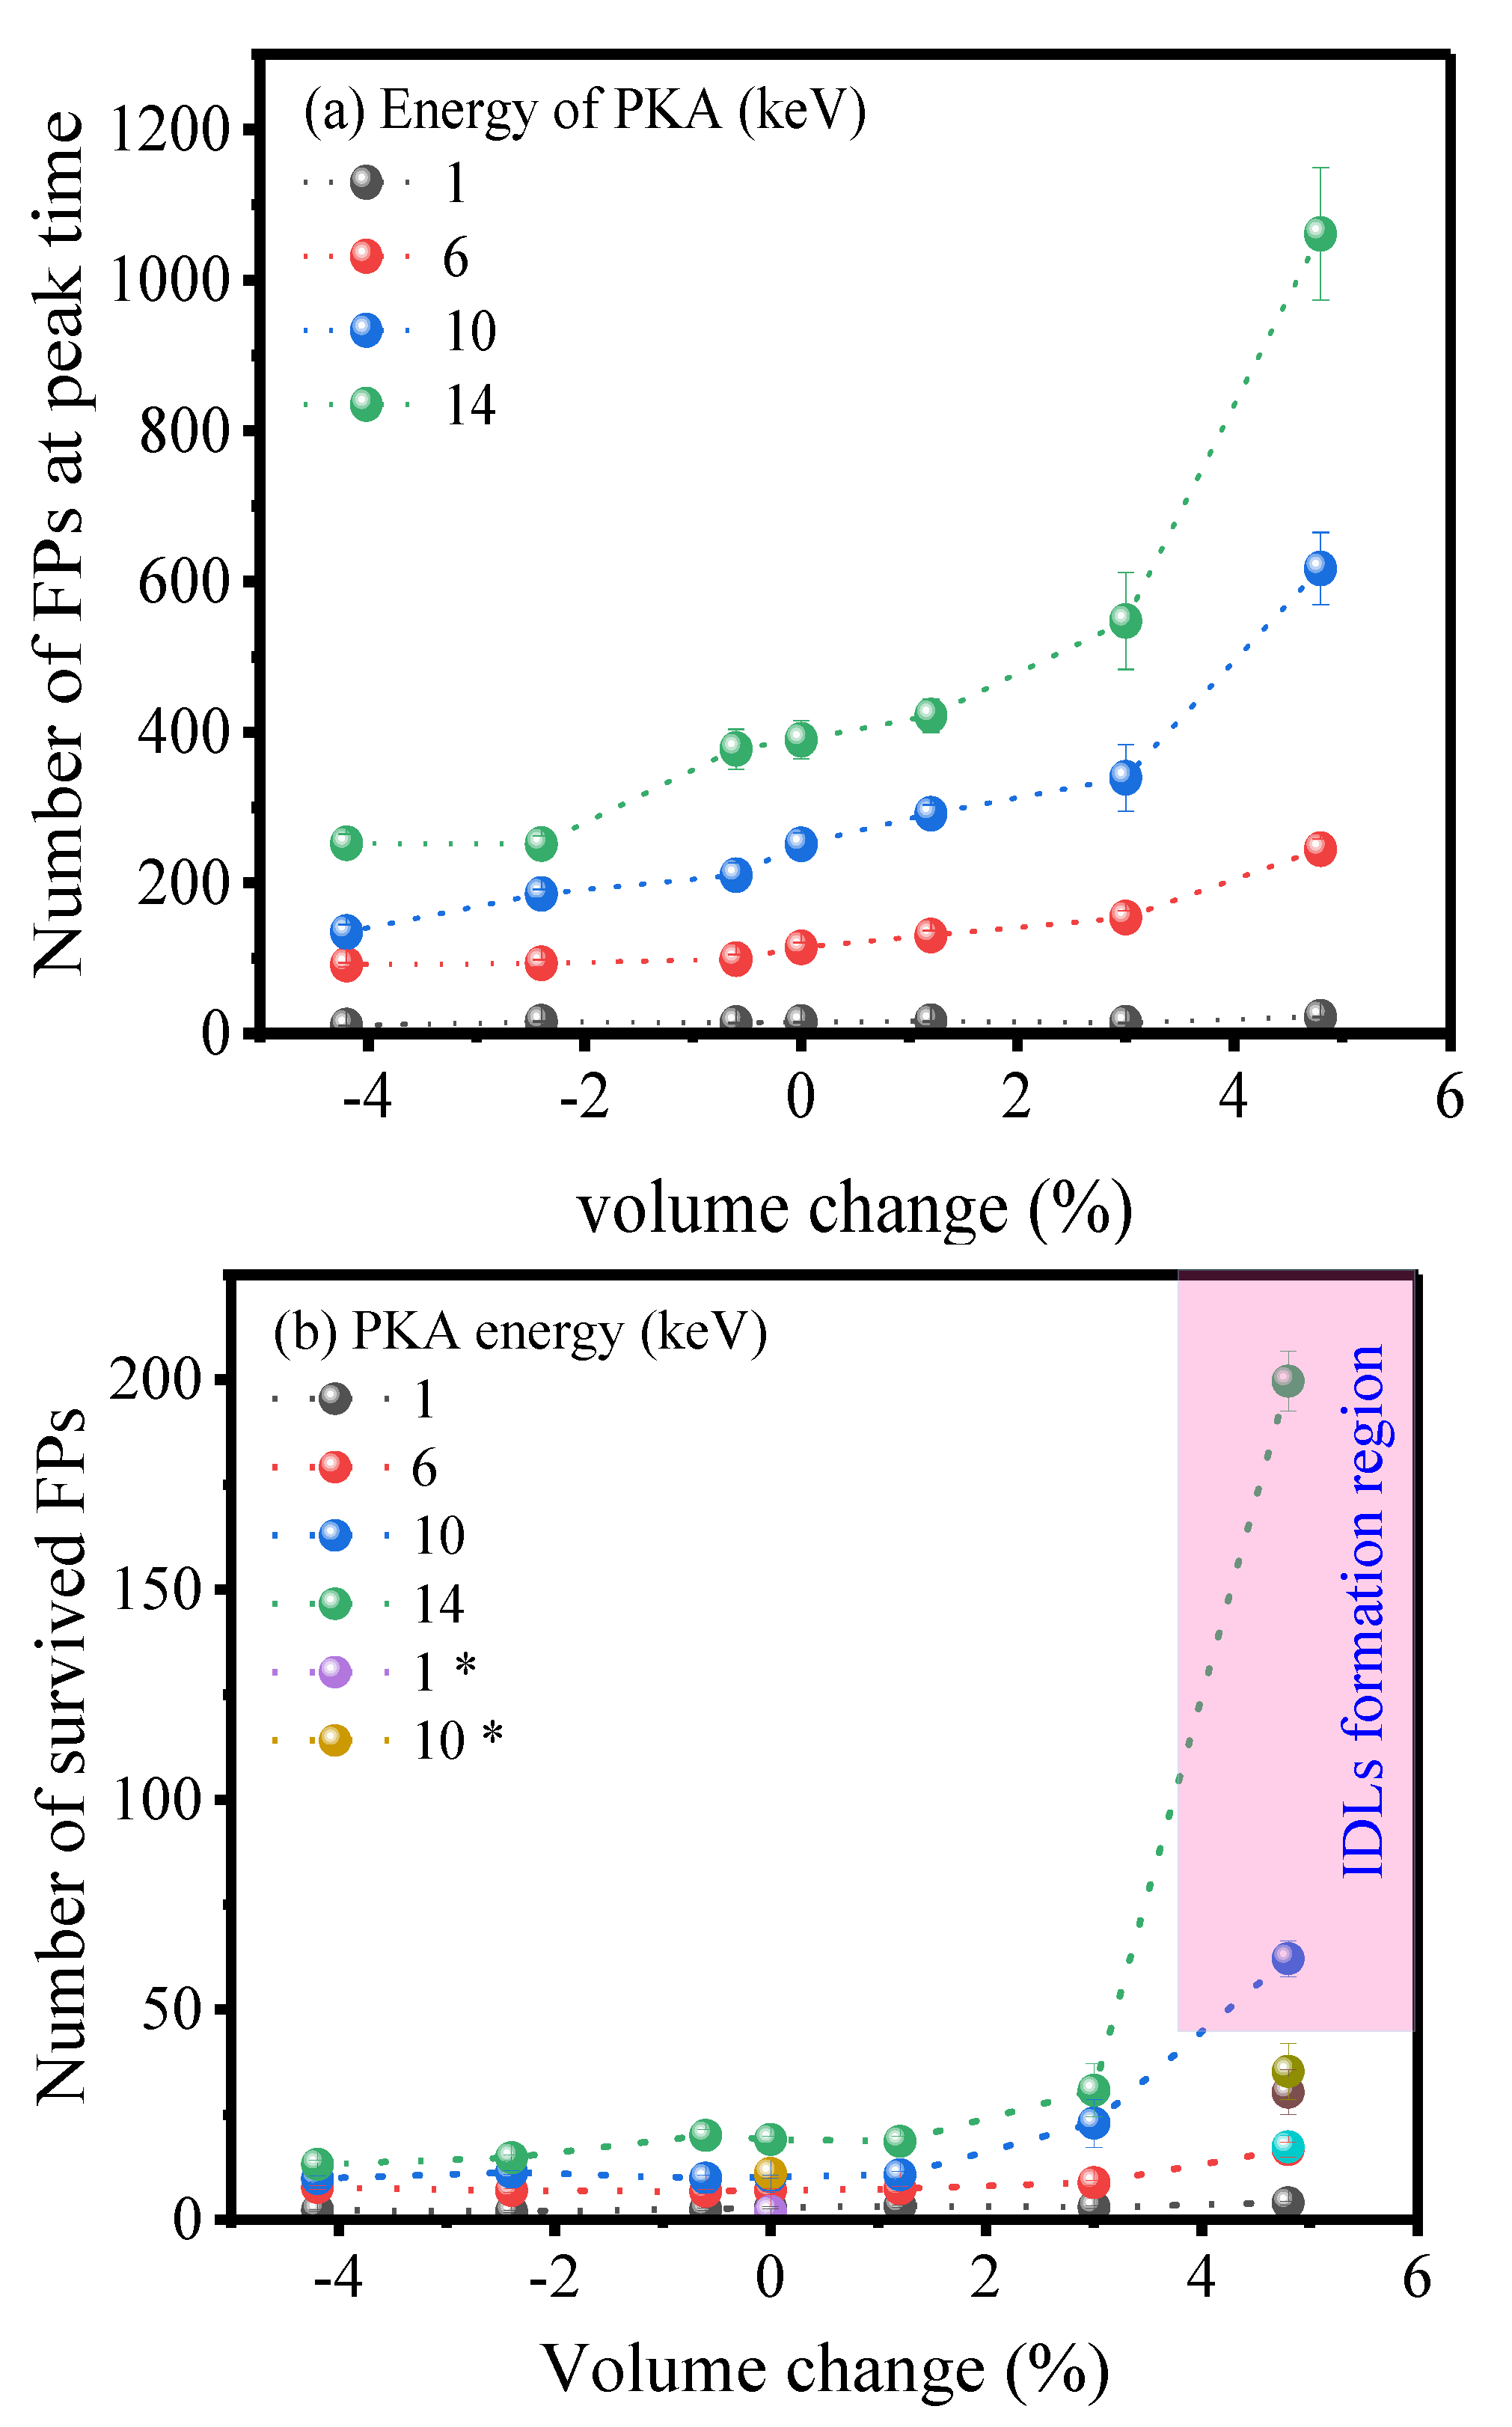
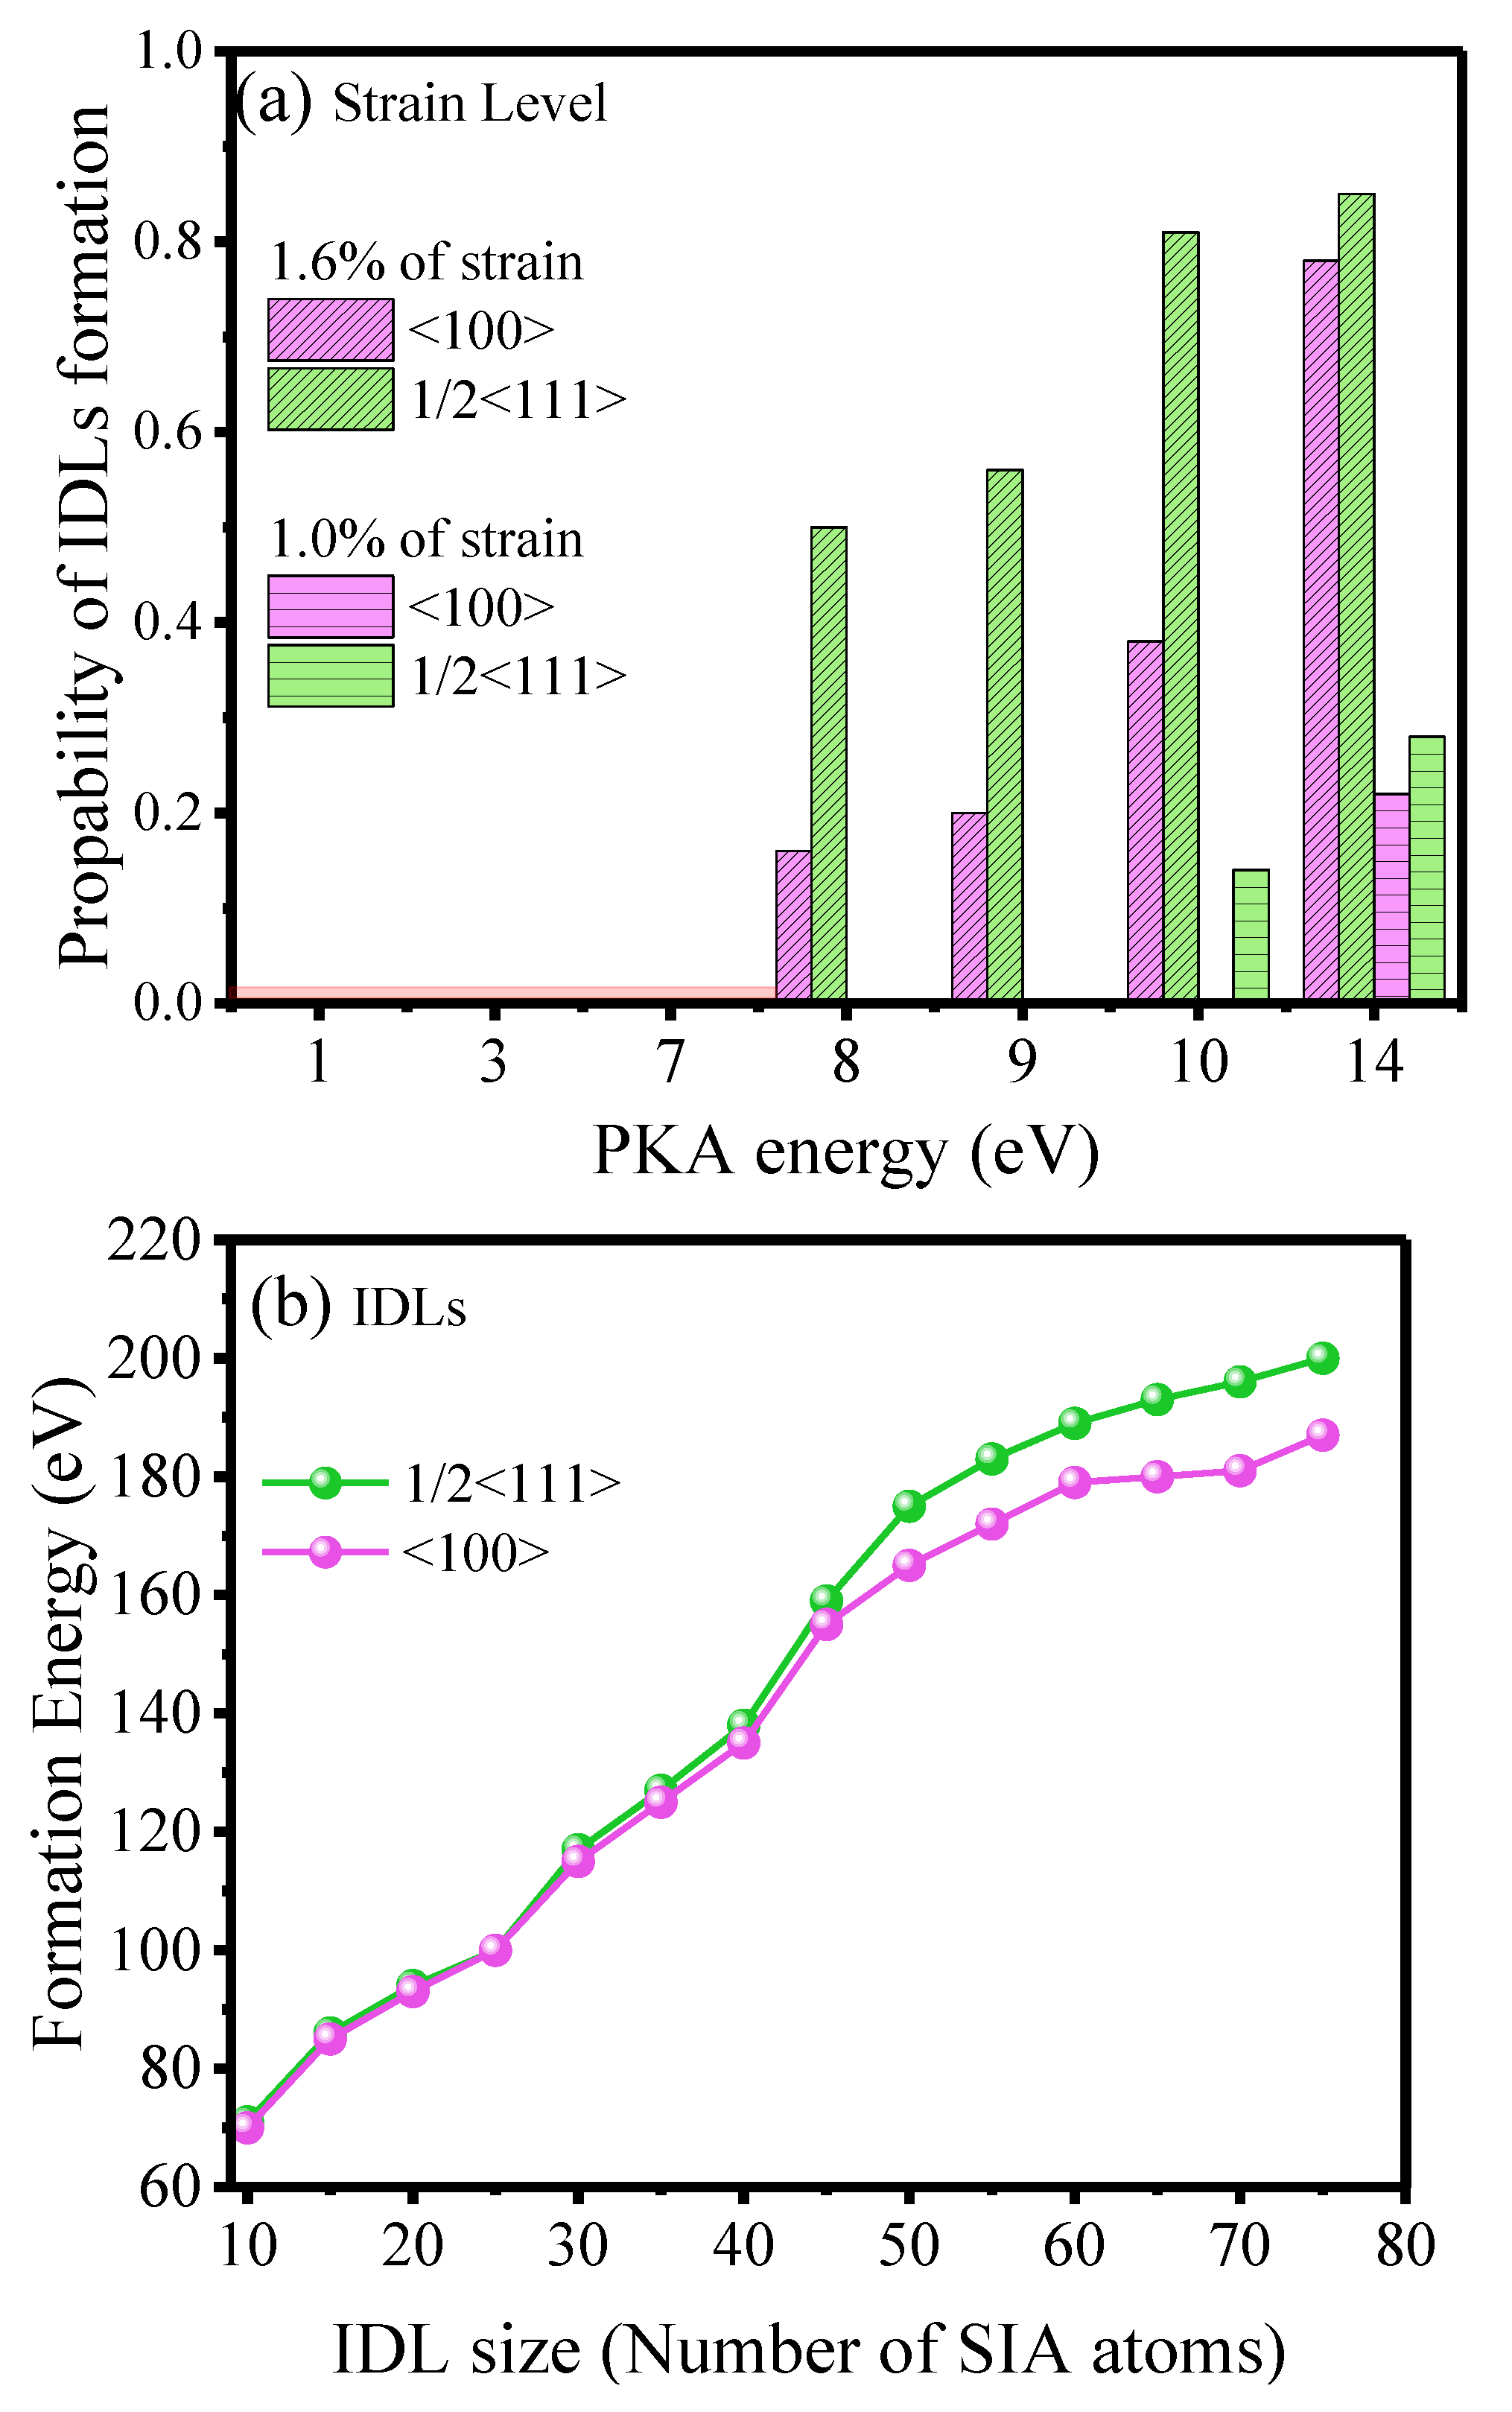
3.2.1. Point Defects and Dislocation Loop Formation

There is a direct correlation between the volume changes of the applied hydrostatic strain and the number of defects generated. The strained peak number of FP of all PKA energies is plotted in Figure 3a, and each point in the figure is averaged over 16 different individual simulations for simplicity. The strained peak number of FPs tended to increase with tensile strain, most notably at 10 and 14 keV of PKA, and such effects on defect generation have been reported [41]. The number of defects FPs produced is directly proportional to the volume changes caused by the applied hydrostatic strain. The number of strained survived FPs after equilibration period is important for estimating radiation damage effects, particularly for understanding the subsequent processes of defect motion and clustering. Our reported FPs result nicely confirms previous MD work on tungsten by Wahyu et al. [42] at free strain conditions for 1 and 10 keV. The surviving number of FPs in Figure 3b varied significantly for the various PKA energies. The surviving number of FPs increased with increasing tension and decreased with compression strain for all PKA energies, due to the change of FP formation energy and the consequent TDE [33]. The variation in the survived number of FPs is more pronounced for higher PKA energies, which is consistent with previous findings [40,43].
We found, with the DXA algorithm [39], that the relatively large shift in FPs formation at larger strains was due to the IDLs formation. The ½<111> of <100> IDLs begin to appear at 10 keV of 1.0 % strain, whereas when the strain is increased to 1.6%, the IDLs begin to appear at lower PKA as 8 keV, indicating that strain has a significant effect on IDL formation. At 1.6% strain, the probability of ½<111> IDL formation is approximately two times that of <100> formation for the PKA from 8 keV, 9 keV, and 10 keV, while the ratio became nearly similar when the PKA is 14 keV. To confirm this, we evaluated the formation energy of both types of IDLs, and it is confirmed that as the number of SIA increases, the formation energy of the <100> clusters decrease, and this can tell why the more <100> IDLs as compared with the ½<111> IDLs appeared at larger PKA and larger strains (Figure 4b). Note that this atomic potential for tungsten at high PKA stated that the <100> cluster was more stable than the <111> cluster, which is consistent with previous findings of the current potential model [15].
It is also worth noting that the number and type of IDLs vary depending on vibration timing and collision displacement direction, as shown in Figure 5. The dislocation lines show that no embedded atoms interfere with the FP’s point defects, and the defects formed are classified as monovacancy, mono SIA, cluster (two or more SIAs or vacancies), and dislocation loops. However, as PKA levels rise, the length of the dislocation loop appears to be extended (see Supplementary Materials Videos S1 and S2). Even if the kinetics differ from ab initio calculations [44] due to the absence of subcascades in tungsten, as opposed to iron [34], then the conclusion that local strain application leads to IDLs formation at lower PKA energies will not be affected by the different kinetics.
Because of the decrease in TDE value at increased strain levels, IDL creation began to occur at the peak time of the ballistic phase. With more FPs, SIA clustering into a loop occurred with lower energy than monodefects (Figure 6). The IDL of 10 SIAs has an energy that is 8 eV lower than the energy of 10 monodefects formation. The energy cutoff in this study for observing interstitial loops was 8 keV. This means that IDLs can occur even at lower PKA energies and lower PKA atomic masses, but only when the local strain is high enough, and this can be considered an addition to the study, which stated that a different types of IDLs can only be observed at very high PKA energies or larger PKA masses [41].

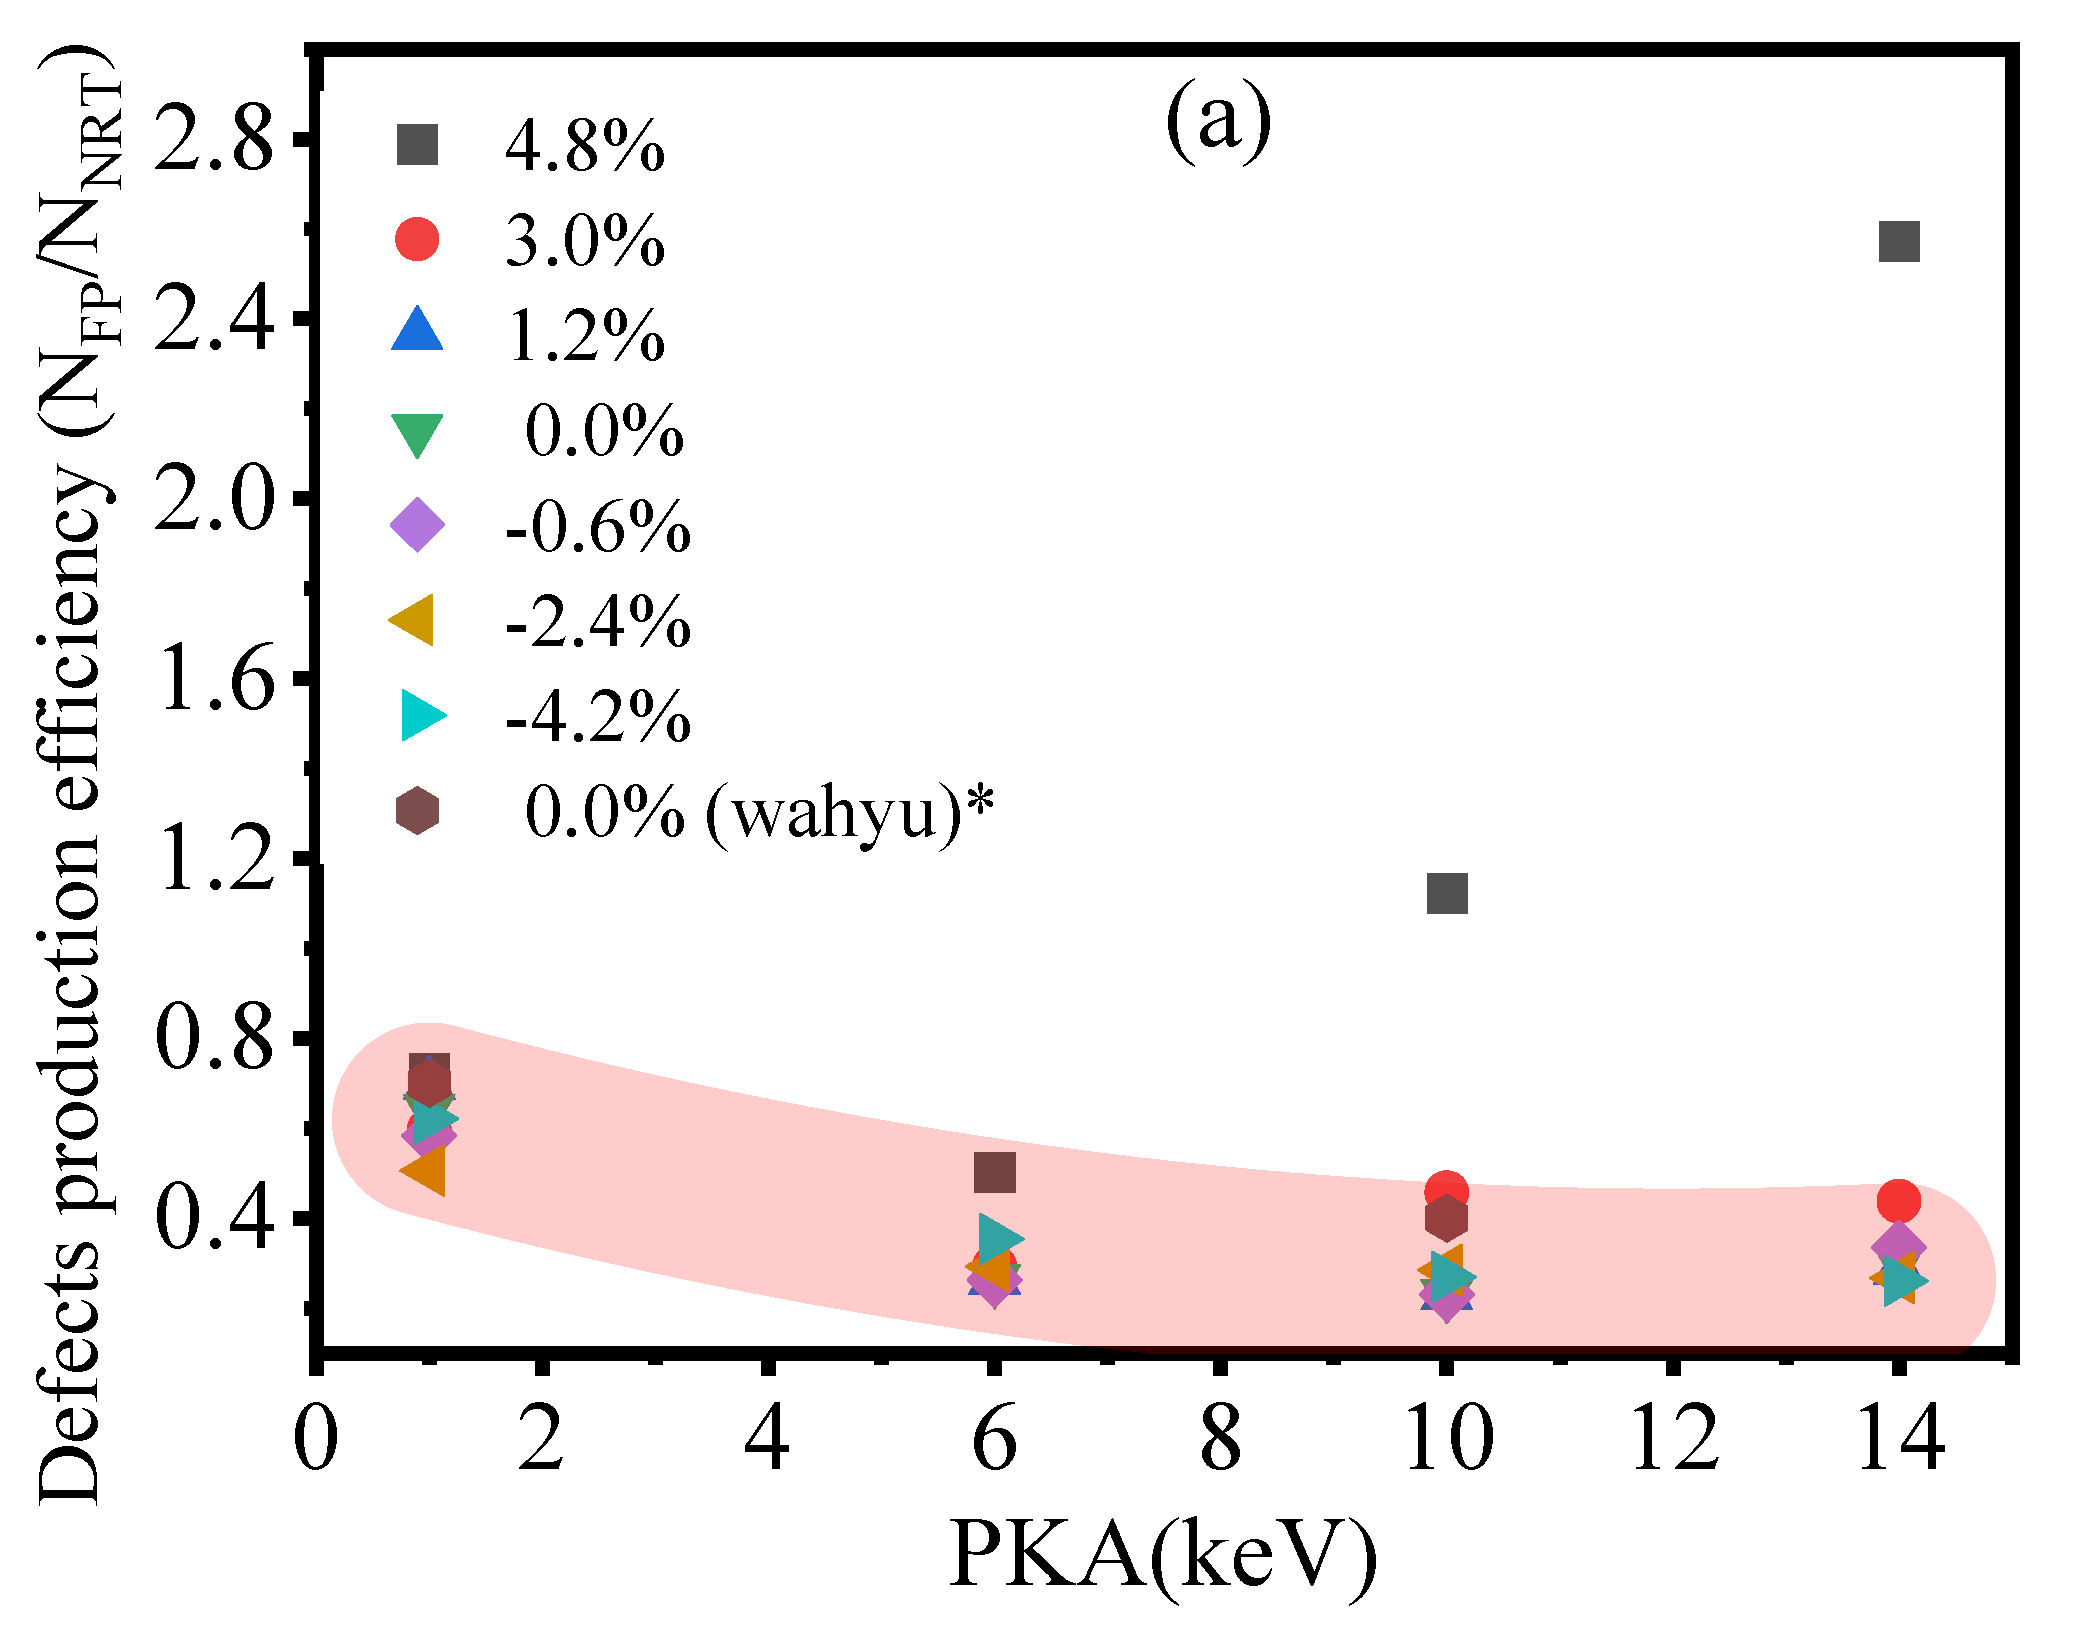
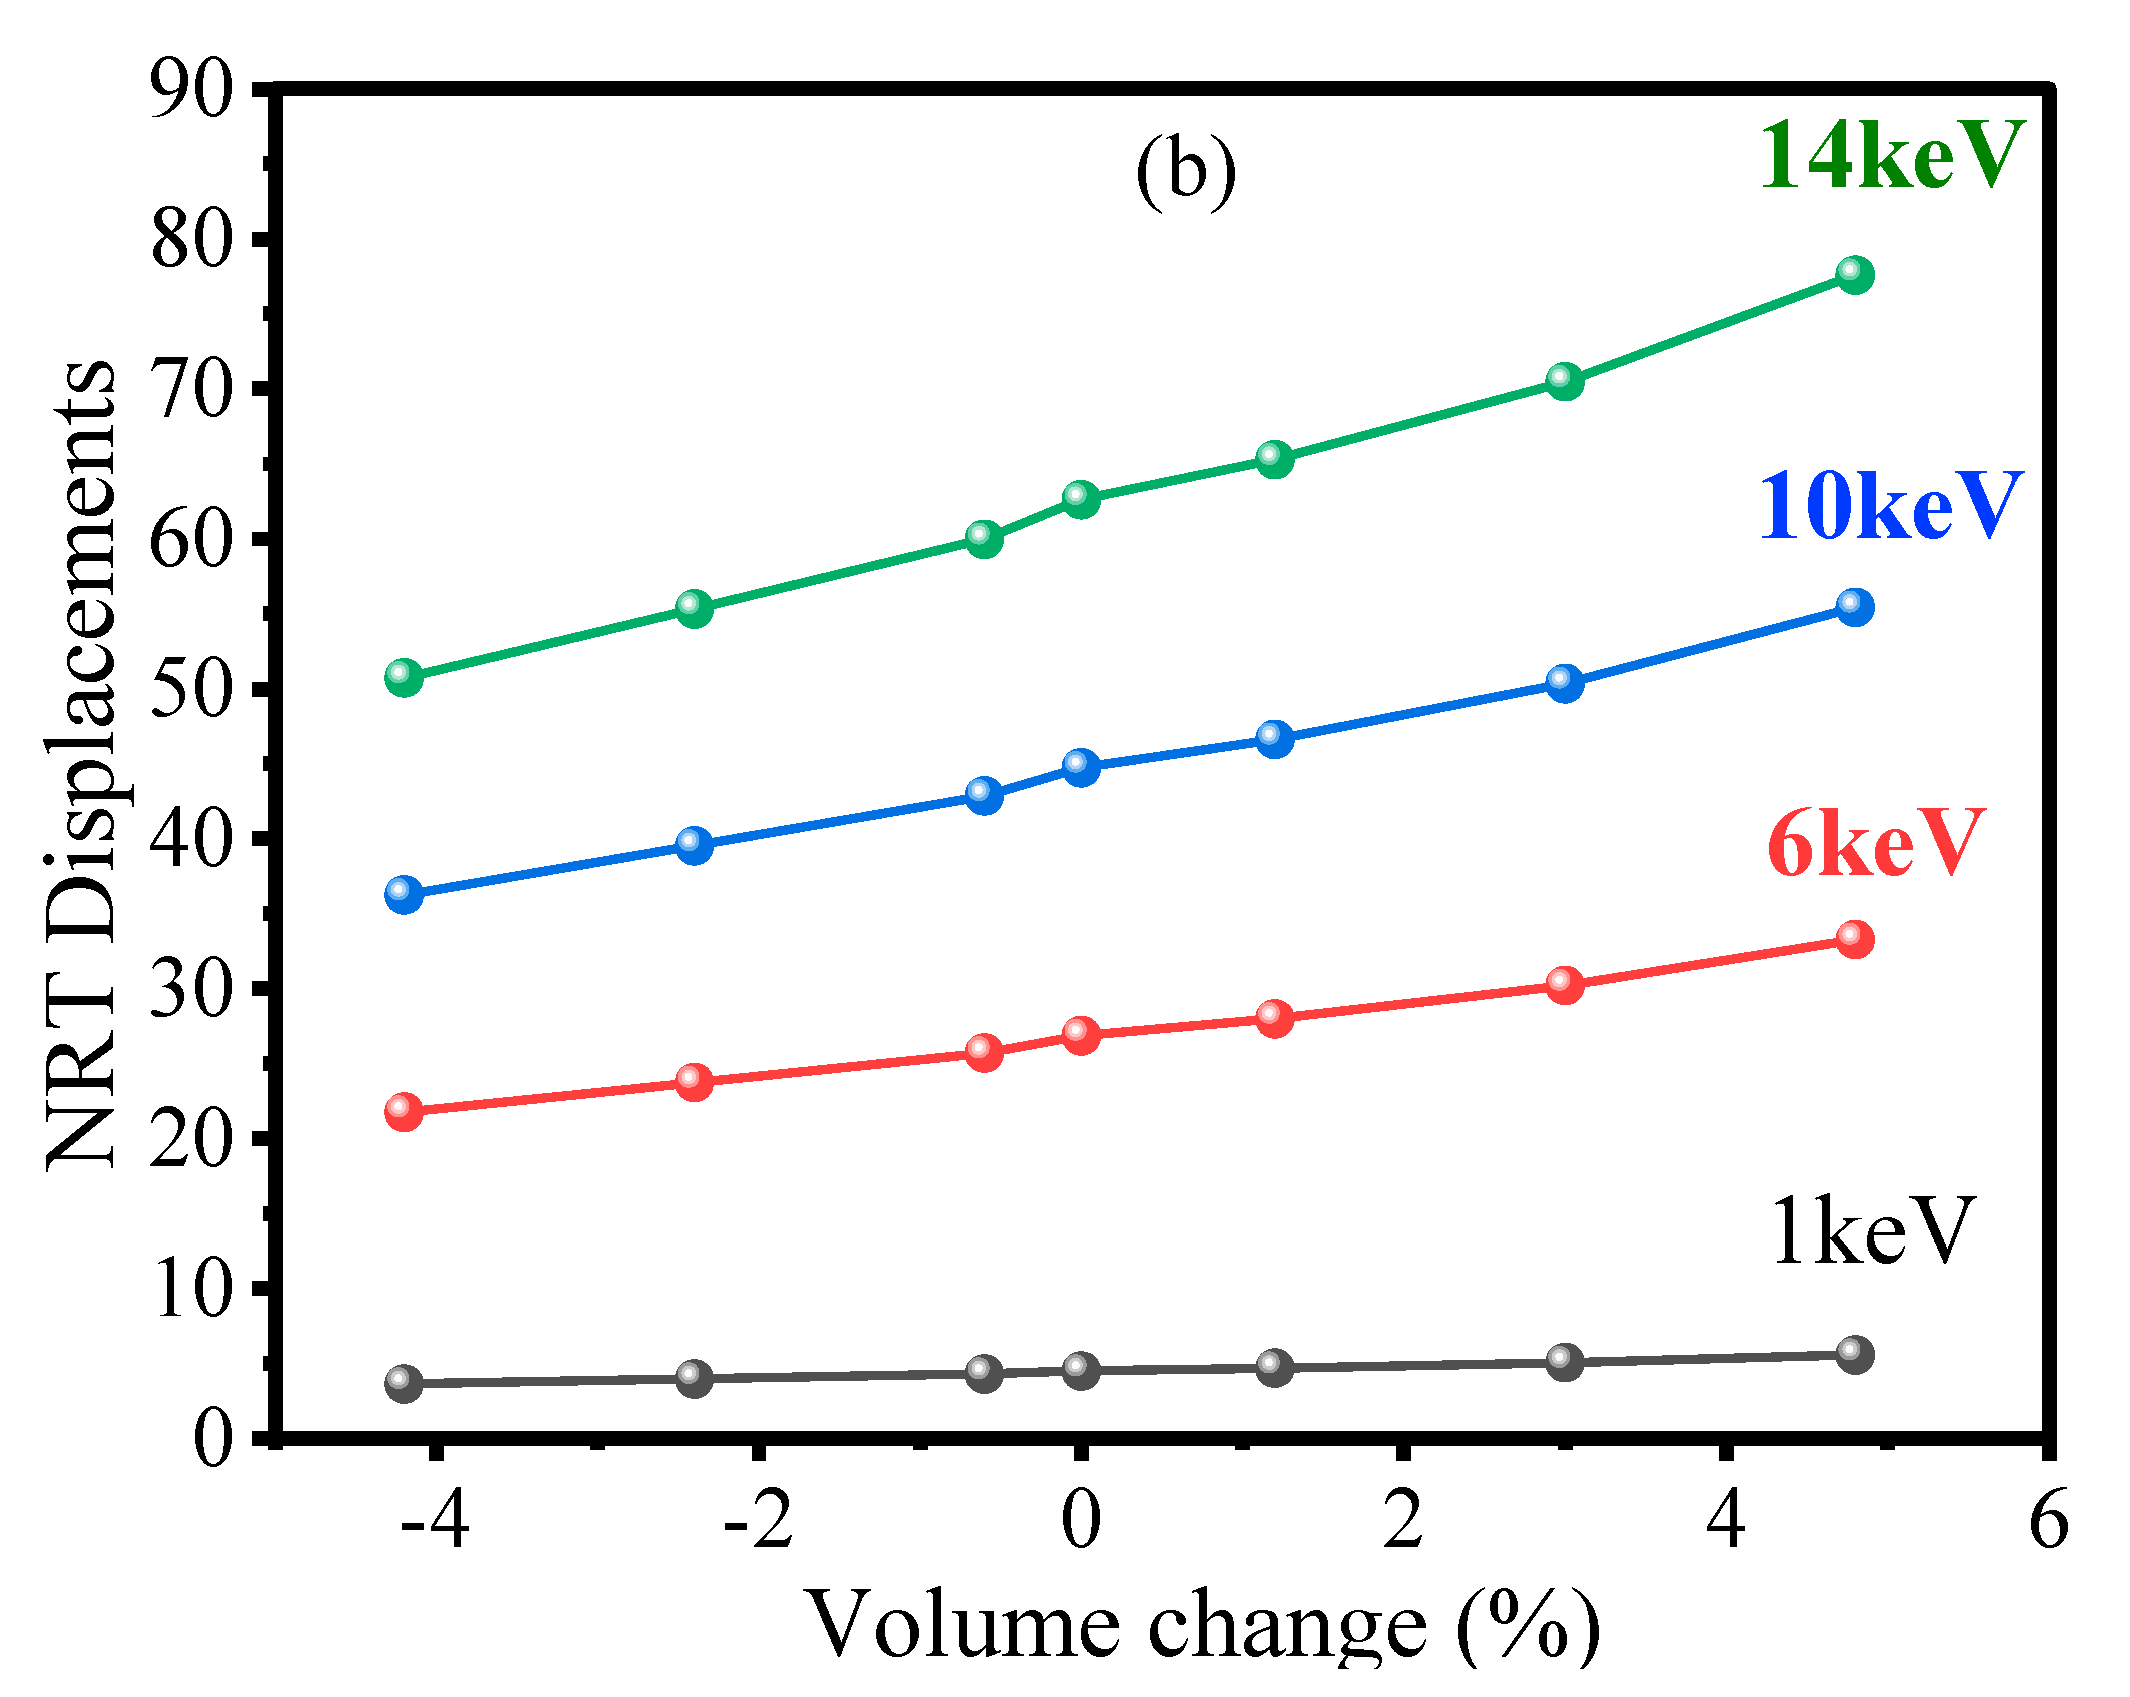
3.2.2. Extra Analysis for the Point Defects and Production Efficiency

The defect production efficiency is defined as the ratio of theoretical methods for evaluating the primary radiation damage of materials to MD results in terms of FPs counts. The defect production efficiency is denoted by the abbreviation NFP/NNRT. Figure 7a,b show the deformed NRT displacements (i.e., the number of FPs predicted by the NRT theoretical model) and the value of Ed,j(V) from our previous work [45]. The defect production efficiency for strained conditions as a function of PKA energy; defect production efficiency decreased as PKA increased for all strain conditions except for 1.6% (4.8% volume change). The defect production efficiency becomes stable or slightly increased for higher PKA energies because of the formations of IDLs [46,47]. At higher PKA energies and higher tensile strain—mainly 14 keV at 1.6%, respectively—the dislocation loop formation led to further defect generation, as clarified in Section 3.2.1; hence, the efficiency increases again.
These findings imply that tensile strain conditions, particularly with higher PKA energies, should be avoided for irradiated structures, and that if local defects and impurities accumulate in structures, the structure should be treated with caution as the source of local strain. Furthermore, our data, specifically the formation of IDLs, can be used as a comprehensive database of cascades obtained from MD for object kinetic Monte Carlo (OKMC) simulations of primary cascade damage in bulk tungsten.

4. Conclusions

Using molecular dynamic simulation, we studied the formation of interstitial dislocation loops caused by strain in tungsten. PKA energies of 1, 6, 10, and 14 keV were applied at 30 K on a volumetric strained structures (hydrostatic) of six different strain values. Our findings suggest that the number of FPs that survive, because structure deformations increase with tensile strain and decrease with compression strain. Additionally, according to the DXA analysis, the IDLs begin to cluster at higher strains of 1.0 and 1.6%, starting from 7 keV of PKA. According to the findings, strain caused a decrease in the barrier to the occurrence of IDLs and thus material degradation. Overall, the findings of this study indicate that tensile loading should be avoided in materials used in irradiation environments, whereas compression deformation could be a promising factor in the design of structural materials used in nuclear reactor applications.

Supplementary Materials

The following supporting information can be downloaded at: https://www.mdpi.com/article/10.3390/solids3020015/s1. Video S1: Video1_dir2_time60; Video S2: Video2_dir4_time60.

Author Contributions

Conceptualization, M.B.S. and M.J.B.; methodology, M.B.S. and M.J.B.; software, M.B.S. and M.J.B.; validation, M.B.S., M.P. and M.J.B.; formal analysis, M.J.B.; investigation, M.J.B.; resources, M.P., and M.J.B.; data curation, M.J.B.; writing—original draft preparation, M.B.S. and M.J.B.; writing—review and editing, M.B.S. and M.J.B.; visualization, M.P. and M.J.B.; supervision, M.J.B.; project administration, M.J.B.; funding acquisition, M.J.B. All authors have read and agreed to the published version of the manuscript.

Funding

This research received no external funding.

Institutional Review Board Statement

Not applicable.

Informed Consent Statement

Not applicable.

Data Availability Statement

The calculations in this work were carried out using LAMMPS package as implemented in Materials Square (MatSQ). The MatSQ structure’s designing tools were used in this work. (Available at: https://www.materialssquare.com/ (accessed on 6 March 2022)).

Conflicts of Interest

The authors declare no conflict of interest.

References

  1. Maisonnier, D.; Cook, I.; Pierre, S.; Lorenzo, B.; Luigi, D.P.; Luciano, G.; Prachai, N.; Aldo, P. DEMO and Fusion Power Plant Conceptual Studies in Europe. Fusion Eng. Des. 2006, 81, 1123–1130. [Google Scholar] [CrossRef]
  2. Nemoto, Y.; Hasegawa, A.; Satou, M.; Abe, K. Microstructural Development of Neutron Irradiated W-Re Alloys. J. Nucl. Mater. 2000, 283–287, 1144–1147. [Google Scholar] [CrossRef]
  3. Cottrell, G.A. Sigma Phase Formation in Irradiated Tungsten, Tantalum and Molybdenum in a Fusion Power Plant. J. Nucl. Mater. 2004, 334, 166–168. [Google Scholar] [CrossRef]
  4. López-Suárez, M.; Neri, I.; Rurali, R. Band Gap Engineering of MoS 2 upon Compression. J. Appl. Phys. 2016, 119, 165105. [Google Scholar] [CrossRef] [Green Version]
  5. Sun, M.; Ren, Q.; Wang, S.; Yu, J.; Tang, W. Electronic Properties of Janus Silicene: New Direct Band Gap Semiconductors. J. Phys. D. Appl. Phys. 2016, 49, 44. [Google Scholar] [CrossRef]
  6. Wang, S.K.; Wang, J. Spin and Valley Filter in Strain Engineered Silicene. Chinese Phys. B 2015, 24, 3. [Google Scholar] [CrossRef]
  7. Rurali, R. Colloquium: Structural, Electronic, and Transport Properties of Silicon Nanowires. Rev. Mod. Phys. 2010, 82, 427–449. [Google Scholar] [CrossRef] [Green Version]
  8. Frederiksen, T.; Brandbyge, M.; Lorente, N.; Jauho, A.P. Inelastic Scattering and Local Heating in Atomic Gold Wires. Phys. Rev. Lett. 2004, 93, 256601. [Google Scholar] [CrossRef] [Green Version]
  9. Bullough, R.; Eyre, B.L.; Perrin, R.C. The Growth and Stability of Voids in Irradiated Metals. Nucl. Appl. Technol. 1970, 9, 346–355. [Google Scholar] [CrossRef]
  10. Was, G.S. Fundamentals of Radiation Materials Science: Metals and Alloys; Springer: Heidelberg, Germany, 2016. [Google Scholar]
  11. Psakhie, S.G.; Zolnikov, K.P.; Kryzhevich, D.S.; Zheleznyakov, A.V.; Chernov, V.M. Evolution of Atomic Collision Cascades in Vanadium Crystal with Internal Structure. Crystallogr. Rep. 2009, 54, 1002. [Google Scholar] [CrossRef]
  12. Yi, X.; Jenkins, M.L.; Kirk, M.A.; Zhou, Z.; Roberts, S.G. In-Situ TEM Studies of 150 KeV W + Ion Irradiated W and W-Alloys: Damage Production and Microstructural Evolution. Acta Mater. 2016, 112, 105–120. [Google Scholar] [CrossRef] [Green Version]
  13. Yi, X.; Jenkins, M.L.; Hattar, K.; Edmondson, P.D.; Roberts, S.G. Characterisation of Radiation Damage in W and W-Based Alloys from 2MeV Self-Ion near-Bulk Implantations. Acta Mater. 2015, 92, 163–177. [Google Scholar] [CrossRef] [Green Version]
  14. Mason, D.R.; Yi, X.; Kirk, M.A.; Dudarev, S.L. Elastic Trapping of Dislocation Loops in Cascades in Ion-Irradiated Tungsten Foils. J. Phys. Condens. Matter 2014, 26, 375701. [Google Scholar] [CrossRef] [PubMed]
  15. Sand, A.E.; Dudarev, S.L.; Nordlund, K. High-Energy Collision Cascades in Tungsten: Dislocation Loops Structure and Clustering Scaling Laws. Epl 2013, 103, 4. [Google Scholar] [CrossRef] [Green Version]
  16. Fang, Z.Z.; Wang, X.; Ryu, T.; Hwang, K.S.; Sohn, H.Y. Synthesis, Sintering, and Mechanical Properties of Nanocrystalline Cemented Tungsten Carbide—A Review. Int. J. Refract. Met. Hard Mater. 2009, 27, 288–299. [Google Scholar] [CrossRef]
  17. Deb, S.K. Optical and Photoelectric Properties and Colour Centres in Thin Films of Tungsten Oxide. Philos. Mag. 1973, 27, 801–822. [Google Scholar] [CrossRef]
  18. Jansen, H.J.F.; Freeman, A.J. Total-Energy Full-Potential Linearized Augmented-Plane-Wave Method for Bulk Solids: Electronic and Structural Properties of Tungsten. Phys. Rev. B 1984, 30, 561–569. [Google Scholar] [CrossRef]
  19. Park, S.; Banisalman, M.J.; Oda, T. Characterization and Quantification of Numerical Errors in Threshold Displacement Energy Calculated by Molecular Dynamics in Bcc-Fe. Comput. Mater. Sci. 2019, 170, 109189. [Google Scholar] [CrossRef]
  20. Banisalman, M.; Oda, T. Molecular Dynamics Study for the Uniaxial Stress Effect on the Threshold Displacement Energy and Defect Formation Energies in Tungsten. In Proceedings of the KNS 2018—Transactions of the Korean Nuclear Society Spring Meeting, Jeju, Korea, 16–18 May 2018. [Google Scholar]
  21. Choi, S., II; Banisalman, M.J.; Lee, G.-G.; Kwon, J.; Yoon, E.; Kim, J.H. Using Rate Theory to Better Understand the Stress Effect of Irradiation Creep in Iron and Its Based Alloy. J. Nucl. Mater. 2020, 536, 152198. [Google Scholar] [CrossRef]
  22. Kaletta, D. The Role of Gases in Radiation Damage Patterns; Kernforschungszentrum Karlsruhe GmbH: Karlsruhe, Germany, 1979. [Google Scholar]
  23. Barrow, A.T.W.; Korinek, A.; Daymond, M.R. Evaluating Zirconium-Zirconium Hydride Interfacial Strains by Nano-Beam Electron Diffraction. J. Nucl. Mater. 2013, 432, 366–370. [Google Scholar] [CrossRef]
  24. Fu, B.Q.; Fitzgerald, S.P.; Hou, Q.; Wang, J.; Li, M. Effect of Collision Cascades on Dislocations in Tungsten: A Molecular Dynamics Study. Nucl. Instruments Methods Phys. Res. Sect. B Beam Interact. with Mater. Atoms 2017, 393, 169–173. [Google Scholar] [CrossRef]
  25. Boev, A.O.; Zolnikov, K.P.; Nelasov, I.V.; Lipnitskii, A.G. Effect of Titanium on the Primary Radiation Damage and Swelling of Vanadium-Titanium Alloys. Lett. Mater. 2018, 8, 263–267. [Google Scholar] [CrossRef]
  26. Zhong, Y.; Nordlund, K.; Ghaly, M.; Averback, R. Defect Production in Tungsten: A Comparison between Field-Ion Microscopy and Molecular-Dynamics Simulations. Phys. Rev. B Condens. Matter Mater. Phys. 1998, 58, 2361–2364. [Google Scholar] [CrossRef] [Green Version]
  27. Plimpton, S. Fast Parallel Algorithms for Short-Range Molecular Dynamics. J. Comput. Phys. 1995, 117, 1–19. [Google Scholar] [CrossRef] [Green Version]
  28. Virtual Lab. Inc. January 01 Materials Square (2017). Available online: https://www.materialssquare.com/ (accessed on 6 March 2022).
  29. Daw, M.S.; Baskes, M.I. Embedded-Atom Method: Derivation and Application to Impurities, Surfaces, and Other Defects in Metals. Phys. Rev. B 1984, 29, 6443–6453. [Google Scholar] [CrossRef] [Green Version]
  30. Derlet, P.M.; Nguyen-Manh, D.; Dudarev, S.L. Multiscale Modeling of Crowdion and Vacancy Defects in Body-Centered-Cubic Transition Metals. Phys. Rev. B Condens. Matter Mater. Phys. 2007, 76, 54107. [Google Scholar] [CrossRef] [Green Version]
  31. Nordlund, K.; Dudarev, S. Modelling Radiation Effects Using the Ab-initio Based Tungs Potentials. Nucl. Instr. Meth. B 2010, 267, 3204. [Google Scholar]
  32. Byggmästar, J.; Granberg, F.; Nordlund, K. Effects of the Short-Range Repulsive Potential on Cascade Damage in Iron. J. Nucl. Mater. 2018, 508, 530–539. [Google Scholar] [CrossRef]
  33. Norgett, M.J.; Robinson, M.T.; Torrens, I.M. A Proposed Method of Calculating Displacement Dose Rates. Nucl. Eng. Des. 1975, 33, 50–54. [Google Scholar] [CrossRef]
  34. Salman, M.B.; Kilic, M.E.; Banisalman, M.J. Formation of Interstitial Dislocation Loops by Irradiation in Alpha-Iron under Strain: A Molecular Dynamics Study. Crystals 2021, 11, 317. [Google Scholar] [CrossRef]
  35. Rycroft, C.H. VORO++: A Three-Dimensional Voronoi Cell Library in C++. ChaosInterdiscip. J. Nonlinear Sci. 2009, 19, 041111. [Google Scholar] [CrossRef] [PubMed] [Green Version]
  36. Wechsler, M.S.; Lin, C.; Sommer, W.F.; Daemen, L.U.L.; Feguson, P.D. Standard Practice for Neutron Radiation Damage Simulation by Charged-Particle Irradiation, E 521–96. Annu. B. ASTM Stand. 1996, 12.02, 1. [Google Scholar]
  37. Banisalman, M.J.; Park, S.; Oda, T. Evaluation of the Threshold Displacement Energy in Tungsten by Molecular Dynamics Calculations. J. Nucl. Mater. 2017, 495, 277–284. [Google Scholar] [CrossRef]
  38. Alexander, K.C.; Schuh, C.A. Visualization and Analysis of Atomistic Simulation Data with OVITO—The Open Visualization Tool. Model. Simul. Inmater. Sci. Eng. 2010, 18, 7. [Google Scholar] [CrossRef]
  39. Stukowski, A.; Bulatov, V.V.; Arsenlis, A. Automated Identification and Indexing of Dislocations in Crystal Interfaces. Model. Simul. Mater. Sci. Eng. 2012, 20, 5007. [Google Scholar] [CrossRef]
  40. Wang, D.; Gao, N.; Wang, Z.G.; Gao, X.; He, W.H.; Cui, M.H.; Pang, L.L.; Zhu, Y.B. Effect of Strain Field on Displacement Cascade in Tungsten Studied by Molecular Dynamics Simulation. Nucl. Instrum. Methods Phys. Res. Sect. B Beam Interact. with Mater. Atoms 2016, 384, 68–75. [Google Scholar] [CrossRef]
  41. Calder, A.F.; Bacon, D.J.; Barashev, A.V.; Osetsky, Y.N. On the Origin of Large Interstitial Clusters in Displacement Cascades. Philos. Mag. 2010, 90, 863–884. [Google Scholar] [CrossRef]
  42. Setyawan, W.; Nandipati, G.; Roche, K.J.; Heinisch, H.L.; Wirth, B.D.; Kurtz, R.J. Displacement Cascades and Defects Annealing in Tungsten, Part I: Defect Database from Molecular Dynamics Simulations. J. Nucl. Mater. 2015, 462, 329–337. [Google Scholar] [CrossRef] [Green Version]
  43. Miyashiro, S.; Fujita, S.; Okita, T. MD Simulations to Evaluate the Influence of Applied Normal Stress or Deformation on Defect Production Rate and Size Distribution of Clusters in Cascade Process for Pure Cu. J. Nucl. Mater. 2011, 415, 1–4. [Google Scholar] [CrossRef]
  44. Chen, Y.; Li, Y.H.; Gao, N.; Zhou, H.B.; Hu, W.; Lu, G.H.; Gao, F.; Deng, H. New Interatomic Potentials of W, Re and W-Re Alloy for Radiation Defects. J. Nucl. Mater. 2018, 502, 141–153. [Google Scholar] [CrossRef]
  45. Banisalman, M.J.; Oda, T. Atomistic Simulation for Strain Effects on Threshold Displacement Energies in Refractory Metals. Comput. Mater. Sci. 2019, 158, 346–352. [Google Scholar] [CrossRef]
  46. Stoller, R.E. Evaluation of Neutron Energy Spectrum Effects and RPV Thru-Wall Attenuation Based on Molecular Dynamics Cascade Simulations. Nucl. Eng. Des. 2000, 195, 129–136. [Google Scholar] [CrossRef] [Green Version]
  47. Miyashiro, S.; Fujita, S.; Okita, T.; Okuda, H. MD Simulations to Evaluate Effects of Applied Tensile Strain on Irradiation-Induced Defect Production at Various PKA Energies. Fusion Eng. Des. 2012, 87, 1352–1355. [Google Scholar] [CrossRef]
Figure 1. The number of Frankel pairs (FPs) produced during the collision cascades of (a) 10 keV and (b) 14 keV PKA for strain resulted in volume changes ranging from −4.2 to 4.8%. Each point represents the average of four distinct directions and four distinct timings, i.e., sixteen distinct samples.
Solids 03 00015 g001
Figure 2. The number of Frenkel pairs that survive when different recoil directions of the 14 keV PKA are subjected to different levels of strain.
Solids 03 00015 g002
Figure 3. (a) Estimated peak number of FPs for various PKA energies as a function of applied hydrostatic strain (b) number of survived defects after 20~30 ps, the pink region is the region where IDLs were found to occur.
Solids 03 00015 g003
Figure 4. (a) The probability of IDLs formation for various strain levels and PKA energies. The probability is the number of IDLs that occurred across the 16 different simulation sets. There were two types of dislocations formed, which were either ½ <111> or <100>. The graphs depict the impacts of two strain values of 1.6% and 1.0%, respectively. (b) IDL formation energy for different number of SIAs. The results of 1/2<111> and <100> IDL are shown with green and pink, respectively.
Solids 03 00015 g004
Figure 5. Snapshots of the FPs evolution and IDLs creation at various displacement directions. The simulation event approached by using the 14 keV of PKA and 1.6% of strain within 20 ps of time. Red atoms represent the site of vacancies; blue atoms represent the SIA; green loops represent ½<111> dislocation, i.e., IDL1; and pink loops represent the <100> dislocation, i.e., IDL2. The defect mesh is represented by the grey foam surrounding the atoms (like any other surface mesh). The grey arrows represent the dislocations’ Burger vectors.
Solids 03 00015 g005
Figure 6. The 10 SIA defect and IDL (10 SIA) cluster formation energy as a function of the different strain levels.
Solids 03 00015 g006
Figure 7. (a) Number of surviving Frenkel pairs for various PKA energies versus applied and hydrostatic strain from NRT model applications VNRT = 0.8 × Epka/2 Ed,j(∆V) [45]. (b) The defects production efficiency which is defined as the ratio between MD and NRT result for defects calculation.
Solids 03 00015 g007aSolids 03 00015 g007b
Table 1. Details of each cell deformation and calculation conditions for a representative applied strain, where ∆ corresponds to the increments from the strains applied along with the X, Y, and Z axes, respectively.
Strain TypeCell ConstantsVol. Change
Rate
x Axisy Axisz Axis
Hydrostaticx0 (1 + ∆)y0 (1 + ∆)z0 (1 + ∆)~3∆
Table 2. Simulation settings for collision cascades.
PKA Energy (keV)Number of
Atoms in the System
Number of
Simulations Set
NRT
Displacements
Evolution Time (ps)
154,00016520
6182,250162820
10432,000164730
14432,000166230
Publisher’s Note: MDPI stays neutral with regard to jurisdictional claims in published maps and institutional affiliations.

