Article

Experimental Investigations of Effective Thermal Conductivity of the Selected Examples of Steel Porous Charge

by
Rafał Wyczółkowski
Department of Production Management, Czestochowa University of Technology, Armii Krajowej 19, 42-200 Czestochowa, Poland
Solids 2021, 2(4), 420-436; https://doi.org/10.3390/solids2040027
Submission received: 17 November 2021 / Revised: 7 December 2021 / Accepted: 8 December 2021 / Published: 16 December 2021
(This article belongs to the Special Issue Solids in Europe)

Abstract

:
In many cases of heat treatment of steel products, the heated charge has a porous structure. The examples of such charges include bundles of long steel components e.g., bars. The basic thermal property of the charge in this form is effective thermal conductivity kef. This paper presents the results of experimental examinations of effective thermal conductivity of the porous charge, which is composed from various types of steel long components. Due to the specific nature of the samples, a special measurement stand was constructed based on the design of a guarded hot plate apparatus. The measurements were performed for sixteen different samples across a temperature range of 70–640 °C. The porosity of the samples, depending on the type of components used, ranged from 0.03 to 0.85. Depending on these factors, the effective thermal conductivity ranged from 1.75 to 8.19 W·m−1·K−1. This accounts for 0.03 to 0.25 of the value of thermal conductivity of the solid phase of the charge, which in the described cases was low-carbon steel. It was found that the effective thermal conductivity rises linearly with temperature. The intensity of this increase and the value of coefficient kef depend on the transverse dimension of the components that form the charge. The results may represent the basis for the validation of various models of effective thermal conductivity with respect to the evaluation of thermal properties of the porous charge.

1. Introduction

Steel continues to be the most widely used material in engineering. The main advantage of steel is its wide range of mechanical properties, such as moderate 200–300 MPa yield strength with excellent ductility and yield stress of over 1400 MPa and fracture toughness of up to 100 MPa·m−2 [1]. This accessibility of steel properties over such a wide range is obtained mainly through heat treatment. The use of precisely controlled steel heating and cooling operations with consideration for the chemical composition of the material allows obtaining the most desired mechanical properties. The heat treatment effects are induced by microstructural changes due to solid-state phase transformation. This means that the heat treatment processes have a direct influence on the quality of steel products. These heat treatments are also essential for the entire manufacturing process, since they have a significant impact on energy consumption, production efficiency, and emission of pollution. For these reasons, the manufacturers of steel need to optimize the heat treatment processes. In modern technological lines, this is achieved by automatic systems where furnaces are operated based on the use of appropriate numerical models [2,3,4,5]. One of the key input data for such models are the thermophysical properties of the heated elements. When solid components such as billets or slabs are heated, the basic property of the charge is the thermal conductivity of steel kst [6,7]. The value of this parameter depends on the steel chemical composition, its crystal structure, and its temperature. The data on the thermal conductivity of the most popular carbon and alloy steels are generally available in the literature [1,8,9,10]. However, in many cases, the heat-treated charge is not solid. Such situations can be met in the heat treatment of the charge in the form of coils or bundles. Coils are used to heat sheets and wires, while bundles are popular in heating various types of long components i.e., bars, tubes, rectangular sections, and shapes [11,12,13]. These types of charge are two-phase structures consisting of a steel skeleton and the gas-filled voids. Due to a discrete form of the solid phase, coils and bundles are considered to be a granular porous charge [14]. Typical examples of the steel porous charge used in industrial practice are shown in Figure 1.
With a granular structure of the porous charge, its thermophysical properties are quite different in comparison to the solid charge. The basic thermal property of the porous charge is effective thermal conductivity kef. This quantity is commonly used in the theory of porous media [15]. The value of kef coefficient is a function of complex heat transfer mechanisms related to conduction, contact conduction, free convection, and radiation, which occur within the space of the porous medium. Many different models of the effective thermal conductivity have been developed over the past several decades [16,17,18,19]. These models are very diverse and determine the value of kef based on several parameters and divided into primary and secondary parameters [20]. Primary parameters include porosity φ and thermal conductivities of the solid phase ks and gas phase kg. Secondary parameters include thermal contact resistance, heat transfer by radiation, the Knudsen effect, and quantities, which describe the geometric configuration of the medium, the most common being the mean diameter of particles or pores. Despite this diversity, only one model relates directly to the porous charge. It has been developed to determine the radial effective thermal conductivity of steel coils annealed in bell-type hydrogen furnaces [21,22,23]. Furthermore, no experimental studies have analyzed this area of research. Experimental tests of heat transfer in metallic porous media relates mostly to steel and aluminum foams [24,25] or metallic thermal protection systems [26].
This paper presents measurements of effective thermal conductivity of various types of steel porous charge over a temperature range of 70–640 °C. For this purpose, a special measurement stand was constructed. Samples of porous charge made of various types of long steel components were tested. On the one hand, the results provide direct information on the effective thermal conductivity of the steel porous charge. Furthermore, the data presented can be used to verify different models of effective thermal conductivity.

2. Materials and Methods

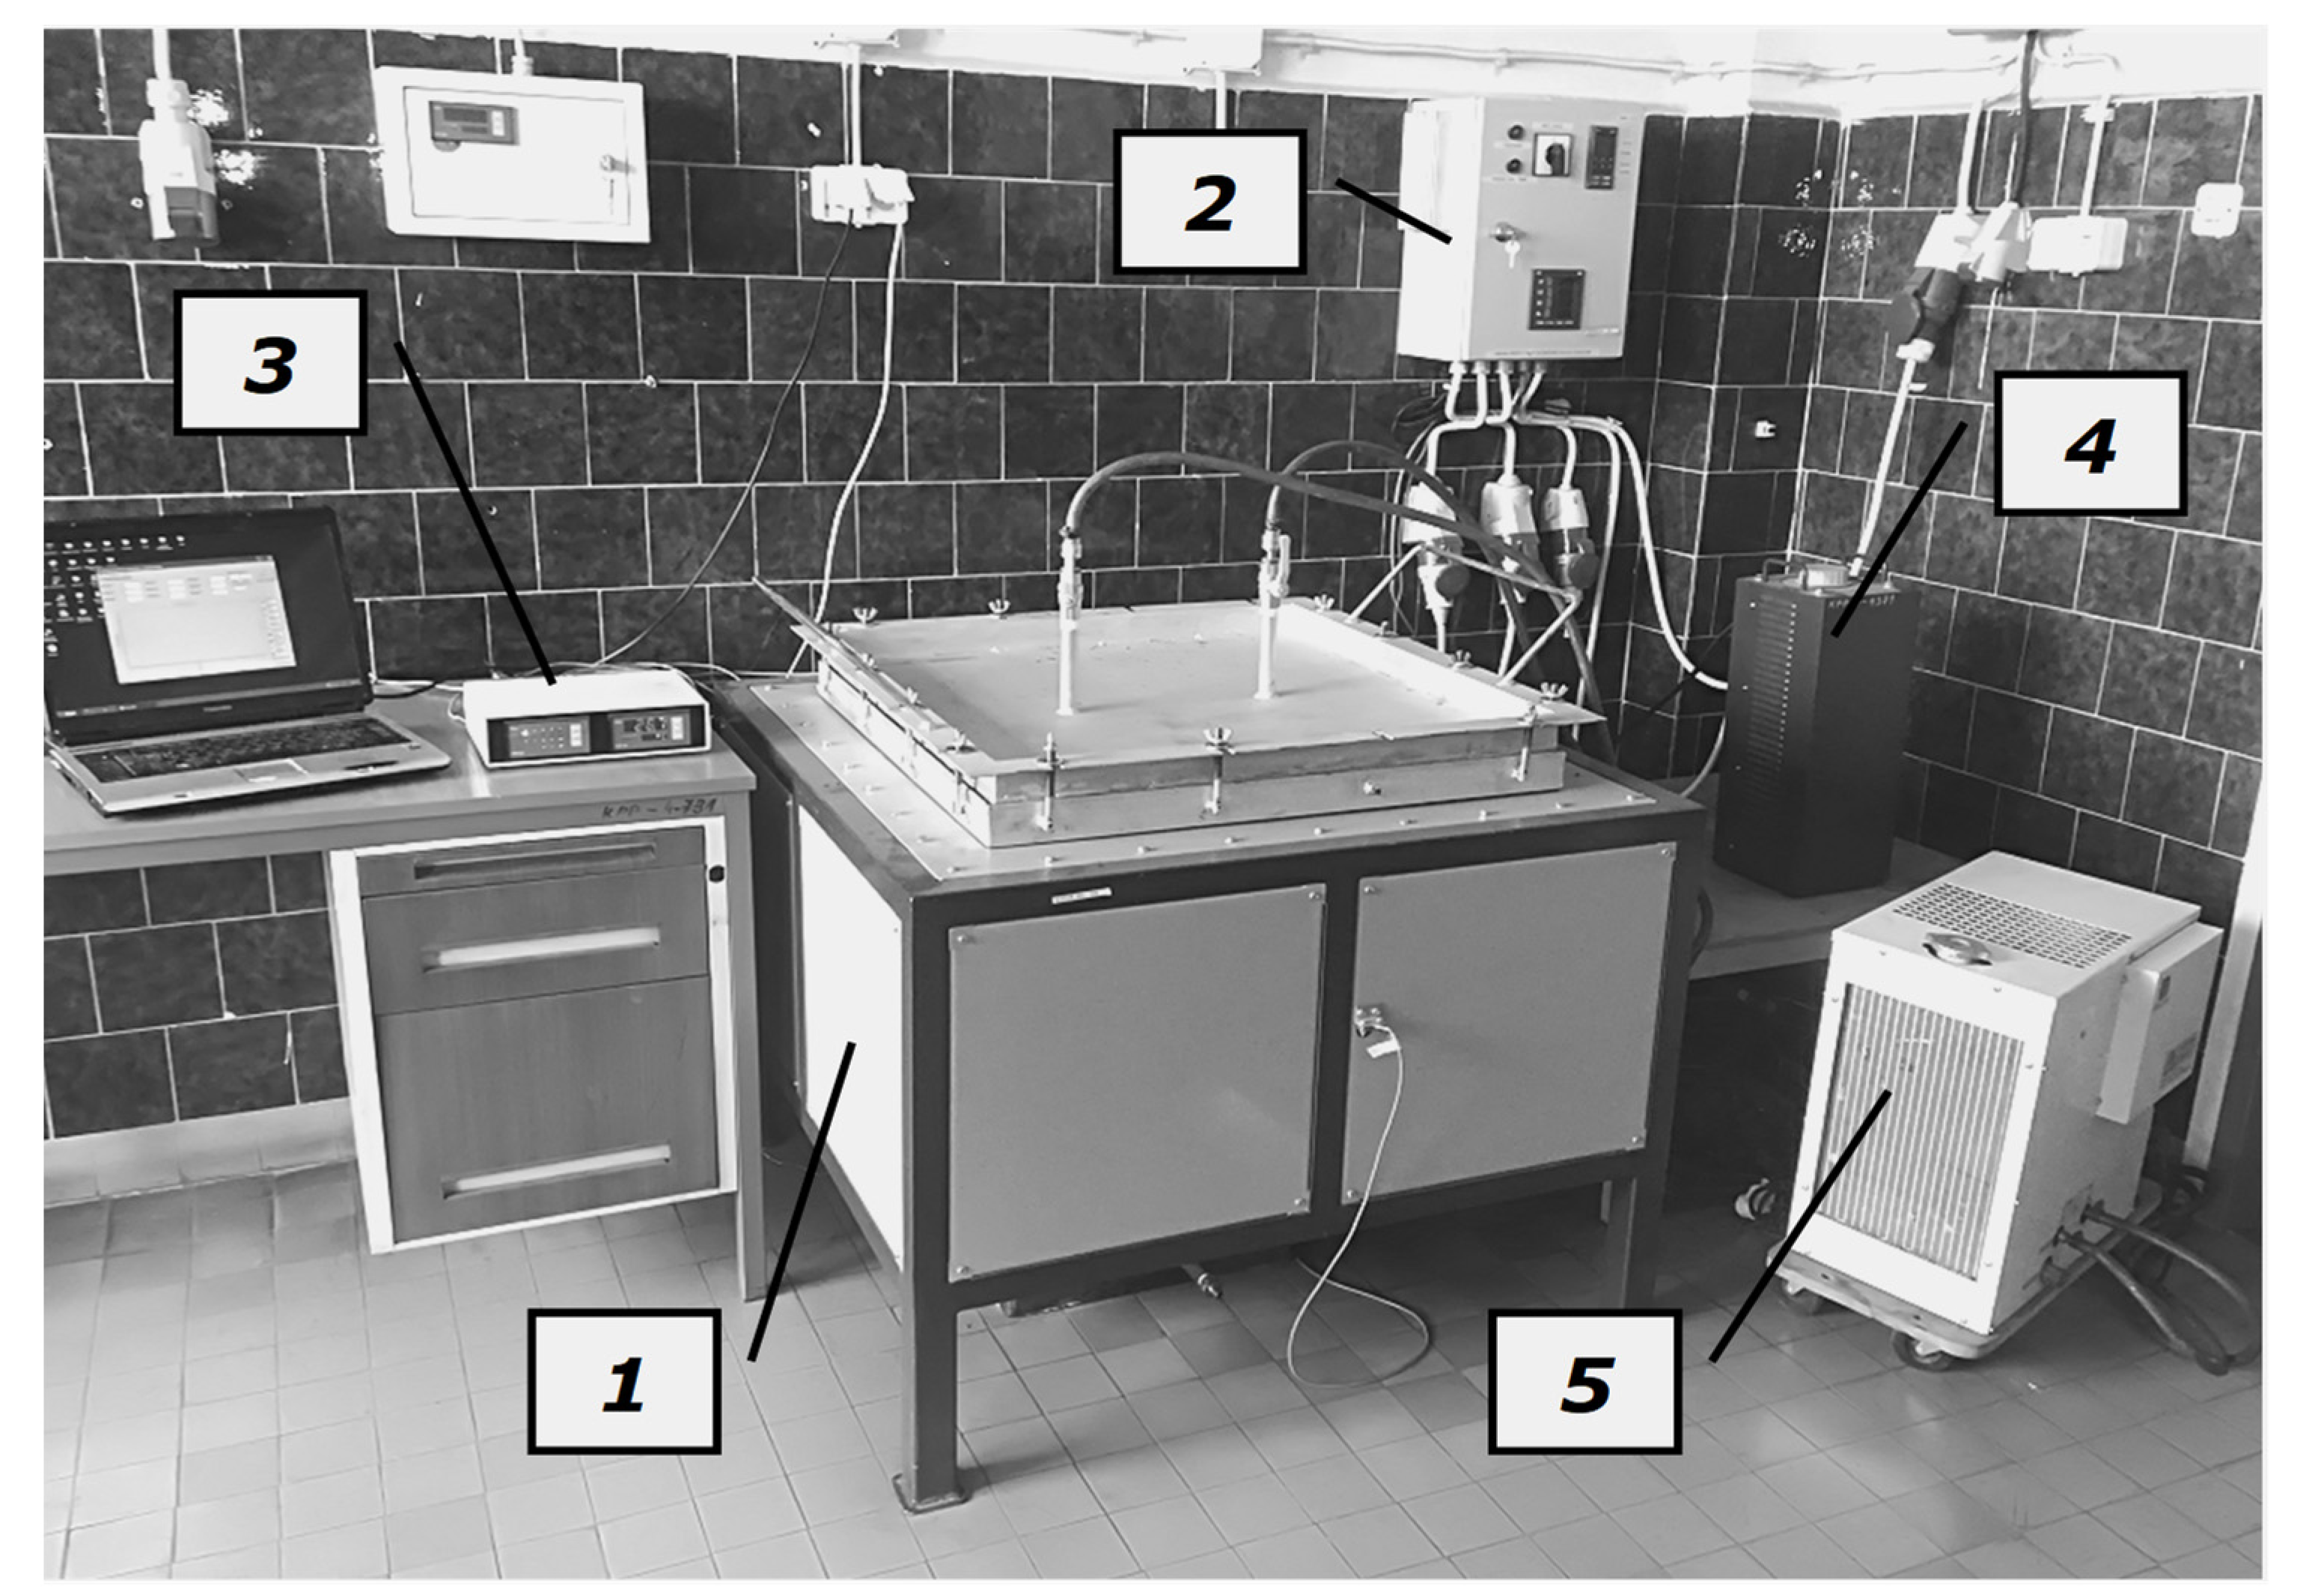
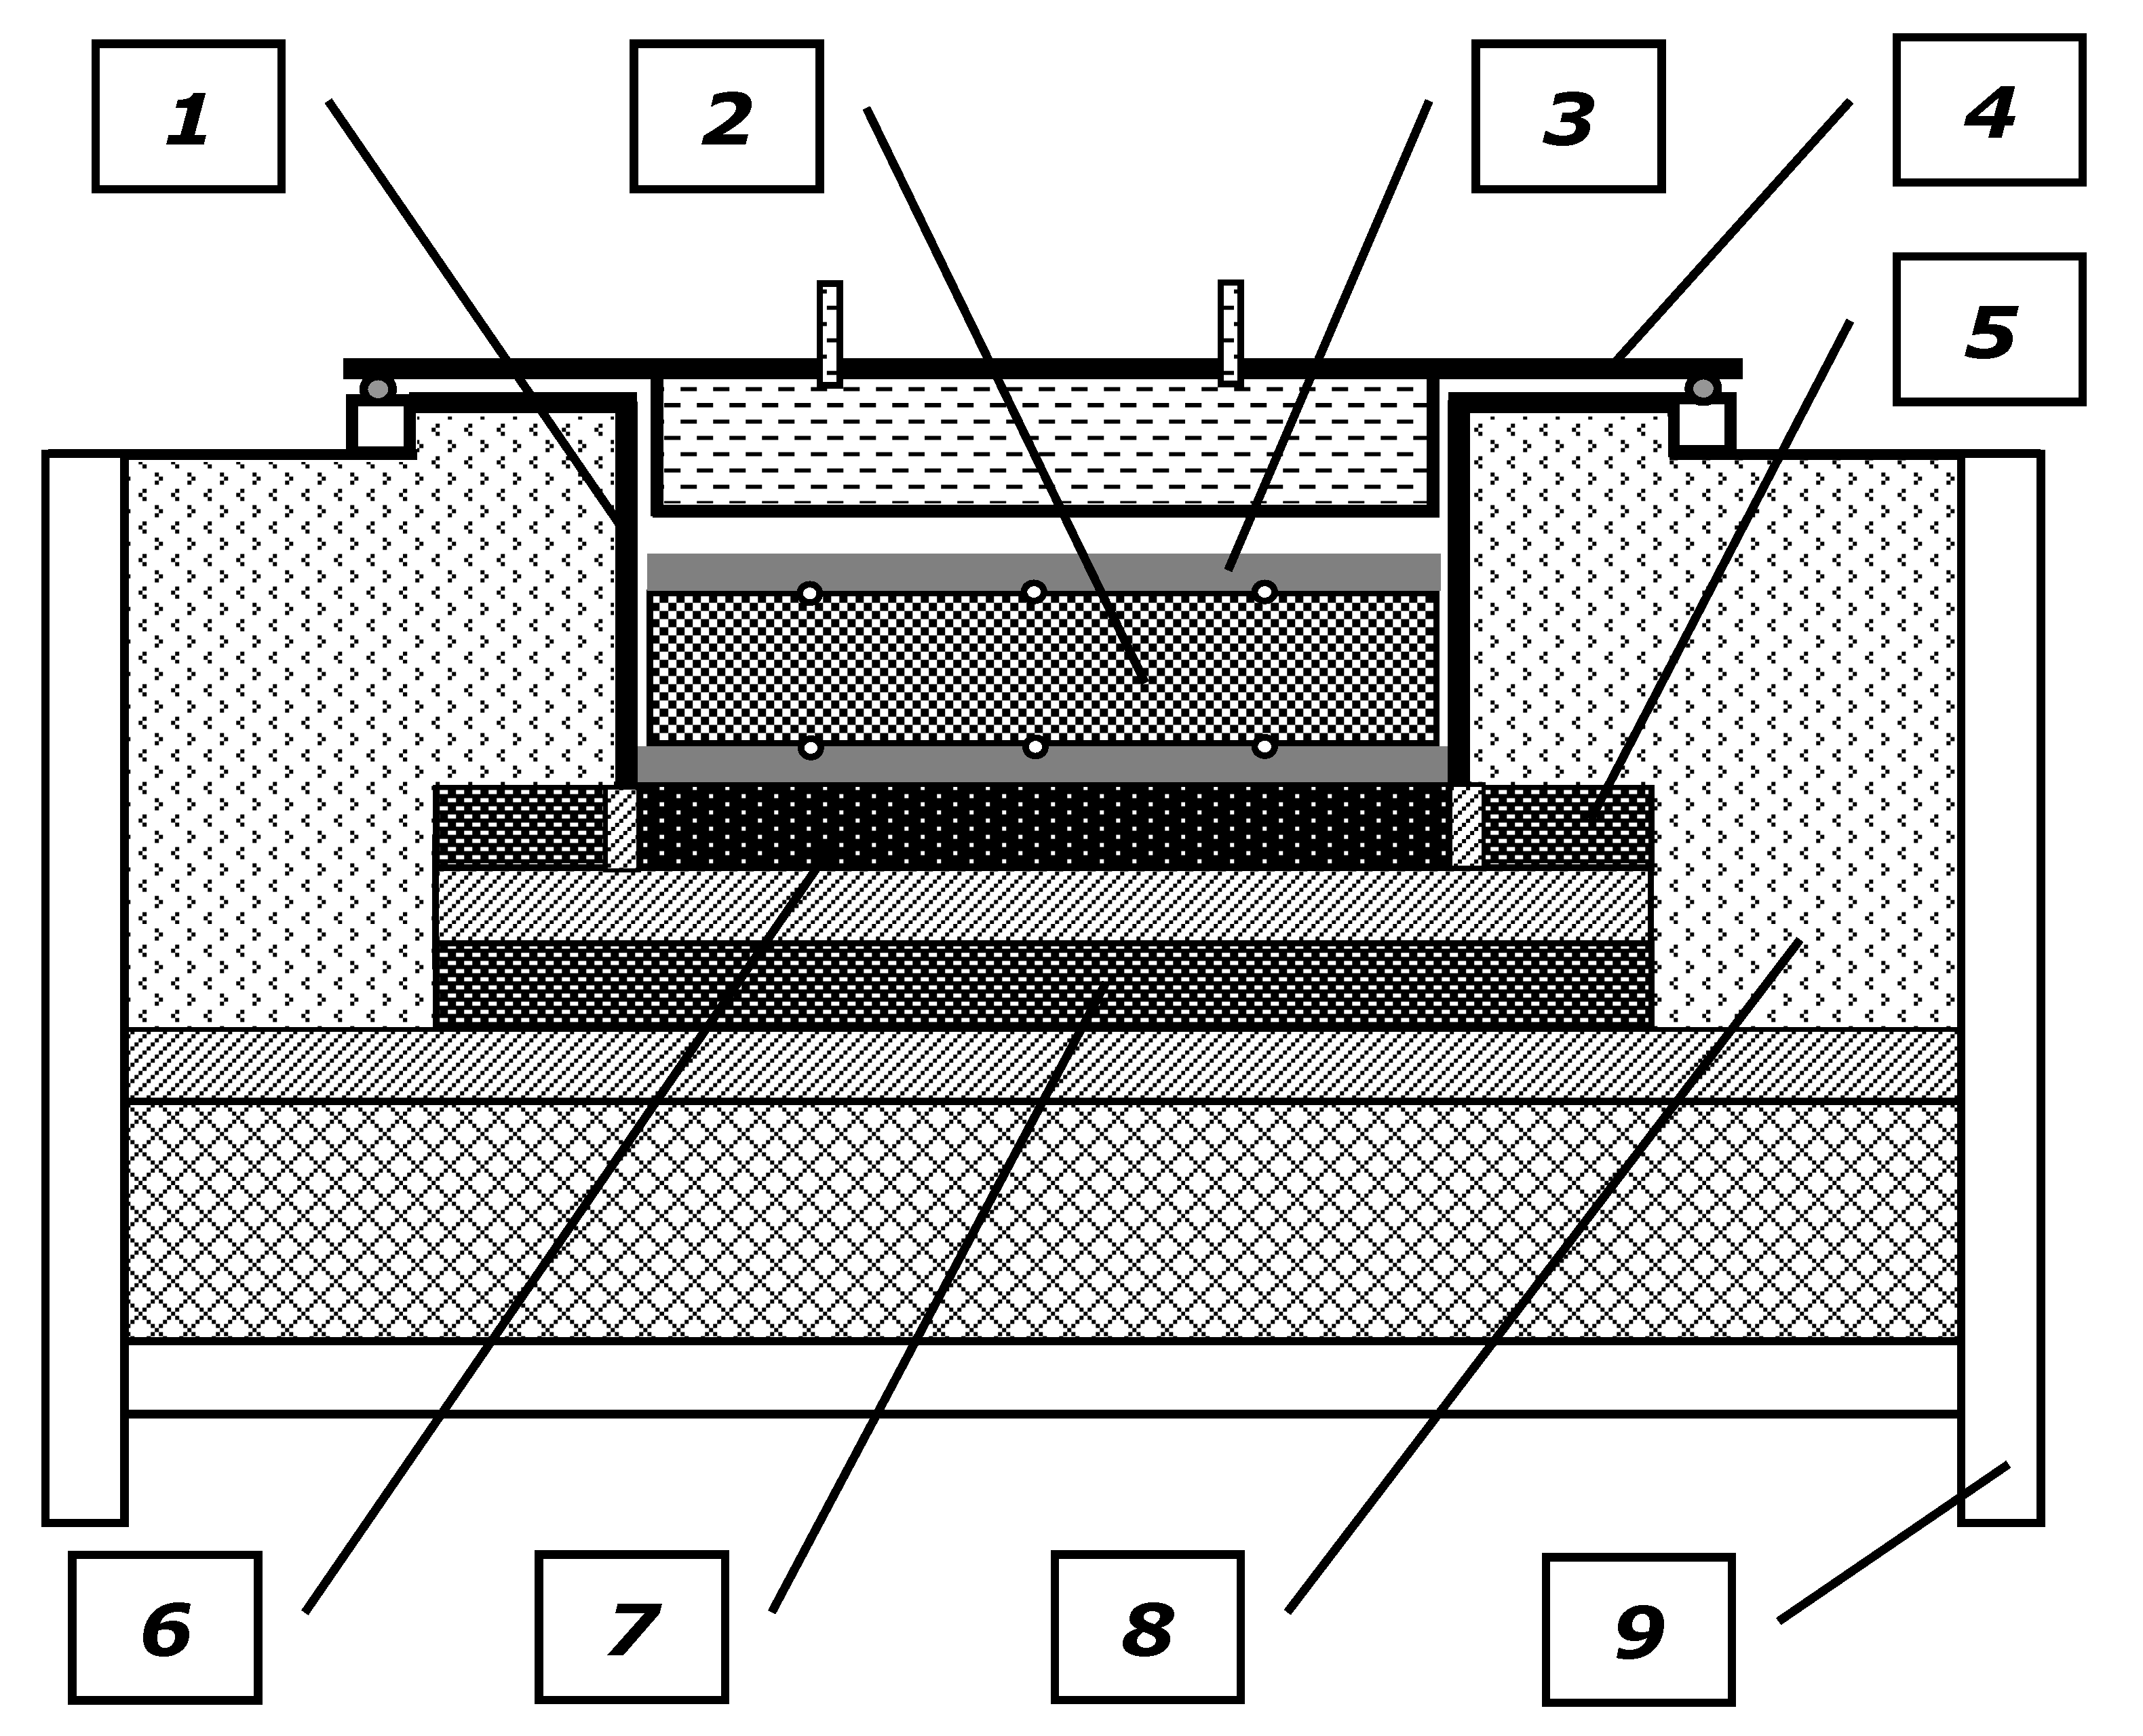
2.1. Experimental Setup

The measurements were performed using the method consisting in steady-state heat flow through flat samples. Such measurements are the most reliable source of data on effective thermal conductivity [27,28,29]. During the test, sample surfaces perpendicular to the heat flow direction are in contact with adjoining parallel boundaries (i.e., hot and cold plates) maintained at a constant temperature. This method was selected for two reasons. Firstly, this technique does not require any additional thermal properties such as heat capacity or mass density that are necessary in the case of transient test methods. Secondly, this method is recommended for materials with relatively low thermal conductivity. A custom experimental stand based on the guarded hot plate apparatus design was used for the measurement, as recommended by the ASTM standards [30,31]. The effective thermal conductivity, which has been determined by using this method, is derived from Fourier’s law of thermal (Equation (1)) [9]:
k e f = q L Δ t ,
where q—heat flux flowing through the sample, L—sample dimension in the direction of heat flow, Δt—temperature difference in the sample along dimension L.
A general view of the test stand is shown in Figure 2. It consists of the following components: heating chamber, sample temperature measurement system, control system of main heater power supply, control system of guarded heaters, and a cooling system. The main component of this stand is the heating chamber. Its task is to produce a uniform, unidirectional, and steady heat flux through the tested samples. The adopted conditions of heat transfer within the sample are obtained through a specific design of this device, which is schematically shown in Figure 3. Samples of the tested charge are placed on the bottom of a rectangular retort, with internal dimensions of the base of 400 × 400 mm and a height of 200 mm and made from 4 mm boiler plate. From the top, the retort end has a flange with a cover fixed with bolts. There is a main heater under the retort, with the same dimensions of 400 × 400 mm. The heat generated in the heater is totally transferred to the test sample. Fulfilling this condition is ensured by two guarded heaters (side and bottom). The external dimensions of the guarded heaters are 600 × 600 mm. All the heaters are in the form of plates made of refractory concrete with a thickness of 35 mm with resistant coils powered with a three-phase current. The power of the main heater during the examinations can adjusted manually by means of an autotransformer. This allows for control of the value of mean measurement temperature. Furthermore, the power of current supplied to the guarded heaters is adjusted automatically by a special control system. The values of power are adjusted so that the signals from thermocouples for temperature measurement on the opposite surfaces of the main heater and guarded heaters have the same values. After reaching this condition, there is no heat flow between the heaters, which means that the entire heat generated in the main heater flows toward the investigated sample. In order to additionally limit the undesired heat loss from the lateral surfaces of the heaters and the retort, the heating chamber was isolated by means of the ceramic fabric.
During the tests in the guarded hot plate apparatus, the surfaces of the sample are in contact with the main heater and cooler, respectively. This solution was not used in the discussed test stand. If the cooler was in direct contact with the upper surface of the examined samples, its effect would limit the temperature range used in the study. The aim of the examinations was to determine the effective thermal conductivity for the biggest possible temperature range. The water cooler was used, but it was installed in the chamber covers and consequently moved from the sample surface. With this solution, its effect forced a one-dimensional heat flow. However, it did not significantly contribute to cooling the samples.
Due to the relatively high temperature range, an important problem during the study was to limit the oxidation of the surfaces of the steel components from which the specimens were made. This was managed by ensuring the retort tightness; plus, there was a seal between the heating chamber cover and the retort flange. Furthermore, the cover was fixed by means of sixteen bolts distributed evenly over its surface area.
According to (1), the examinations of effective thermal conductivity required measurement of the temperature difference on the sample surfaces and the related heat flux. The temperature measurements were carried out by employing 0.5 mm K-type sheltered thermocouples TP-201 [32] connected to the multi-channel data logger equipped with an EMT 200 temperature meter characterized by a resolution of 0.1 °C [33]. Temperatures on the hot surface (lower) ti−h and cold surface (top) ti−c were measured in five opposite points. One point was located in the geometrical center of the surface, whereas four other points were in the corners of the square with the side of 260 mm, and its center was overlapped with the sample center. The thermocouples that were used to measure the temperature at the lower surface of the sample were fixed to the bottom of the retort that acted as a hot plate. Furthermore, the thermocouples used for the temperature measurement on the upper surface of the sample were fixed to the steel plate that covered the sample. Due to the cooler shift, this plate performed the role of the cold plate. Its thickness was 15 mm with transverse dimensions of 390 × 390 mm. In order to determine the value of the coefficient kef, after measurement of the temperature in the described ten points, mean temperatures were determined for each surface i.e., thot (Equation (2)) and tcold (Equation (3)), and difference in temperature Δt along sample high (dimension L) (Equation (4)) and mean measurement temperature tm (Equation (5)):
t h o t = t 1 h + t 2 h + t 3 h + t 4 h + t 5 h 5 ,
t c o l d = t 1 c + t 2 c + t 3 c + t 4 c + t 5 c 5 ,
Δ t = t h o t t c o l d ,
t m = 0.5 ( t h o t + t c o l d ) .
Heat flux q was evaluated as a quotient of the heat flux rate Q generated in the main heater and its surface area A. The value of Q was assumed as equal to the power P supplied to this heater. Such an approach is possible because electric resistance heaters are typically 100% efficient, which means that all of the electrical energy used is converted into heat [34]. The current power P was measured using a three-phase electronic wattmeter Lumel N14 [35].

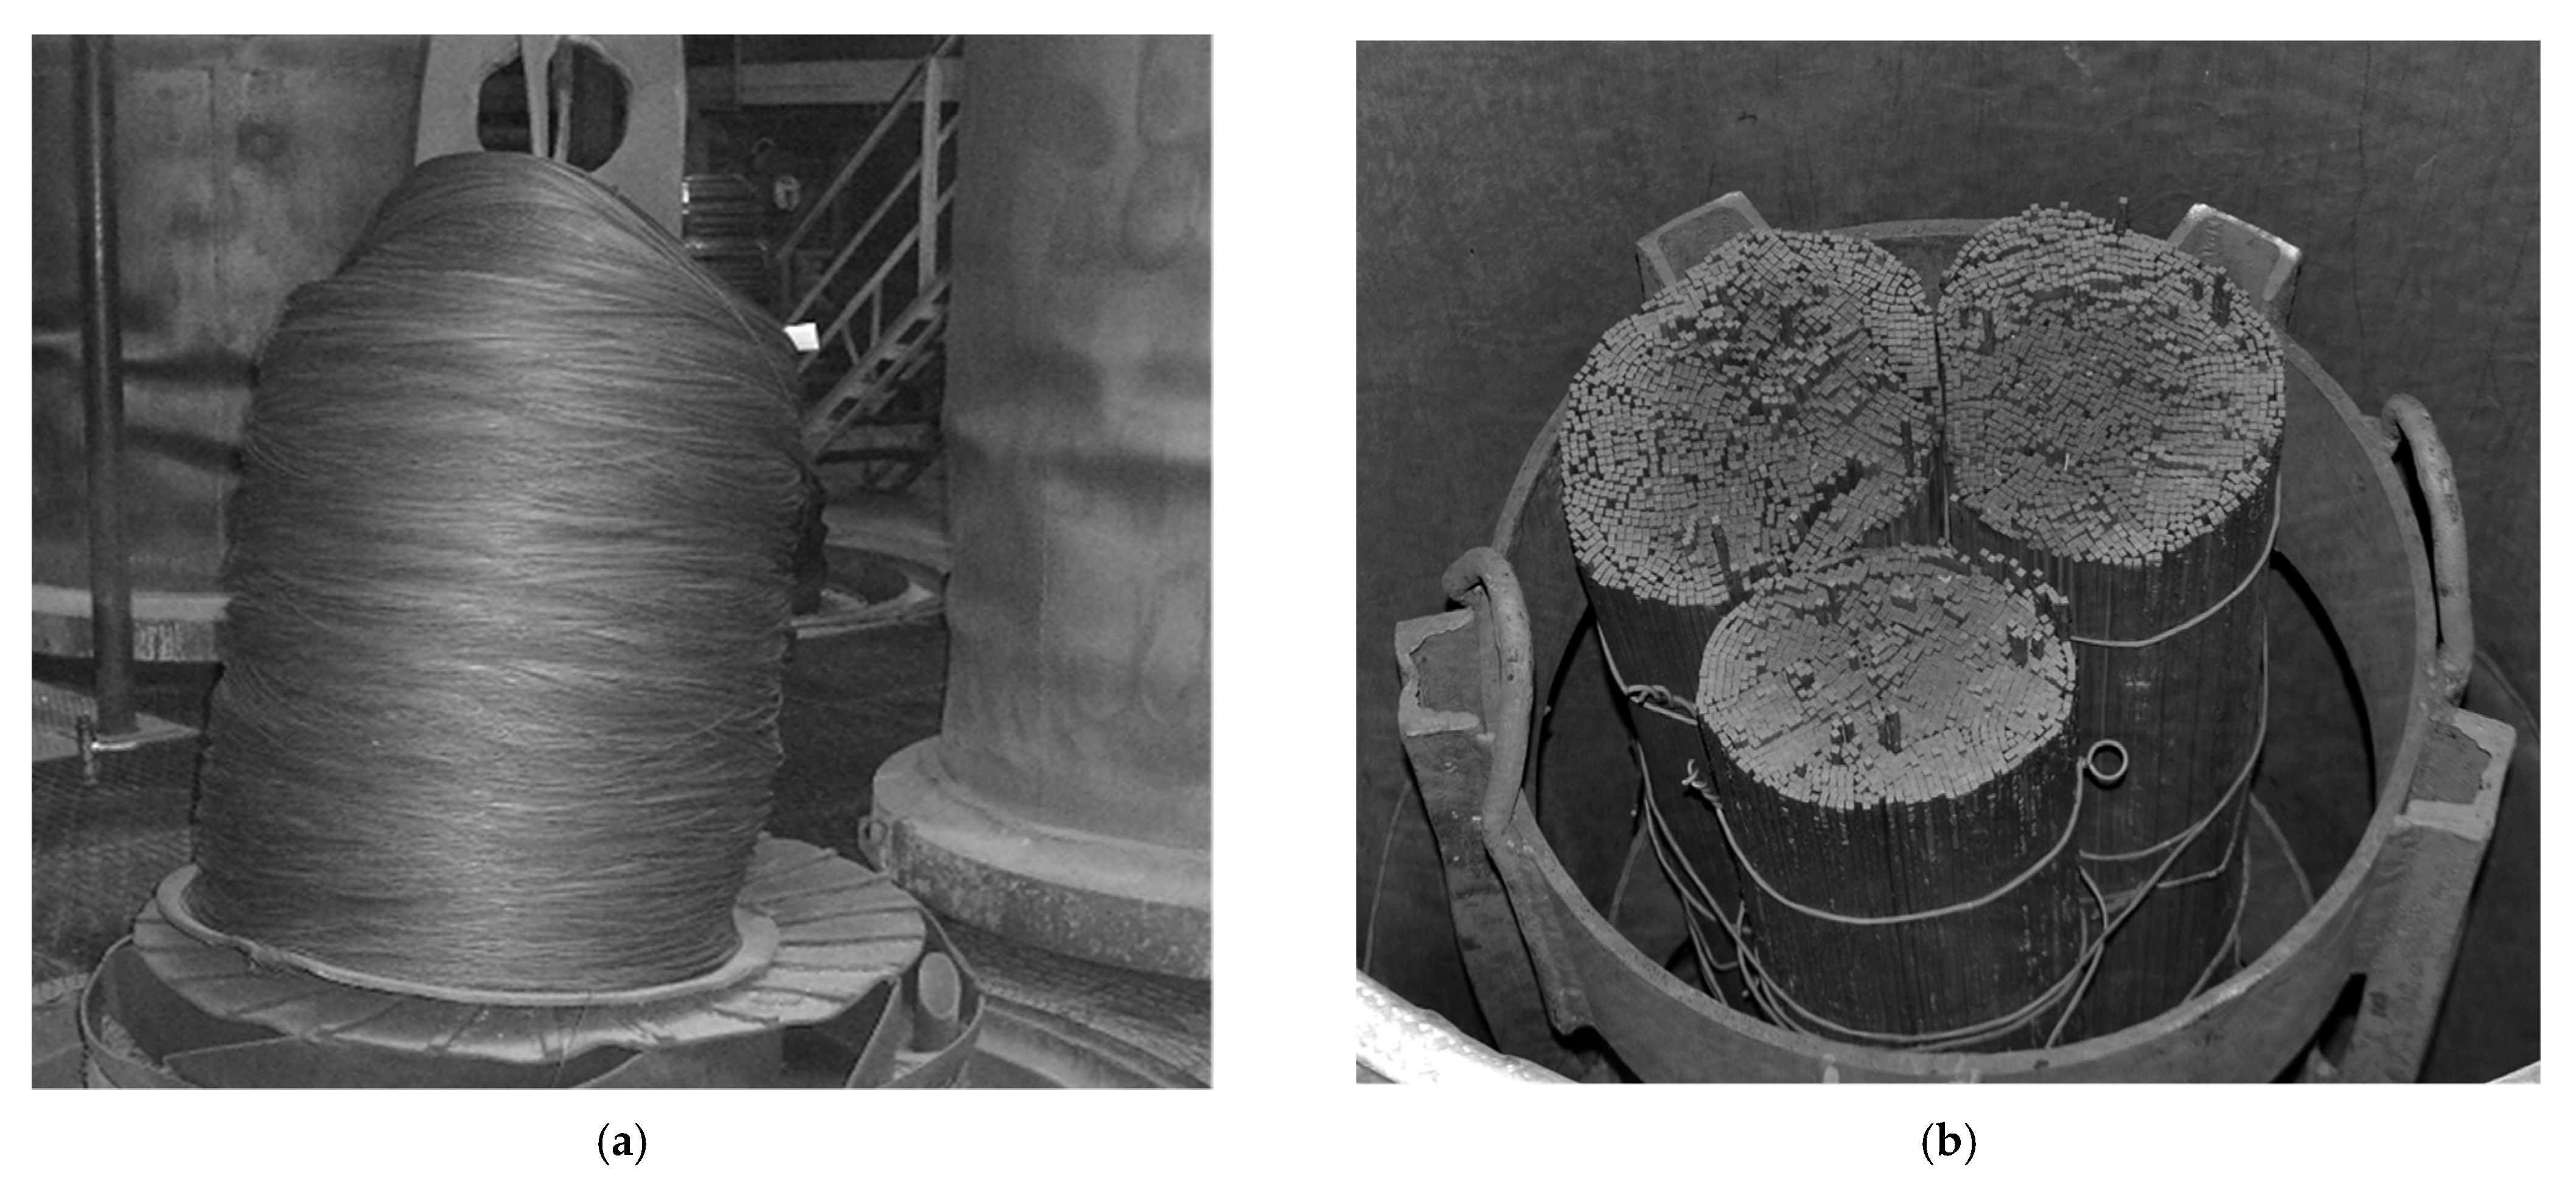
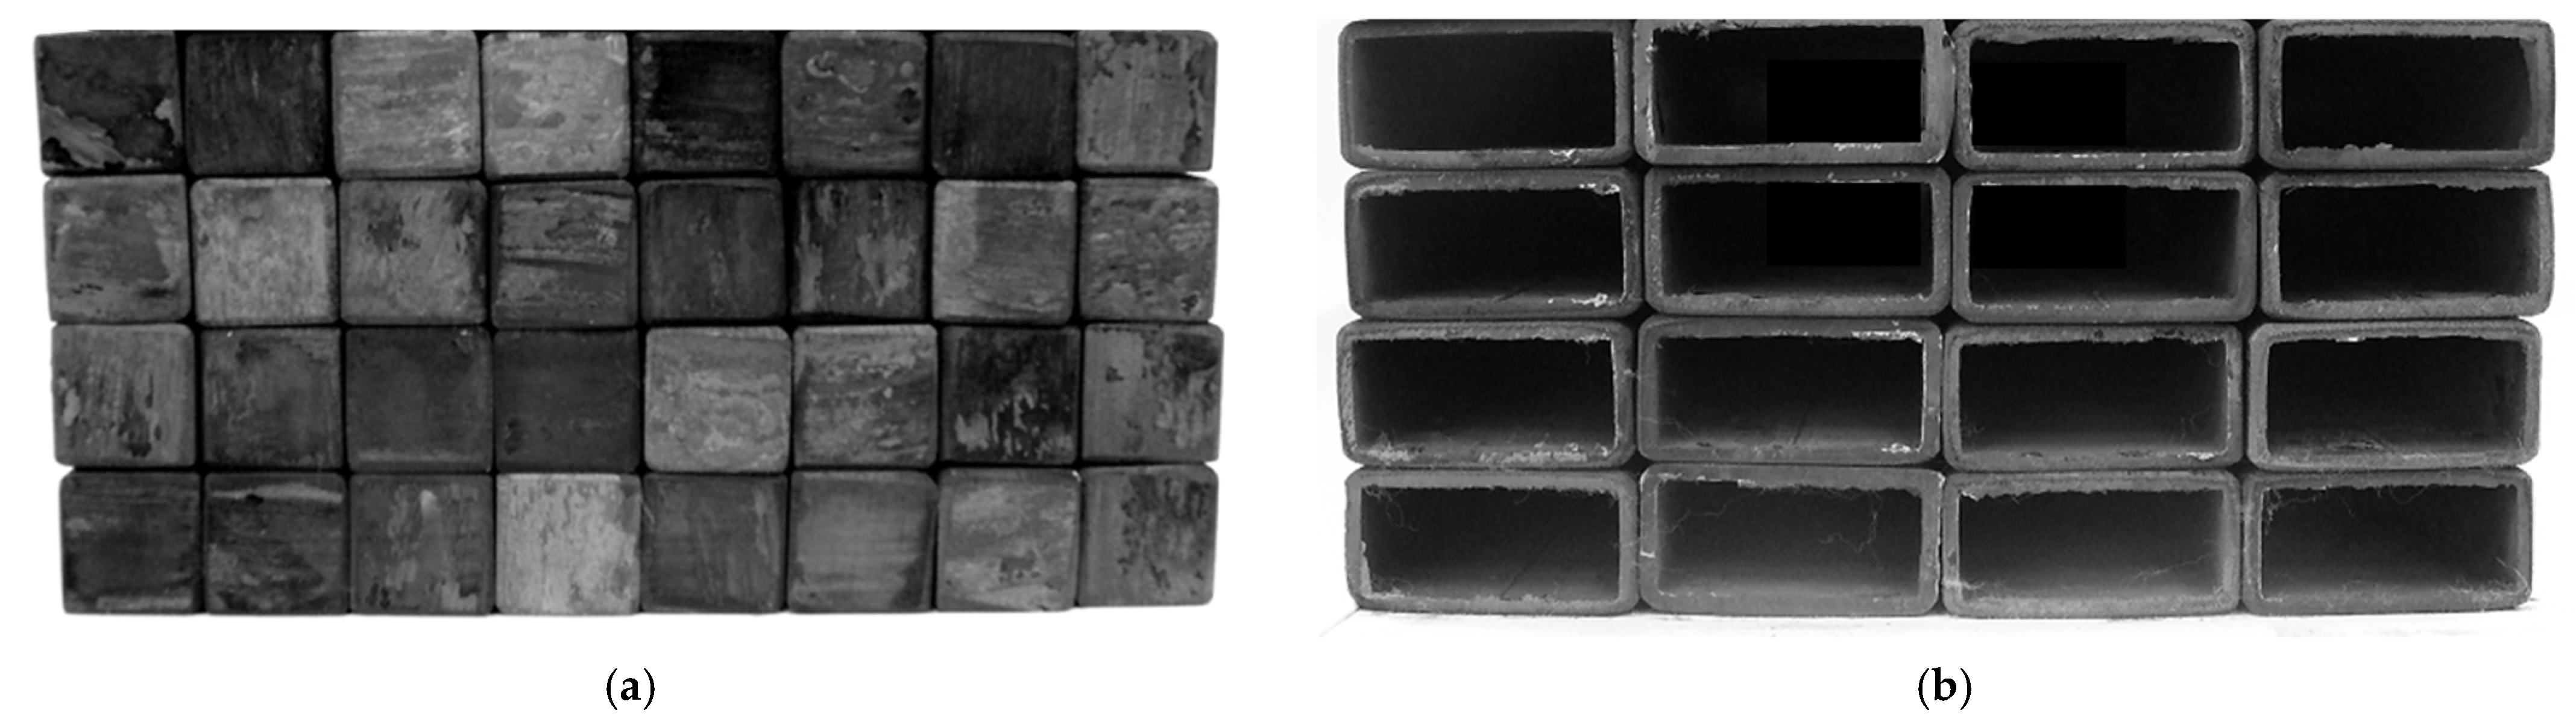
2.2. Investigated Samples

The samples of porous charge were in the form of the flat beds composed of specific types of long steel elements. Depending on the type of the components used, the obtained charge is characterized by various contributions and values of porosity. For example, the charge composed of bars has porosities of external type. The value of this parameter depends only on the charge packing. In contrast, the charge composed of pipes or sections, which are hollow components, is described by mixed porosity (internal and external). External porosity for the specific type of components can be changed since it depends on the charge packing. Internal porosity is constant and results from the geometry of the components. For thin-walled components, the value of internal porosity exceeds 0.85 [14]. Figure 4 shows the pictorial pictures of the samples made of square bars and rectangular sections. The samples also represent the examples of the charge with external and mixed porosity. Transverse dimensions of the samples were similar to the internal dimensions of the retort. In order to allow for free arrangement of the samples, all the components were of 390 mm in length. The gaps between the side walls of the retort and sample surfaces were filled with the ceramic felt with thickness of 2 mm. Depending on the number of layers, type and dimensions of the components, and their arrangement, the sample height ranged from 60 to 120 mm.
The samples were obtained using the following components: round and square bars: 10, 20, 30 mm, flat bars: 5 × 20 and 10 × 40 mm, and rectangular and square sections: 20 × 40, 40 × 40, and 60 × 60 mm. In total, 16 samples were examined, including 6 made of round bars, 3 made of square bars, 4 made of flat bars, and 3 made of sections. All the components used for the examinations were made of S 235JRH steel grade (with a maximum carbon content of 0.2%) [36].
The examinations for the samples of round bars were performed for two arrangements: staggered and in-line, as illustrated in Figure 5. These samples differ in the conditions of contact between individual layers of bars and porosity. In the staggered samples, each bar is in contact with two bars from the adjacent layers. In the in-line samples, only one contact is observed between the bars from the individual layers. The porosity of these samples at maximal packing is 0.09 and 0.21, respectively. With consideration for the above factors, one can expect that staggered beds should be characterized by a higher value of coefficient kef.
Two different arrangements were also used for the samples made of flat bars, as illustrated in Figure 6. The samples with this arrangement were termed parallel and mixed. Only the in-line arrangement was used in the case of the samples made of square bars and rectangular sections.

2.3. Measurement Procedure

The testing procedure was composed of the following steps. After fixing the thermocouples to the hot plate surface, the sample was placed inside the retort. Next, the sample was covered by the cold plate with other thermocouples fixed on its surface. After these operations and the verification of correctness of the operation of all the thermocouples, the retort was tightly closed by carefully fixing the cover with the bolts. The next step involved turning on the heating system of the test station and setting the power of the main heater to its the initial value. The cooling system was also started. According to the adopted method, the measurements of the temperature on the sample surface were made after obtaining the steady state in the sample. Next, a new value of the main heater power was set, and the measurement was postponed until it had reached a steady state. The measurements for each sample were taken using eleven adjustments of the power supply P. This procedure allowed for the determination of changes in the value of coefficient kef in possibly the widest range of temperature. The value of the parameter P was changed from 200 to 3200 W, which corresponded to the change in mean temperature of the samples of 70–640 °C. The upper temperature of the examination was limited by the maximal temperature of the main heater. The heater was automatically switched off by the control system after it achieved a temperature of 900 °C. This temperature was reached at a power adjustment of 3400 W.

2.4. Measurement Uncertainty

The uncertainty of the measured effective thermal conductivity was estimated from error propagation equation (Equation (6)) [37]:
δ k e f k e f = ( ( δ P P ) 2 + ( δ A A ) 2 + ( δ L L ) 2 + ( δ Δ t Δ t ) 2 ) 0.5 .
According to the information contained in the technical specification of the wattmeter Lumel N14, the uncertainty of the measurement of power of the main heater P is 2% [35]. The surface of the main heater A was set based on the measurement of the length of its sides. This measurement was made with an accuracy of 1 mm, which, for the surface A, yielded uncertainty of 0.4%. The measurement of the sample length L was made by means of the caliper with an accuracy of 0.5 mm. With consideration of the sample height, the maximal uncertainty of this measurement was 0.8%. According to the manufacturer’s data, the measurement of the temperature by means of the system used was characterized by the uncertainty of 0.5 °C [33]. Consequently, the maximum uncertainty of the measurement of temperature difference Δt at the sample height was 4%. With consideration for measurement uncertainty for individual values, the maximum uncertainty of measurement of effective thermal conductivity in the discussed stand is 4.6%.

3. Results and Discussion

The results of measurements of effective thermal conductivity of the samples are presented versus mean temperature. The results lead to two basic conclusions. Firstly, the effective thermal conductivity of the porous charge is greater for larger dimensions of the components. This property results from the fact that increasing of the components’ dimensions leads to a reduced number of layers on a specific section along the direction of heat flux. Since the highest thermal resistance is on the boundaries between the layers, the following observation has been made: the conditions of heat flow in a specific medium improve with the reduction of the layers per unit length. The second conclusion is that effective thermal conductivity (except in one case) increases with temperature. This is caused by the phenomenon of thermal radiation between the surfaces of the adjacent components. The intensity of this process is nearly proportional to the third power of the mean absolute temperature of the surfaces that exchanges heat [16,38,39].
Figure 7 and Figure 8 relate to round bar samples with staggered and in line arrangement, respectively. Values of the studied parameter range from 1.75 to 6.27 W·m−1·K−1 for the staggered arrangement and from 1.64 to 6.03 W·m−1·K−1 for the in-line arrangement. The percentage increase in the coefficient kef caused by the change in the arrangement and averaged for the entire temperature range was, depending on the bar diameter, 4% for 10 mm bars, 13% for 20 mm bars, and 10% for the 30 mm bars. These results support the previously proposed presumption that the effective thermal conductivity of the bar bed depends on the arrangement. The greater the contact area between the adjacent bars in the sample, the greater the value of kef.
Figure 9 contains the results obtained for the samples of square bars. The values of the coefficient kef range from 2.69 to 8.19 W·m−1·K−1. These are the highest values of kef obtained among all the examined types of charge. The result can be considered as obvious, since the charge is characterized by the lowest porosity (0.03). The porosity of these samples results from narrow gaps between individual bars, which are caused by errors in the shapes of these components. Furthermore, compared to round bar beds, the contact area is greater, which reduces the resistance of thermal contact conductance between individual layers.
Figure 10 presents the results obtained for the samples of flat bars. The porosity of these samples is approximately 0.05. The range of effective thermal conductivity of these samples is 1.96–5.32 W·m−1·K−1. As can be seen, the arrangement of bars has an effect on the value of kef in this case as well. Higher values were obtained for mixed samples. The percentage increase in kef averaged for the entire temperature range between mixed and parallel samples was 19% for 5 × 20 mm bars and 42% for 10 × 40 mm bars. This shows that the effective thermal conductivity of the porous charge made of components with varied transverse dimensions depends significantly on the orientation of these components with the direction of heat flow.
Figure 11 presents the results obtained for the last type of the samples, i.e., section beds. Compared to the previously discussed samples, these samples are characterized by a substantially greater porosity, which is reflected by the internal porosity. The external porosity of these samples is similar to the porosity of the samples of square bars and is ca. 0.03. The internal porosity for 20 × 40 mm (wall thickness of 2 mm) and 40 × 40 mm sections (wall thickness of 3 mm) is 0.72. For the 60 × 60 mm sections (wall thickness of 3 mm), the internal porosity is 0.81. This means that the total porosity of these samples is ca. 0.75 and 0.85. However, this did not contribute to any substantial reduction in the effective thermal conductivity of this charge. The values obtained for these samples were from 3.63 to 6.31 W·m−1·K−1. This means that the range similar to previous cases. Interestingly, for the sample of 20 × 40 mm sections, the value of kef did not increase with temperature, ranging from 3.63 to 3.85 W·m−1·K−1 at a mean value of 3.73 W·m−1·K−1. For the samples of 40 × 40 mm and 60 × 60 mm sections, coefficient kef was rising with temperature, as it was in previous cases.
The diagrams show that except for one case, the effective thermal conductivity of the samples rises linearly with temperature. Therefore, for the purposes of further analysis, the measurement results for individual samples were approximated using the least squares method by means of linear regression equations (Equation (7)):
k e f = k 0 + β t ,
The values of coefficients k0 and β and coefficient of determination R2 for individual samples are listed in Table 1.
As the results from Table 1 show, the values of coefficients k0 and β ranged from 1.58 to 4.18 and 0.0019 to 0.0054, respectively. Furthermore, the range of coefficient of determination R2 is 0.967–0.998. Values of this parameter similar to unity indicate that the adopted equations are well adjusted to the measurement results. The values of coefficient k0 confirmed unequivocally the previous conclusion that the effective thermal conductivity of a specific type of porous charge increases with the increase in dimensions of the components. For example, for the round bar samples, the coefficient kef is greater for larger bar diameters. Furthermore, the values of coefficient β indicate that with the increase in the dimensions of the components, the effect of temperature on kef is also more pronounced.
Using regression equations obtained for individual samples, the effect of porosity on effective thermal conductivity was also analyzed. This comparison was made between samples made of components with the same dimension in the direction of heat flow for three temperatures: 200, 400, and 600 °C.
Figure 12 presents the values of coefficient kef of the samples made of 10 mm components. These were samples of square bars, flat bars with parallel arrangement, and round bars. As can be seen, the increase in porosity in this case from 0.03 to 0.09 leads to a substantial decline in coefficient kef. Furthermore, for both samples of round bars, effective thermal conductivity, despite a substantial difference in porosity, is at nearly the same level. This can be explained in the following manner. Round bars with a diameter of 10 mm are unrolled from the coil and consequently are characterized by high rectilinearity errors. Consequently, the contact areas in the beds of such bars are substantially less dependent on the bars’ arrangement.
Figure 13 presents the effective thermal conductivity for the samples made of 20 mm components. In this case, these are square bar samples, two samples of round bars, and rectangular section samples. Apart from external porosity, the last of the samples is also characterized by a high internal porosity. The total porosity of the charge is 0.75. Since the sample was characterized by the lack of unequivocal changes in kef versus temperature, a constant value of 3.73 W·m−1·K−1 was adopted for the entire temperature range. The diagram shows that the increase in external porosity (the first three points for each temperature) of the charge substantially reduces the value of kef. Furthermore, the increase in charge porosity related to internal porosity does not have such a high effect.
As the sections are filled with air whose thermal conductivity is four orders of magnitude lower than the thermal conductivity of steel, these elements should have much lower kef values. However, the measurements do not confirm this. The relatively high value of kef for the sections (comparable to the values obtained for bars) results from the fact that gas conduction is compensated by other heat transfer mechanisms. In the free space of the section, heat is also transferred through the free convection and thermal radiation between the internal surfaces. The problem of complex heat flow in the steel rectangular sections was analyzed in the papers [40]. It has been shown that heat transfer in the section occurs with over twice lower intensity compared to heat conduction in the solid equivalent. It was also demonstrated that above 300 °C, thermal radiation is essential for the whole phenomenon. In the next article [41,42], the complex heat transfer in the packages of rectangular steel sections was analyzed in turn. It was established that the heat transfer intensity in such systems mostly depends on the thermal contact resistance Rct between adjacent layers of the package. The cited studies also show that the phenomenon of heat flow in the analyzed systems is the result of the simultaneous and interrelated mechanisms of conduction in steel and air, contact conduction, free convection, and thermal radiation. As a result, the internal porosity does not drastically reduce the value of the kef coefficient. Further research will be carried out to obtain more precise results. Currently, due to the limited amount of the experimental data, it is impossible to draw a more precise conclusion.
Figure 14 presents the results obtained for the samples made of 30 mm components. These were samples of square and round bars. Changes in the coefficient kef are much similar to those obtained for the samples made of 10 mm components. Figure 12, Figure 13 and Figure 14 reveal that porosity is not the only parameter that has the effect on changes in the value of coefficient kef of the charge. It should be concluded that another important factor in this respect is the thermal contact resistance Rct between the adjacent components of individual layers. This resistance is dependent, among other things, on the actual contact area Ar [43,44]. In the packed beds of the porous charge, this surface depends on the shape of the components and their work accuracy [45]. Any shape errors, and in the case of long components, especially the lack of rectilinearity, leads to a reduction in this surface. In a bed of square bars, this area should be many times greater than that of round bars. However, if the bars are characterized by substantial rectilinearity errors, numerous and randomly distributed gaps will occur between the adjacent bars. In this case, the previously mentioned disproportion in the surface Ar between round and square bars will be substantially lower. The results obtained lead to the conclusion that the phenomenon of contact conduction is critical to the intensification of a global heat flow in the area of porous charge.
Another factor critical to the analysis is how much the effective thermal conductivity of the examined samples differs from the thermal conductivity of the components. Analysis of this problem can be performed using relative thermal conductivity Kr [46]. This quantity is dimensionless and is a quotient of effective thermal conductivity of the porous medium and thermal conductivity of its solid phase ks (Equation (8)):
K r = k e f / k s .
As emphasized, all the components used for construction of the samples of porous charge were made of steel containing 0.2% carbon. Changes in the thermal conductivity of this steel vs. temperature are described by the second-order polynomial (Equation (9)):
k s t = 1.78 10 5 t 2 0.016 t + 51.9 .
This equation was determined through approximation of the tabular literature data [47]. The lowest value of the coefficient kef was obtained for the 10 mm round bar sample with the in-line arrangement. The highest value of kef was observed for 30 mm square bars. Therefore, the minimum and maximum value of kef for the charge depending on temperature can be described by the Equations (10) and (11):
k e f min = 1.48 + 0.0022 t ,
k e f max = 5.48 + 0.0036 t .
Using Equations (9)–(11), minimum and maximum values of Kr were computed; these are presented in Figure 15 for the temperature range of 25–675 °C. At room temperature, effective thermal conductivity for the discussed cases accounts for 0.03 to 0.12 of the thermal conductivity of steel. At a temperature of 675 °C, this value ranges from 0.09 to 0.25. The increase in Kr with temperature can be explained by the effect of thermal radiation that takes place in the area of the porous charge between the surfaces of individual components (bars or sections) [42,48].
The averaging of these results leads to the conclusion that the effective conductivity of the porous charge is by one order of magnitude lower than the thermal conductivity of steel. This means that the heating and cooling of the porous charge is much slower compared to these processes for the solid charge. Therefore, optimization of these operations can be considered as legitimate for what knowledge about changes in effective thermal conductivity of the porous charge is necessary.
When discussing the problem of heat treatment optimization, it should be noted that the heating of the charge is influenced by three parameters: thermal conductivity k, heat capacity (at constant pressure) c, and density ρ. The product ρc is called the heat capacity of a material. These parameters determine another thermal property—the thermal diffusivity α, which represents how fast heat diffuses through a material and is defined as (Equation (12)) [9]:
α = k ρ c .
In the case of porous materials, it is effective thermal diffusivity αef. The most common method for determining this property is to calculate it from effective thermal conductivity and effective volumetric heat capacity (Equation (13)) [49]:
α e f = k e f ( ρ c ) e f = k e f ρ g c g ϕ + ρ s c s ( 1 ϕ ) . k ef = [ 1 f k eP + f k eS ] 1 .
This approach is called the Lumped Parameter method. The problem of determining the effective thermal diffusivity of the porous charge will be the subject of further research and publications.

4. Conclusions

The results obtained lead to the following conclusions:
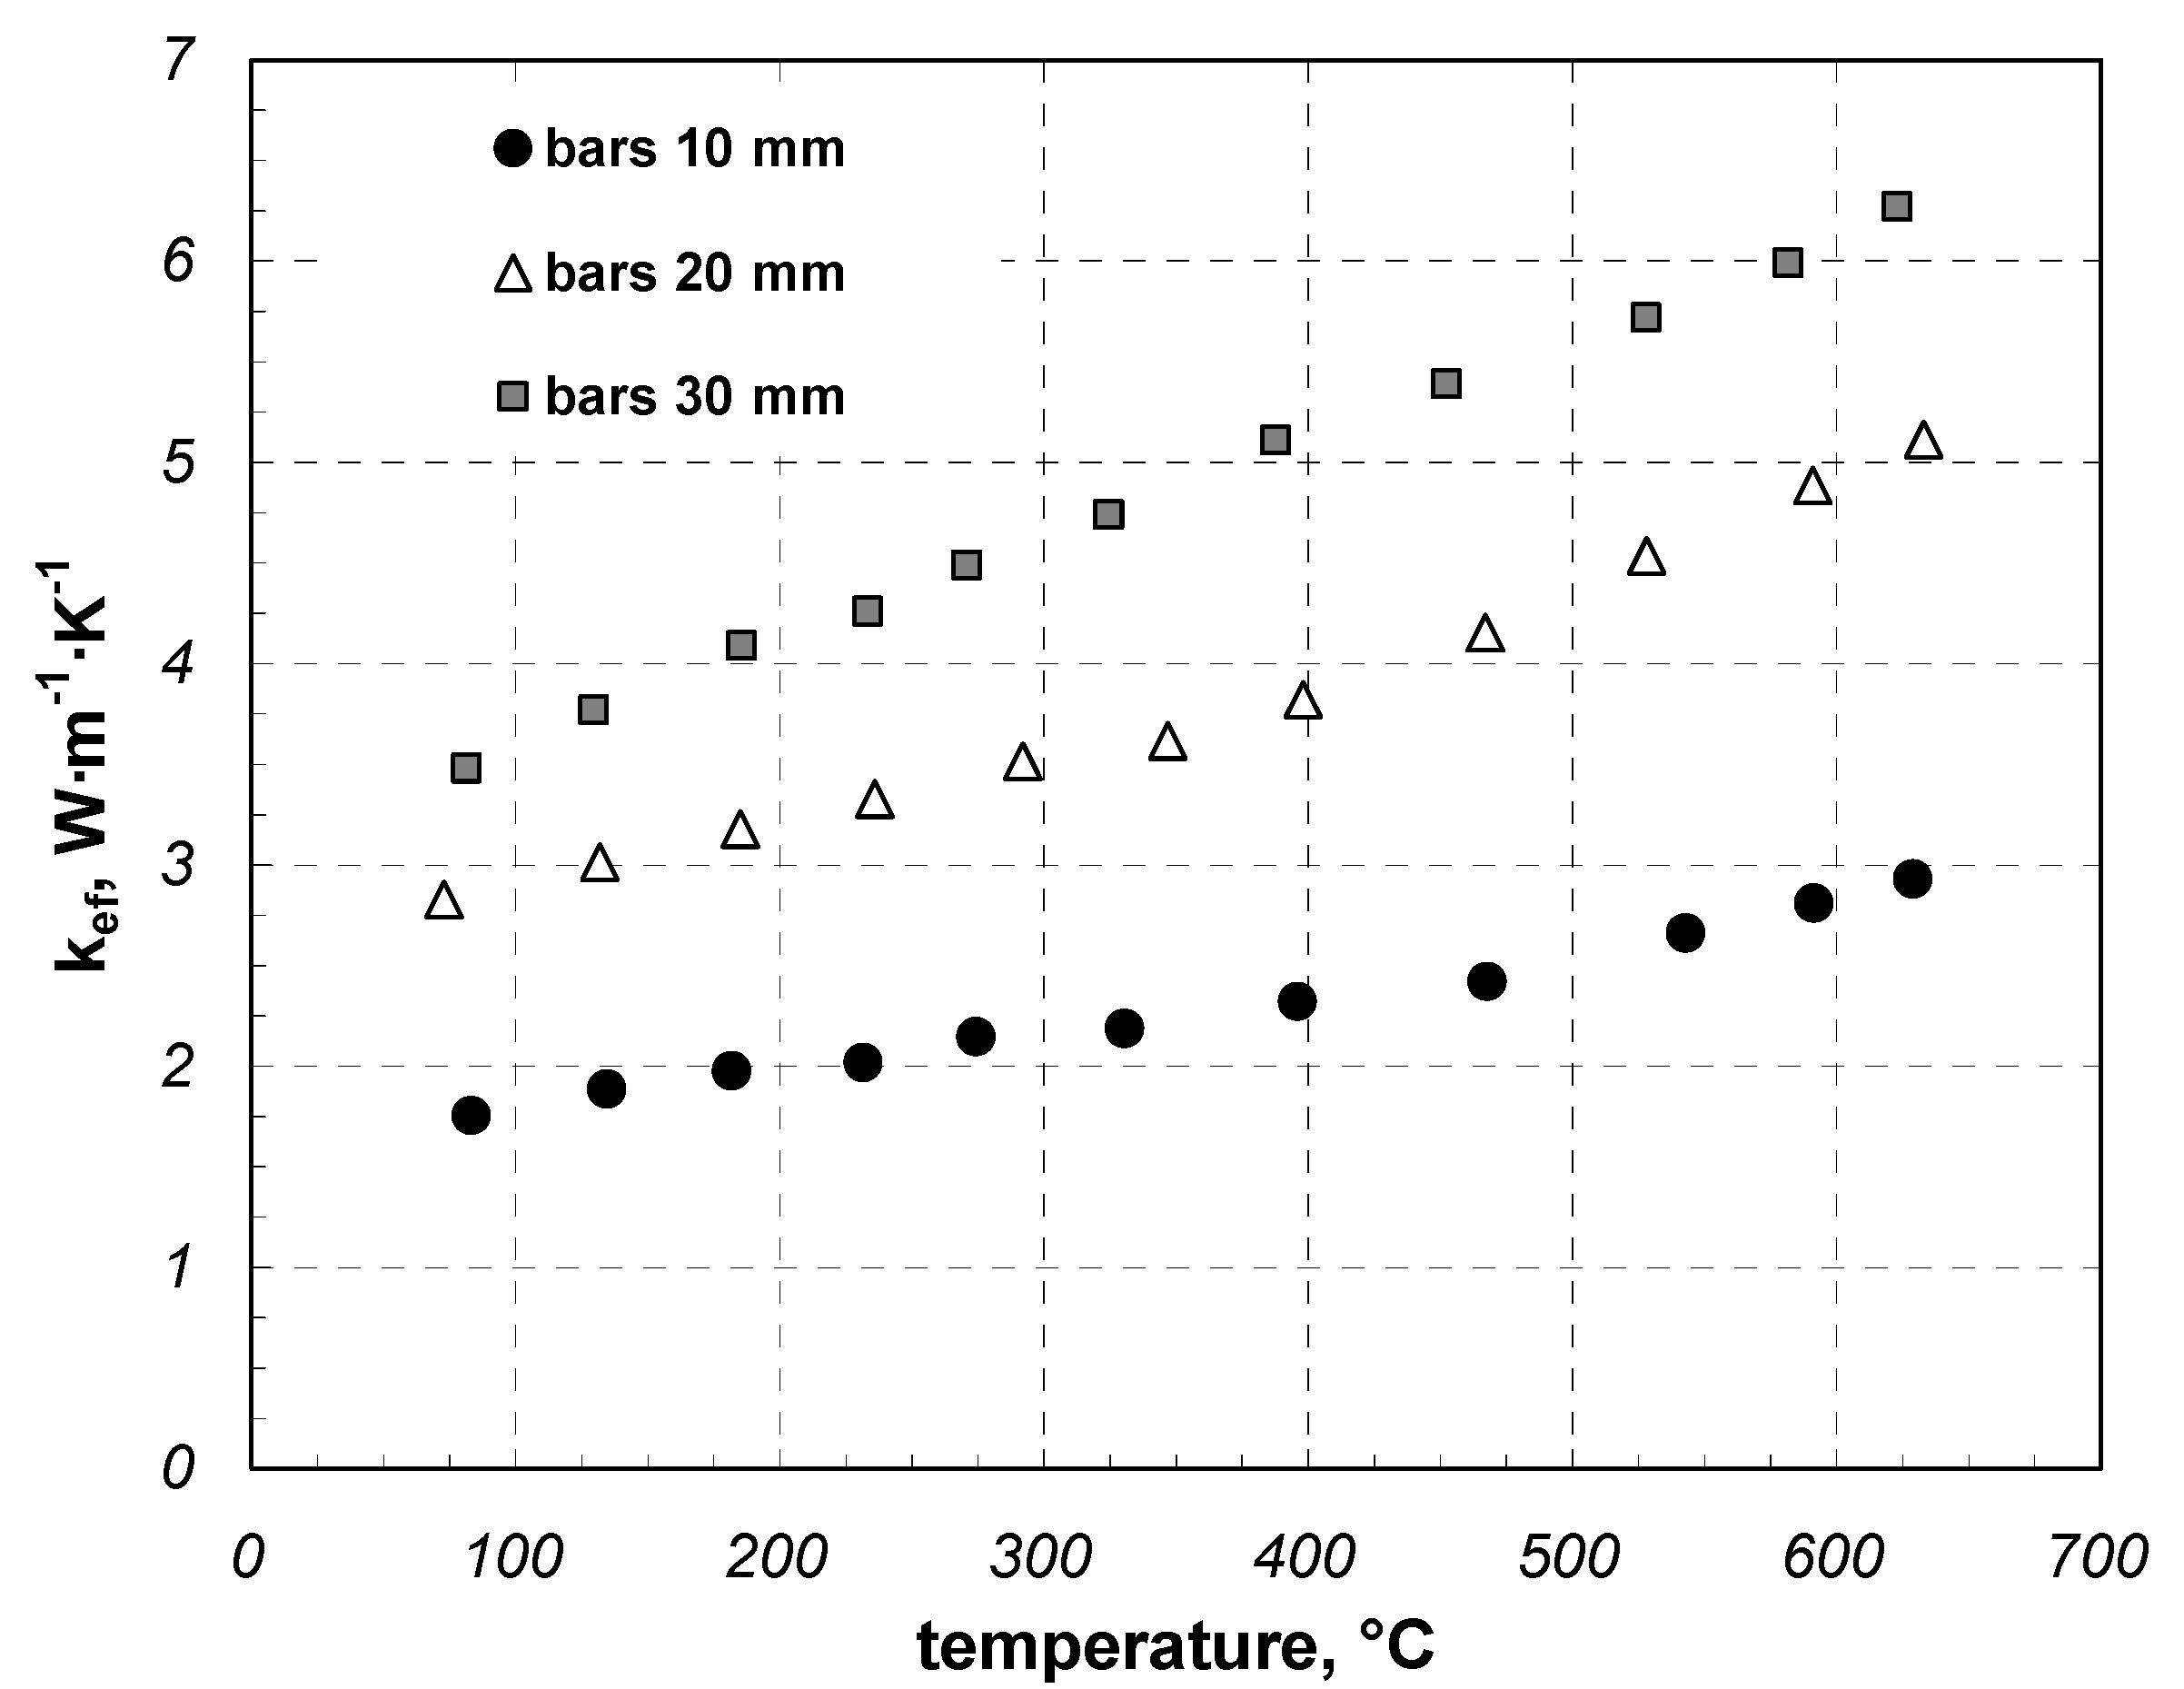
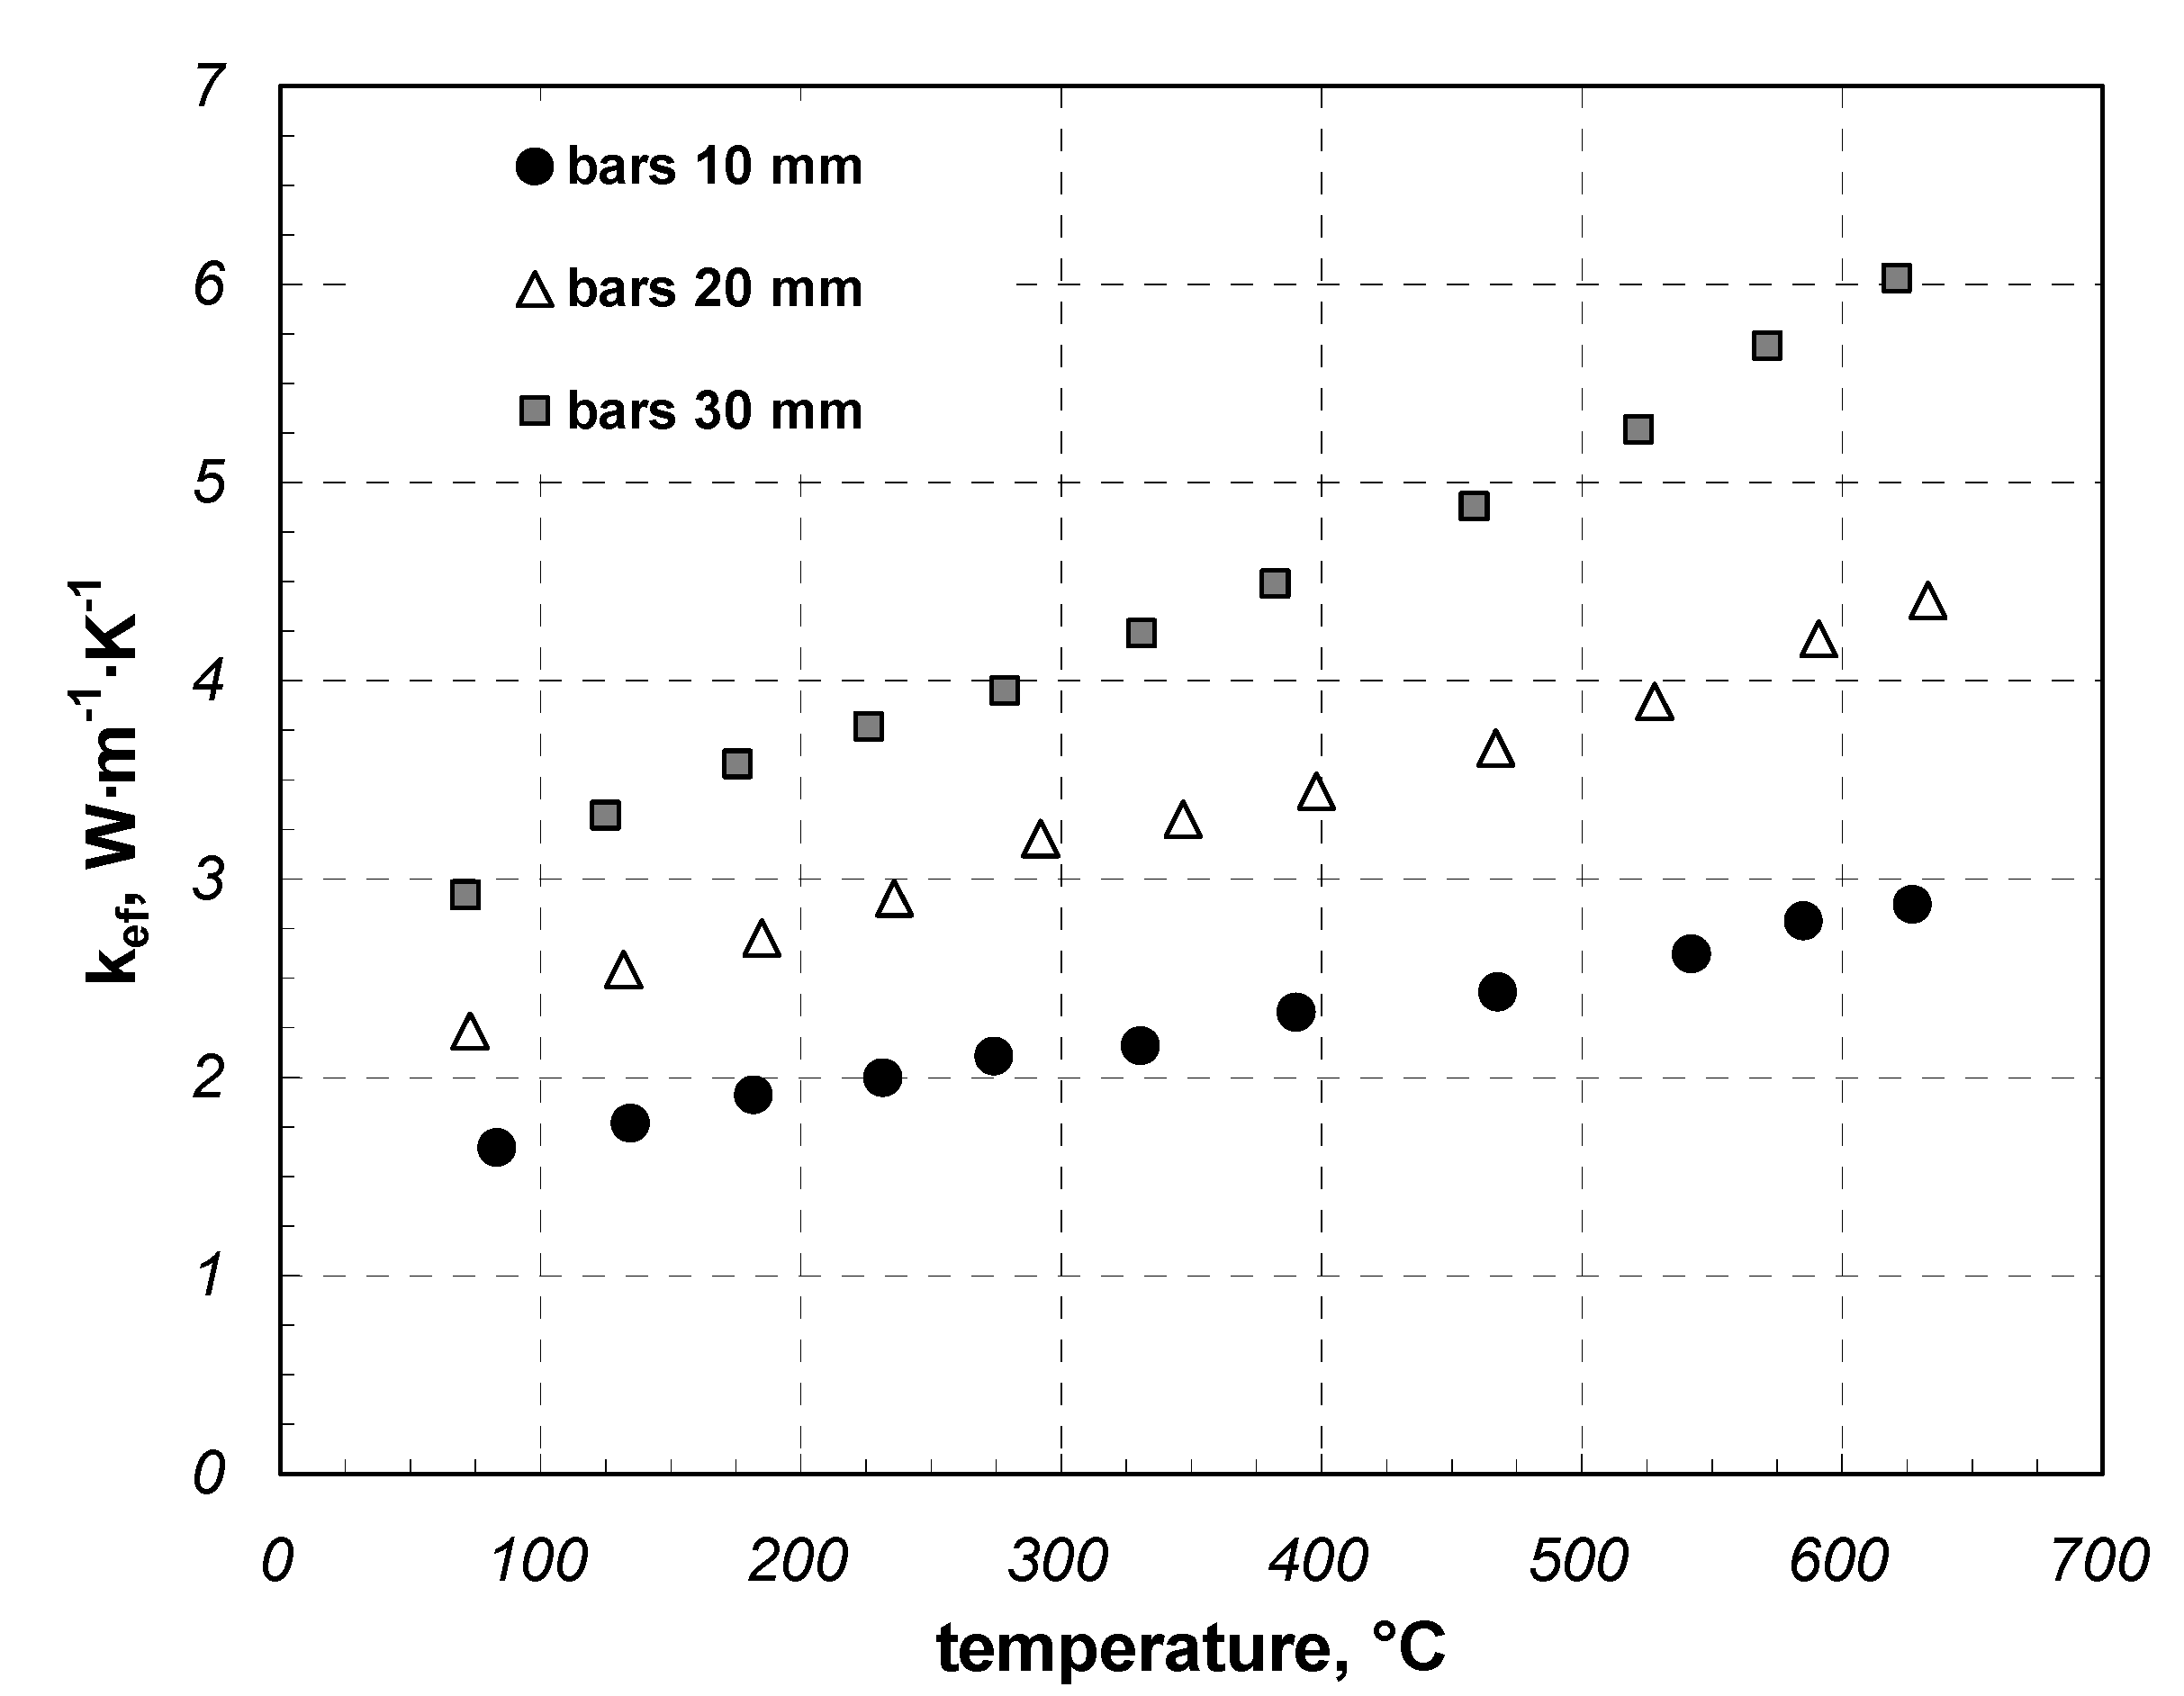
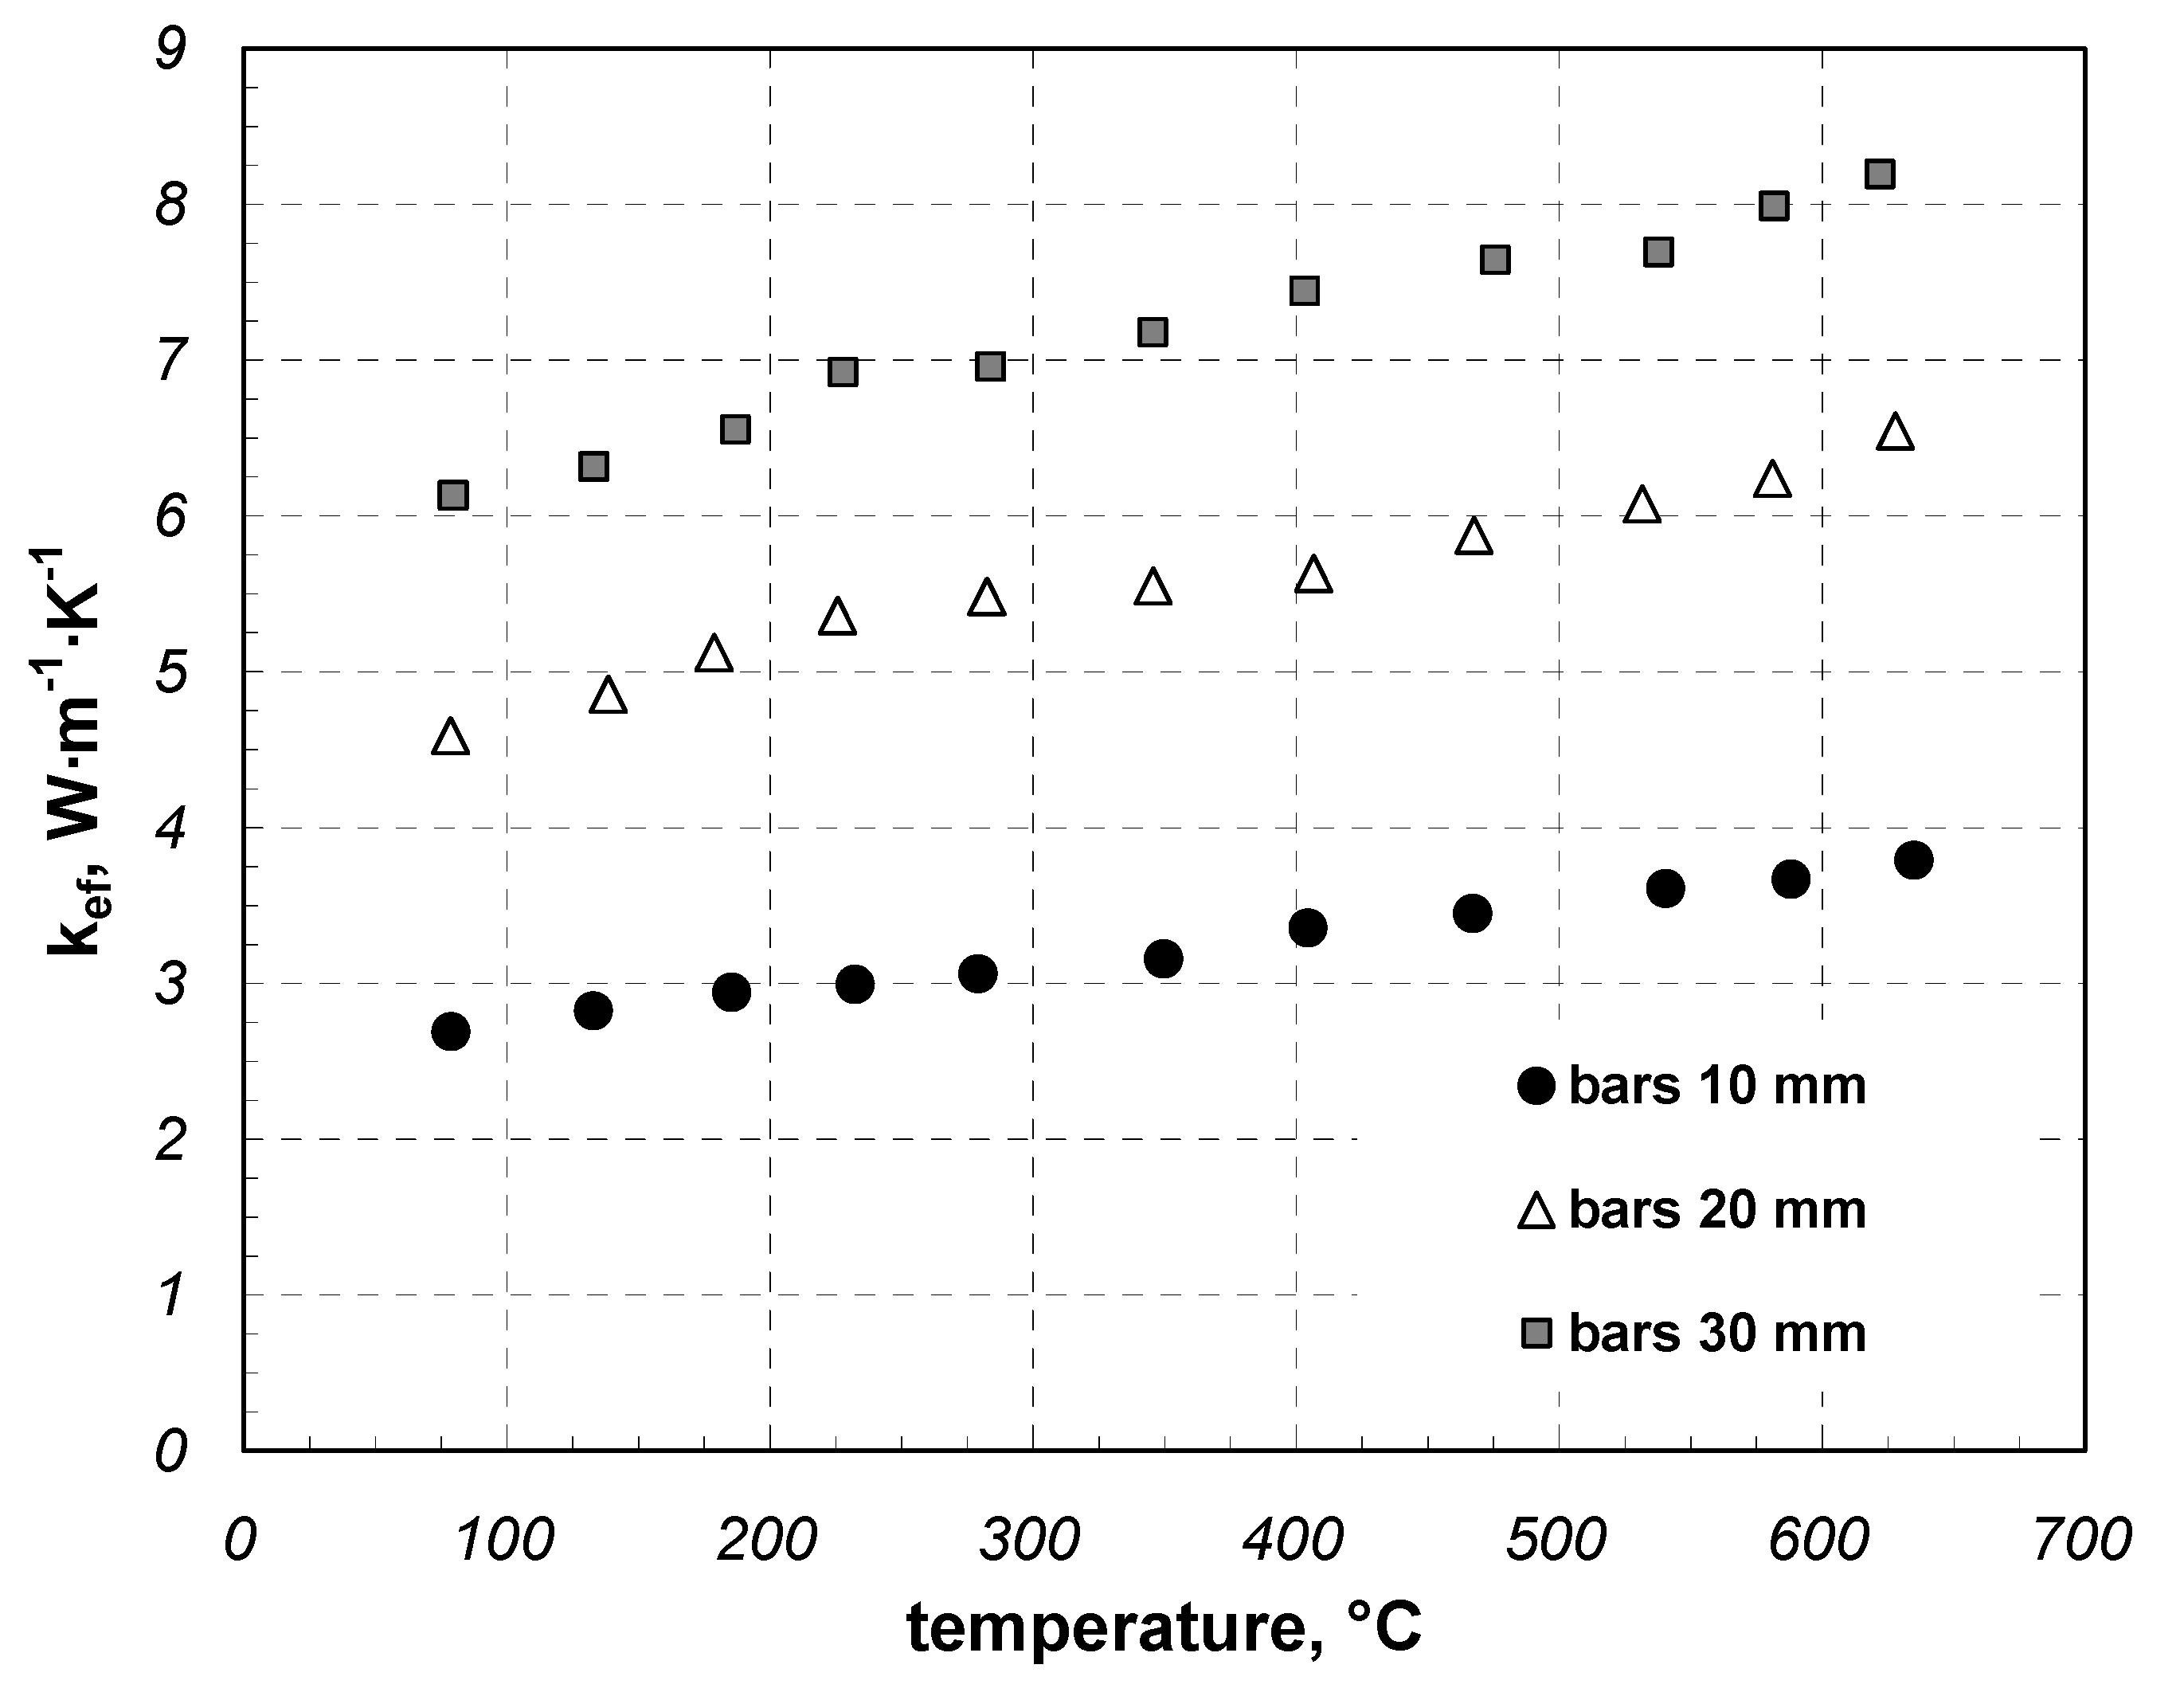
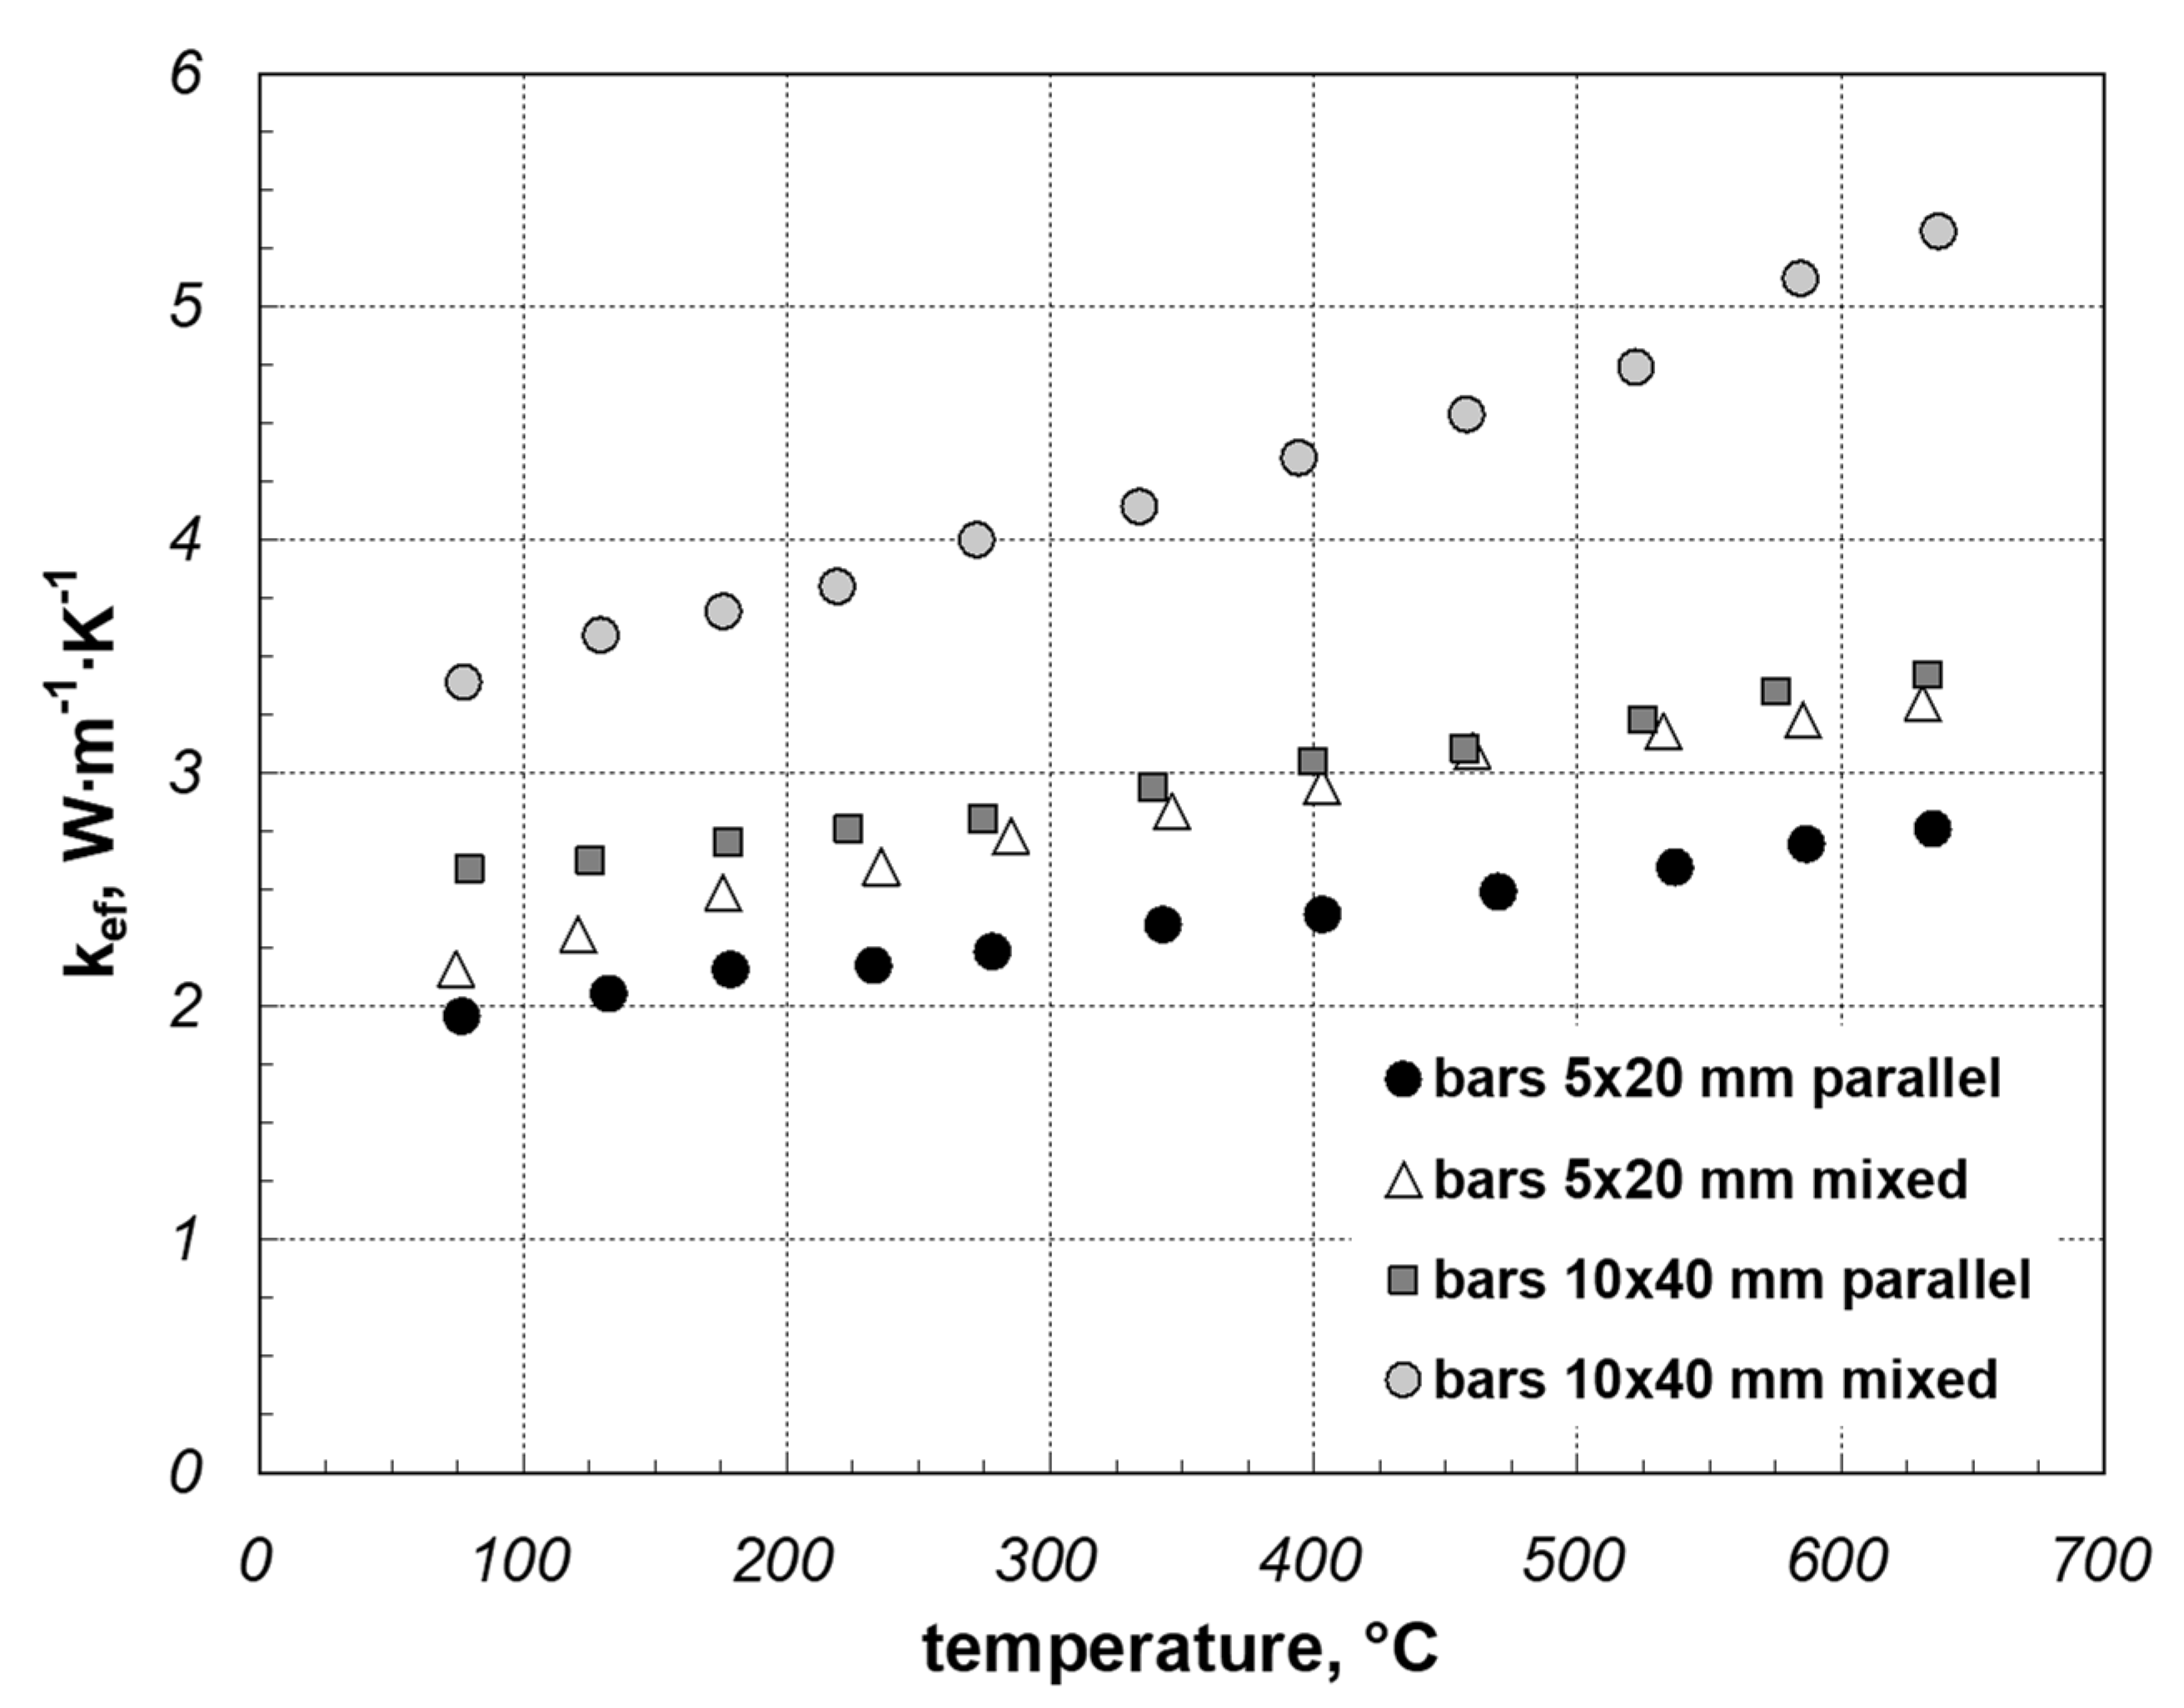
  • Depending on the temperature, size, shape, and arrangement, the effective thermal conductivity of packed bundles of various long components made of low-carbon steel changes over the range of 1.7–8.2 W·m−1·K−1;
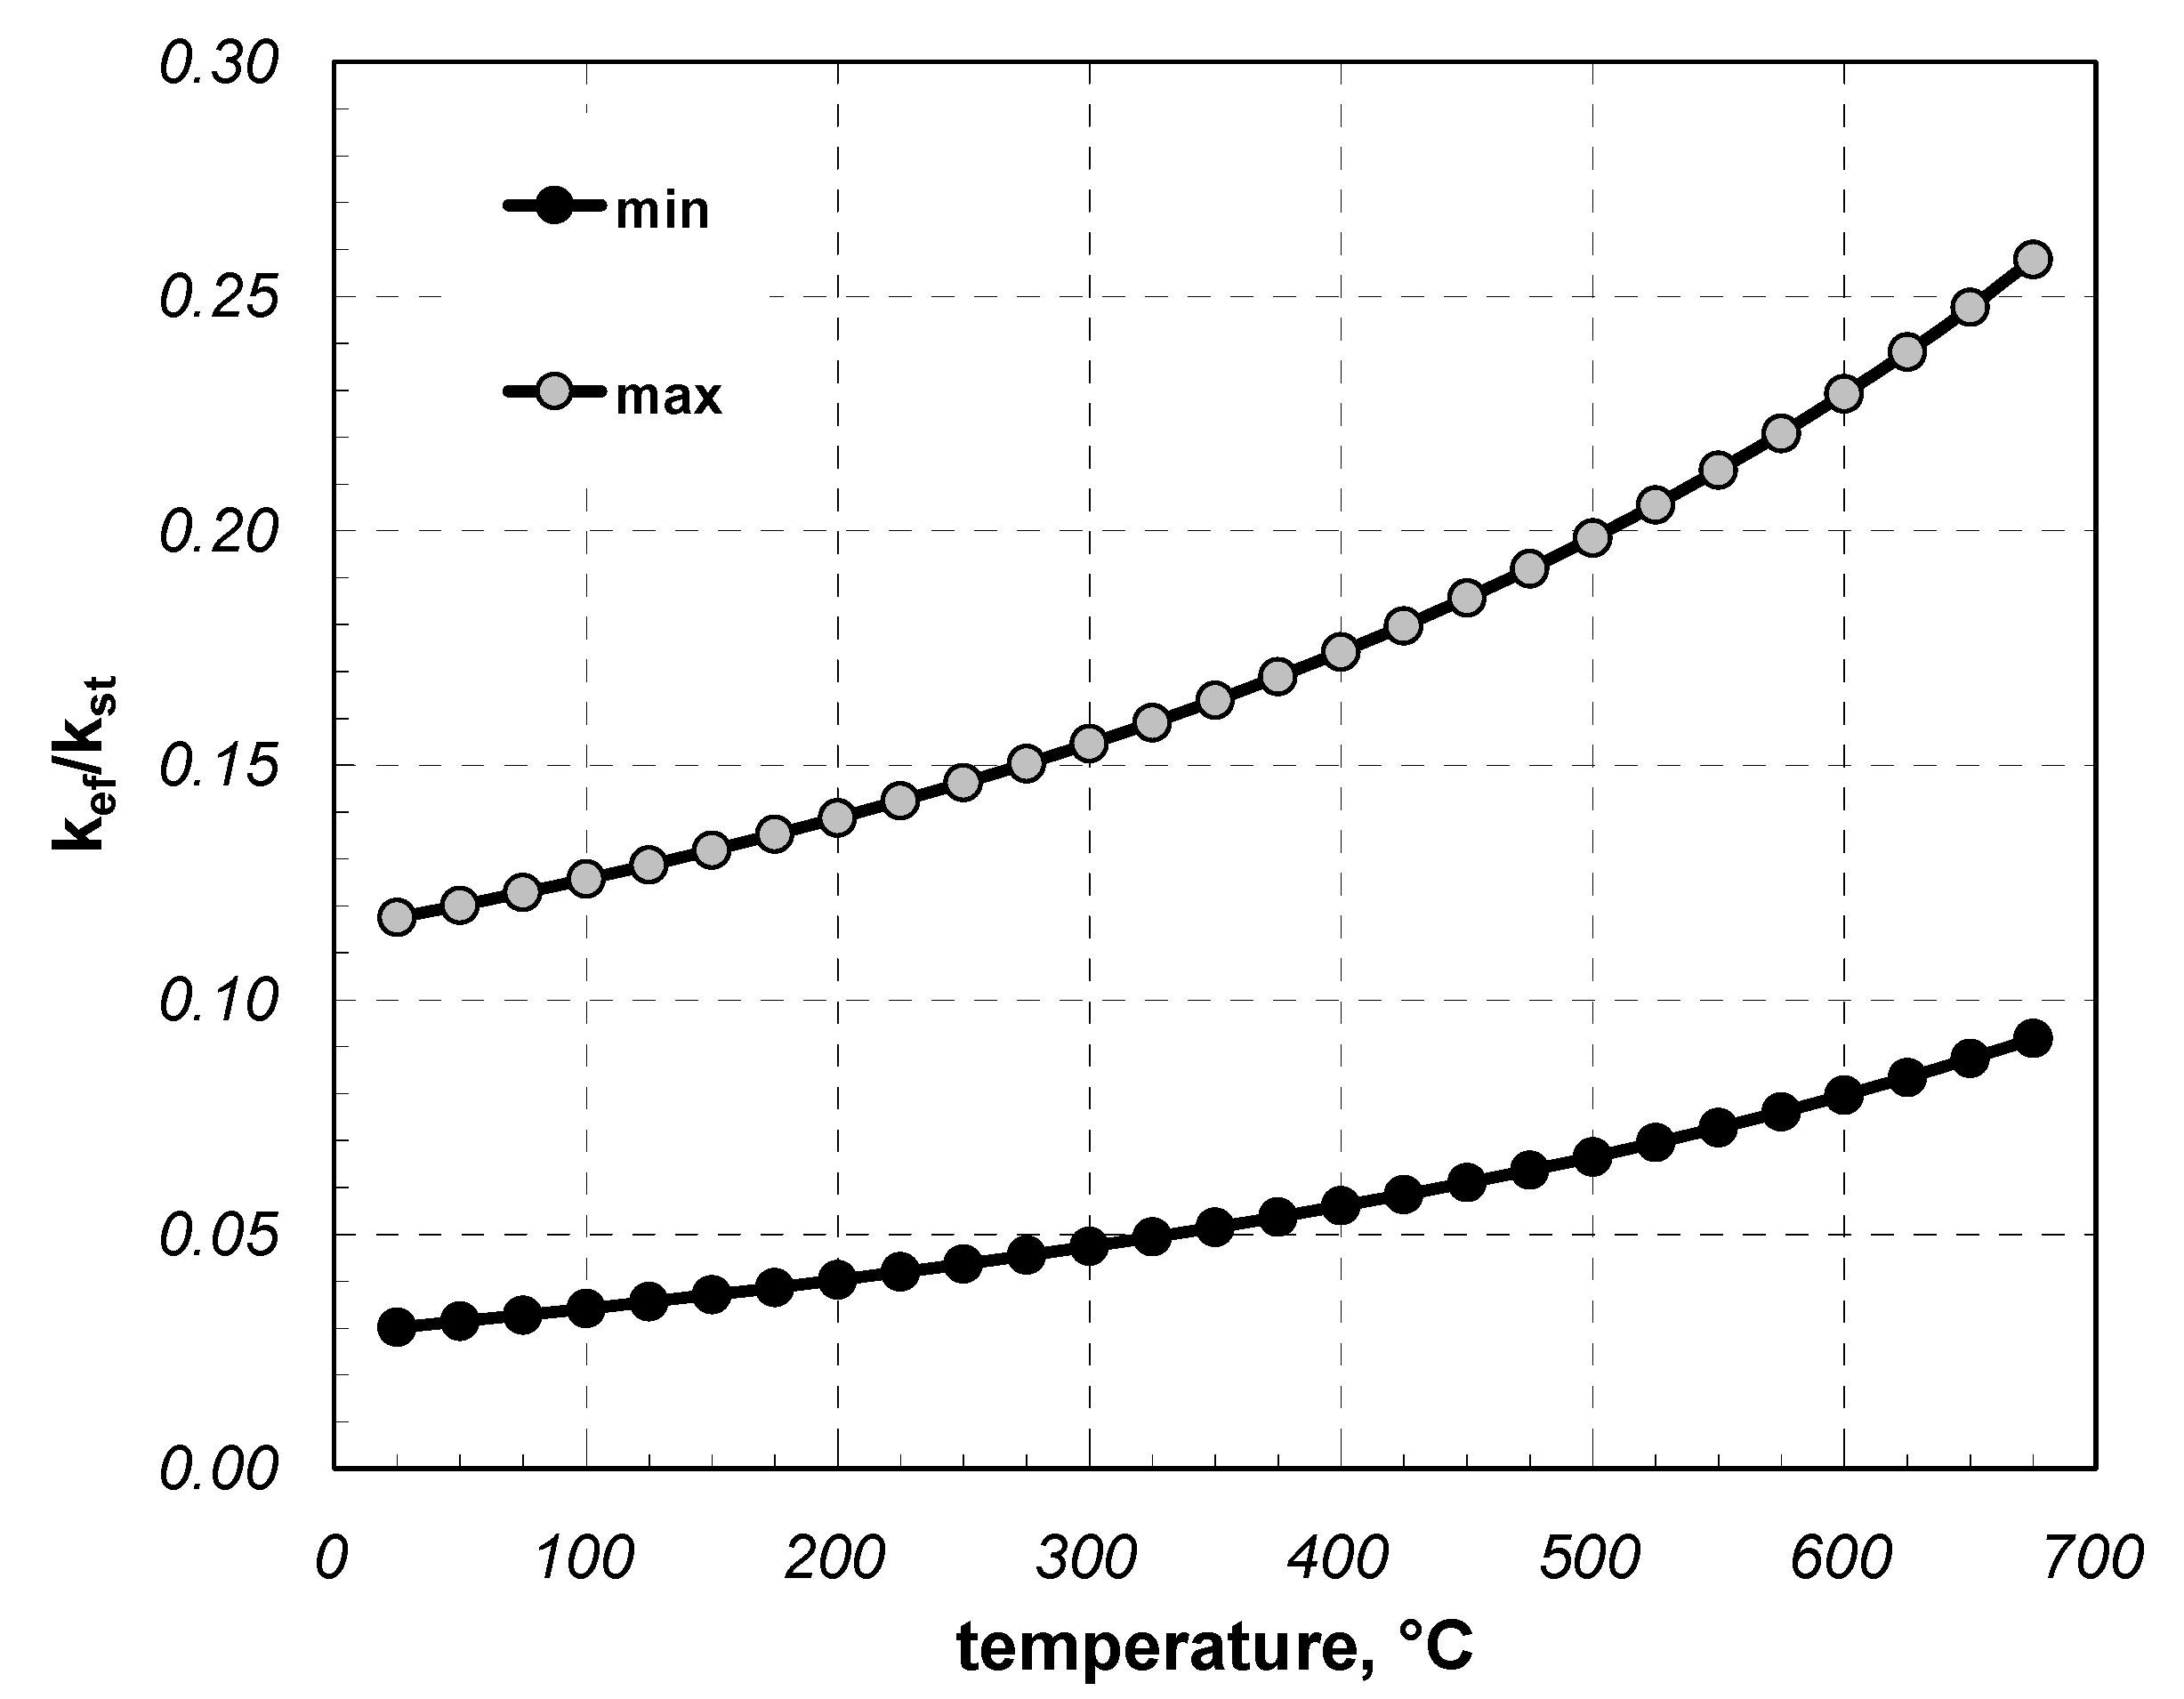
  • The values of coefficient kef range from 0.03 to 0.25 of thermal conductivity of the solid phase of the charge;
  • The effective thermal conductivity rises linearly with temperature, whereas the intensity of this increase and the value of coefficient kef depend on the transverse dimension of the components that form the charge;
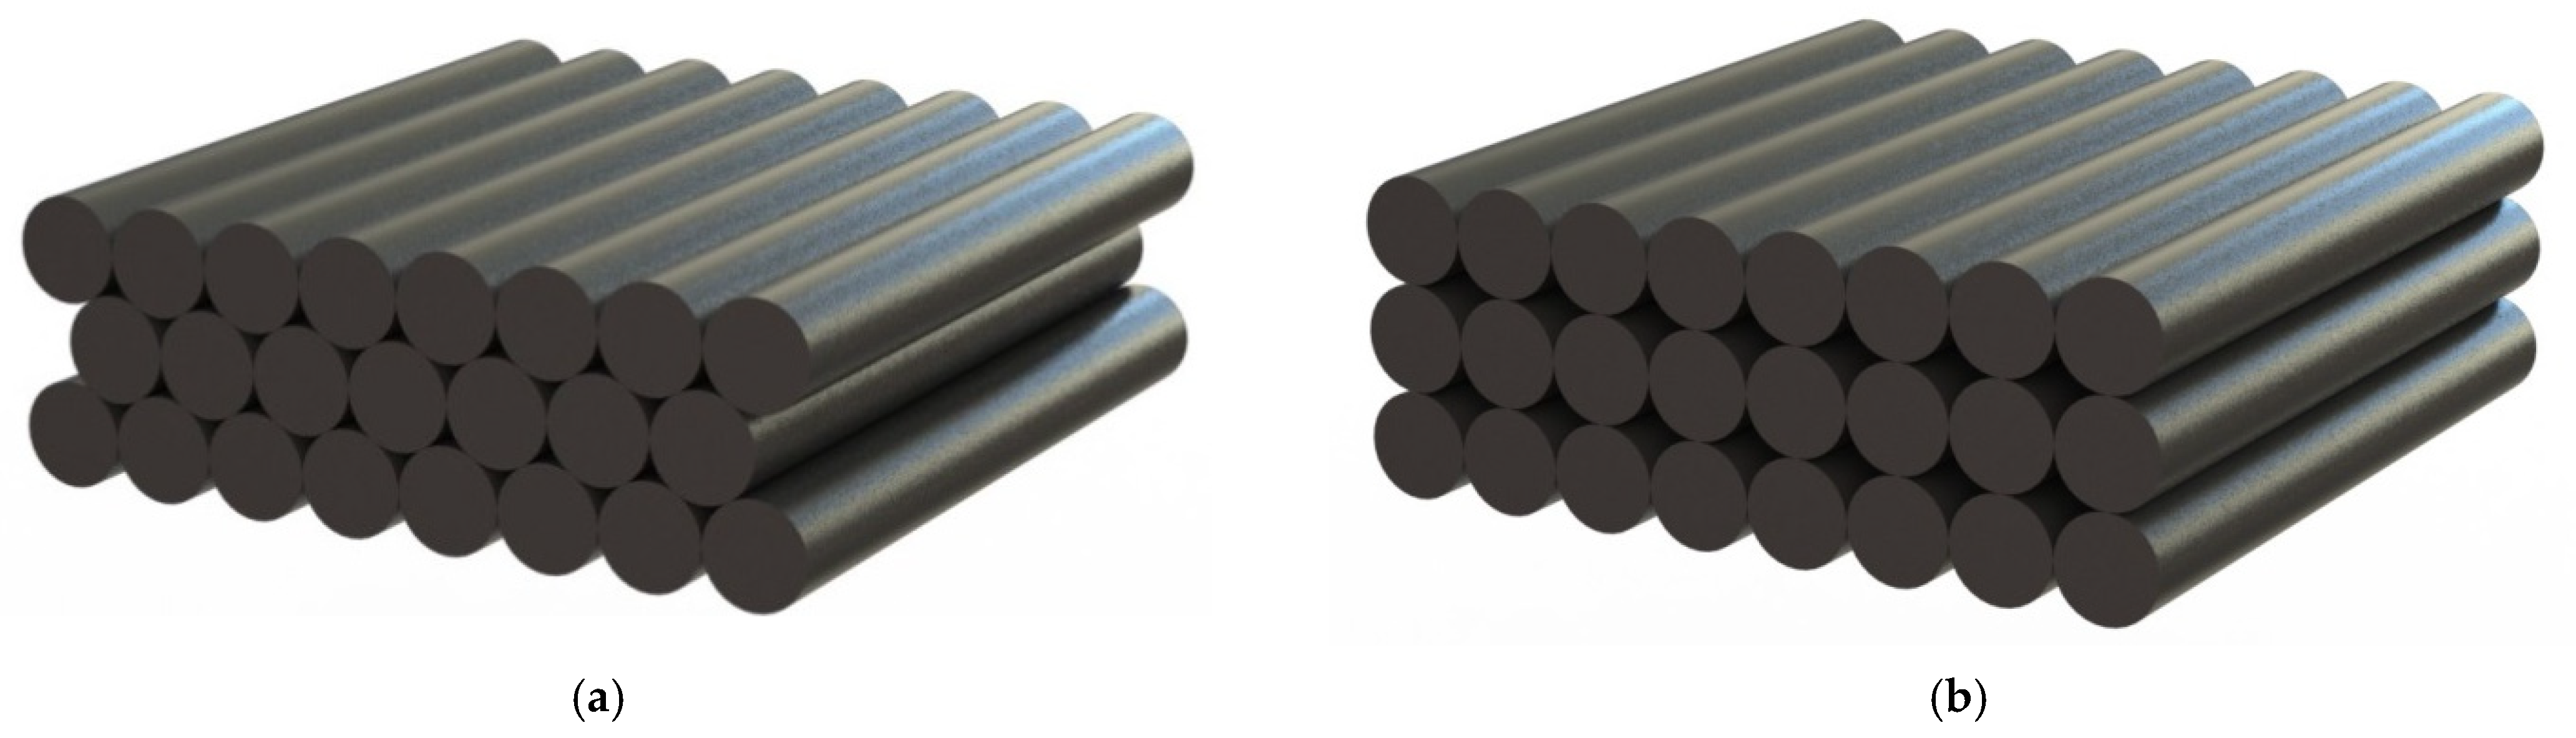
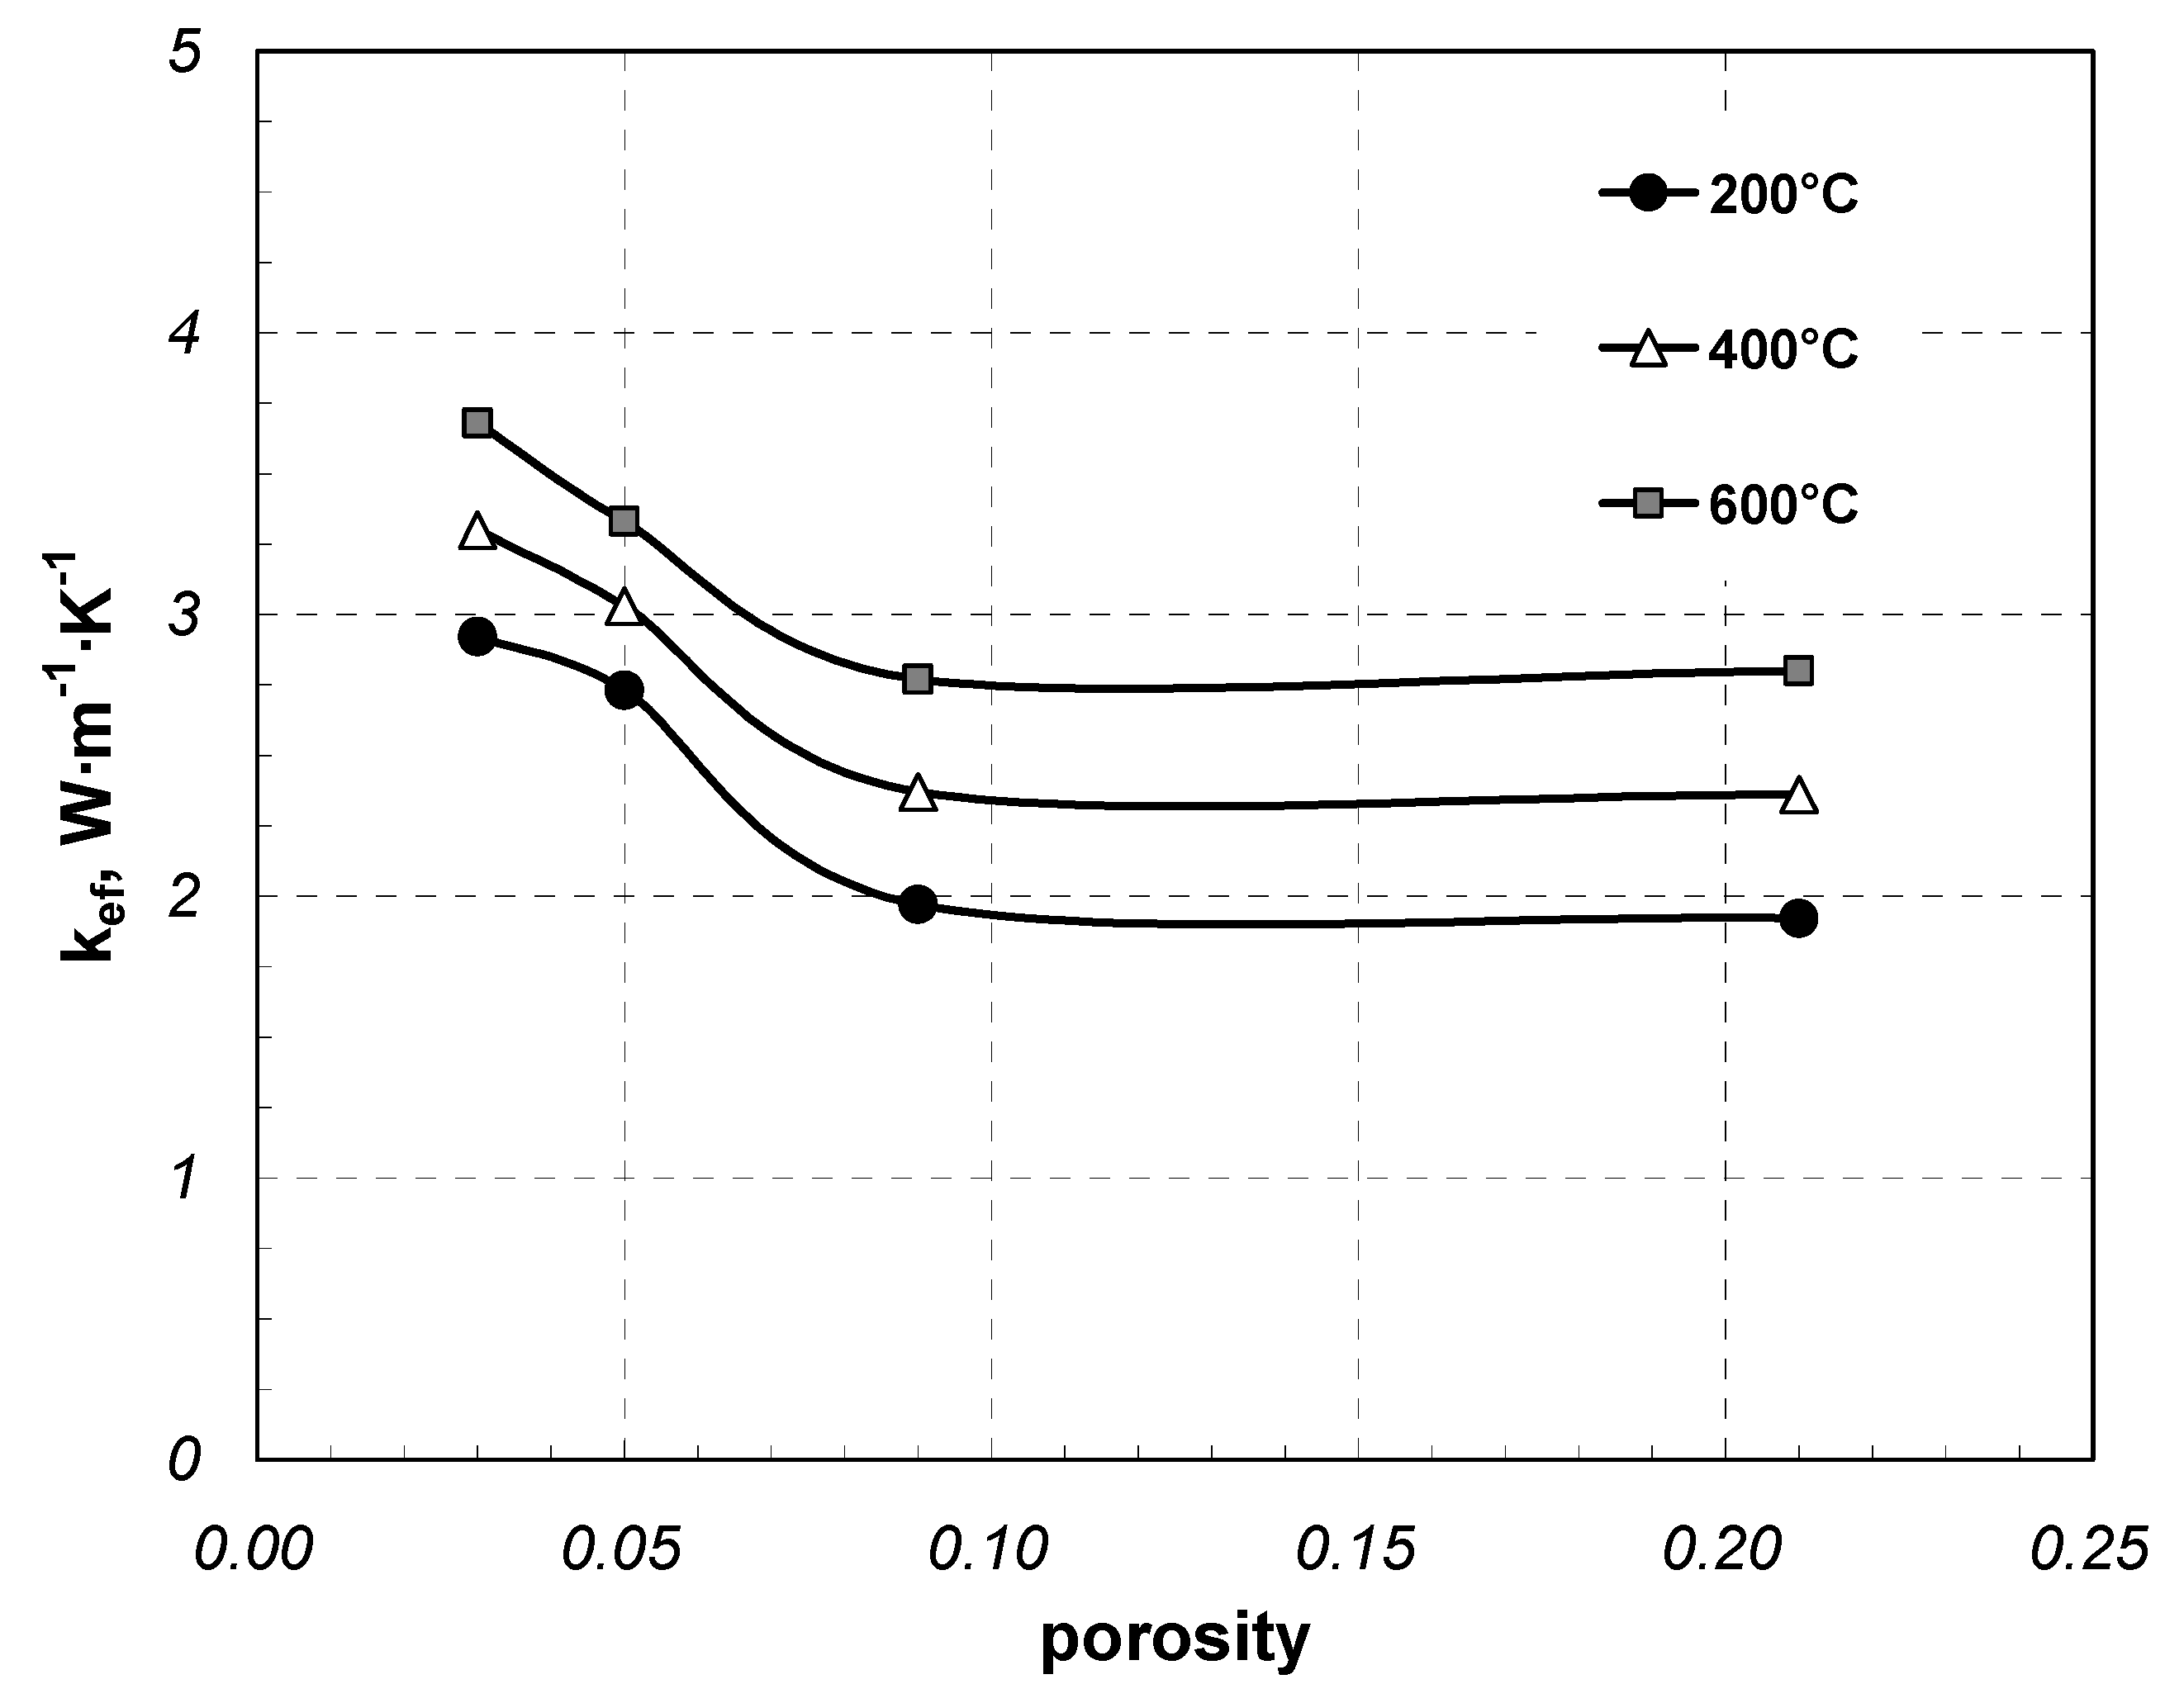
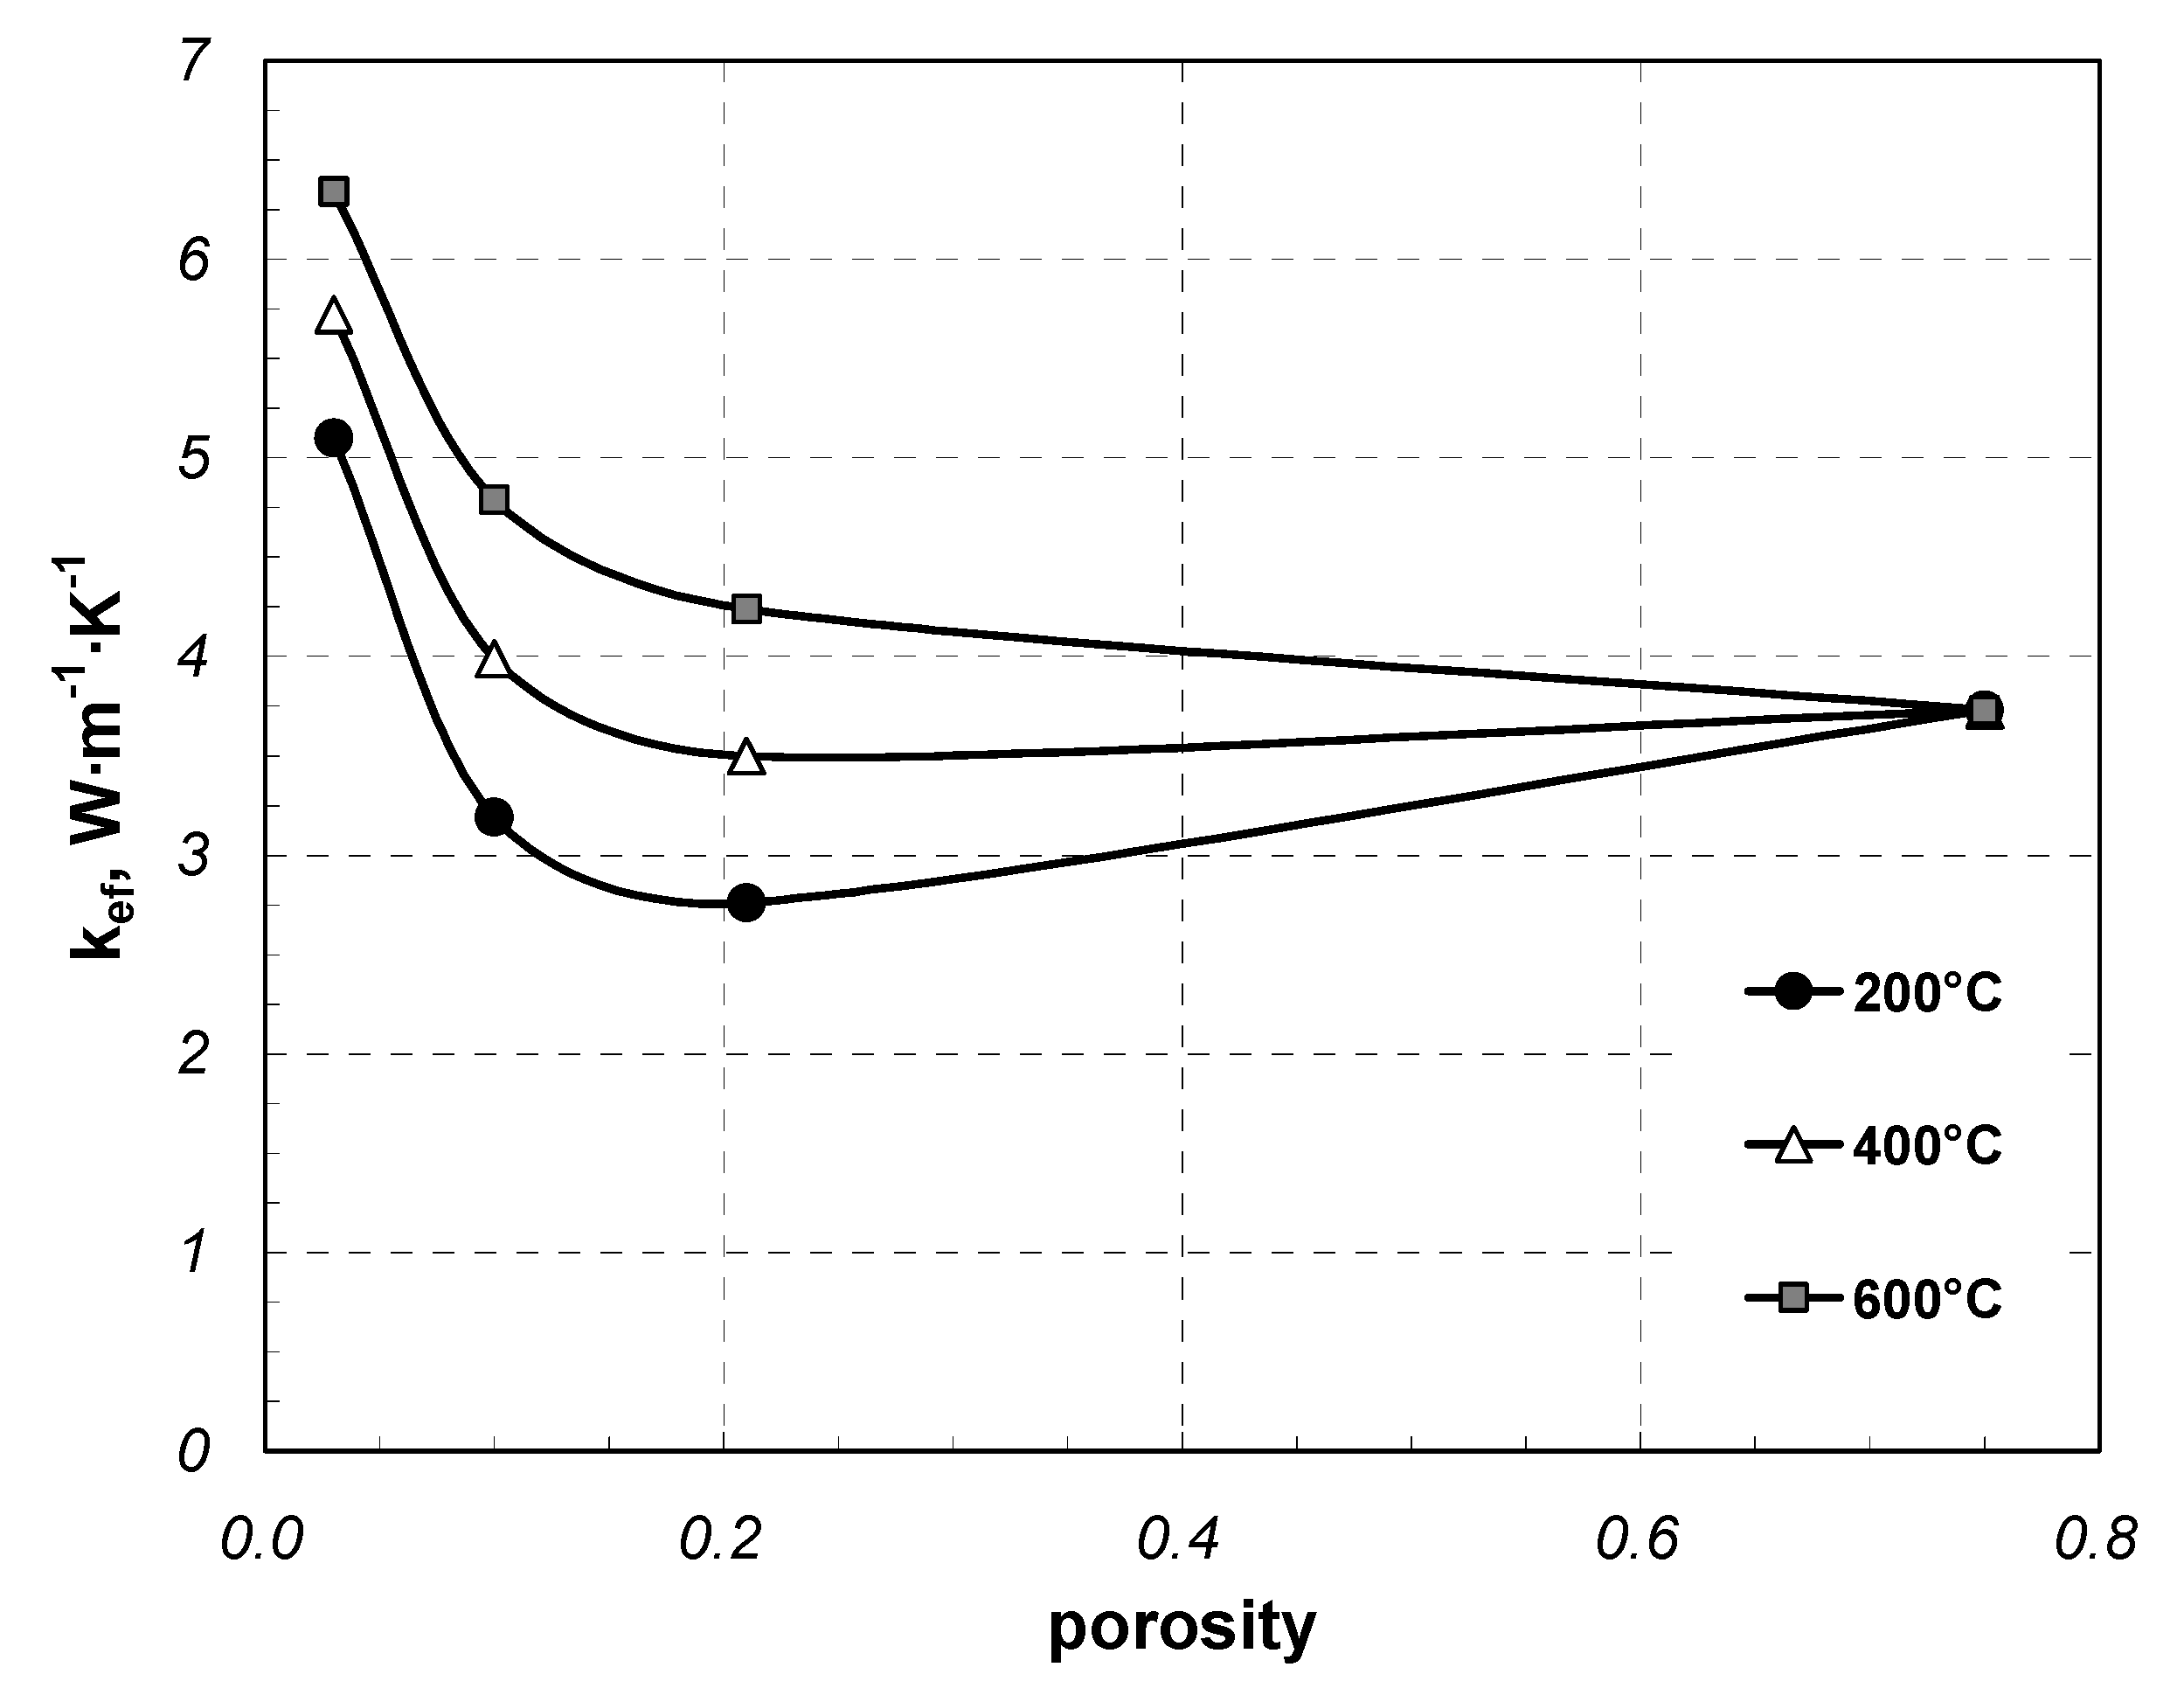
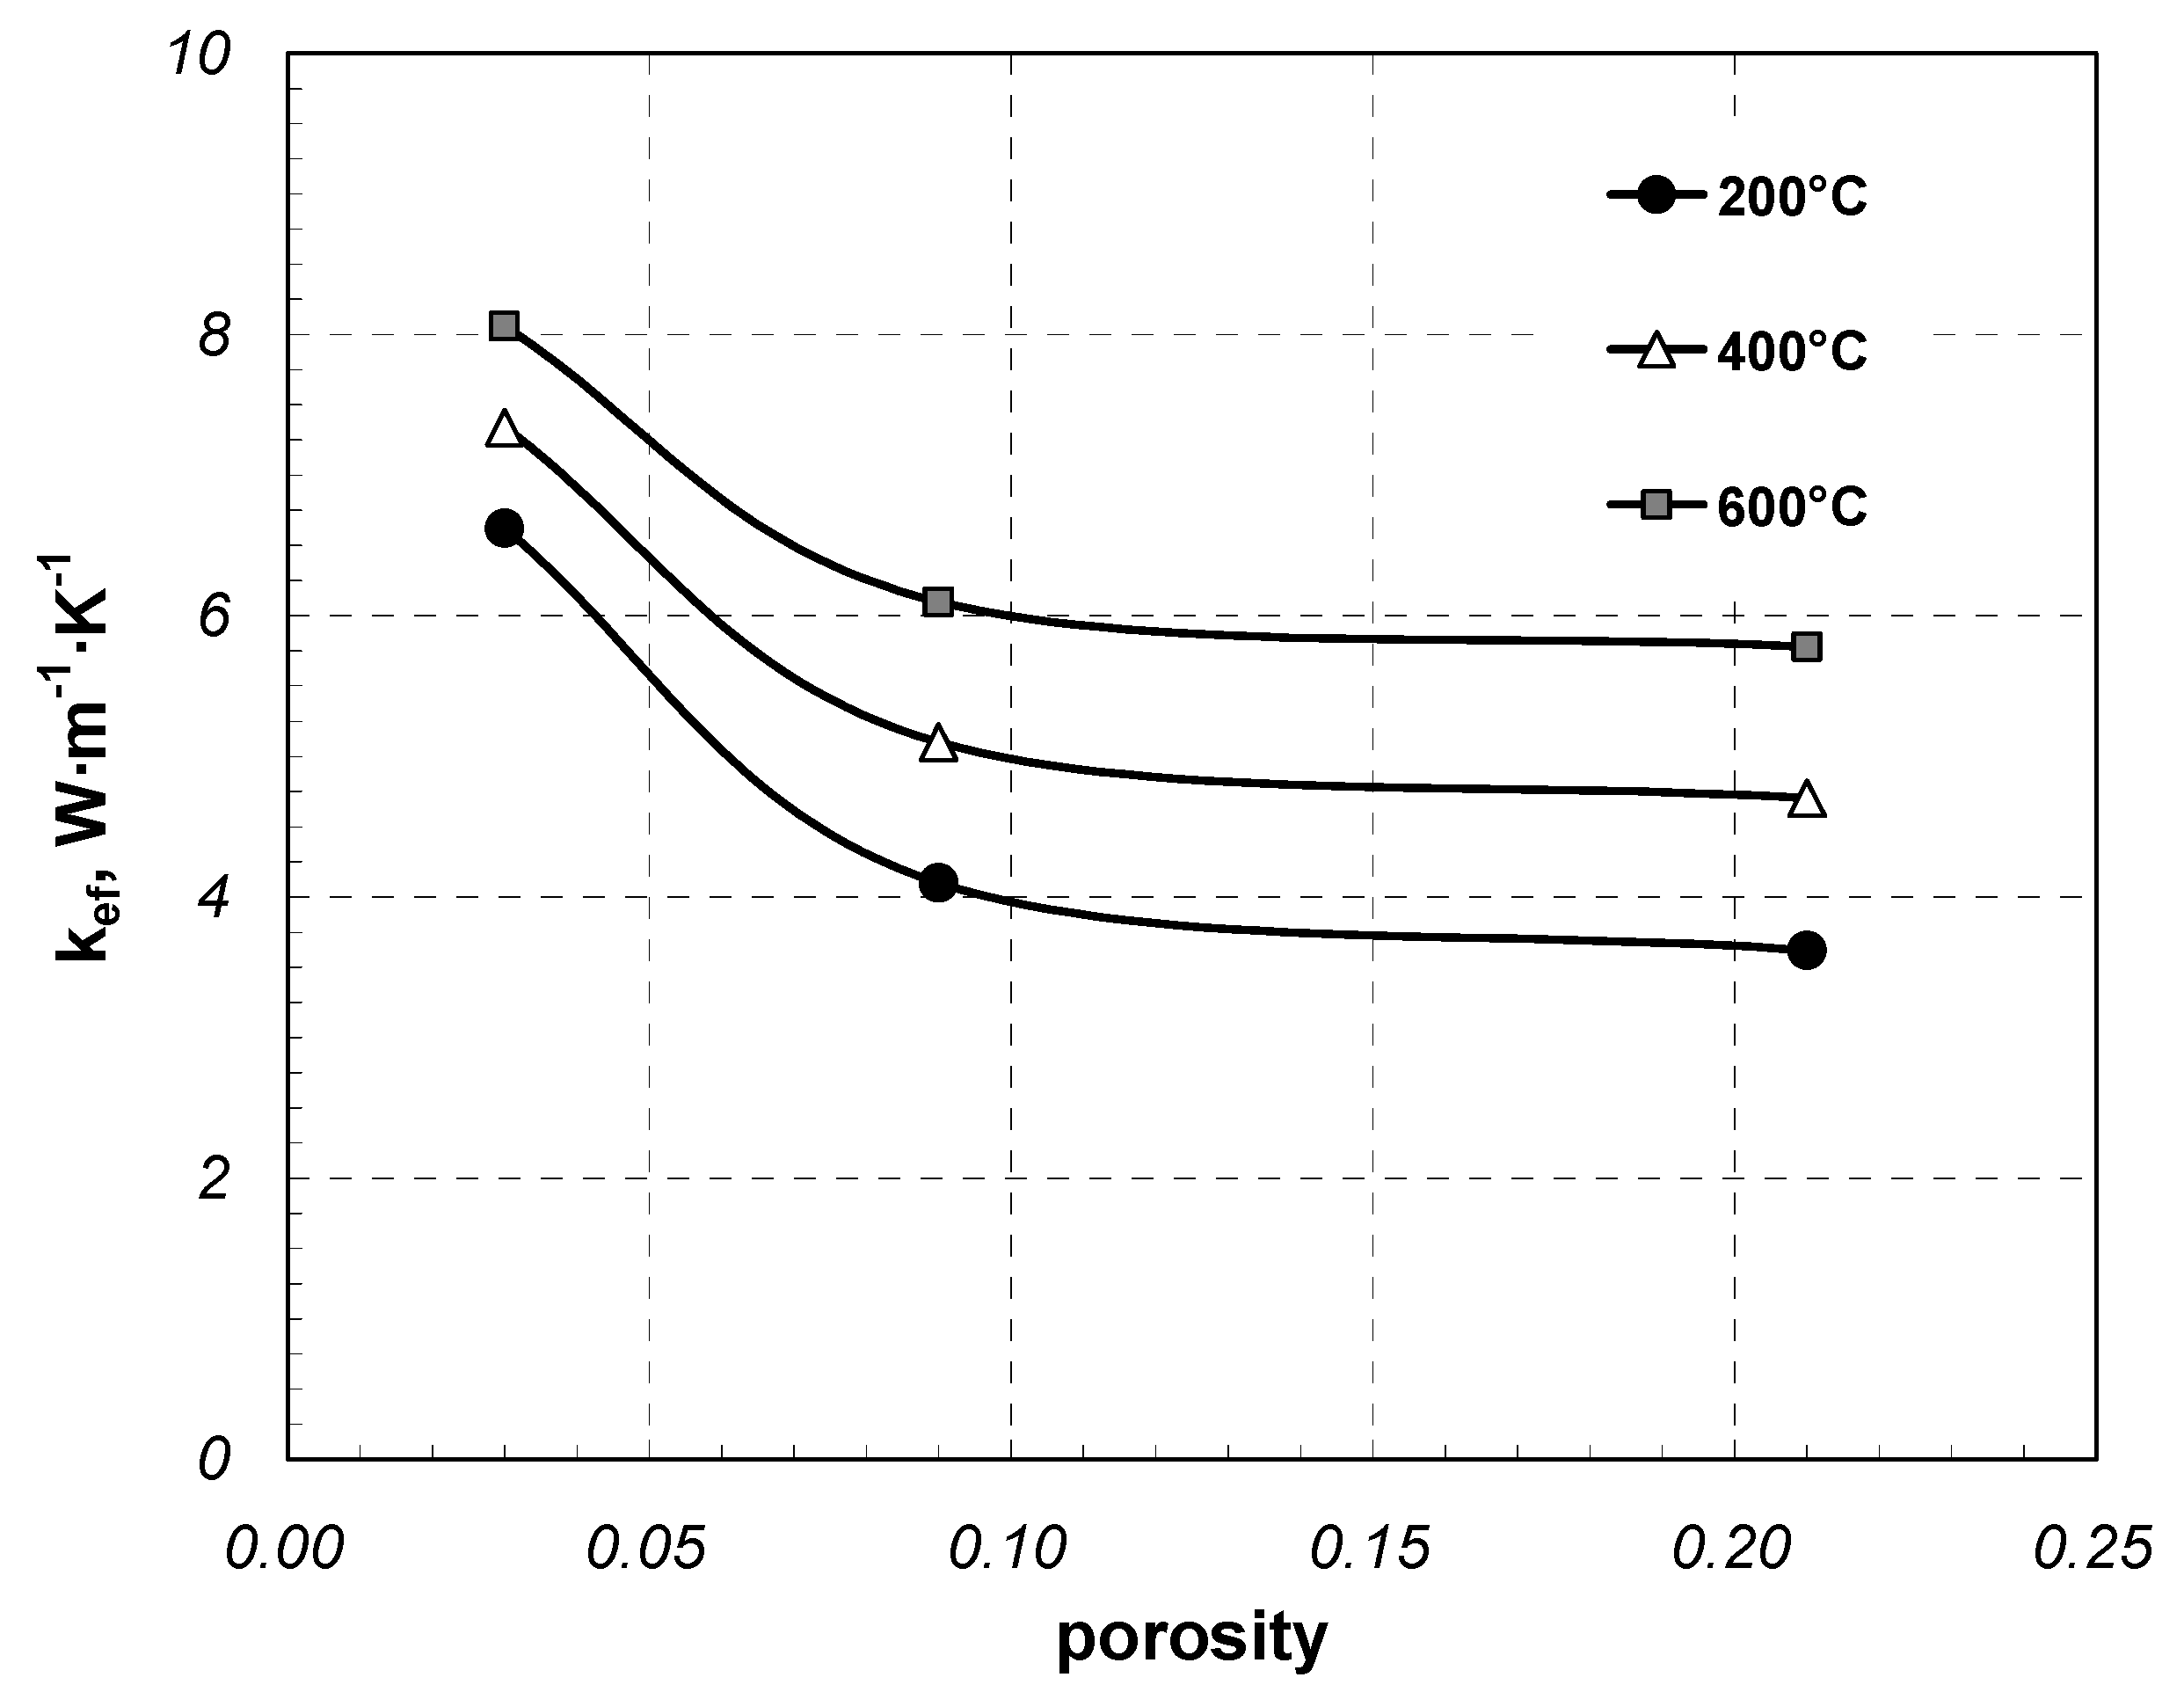
  • Coefficient kef declines with the increase in the external porosity of the charge, which depends on the transverse shape of the components and their arrangement;
  • A lower effect on the value of kef is observed from internal porosity that concerns hollow components and is related to their geometry;
  • A substantial impact on the value of coefficient kef is observed for thermal contact resistance, occurring between the adjacent components of the charge, with the value of this resistance depending mainly on the real contact area in the joints.
The described examinations represent one of the parts of the studies devoted to the development of analytical models of effective thermal conductivity of various types of steel porous charge. Results of the measurements, which are the most reliable source of information about the coefficient kef, will represent the basis for the validation of these models.

Funding

This research received no external funding.

Institutional Review Board Statement

Not applicable.

Informed Consent Statement

Not applicable.

Data Availability Statement

Not applicable.

Conflicts of Interest

The author declares no conflict of interest.

Sample Availability

Investigated samples are available from the authors.

References

  1. Totten, G.E. (Ed.) Steel Heat Treatment Handbook. Metallurgy and Technologies; CRC Taylor & Francis Group: Boca Raton, FL, USA, 2006. [Google Scholar]
  2. Sahay, S.S.; Kapur, P.C. Model Based Scheduling of a Continuous Annealing Furnace. Iron Steelmak. 2007, 34, 262–268. [Google Scholar] [CrossRef]
  3. Jaluria, Y. Numerical Simulation of the Transport Process in a Heat Treatment Furnace. Int. J. Numer. Methods Eng. 1988, 25, 387–399. [Google Scholar] [CrossRef]
  4. Rao, T.R.; Barth, G.J.; Miller, J.R. Computer Model Prediction of Heating, Soaking and Cooking Times in Batch Coil Annealing. Iron Steel Eng. 1983, 60, 22–33. [Google Scholar]
  5. Sahay, S.S.; Krishnan, K. Model Based Optimization of Continuous Annealing Operation for Bundle of Packed Rods. Ironmak. Steelmak. 2007, 29, 89–94. [Google Scholar] [CrossRef]
  6. Ginkul, S.I.; Biryukov, A.B.; Ivanova, A.A.; Gnitiev, P.A. Predictive Mathematical Model of the Process of Metal Heating in Walking-Beam Furnaces. Metallurgist 2018, 62, 15–21. [Google Scholar] [CrossRef]
  7. Kim, M.Y. A Heat Transfer Model for the Analysis of Transient Heating of the Slab in a Direct-Fired Walking Beam Type Reheating Furnace. Int. J. Heat Mass Transf. 2007, 50, 3740–3748. [Google Scholar] [CrossRef]
  8. Shelton, S.N. Thermal Conductivity of Some Irons and Steels Over the Temperature Range 100 to 500 C. Stand. J. Res. 1934, 12, 441–449. [Google Scholar] [CrossRef]
  9. Cengel, Y.A. Heat and Mass Transfer. A Practical Approach, 3rd ed.; Mc Graw Hill: New York, NY, USA, 2002. [Google Scholar]
  10. Spur, G.; Stoferle, T. (Eds.) Handbuch der Fertigungstechnik; Carl Hausner: Munich, Germany, 1987; Volume 4/2. (In German) [Google Scholar]
  11. Wyczolkowski, R.; Musial, D. The Experimental Study of Natural Convection within the Space of a Bundle of Rectangular Sections. Exp. Therm. Fluid Sci. 2013, 51, 122–134. [Google Scholar] [CrossRef]
  12. Wyczólkowski, R.; Urbaniak, D. Modeling of Radiation in Bar Bundles Using the Thermal Resistance Concept. J. Thermophys. Heat Transf. 2016, 30, 721–729. [Google Scholar] [CrossRef]
  13. Musiał, M. Numerical Analysis of the Process of Heating of a Bed of Steel Bars. Arch. Metall. Mater. 2013, 1, 63–66. [Google Scholar] [CrossRef]
  14. Kolmasiak, C.; Wyleciał, T. Heat Treatment of Steel Products as an Example of Transport Phenomenon in Porous Media. Metalurgija 2018, 57, 363–366. [Google Scholar]
  15. Kaviany, M. Principles of Heat Transfer in Porous Media, 2nd ed.; Springer: New York, NY, USA, 1995. [Google Scholar]
  16. van Antverpen, W.; du Toit, C.G.; Rousseau, P.G. A Review of Correlations to Model the Packing Structure and Effective Thermal Conductivity in Packed Beds of Mono-Sized Spherical Particles. Nucl. Eng. Des. 2010, 240, 1803–1818. [Google Scholar] [CrossRef]
  17. Öchsner, A.; Murch, G.E.; de Lemos, M.J.S. (Eds.) Cellular and Porous Materials: Thermal Properties Simulation and Prediction; WILEY-VCH Verlag GmbH & Co, KGaA: Wenheim, Germany, 2008. [Google Scholar]
  18. Tavman, I.H. Effective Thermal Conductivity of Granular Porous Material. Int. Commun. Heat Mass Transf. 1996, 23, 169–176. [Google Scholar] [CrossRef]
  19. Cheng, P.; Hsu, T.C. The Effective Stagnant Thermal Conductivity of Porous Media with Periodic Structures. J. Porous Media 1999, 2, 19–38. [Google Scholar] [CrossRef]
  20. Palaniswamy, S.K.A.; Venugopal, P.R.; Palaniswamy, K. Effective Thermal Conductivity Modeling with Primary and Secondary Parameters for Two-Phase Materials. Therm. Sci. 2010, 14, 393–407. [Google Scholar] [CrossRef]
  21. Zuo, Y.; Wu, W.; Zhang, X.; Lin, L.; Xiang, S.; Liu, T.; Niu, L.; Huang, X. A Study of Heat Transfer in High-Performance Hydrogen Bell-Type Annealing Furnace. Heat Transf. Asian Res. 2001, 30, 615–623. [Google Scholar] [CrossRef]
  22. Zhang, X.; Yu, F.; Wu, W.; Zuo, Y. Application of Radial Effective Thermal Conductivity for Heat Transfer Model of Steel Coils in HPH Furnace. Int. J. Thermophys. 2003, 24, 1395–1405. [Google Scholar] [CrossRef]
  23. Saboonchi, A.; Hassanpour, S.; Abbasi, S. New Heating Schedule in Hydrogen Annealing Furnace Based on Process Simulation for Less Energy Consumption. Energy Convers. Manag. 2008, 49, 3211–3216. [Google Scholar] [CrossRef]
  24. Zhao, C.Y.; Lu, T.J.; Hodson, H.P.; Jackson, J.D. The Temperature Dependence of Effective Thermal Conductivity of Open-Celled Steel Alloy Foams. Mater. Sci. Eng. A 2004, 367, 123–131. [Google Scholar] [CrossRef]
  25. Peak, J.W.; Kang, B.H.; Kim, S.Y.; Hyun, J.M. Effective Thermal Conductivity and Permeability of Aluminum Foam Materials. Int. J. Thermophys. 2000, 21, 453–464. [Google Scholar] [CrossRef]
  26. Zhang, B.M.; Zhao, S.Y.; He, X.D. Experimental and Theoretical Studies on High-Temperature Thermal Properties of Fibrous Insulation. J. Quant. Spect. Radiat. Trans. 2008, 109, 1309–1324. [Google Scholar] [CrossRef]
  27. Edet, C.O.; Ushie, P.O.; Ekpo, C.M. Effect of additives on the thermal conductivity of loamy soil in cross river university of technology (crutech) farm, Calabar. Asian J. Phys. Chem. Sci. 2017, 3, 1–8. [Google Scholar] [CrossRef]
  28. Xu, Y.; Jiang, L.; Liu, J.; Zhang, Y.; Xu, J.; He, G. Experimental study and modeling on effective thermal conductivity of EPS lightweight concrete. J. Therm. Sci. Technol. 2015, 11, JTST0023. [Google Scholar] [CrossRef] [Green Version]
  29. Janjarasskul, T.; Lee, S.; Inoue, S.; Matsumura, Y.; Charinpanitkul, T. Enhancement of the effective thermal conductivity in packed beds by direct synthesis of carbon nanotubes. J. Therm. Sci. Technol. 2015, 10, JTST0013. [Google Scholar] [CrossRef] [Green Version]
  30. ASTM C1044-12. Standard Practice for Using a Guarded-Hot-Plate Apparatus or Thin-Heater Apparatus in the Single-Sided Mode; ASTM International: West Conshohocken, PA, USA, 2012. [Google Scholar]
  31. ASTM C177-13. Standard Test Method for Steady-State Heat Flux Measurements and Thermal Transmission Properties by Means of the Guarded-Hot-Plate Apparatus; ASTM International: West Conshohocken, PA, USA, 2013. [Google Scholar]
  32. Temperature Sensor TP-201_206 (Sheathed Thermocouple). Available online: https://www.czaki.pl/en/produkt/temperature-sensor-tp-201_206/ (accessed on 17 November 2021).
  33. EMT-200 Temperature Meter. Available online: https://www.czaki.pl/en/produkt/emt-200-temperature-meter/ (accessed on 17 November 2021).
  34. Saving Energy with Electric Resistance Heating. Available online: https://www.nrel.gov/docs/legosti/fy97/6987.pdf (accessed on 17 November 2021).
  35. 3-Phase Power Network Meter N14. Available online: https://www.lumel.com.pl/en/catalogue/product/3-phase-power-network-meter-n14 (accessed on 17 November 2021).
  36. European Steel and Alloy Grades/Numbers Steel Number. Available online: http://www.steelnumber.com/en/steel_composition_eu.php?name_id=645 (accessed on 30 July 2021).
  37. Taylor, J.R. An Introduction to Error Analysis; The Study of Uncertainties in Physical Measurements, 2nd ed.; University Science Book: Sausaliti, CA, USA, 1997. [Google Scholar]
  38. Breitbah, G.; Barthels, H. The Radiant Heat Transfer in the High Temperature Reactor Core After Failure of the Heat Removal System. Nucl. Technol. 1980, 49, 392–399. [Google Scholar] [CrossRef]
  39. Wyczółkowski, R.; Gała, M.; Szwaja, S.; Piotrowski, A. Determination of the Radiation Exchange Factor in the Bundle of Steel Round Bars. Energies 2021, 14, 5263. [Google Scholar] [CrossRef]
  40. Wyczółkowski, R. Computational model of complex heat flow in the area of steel rectangular section. Proc. Eng. 2016, 157, 185–192. [Google Scholar] [CrossRef] [Green Version]
  41. Wyczółkowski, R.; Szmidla, J.; Gała, M.; Bagdasaryan, V. Analysis of Nusselt Number for Natural Convection in Package of Square Steel Sections. Acta Phys. Pol. A 2020, 139, 548–551. [Google Scholar] [CrossRef]
  42. Wyczółkowski, R.; Gała, M.; Bagdasaryan, V. Model of Complex Heat Transfer in the Package of Rectangular Steel Sections. Appl. Sci. 2020, 10, 9044. [Google Scholar] [CrossRef]
  43. Mikic, B.B. Thermal Contact Conductance: Theoretical Consideration. Int. J. Heat Transf. 1974, 17, 205–214. [Google Scholar] [CrossRef]
  44. Shridar, M.R.; Yovanovich, M.M. Review of Elastic and Plastic Contact Conductance Models: Comparison with Experiment. J. Thermophys. Heat Transf. 1994, 8, 633–640. [Google Scholar] [CrossRef]
  45. Kolmasiak, C.; Bagdasaryan, V.; Wyleciał, T.; Gała, M. Analysing the Contact Conduction Influence on the Heat Transfer Intensity in the Rectangular Steel Bars Bundle. Materials 2021, 14, 5655. [Google Scholar] [CrossRef] [PubMed]
  46. Xu, W.; Zhang, H.; Yang, Z.; Zhang, J. The Effective Thermal Conductivity of Three-Dimensional Reticulated Foam Material. J. Porous Mater. 2009, 16, 65–71. [Google Scholar] [CrossRef]
  47. Wyczółkowski, R.; Strychalska, D.; Bagdasaryan, V. Correlations for the Thermal Conductivity of Selected Steel Grades as a Function of Temperature in the Range of 0–800 °C. Unpublished Work Accepted for Publication at Scientific Conference “XV Research & Development in Power Engineering Conference, Warshaw. 2021. Available online: https://www.rdpe.itc.pw.edu.pl/public/site/2021/A_BOOK_OF_ABSTRACTS_RDPE_2021_11_30.pdf (accessed on 15 December 2021).
  48. Wyczółkowski, R.; Bagdasaryan, V.; Szwaja, S. On Determination of the Effective Thermal Conductivity of a Bundle of Steel Bars Using the Krischer Model and Considering Thermal Radiation. Materials 2021, 14, 4378. [Google Scholar] [CrossRef]
  49. Carson, J.K. A Versatile Effective Thermal Diffusivity Model for Porous Materials. Int. J. Thermophys. 2021, 42, 141. [Google Scholar] [CrossRef]
Figure 1. Typical examples of the steel porous charge: (a) wire coil treated in bell-type furnace, (b) square bar bundles treated in soaking furnace.
Solids 02 00027 g001
Figure 2. A general view of the testing stand: 1—heating chamber, 2—control unit of main and guarded heaters, 3—data logger with temperature meter, 4—autotransformer, 5—unit of cooling system.
Solids 02 00027 g002
Figure 3. Scheme of the heating chamber: 1—retort with a hot plate, 2—investigated sample, 3—cold plate, 4—heating chamber cover with a cooler, 5—side guarded heater, 6—main heater, 7—bottom guarded heater, 8—thermal insulation, 9—support structure.
Solids 02 00027 g003
Figure 4. Pictorial photographs showing geometrical structure of two samples: (a) sample of square bars, (b) sample of rectangular sections.
Solids 02 00027 g004
Figure 5. Samples of round bars with staggered (a) and in-line (b) arrangements.
Solids 02 00027 g005
Figure 6. Samples of flat bars with parallel (a) and mixed (b) arrangements.
Solids 02 00027 g006
Figure 7. Effective thermal conductivity of round bar samples with staggered arrangement.
Solids 02 00027 g007
Figure 8. Effective thermal conductivity of round bar samples with in-line arrangement.
Solids 02 00027 g008
Figure 9. Effective thermal conductivity of square bar samples.
Solids 02 00027 g009
Figure 10. Effective thermal conductivity of flat bar samples.
Solids 02 00027 g010
Figure 11. Effective thermal conductivity of rectangular section samples.
Solids 02 00027 g011
Figure 12. Coefficient kef for samples made of 10 mm components depending on porosity.
Solids 02 00027 g012
Figure 13. Coefficient kef for samples made of 20 mm components depending on porosity.
Solids 02 00027 g013
Figure 14. Coefficient kef for samples made of 30 mm components depending on porosity.
Solids 02 00027 g014
Figure 15. Minimum and maximum values of Kr versus temperature.
Solids 02 00027 g015
Table 1. The values of coefficients k0, β, and R2 for individual samples.
Sample TypeElement Dimensionk0βR2
Staggered round bars10 mm1.570.00210.981
20 mm2.390.00420.974
30 mm3.110.00510.998
In-line round bars10 mm1.480.00220.993
20 mm2.020.00370.993
30 mm2.540.00540.990
Square bars10 mm2.540.00190.994
20 mm4.480.00310.967
30 mm5.910.00360.982
Parallel flat bars5 × 20 mm1.860.00140.993
10 × 40 mm2.430.00150.992
Mixed flat bars5 × 20 mm2.100.00210.980
10 × 40 mm3.090.00330.988
Sections40 × 40 mm3.950.00190.984
60 × 60 mm4.180.00310.977
Publisher’s Note: MDPI stays neutral with regard to jurisdictional claims in published maps and institutional affiliations.

