Article

Anharmonic Effects in Ordered Kesterite-Type Cu2ZnSnS4

1
GFZ German Research Center for Geosciences, Telegrafenberg, 14473 Potsdam, Germany
2
Institut für Chemie, Technische Universität Berlin, Straße des 17 Juni 135, 10623 Berlin, Germany
3
Helmholtz-Zentrum Berlin für Materialien und Energie, Hahn-Meitner-Platz 1, 14109 Berlin, Germany
4
Max-Planck-Institut für Eisenforschung GmbH, Max-Planck-Str. 1, 40237 Düsseldorf, Germany
*
Author to whom correspondence should be addressed.
Solids 2021, 2(4), 385-394; https://doi.org/10.3390/solids2040024
Submission received: 28 October 2021 / Revised: 12 November 2021 / Accepted: 22 November 2021 / Published: 24 November 2021
(This article belongs to the Special Issue Feature Papers of Solids 2021)

Abstract

:
We performed an in-depth investigation and analysis of the effect of temperature on the Raman-active A-modes of bulk kesterite-type Cu2ZnSnS4 within the 300–460 K temperature range. We acquired the individual contributions to each Raman mode, namely, the thermal expansion and anharmonic interactions terms responsible for the Raman shift and broadening with temperature. Our results indicate that the Raman shift with temperature is dominated by the thermal expansion term, whereas the broadening is mainly governed by three-phonon damping processes in this material. Considering relevant results from the literature, it appears that dimensionality is a key factor in regulating the dominant phonon decay mechanism.

1. Introduction

The quaternary semiconductor Cu2ZnSnS4 has received considerable attention in recent years due to its potential use as a solar absorber [1,2]. The promising photovoltaic properties of this material come from its almost optimal optical band gap (Eg~1.5 eV), its high absorption coefficient in the visible range (~104 cm−1), and its earth-abundant, low-cost, and nontoxic elemental constituents [2,3]. Moreover, the possibility for using this environmentally friendly material in thermoelectric applications has also emerged recently [4,5,6]. The current record for the thermoelectric figure of merit ZT = 1.6 has been achieved for Na-doped Cu2ZnSnS4 single crystals at 800 K [4], a rather promising and competitive value [7]. A critical component for determining the thermoelectric performance of a semiconducting material such as Cu2ZnSnS4 is the inherent anharmonic phonon–phonon interactions, which influence the lattice thermal conductivity. The latter is inversely proportional to ZT, such that an enhancement of ZT can be realized via the reduction in the lattice thermal conductivity contribution. Hence, the understanding of these anharmonic processes may lead to the optimization of the respective thermoelectric efficiency.
In terms of structure, Cu2ZnSnS4 adopts ideally an ordered kesterite-type (KS) phase in ambient conditions, with each metal cation adopting a specific (and unique) Wyckoff position (Figure 1) [8,9]. This phase is composed of alternating Cu/Zn and Cu/Sn layers stacked along the c-axis, with sulfur anions in between. Each of the metal cations is tetrahedrally coordinated with respect to the S2− anions and is structurally derived from the well-known sphalerite/zinc-blende archetypal phase [10].
We should point out here that the synthesis of Cu2ZnSnS4 samples suffers from several issues such as cationic disorder, point defects, deviation from ideal stoichiometry, and appearance of secondary phases. Actually, several recent studies have been devoted to the identification and the classification of these intrinsic defects, as a means of finding the optimal synthesis conditions [11,12,13,14,15,16,17]. It is generally observed that, for example, the annealing temperature plays a major role in the stoichiometry of the final product. Moreover, inspection of the available literature reveals that the synthesis procedure is better controlled for bulk KS samples compared to their thin-film counterparts, yielding generally higher-quality (poly)crystalline products [13,14,18,19,20]. Nevertheless, we need to mention that the most common type of intrinsic disorder in KS Cu2ZnSnS4 is the anti-site cationic exchange of the Cu and Zn cations within the z = 1/4 and z = 3/4 cationic layers (Figure 1), leading to the adoption of a disordered kesterite phase [21]. This particular type of disorder is almost always evidenced in the KS structure, owing to the low activation energy barrier [15,17,22]. For more details, the interested reader is referred to the cited works. The aforementioned structural issues affect virtually every other property of the material, including its vibrational response [13,23].
Regarding the latter, one of the most simple and straightforward ways to monitor the anharmonic properties of a material is through separate high-temperature and high-pressure Raman scattering studies [24,25]. Given that we previously conducted high-pressure Raman investigations on a stoichiometric and ordered Cu2ZnSnS4 bulk sample at ambient temperature [26,27], we decided to expand our Raman investigations on the same sample with varying temperature at ambient pressure. This would allow us to model the anharmonicity of the KS Cu2ZnSnS4 Raman-active modes in a reliable and self-consistent manner [28,29] and acquire an in-depth understanding of the damping processes dominating the Raman-active phonons.

2. Materials and Methods

The investigated ordered Cu2ZnSnS4 sample was available in polycrystalline powder form. Synthesis and characterization details can be found elsewhere [30,32,33].
The temperature-dependent Raman measurements at ambient pressure were conducted using a Horiba Jobin Yvon LabRam HR800 VIS single-stage Raman spectrometer, equipped with a 1800 L/mm diffraction grating and a Peltier-cooled charged-coupled device (CCD). A blue diode-pumped solid-state laser (λ = 473 nm) served as the laser excitation source. The laser beam was focused on the sample surface with a 20× objective lens, with the incident laser power staying below ~1 mW in order to avoid any potential sample damage [34]. The measured frequency range was 100–600 cm−1, and the collection time of each spectrum was set to three accumulations of 10 min each. The spectrometer resolution with this configuration is estimated at 1 cm−1, considering the Rayleigh line. Heating of the sample was achieved with a Linkam THMS600 stage, and the sample chamber was purged continuously with argon gas. The thermocouple readout temperature was corrected with an empirical formula, derived from the melting points of different salts and the freezing point of water [35,36]. The Raman-relevant parameters were obtained from the fitting of the Raman spectra with Lorentzian functions, accompanied by linear background correction/subtraction.

3. Results

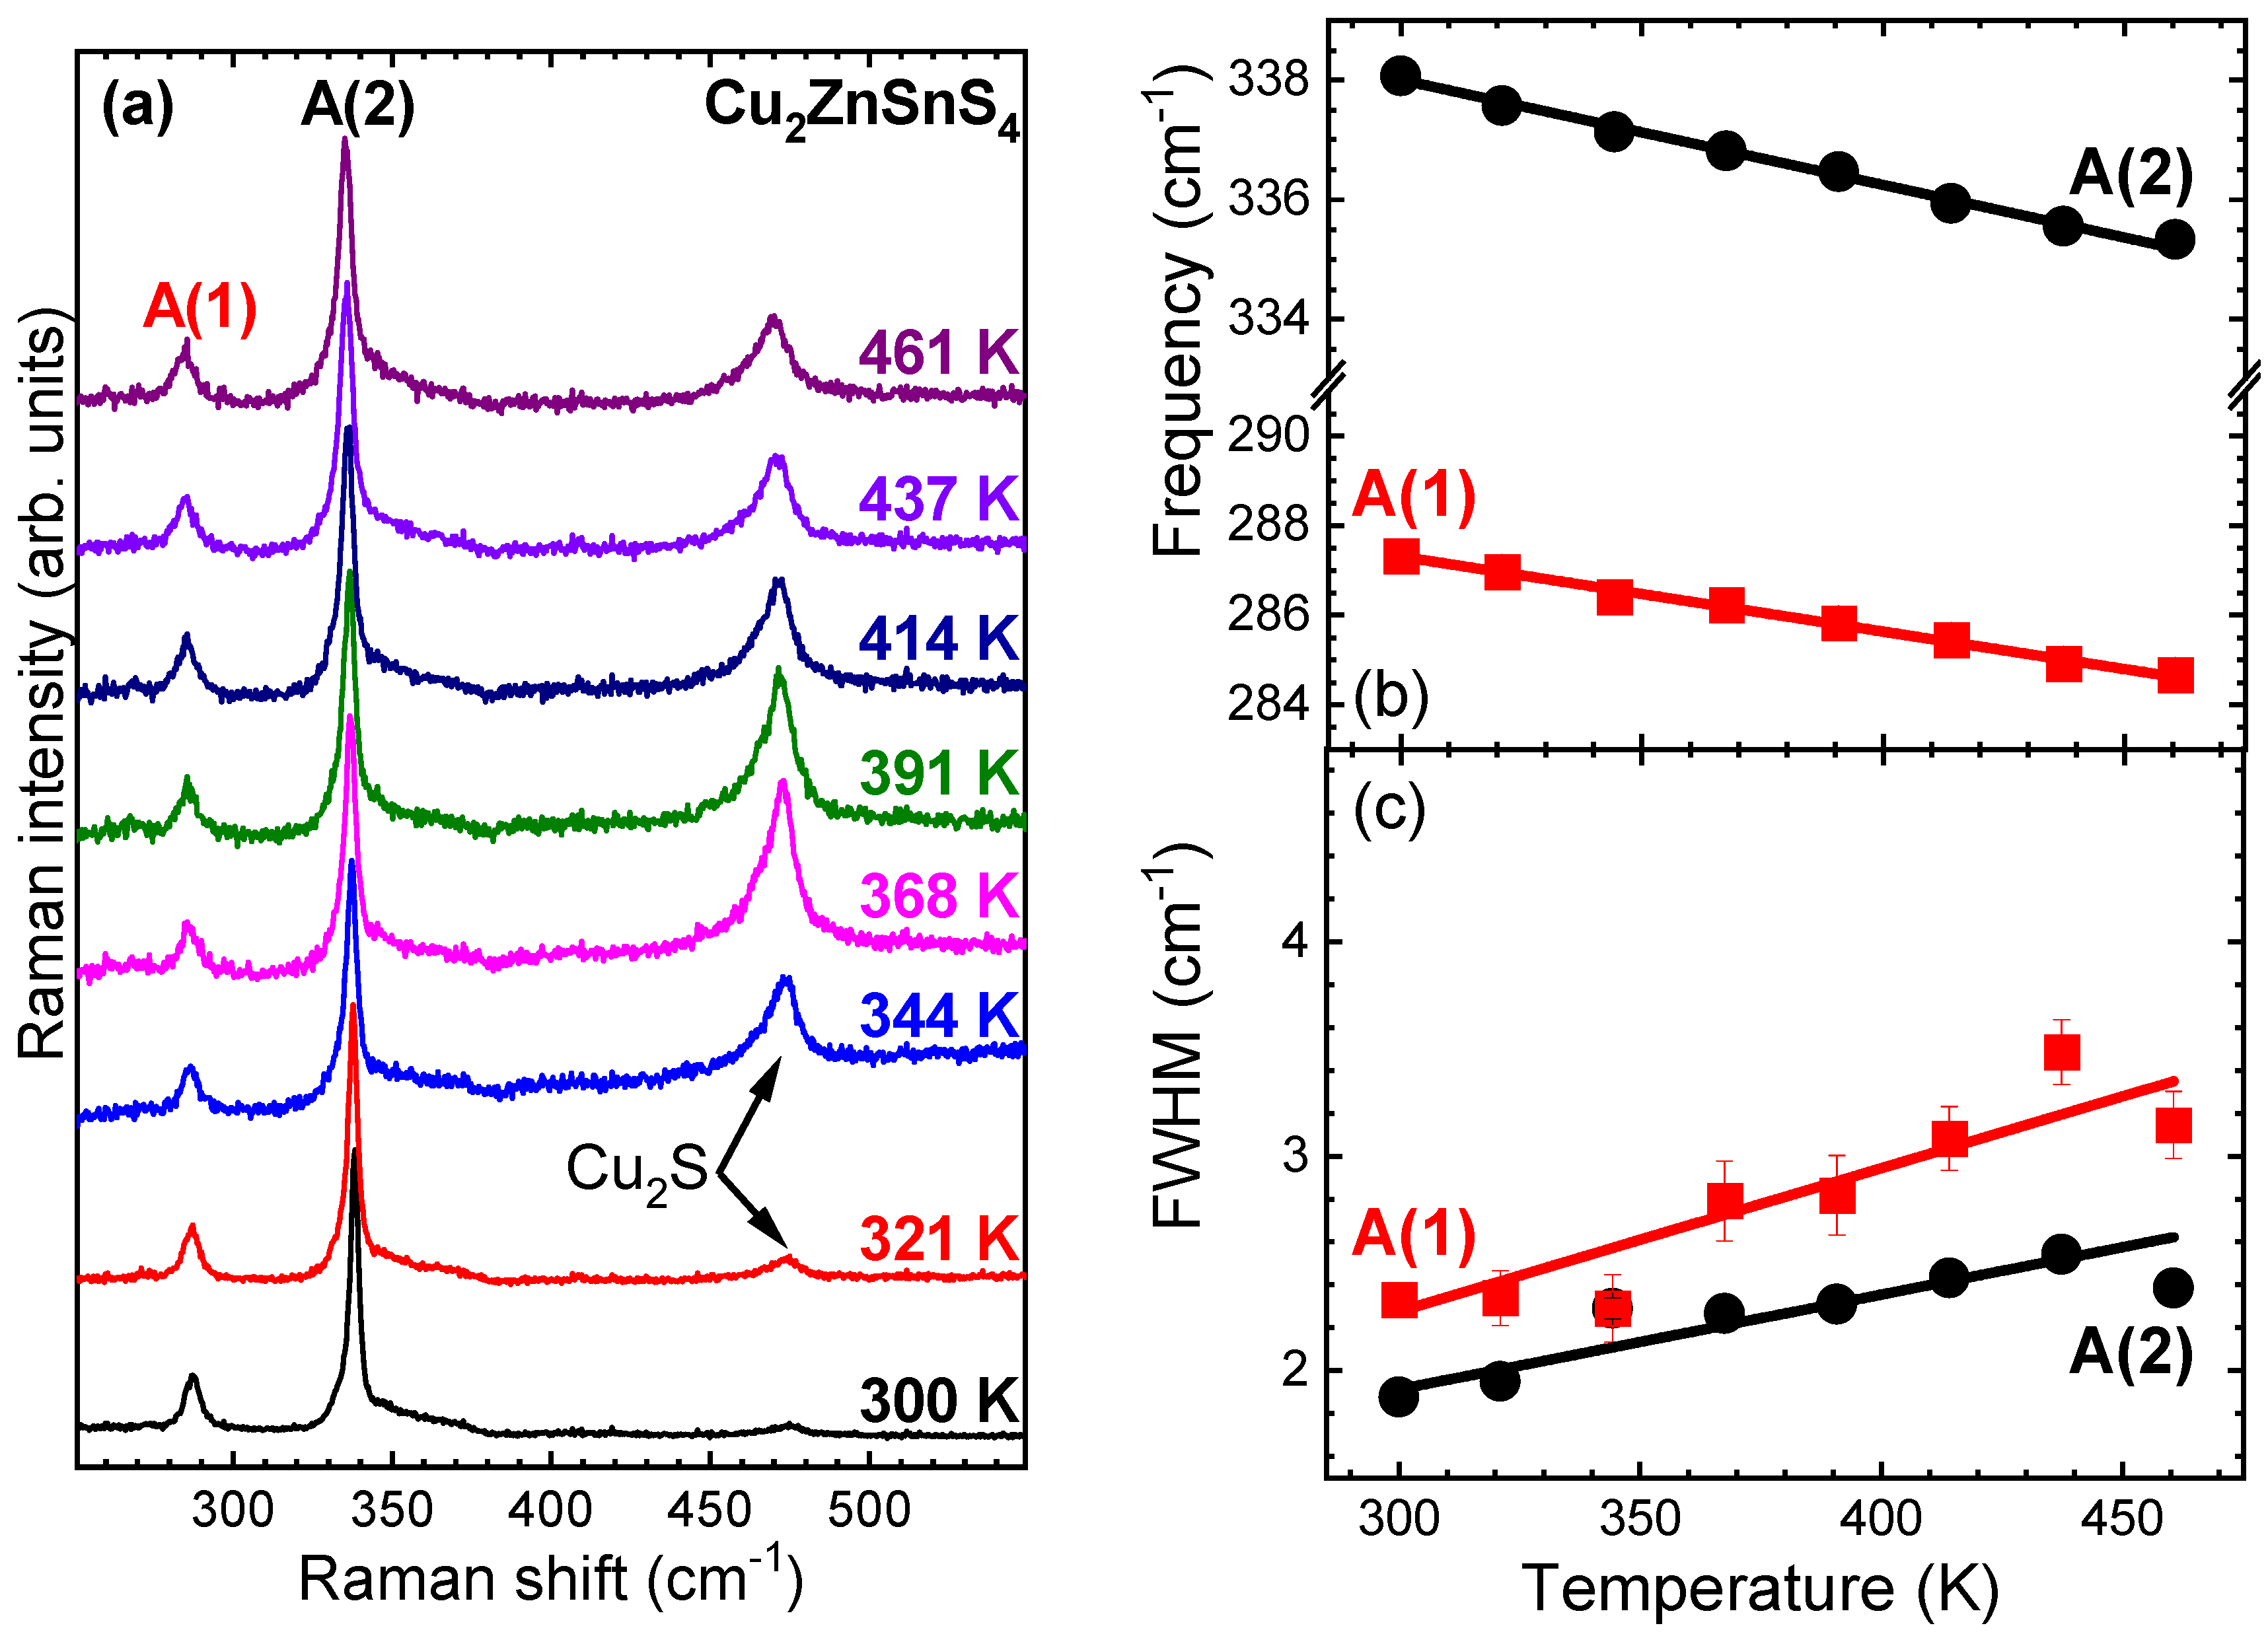
3.1. Temperature Dependence of the Raman-Active Modes in Cu2ZnSnS4

From group theory, a total sum of 15 Raman-active modes are predicted for the KS phase [37].
Γ = 3A + 6B + 6E.
We can readily observe that the KS Raman spectrum in ambient conditions is dominated by two Raman features lying at ~288 cm−1 [A(1)] and ~338 cm−1 [A(2)] (Figure 2), in agreement with results from the literature using blue laser light excitation [23,38]. Both of these Raman modes correspond to A symmetry vibrations and involve sulfur motions mainly along the tetragonal ab plane (288 cm−1) and along the c-axis (338 cm−1) [39]. Moreover, we detected an additional Raman mode close to 475 cm−1, attributed to a Cu2S impurity phase according to previous investigations on the same sample [26,27]. For the sake of completeness, we mention in passing that Cu2S (chalcocite) undergoes a temperature-induced structural transition from the ambient temperature monoclinic phase to a high-temperature hexagonal modification close to ~370 K [40,41], most likely captured in our Raman spectra from the substantial intensity enhancement of the Cu2S-related Raman feature around that temperature (Figure 2a).
In Figure 2a, we plot the measured Raman spectra of the ordered Cu2ZnSnS4 modification at various temperatures. It becomes immediately clear that the Raman spectra do not show any substantial changes with varying temperature within the measured 300–460 K temperature range. The only notable effect taking place is the frequency downshift for both of the KS A modes with increasing temperature, as well as the increase in the respective full width at half maximum (FWHM) (Figure 2b). Both of these effects are consistent with the generic Raman-related behavior of solids upon heating [25].
Before proceeding any further, we should point out here that we restrict the analysis of the current set of Raman experiments up to 460 K, as further temperature increase resulted in the appearance of structural disorder and the subsequent altering of the KS Raman spectra; such temperature-induced order-to-disorder transition, stemming from the mutual anti-site Cu+ and Zn2+ cationic exchange within the respective crystal planes (Figure 1), is well documented in the literature [30,42]. As we are primarily interested in acquiring the KS anharmonic properties at this stage, for the sake of consistency, we confined our analysis within the temperature stability field of the KS phase.
Coming now to the analysis of the obtained data, the isobaric Raman mode frequency evolution of the Raman-active modes as a function of temperature can be expressed with the following equation:
ω i P ( T ) = ω i 0 P + ( ω i T ) P Δ T ,
where ω i 0 P is the (extrapolated) mode frequency at zero temperature and ambient pressure, ΔT is the temperature difference, and (∂ωi/∂T)P is the first-order temperature coefficient. Moreover, the isothermal mode Grüneisen parameters γ i P can also be calculated with the following formula [25]:
γ i P = 1 α V ω i 0 P ( ω i T ) P Δ T ,
where αV represents the volumetric thermal expansion coefficient. The latter value can be calculated from the in situ structural data for the 300–460 K temperature range [42]. The extracted results are tabulated in Table 1.
In a similar fashion, the width of the KS Raman modes against temperature can also be fitted with a polynomial function (Figure 2c).
Γ i ( T ) = Γ i 0 P + ( Γ i T ) P Δ T ,
where Γ i 0 P is the (extrapolated) width at zero temperature and ambient pressure, ΔT is the temperature difference, and (Γi/∂T)P is the first-order temperature coefficient. The respective fitting parameters are also tabulated in Table 1.

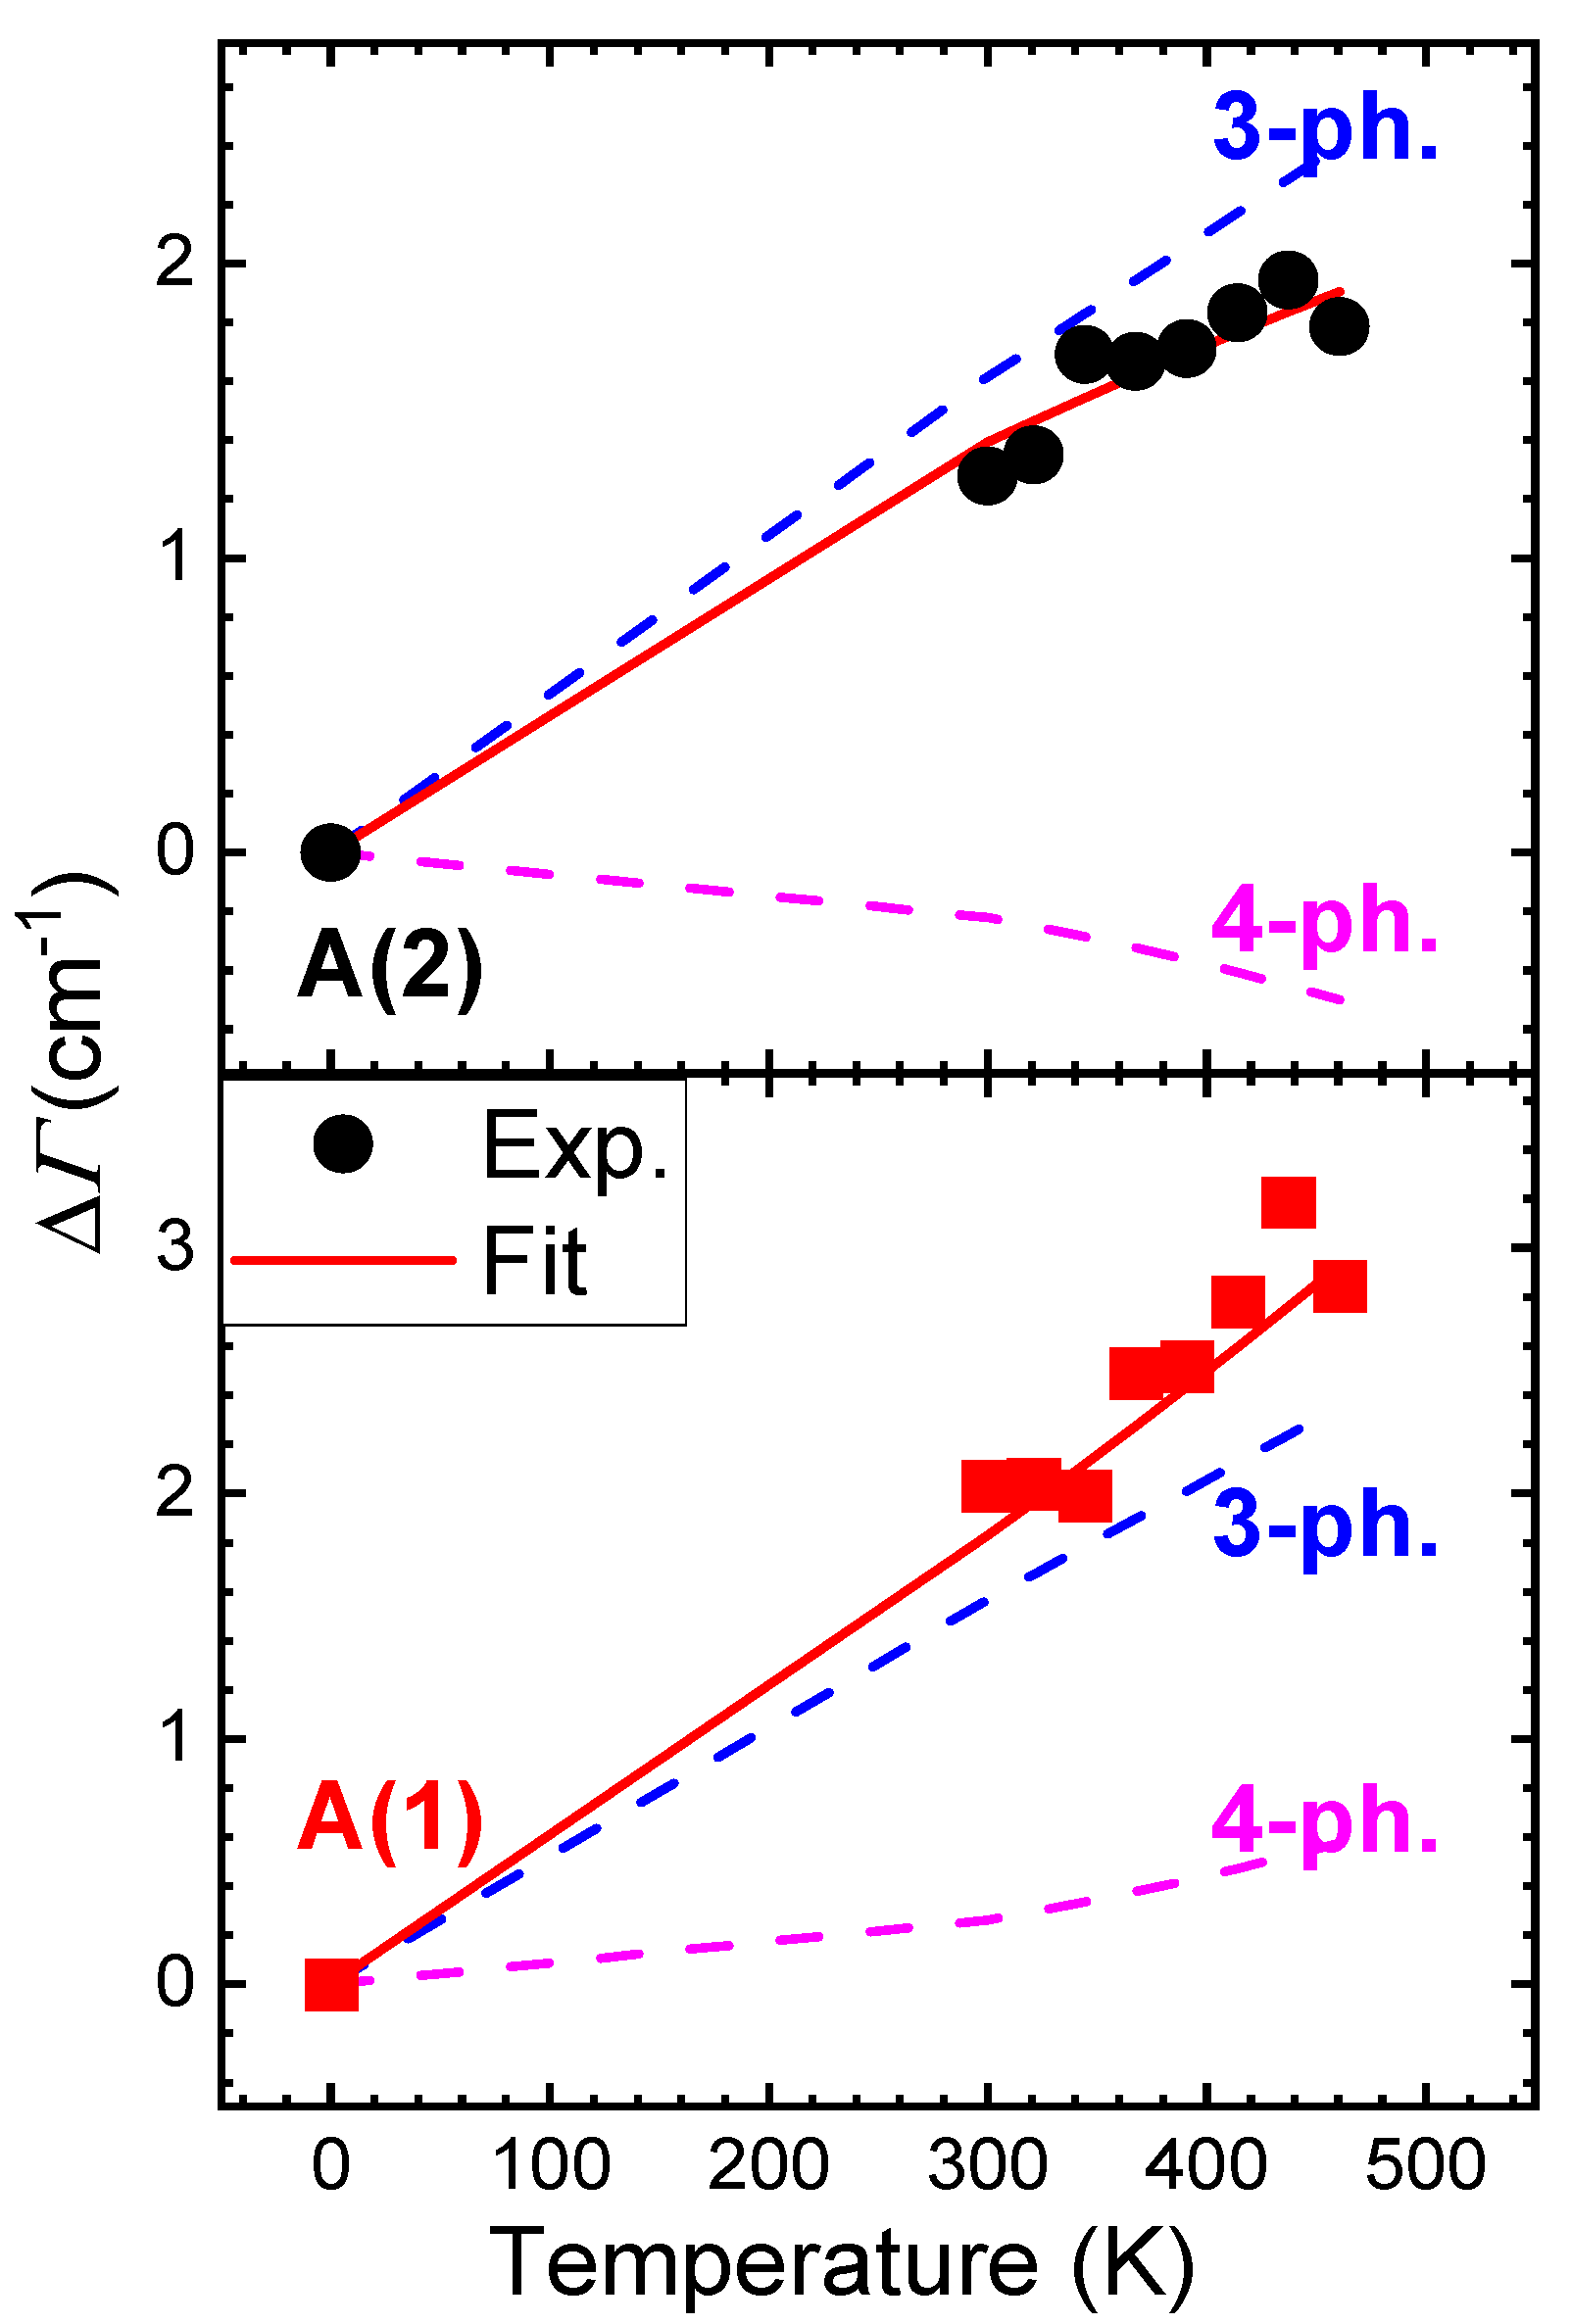
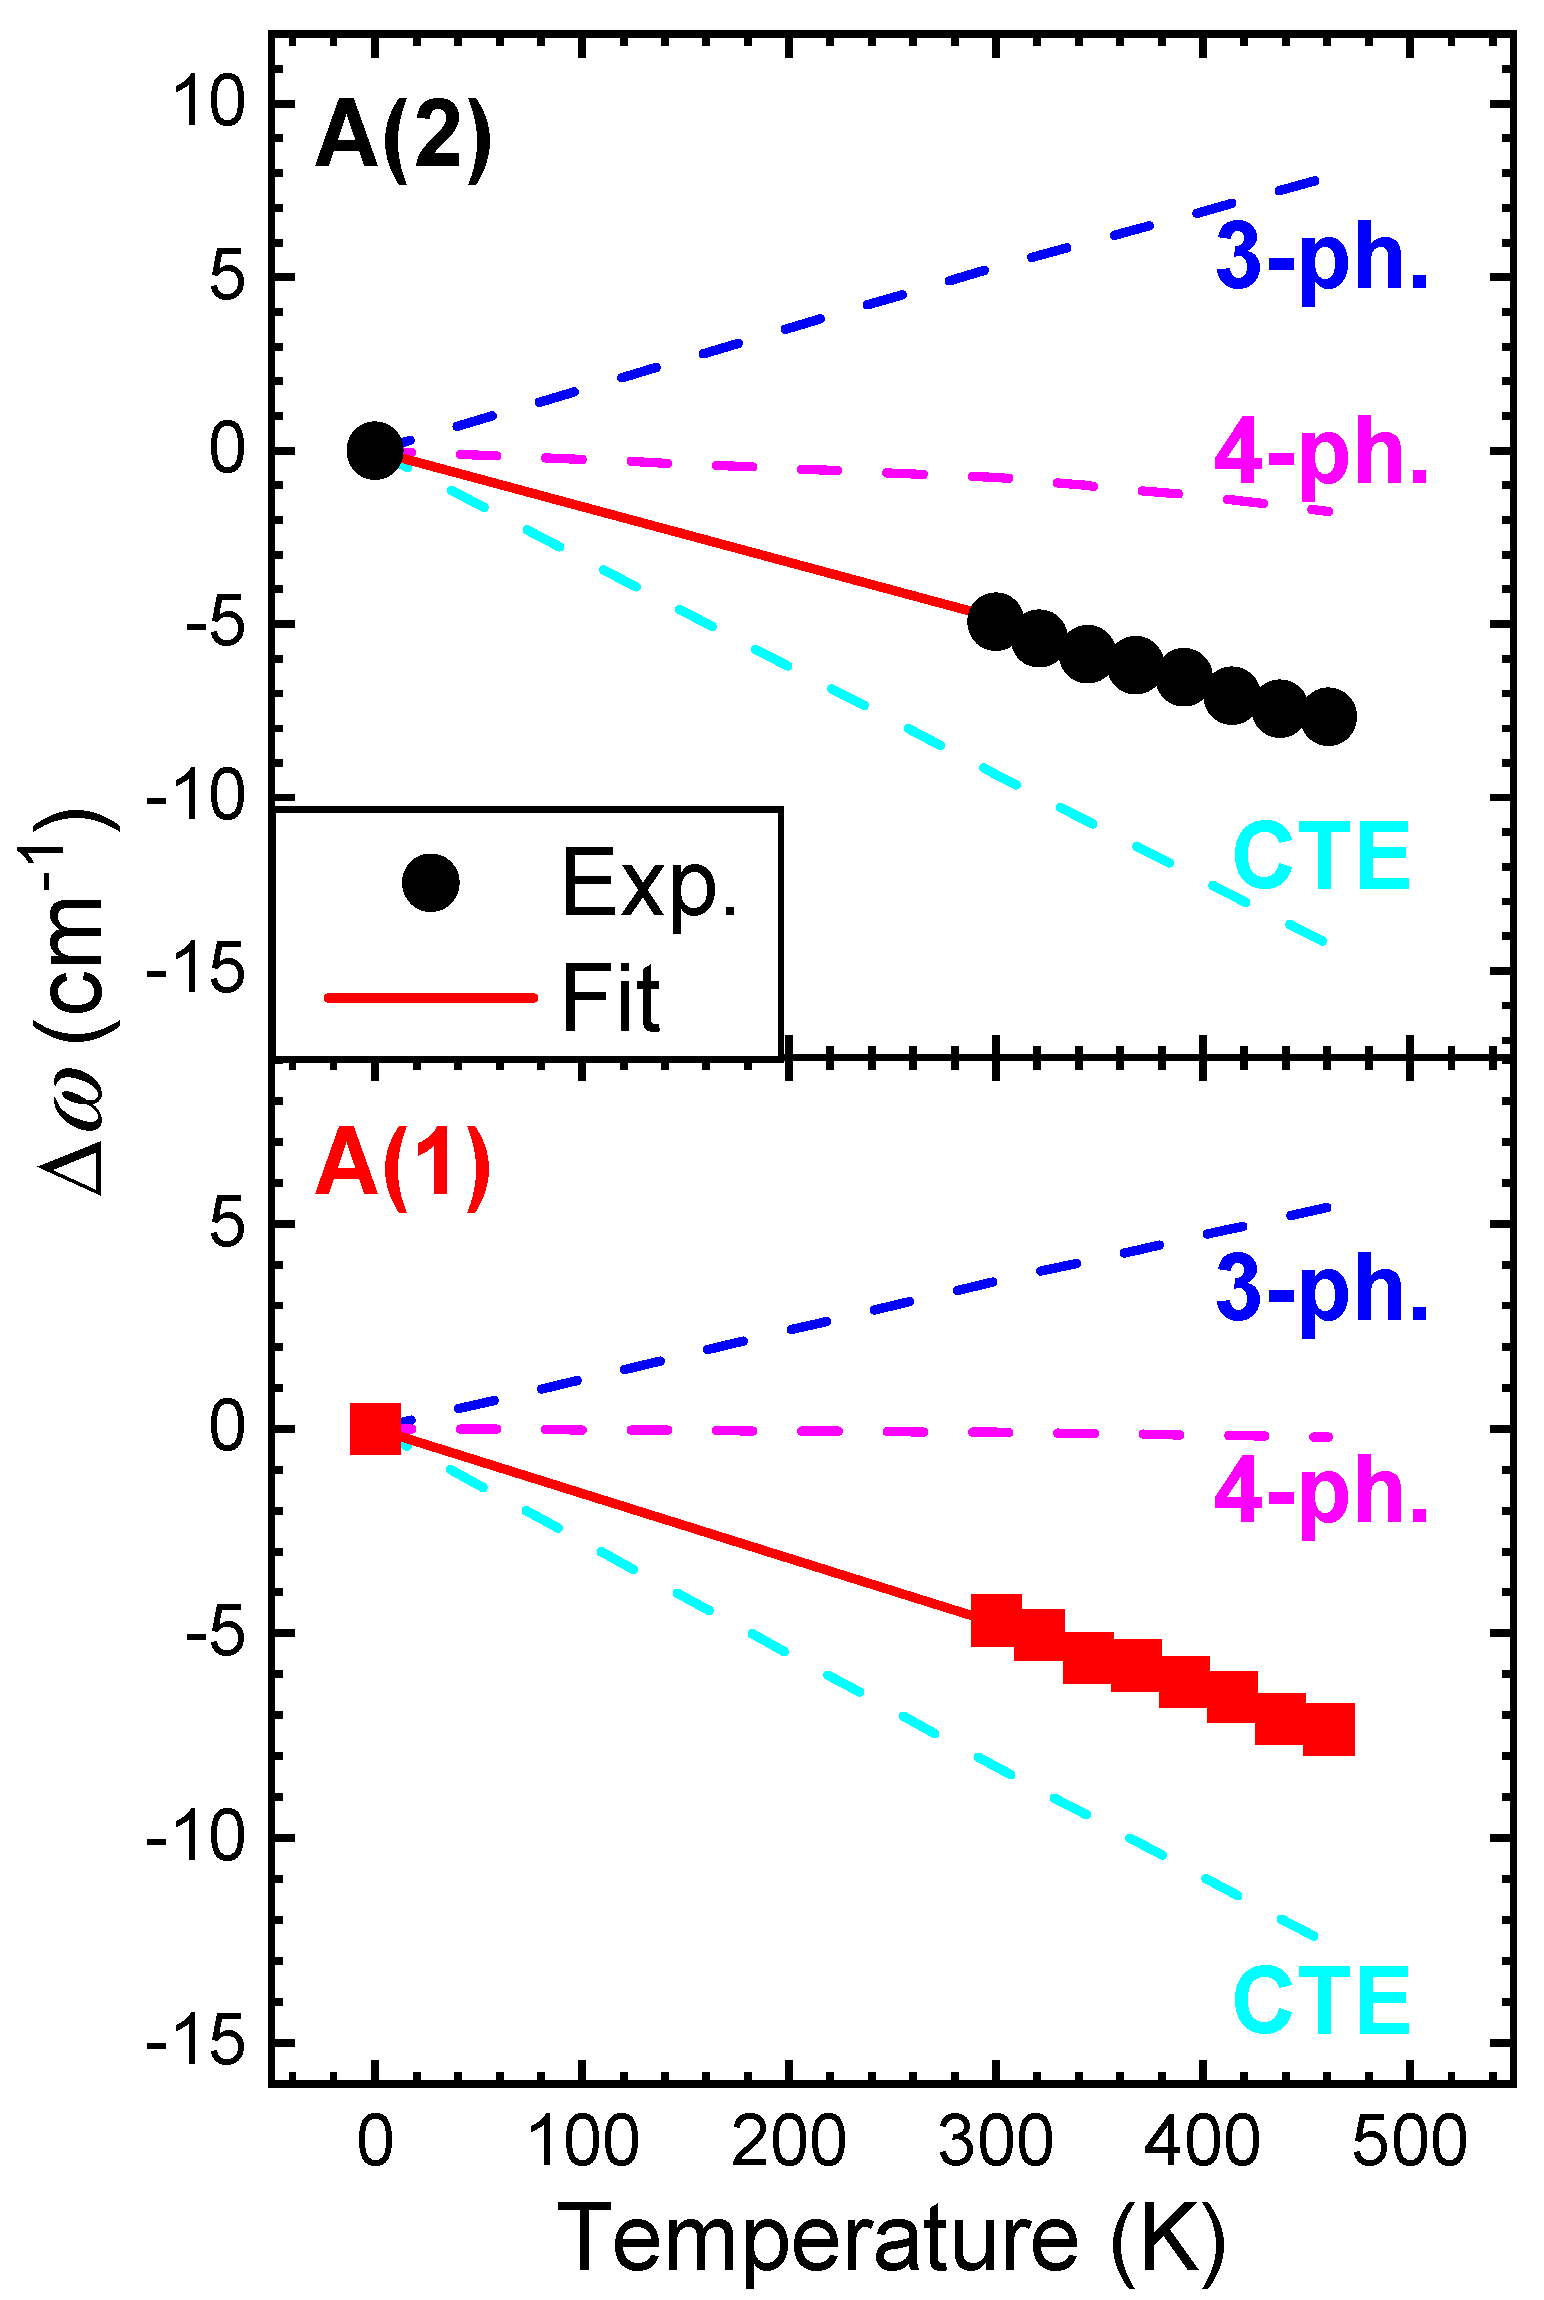
3.2. Modeling Phonon Anharmonicity in Cu2ZnSnS4

The shift of a Raman-active mode with varying temperature is generally attributed to thermal expansion (volumetric) and anharmonic effects, and it can be approximated by the following equation [25,29]:
Δ ω ( T ) = ω i ( T ) ω i 0 P = Δ ω E ( T ) + Δ ω A ( T ) .
The ΔωE(T) term indicates the volumetric thermal expansion contribution (implicit term), and the ΔωA(T) term describes the anharmonic phonon–phonon interactions (explicit term) to the mode-specific temperature dependence. The ΔωE(T) part is given by the following expression [24,29]:
Δ ω E ( T ) = ω i 0 P [ e x p ( n 300   K 460   K γ i T α V ( T ) d T ) 1 ] ,
where n denotes the degeneracy of the respective Raman-active vibration (n = 1 for the A mode symmetries examined here), and γ i T is the respective isothermal mode Grüneisen parameter (here taken from [27]). Assuming that γ i T is temperature-independent, we calculated the implicit part (CTE) of each KS Cu2ZnSnS4 A-mode’s frequency shift with temperature (Figure 3).
On the other hand, the anharmonic/explicit ΔωA(T) term can be expressed with the following equation [29]:
Δ ω A ( T ) = A [ 1 + 2 e x 1 ] + B [ 1 + 3 e y 1 + 3 ( e y 1 ) 2 ]   ,
where x = ħωi0P/2kBT, y = ħωi0P/3kBT, ħ is the reduced Planck’s constant, kB is Boltzmann’s constant, and A and B are anharmonic constants used as fitting parameters. The A and B constants indicate the magnitude of the three-phonon (cubic) and four-phonon (quartic) processes, respectively, i.e., the decay of one particular optical Γ phonon (here the KS A-modes) into two (cubic) or three (quartic) phonons at different points of the KS Brillouin zone, according to energy and momentum conservation rules [28]. The respective calculated three-phonon (3-ph.) and four-phonon (4-ph.) contributions to the A mode frequency shifts with temperature are also shown in Figure 3.
We turn now to the modeling of the width Γ of the Cu2ZnSnS4 A-bands as a function of temperature. Generally, the behavior of Γ, which represents the lifetime of the respective phonon, can be accounted for by two physical processes [24].
Γ ( T ) = Γ 0 + Γ E P C ( T ) + Γ a n ( T )   ,
where the temperature-independent Γ0 term stands for the width contribution due to, e.g., the finite spectrometer resolution and/or other scattering mechanisms such as crystalline defects and impurities present in real samples [47], and the ΓEPC and Γan factors denote contributions from the electron–phonon coupling (decay of the phonon into a hole–electron pair) and the anharmonic phonon–phonon scattering, respectively. The ΓEPC term is relevant only in (semi)metallic systems [24,48] and can be neglected for the semiconducting Cu2ZnSnS4. On the other hand, the anharmonic Γan part can be expressed as follows [24,29]:
Γ a n ( T ) = C [ 1 + 2 e x 1 ] + D [ 1 + 3 e y 1 + 3 ( e y 1 ) 2 ]   ,
where x = ħωi0P/2kBT, y = ħωi0P/3kBT, and C and D are fitting parameters for the three- and four-phonon decay processes. The respective fittings are shown in Figure 4, with the calculated parameters listed in Table 2.

4. Discussion

From the aforementioned rigorous analysis, it becomes clear that the frequency shift for both A modes of Cu2ZnSnS4 as a function of temperature is dominated by the thermal expansion term, whereas the four-phonon contribution is marginal within the investigated temperature range (Figure 3). Interestingly, the three-phonon term shows a clear increase with increasing temperature for both modes (positive A parameter in Table 2), a sign of up-conversion decay channels for both of these vibrations [49]. Nevertheless, it can be noted that the strength of the cubic and quartic phonon damping processes is significantly larger for the A(2) mode compared to the A(1) vibration, indicating the wider availability of decay channels for the former [37,50].
For the A-mode width temperature dependence, on the other hand, the three-phonon mechanism is clearly the dominant factor in determining the phonon lifetimes for both modes (Figure 4). Such a result is consistent with the general trend of semiconducting materials [24,51].
Comparison with the available literature data reveals some interesting traits. Our results are in stark contrast with a previous study on Cu2ZnSnS4 thin films, where the dominant damping mechanism was found to be four-phonon processes [43,44]. Possible reasons behind this discrepancy might be, e.g., differences in the studied temperature range (Table 2), sample stoichiometry, presence and type of defects, the presence of intrinsic and extrinsic strain, and dimensionality, as well as a possible influence of the underlying substrate in the Raman measurements [52]. Interestingly, the four-phonon process was also shown to be the major decay mechanism for the isostructural kesterite-type Cu2ZnSnSe4 thin films [45]. On the other hand, the thermal expansion term is the prevailing damping factor for the Raman-active phonons of the closely related stannite-type Cu2FeSnS4 [46]. Since the latter sample was investigated in bulk form, as our Cu2ZnSnS4 sample here, it appears that dimensionality strongly influences the exact phonon damping mechanism (at least within kesterite-type materials). Actually, the reduction in dimensionality, i.e., passing from the respective bulk compounds to thin films and nanomaterials, seemingly enhances the strength of both three- and four-phonon processes [48,53,54,55]. If that is indeed the case, one could also manipulate and even control the dominant phonon scattering processes in Cu2ZnSnS4 and, consequently, its thermoelectric performance by altering the material’s dimensions (e.g., thickness and number of layers for thin films). Indeed, the enhancement of a material’s thermoelectric performance via the reduction in lattice thermal conductivity, stemming in turn from the reduction in its dimensions, has received significant attention in recent years [56]. Follow-up experimental investigations are needed, however, in order to verify this possibility in both the Cu2ZnSnS4 compound and in other technologically important material families.

5. Conclusions

In summary, we investigated the effect of temperature on the Raman-active A-modes of kesterite-type Cu2ZnSnS4. We were able to extract the individual contributions to each Raman mode, i.e., the volumetric (thermal expansion) and anharmonic (phonon-phonon interactions) terms responsible for the Raman shift and broadening with temperature. Comparison with relevant systems indicates the significant role of dimensionality in determining the dominant phonon damping factor, thus opening the way for tuning the thermoelectric performance of this class of materials by appropriate growth conditions.

Author Contributions

Conceptualization, I.E. and M.L.; methodology, N.S. and I.E.; software, N.S.; validation, N.S. and I.E.; formal analysis, N.S.; investigation, N.S.; resources, A.R. and M.L.; writing—original draft preparation, N.S. and I.E.; writing—review and editing, N.S., A.R., M.L. and I.E.; funding acquisition, M.L. and I.E. All authors have read and agreed to the published version of the manuscript.

Funding

This research was funded by the following Deutsche Forschungsgemeinschaft (DFG), project numbers LE781/19-1 and EF112/3-1. Financial support from the MatSEC graduate school of the Helmholtz Zentrum Berlin (HZB) in cooperation with the Dahlem Research School (A.R.) is gratefully acknowledged.

Data Availability Statement

The data presented in this study are available on request from the corresponding author.

Acknowledgments

We thank Hans-Josef Reichmann and Monika Koch-Müller from the Deutsches GeoForschungsZentrum Potsdam (GFZ) for assistance with the experiments.

Conflicts of Interest

The authors declare no conflict of interest. The funders had no role in the design of the study; in the collection, analyses, or interpretation of data; in the writing of the manuscript, or in the decision to publish the results.

Sample Availability

Samples of the investigated compound Cu2ZnSnS4 are available upon request from the authors.

References

  1. Katagiri, H.; Jimbo, K.; Maw, W.S.; Oishi, K.; Yamazaki, M.; Araki, H.; Takeuchi, A. Development of CZTS-based thin film solar cells. Thin Solid Films 2009, 517, 2455–2460. [Google Scholar] [CrossRef]
  2. Liu, X.; Feng, Y.; Cui, H.; Liu, F.; Hao, X.; Conibeer, G.; Mitzi, D.B.; Green, M. The current status and future prospects of kesterite solar cells: A brief review. Progr. Photovolt. 2016, 24, 879–898. [Google Scholar] [CrossRef]
  3. Siebentritt, S.; Schorr, S. Kesterites—A challenging material for solar cells. Progr. Photovolt. 2012, 20, 512–519. [Google Scholar] [CrossRef]
  4. Nagaoka, A.; Yoshino, K.; Masuda, T.; Sparks, T.D.; Scarpulla, M.A.; Nishioka, K. Environmentally friendly thermoelectric sulphide Cu2ZnSnS4 single crystals achieving a 1.6 dimensionless figure of merit ZT. J. Mater. Chem. A 2021, 9, 15595–15604. [Google Scholar] [CrossRef]
  5. Kumar, S.; Ansari, M.Z.; Khare, N. Enhanced thermoelectric power factor of Cu2ZnSnS4 in the presence of Cu2−xS and SnS2 secondary phase. AIP Conf. Proc. 2017, 1832, 120033. [Google Scholar]
  6. Yang, H.; Jauregui, L.A.; Zhang, G.; Chen, Y.P.; Wu, Y. Nontoxic and abundant copper zinc tin sulfide nanocrystals for potential high-temperature thermoelectric energy harvesting. Nano Lett. 2012, 12, 540–545. [Google Scholar] [CrossRef] [PubMed] [Green Version]
  7. Tan, G.; Ohta, M.; Kanatzidis, M.G. Thermoelectric powergeneration: From newmaterials to devices. Phil. Trans. R. Soc. A 2019, 377, 20180450. [Google Scholar] [CrossRef] [Green Version]
  8. Schorr, S. The crystal structure of kesterite type compounds: A neutron and X-ray diffraction study. Sol. Energy Mater. Sol. Cells 2011, 95, 1482–1488. [Google Scholar] [CrossRef]
  9. Schorr, S.; Hoebler, H.J.; Tovar, M. A neutron diffraction study of the stannite-kesterite solid solution series. Eur. J. Miner. 2007, 19, 65–73. [Google Scholar] [CrossRef]
  10. Schorr, S. Structural aspects of adamantine like multinary chalcogenides. Thin Solid Films 2007, 515, 5985–5991. [Google Scholar] [CrossRef]
  11. Lafond, A.; Choubrac, L.; Guillot-Deudon, C.; Deniard, P.; Jobic, S. Crystal structures of photovoltaic chalcogenides, an intricate puzzle to solve: The cases of CIGSe and CZTS materials. Z. Anorg. Allg. Chem. 2012, 638, 2571–2577. [Google Scholar] [CrossRef]
  12. Rios, L.E.V.; Neldner, K.; Gurieva, G.; Schorr, S. Existence of off-stoichiometric single phase kesterite. J. Alloy. Comp. 2016, 657, 408–413. [Google Scholar] [CrossRef]
  13. Schorr, S.; Gurieva, G.; Guc, M.; Dimitrievska, M.; Perez-Rodriguez, A.; Izquierdo-Roca, V.; Schnohr, C.S.; Kim, J.; Jo, W.; Merino, J.M. Point defects, compositional fluctuations, and secondary phases in non-stoichiometric kesterites. J. Phys. Energy 2020, 2, 12002. [Google Scholar] [CrossRef] [Green Version]
  14. Mitzi, D.B.; Gunawan, O.; Todorov, T.K.; Barkhouse, D.A.R. Prospects and performance limitations for Cu–Zn–Sn–S–Se photovoltaic technology. Phil. Trans. R. Soc. A 2013, 371, 20110432. [Google Scholar] [CrossRef] [PubMed] [Green Version]
  15. Chen, S.; Yang, J.-H.; Gong, X.G.; Walsh, A.; Wei, S.-H. Intrinsic point defects and complexes in the quaternary kesterite semiconductor Cu2ZnSnS4. Phys. Rev. B 2010, 81, 245204. [Google Scholar] [CrossRef] [Green Version]
  16. Chen, S.; Gong, X.G.; Walsh, A.; Wei, S.H. Defect physics of the kesterite thin-film solar cell absorber Cu2ZnSnS4. Appl. Phys. Lett. 2010, 96, 021902. [Google Scholar] [CrossRef]
  17. Chen, S.; Walsh, A.; Gong, X.-G.; Wei, S.-H. Classification of lattice defects in the kesterite Cu2ZnSnS4 and Cu2ZnSnSe4 earth-abundant solar cell absorbers. Adv. Mater. 2013, 25, 1522–1539. [Google Scholar] [CrossRef]
  18. Du, H.; Yan, F.; Young, M.; To, B.; Jiang, C.-S.; Dippo, P.; Kuciauskas, D.; Chi, Z.; Lund, E.A.; Hancock, C.; et al. Investigation of combinatorial coevaporated thin film Cu2ZnSnS4. I. Temperature effect, crystalline phases, morphology, and photoluminescence. J. Appl. Phys. 2014, 115, 173502. [Google Scholar] [CrossRef]
  19. Guc, M.; Levcenko, S.; Bodnar, I.V.; Izquierdo-Roca, V.; Fontane, X.; Volkova, L.V.; Arushanov, E.; Perez-Rodriguez, A. Polarized Raman scattering study of kesterite type Cu2ZnSnS4 single crystals. Sci. Rep. 2016, 6, 19414. [Google Scholar] [CrossRef] [PubMed] [Green Version]
  20. Paris, M.; Choubrac, L.; Lafond, A.; Guillot-Deudon, C.; Jobic, S. Solid-state NMR and Raman spectroscopy to address the local structure of defects and the tricky issue of the Cu/Zn disorder in Cu-poor, Zn-rich CZTS materials. Inorg. Chem. 2014, 53, 8646–8653. [Google Scholar] [CrossRef]
  21. Nagoya, A.; Asahi, R.; Wahl, R.; Kresse, G. Defect formation and phase stability of Cu2ZnSnS4 photovoltaic material. Phys. Rev. B 2010, 81, 113202. [Google Scholar] [CrossRef]
  22. Grossberg, M.; Krustok, J.; Raudoja, J.; Raadik, T. The role of structural properties on deep defect states in Cu2ZnSnS4 studied by photoluminescence spectroscopy. Appl. Phys. Lett. 2012, 101, 102102. [Google Scholar] [CrossRef] [Green Version]
  23. Caballero, R.; Garcia-Llamas, E.; Merino, J.M.; Leon, M.; Babichuk, I.; Dzhagan, V.; Strelchuk, V.; Valakh, M. Non-stoichiometry effect and disorder in Cu2ZnSnS4 thin films obtained by flash evaporation: Raman scattering investigation. Acta Mater. 2014, 65, 412–417. [Google Scholar] [CrossRef] [Green Version]
  24. Menendez, J.; Cardona, M. Temperature dependence of the first-order Raman scattering by phonons in Si, Ge, and a-Sn: Anharmonic effects. Phys. Rev. B 1984, 29, 2051–2059. [Google Scholar] [CrossRef]
  25. Lucazeau, G. Effect of pressure and temperature on Raman spectra of solids: Anharmonicity. J. Raman Spectr. 2003, 34, 478–496. [Google Scholar] [CrossRef]
  26. Efthimiopoulos, I.; Kullmey, T.; Speziale, S.; Pakhomova, A.S.; Quennet, M.; Paulus, B.; Ritscher, A.; Lerch, M.; Koch-Muller, M. Pressure-induced structural and electronic transitions in kesterite-type Cu2ZnSnS4. J. Appl. Phys. 2018, 124, 85905. [Google Scholar] [CrossRef] [Green Version]
  27. Efthimiopoulos, I.; Ritscher, A.; Lerch, M.; Speziale, S.; Pakhomova, A.S.; Liermann, H.P.; Koch-Muller, M. Structural transitions of ordered kesterite-type Cu2ZnSnS4 under pressure. Appl. Phys. Lett. 2017, 110, 41905. [Google Scholar] [CrossRef] [Green Version]
  28. Klemens, P.G. Anharmonic decay of optical phonons. Phys. Rev. B 1966, 148, 845–848. [Google Scholar] [CrossRef]
  29. Balkanski, M.; Wallis, R.F.; Haro, E. Anharmonic effects in light scattering due to optical phonons in silicon. Phys. Rev. B 1983, 28, 1928–1934. [Google Scholar] [CrossRef]
  30. Ritscher, A.; Hoelzel, M.; Lerch, M. The order-disorder transition in Cu2ZnSnS4—A neutron scattering investigation. J. Sol. St. Chem. 2016, 238, 68–73. [Google Scholar] [CrossRef] [Green Version]
  31. Bosson, C.J.; Birch, M.T.; Halliday, D.P.; Knight, K.S.; Gibbs, A.S.; Hatton, P.D. Cation disorder and phase transitions in thestructurally complex solar cell material Cu2ZnSnS4. J. Mater. Chem. A 2017, 5, 16672–16680. [Google Scholar] [CrossRef] [Green Version]
  32. Ritscher, A.; Franz, A.; Schorr, S.; Lerch, M. Off-stoichiometric CZTS: Neutron scattering investigations on mechanochemically synthesized powders. J. Alloy. Compd. 2016, 689, 271–277. [Google Scholar] [CrossRef]
  33. Ritscher, A.; Just, J.; Dolotko, O.; Schorr, S.; Lerch, M. A mechanochemical route to single phase Cu2ZnSnS4 powder. J. Alloy. Compd. 2016, 670, 289–296. [Google Scholar] [CrossRef] [Green Version]
  34. Valakh, M.Y.; Kolomys, O.F.; Ponomaryov, S.S.; Yukhymchuk, V.O.; Babichuk, I.S.; Izquierdo-Roca, V.; Saucedo, E.; Perez-Rodriguez, A.; Morante, J.R.; Schorr, S.; et al. Raman scattering and disorder effect in Cu2ZnSnS4. Phys. Status Solidi RRL 2013, 7, 258–261. [Google Scholar] [CrossRef]
  35. Schück, G.; Többens, D.M.; Koch-Müller, M.; Efthimiopoulos, I.; Schorr, S. Infrared spectroscopic study of vibrational modes across the orthorhombic-tetragonal phase transition in methylammonium lead halide single crystals. J. Phys. Chem. C 2018, 122, 5227–5237. [Google Scholar] [CrossRef] [Green Version]
  36. Trittschack, R.; Grobety, B.; Koch-Müller, M. In situ high-temperature Raman and FTIR spectroscopy of the phase transformation of lizardite. Amer. Miner. 2012, 97, 1965–1976. [Google Scholar] [CrossRef]
  37. Khare, A.; Himmetoglu, B.; Johnson, M.; Norris, D.J.; Cococcioni, M.; Aydil, E.S. Calculation of the lattice dynamics and Raman spectra of copper zinc tin chalcogenides and comparison to experiments. J. Appl. Phys. 2012, 111, 83707. [Google Scholar] [CrossRef]
  38. Dimitrievska, M.; Fairbrother, A.; Fontane, X.; Jawhari, T.; Izquierdo-Roca, V.; Saucedo, E.; Perez-Rodriguez, A. Multiwavelength excitation Raman scattering study of polycrystalline kesterite Cu2ZnSnS4 thin films. Appl. Phys. Lett. 2014, 104, 21901. [Google Scholar] [CrossRef] [Green Version]
  39. Skelton, J.M.; Jackson, A.J.; Dimitrievska, M.; Wallace, S.K.; Walsh, A. Vibrational spectra and lattice thermal conductivity of kesterite-structured Cu2ZnSnS4 and Cu2ZnSnSe4. APL Mater. 2015, 3, 41102. [Google Scholar]
  40. Buerger, M.J.; Wuensch, B.J. Distribution of atoms in high chalcocite, Cu2S. Science 1963, 141, 276–277. [Google Scholar] [PubMed]
  41. Evans, H.T. The crystal structures of low chalcocite and djurleite. Z. Krist. 1979, 150, 299–320. [Google Scholar] [CrossRef]
  42. Schorr, S.; Gonzalez-Aviles, G. In-situ investigation of the structural phase transition in kesterite. Phys. Stat. Sol. 2009, 206, 1054–1058. [Google Scholar] [CrossRef]
  43. Sarswat, P.K.; Free, M.L.; Tiwari, A. Temperature-dependent study of the Raman A mode of Cu2ZnSnS4 thin films. Phys. Stat. Sol. 2011, 248, 2170–2174. [Google Scholar] [CrossRef]
  44. Singh, O.P.; Muhunthan, N.; Singh, V.N.; Samanta, K.; Dilawar, N. Effect of temperature on thermal expansion and anharmonicity in Cu2ZnSnS4 thin films grown by co-sputtering and sulfurization. Mater. Chem. Phys. 2014, 146, 452–455. [Google Scholar] [CrossRef]
  45. Stanchik, A.V.; Tivanov, M.S.; Tyukhov, I.I.; Juskenas, R.; Korolik, O.V.; Gremenok, V.F.; Saad, A.M.; Naujokaitis, A. Temperature dependence of Raman scattering in the Cu2ZnSnS4 thin filmson a Ta foil substrate. Sol. Energy 2020, 201, 480–488. [Google Scholar] [CrossRef]
  46. Rincon, C.; Quintero, E.; Quintero, M.; Moreno, E.; Power, C.; Morocoima, M.; Delgado, G.E. Temperature dependence of Raman spectra in Cu2ZnSnS4 magnetic semiconductor compound. Phys. Stat. Sol. 2019, 256, 1900076. [Google Scholar] [CrossRef]
  47. Verma, P.; Abbi, S.C.; Jain, K.P. Raman-scattering probe of anharmonic effects in GaAs. Phys. Rev. B 1995, 51, 16660–16667. [Google Scholar] [CrossRef]
  48. Bonini, N.; Lazzeri, M.; Marzari, N.; Mauri, F. Phonon anharmonicities in graphite and graphene. Phys. Rev. Lett. 2007, 99, 176802. [Google Scholar] [CrossRef] [PubMed] [Green Version]
  49. Zhao, Z.; Elwood, J.; Carpenter, M.A. Phonon anharmonicity of PdO studied by Raman spectroscopy. J. Phys. Chem. C 2015, 119, 23094–23102. [Google Scholar] [CrossRef]
  50. Kandare, S.P.; Rao, M.N.; Dahiwale, S.S.; Rao, R.; Dhole, S.D.; Chaplot, S.L. Lattice dynamics in kesterite-type Cu2ZnSnS4: Inelastic neutron scattering studies and thermoelectric properties. J. Phys. Chem. Sol. 2021, 150, 109819. [Google Scholar] [CrossRef]
  51. Gonzalez, J.; Moya, E.; Chervin, J.C. Anharmonic effects in light scattering due to optical phonons in CuGaS2. Phys. Rev. B 1996, 54, 4707–4713. [Google Scholar] [CrossRef] [PubMed]
  52. Lin, Z.; Liu, W.; Tian, S.; Zhu, K.; Huang, Y.; Yang, Y. Thermal expansion coefficient of few-layer MoS2 studied by temperature-dependent Raman spectroscopy. Sci. Rep. 2021, 11, 7037. [Google Scholar] [CrossRef] [PubMed]
  53. Bonini, N.; Rao, R.; Rao, A.M.; Marzari, N.; Menendez, J. Lattice anharmonicity in low-dimensional carbon systems. Phys. Stat. Sol. 2008, 245, 2149–2154. [Google Scholar] [CrossRef]
  54. Chen, Y.; Peng, B.; Wang, B. Raman spectra and temperature-dependent Raman scattering of silicon nanowires. J. Phys. Chem. C 2007, 111, 5855–5858. [Google Scholar] [CrossRef]
  55. Efthimiopoulos, I.; Mayanna, S.; Stavrou, E.; Torode, A.; Wang, Y. Extracting the anharmonic properties of the G-band in graphene nanoplatelets. J. Phys. Chem. C 2020, 124, 4835–4842. [Google Scholar] [CrossRef]
  56. Lindsay, L.; Hua, C.; Ruan, X.L.; Lee, S. Survey of ab initio phonon thermal transport. Mater. Today Phys. 2018, 7, 106–120. [Google Scholar] [CrossRef]
Figure 1. Unit cell of the ordered kesterite-type Cu2ZnSnS4 (KS, SG I 4 ¯ , Z = 2). The brown, green, gray, and yellow spheres represent Cu+, Zn2+, Sn4+, and S2− ions, respectively. In this structural arrangement, the atomic Wyckoff positions at ambient conditions are Cu(1)-2a (0, 0, 0), Cu(2)-2c (0, 0.5, 0.25), Zn-2d (0, 0.5, 0.75), Sn-2b (0, 0, 0.5), and S-8g (0.753, 0.7589, 0.8724) [30]. The Cu(1) cations are lying at the same plane as the Sn4+ cations forming the z = 2/4 cationic layer, whereas Cu(2) and Zn2+ make up the z = 1/4 and z = 3/4 cationic layers; the latter are more susceptible to cationic disordering, resulting from the mutual anti-site exchange of the Cu(2) and Zn cations [13,31].
Solids 02 00024 g001
Figure 2. (a) Selected Raman spectra of KS Cu2ZnSnS4 at various temperatures (λ = 473 nm, P = 1 bar). The spectra are scaled with respect to the intense A(2)-band. The Raman mode at ca. 475 cm−1 corresponds to the Cu2S impurity phase. (b) Plots of Raman mode frequency and (c) full width at half maximum (FWHM) against temperature for the two most intense A modes of KS Cu2ZnSnS4. Solid lines passing through the measured data correspond to least-square fittings.
Solids 02 00024 g002
Figure 3. Frequency shift Δω of the Cu2ZnSnS4 A-modes as a function of temperature. The experimental data are drawn as solid symbols, and the red solid lines correspond to total fittings according to Equations (5)–(7). The various contributions are drawn separately as dashed lines. The fitting parameters are listed in Table 2.
Solids 02 00024 g003
Figure 4. Change in width ΔΓ of the Cu2ZnSnS4 A-modes as a function of temperature. The experimental data are drawn as solid symbols, and the red solid lines correspond to total fittings according to Equations (8) and (9). The various contributions are drawn separately as dashed lines. The fitting parameters are listed in Table 2.
Solids 02 00024 g004
Table 1. Raman-related temperature coefficients for the Raman modes of KS Cu2ZnSnS4.
KS Mode ω i 0 P (cm−1)(∂ωi/∂T)P (cm−1/K) γ i P Γ i 0 P (cm−1)(Γi/∂T)P (cm−1/K)
A(1)292.3(2)−0.0168(5)1.930.3(4)−0.007(1)
A(2)343.3(2)−0.0176(5)1.720.6(2)−0.0044(6)
Table 2. Fitting parameters derived from reproducing the Raman-active A-band frequency and width shift as a function of temperature in KS Cu2ZnSnS4, according to Equations (5)–(9). Literature data are also listed for comparison. The acronyms are explained as follows: CZSS, Cu2ZnSnS4; TF, thin film; CZSS-TF1 [43], thin film grown on fluorinated tin oxide coated glass; CZSS-TF2 [44], thin film grown on soda lime glass; CZSSe-TFA [45], Cu2ZnSnSe4 thin film, Zn-rich and Sn-poor, grown on Ta foil; CZSSe-TFB [45], Cu2ZnSnSe4 thin film, Zn-poor and Sn-rich, grown on Ta foil; CFSS [46], Cu2FeSnS4 (stannite structure); N/A, not available.
CompoundMode ω i 0 P   ( cm 1 ) γ i T   [27]A (cm1)B (cm1) Γ i 0 P   ( cm 1 ) C (cm1)D (cm1)T Range (K)
CZSS-bulkA(1)292.3(2)1.071.21−0.0060.3(2)0.5300.02300–460
A(2)343.3(2)1.032.06−0.070.6(2)0.630−0.02300–460
CZSS-TF1A(2)340.81.01−1 × 10⁻²²−9.1 × 10−2010.72 × 10−101.09 × 10−2098–378
CZSS-TF2A(2)N/AN/AN/AN/AN/AN/AN/A80–450
CZSSe-TFAA(1)174.5N/A2.762−3.9477.50.653−0.00724–290
CZSSe-TFAA(2)197.9N/A3.668−4.93630.068−2.817 × 10−424–290
CZSSe-TFBA(1)175.8N/A3.471−4.4146.40.276−0.00224–290
CZSSe-TFBA(2)198.6N/A3.729−4.2742.3−0.001−2.727 × 10−424–290
CFSS-bulkA(2)325.45.1−0.89−1.2 × 10−93.56.000N/A10–300
Publisher’s Note: MDPI stays neutral with regard to jurisdictional claims in published maps and institutional affiliations.

