Article

Static Hardness Testing of Cement Mortars Containing Different Types of Recycled Construction Waste Powders

Department of Construction Materials and Technologies, Budapest University of Technology and Economics, 1111 Budapest, Hungary
*
Author to whom correspondence should be addressed.
Solids 2021, 2(4), 331-340; https://doi.org/10.3390/solids2040021
Submission received: 13 September 2021 / Revised: 1 October 2021 / Accepted: 6 October 2021 / Published: 10 October 2021

Abstract

:
The present paper deals with the hardness of cement mortars prepared with recycled materials that are potential supplementary cementitious materials (SCM). Two potential SCMs (aerated concrete powder (ACP) and concrete powder) were investigated and compared with a reference (neat cement) sample and a sample containing metakaolin (MK). The long-term performance of the mortars was studied up to the age of one year. Based on the compressive strength tests at different ages, neither concrete powder nor ACP significantly decreases the compressive strength at a 10% substitution ratio. The samples were studied with two types of static hardness tests: the Brinell hardness test and the depth sensing indentation test at two different load levels. The hardness test results indicated that the standard deviation of the results is lower at a higher load level. In the case of metakaolin and concrete powder, the change in the compressive strength was observable in the hardness test results. However, in case of the ACP, the compressive strength decreased, while the hardness increased, which can be traced back to the filler effect of aerated concrete powder. Finally, using the DSI test, the hardness results were analyzed on an energy basis. The analysis highlighted that the change in the hardness is connected to the elastic indentation energy, while it is independent from the dissipated (plastic) indentation energy.

1. Introduction

Nowadays, there is an increased interest in civil engineering for the use of recycled materials in concrete mixes. There is a wide range of recycled materials that can be used in concrete, but the most promising results have been achieved with recycled construction waste materials [1,2,3,4,5,6]. Two of those that are available in huge amounts are waste concrete and waste aerated concrete. Studies are available about the application of these materials as coarse aggregate, and there have been attempts to use them as supplementary cementitious materials (SCM) [7,8,9]. In a powder form, the recycled material can be added to the concrete mix, and it is incorporated into the cement matrix. Thus, it can modify the mechanical, durability, and other properties of the concrete. It is known from the literature how these powders modify the strength of the concrete, but how they influence the surface hardness of the material, which is more important when these concretes are investigated in existing buildings, has not yet been investigated [10]. Hardness tests on concrete are mostly performed using in situ dynamic hardness tests, such as the rebound hammer test [11]. However, there were studies where it was shown that using laboratory static hardness testing methods, a more accurate result can be reached. Brinell hardness tests on concrete samples with promising results can be found in the literature [12].
The aerated (or cellular) concrete powder (also known in Europe under the brand name Ytong, after the name of one of its largest producers) could be easily collected and used as an additive to concrete without any further processing. The main reaction product in aerated concrete belongs to the tobermorite group of calcium silicate hydrates (C-S-H) [10,13,14]. These products have very high specific surface area and are stable, which indicates that they may be used as an SCM. Concrete powder is the crushed and powdered form of demolition waste concrete that is available in large amounts.
The objective of this research is to investigate the effect of recycled construction wastes on the hardness of cement-based materials, for which only a limited number of studies can be found in the literature. The hardness test results of mortars containing SCMs are analyzed on an energy-basis, which is not covered by the literature. It is advantageous to study the effect of potential SCMs on mortar samples (instead of concrete samples), because their effects on mortars could be more significant, and in the case of a normal strength concrete, the failure of the material originates in the failure of the cement matrix and not in the aggregates. Three SCMs were selected that interact with the mortar in different ways: concrete powder is an inert filler material; metakaolin develops chemical bonds; aerated concrete powder induces physical bonds. The hypothesis is that the different SCMs affect the hardness of the mortars in other ways (and differently influence how the strength of the material is affected by these SCMs). A long-term goal is to propose a way to estimate the material strength of concretes containing various SCMs based on their hardness (as is possible for concretes without SCMs). The recycled materials were compared to a reference mix (containing only cement) and a mortar containing metakaolin. Two types of static hardness tests were used: Brinell hardness test and depth sensing indentation test, which are briefly introduced in Section 2.
Research objectives
The main steps of this research were the following:
  • Long-term development of the compressive strength (up to one year) of cast specimens was studied, and the hardening process of the different samples was monitored.
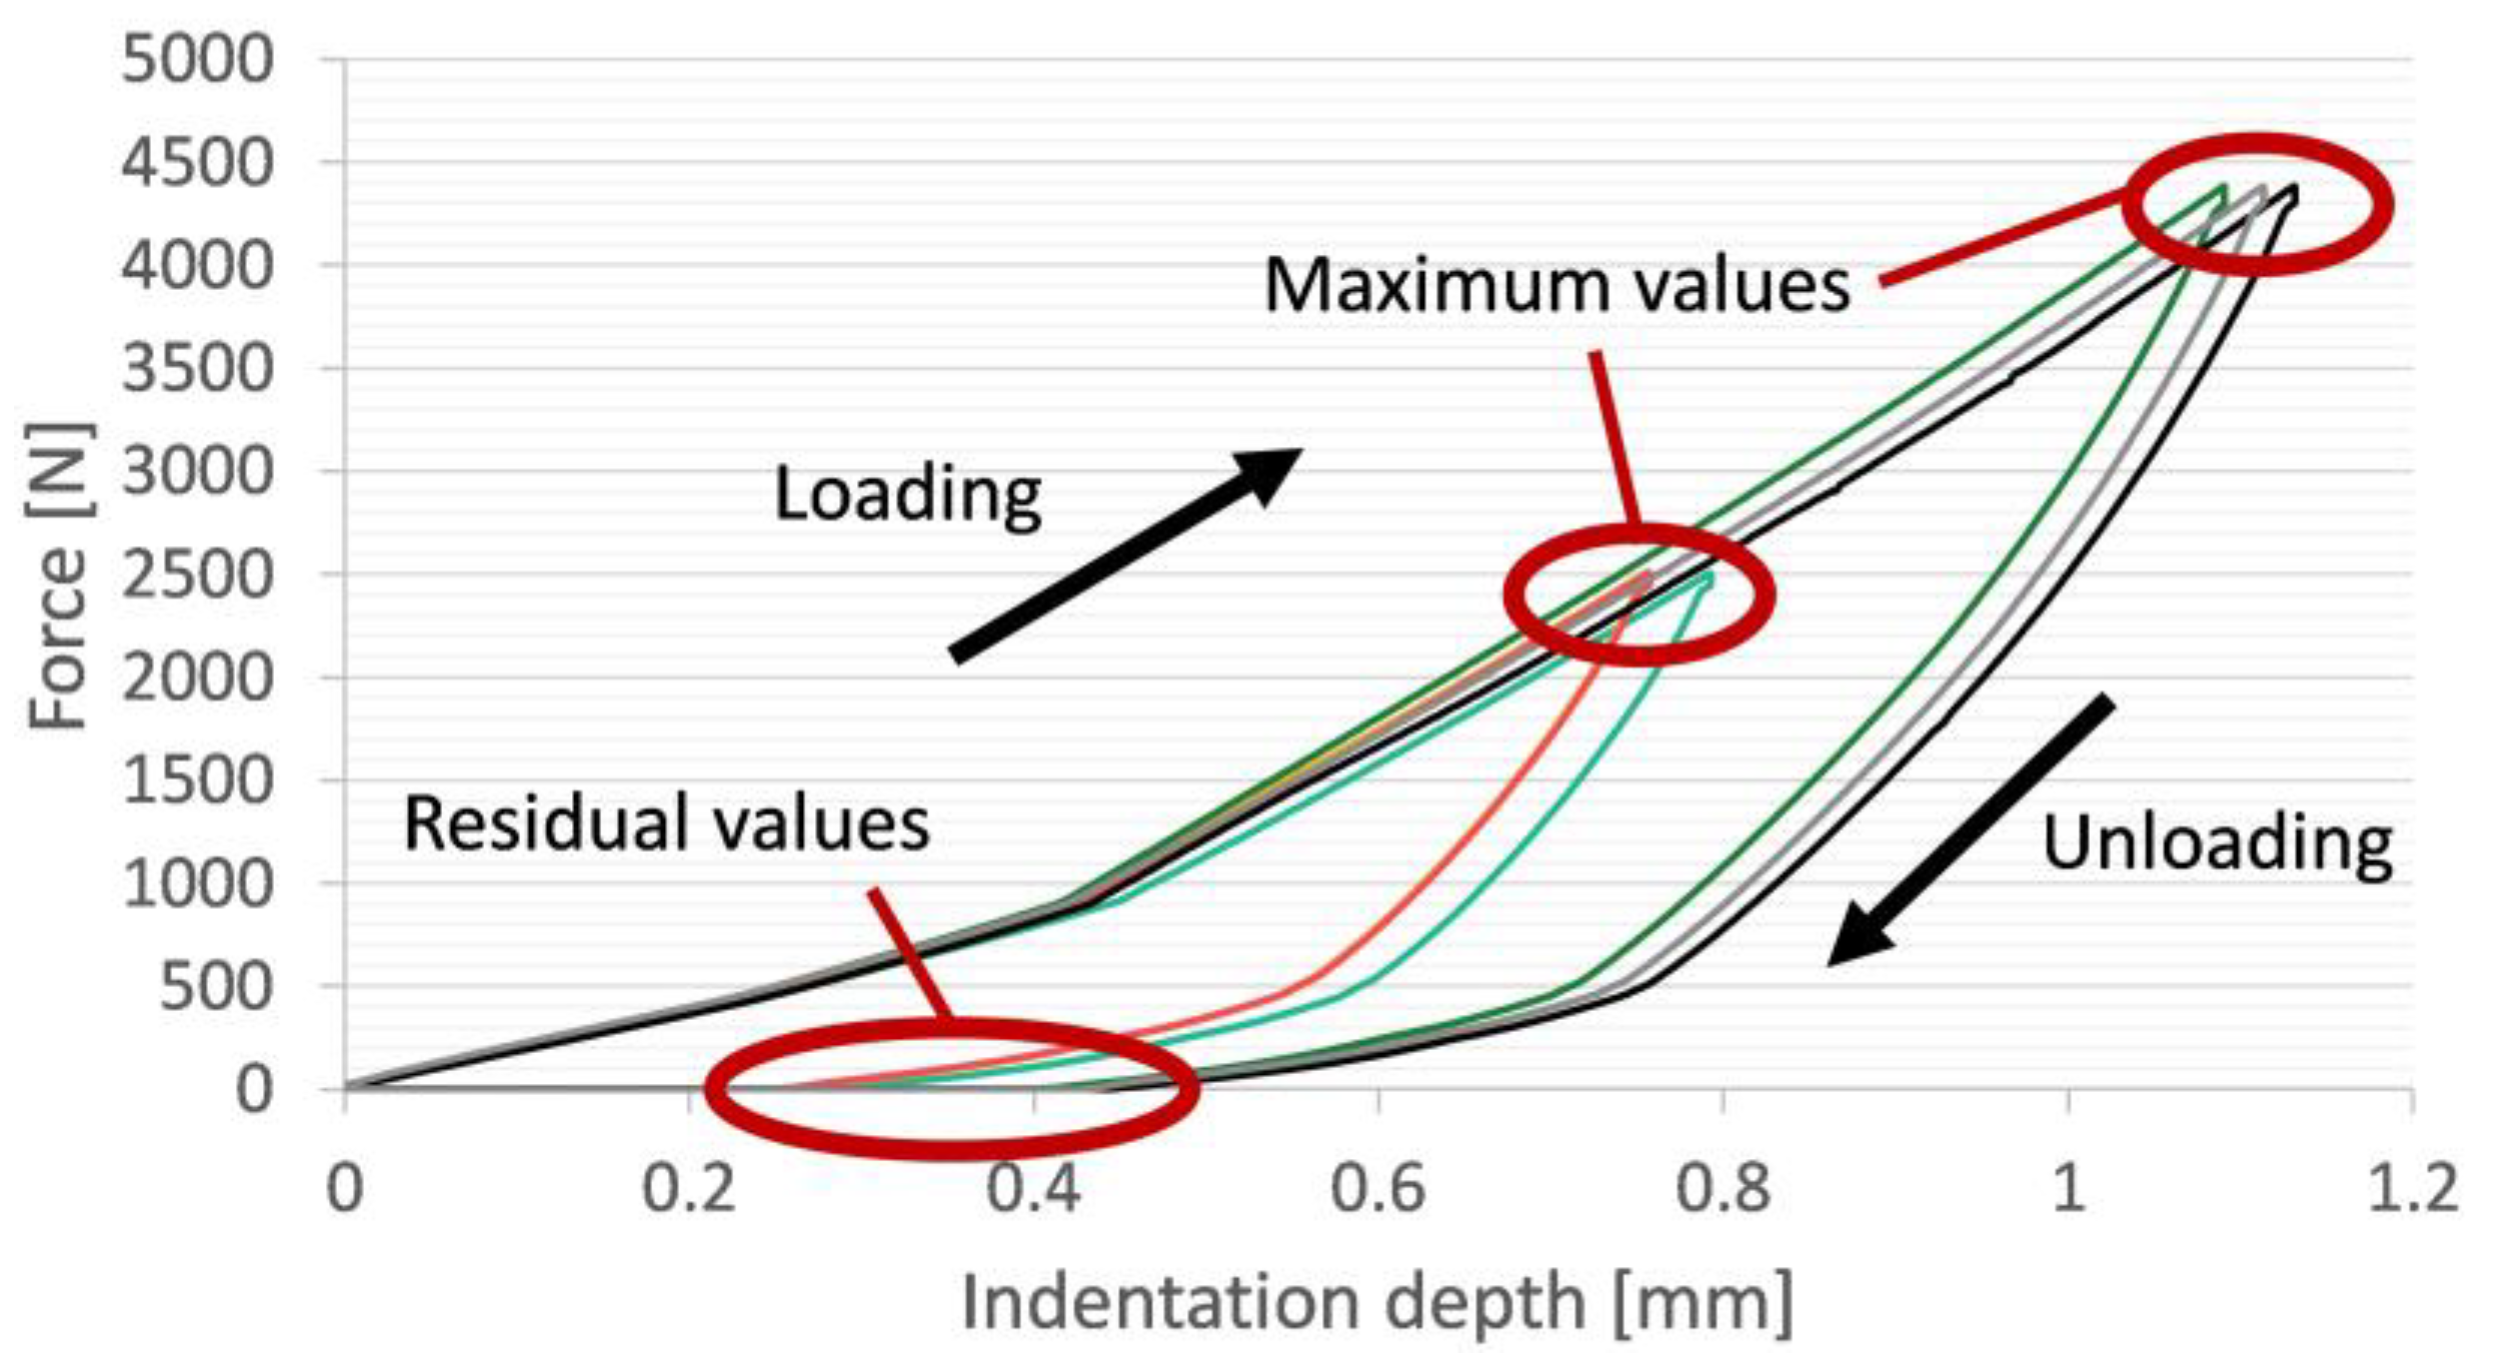
  • Specimens were subjected to DSI and Brinell hardness tests, and the results were analyzed on the bases of deformation, hardness, and energy.

2. Materials and Methods

To investigate the effect of waste powders on the hardness of cement mortars, four different mixes were designed. The applied additive powders were metakaolin (MK), which was used as a comparison and two recycled waste powders, aerated (aka cellular) concrete (Ytong) powder (Y) and concrete powder (CP). The composition of the mixes is described in Table 1. In every mix, 10% of the cement amount was substituted, because this was found to be optimal for the studied metakaolin in earlier research [15].
CEM I 42.5 N type cement (EN 197) was applied in all samples, while the water-to-cement (w/c) ratio of the mixes was 0.5. To prepare the reference mortar, 3 units of fine aggregate (0/4) were mixed with 1 unit of cement (and 0.5 unit of water), in accordance with EN 196-1. The original dry body density (measured on blocks) of the aerated concrete was 440 kg/m3. There are several type of aerated concrete blocks (with various densities as main difference) available on the market, but according to the business sales statistics (provided by the manufacturer) this type is the most applied by far. Based on its declaration of performance, the properties of the studied aerated concrete are listed in Table 2.
It is important to mention that based on Laser Diffraction Analysis, the aggregate size of the aerated concrete powder was lower than 0.09 mm (0/009 particle size fraction), while the MK has a size lower than 0.018 mm. The specific surface area of the aerated concrete powder was lower by an order of magnitude compared to MK, as is shown in Table 3. The density and porosity of the aerated concrete powder and MK were determined based on EN 12390-7 European Standard. The amount of the aerated concrete powder, MK, or concrete powder did not affect the workability of the mixes.
From all mixes prism samples (40 mm × 40 mm × 160 mm) were cast. The samples were subjected to compressive strength test, flexural-tensile strength test, Brinell hardness test, DSI test at different ages of the samples.
In the following lines the test methods are described. The compressive and tensile strengths of the mortars were determined at 2, 7, 28, 90, 180, and 360 days of age after wet curing, according to European Standard EN 12390-3 [16]. The uniaxial compressive strength test was performed in an Alpha 3-3000 S hydraulic press with 11.25 kN/s (static) loading rate with a measurement uncertainty of 0.63 N/mm2. Three-point bending tests were conducted on a loading frame to determine the flexural tensile strength on 40 mm × 40 mm × 160 mm beam specimens according to European Standard EN 196-1 [16]. For both tests, at least five samples were used at each age (6 ages × 4 materials × 5 samples × 2 types of strength test = 240 tests). The results presented in Section 3 are the averaged values of these test results.
Besides that, the surface topography was investigated by Scanning Electron Microscope (SEM) method, to study the microstructure of the materials.
Nowadays, the so-called indentation hardness test methods are the most commonly used for measuring the surface hardness of a material [17]. Hardness can be defined as the least value of pressure under a spherical indenter necessary to produce a permanent set at the center of the area of contact [18]. In practice, it means the relationship between the loading force and the resistance of the sample against penetration or permanent deformation. The indentation hardness test methods can be divided into two groups based on the load history of the process: static and dynamic. Dynamic processes such as the rebound hammer measurement or Leeb testing are faster than static processes (Brinell- or Vickers-test), but less reliable. If one wants to examine hardness scientifically, then static processes are more appropriate.
The most well-known static indentation hardness test method is the Brinell test [19,20]. In case of the Brinell test, a hardened, polished steel ball is pushed into the surface of the material with a specified load and time. The test applies a constant loading force, usually 0.5 to 30 kN (depending on the tested material), on a 10 mm diameter hardened steel ball to the flat surface of a workpiece. The load is applied for a specified time (for a soft material it is between 10–15 s, for a hard material (e.g., metals) it is 30 s). This time period is required that the plastic deformations in the material can develop. The aim of the process is to have a hardness value, which is calculated from the diameter of the ball print created by the indenter. During the DSI (Depth Sensing Indentation) test, the computer-aided device pushes the indentation body into the surface of the sample with a constant loading rate or indentation velocity. During the measurement, the device continuously registers the magnitude of the loading force and the depth of the indentation. The device records the so-called indentation curve in a force (N)-displacement (mm) coordinate system, which is recorded in real-time. The capacity of the machine used in the present experiments was 50 kN; the test speed varied between 0.0001 and 500 mm/min. To avoid the measurement errors, at least three measurements were made at each load level. The testing device was a Zwick Z050 computer-controlled universal testing machine. Experimental results indicated that the elastic, elastic-plastic, and plastic porous solid building materials could be distinguished easily by the indentation loading–unloading characteristics. The differences between the total and elastic indentation works represented as areas under the specific loading–unloading curves are easy to be visualized. In the case of the elastic–plastic materials (such as concrete), one can generally observe that the dissipating (plastic) indentation energy and the elastic indentation energy have similar magnitudes; however, the ratios are very sensitive to the actual stiffness and strength of the material [21].
The DSI and Brinell hardness tests were performed on all materials (reference, Y10, MK10, and CP10). For both tests, at least 5 samples were used, and on every sample, at least 5 test instances were performed (2 tests × 4 materials × 5 samples × 5 repetitions = 200 test instances). The results presented in Section 3 are the averaged values of these test results. The hardness tests were performed on the one year old samples. Until then, the samples were stored in a hermetically (in a way that does not allow any air or other substance to leave or enter) sealed container.

3. Results and Discussion

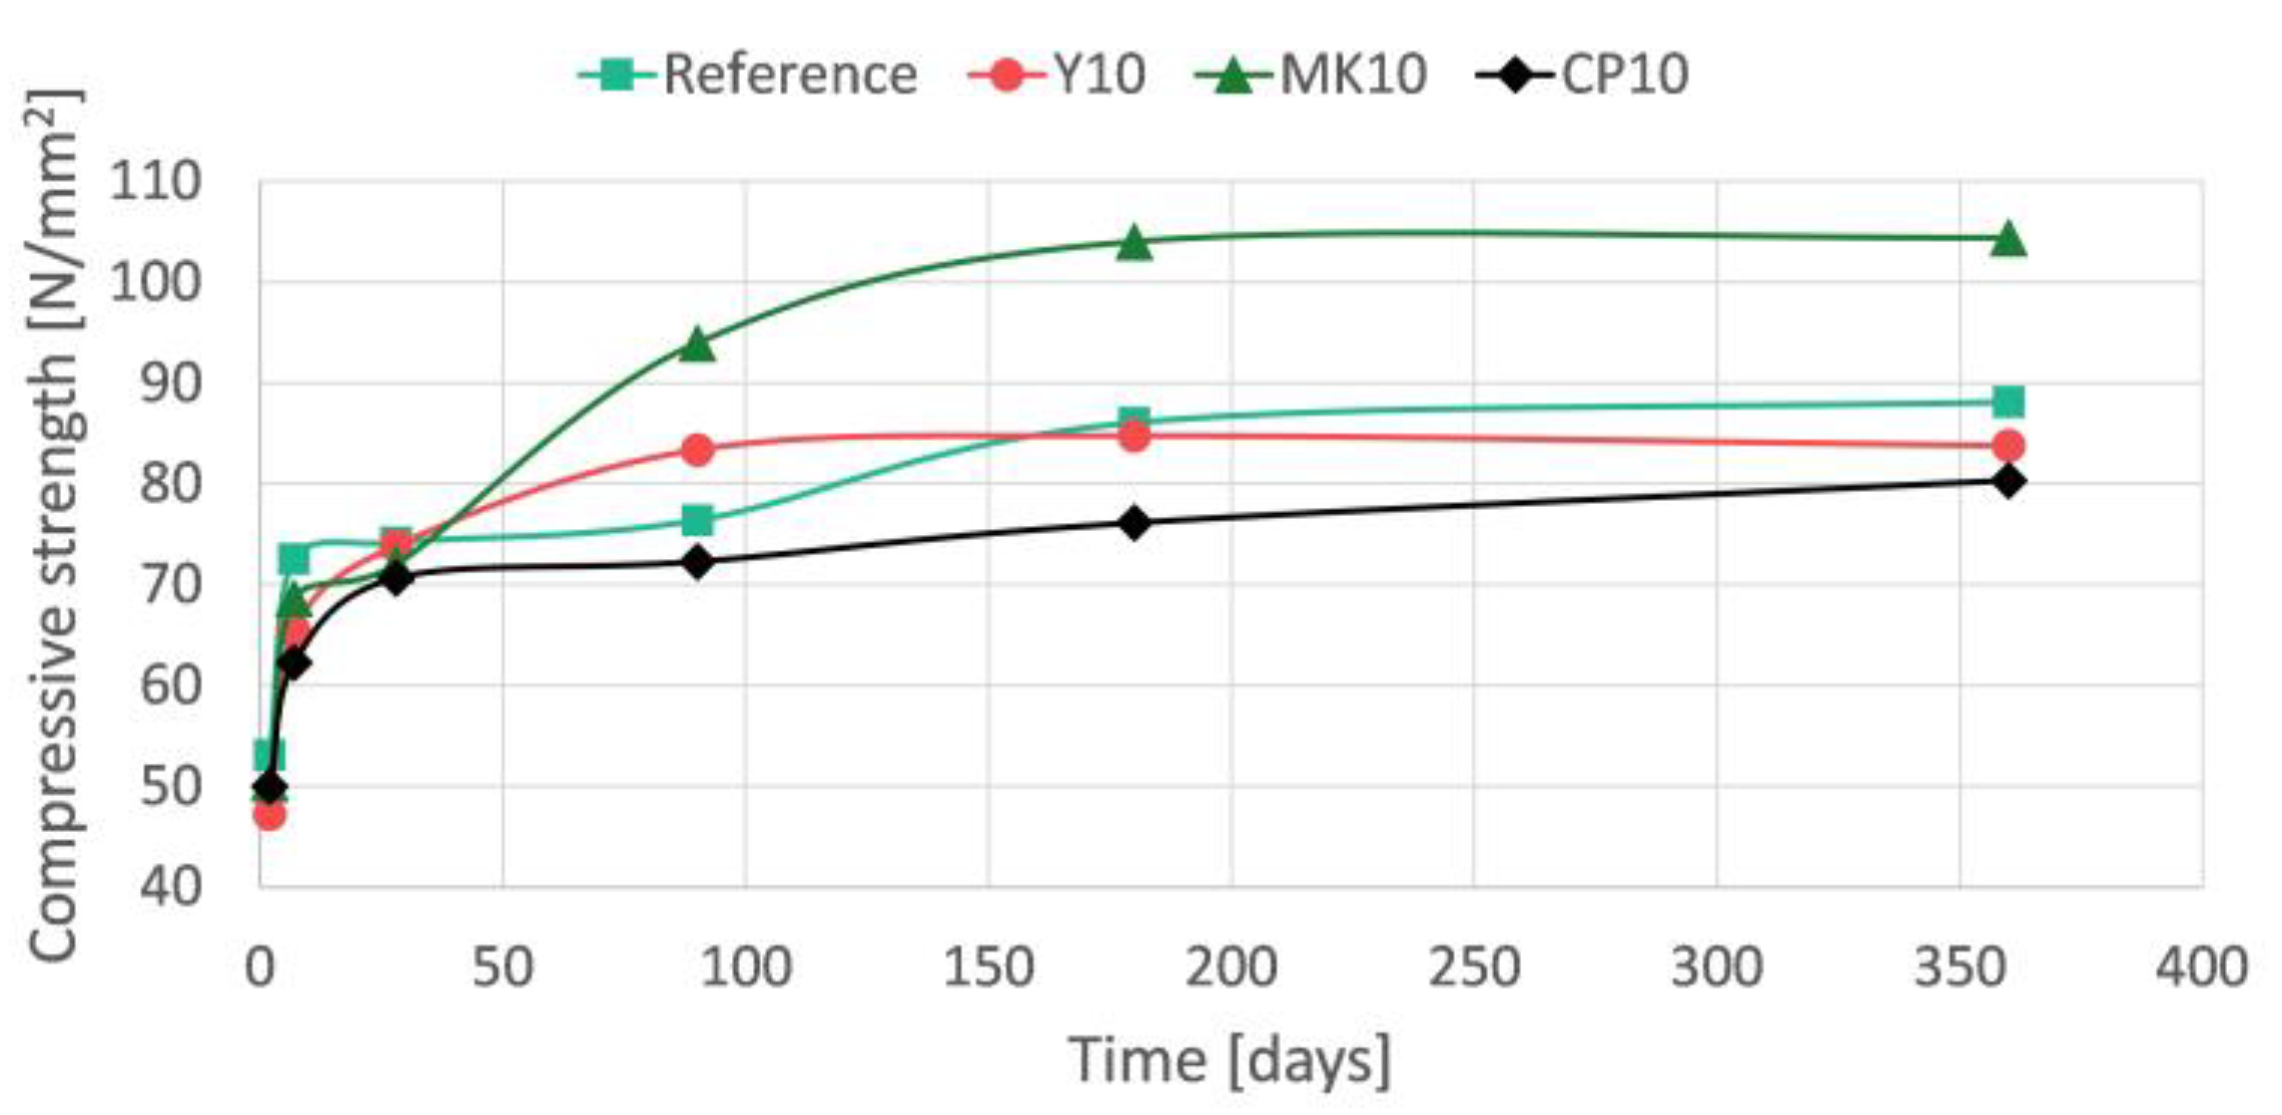
3.1. Compressive Strength Test Results

First of all, the compressive strength of the samples have been tested. In Figure 1 it can be seen that all additives decrease the 28 days compressive strength of the mortar; however, at the age of 360 days, all have similar or even higher compressive strength. Until 28 days of age, the Reference has the highest compressive strength, and as the Ca(OH)2 content increasing, the strength increases as well in all mixes with similar tendencies. The MK10 mix’s results are also in agreement with the literature; the metakaolin started to show its effects after 7 days and reached its peak around 180 days [15]. In case of the MK10 mortar, after 28 days the compressive strength is increasing with a higher rate than the other mortars. In that phase, the effect of a supplementary material is more significant than the hardening of the cement. Based on that, it can be concluded that the Y is not working as a traditional SCM, but its behavior is similar to a filler material.
It can be concluded based on the measurements that the compressive strength of all mixes consolidated around the age of 180 days. The compressive strength of the Y10 mix reached its peak on the 90th day, which is almost identical to the strength of the reference mix. Based on that, it can be noted that 10% of Y does not reduce the compressive strength of cement, which can be perceived as a good result from a recycled material. It raises the question: why not apply more than 10%? In a previous study, it was found that the application of more than 10% Y in a mix can lead to the degradation of the compressive strength of the material [22]. It can be explained by the excessive tobermorite formation, which in that amount of Y (higher than 10%) not only fills the pores but also due to the additional tobermorite formation cause inner stress in the material that leads to microcracks [23]. The CP10 mix showed similar results until 28 days of age to the other two mixes containing additives. However, after 28 days, its strength increase rate was much lower than that of the other two. At the age of 360 days, its strength was about 10% lower compared to the reference mix and somewhat lower than the strength of the Y10 mix. However, the CP has higher specific surface area than the Y, which means that it could be more advantageous against freeze–thaw attack. CP is a finer material than Y, but its size distribution is not that advantageous as in case of Y, and it does not have any chemical effect (no additional CSH crystal formation or swelling).
In case of MK, the effect of post-hardening (from 28 to 360 days) is a well-known chemical process; however, in case of Y and CP, the internal processes in the material during hardening are unknown. In the work of Fenyvesi and Jankus [7] and Abed and Nemes [24], it was shown that the aerated concrete (Ytong) powder with specific surface area of 1800 cm2/cm3 has a negative effect on the compressive strength of concrete, while in the work of the authors it was shown that Y with specific surface area of 2500 cm2/cm3 (in appropriate amount) increases the compressive strength [7,8,24]. This means that based on the size of particles (specific surface area) of the Y, it can be determined whether it will have a negative effect on the compressive strength or not. If Y is applied as a coarse aggregate in concrete, due to its significant swelling it can cause cracks in the concrete’s cement matrix, but with grinding, this effect can be decreased. It was shown Gyurkó et al. [8] that if Y (dmax < 0.09 mm) applied in concrete with 10% dosage, it could increase the compressive strength of concrete. Y shows no sign of chemical reactions (hydraulic reactions), so it could not be considered as a traditional SCM; however, it swells during the hardening of the mortar, which makes it a very good filling material until its particles are small enough [8]. The CP does not show any sign of these chemical reactions during the hardening of the mortar.
As was mentioned, the density and the tensile strength of the samples were determined as well, but they were not used in this analysis.

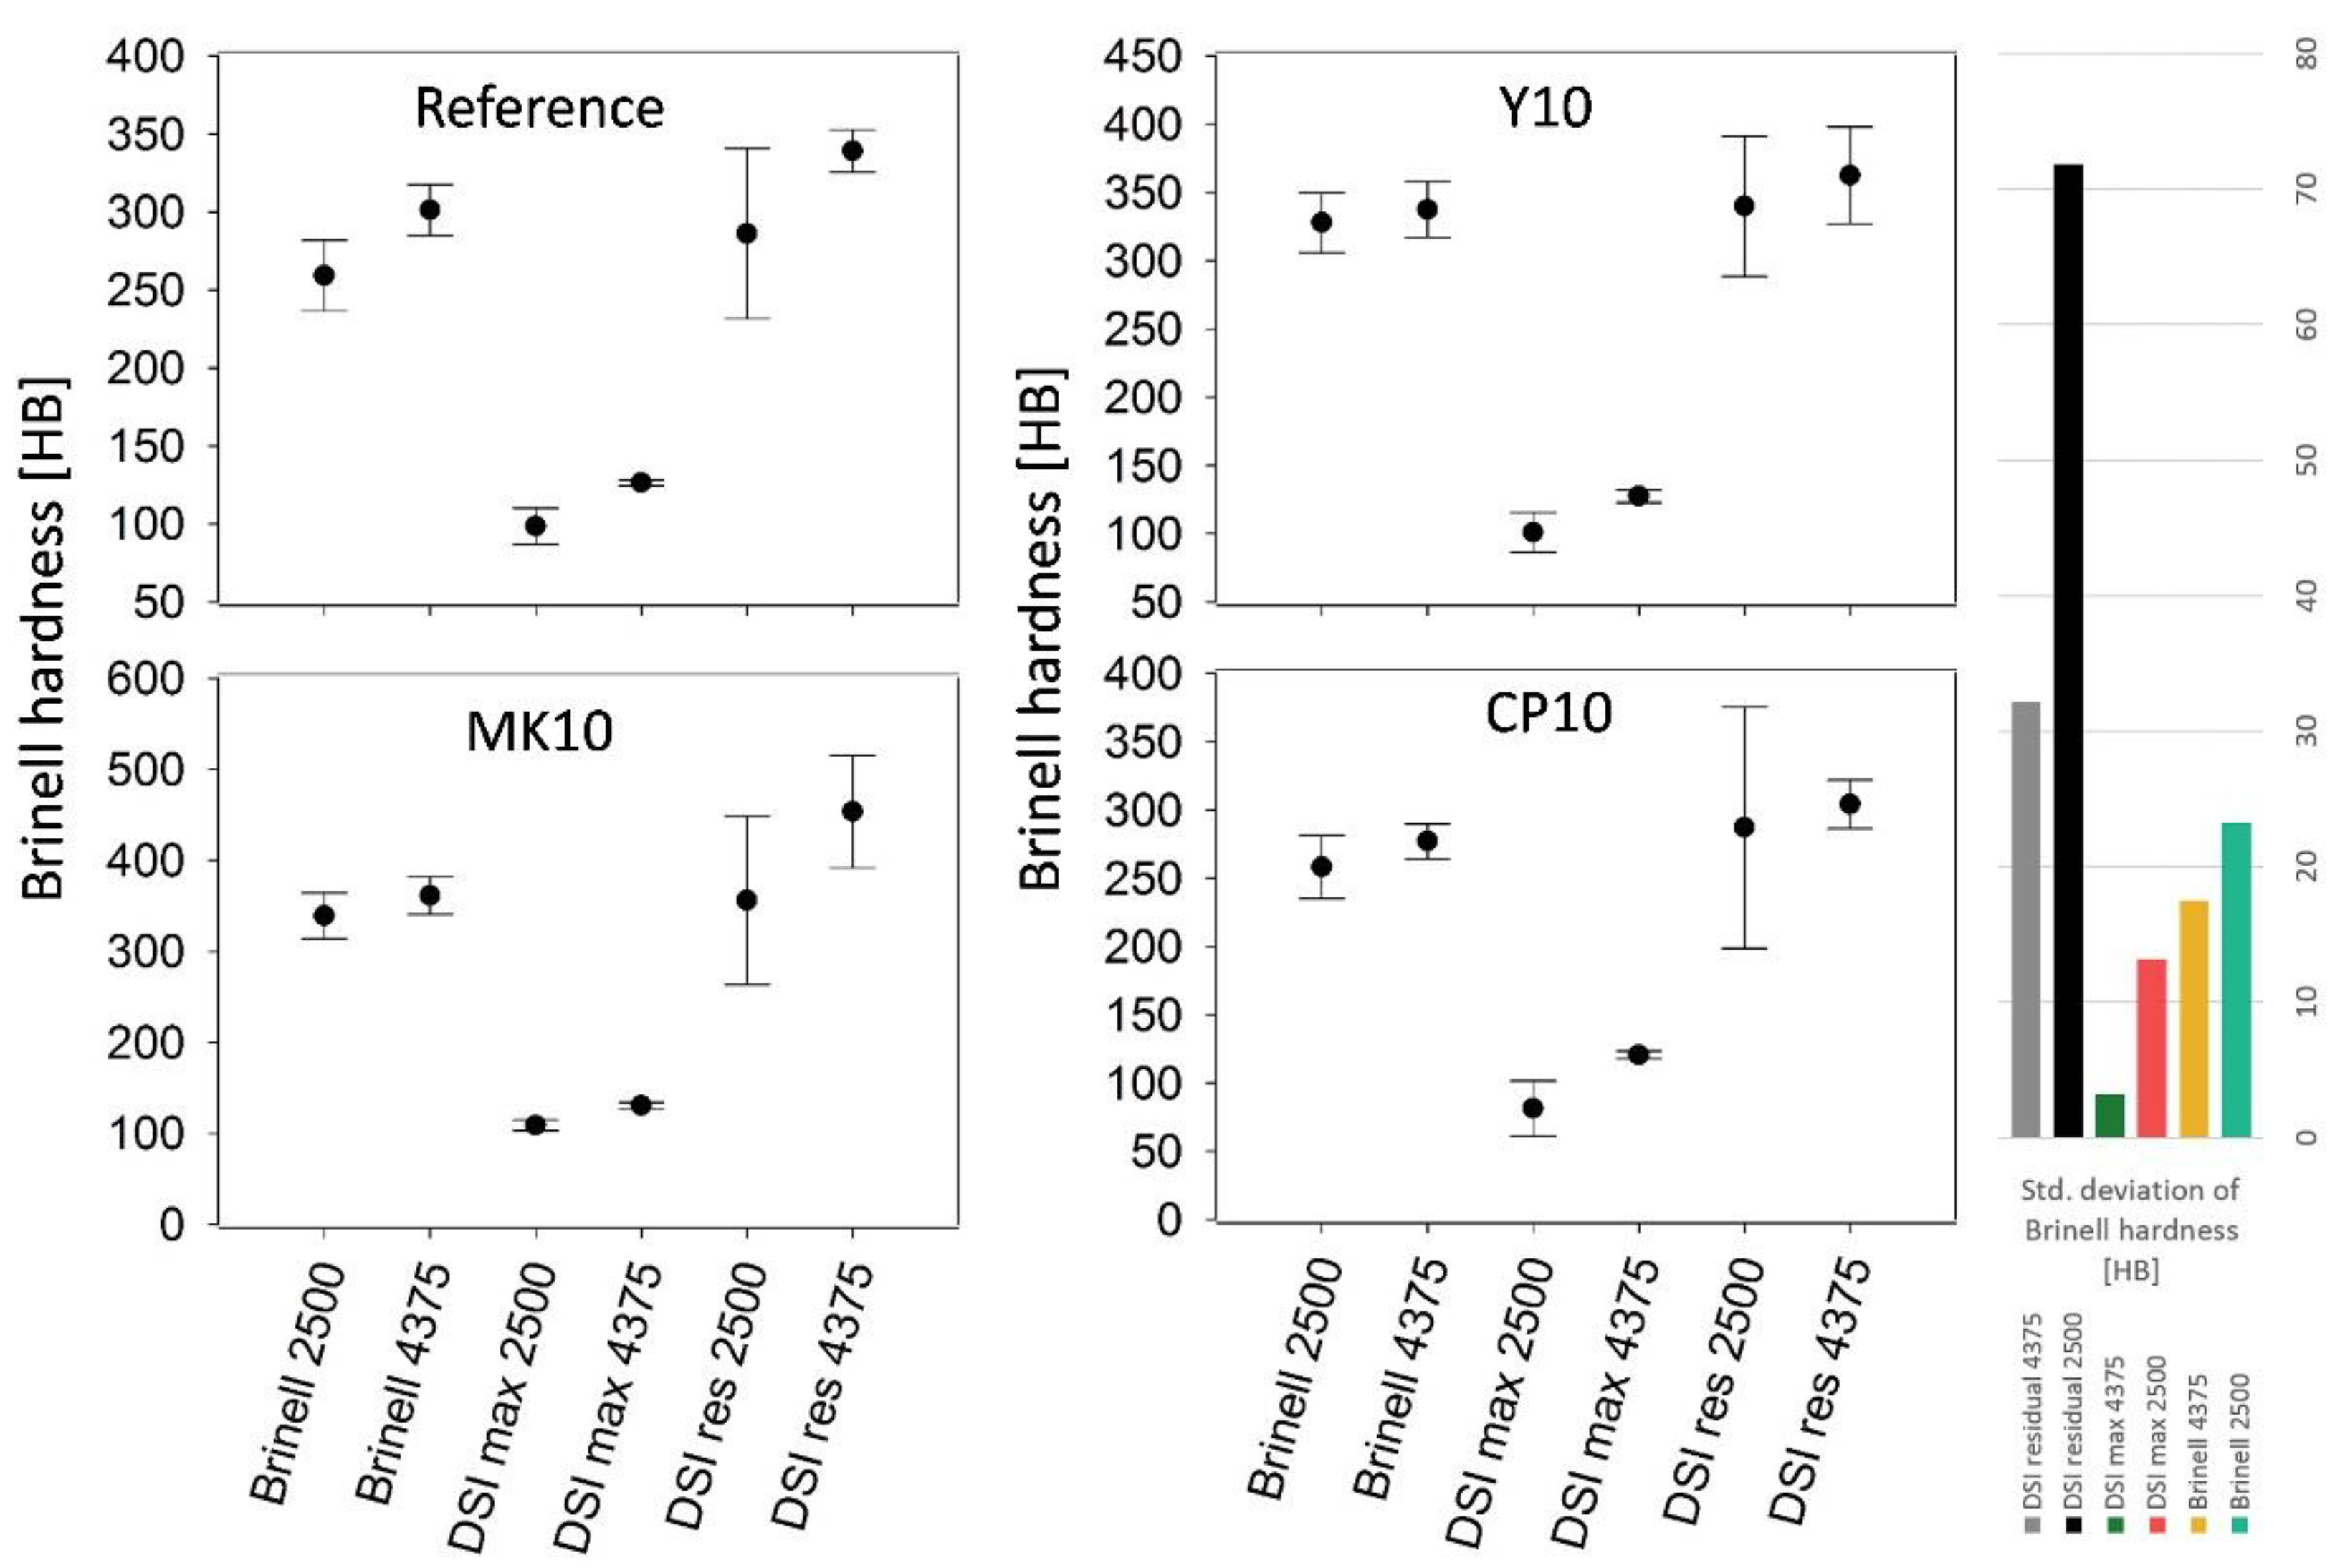
3.2. Non-Destructive Test Results

As a first step, sensitivity analysis for Brinell and DSI test was conducted on some of the reference samples. The aim of the analysis was to determine the optimal loading force for both Brinell and DSI tests. The loading force cannot be too small, otherwise the imprints on the surface of the material will be too small, and the results cannot be used, while in case of too high a load, the ball would penetrate fully to the material or it could break the sample. The results indicated to use 2500–4375 N loading force range, thus, in the latter part of the study, the results of those two load (upper and lower) levels are analyzed.
Based on the measurement results it was observed that the standard deviation of the Brinell hardness (or the indentation diameter) is lower in case of the higher load level (4375 N) than in case of the lower load level (2500 N), as can be seen in Figure 2. This observation was true for both measurement methods (Brinell and DSI) and in the case of DSI both for the maximum and residual values as well. The average standard deviations in indentation diameter were the following of all materials for 2500 N and 4375 N load level, respectively:
  • Brinell: 0.19 and 0.16 mm;
  • DSI maximum: 0.40 and 0.09 mm;
  • DSI residual: 0.51 and 0.29 mm.
This indicates that it is more advantageous to perform static hardness tests on the possible maximum load level to make the measurements more accurate. Figure 2 reflects another phenomenon, namely that the calculated Brinell hardness is always higher in case of the higher load level. Previous studies found that the Brinell hardness has a maximum value if represented as function of the loading level [12].
As expected, the value of indentation diameter (and consequently Brinell hardness) in case of the Brinell test falls between the maximum and residual value of the DSI test (Figure 2). The values of the Brinell test result should be very similar to the values of the DSI test results, with the difference that in case of the Brinell test, the sample is kept “under loading” for 15 s. During this time frame, irreversible plastic deformations develop in the material, for which there is no time given in the case of the DSI test.
By comparing the compressive strength and hardness test results, it can be seen that, as expected, with the increase or decrease in the compressive strength, the hardness values are also increasing or decreasing. This is valid in the cases of MK and CP; however, in case of Y, the relation is reversed. It could be caused by the filling effect of Y, which fills the pores of the cement paste, and thus increases its surface hardness. The effect of carbonation was excluded because the samples were stored in a hermetically (in a way that does not allow any air or other substance to leave or enter) sealed container.
Usually, the effect of a supplementary material on the compressive strength is analyzed through a ratio of the compressive strength, compared to the reference material. In our case, the effect of a given supplementary material on the hardness was investigated using a ratio compared to the reference material. For MK and CP, as mentioned, the hardness ratio follows the change of the compressive strength ration (as can be seen in Table 4); however, quantitatively the values differ. If we assume a linear correlation between the compressive strength and the hardness, the most accurate estimation is given by the Brinell hardness test at the higher load level.
It can be read from the loading–unloading curves of the DSI test that the tested materials have elastoplastic behavior (significant residual deformation, non-linear loading–unloading curve), as shown in Figure 3.
One of the advantages of DSI test method over the Brinell test is that it provides information regarding the indentation work (energy) generated during the penetration of the indenter, as shown in Table 5. Based on that, the material behavior can be analyzed. It can be seen that between the two load levels, the load increase ratio was 1.75 (4375/2500); however, the increase ratio in the total work is about 2.5. The reference material is more elastic (elastic work ratio is higher than the plastic). In case of the MK10 mix, the distribution of the work is universal between the plastic and elastic works. The Y has no significant effect on the total work; the MK decreases the total work, which indicates that the material has higher hardness, while the CP increases it, indicating a lower hardness, as can be seen in the measurements. Another interesting observation is that the dissipated energy changes much less due to the different types of additives than the elastic energy. It could be considered to be constant in case of the lower loading level (2500 N). This indicates that the compressive strength increase/decrease caused by supplementary materials influences the elastic properties of the material and so the compressive strength/hardness is related to the elastic properties of the porous materials.

4. Conclusions

The present research studied the effect of recycled powders (potential SCMs) on the strength and hardness of cement mortars. Based on the laboratory tests and theoretical analyses, the following conclusions can be drawn:
  • Based on thermogravimetric analysis, it was determined that neither the aerated concrete powder nor the concrete powder works as a traditional SMC (such as metakaolin); there is no sign of chemical reactions (hydraulic reactions). However, aerated concrete powder swells during the hardening of the mortar, which makes it a beneficial filling material until its particles are small enough (based on our measurement dmax < 0.09 mm). The CP does not show any sign of these chemical reactions during the hardening of the mortar; it could be considered as an inert material in the mix.
  • The long-term compressive strength tests showed that all applied recycled additives are influencing the hardening process of the mortar; however, after 360 days of age, their compressive strength was close to the reference mortar (CP10 was lower ~10%; Y10 was lower ~5%). By taking into account that these are recycled waste materials, from an environmental point of view, they are more advantageous and do not significantly affect the performance of the mix; it can be concluded that they could be applicable on a larger scale as well.
  • The hardness test results from both the Brinell and DSI tests unanimously indicated that on a higher load level (4375 N in the present case), the standard deviation of the results (indentation diameter / Brinell hardness) is lower. In case of MK10 and CP10, the change in the compressive strength (compared to the reference) was followed by the hardness test results. However, in case of the Y10 mortar, the compressive strength decreased, while the measured Brinell hardness increased. This can be explained by the filler effect of aerated concrete powder, which increased the surface hardness of the samples.
  • The hardness results were analyzed on an indentation energy basis, using the data available from the DSI tests. The analysis showed that all materials could be considered to be elastoplastic material. It was found that the aerated concrete powder has no effect on the total indentation energy, while the metakaolin increases it, and the concrete powder decreases it, that correlates with their hardness values compared to the reference mix.
  • The analysis also highlighted that the change in the hardness value is connected to the elastic indentation energy, while it is seemingly independent from the dissipated (plastic) indentation energy. This indicates that the change in the compressive strength caused by additives influences the elastic properties of the material.

Author Contributions

Conceptualization, Z.G. and R.N.; methodology, R.N.; software, Z.G.; validation, Z.G. and R.N.; formal analysis, Z.G.; investigation, Z.G.; resources, R.N.; writing—original draft preparation, Z.G.; writing—review and editing, R.N.; visualization, Z.G.; supervision, R.N.; project administration, R.N.; funding acquisition, R.N. All authors have read and agreed to the published version of the manuscript.

Funding

The authors are grateful to the Hungarian Scientific Research Fund (OTKA) for the financial support of the OTKA K 109233 research project.

Institutional Review Board Statement

Not applicable.

Informed Consent Statement

Not applicable.

Data Availability Statement

Not applicable.

Conflicts of Interest

The authors declare no conflict of interest.

References

  1. Aprianti, E. A huge number of artificial waste material can be supplementary cementitious material (SCM) for concrete production e a review part II. J. Clean. Prod. 2017, 142, 4178–4194. [Google Scholar] [CrossRef]
  2. Topcu, I.B.; Güncan, N.F. Using waste concrete as aggregate. Cem. Concr. Res. 1995, 25, 1385–1390. [Google Scholar] [CrossRef]
  3. Topcu, I.B.; Sengel, S. Properties of concretes produced with waste concrete aggregate. Cem. Concr. Res. 2004, 34, 1307–1312. [Google Scholar] [CrossRef]
  4. Borosnyói, A. Long term durability performance and mechanical properties of high performance concretes with combined use of supplementary cementing materials. Constr. Build. Mater. 2016, 112, 307–324. [Google Scholar] [CrossRef]
  5. Yu, R.; Shui, Z. Efficient reuse of the recycled construction waste cementitious materials. J. Clean. Prod. 2014, 78, 202–207. [Google Scholar] [CrossRef] [Green Version]
  6. Zhang, J.; Ding, L.; Li, F.; Peng, J. Recycled aggregates from construction and demolition wastes as alternative filling materials for highway subgrades in China. J. Clean. Prod. 2020, 255, 120223. [Google Scholar] [CrossRef]
  7. Fenyvesi, O.; Jankus, B. Opportunities in recycling AAC waste as aggregate for lightweight concrete. Építőanyag J. Silic. Based Compos. Mater. 2015, 67, 66–70. [Google Scholar] [CrossRef]
  8. Gyurkó, Z.; Jankus, B.; Fenyvesi, O.; Nemes, R. Sustainable applications for utilization the construction waste of aerated concrete. J. Clean. Prod. 2019, 230, 430–444. [Google Scholar] [CrossRef]
  9. Medina, G.; Sáez del Bosque, I.F.; Frías, M.; Sánchez de Rojas, M.I.; Medina, C. Ranite quarry waste as a future eco-efficient supplementary cementitious material (SCM): Scientific and technical considerations. J. Clean. Prod. 2017, 148, 467–476. [Google Scholar] [CrossRef]
  10. Narayanan, N.; Ramamurthy, K. Structure and properties of aerated concrete: A review. Cem. Conc. Comp. 2000, 22, 321–329. [Google Scholar] [CrossRef]
  11. Hoła, J.; Schabowicz, K. New technique of nondestructive assessment of concrete strength using artificial intelligence. NDT E Int. 2004, 38, 251–259. [Google Scholar] [CrossRef]
  12. Szilágyi, K.; Borosnyói, A.; Dobó, K. Static indentation hardness testing of concrete: A long established method revived. Építőanyag J. Silic. Based Compos. Mater. 2011, 63, 2–8. [Google Scholar] [CrossRef]
  13. Teramura, S.; Tsukiyama, K.; Takahashi, H. The detection of the fracture of autoclaved aerated concrete during autoclave curing process by acoustic emission. NDT E Int. 1991, 24, 273. [Google Scholar] [CrossRef]
  14. He, X.; Zheng, Z.; Yang, J.; Su, Y.; Wang, T.; Strnadel, B. Feasibility of incorporating autoclaved aerated concrete waste for cement replacement in sustainable building materials. J. Clean. Prod. 2020, 250, 119455. [Google Scholar] [CrossRef]
  15. Borosnyói, A.; Szijártó, A. Metakaolin vizsgálata cement kiegészítő anyagként a k-érték elve szerint. Építőanyag J. Silic. Based Compos. Mater. 2016, 68, 40–44. [Google Scholar]
  16. European Committee for Standardization (CEN). Testing Hardened Concrete. Compressive Strength of Test Specimens; EN 12390-3:2009 European Standard; CEN: Brussels, Belgium, 2009. [Google Scholar]
  17. Chandler, H. Hardness Testing; ASM International: Cleveland, OH, USA, 1999; 192p. [Google Scholar]
  18. Hertz, H. Über die Berührung fester elastischer Körper. J. Reine Angew. Math. 1881, 5, 12–23. [Google Scholar]
  19. Brinell, J.-A. Mémoire sur les épreuves á bille en acier. Commun. Presentés Devant Congrés Int. Méthodes D’essai Matériaux Constr. 1901, 2, 83–94. [Google Scholar]
  20. Vértesy, G.; Uchimoto, T.; Takagi, T.; Tomáš, I.; Kage, H. Nondestructive characterization of flake graphite cast iron by magnetic adaptive testing. NDT E Int. 2015, 74, 8–14. [Google Scholar] [CrossRef] [Green Version]
  21. Gyurkó, Z.; Nemes, R. Energy-based evaluation of hardness testing with discrete element method. IOP Conf. Ser. Mater. Sci. Eng. 2018, 426–433. [Google Scholar] [CrossRef]
  22. Gyurkó, Z.; Szijártó, A.; Abed, M.; Nemes, R. Effect of Cellular Concrete Powder on Durability of Normal Strength Concrete. Archit. Civ. Eng. Environ. 2018, 11, 59–64. [Google Scholar] [CrossRef] [Green Version]
  23. Gyurkó, Z.; Szijártó, A.; Nemes, R. Cellular concrete waste as an economical alternative to traditional supplementary cementitious materials. J. Therm. Anal. Calorim. 2019, 138, 947–961. [Google Scholar] [CrossRef] [Green Version]
  24. Abed, M.; Nemes, R. Characteristics of cement pastes incorporating different amounts of waste cellular concrete powder. Építőanyag J. Silic. Based Compos. Mater. 2018, 70, 151–154. [Google Scholar] [CrossRef]
Figure 1. Compressive strength test results for all mixes over time.
Solids 02 00021 g001
Figure 2. Mean values of Brinell hardness from the different measurement methods and their standard deviation.
Solids 02 00021 g002
Figure 3. Real loading–unloading curves for one of the reference samples (the different colors mean different measurements on the same sample).
Solids 02 00021 g003
Table 1. Aerated (cellular) concrete (Ytong) powder (Y), concrete powder (CP) and metakaolin (MK) proportions in the mortar samples and the list of laboratory tests performed.
NotationDescription
ReferenceReference mix, 100% cement
Y1010% of cement was substituted by Y (cellular concrete powder)
MK1010% of cement was substituted by MK (metakaolin)
CP1010% of cement was substituted by CP (concrete powder)
Table 2. Properties of the applied aerated concrete in block form.
PropertyMean Compressive Strength
(N/mm2)
Thermal Conductivity
(W·m/K)
Water Vapor Permeability
(-)
Value3.00.1255/10
Table 3. Bulk density and specific surface area of the applied additives.
AdditiveBulk Density (kg/m3)Specific Surface Area (cm2/cm3)
Aerated concrete powder (Y)20002513
Metakaolin (MK)55028,695
Concrete powder (CP)25205224
Table 4. Compressive and hardness test results.
F = 2500 NF = 4375 N
Type of Hardness TestSample NameCompressive Strength (N/mm2)Compressive Strength Ratio (-)Indentation Diameter (mm)Brinell Hardness (HB)Hardness Ratio to the Ref. Mix (-)Indentation Diameter (mm)Brinell Hardness (HB)Hardness Ratio to the Ref. Mix (-)
BrinellReference88.11.003.452591.004.203011.00
Y1083.80.953.083281.263.983381.12
MK10104.41.183.033391.313.853611.16
CP1080.30.913.462581.004.372770.93
DSI maximumReference88.11.005.48981.006.261261.00
Y1083.80.955.441011.026.251271.01
MK10104.41.185.211091.106.181301.03
CP1080.30.916.05810.836.391210.95
DSI residualReference88.11.003.292861.003.973391.00
Y1083.80.953.023401.193.843621.07
MK10104.41.183.003381.153.454541.34
CP1080.30.913.322870.764.183040.90
Table 5. Generated indentation energy during the DSI test.
2500 N4375 N
Total Work Average (kNmm)Dissipated (Plastic) Work Average (kNmm)Elastic Work Average (kNmm)Plastic Work Ratio (-)Elastic Work Ratio (-)Total Work Average (kNmm)Dissipated (Plastic) Work Average (kNmm)Elastic Work Average (kNmm)Plastic Ratio (-)Elastic Ratio (-)
Reference0.760.330.4344%56%1.940.771.1740%60%
Y100.790.340.4643%57%1.880.871.0146%54%
MK100.690.350.3450%50%1.740.880.8651%49%
CP100.910.330.5836%64%2.030.861.1742%58%
Publisher’s Note: MDPI stays neutral with regard to jurisdictional claims in published maps and institutional affiliations.

