2.3. ZigBee Terminal Node
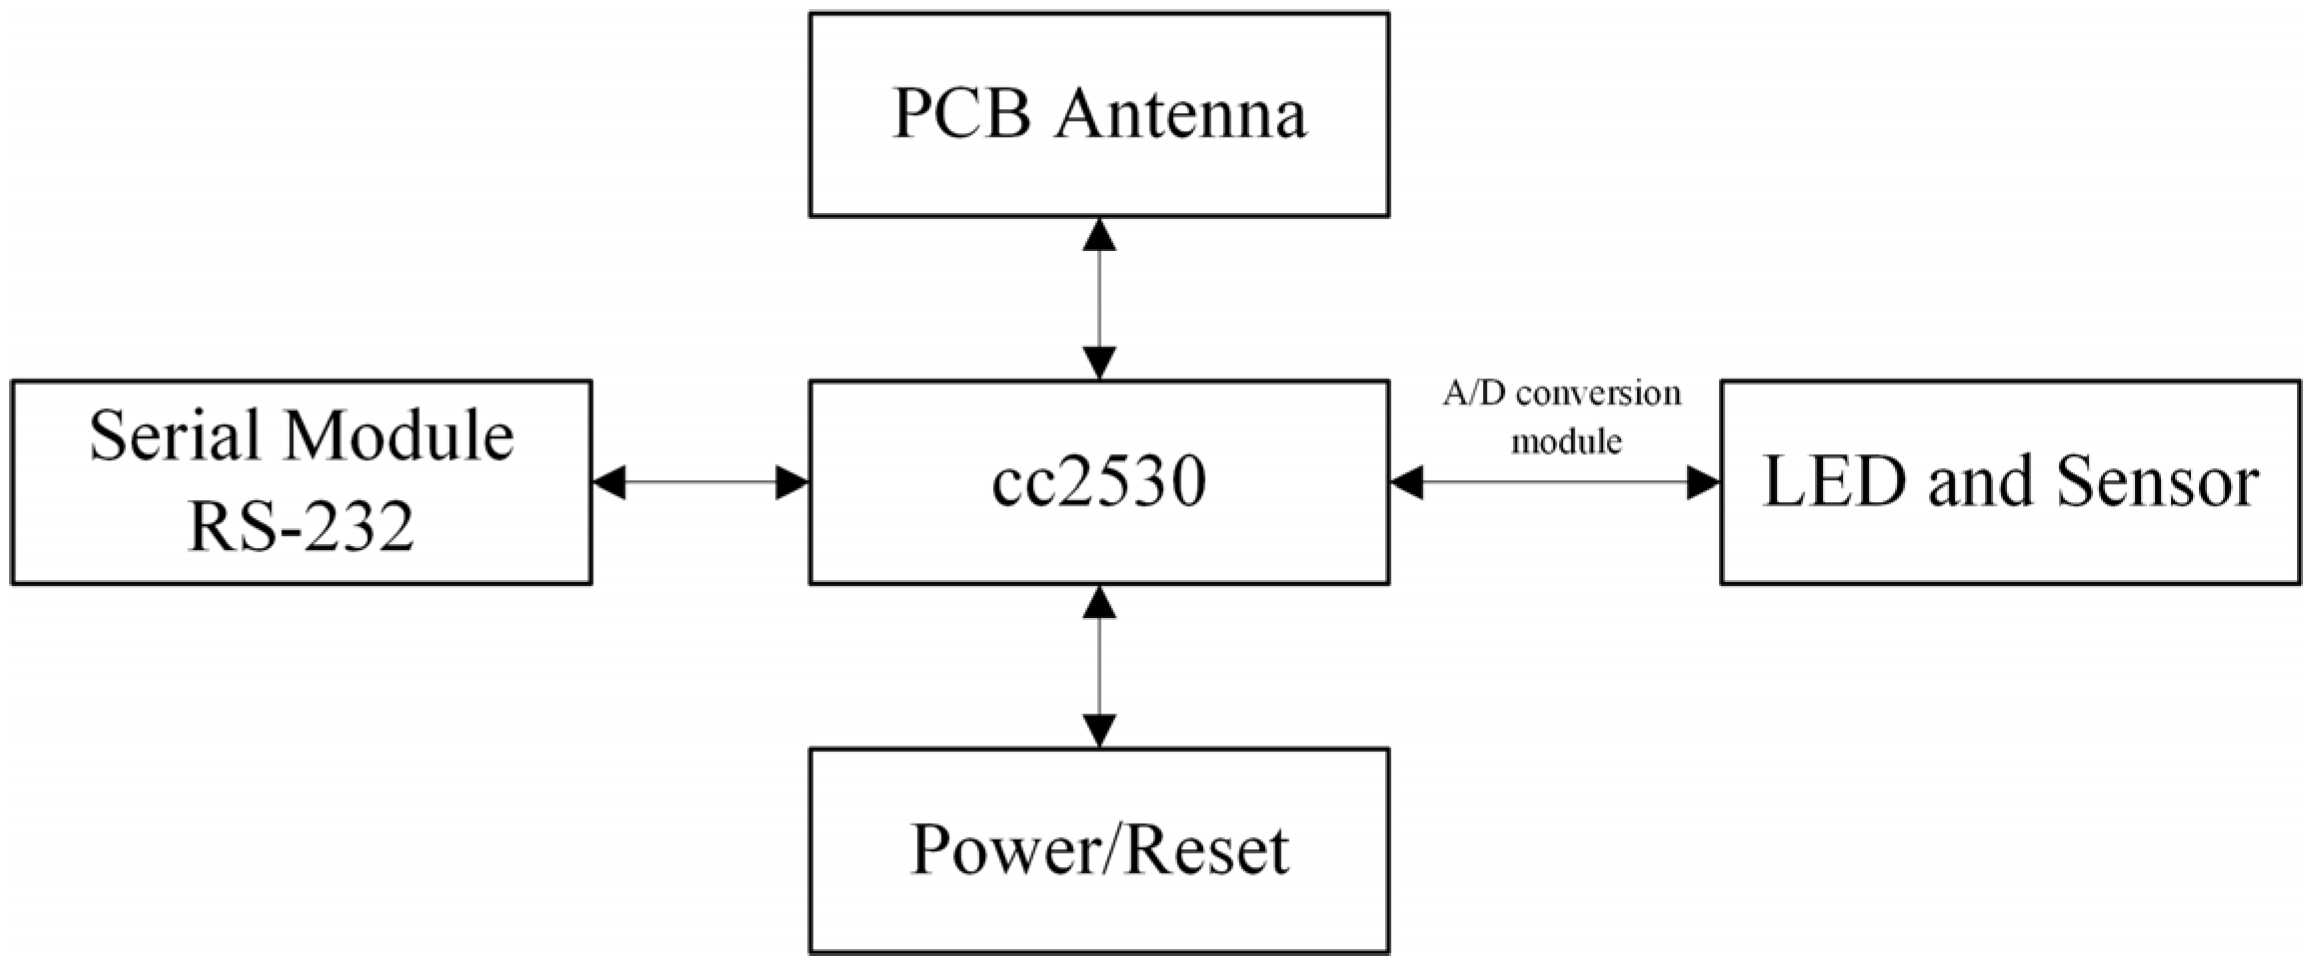
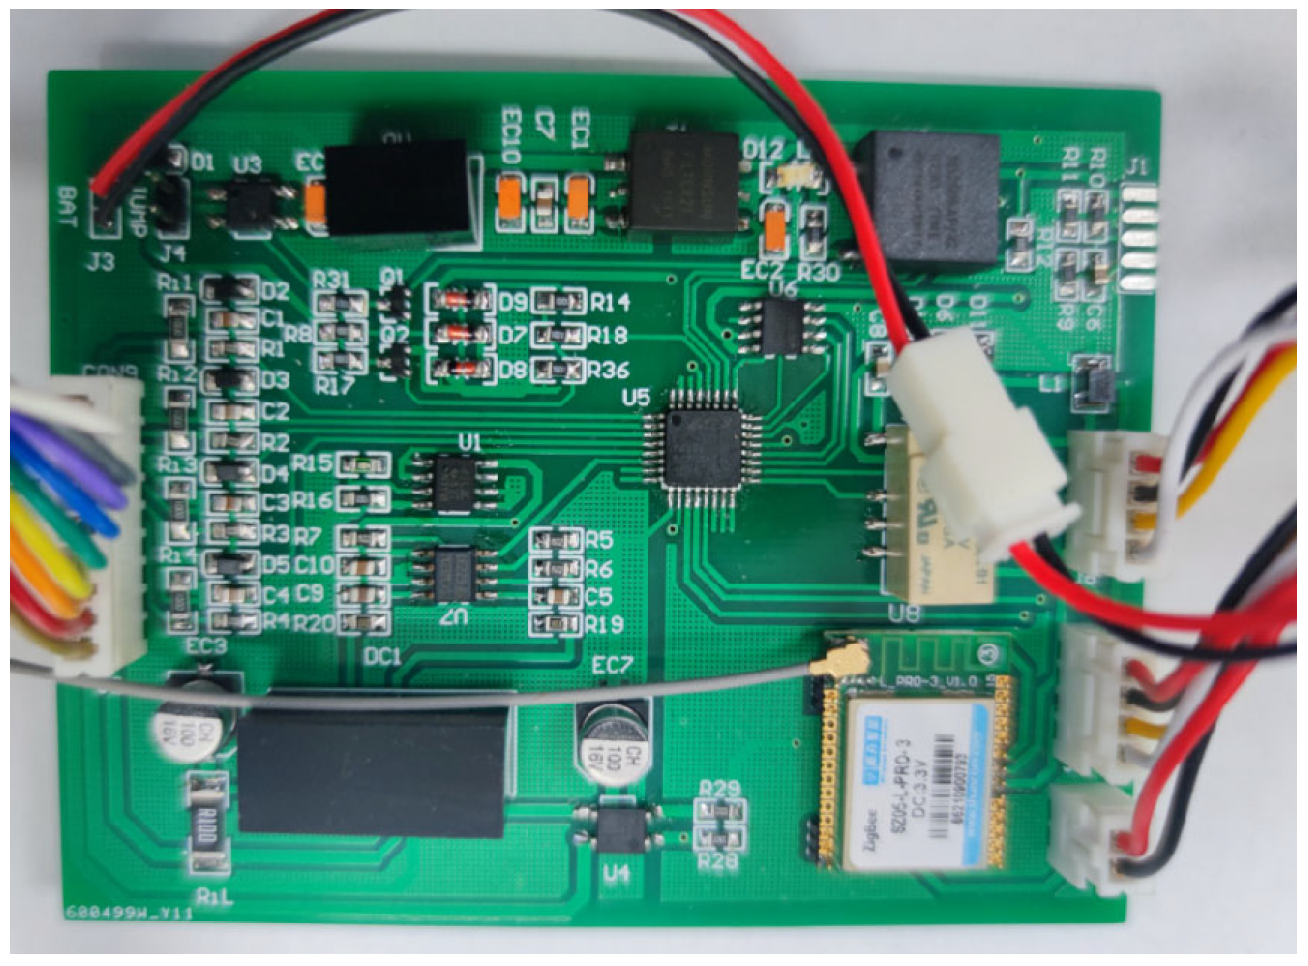
This layer is mainly composed of perceptual node modules such as the CC2530 core chip, ZigBee antenna module, RS-232 serial module, LED and sensor module, A/D conversion module, and POWER/RESET module, as shown in
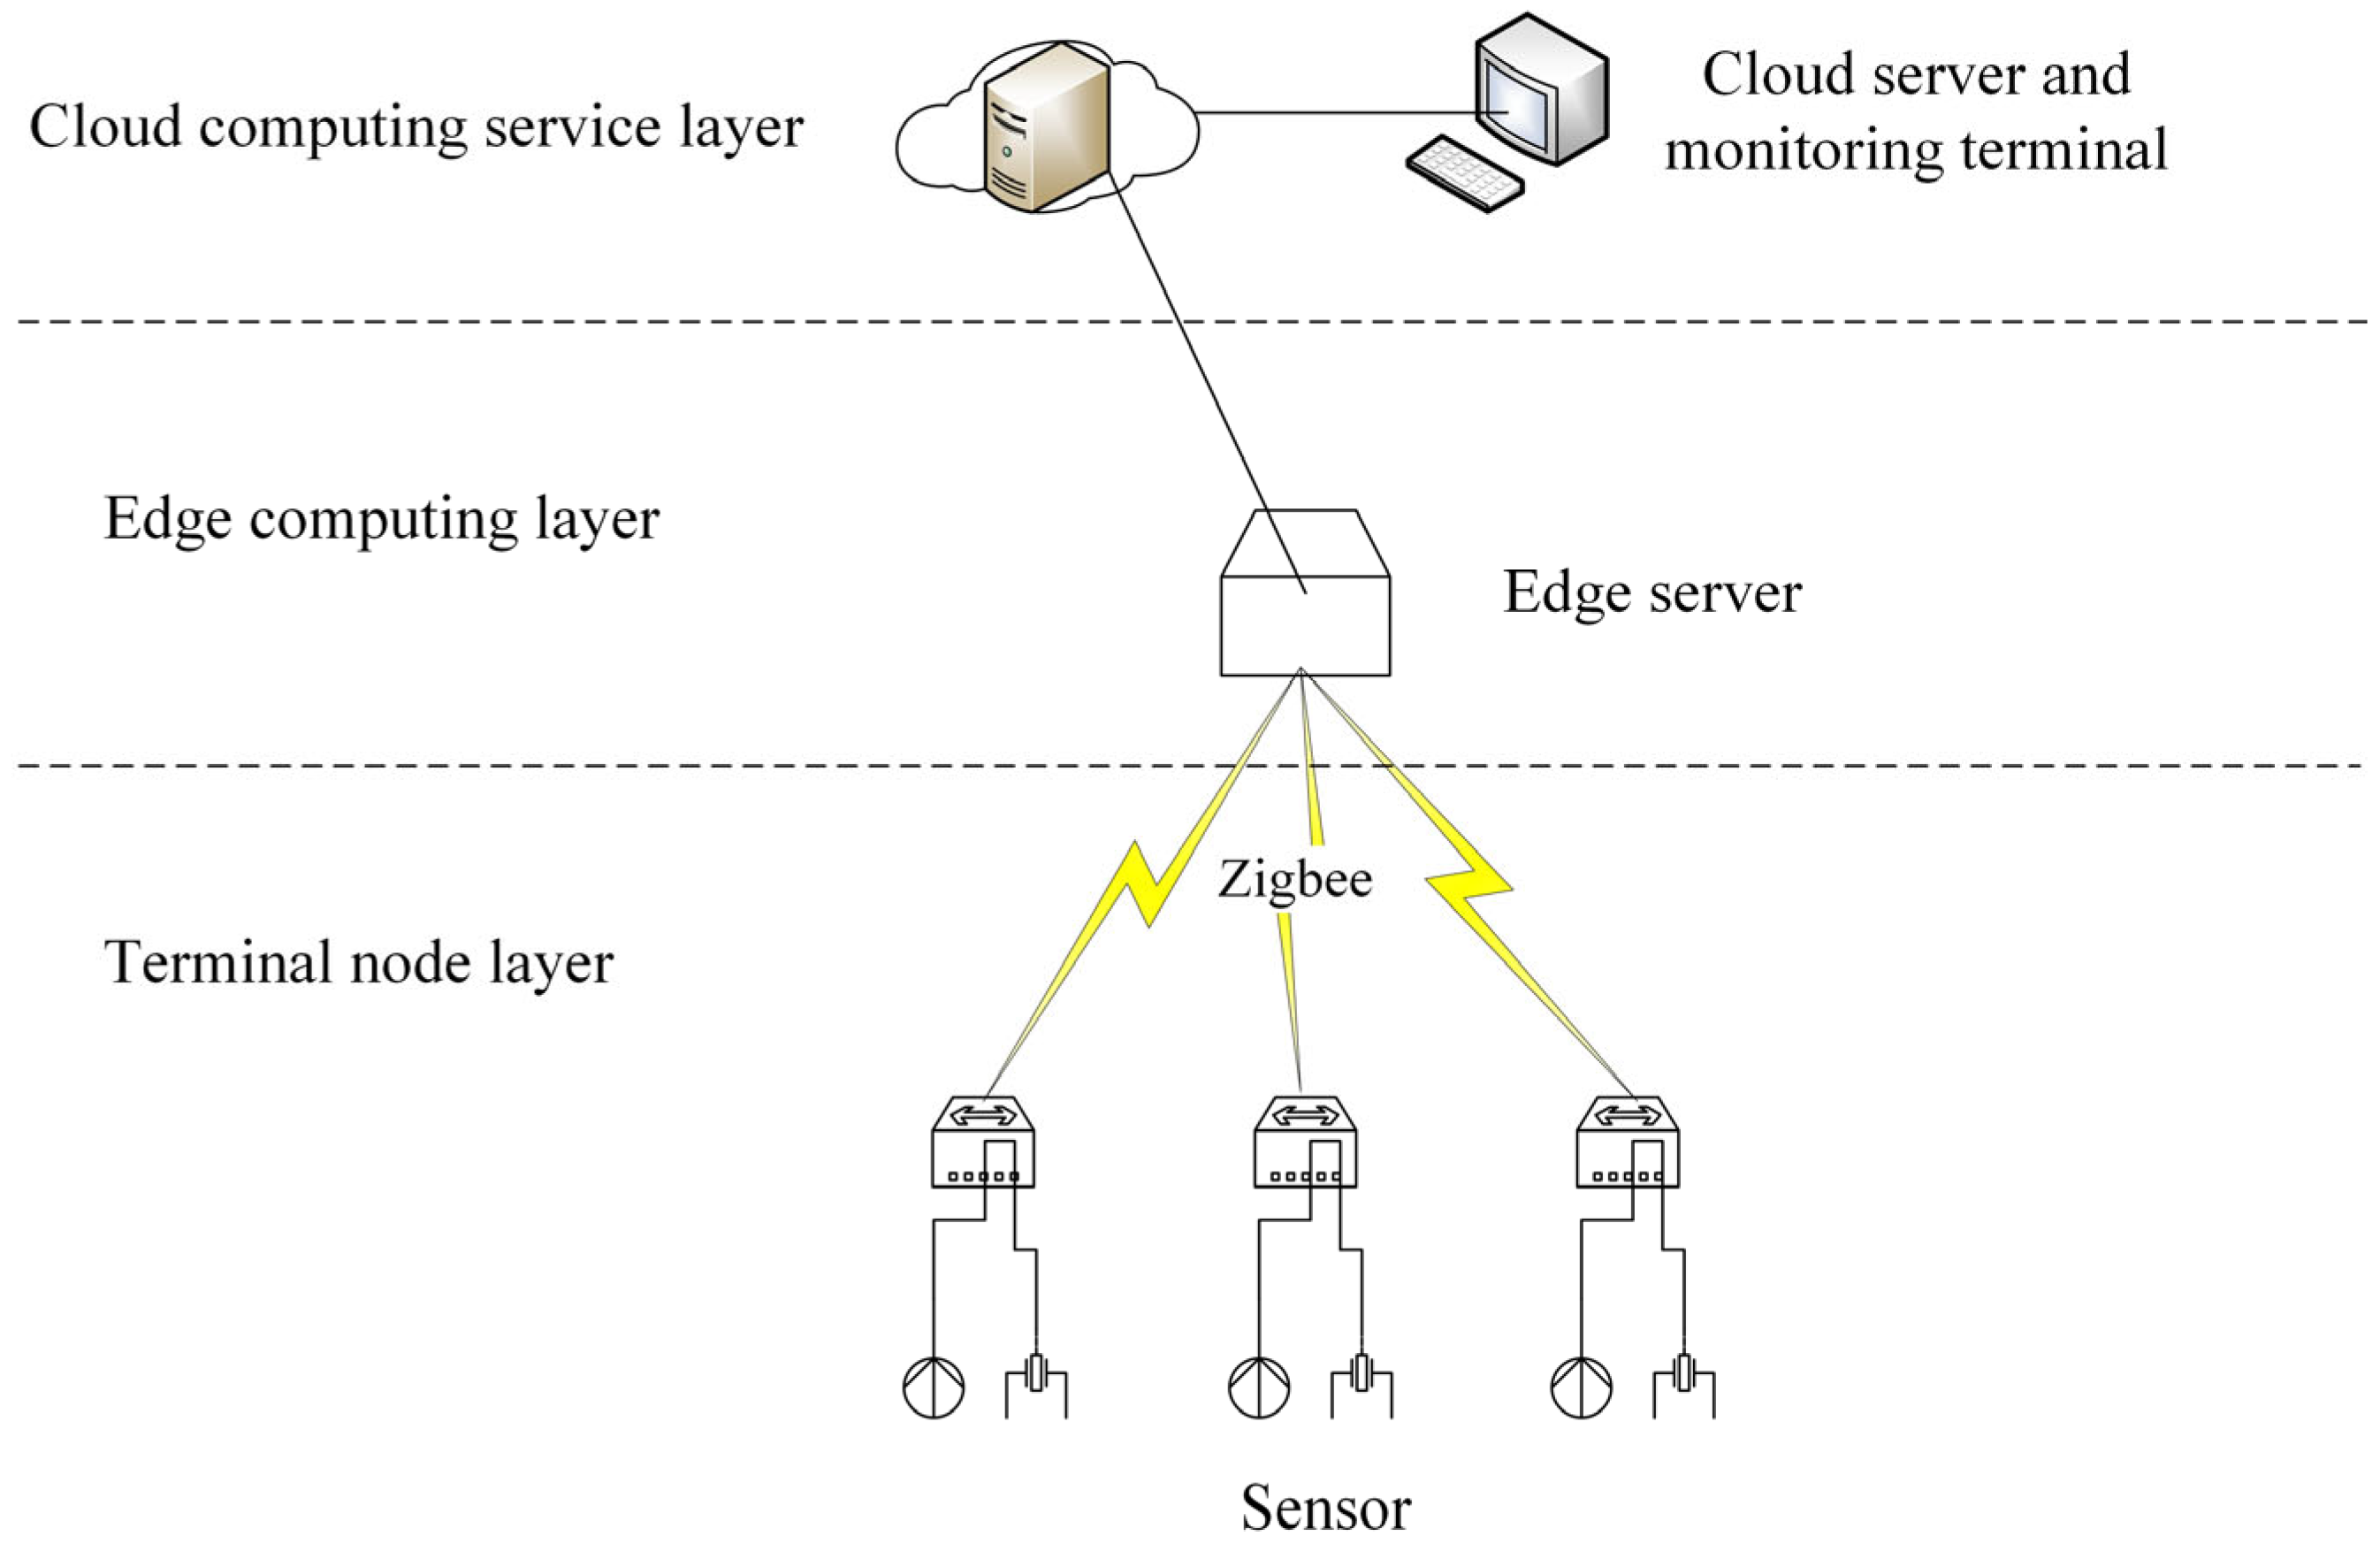
Figure 4. Those equipment were all sourced from Ebyte Electronic Technology Co., Ltd. (Chengdu, China). The expansion performance of the gateway is relatively good and can support a variety of types of sensing device access, including wired connections such as serial, Modbus, and wireless methods like ZigBee. Because of the number of sensors deployed in this system and easy to failure, the topology of WSN will be changed frequently. Considering the requirements of low power and low cost, the wireless front-end sensing nodes mainly use the ZigBee self-organizing network to form a wireless sensing network [
30]. In this system, the ZigBee network adopts a star topology, with the edge gateway serving as the central coordinator and all sensing nodes communicating directly with it. A total of five sensing nodes are deployed in the monitoring area, each transmitting a small data payload to the gateway once every 30 min, which keeps network traffic low and power consumption minimal. This configuration reduces routing complexity, simplifies network maintenance, and ensures stable communication in the confined and obstacle-rich underground stope environment. ZigBee technology is often used in remote control applications, does not require huge amounts of communication, and can be embedded in a wide range of devices [
31]. ZigBee is a wireless sensor technology based on IEEE802.15.4 [
32] with low price, low data rate, and high efficiency [
33]. Compared with other wireless communication technologies such as Bluetooth, WiFi, and LoRa, ZigBee offers significantly lower power consumption, greater scalability for large-scale node deployment, and more robust performance in interference-prone environments [
34]. Previous comparative analyses [
35] have shown that ZigBee’s ability to form self-organizing networks, combined with its high node capacity and resistance to electromagnetic interference, makes it a more reliable choice for long-term monitoring in challenging industrial environments such as underground mines. Because of these features, this technology is more suited for handling data transmission tasks in underground mining environments [
36]. The gateway is installed near the stope, close to the terminal sensing devices, to maintain a stable connection and minimize transmission delays. Processed data from the gateway is forwarded to the cloud platform through the mine’s existing wired Ethernet network, ensuring reliable, high-bandwidth communication in the underground environment.
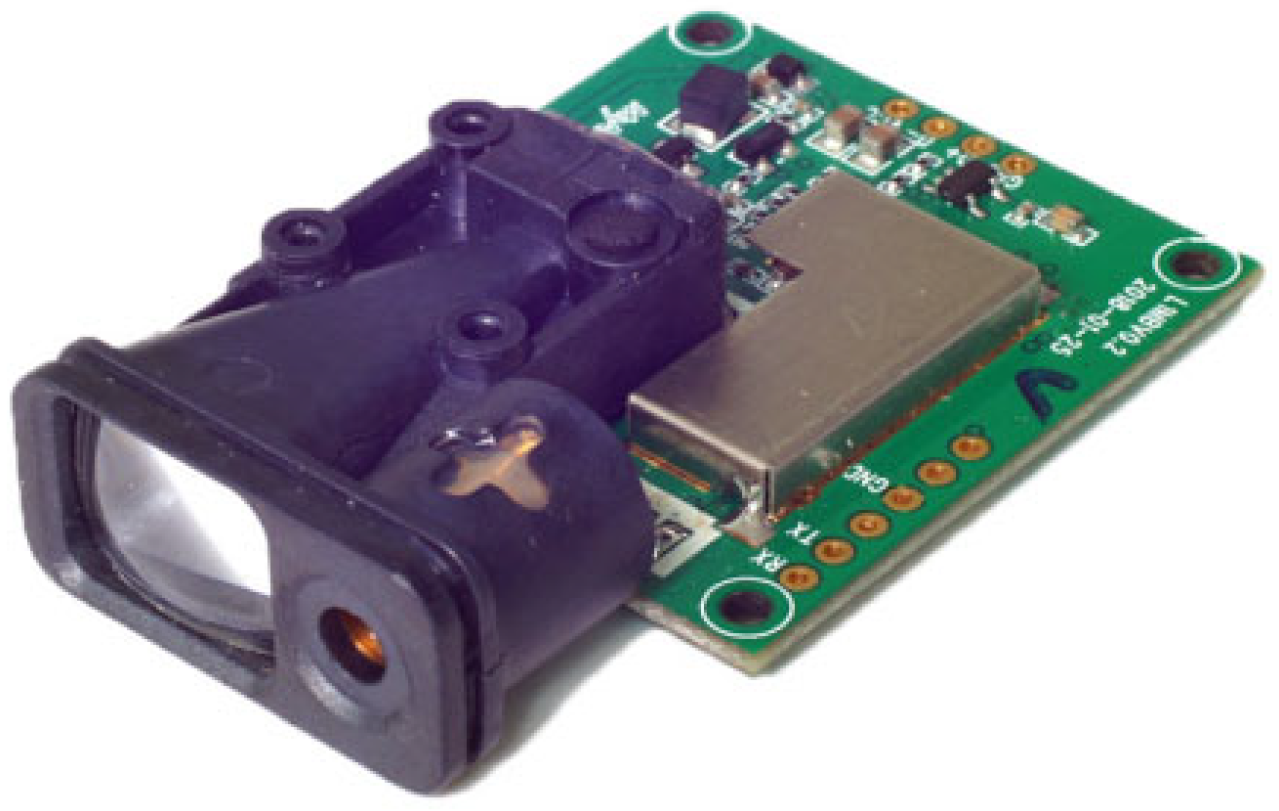
Figure 5 shows the core control board of the edge gateway used in the system. The board integrates multiple functional modules, including the CC2530 core chip for protocol processing, a ZigBee communication module for wireless data transmission, and an RS-232 serial interface for wired connections. It also contains an A/D conversion module for sensor signal digitization, power management circuits for stable operation, and multi-pin connectors for peripheral sensor access. This hardware design enables flexible connectivity, supporting both wired and wireless communication with front-end sensing nodes, and ensures reliable data acquisition and transmission in underground mining environments.
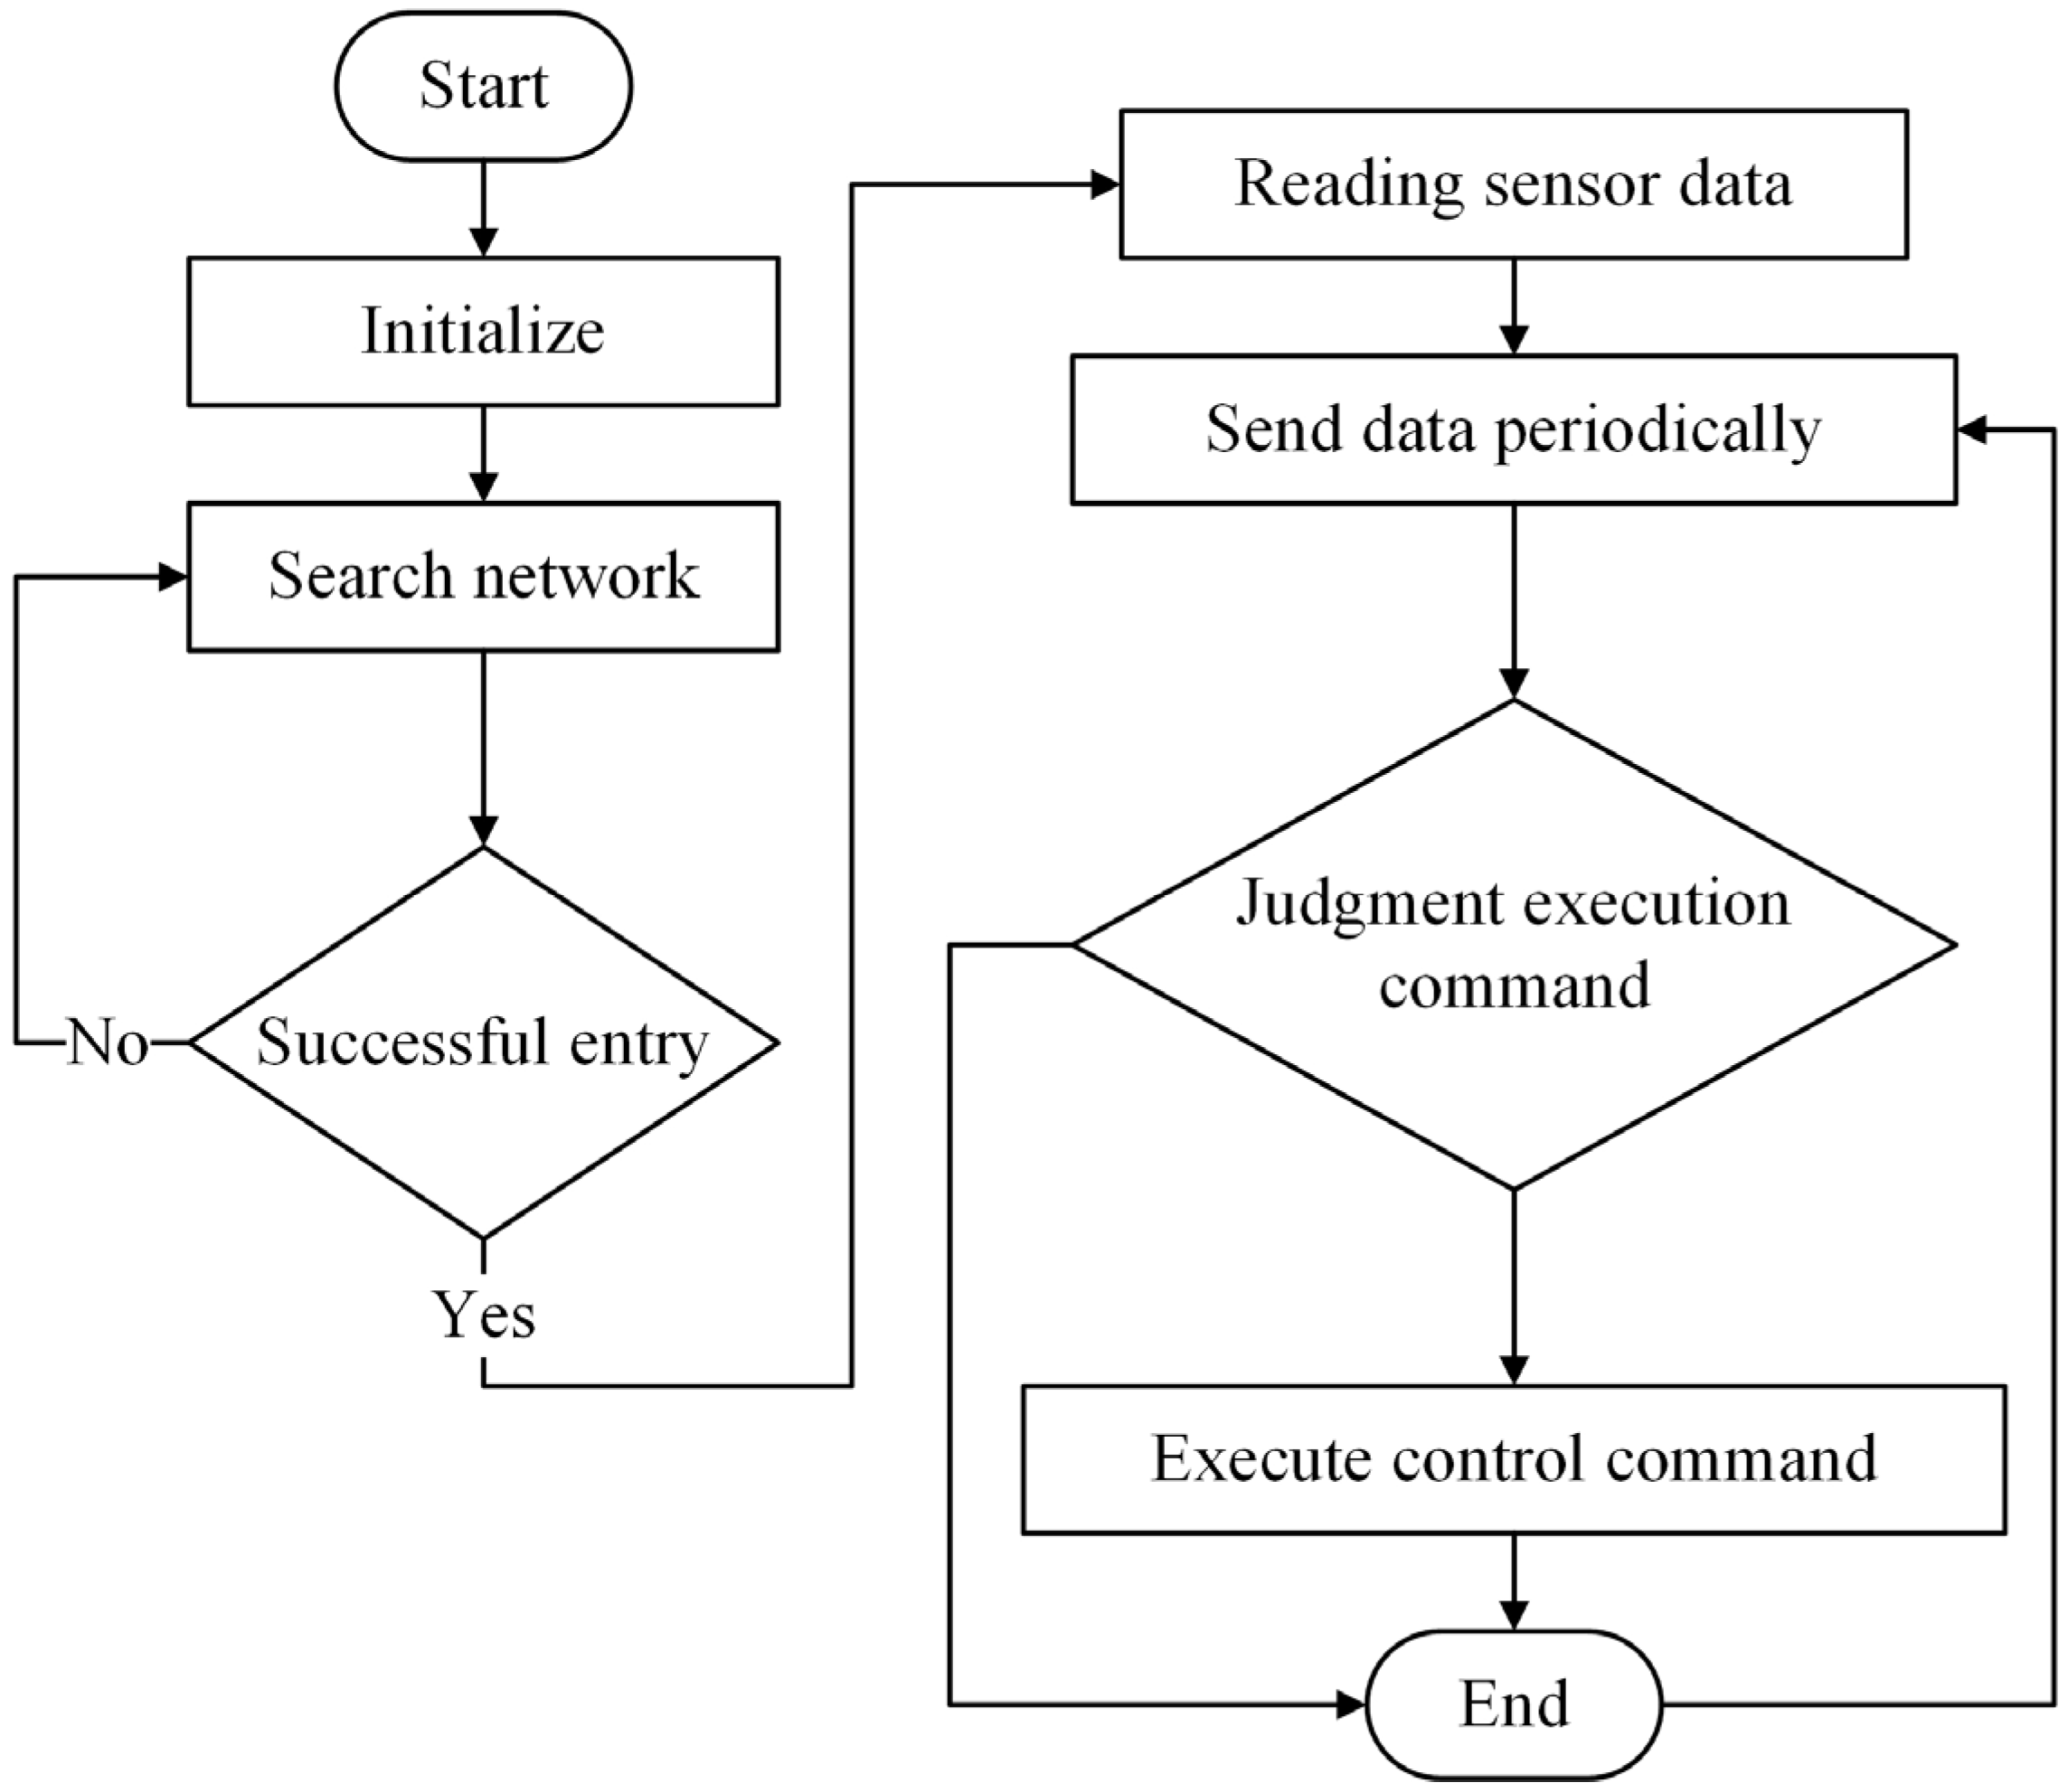
The main workflow of the ZigBee terminal node is shown in
Figure 6. The system initializes after the ZigBee terminal node starts up, then proceeds to search for and connect to the ZigBee network, and periodically reads sensor data to send it to the edge server.
The sensing nodes are powered by a lithium battery with a capacity of 21 Ah, allowing the system to operate continuously for approximately six months under typical monitoring conditions. This low-power design ensures stable operation in underground environments where frequent battery replacement is impractical.
2.4. Edge Server Hardware Selection
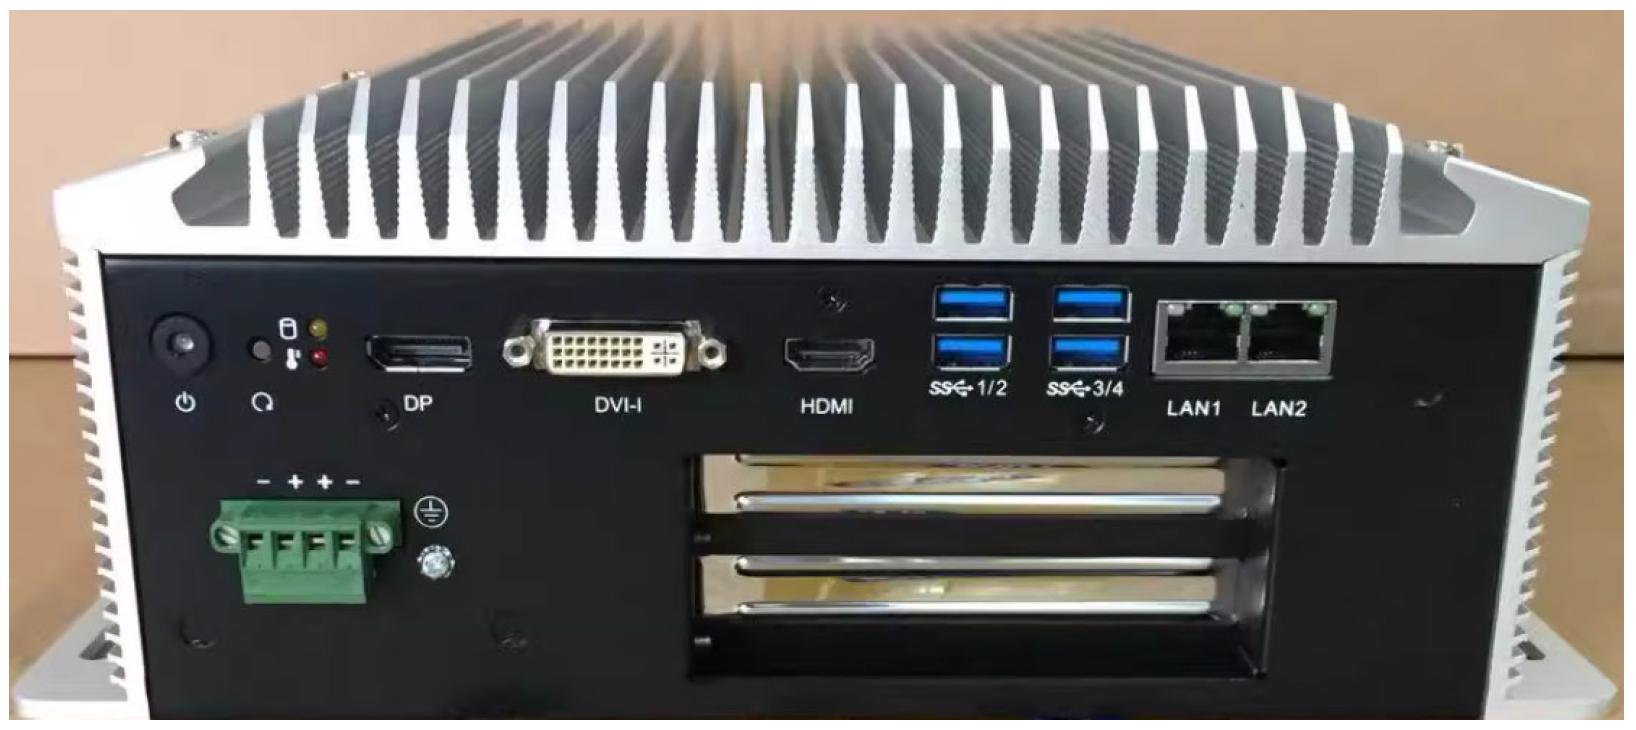
The edge server is the core component of data collection in this system. It is mainly composed of the core processor and peripheral function modules. The edge server of this system not only serves as the protocol conversion function for sensing information aggregation but also has fast computing and processing performance as well as rich peripheral resources. The CPU of the Edge Server is an Intel Celeron G5905, from Intel Corporation, Santa Clara, CA, USA. In addition to the core board, it also has interfaces of HDMI, LVDS × 2, LCD, single 1080p LVDS or dual LVDS below 1366 × 768, Gigabit Ethernet, USB master + slave, PCIE, CAN, SD × 2, UART × 4, which can be configured as 232 or 485, as well as supporting audio input and output, as shown in
Figure 7. This high-performance edge server effectively addresses the computing power constraints of edge devices, enabling the execution of complex data processing and anomaly detection algorithms locally.
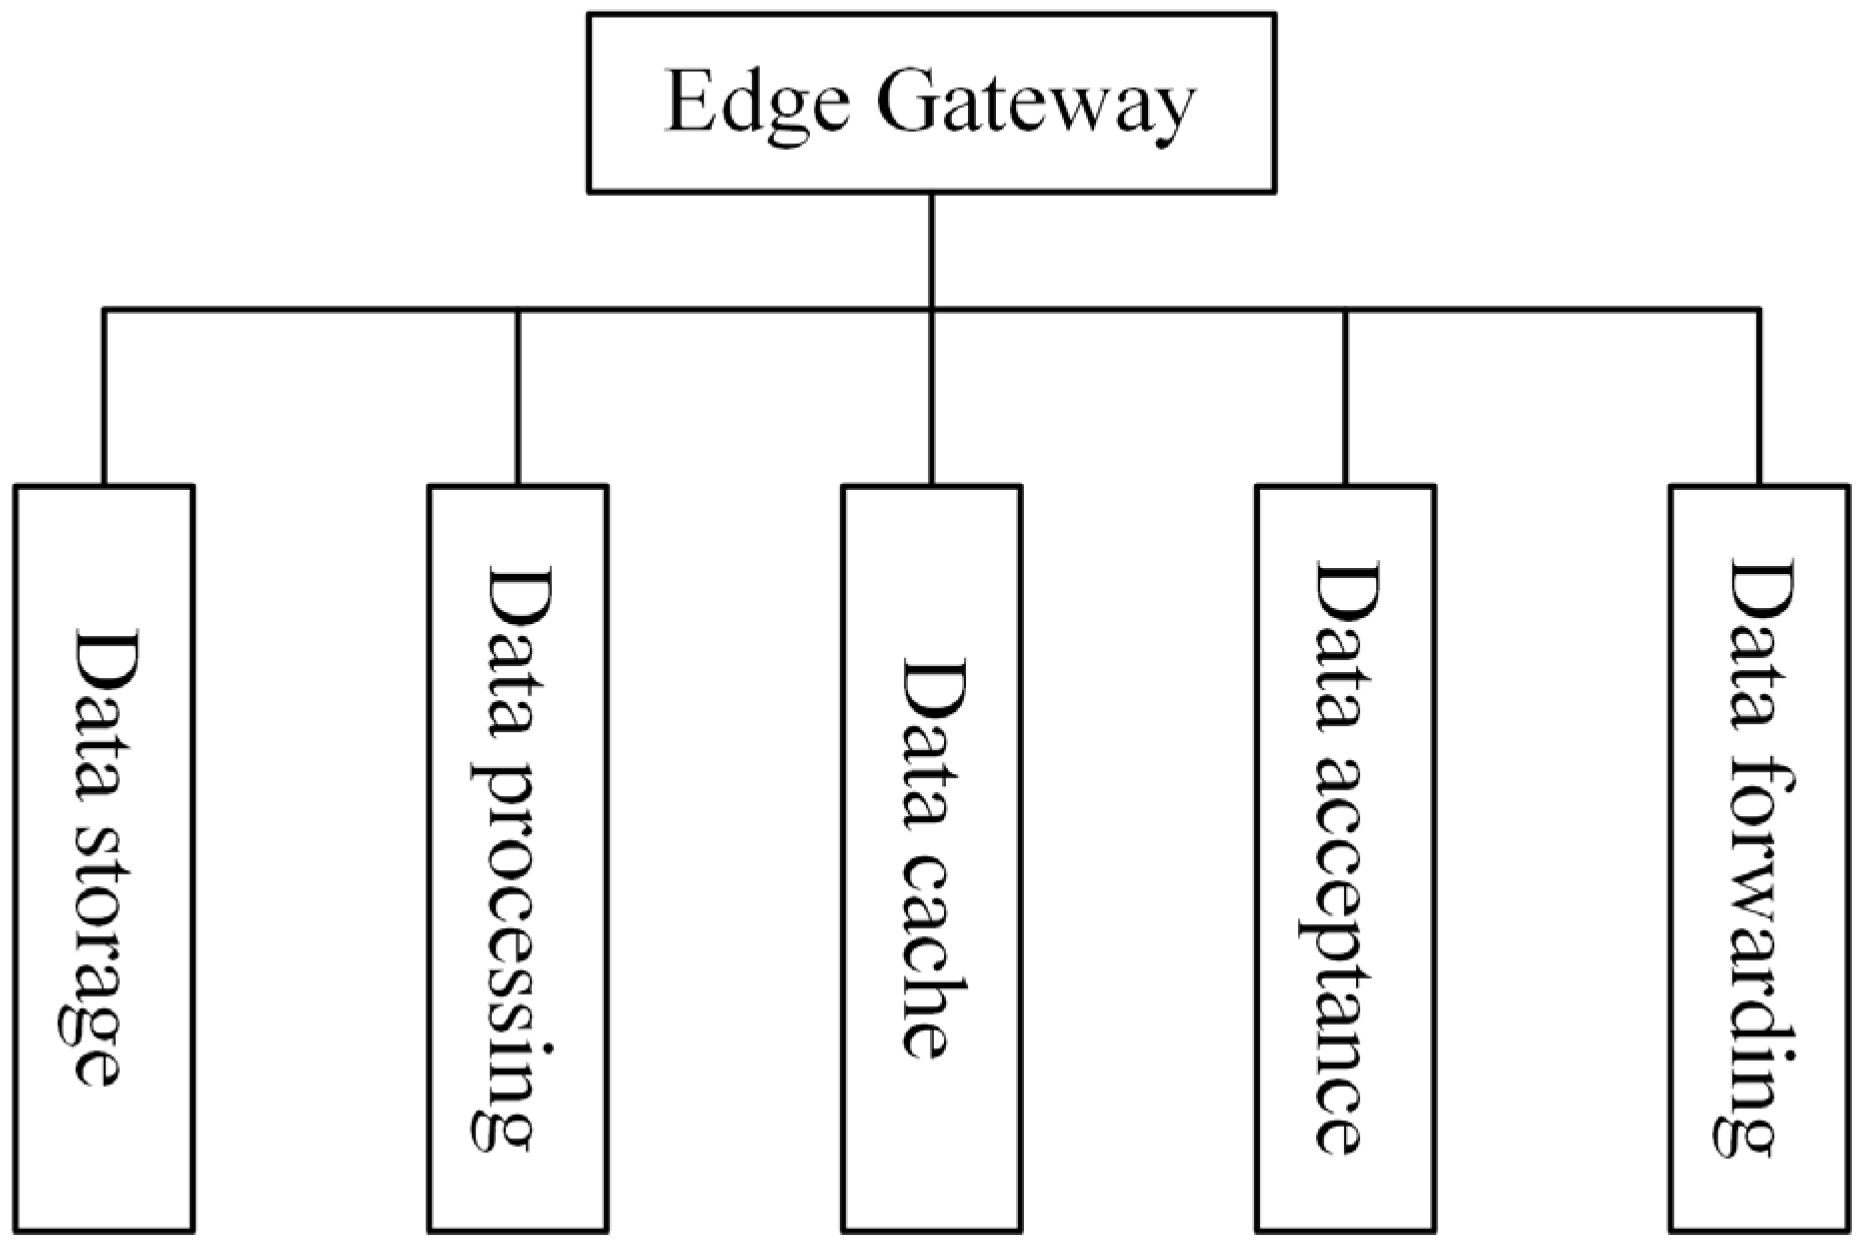
Since early warning mechanisms require a high degree of real-time performance, it is necessary to move these mechanisms, traditionally deployed on the cloud, forward to the front-end gateway. In addition to the simple routing and forwarding functions of traditional gateways, this gateway also provides data storage, processing, caching, reception, and transmission. Its processing capability is used to aggregate, pre-process, and filter data, thereby enhancing overall data handling efficiency. By combining edge computing with the data monitoring platform, the gateway can perform complex analytics and support incident handling and decision-making. The functionality of the gateway is illustrated in
Figure 8.
If data is transmitted to the cloud and an incident occurs, decision packets must be returned to each IoT device, which inevitably causes network latency. Edge computing addresses this issue by adapting to the processing requirements of each application. To meet low-latency requirements, decision-making algorithms are executed at the edge gateway, thereby enabling rapid data processing at the edge and effectively reducing network latency [
37].
As an efficient and stable edge gateway server, its software architecture is particularly important. An effective architecture should feature clear code logic, minimal interface encapsulation redundancy, strong scalability, and high system stability. The gateway functions as an aggregate node, receiving all data from the lower sensing nodes. An important consideration is how to efficiently receive large volumes of data in a one-to-many communication mode. In addition, the gateway must support data caching, as the system needs to retain data for a period of time rather than forwarding it immediately. Under normal operating conditions, data are transmitted to the cloud as soon as they are received by the gateway. However, in underground mining environments, network stability is often limited and bandwidth is constrained. To ensure data integrity, the gateway temporarily caches the collected data and forwards them to the cloud once the connection is stable, with a default transmission interval of 30 min. As the core prediction and decision-making logic operates locally at the gateway, this scheduled transmission strategy does not compromise the system’s responsiveness. Due to the gateway’s limited forwarding capacity, caching is also essential to prevent data loss. Most importantly, as the front-end node of edge computing in this system, the gateway must possess strong data processing capabilities [
38].
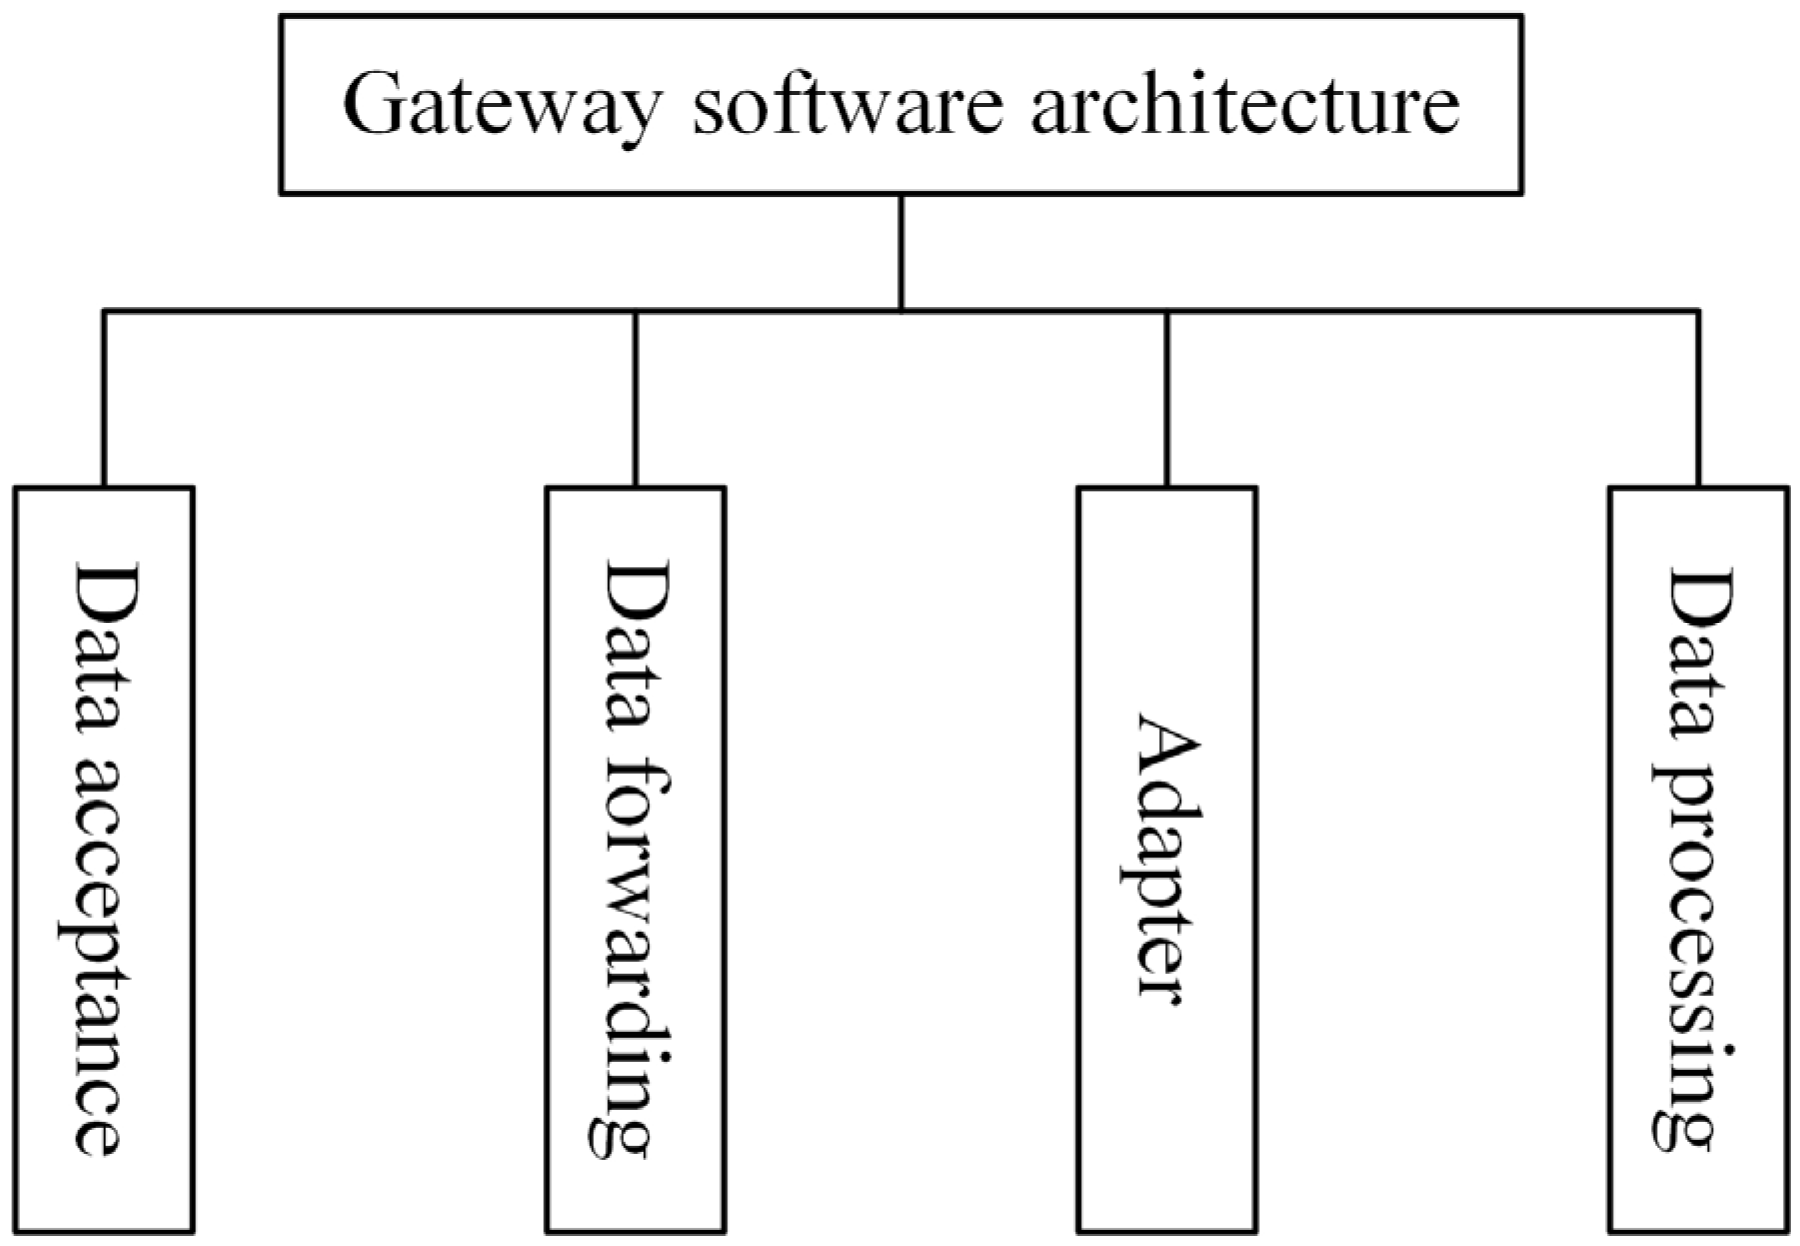
To address the above issues, the gateway architecture in this system consists of four main modules: the receiver module (data reception), the entry module (adaptation), the handle module (data processing), and the transmit module (data forwarding), as shown in
Figure 9.
Receiver module—This module receives data from sensing nodes using a multiplexing approach. Whenever a sensing node is connected, a communication channel is allocated. At its core is a selector poller implemented as a dedicated polling thread within the gateway’s application-level thread pool. The gateway runs on an embedded Linux operating system, and each functional module operates as an independent thread, with scheduling handled by the OS thread management mechanism. The selector poller periodically (every 100 ms) checks all registered communication channels for I/O readiness events and dispatches active channels to processing threads, enabling efficient handling of up to 64 concurrent connections. This design combines multi-threaded concurrency with OS-level scheduling, ensuring low latency and high throughput in underground mining conditions.
Entry module—Designed for system scalability, this module manages other modules through dynamic library loading. Each functional module is compiled as a separate dynamic library. When the program runs, it loads the appropriate library according to the configuration file and calls the entry module to manage execution. Different versions of a module can be used; for example, several versions of the handle module may exist for different data processing methods, and switching between them requires only a configuration file change.
Handle module—This module processes incoming data through open interfaces and applies algorithms suited to specific application environments. In this system, anomaly detection is performed using residual analysis with a moving average filter. The raw sensor data are smoothed using a fixed-size moving average window to generate a baseline signal, and the residual is computed as the difference between the measured value and the baseline. If the residual exceeds a threshold determined from historical monitoring data, the event is flagged as an anomaly. This approach effectively filters random noise while enabling timely detection of significant deviations.
Transmit module—Based on the TCP/IP protocol, this module uploads data from the gateway to the server. It packages the data, adds the source address, performs routing and forwarding, and sends it to the server.
2.5. Monitoring Platform Software Design
The data collected at the lower layer must be transmitted to the data monitoring platform after being processed by the edge gateway. This platform supports real-time querying of characteristic data changes during the mining process and provides essential functions such as equipment management and authority management. For example, during mining operations, if the roof strain exceeds the threshold value, the edge gateway makes the decision locally and uploads the relevant data to the platform. The platform then monitors these changes, enabling managers to promptly assess the situation and intervene to prevent adverse developments. The authority management function ensures that sensitive data are not accessible to unauthorized personnel. Users with different permission levels are presented with different interfaces upon login. Equipment management is another key feature of the platform. It records the status and specifications of equipment currently deployed in the mining section, providing managers with a comprehensive view of ongoing operations. In addition to real-time monitoring, the platform includes a history module that allows users to view and analyze historical data over a defined period, supporting long-term operational assessment and decision-making.
The data monitoring platform is designed to enable administrators to monitor, in real time, the data collected by the front-end sensing layer. Its main functions include equipment management, environmental monitoring, personnel positioning, history recording, and system management, as shown in
Figure 10.
Equipment management module—This module manages front-end sensing hardware, such as sensors and gateways. It supports the registration of device information, summarizes anomaly and maintenance records, and provides device query functions to quickly locate specific equipment when large numbers of devices are deployed.
Environmental monitoring module—This module is divided into two sub-modules. The first provides an overview of basic data by displaying multiple parameters on a single page, reducing the need for page switching. The second presents specialized data views to enable focused monitoring of parameters of interest.
Personnel positioning module—This module is currently under development and will enable real-time location tracking of personnel within the mining site.
History module—Complementing the environmental monitoring module, this function allows users to view historical monitoring data, which are otherwise unavailable in the dynamic real-time view. It supports analysis of past data trends for operational assessment.
System management module—This module manages user access rights. Through page, module, role, and user management, it assigns different permission levels to different users, thereby preventing data leakage and ensuring data security.
The data monitoring platform represents the application layer where administrators directly interact with the system. The data displayed on the upper-layer platform originate from the underlying hardware, including sensor nodes and aggregation gateways. The gateway receives data from neighboring nodes and preprocesses multi-source inputs. This system applies a sliding-window method, referencing data from adjacent nodes for fault discrimination, event detection, and anomaly identification. When an incident occurs, it is processed according to its specific characteristics, with event discrimination performed at the gateway layer to reduce network transmission time and improve response time. If abnormal data are detected, filtering operations are carried out to alleviate bandwidth pressure and prevent corrupted data from contaminating the server’s dataset.
2.6. Intelligent Prediction of Stope Roof Subsidence and Deformation
Stope subsidence is a key indicator of stope dilation and deformation. Therefore, accurate and intelligent prediction of subsidence is crucial for maintaining the stability of surrounding rock in deep mining. To address this challenge, many researchers have employed deep learning techniques, with commonly used algorithms including the Backpropagation (BP) neural network and the Recurrent Neural Network (RNN). In this study, considering the convergence deformation characteristics of the stope, the variation in subsidence over time is treated as an equally spaced time series. Based on this representation, a Long Short-Term Memory (LSTM) neural network is employed to perform intelligent prediction of stope subsidence.
The LSTM model is trained on the cloud, leveraging the abundant computational resources available in cloud environments to significantly reduce training time. After training, the model is deployed to edge intelligent devices, enabling localized prediction services and reducing data transmission latency. This approach fully utilizes the limited computational capacity of edge devices for inference, while alleviating the computational burden on the cloud. By combining cloud-based training with edge-based inference, the system achieves both high training efficiency and low-latency prediction.
Long Short-Term Memory (LSTM) is a special type of recurrent neural network (RNN). Based on the RNN architecture, LSTM introduces a gating mechanism that enables the model to effectively transmit and represent information in sequences, thereby avoiding the loss or omission of useful prior information. This mechanism effectively addresses the issues of vanishing and exploding gradients. Compared with standard RNNs, LSTM introduces three types of gates: the input gate, the forget gate, and the output gate. Among them, f
t denotes the forget gate, which determines whether the information from the previous time step should be retained or discarded; it denotes the input gate, which controls the extent to which new information from the current input is stored in the cell state; and Ot denotes the output gate, which decides how much of the updated information should be transferred to the next time step.
Figure 11 illustrates the internal structure and data flow of a Long Short-Term Memory (LSTM) network. The inputs consist of the current time step input vector X
t and the previous hidden state h
t−1, which are processed through three distinct gating mechanisms:
Forget gate (ft): Generates a coefficient between 0 and 1 via a sigmoid activation function, determining the proportion of information from the previous cell state Ct−1 to retain or discard.
Input gate (it): Also uses a sigmoid activation to produce a gating coefficient, which is combined with a candidate memory vector generated by a tanh activation. This combination controls how much new information is written into the cell state.
Cell state update (Ct): The new cell state is computed by combining the retained portion of the previous state with the scaled candidate memory, using element-wise addition. This additive update path helps mitigate the vanishing gradient problem.
Output gate (Ot): Determines the portion of the updated cell state to output as the new hidden state. Specifically, the updated cell state Ct is passed through a tanh activation and multiplied by the output gate coefficient, producing the current hidden state ht, which serves as both the time step’s output and an input to the next step.
Through the coordinated operation of these three gates, LSTM networks can selectively forget irrelevant information, retain essential context, and output the necessary information, enabling them to effectively capture long-term dependencies while alleviating the gradient vanishing issue present in standard RNNs.
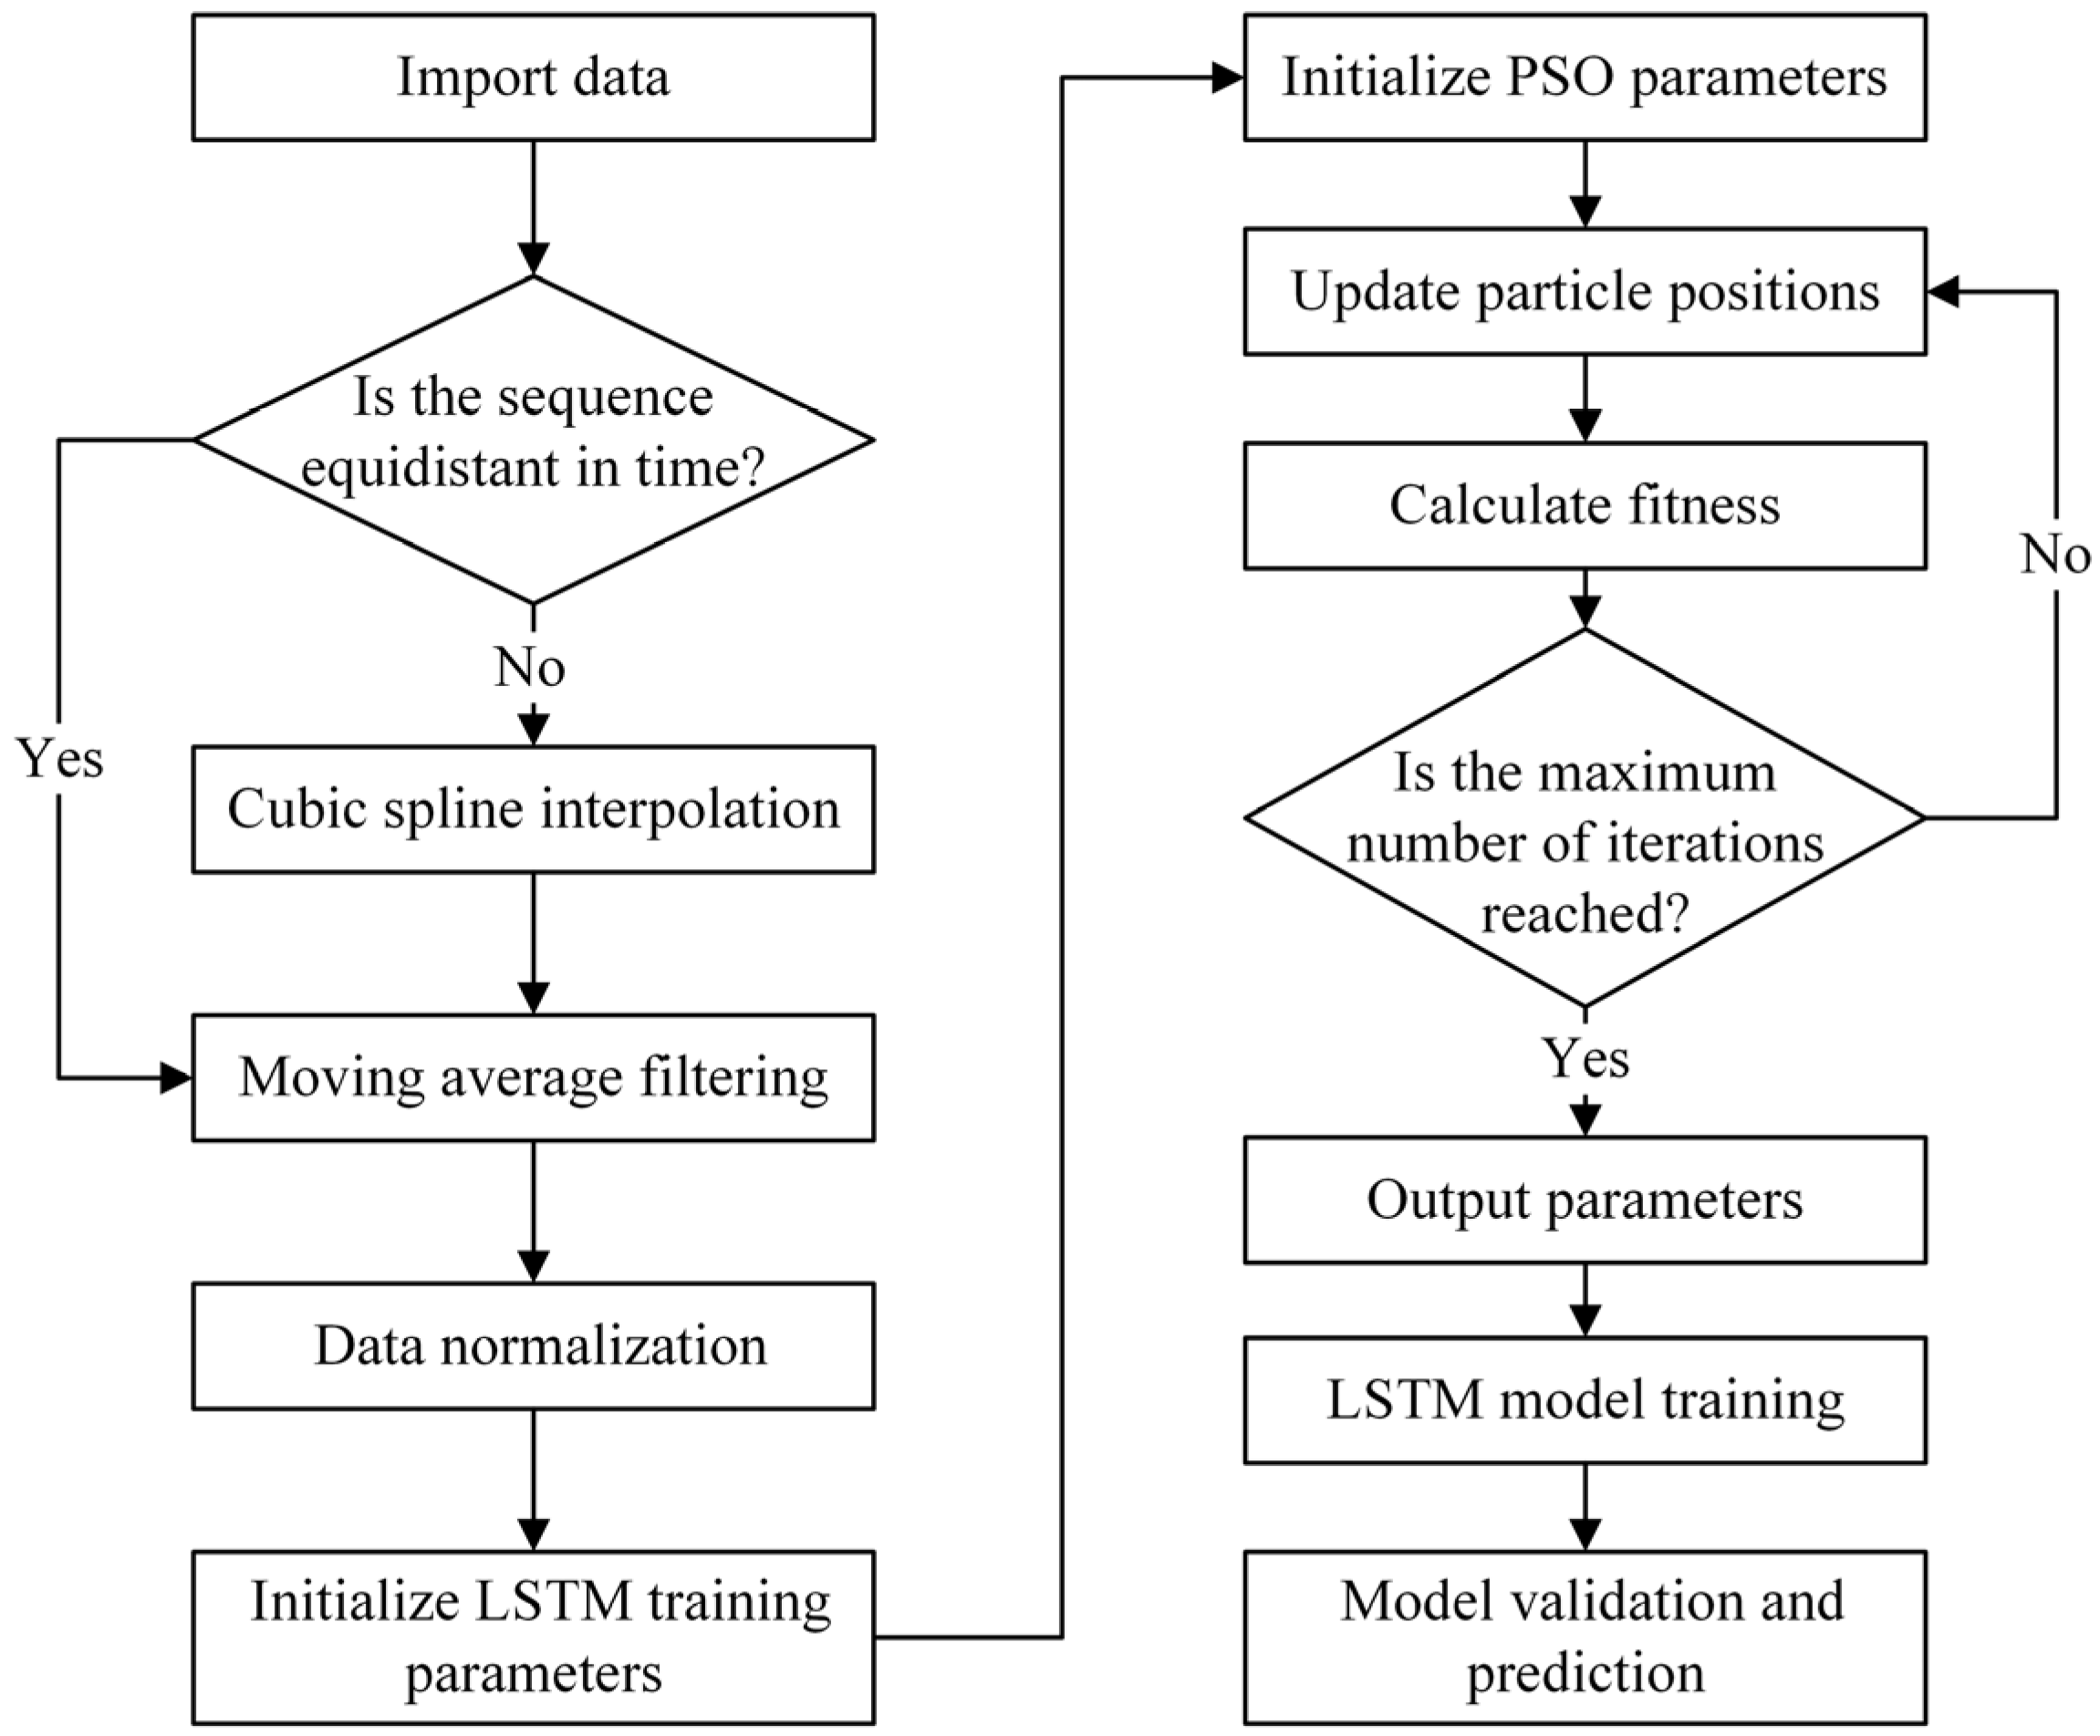
The performance of an LSTM neural network is highly sensitive to its parameter settings, and arbitrary selection can lead to significant variability in training outcomes. To address this issue, this study employs Particle Swarm Optimization (PSO), an evolutionary computation technique that initializes a population of candidate solutions (particles) and iteratively refines them by simulating the social behavior of swarms. In each iteration, the fitness of each particle is evaluated according to a predefined objective function, and particles adjust their positions in the search space based on both their own best historical performance and the best performance within the swarm. Through this cooperative mechanism, PSO efficiently converges toward the global optimum and, owing to its strong adaptability, can be seamlessly integrated with other algorithms for complex optimization tasks. PSO offers strong capability in optimizing models trained on small, noisy, and irregularly sampled datasets, which are typical in underground mine monitoring scenarios. By automating the search for optimal LSTM hyperparameters, it reduces manual trial-and-error, accelerates convergence, and improves prediction stability, making it highly effective for real-time safety monitoring in complex mining environments. In the proposed PSO–LSTM framework, PSO is used to automatically identify the optimal set of LSTM training parameters, thereby enhancing the model’s predictive accuracy and generalization performance. The overall workflow of the PSO–LSTM optimization process, including data preprocessing, parameter optimization, model training, and validation, is illustrated in
Figure 12.
In this study, three key parameters are selected for optimization: the number of epochs, the number of layers, and the time step size.
Epoch refers to one complete pass through the entire training dataset. In practice, a single epoch is insufficient for the model to achieve convergence, and multiple epochs are generally required. However, a greater number of epochs does not necessarily result in better performance, as excessive iterations not only increase the training time but may also lead to overfitting.
Layer denotes the number of layers in the neural network architecture. Moderately increasing the number of layers can enhance model accuracy, but it may also raise the risk of overfitting if not properly controlled.
The time step, determined based on the characteristics of LSTM networks, defines the number of previous time points used to predict the value at the next step. In this study, the input data is treated as an equally spaced time series, where data from the preceding n steps is used to forecast the value at step n + 1. Since the choice of n significantly influences the predictive performance of the model, PSO is employed to determine its optimal value.
The PSO optimization process yielded the following optimal hyperparameter configuration for the LSTM model: the number of hidden layers was set to 2, the time step size was set to 8, and the number of training epochs was set to 150. This configuration ensured both rapid convergence and stable prediction performance while avoiding overfitting, which is particularly important in small-sample and irregular underground monitoring datasets.
In practical engineering applications, convergence deformation of surrounding rock is often not recorded as uniformly spaced time series data. In addition, the available measurement samples are frequently insufficient for training neural network models, and missing data is common. To overcome these issues, we employ interpolation methods to expand the original dataset and transform it into an equally spaced time series. This transformation enables more effective subsequent analysis. Considering the strengths and weaknesses of various interpolation techniques, and based on empirical tests, this study adopts cubic spline interpolation for data processing. This method is particularly suited to underground mine monitoring scenarios, where sensor readings are often sparse, irregularly timed, and subject to occasional data loss, as it can reconstruct a smooth and continuous dataset while preserving the essential characteristics of the original measurements. Cubic spline interpolation divides the entire interval into multiple subintervals, with each fitted by a cubic polynomial. The coefficients of these polynomials are determined by two constraints. The first is the interpolation condition, ensuring that the polynomial passes through the given data points. The second is the smoothness condition, which guarantees the continuity of the function values as well as their first and second derivatives at the boundaries between adjacent segments. By solving these constraints, the polynomial coefficients are obtained and the interpolation process is completed. Cubic spline interpolation preserves the original data characteristics while ensuring smoothness, making it highly suitable for preprocessing in time series prediction tasks.
The raw monitoring data contains significant noise and outliers. To improve data quality before training the neural network, a filtering algorithm is applied. Based on practical experiments and evaluation of multiple criteria, including effectiveness and computational simplicity, the moving average filter is selected for data smoothing. This filter uses a fixed-length queue following the first-in, first-out (FIFO) principle. Each new data point entering the queue replaces the oldest one, and the output is calculated as the arithmetic mean of the N data points in the queue. This method effectively suppresses periodic noise and produces a smooth processed signal.
In this study, the sampling interval for cubic spline interpolation was set to 30 min, consistent with the monitoring frequency of the sensors. For the moving average filter, the window size N was set to 24, corresponding to a 12 h smoothing span. This ensured effective noise reduction while retaining the essential deformation trends.
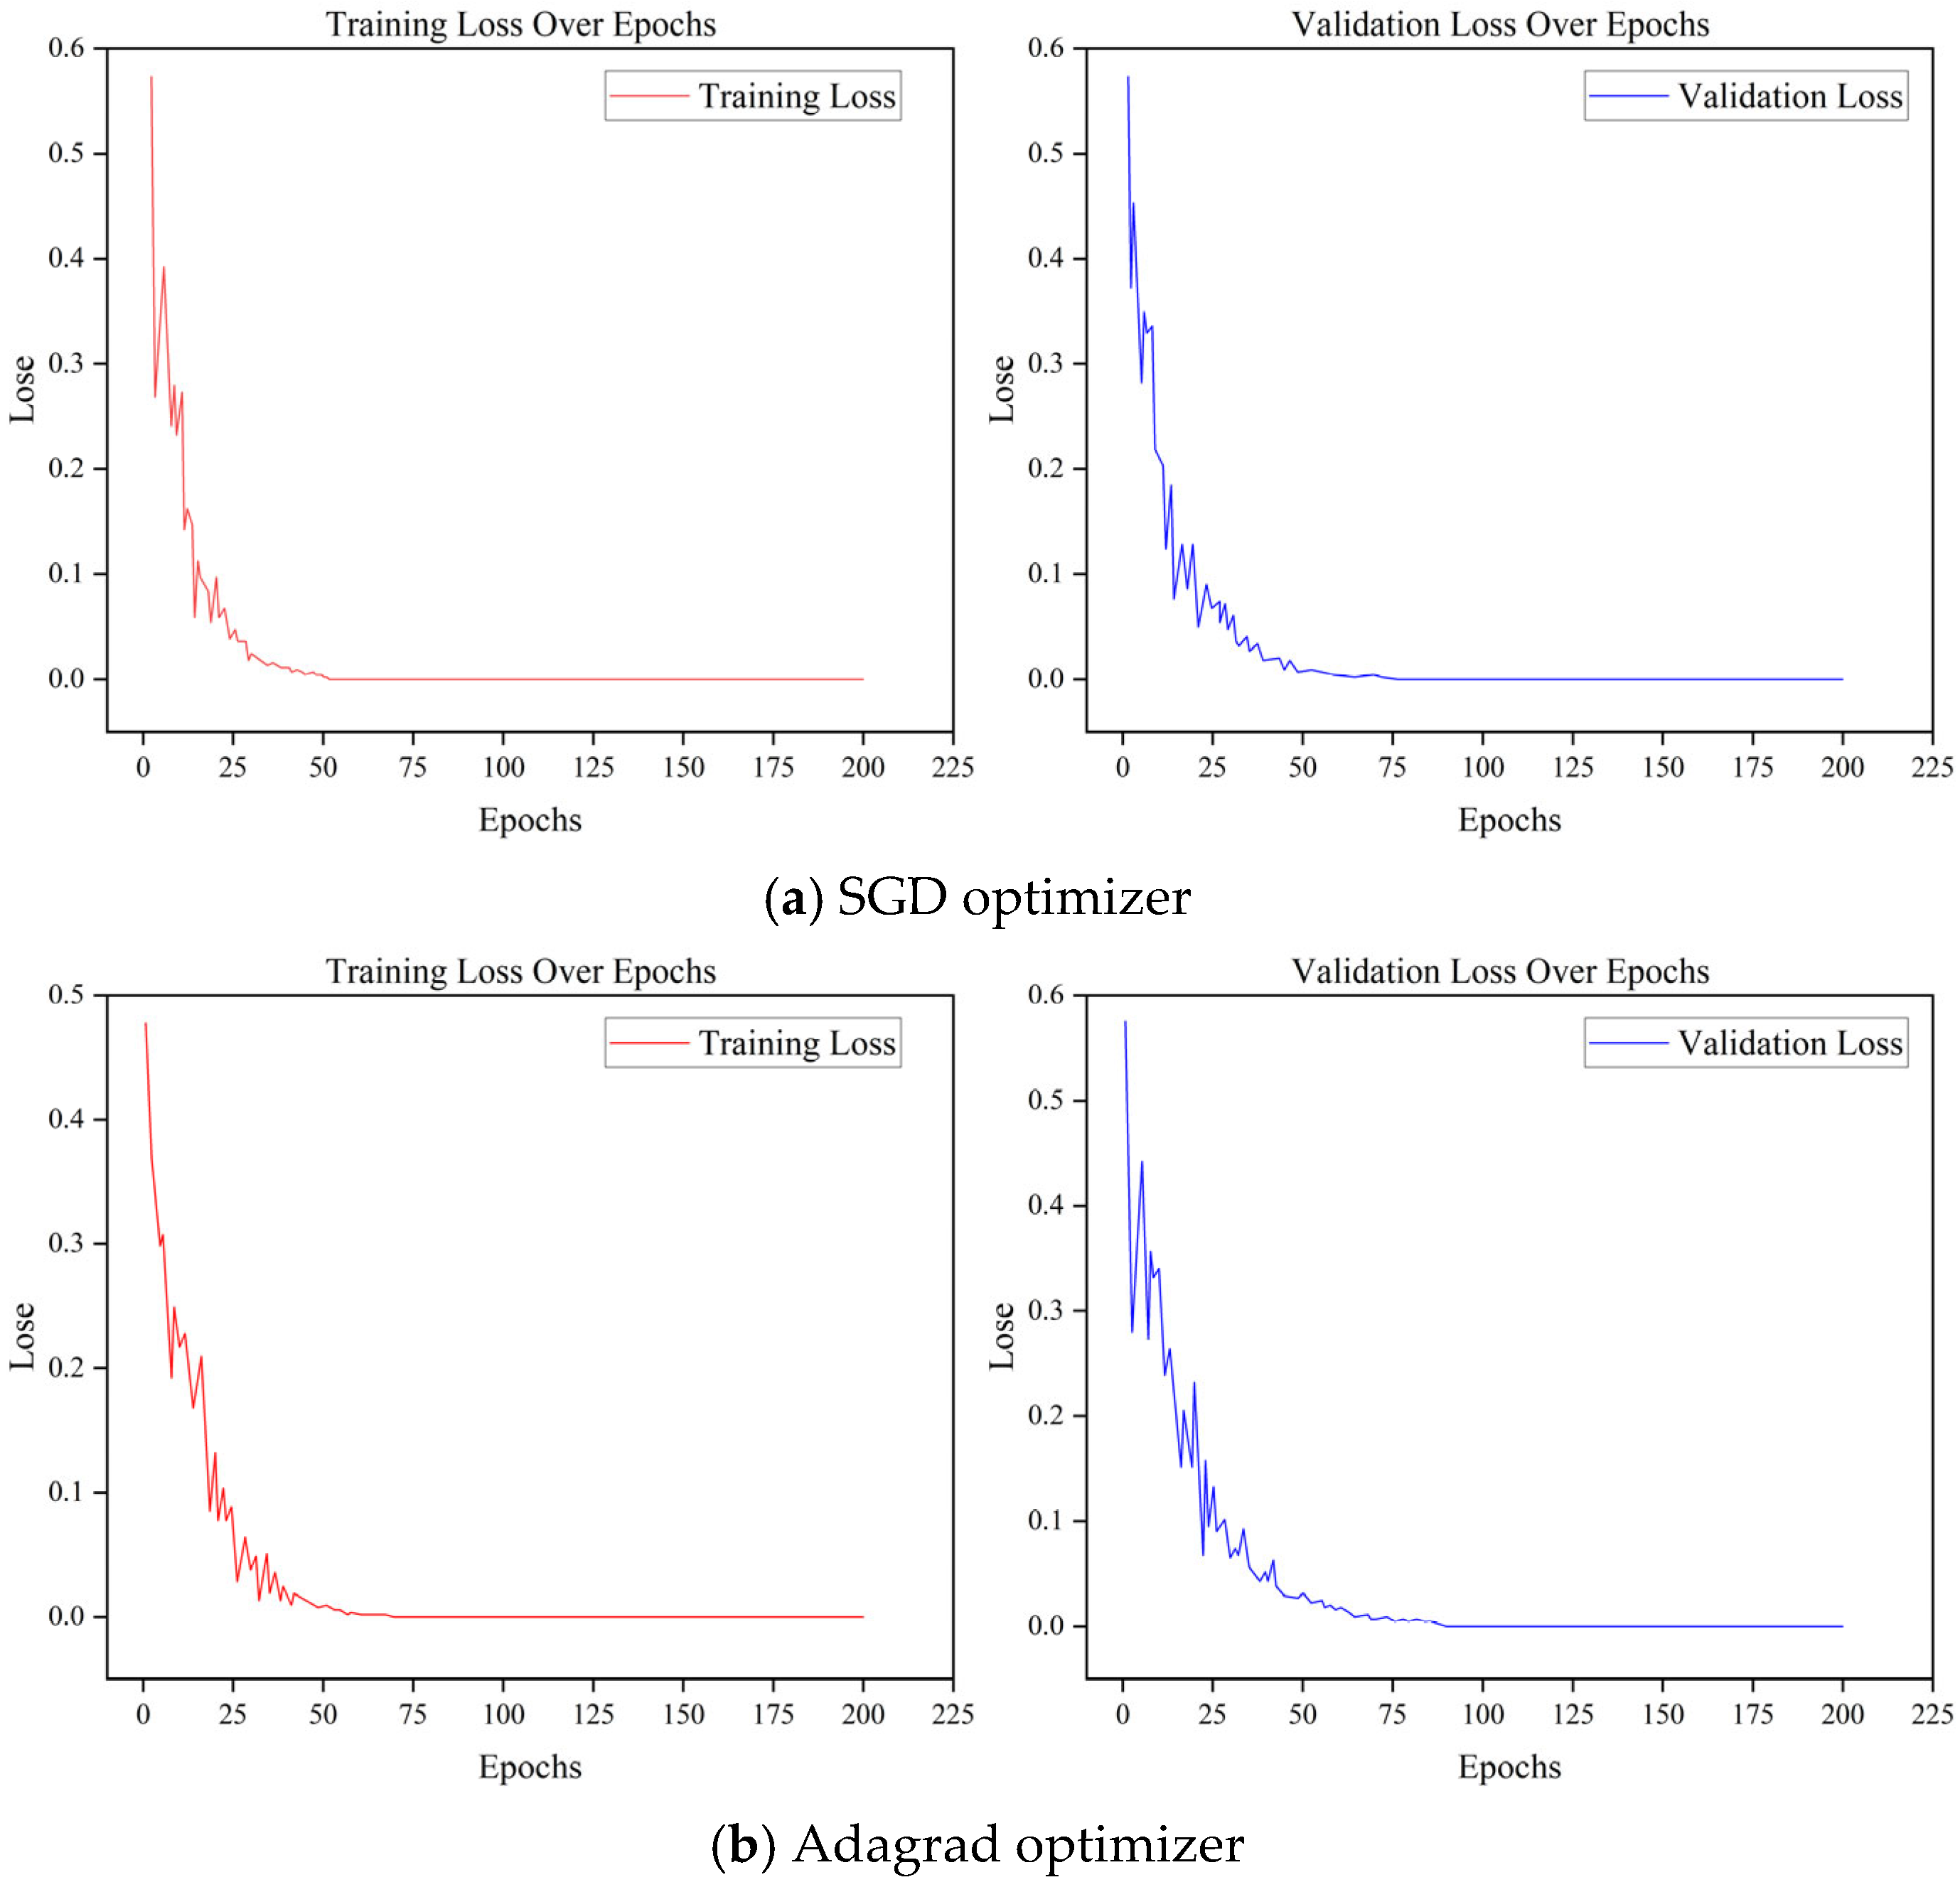
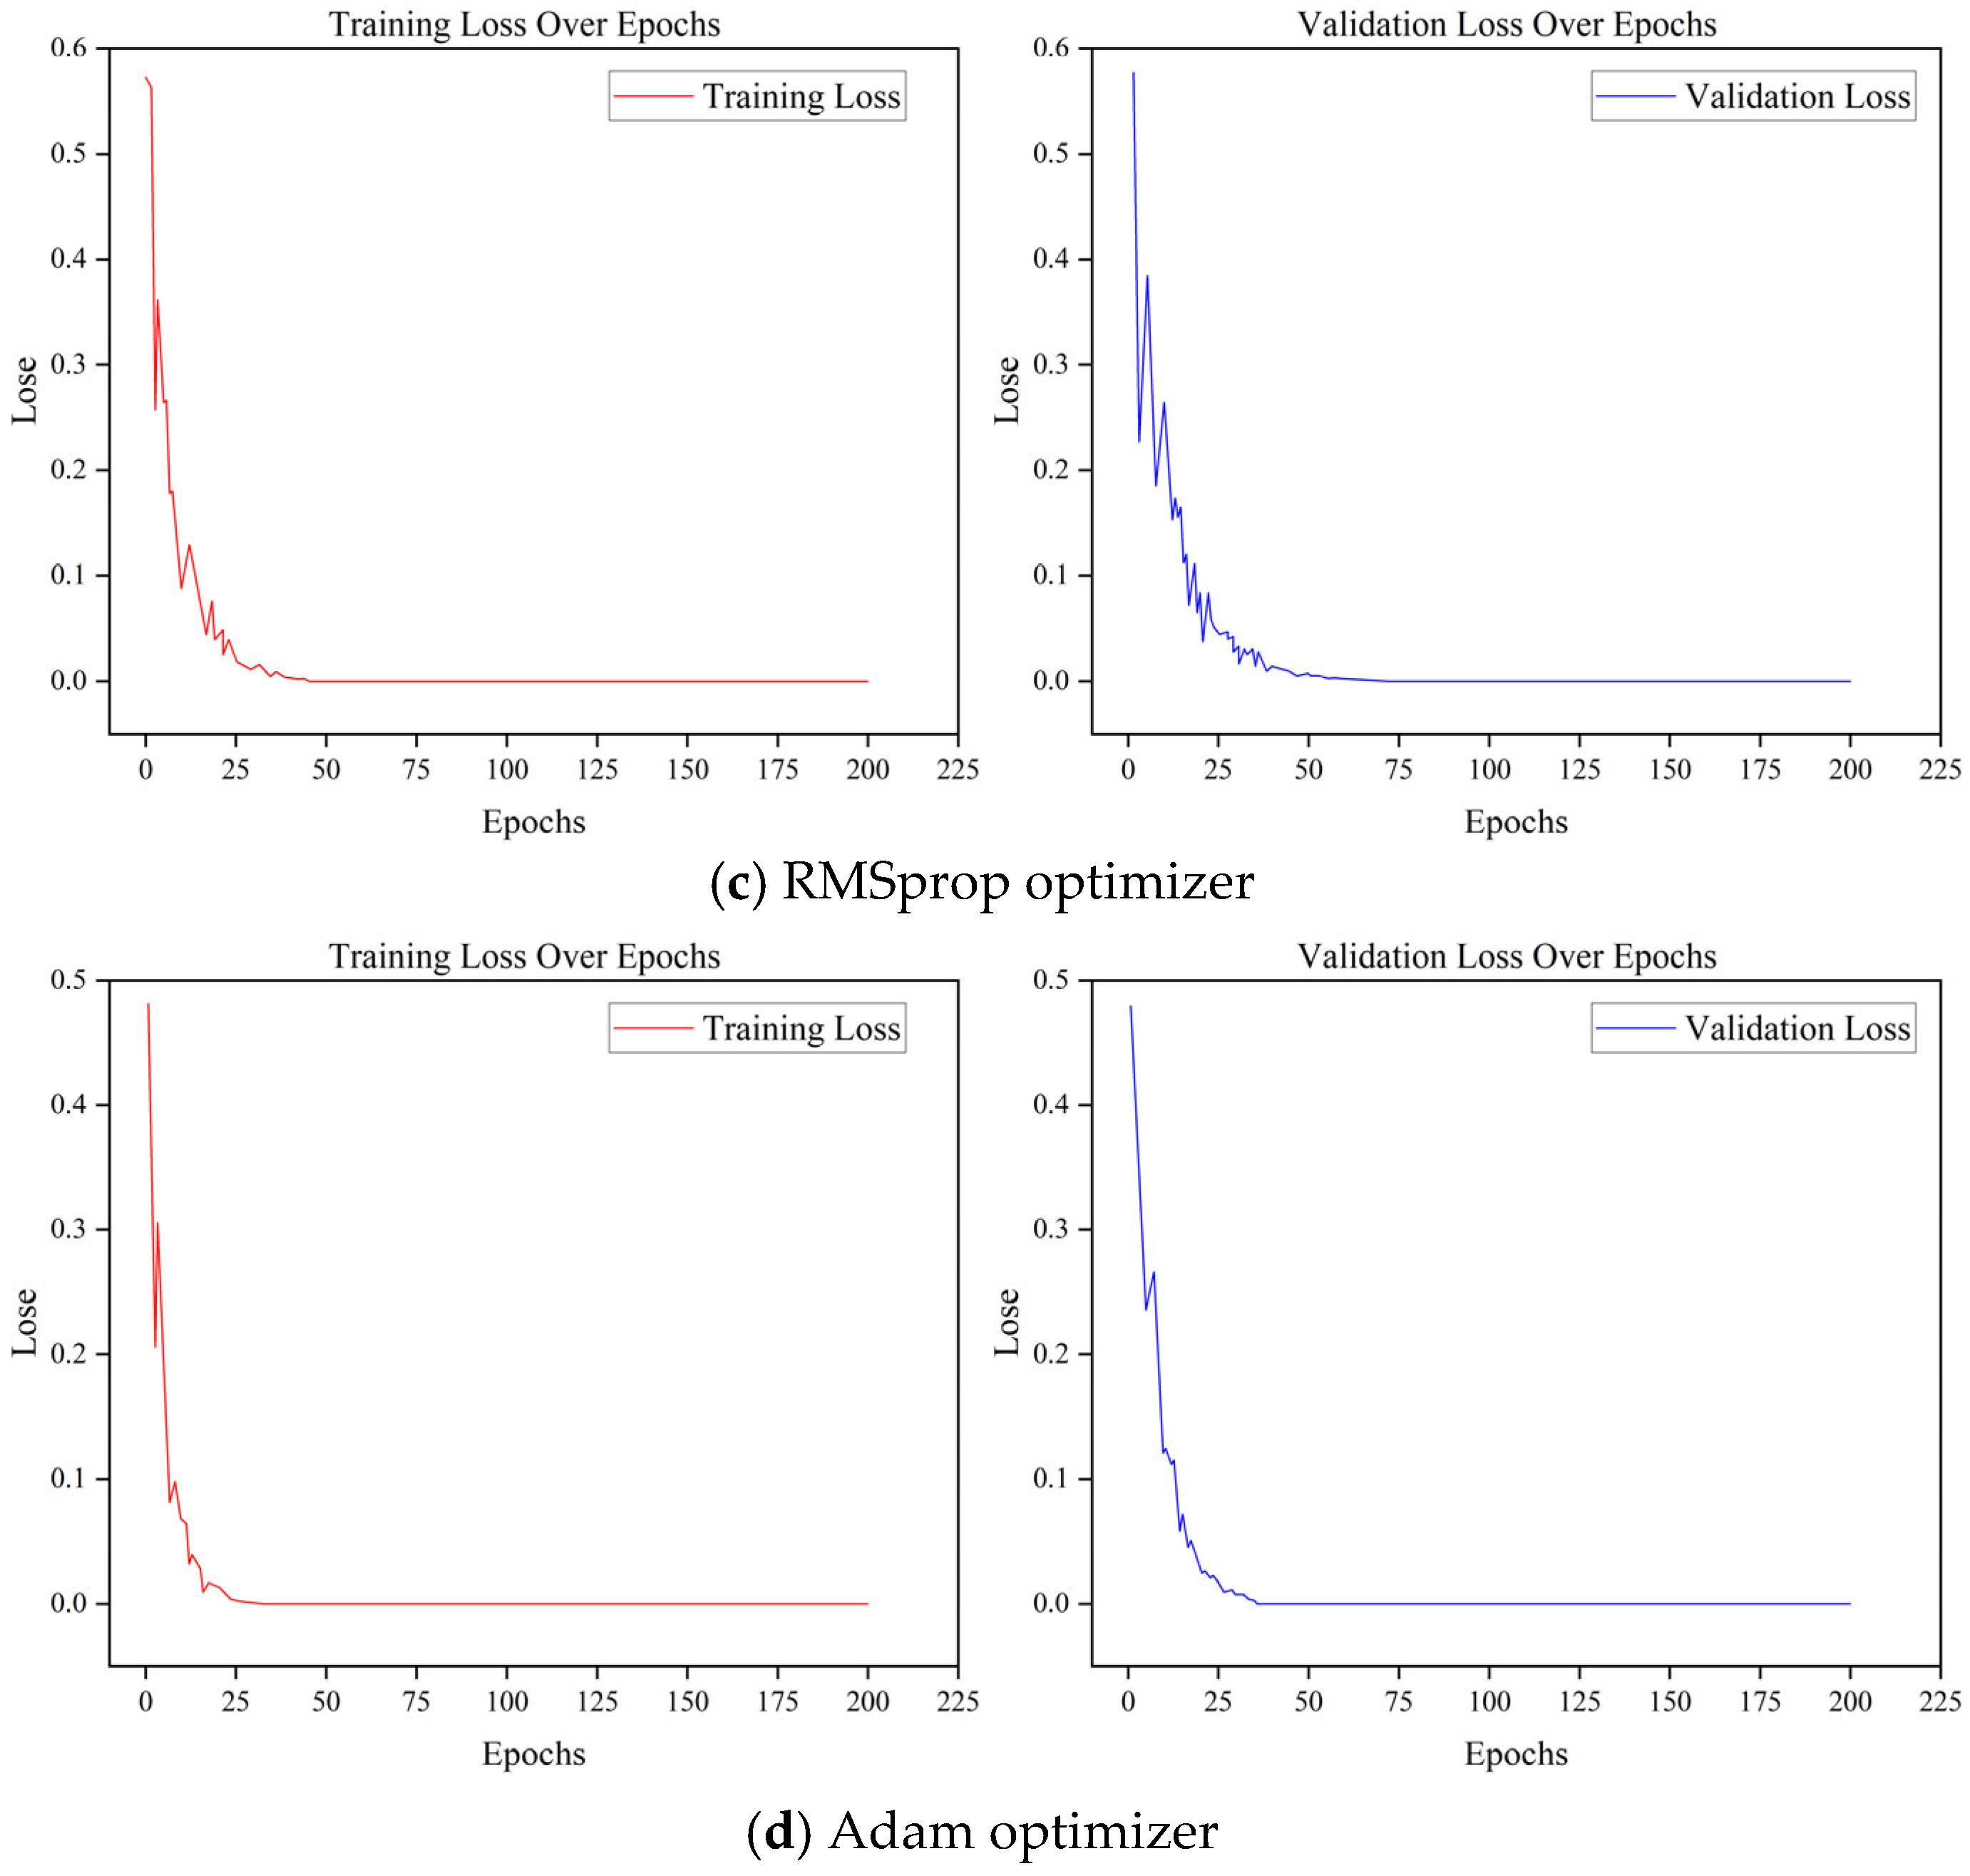
To further verify the optimization effects of different optimizers, 80% of the tunnel deformation displacement data was used as the training set and 20% as the test set. The baseline was the PSO–LSTM model with the original SGD optimizer. For comparison, the same model was trained with Adagrad, RMSprop, and Adam optimizers, each for 200 epochs, and the mean absolute error (MAE) was selected as the evaluation metric. The training and validation loss curves of the four optimizers are shown in
Figure 13.
As shown in
Figure 13a, the SGD optimizer exhibited a relatively stable convergence pattern, with the MAE gradually decreasing and stabilizing after approximately 50 epochs. However, its convergence speed was relatively slow. In
Figure 13b, the Adagrad optimizer displayed a similar convergence trend to SGD, but with higher fluctuations after 25 epochs and an overall larger MAE value, suggesting a risk of overfitting. In
Figure 13c, RMSprop achieved a faster convergence speed, with the MAE loss decreasing sharply within the first 25 epochs. Nevertheless, its loss curve showed significant oscillations, indicating instability that may negatively affect prediction accuracy. In contrast,
Figure 13d demonstrates that Adam achieved the best overall performance: the model reached full convergence in about 25 epochs, with the lowest MAE among all tested optimizers. The Adam loss curve was also the smoothest, showing minimal fluctuations, which indicates that the Adam optimizer effectively avoided both overfitting and underfitting. These results confirm that Adam provided the most stable and accurate optimization performance for the PSO–LSTM framework.
